Article

Pedestrian Trajectory Prediction Based on Dual Social Graph Attention Network

1
Key Laboratory of Advanced Manufacturing and Automation Technology, Education Department of Guangxi Zhuang Autonomous Region, Guilin 541006, China
2
College of Mechanical and Control Engineering, Guilin University of Technology, Guilin 541006, China
*
Author to whom correspondence should be addressed.
Appl. Sci. 2025, 15(8), 4285; https://doi.org/10.3390/app15084285
Submission received: 17 February 2025 / Revised: 9 April 2025 / Accepted: 11 April 2025 / Published: 13 April 2025

Abstract

:
Pedestrian trajectory prediction poses significant challenges for autonomous systems due to the intricate nature of social interactions in densely populated environments. While the existing methods frequently encounter difficulties in effectively quantifying the nuanced social relationships, we propose a novel dual social graph attention network (DSGAT) that systematically models multi-level interactions. This framework is specifically designed to enhance the extraction of pedestrian interaction features within the environment, thereby improving the trajectory prediction accuracy. The network architecture consists of two primary branches, namely an individual branch and a group branch, which are responsible for modeling personal and collective pedestrian behaviors, respectively. For individual feature modeling, we propose the Spatio-Temporal Weighted Graph Attention Network (STWGAT) branch, which incorporates a newly developed directed social attention function to explicitly capture both the direction and intensity of pedestrian interactions. This mechanism enables the model to more effectively represent the fine-grained social dynamics. Subsequently, leveraging the STWGAT’s processing of directed weighted graphs, the network’s ability to aggregate spatiotemporal information and refine individual interaction representations is further strengthened. To effectively account for the critical group dynamics, a dedicated group attention function is designed to identify and quantify the collective behaviors within pedestrian crowds. This facilitates a more comprehensive understanding of the complex social interactions, leading to an enhanced trajectory prediction accuracy. Extensive comparative experiments conducted on the widely used ETH and UCY benchmark datasets demonstrate that the proposed network consistently surpasses the baseline methods across the key evaluation metrics, including the Average Displacement Error (ADE) and Final Displacement Error (FDE). These results confirm the effectiveness and robustness of the DSGAT-based approach in handling complex pedestrian interaction scenarios.

1. Introduction

Pedestrian trajectory prediction entails forecasting the potential movement paths of pedestrians over a future period based on the observed historical trajectory data. With the rapid advancement of autonomous vehicle and robotic technology, the research in this domain has gained increasing prominence. During movement, these intelligent agents must inevitably account for the impact of pedestrians in their environment. Consequently, pedestrian trajectory prediction technology serves as a crucial foundation for various research fields, including autonomous driving, pedestrian surveillance, and autonomous robotic navigation [1,2].
Despite the notable advancements in real-time recognition technology, autonomous agents still experience a temporal delay in recognition processes. This latency in decision making can be critical for other traffic participants, as ensuring pedestrian safety constitutes a fundamental ethical prerequisite for the development and deployment of autonomous mobility systems. As a result, the precise extraction of pedestrian interaction information to predict movement trajectories is of paramount importance.
However, due to the highly dynamic and intrinsically interactive nature of pedestrian movement, pedestrian trajectory prediction remains a formidable challenge. Predicting the trajectories in complex and dynamic movement scenarios necessitates the most accurate possible extraction of the interaction features among moving traffic participants to achieve the robust modeling of pedestrian interactions and enhanced trajectory prediction.
In the early pedestrian trajectory prediction research, traditional hand-crafted knowledge modeling techniques [3,4] were employed to represent pedestrian interactions, yet these approaches proved inadequate in effectively capturing the latent interaction features within crowds. Subsequent studies leveraged Long Short-Term Memory (LSTM) networks, an extension of Recurrent Neural Networks (RNNs) [5,6], to aggregate and extract the potential interaction features. These networks modeled pedestrian interactions based on positional information and focused on capturing these latent relationships through attention mechanisms [7]. Owing to its robust capability in processing temporal features, LSTM [8] has also been used in vehicle trajectory prediction studies. For instance, Shao et al. [9] integrated driving intent, driving style, and historical trajectory data to model vehicles for trajectory prediction.
Given the inherent strengths of Graph Neural Networks (GNNs) [10,11] in aggregating and computing topological social interaction structures, researchers have also proposed GNN-based pedestrian trajectory prediction methods. By capitalizing on the advantages of GNNs in processing non-Euclidean data, these methods have demonstrated promising predictive capabilities. This study also employs graph-based methodologies for pedestrian trajectory prediction.
In the prior research, scholars attempted to model pedestrian interactions using rectangular-based [12] or circular-based [13] approaches. Hasan et al. [14] introduced directionality by utilizing head orientation features. However, this approach requires pre-labeling the dataset and lacks generalizability to other datasets. Subsequently, Yang et al. [15] attempted to address this limitation by calculating social attention through azimuth. Nevertheless, this method is insufficient as it relies solely on azimuth, failing to adequately capture the complex interaction characteristics between pedestrians. The interaction features considered in such scenarios do not align with the actual interaction characteristics of pedestrians in time-based motion.
Moreover, the previous research insufficiently leveraged the group characteristics within pedestrian crowds. The members of a group within a crowd often exhibit behavioral consistency, a critical aspect of trajectory prediction. While the earlier studies employed manual annotation [16] or rule-based [17] methods for crowd grouping, these approaches suffered from inherent flaws, and the resulting group interactions remained unquantified post-grouping. To better predict pedestrian trajectories and ensure safety while enhancing vehicle–road coordination, we need to improve the accuracy of pedestrian trajectory prediction. To more accurately model interactions in real-world scenarios, we constrained the pedestrian observation area and designed a directed social attention function. This function effectively quantifies pedestrian interaction relationships by simultaneously considering the relative positions, relative velocities, and walking directions. A directed adjacency matrix was then constructed to encode the individual pedestrian features. Additionally, we proposed a spatiotemporal weighted graph attention network to process directed weighted graphs.
For group characteristics, we designed a group attention function to refine the crowd grouping criteria and quantify the interaction intensities among group members. By employing this function, the pedestrians within a crowd were systematically categorized into groups, a group adjacency matrix was constructed, and the resulting data were processed using a spatiotemporal graph convolutional neural network. Finally, we integrated social interaction features and performed trajectory prediction using the Time Extrapolator Convolutional Neural Network (TXP-CNN).
The above contributions can be summarized as follows:
  • A novel dual social graph attention network is proposed for pedestrian trajectory prediction, capable of comprehensively quantifying individual and group pedestrian features, fully harnessing dynamic interaction patterns, and substantially improving the model performance.
  • A directed social attention function was developed, introducing the concept of directed interaction relationships, explicitly incorporating factors such as vision, position, and distance to quantify directed pedestrian interactions. Furthermore, a spatiotemporal weighted graph attention network was proposed to process these graphs.
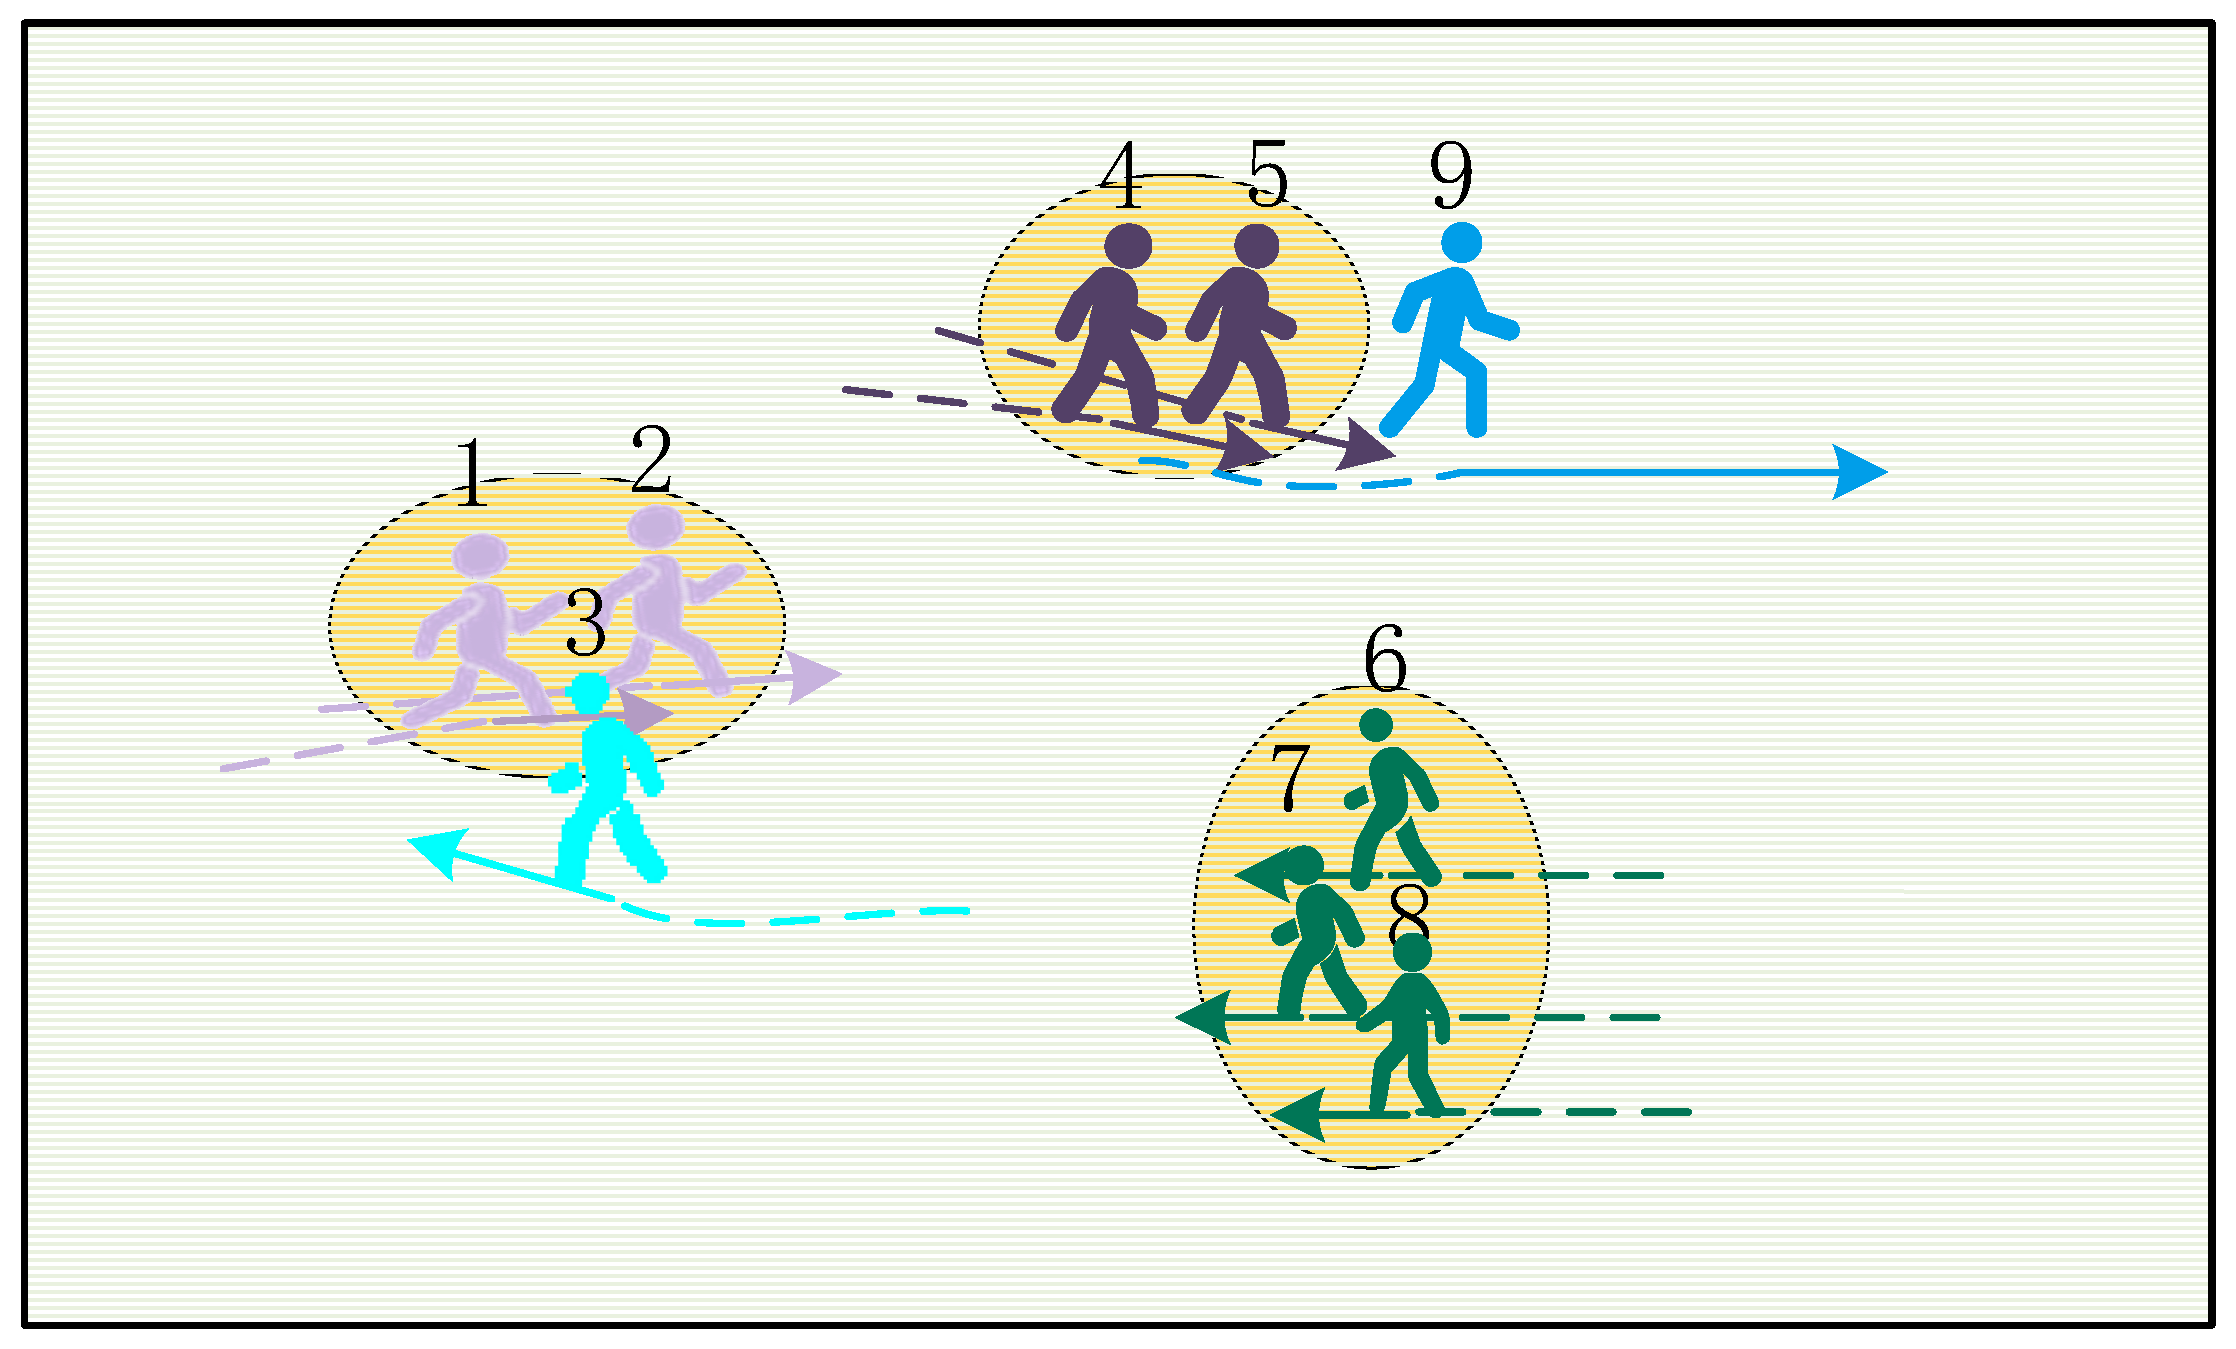
  • A group attention function was designed, the group division rules were improved, groups were effectively divided from the crowd, and the interaction intensity of groups was quantified.
  • Experimental evaluations conducted on the ETH/UCY pedestrian trajectory prediction dataset demonstrate that the proposed dual social graph attention network outperforms the existing methods in terms of both Average Displacement Error (ADE) and Final Displacement Error (FDE).

2. Related Work

2.1. Research on Spatiotemporal Interactions

The core challenge of pedestrian trajectory prediction lies in effectively modeling the interactions across spatiotemporal dimensions. In dynamic spatiotemporal interaction modeling, the design of interaction mechanisms is critical for capturing the complex behavioral patterns.
In the early research, Ellis et al. [18] modeled the non-parametric temporal dependencies of pedestrian trajectories using Gaussian process regression and explicitly expressed the uncertainty of movement through Bayesian inference. However, this method struggled to handle multimodal characteristics at path bifurcations and did not fully consider the synergistic effects of multi-scale temporal features in complex scenarios. To address this issue, Yin D et al. [19] proposed a Gated Convolutional Neural Network (Gated CNN) that integrates recent and long-term temporal segments. By separating the extraction of inertial features during commuting peaks and real-time fluctuation patterns, and constructing dynamic/static multi-graph structures (such as OD graphs and DTW graphs), they coupled multidimensional spatial associations between locations.
In the field of mobility behavior recommendation, Bicocchi et al. [20] extracted users’ daily behavioral patterns using probabilistic topic models (LDA) and identified shared mobility opportunities in short-distance commutes. Through the mining and matching of spatiotemporal patterns, they leveraged mobility data to support ride-sharing recommendations. Cavallaro et al. [21] analyzed the temporal distribution characteristics of users visiting POIs using DBSCAN clustering, revealing the time-sensitive spatial interaction patterns. By integrating a multi-agent system to dynamically update the user behavior data, they verified that the synergy between temporal preferences and spatial locations significantly improves the recommendation performance. In the studies on spatiotemporal demand prediction and vehicle scheduling for ride-hailing platforms, Guo et al. [22] proposed a prediction model based on random forest regression and a perception-based regional dispatching strategy by integrating multi-dimensional POI spatiotemporal features with meteorological data.
To address the insufficient integration of individual preferences and dynamic traffic conditions in spatiotemporal interaction modeling, Zou et al. [23] proposed a Multi-Task Spatiotemporal Attention Network (MT-STAN). Through dynamic spatiotemporal attention modules (ST-Blocks), they extracted historical road network associations and utilized Bridge Transformer (Bridge Trans) to transfer future spatiotemporal dependencies. Additionally, they employed cross-network attention mechanisms to uncover the temporal interactions between the individual travel characteristics and traffic conditions.
Huang et al. [11] proposed a spatiotemporal interaction modeling method (STGAT) based on Graph Attention Networks (GATs) and Long Short-Term Memory (LSTM) networks. By capturing spatial interactions through graph attention mechanisms and explicitly modeling the continuity of temporal interactions with an additional LSTM, this method was the first to combine GATs and LSTM networks to model the spatial relationships and temporal associations between pedestrians. Through a multimodal loss function, it generated diverse socially acceptable trajectories, significantly improving the accuracy of trajectory prediction. In this study, we also investigate the problem of pedestrian trajectory prediction based on spatiotemporal interactions.

2.2. Social Awareness in Pedestrian Trajectory Prediction

To accurately extract the pedestrian interaction features, the early trajectory prediction methods employed manually designed functions, as outlined in [3,4], to model these interactions. However, these methods relied on simplistic mathematical formulations, which restricted their ability to comprehensively capture the complexities of pedestrian interactions. For instance, Helbing et al. [3] introduced the social force model, which employed attractive and repulsive forces to regulate pedestrian movement, thereby facilitating trajectory prediction. Similarly, Kim et al. [4] integrated a Kalman filter with a maximum likelihood estimation algorithm, leveraging statistical inference to learn the individual motion parameters in a given scenario. While these approaches attempted to mathematically define pedestrian interactions, they failed to incorporate the latent interaction features, ultimately limiting the accuracy of pedestrian trajectory prediction.
With the rapid advancements in deep learning, researchers have proposed various methodologies to extract latent interaction features for trajectory prediction. For example, in Long Short-Term Memory (LSTM)-based approaches [12,24], Alahi et al. [12] developed the Social-LSTM model, which integrates an enhanced Recurrent Neural Network (RNN) to model pedestrian behavior over time. In generative adversarial learning-based research [25,26,27,28], Gupta et al. [28] proposed Social-GAN, which introduced a pooling module to aggregate the interaction information between a target pedestrian and surrounding individuals. This model employed a generator, pooling module, and discriminator to generate multiple potential trajectories, ultimately selecting the most plausible one. Furthermore, in bivariate Gaussian distribution-based methods [10,12], Shi et al. [10] introduced the Sparse Graph Convolutional Network (SGCN), which utilized a sparse spatial graph to identify pedestrians with adaptive interactions and a sparse temporal graph to model pedestrian motion trends. By integrating these two sparse graphs, the model estimated the parameters of a bivariate Gaussian distribution, effectively capturing motion uncertainty and diversity. Moreover, in Conditional Variational AutoEncoder (CVAE)-based frameworks [29,30], Zhou et al. [29] proposed a model combining a cascaded CVAE module with a social awareness regression module. The former estimated future trajectories by linking past trajectories with predicted positions, while the latter refined trajectory predictions by generating offsets.
Although these data-driven neural networks excel in learning complex interaction patterns, their extracted features lack interpretability and fail to explicitly correspond to physically meaningful attributes. To address this limitation, the subsequent research has reintroduced manually defined functions to impose feature constraints, thereby facilitating the extraction of interaction features with clear physical or domain significance. Studies in bionics and psychology suggest that such analytical approaches better reflect real-world pedestrian behavior, as human movement is typically not dictated by complex mathematical equations but rather shaped by simple prior constraints and past experiences. This concept has been effectively applied in graph-based methods. For instance, Mohamed et al. [31] formulated pedestrian trajectory prediction as a graph structure problem, leveraging a Graph Convolutional Network (GCN) to capture the spatiotemporal dependencies after feature constraints, subsequently predicting future trajectories using a Gaussian distribution. However, pedestrian interactions are not uniform, as individuals exhibit varying degrees of influence on each other. Zhang et al. [17] introduced Social-TAG, which explicitly controlled the field of vision, selecting pedestrians within a predefined range for interaction calculations and employing grouping strategies. However, most existing methodologies rely on undirected graphs, leading to incomplete feature quantification.
To overcome these limitations, this paper proposes a dual social graph attention network, which comprehensively integrates the effects of relative position, relative velocity, angular occupancy, and group dynamics on pedestrian interactions. This framework aims to refine and quantify both individual and group-level interactions. Specifically, we designed a Directed Weighted Network based on a directed weighted graph to systematically quantify individual pedestrian features. Additionally, a group recognition function was devised to further quantify the group dynamics. By incorporating explicit constraints and data-driven training, the model’s interpretability is significantly enhanced.

2.3. Graph Neural Networks in Pedestrian Trajectory Prediction

Graph Neural Networks (GNNs) offer substantial advantages in processing social interaction data and other non-Euclidean spatial structures. This network architecture effectively extracts implicit relational patterns, capturing spatiotemporal regularities and thereby enhancing the predictive performance. These capabilities make GNNs particularly well suited for modeling pedestrian interactions and environmental influences in complex, dynamic movement scenarios.
In GNN-based pedestrian trajectory prediction methods [10,11,17,31], individual pedestrians are typically represented as nodes, with their interactions encoded as edges. The two predominant GNN methodologies are Graph Convolutional Networks (GCNs) [32] and Graph Attention Networks (GATs) [33], which differ significantly in how they aggregate graph-structured information.
A GCN employs spectral methods, relying on the Laplacian matrix’s spectral decomposition, enabling feature transformations in the frequency domain. In contrast, GATs utilize a spatial domain approach, incorporating an attention mechanism to compute the adaptive attention weights between nodes, dynamically adjusting interaction strengths based on the neighboring node importance.
Among the GCN-based pedestrian trajectory prediction methods, Mohamed et al. [31] introduced Social-STGCNN, which utilized a spatial convolutional layer to model pedestrian social relationships and a temporal convolutional layer to capture long-term motion dependencies. Additionally, Youssef et al. [34] proposed the Spatio-Temporal Multi-Graph Convolutional Network (STM-GCN), which aggregated positional and velocity-based social interactions into multiple graphs, learning and predicting pedestrian trajectories via GNNs. Similarly, Sighencea et al. [35] developed the Interaction-Aware Spatio-Temporal Graph Neural Network (D-STCNN), which extracted features through a temporal graph network and incorporated spatial graph neural networks for interaction modeling.
In GAT-based trajectory prediction models, Kosaraju et al. [36] proposed Social-BiGAT, which extracted pedestrian interactions using GATs and predicted trajectories via a Graph Adversarial Generative Network. Zhang et al. [17] developed Social-TAG, which applied GATs to model pedestrians’ field-of-vision features.
In this study, we propose a Directed Weighted Graph Attention Network (DWGAT) based on GATs, which quantifies directed pedestrian interactions and aggregates them to improve the interaction modeling accuracy.

3. Methods

In this paper, we propose a pedestrian trajectory prediction model based on the dual social graph attention network to predict the future walking trajectories of pedestrians. In Section 3.1, we elaborate on the specific mathematical definition of the pedestrian trajectory prediction problem. In Section 3.2, we outline the overall network structure of the proposed model. In Section 3.3, we detail the composition and rationale of the dual social graph attention network. Finally, in Section 3.4, we carefully introduce the pedestrian trajectory prediction method.

3.1. Definition of the Pedestrian Trajectory Prediction Problem

Pedestrian trajectory prediction involves predicting the future position sequence of pedestrians based on their historical position sequences in two-dimensional space. Ultimately, this problem can be regarded as a temporal prediction problem. Suppose that within a given time period 1 , T o b s , the position sequence P of N pedestrians is given; then, the position of any individual p t i in P can be represented as:
p t i = { ( x t i , y t i ) | t 1,2 , , T o b s , i 1 , , 2 , , N }
Our goal is to predict the position sequence P ^ of these pedestrians from T o b s + 1 to T p r e d based on the position sequences of the past N pedestrians within T o b s time steps. Then, the position of any individual p ^ t i in P ^ can be represented as:
p ^ t i = { ( x t i , y t i ) | t T o b s + 1 , T o b s + 2 , , T p r e d , i 1 , , 2 , , N }
The future trajectory coordinates ( x ^ t i , y ^ t i ) are modeled as a bivariate Gaussian distribution parameterized by mean μ t i = ( μ t x , i , μ t y , i ) , standard deviations σ t i = ( σ t x , i , σ t y , i ) , and correlation coefficient ρ t i between x and y coordinates, as formalized in Equation (3):
x ^ t i , y ^ t i ~ N ( μ t i , t i )
where the covariance matrix t i is composed of standard deviations and correlation coefficient as specified in Equation (4):
t i = ( σ t x , i ) 2 ρ t i σ t x , i σ t y , i ρ t i σ t x , i σ t y , i ( σ t y , i ) 2
With this equation, we have successfully transformed the pedestrian trajectory prediction challenge into a constrained learning problem governed by bivariate Gaussian distributions.
By learning the underlying bivariate Gaussian patterns embedded in historical trajectory data, we can now probabilistically forecast pedestrian positions across future time steps through the acquired distribution parameters. This paradigm shift enables systematic uncertainty quantification while maintaining the mathematical tractability in motion prediction.

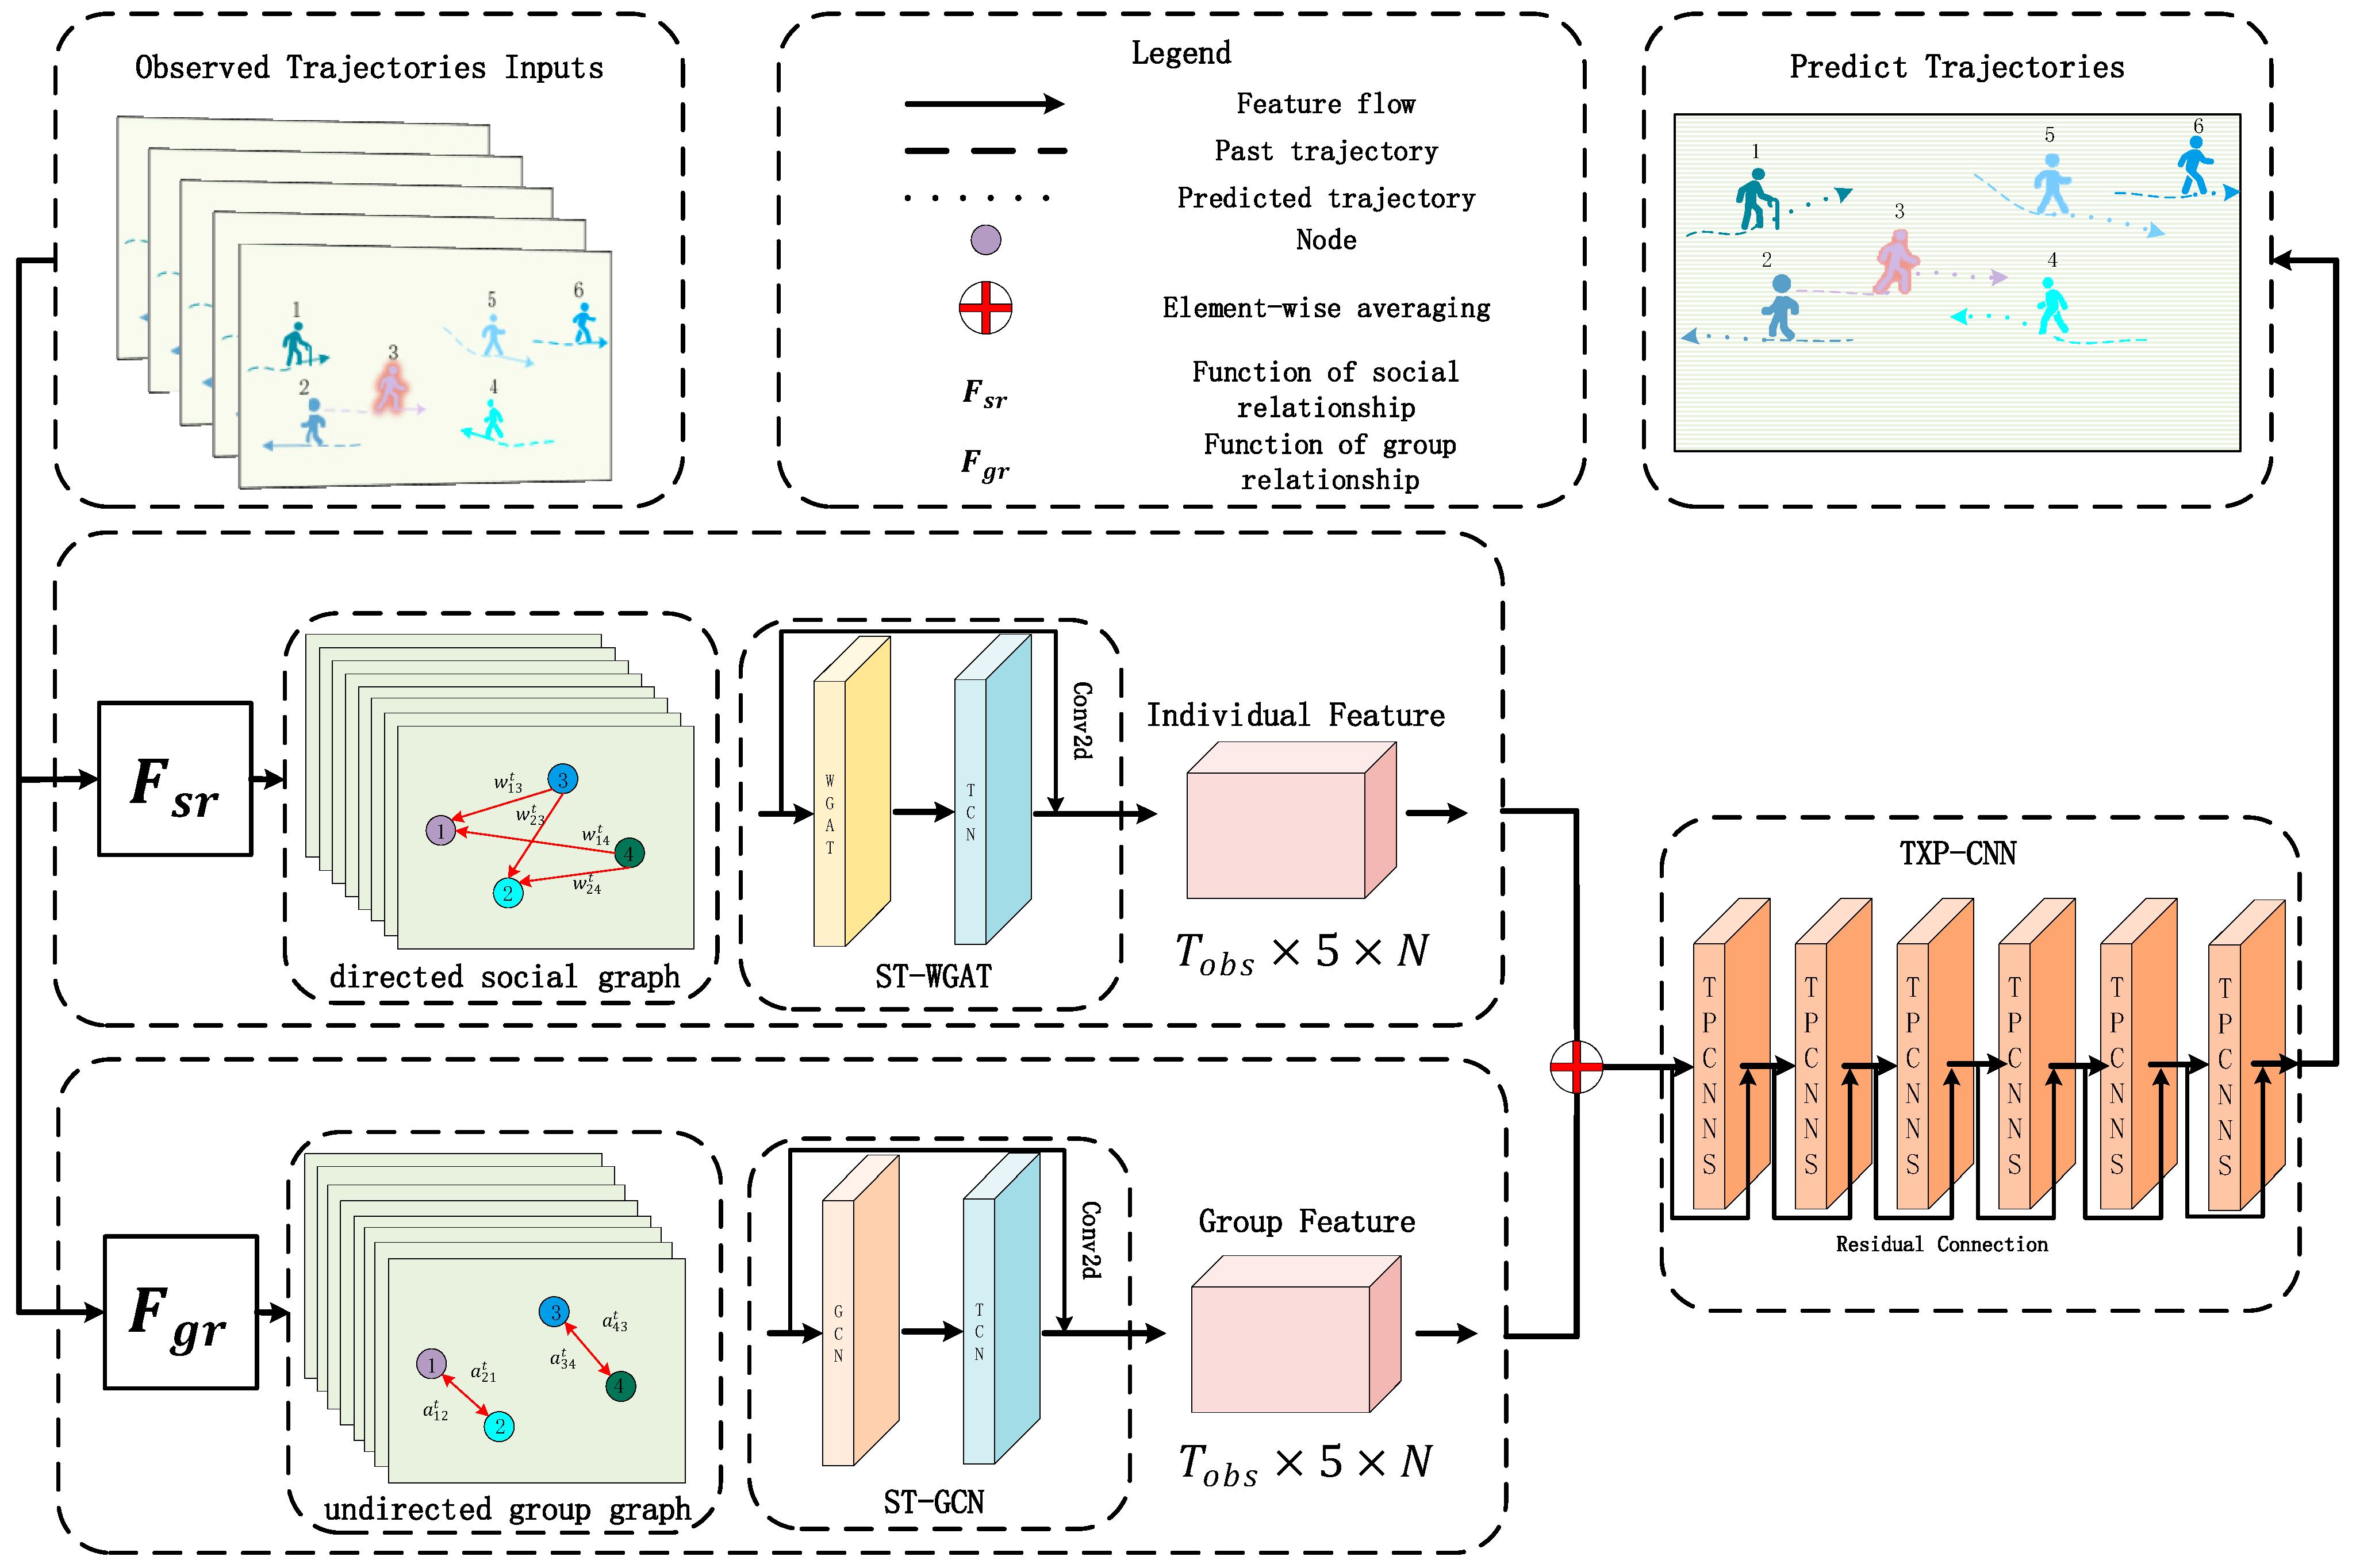
3.2. Network Architecture

The structure of the dual social graph attention network proposed in this paper is shown in Figure 1. This method consists of two branches: the spatiotemporal weighted attention network (STWGAT) branch and the spatiotemporal graph convolutional neural network (STGCN) branch. The STWGAT branch is based on the directed social attention function and is used to collect and model various interaction information between pedestrians. The STGCN branch is based on the group attention function, which identifies groups from the crowd and quantifies their interaction intensity. These two branches encode different interaction information into feature sequences. We will fuse the features encoded by these two branches into a single feature, and then use the Temporal Extrapolation Convolutional Neural Network (TXP-CNN) to perform trajectory prediction based on the encoded features.
When constructing the graph G ( V , E ) , we regarded pedestrians as the nodes V of the graph, and the interaction relationships between pedestrians as the edges E between the nodes.
We constructed two graphs to extract the scene features. The first graph is a directed graph G 1 based on the directed social attention function for weighted calculation, where the elements w i j in its adjacency matrix represent the edge from node i to node j , and the size of element w i j is calculated by using the directed social attention function, which directly reflects the influence of node i on node j .
The second graph is an undirected graph G 2 constructed based on the group attention function, where the elements e i j in its adjacency matrix are calculated after being determined by the group attention function, which can determine whether node i and node j belong to the same group and be used to calculate the group interaction intensity.
After network computation, the dimensions of the graph features V for these two branches are transformed from T o b s × 2 × N to T o b s × 5 × N . Here, T o b s represents the number of observed time steps, and N denotes N pedestrians. The original “2” refers to the positional features, x and y , of the pedestrians. The model learns a bivariate Gaussian distribution from x and y , introducing three additional parameters: μ t i , σ t i , and ρ t i . As a result, the output shape of the graph features, V , for both branches of the network becomes T o b s × 5 × N .
In Figure 1, the GCN (Graph Convolutional Network) functions as a spatial convolution, extracting the spatial features of pedestrians. Subsequently, the TCN (Temporal Convolutional Network) extracts temporal features, composed of 2D convolutions, batch normalization, PReLU, and Dropout. The TPCNNS is the core module in TXP-CNN for temporal extrapolation, directly expanding the temporal dimension of spatiotemporal graph embeddings through multiple layers of 2D convolutions. This approach replaces traditional recurrent structures, enabling efficient multi-step prediction with fewer parameters.

3.3. Dual Social Graph Attention Network

The current methods for constructing pedestrian interaction feature graphs are primarily based on a 360° panoramic perspective. As shown in Figure 2, in a pedestrian interaction scenario, there are six pedestrians labeled 1–6, each with distinct motion characteristics such as position, speed, and direction.
The construction of interaction graphs aims to incorporate these features while reflecting real-world interactions. Mainstream methods quantify interactions by considering the influence of all surrounding pedestrians and constructing undirected interaction graphs. The feature extraction process, as illustrated in Figure 2a,b, involves abstracting the six pedestrians into graph nodes and calculating the interaction features between these nodes. For example, in Figure 2b, each node (labeled 1–6) undergoes feature computation. Taking pedestrian 3 as an example, this pedestrian serves as the target node for feature aggregation, while pedestrians 1, 2, 4, 5, and 6 act as neighbor nodes providing interaction features. In the undirected graph construction shown in Figure 2b, node 3 considers the features of all the pedestrians in the scene.
However, in reality, pedestrians have spatial relationships (front, back, left, right) that significantly influence their trajectory choices and must be considered and quantified. As shown in Figure 2c,d, using pedestrian 3 as an example, pedestrians tend to pay more attention to those in front of them, whether based on their field of view or trajectory direction. This aligns with the principles of social psychology and reflects an asymmetric interaction that is closer to a directed relationship. Regrettably, most existing methods fail to adequately account for this aspect and lack the quantification of such relationships.
In real pedestrian movement trajectories, pedestrian behavior is complexly influenced by various social factors. Therefore, when modeling pedestrian trajectories, it is necessary to consider the impact of various factors on pedestrian behavior. Pedestrians are both independent individuals and sometimes exist in groups, which requires us to consider the interaction relationships between pedestrians from both individual and group levels. For individual interactions, we use the directed social attention function for precise quantification to obtain the interaction relationships between different individuals. Groups are ubiquitous in crowds and can be regarded as an important whole in social relationships. Therefore, we use the group attention function to extract and quantify the influence of groups from the crowd.

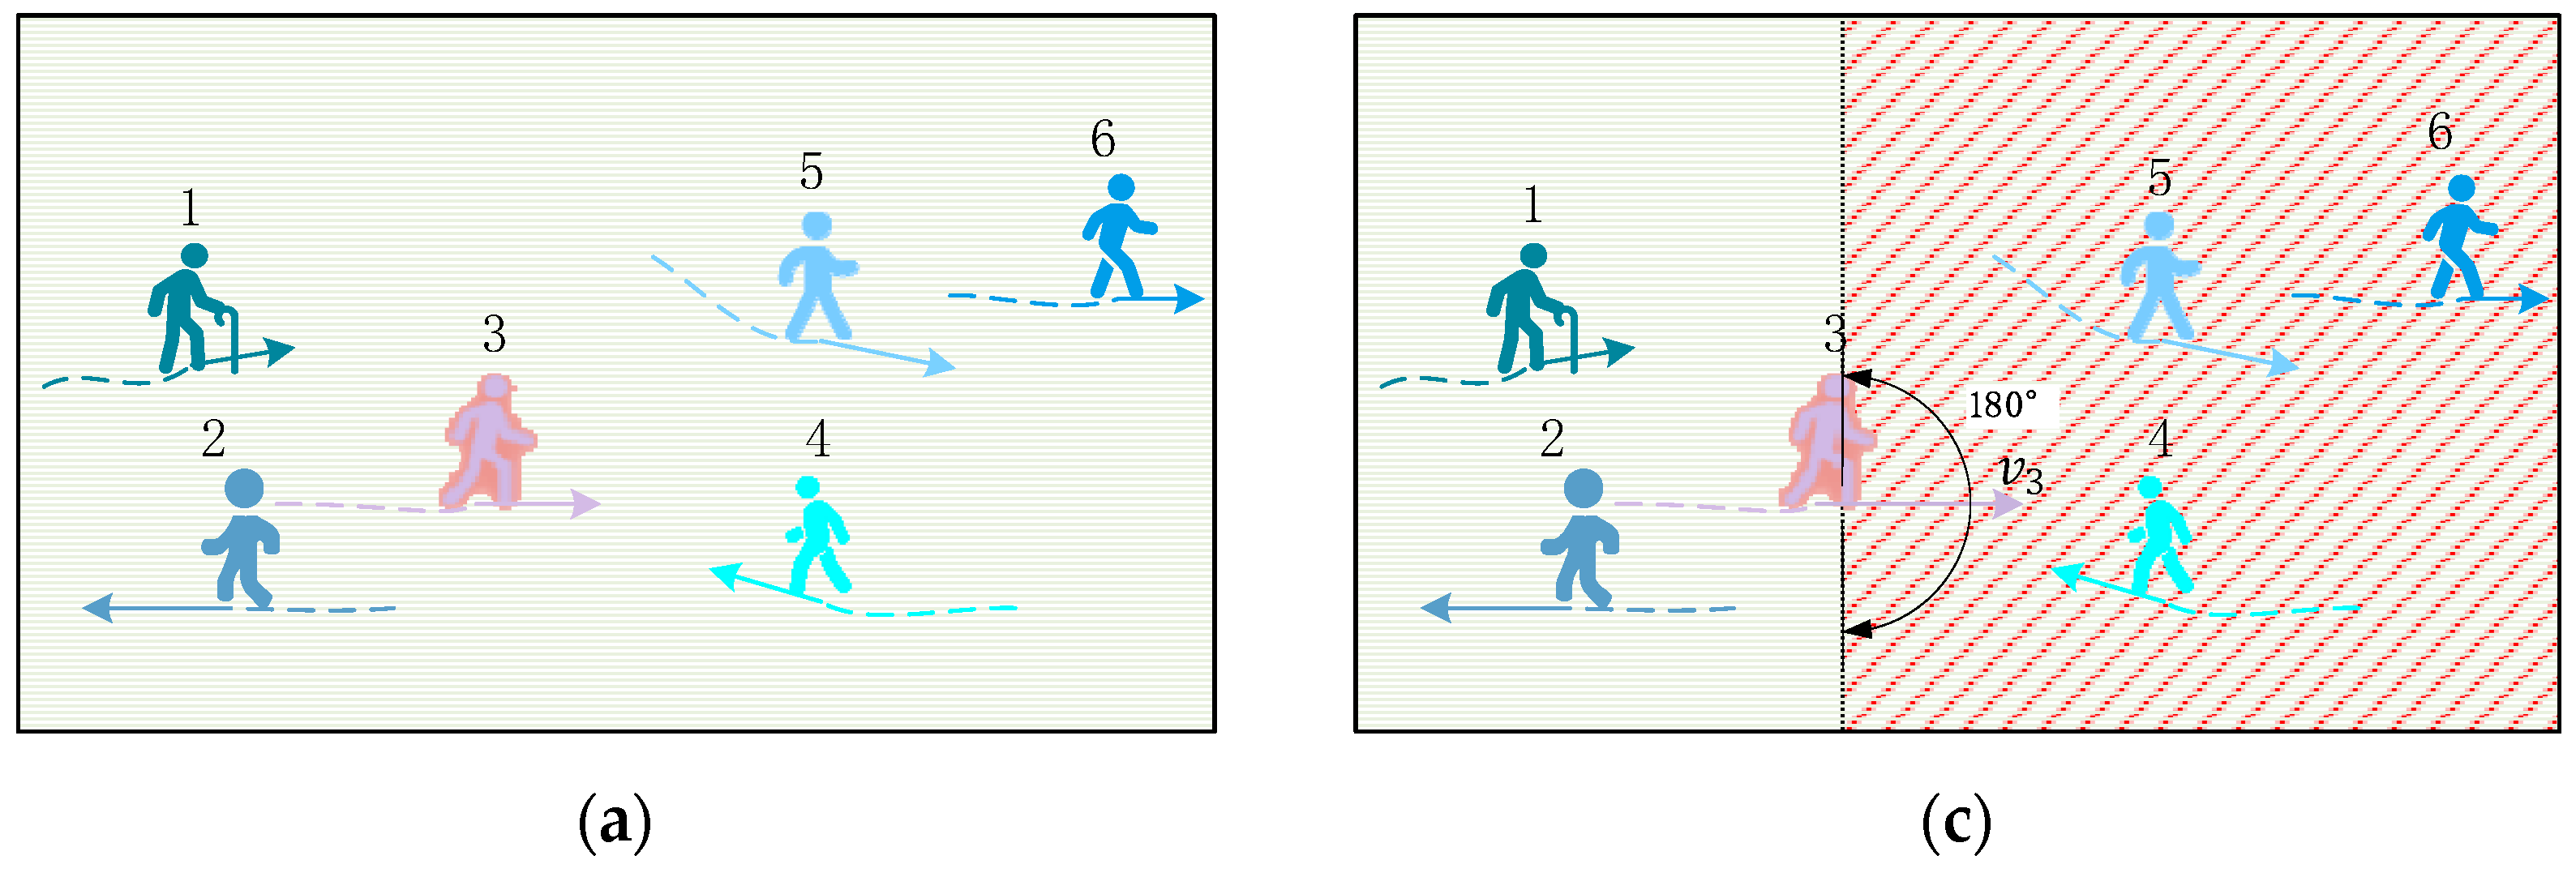
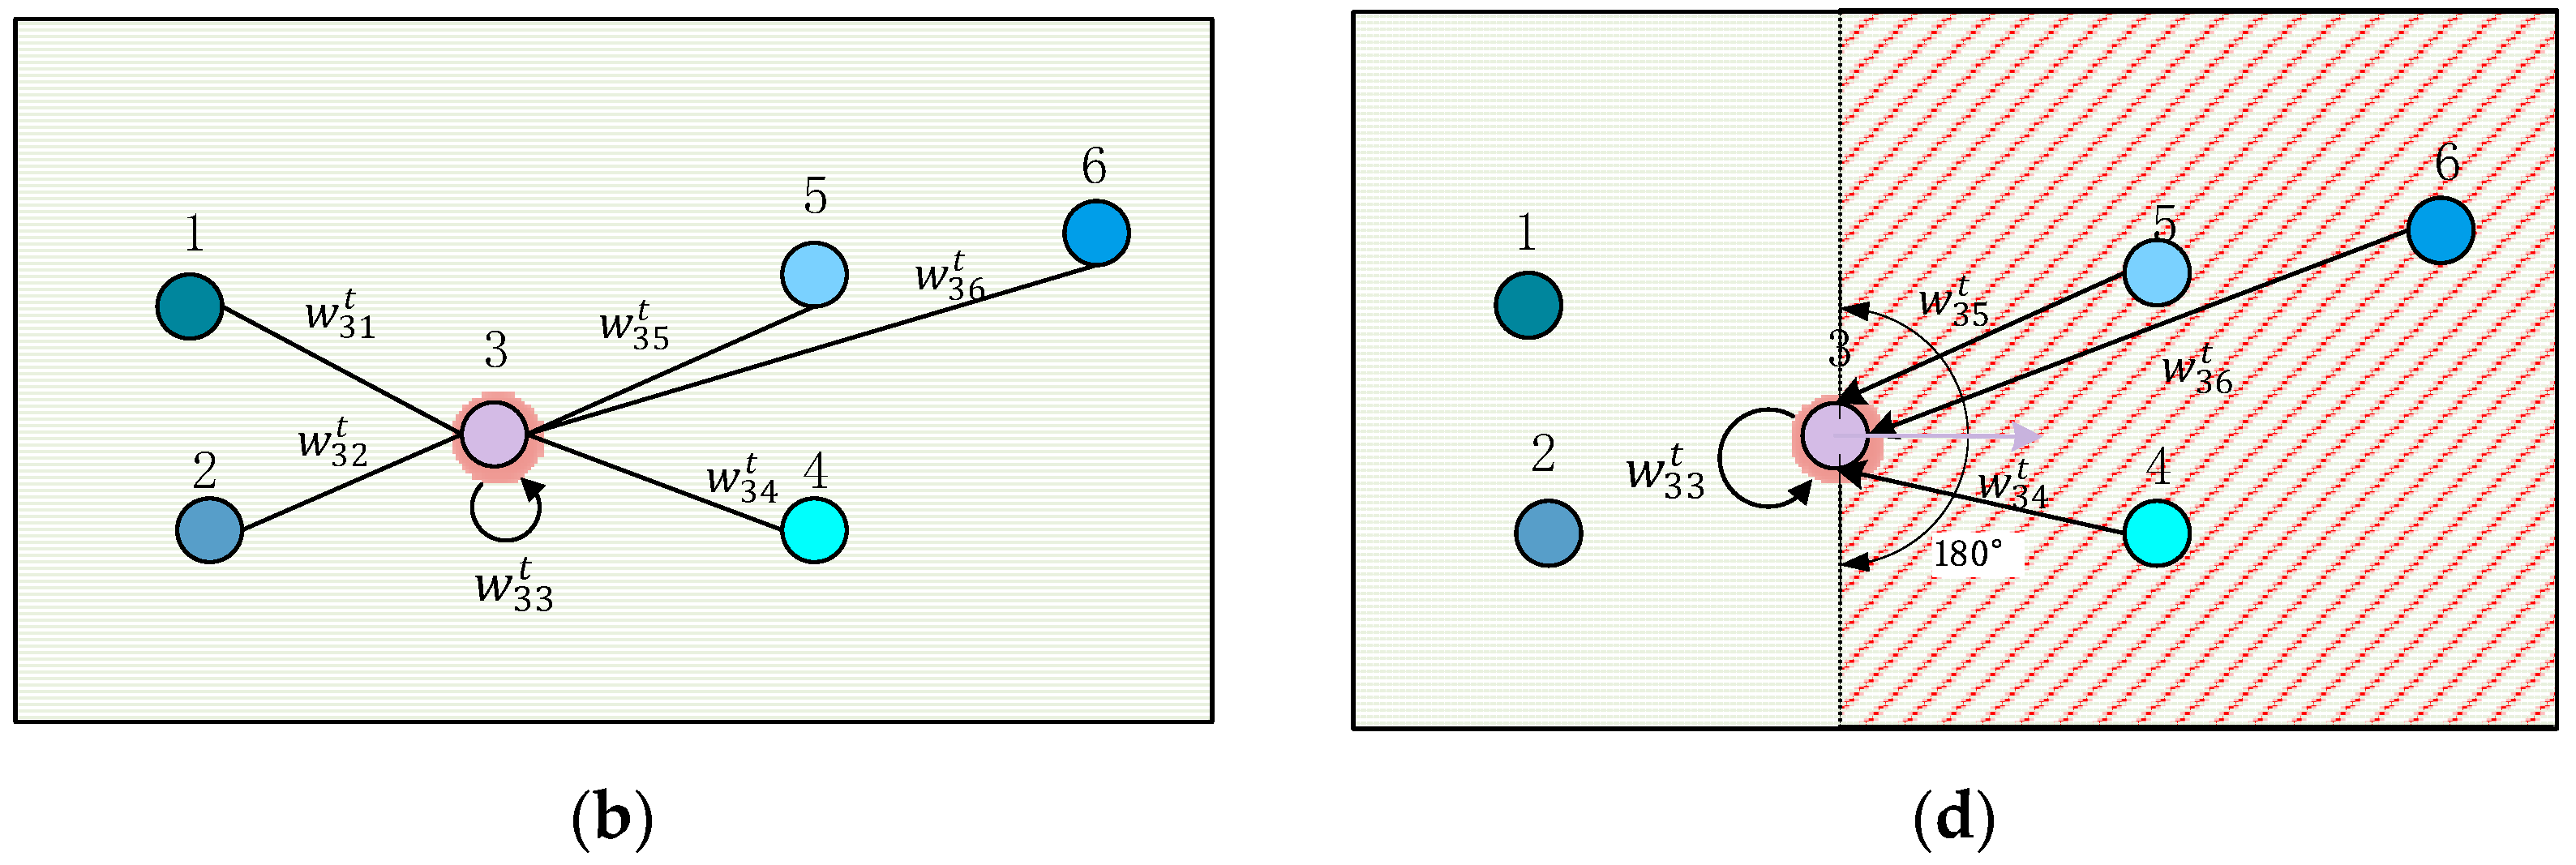
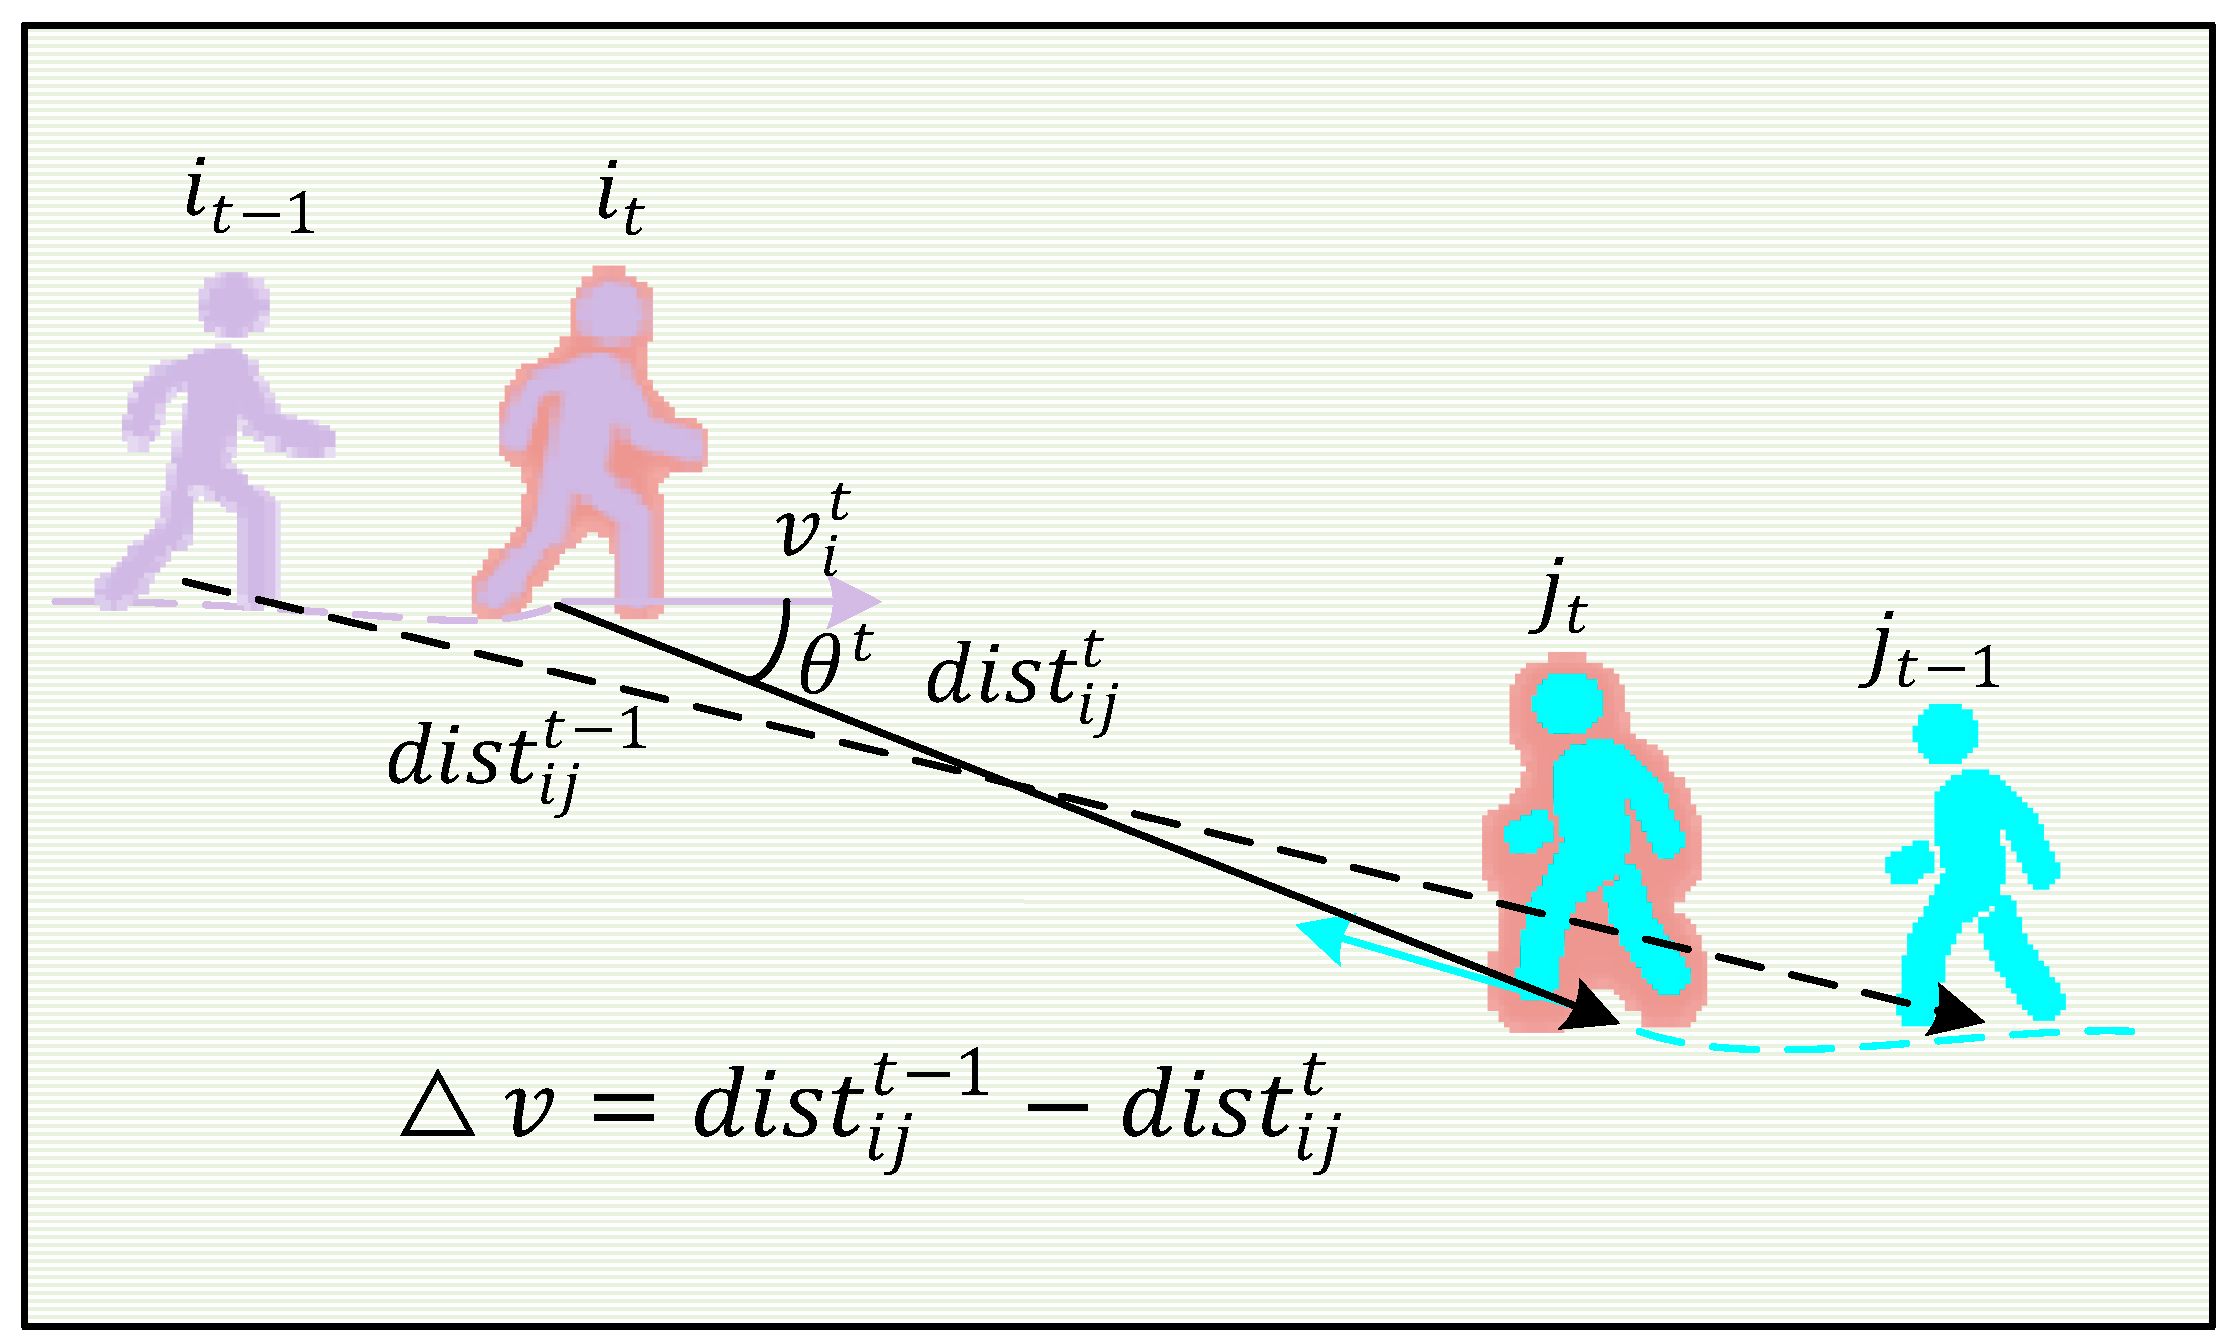
3.3.1. Directed Social Attention Function

To extract the directed interaction between pedestrians that conforms to the actual situation, we constructed the directed social attention function, which needs to accurately model the influence that pedestrians experience during walking. When pedestrians are moving forward, they will judge whether the pedestrians in front may collide with themselves and make way for and plan the route accordingly. Based on this description, we can identify two key factors: forward and collision. Next, we build the directed social attention function between pedestrians around these two keywords.
During the process of moving forward, due to the limitation of vision, pedestrians cannot consider the influence of everyone present on themselves, but can only focus on the individuals in the direction of their walking. Therefore, the influence between pedestrians is directed, rather than an indiscriminate two-way influence. Based on this, we calculate the directed interaction between pedestrians and construct a directed adjacency matrix representation.
Regarding collisions, pedestrians have actual volume, so it is inevitable to consider the factor of collision in the actual walking process. The factors affecting collisions include the relative speed of movement between pedestrians, the distance between them, and whether they are walking in the direction of movement. The traditional methods of modeling collisions are mostly designed based on relative distance, which cannot effectively express the complex relationships between pedestrians. Unlike most traditional methods, we comprehensively consider the approach speed, relative angle, and relative position to model individuals.
In response to this series of complex interaction situations, we designed the directed social attention function F s r to cover these features, aiming to calculate the relationship weight w i j t between pedestrian i and j at time t to construct the directed graph G 1 , so as to calculate the unique interaction influence of each pedestrian at every moment. The specific function is represented as follows:
w i j t = F s r v , cos θ t , d i s t i j t
That is,
w i j t = m a x 0 , v cos θ t d i s t i j t i j α i = j
As shown in Equation (5), our directed social attention function uses v , cos θ t , and d i s t i j t to represent the relative speed, relative angle, and relative distance between pedestrians, respectively.
We take the direction of the vector v i t as the positive direction and calculate the influence of relevant nodes within 180° in front of node i on node i . Taking node j as an example, we calculate the influence of node j on node i at time t . As shown in Figure 3, v i t represents the velocity vector v of node i at time t , which expresses the displacement of node i within unit time i , calculated via x i t x i t 1 , y i t x i t 1 . d i s t i j t represents the Euclidean distance between node i and node j at time t , and similarly, d i s t i j t 1 is the Euclidean distance between node i and node j at time t − 1. ∆v represents the distance change between node i and node j from time t 1 to t , calculated via v = d i s t i j t 1 d i s t i j t , representing their approach speed. θ t represents the angle between the direction of node i ’s movement and node j at time t , which we use to determine whether node j is in the direction of node i ’s movement. α is the attention constant of the self-loop in the graph, that is, the size of the pedestrian’s attention to itself, which is based on the data level. If it is too large, it will reduce the influence of surrounding pedestrians, and if it is too small, it will not pay enough attention to itself. The value here is obtained via our experiments.
In Figure 3, we only calculate the influence of pedestrians in the positive direction of node i’s walking direction on α . When considering the relative speed, v , we divide the relationship into two cases: approaching and moving away. Since only approaching poses a collision risk, we only need to consider the influence when two pedestrians are approaching each other. If two people are walking towards each other or pedestrian i is faster than pedestrian j , then the relative speed v obtained via v = d i s t i j t 1 d i s t i j t is positive. The larger the value of v , the larger the value of F s r . In this case, the two will not pose a collision risk. If the two are moving away from each other, then v is negative, and the influence of pedestrian j on pedestrian i is smaller at this time.
As shown in Equation (6), we introduced cos θ t in the F s r function to calculate whether pedestrian j is walking in the direction of pedestrian i ’s movement. With the direction of pedestrian i ’s movement specified as positive, only the influence of pedestrians within ±90° on both sides of the positive direction needs to be considered. When pedestrian j is directly in front of pedestrian i , the angle θ t is zero, the value of F s r is the largest, and the influence of pedestrian j on pedestrian i is the greatest. When pedestrian j is on both sides of pedestrian i , as the angle θ t increases, the influence of pedestrian j on pedestrian i decreases accordingly. Consistent with the traditional methods, in the positional relationship between two pedestrians, we also directly take the Euclidean distance d i s t i j t between them. The closer the distance, the greater the possibility of collision; that is, the smaller the d i s t i j t , the greater the influence. Therefore, in the calculation of F s r , we take the reciprocal of d i s t i j t , so that the smaller the d i s t i j t , the larger the value of F s r . Based on this method, we can effectively calculate the directed interaction intensity between pedestrians.

3.3.2. Spatiotemporal Weighted Attention Network

The purpose of this study is to better aggregate the weight features of directed edges. Inspired by the weighted signed graph attention network (WSGAT) [37] for link prediction, we improved the graph attention network and propose the spatiotemporal weighted attention network branch STWGAT. As shown in Equation (7), the classic Graph Attention Network (GAT) uses the same weight matrix W l to perform the calculation with the target node i and the adjacent node j , and then linearly combines them together, which limits the richness of feature expression.
e i j l = a k T ( W l h i | | W l h j )
In Equation (7), h i and h j represent the feature vectors of target node i and adjacent node j , respectively. W l denotes the learnable weight matrix for the l-th layer, and a k T is the attention vector. e i j l represents the attention coefficient between node i and node j at the l-th layer, indicating the relationship weight between the two nodes.
In our method, we calculate the weight of each edge based on the attention mechanism and then aggregate it, which is different from the common GAT method. As shown in Equation (8), we introduce the Multilayer Perceptron (MLP) to propagate the target node i , the adjacent node j , and the weight between them together.
e i j l = M L P l ( h i l | | h j l | | w i j t )
Thus, we can see that the new edge attention coefficient of node j to node i in the l -th layer can be calculated as follows:
α i j l = e x p ( L e a k y R e L U ( M L P l ( h i l | | h j l | | w i j t ) ) ) k V i e x p ( L e a k y R e L U ( M L P l ( h i l | | h k l | | w i j t ) ) )
Therefore, the node feature of node i in the new l + 1 layer can be represented as:
h i ( l + 1 ) = σ ( j V i α i j l h j l )
where σ is the activation function LeakyReLU. After the node features are aggregated in the Weighted Graph Attention Network (WGAT), the features will be sent into the temporal convolution to propagate in the temporal dimension. So far, the features have been propagated in the spatiotemporal weighted attention network.

3.3.3. Group Attention Function

Group behavior activities are an important part of pedestrian interactions. Groups usually have similar behavioral patterns or destinations, so pedestrians often exhibit the same characteristics in group walking activities. Therefore, separating groups from the crowd and encoding their features can help improve the accuracy of pedestrian trajectory prediction. Similar to the dual-branch spatiotemporal graph neural network Social-TAG [17], we need to identify and separate groups in the crowd and encode them into an adjacency matrix. Unlike Social-TAG, we have improved the definition of groups and quantified the interaction intensity within groups, and then performed spatiotemporal convolution through the Spatiotemporal Graph Convolutional Network (STGCN) to aggregate the spatiotemporal information of groups. In the scenario depicted in Figure 4, nine pedestrians (labeled 1 to 9) exhibit distinct movement characteristics, including varying directions and speeds. We determine the group affiliations based on their behavioral patterns, which are essential for constructing the group graph.
Our definition of groups is based on the behavioral logic of pedestrian groups. Groups in the crowd have similar ways of behaving. As a group of pedestrians, their direction of movement should be similar, the distance between pedestrians should be close, and their walking speed should be similar. Therefore, to determine whether pedestrians belong to the same group, these three conditions must be met simultaneously. As shown in Figure 4, pedestrian 3 is not in the same group as pedestrians 1 and 2 because the angle of their walking direction is too different, although pedestrian 3 is close to pedestrians 1 and 2. At the same time, pedestrian 9 is not in the same group as pedestrians 4 and 5 because their speed difference is too large, although the distance between pedestrian 9 and pedestrians 4 and 5 is close and the angle of their walking direction is also close. The changes of groups are particularly evident in the temporal dimension, so we make group determinations for the crowd at each time step and encode them into the adjacency matrix for propagation in the model. In the function we designed, thresholds are used to judge the direction of travel, the distance between pedestrians, and the speed of pedestrians to divide the groups. We compare each pedestrian in the crowd one by one, taking pedestrians i and j as an example for group determination.
x i t , y i t x j t , y j t 2 L p o s i t i o n θ v i t , v j t L d i r e c t i o n v i t v j t 2 L v e l o c i t y
In Equation (11), we calculate the Euclidean distance between pedestrian i and pedestrian j , and judge the distance between them based on the position restriction threshold L p o s i t i o n . At the same time, we calculate the angle θ between the velocity vectors of pedestrian i and pedestrian j , and judge the difference in their direction of travel based on the angle restriction threshold L d i r e c t i o n . Finally, we calculate the relative speed of the two people and judge it based on the speed restriction threshold L d i r e c t i o n . Only when pedestrians meet these three restriction conditions simultaneously can they be determined to belong to the same group. After the group determination is completed, we use the reciprocal of the Euclidean distance between pedestrians to quantify the interaction intensity between them. The smaller the distance between pedestrians, the greater the interaction intensity, which is consistent with the actual interaction situation.

3.4. Loss Function

The purpose of our method is to learn the binary Gaussian distribution of observed pedestrian trajectories, and the learned binary Gaussian distribution can be used to predict pedestrian trajectories during prediction. Therefore, we can effectively estimate the mean and covariance of the binary Gaussian distribution by minimizing the negative log-likelihood. The loss function is defined as:
L i = t = T o b s + 1 T p r e d log ( P ( x t i , y t i | μ t i , σ t i , ρ t i )
In the above Equation (12), μ t i is the mean, σ t i is the variance, and ρ t i is the correlation coefficient, while P ( x t i , y t i | μ t i , σ t i , ρ t i ) denotes the probability density of the observations x t i and y t i given the model parameters μ t i , σ t i , and ρ t i . By minimizing this loss function, we can optimize the model parameters so that the predicted pedestrian trajectories better conform to the actual observed trajectory data.

4. Experiment and Results
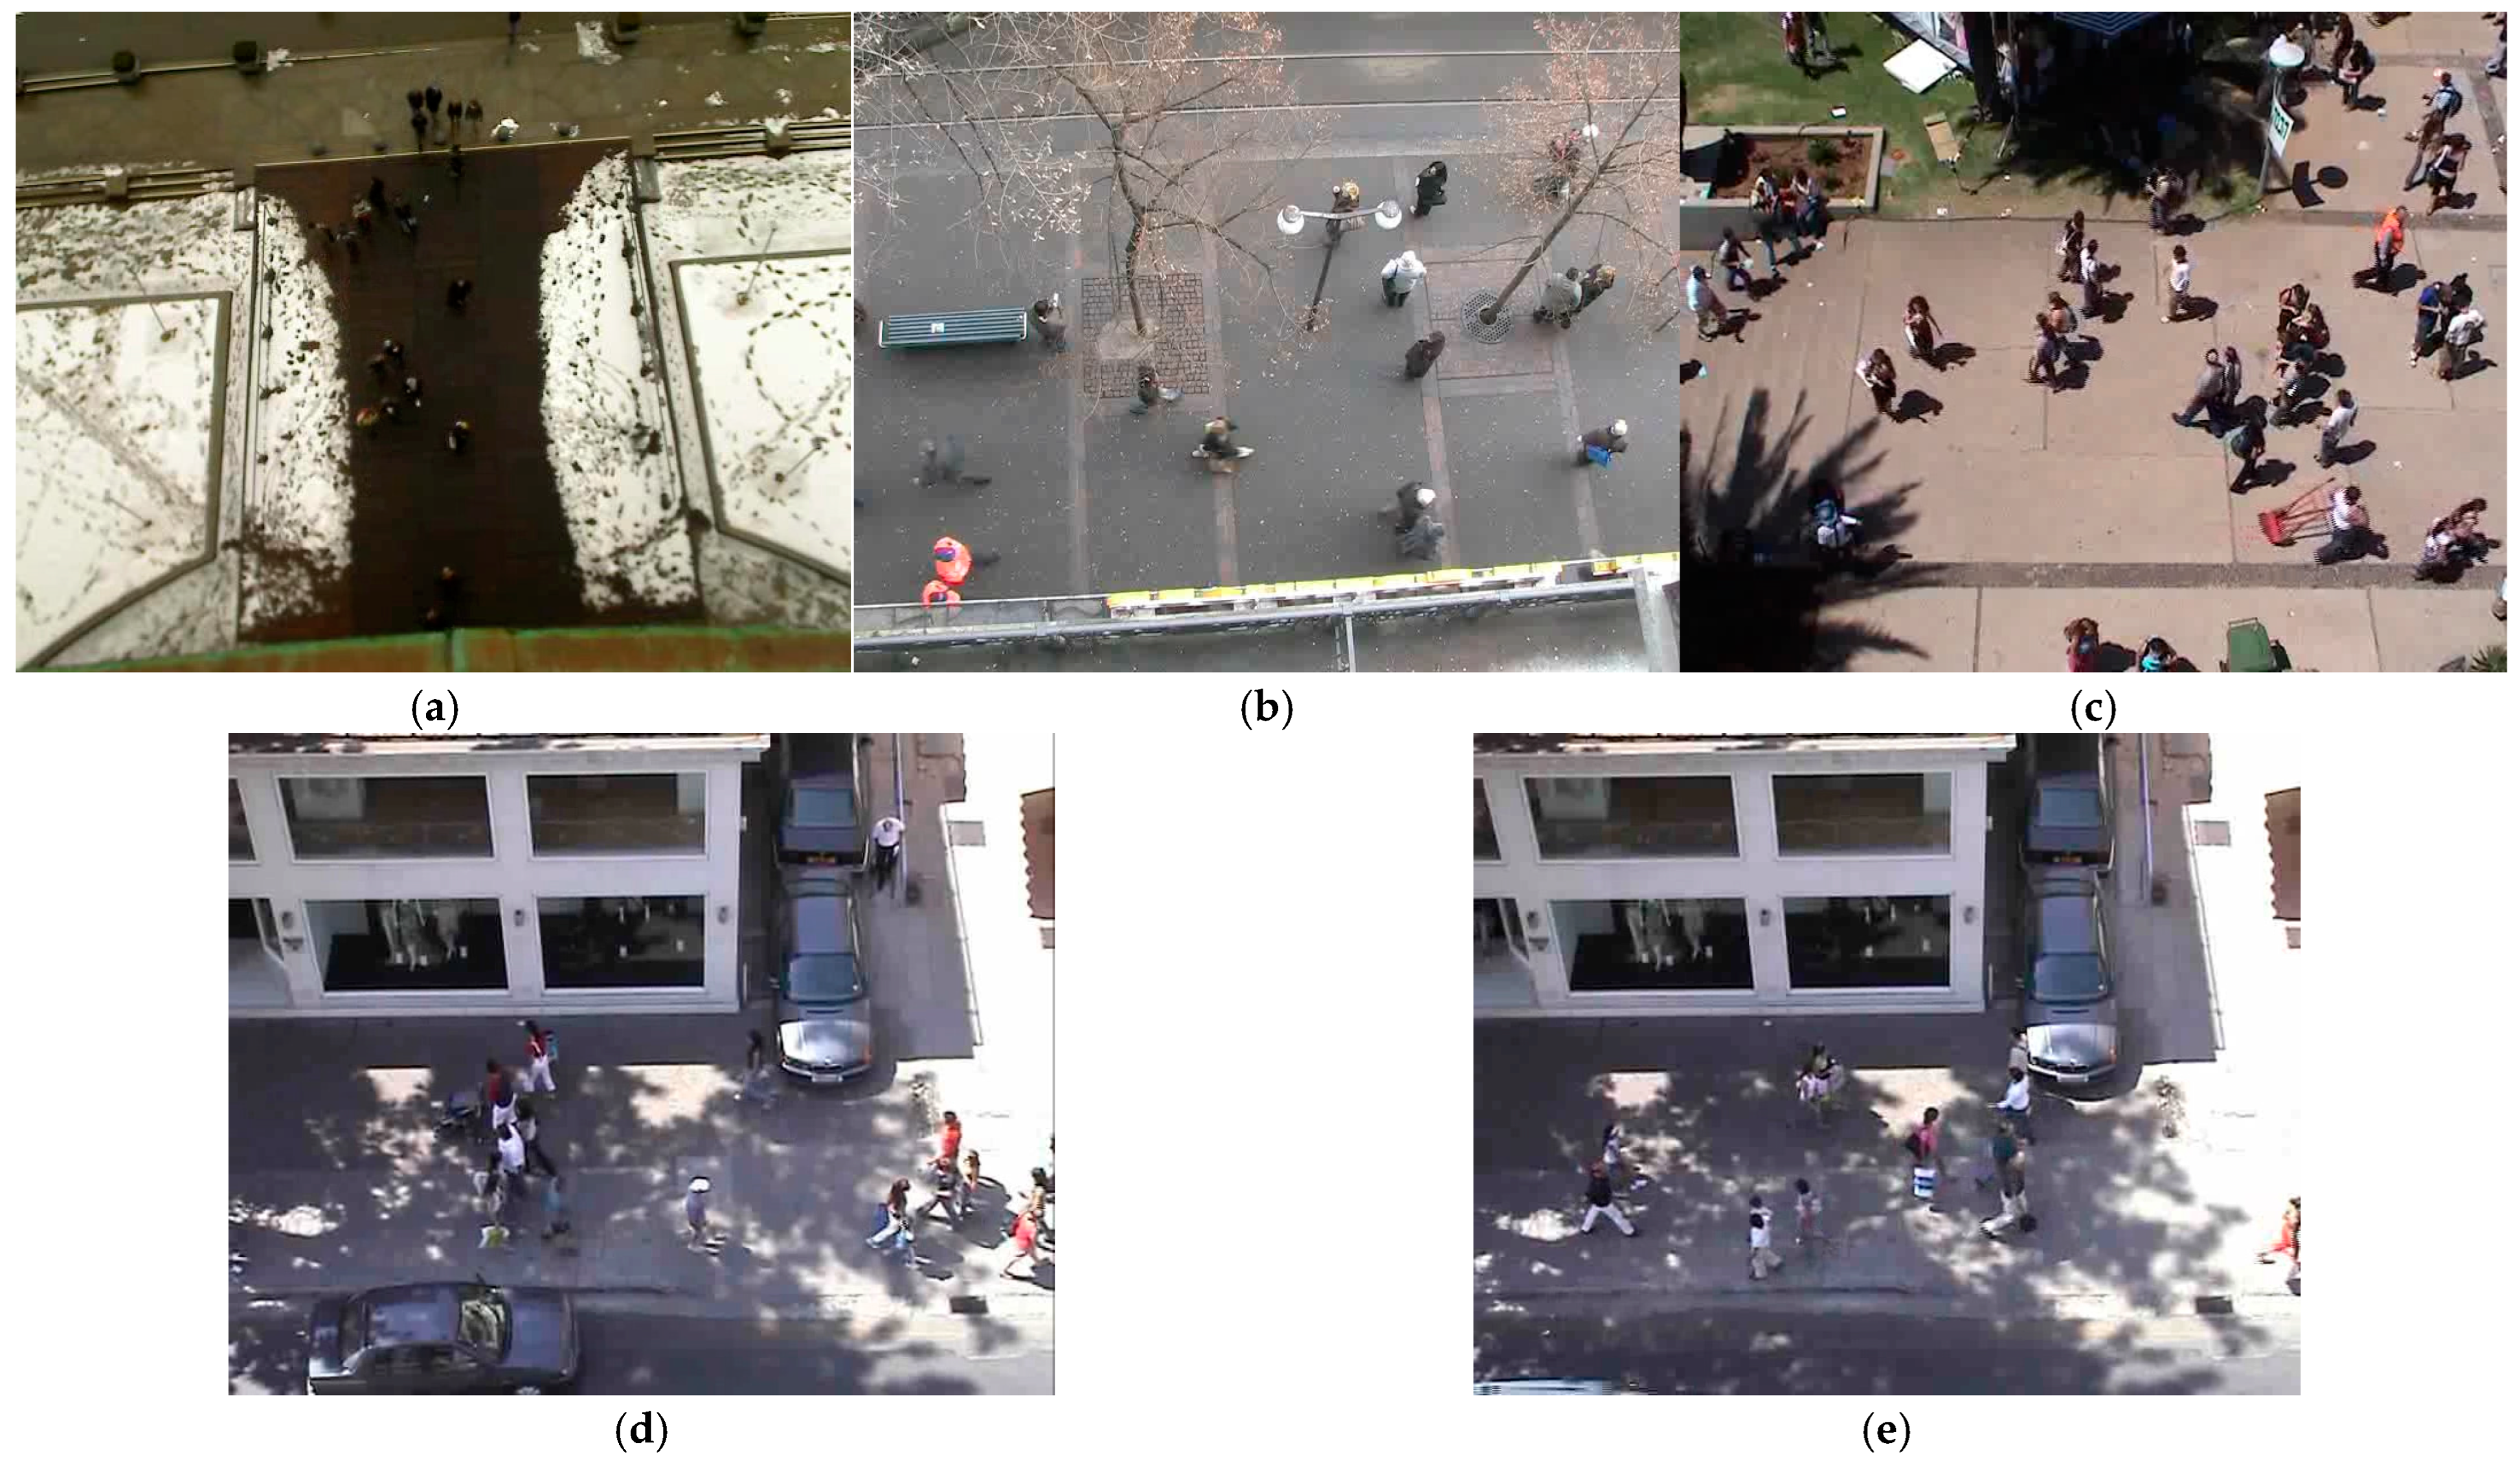
4.1. Datasets

This study conducted experimental evaluations on the ETH [38] and UCY [39] benchmark datasets, which encompass five distinct scenarios. The ETH dataset comprises “eth” (university campus environment) and “hotel” (hotel surroundings) scenarios, while the UCY dataset contains “Univ” (large academic campus), “zara1”, and “zara2” (both representing commercial district environments).
The ETH dataset was collected and released by the Computer Vision Laboratory at ETH Zurich, while the UCY dataset was developed by the University of Cyprus. Both datasets have been anonymized, and the pedestrian data included do not contain personal information. Figure 5 illustrates representative frames from these five scenarios (labeled a-e corresponding to eth, hotel, Univ, zara1, and zara2, respectively).
The details of the originally collected data are shown in Table 1. Each dataset contains approximately 12,380 frames, recorded at a rate of about 25 frames per second. The number of pedestrians varies depending on the specific scene.
In practical applications, a sampling interval of every 0.4 s is used to record the pixel coordinates of pedestrians in the scene, thereby collecting the trajectory data of pedestrians. To facilitate a comparison with other methods, we adopt a similar observation and prediction time-step division strategy as in the existing research: after observing the pedestrian trajectories for 3.2 s (i.e., 8 time steps), we predict the pedestrian trajectories for the next 4.8 s (i.e., 12 time steps). Similar to the method in the literature [31], during the division of the training and prediction sets, we allocate a portion of the data in the corresponding scenario dataset for testing, and the remaining part is used for model training together with the data from the other four scenarios.

4.2. Evaluation Metrics

To maintain the consistency with the previous methods, we use the Average Displacement Error (ADE) and Final Displacement Error (FDE) as evaluation metrics.
Specifically, the Average Displacement Error (ADE) is defined as the average Euclidean distance between the predicted and true positions of all individuals over the entire time period of the predicted trajectory. ADE measures the average error between the predicted and true trajectories at each time step, reflecting the overall accuracy of the predicted trajectory. The definition of ADE is as follows:
A D E = i N t = T o b s + 1 T p r e d x i t , y i t ( x ^ i t , y ^ i t ) 2 N ( T p r e d T o b s )
The Final Displacement Error (FDE) is defined as the Euclidean distance between the predicted and true positions at the final time step of the predicted trajectory. FDE measures the error between the endpoint of the predicted trajectory and the endpoint of the true trajectory, reflecting the accuracy and stability of the predicted trajectory in long-term predictions. The definition of FDE is as follows:
F D E = i N x i T p r e d , y i T p r e d ( x ^ i T p r e d , y ^ i T p r e d ) 2 N

4.3. Implementation Details

In our approach, we compute two adjacency matrices after processing the data information through two information extraction functions. Following the normalization of these adjacency matrices, they are, respectively, fed into the STWGAT layer and the STGCN layer. Next, we utilize six TPCNNS layers for trajectory prediction. In the model, all activation functions employ PReLU, and we introduce Dropout regularization to prevent overfitting, with the Dropout rate is set at 0.1. The batch size is set to 128. All the training and testing for this study are conducted on an NVIDIA RTX 4060 GPU and an Intel i5-13600 KF CPU. The model is trained for a total of 300 epochs, using the Stochastic Gradient Descent (SGD) optimizer for model training. The learning rate is set to 0.01 for the first 150 epochs, and subsequently, the learning rate is reduced by a factor of 0.2 every 150 epochs thereafter.

4.4. Quantitative Analysis

In this study, we selected several classic trajectory prediction methods for comparison, including Social-GAN [28], Social-BiGAT [24], Sophie [40], SCAN [41], Social TAG [17], Social-STGCNN [31], D-STGCN [23], SISGAN [27], and STGAT [9]. The comparative results of our method with these models are shown in Table 2, which lists the comparison results of the Average Displacement Error (ADE) and Final Displacement Error (FDE) for all the methods. The best results in the table are marked in bold. The comparison results indicate that on the ETH and UCY datasets, compared with these classic prediction approaches, the proposed method outperforms them in terms of their prediction performance.
Specifically, compared with the best-performing model, Social-TAG, our method reduces the ADE and FDE metrics by 7.14% and 5.88%, respectively. Compared with the classic Graph Neural Network method, Social-STGCNN, our method reduces the ADE and FDE metrics by 11.36% and 14.67%, respectively. On the hotel dataset, our model shows a significant advantage over Sophie and SISGAN. Although these two models enhance the model performance by introducing scene context information, making them competitive in some cases, they also introduce some scene interference, resulting in poor performance on the hotel dataset. As shown in Table 2, compared with other datasets, our method shows the most significant improvement on the univ dataset. This observation demonstrates that our directed relationship and group attention functions effectively extract interaction information in crowded scenarios.

4.5. Ablation Experiments

In this section, to verify the effectiveness of the proposed directed social attention function and group attention function, we design a set of experiments to conduct ablation studies on the model. Table 3 shows different experimental configurations, where the baseline model (Basel) indicates that the model does not use our attention functions but only aggregates the node features of the two branches through the basic adjacency matrix. The Social option indicates whether to use the directed social attention function for individual features, and the Group option indicates whether to use the group attention function for group features.
As shown in Table 3, in this comparative experiment, we observe that although both methods contribute to improving the model performance, the effect is relatively limited when only the group attention function is combined with the baseline model. In contrast, after introducing the directed social attention function, the model performance is significantly improved, with ADE/FDE reduced to 0.42 and 0.68, respectively. Finally, when both functions are introduced simultaneously, the model performance is further enhanced, indicating that our approach of collecting more pedestrian features through these two methods to improve model performance is correct.
To verify the effectiveness of the proposed Spatio-Temporal Weighted Attention Network, we conducted relevant research on the calculation of directed weighted graphs and used different methods to calculate the directed weighted graph. Specifically, we designed four methods for experimental testing.
As shown in Table 4, in the first method (M1), based on the Directed Graph Convolutional Neural Network (DGCN), the node features of the next layer are propagated after calculating the adjacency matrix through in-degree normalization.
h i l + 1 = σ ( D 1 A h j l )
as shown in Equation (15). h j l represents the feature vector of node j in the l -th layer, A is the adjacency matrix, D 1 is the inverse of the degree matrix, σ is the activation function, and h i l + 1 denotes the feature vector of node i in the ( l + 1 ) -th layer.
The second method is an improved approach based on Graph Attention Networks (GATs). In this method, α i j l represents the attention coefficient between node i and node j in the l -th layer, and W i j is the weight of the directed weighted graph. The meanings of other symbols are consistent with those in Equation (16). W i j directly acts as an explicit weighting factor in the propagation of node features, and the propagation equation is as follows:
h i l + 1 = σ ( j V i α i j l h j l W i j )
In the third method, we add the weights W i j of the directed weighted graph to the node features and then participate in the aggregation propagation, as shown in Equations (15) and (16). In this context, a k T is a learnable parameter used to weight node features during the feature aggregation process. γ is a learnable scalar that modulates the interaction between edge weights and node features. The meanings of other symbols are consistent with those in Equation (17).
e i j l = γ W i j + a k T ( W l h i | | W l h j )
h i ( l + 1 ) = σ ( j V i α i j l h j l )
The fourth method is our proposed Spatio-Temporal Weighted Attention Network branch STWGAT method, with the aggregation method as shown in Equations (8) and (10). As shown in Table 4, the performance of different calculation methods is listed. It can be seen that the proposed Spatio-Temporal Weighted Attention Network method has the best overall performance, with its structure outperforming other methods in terms of ADE/FDE.

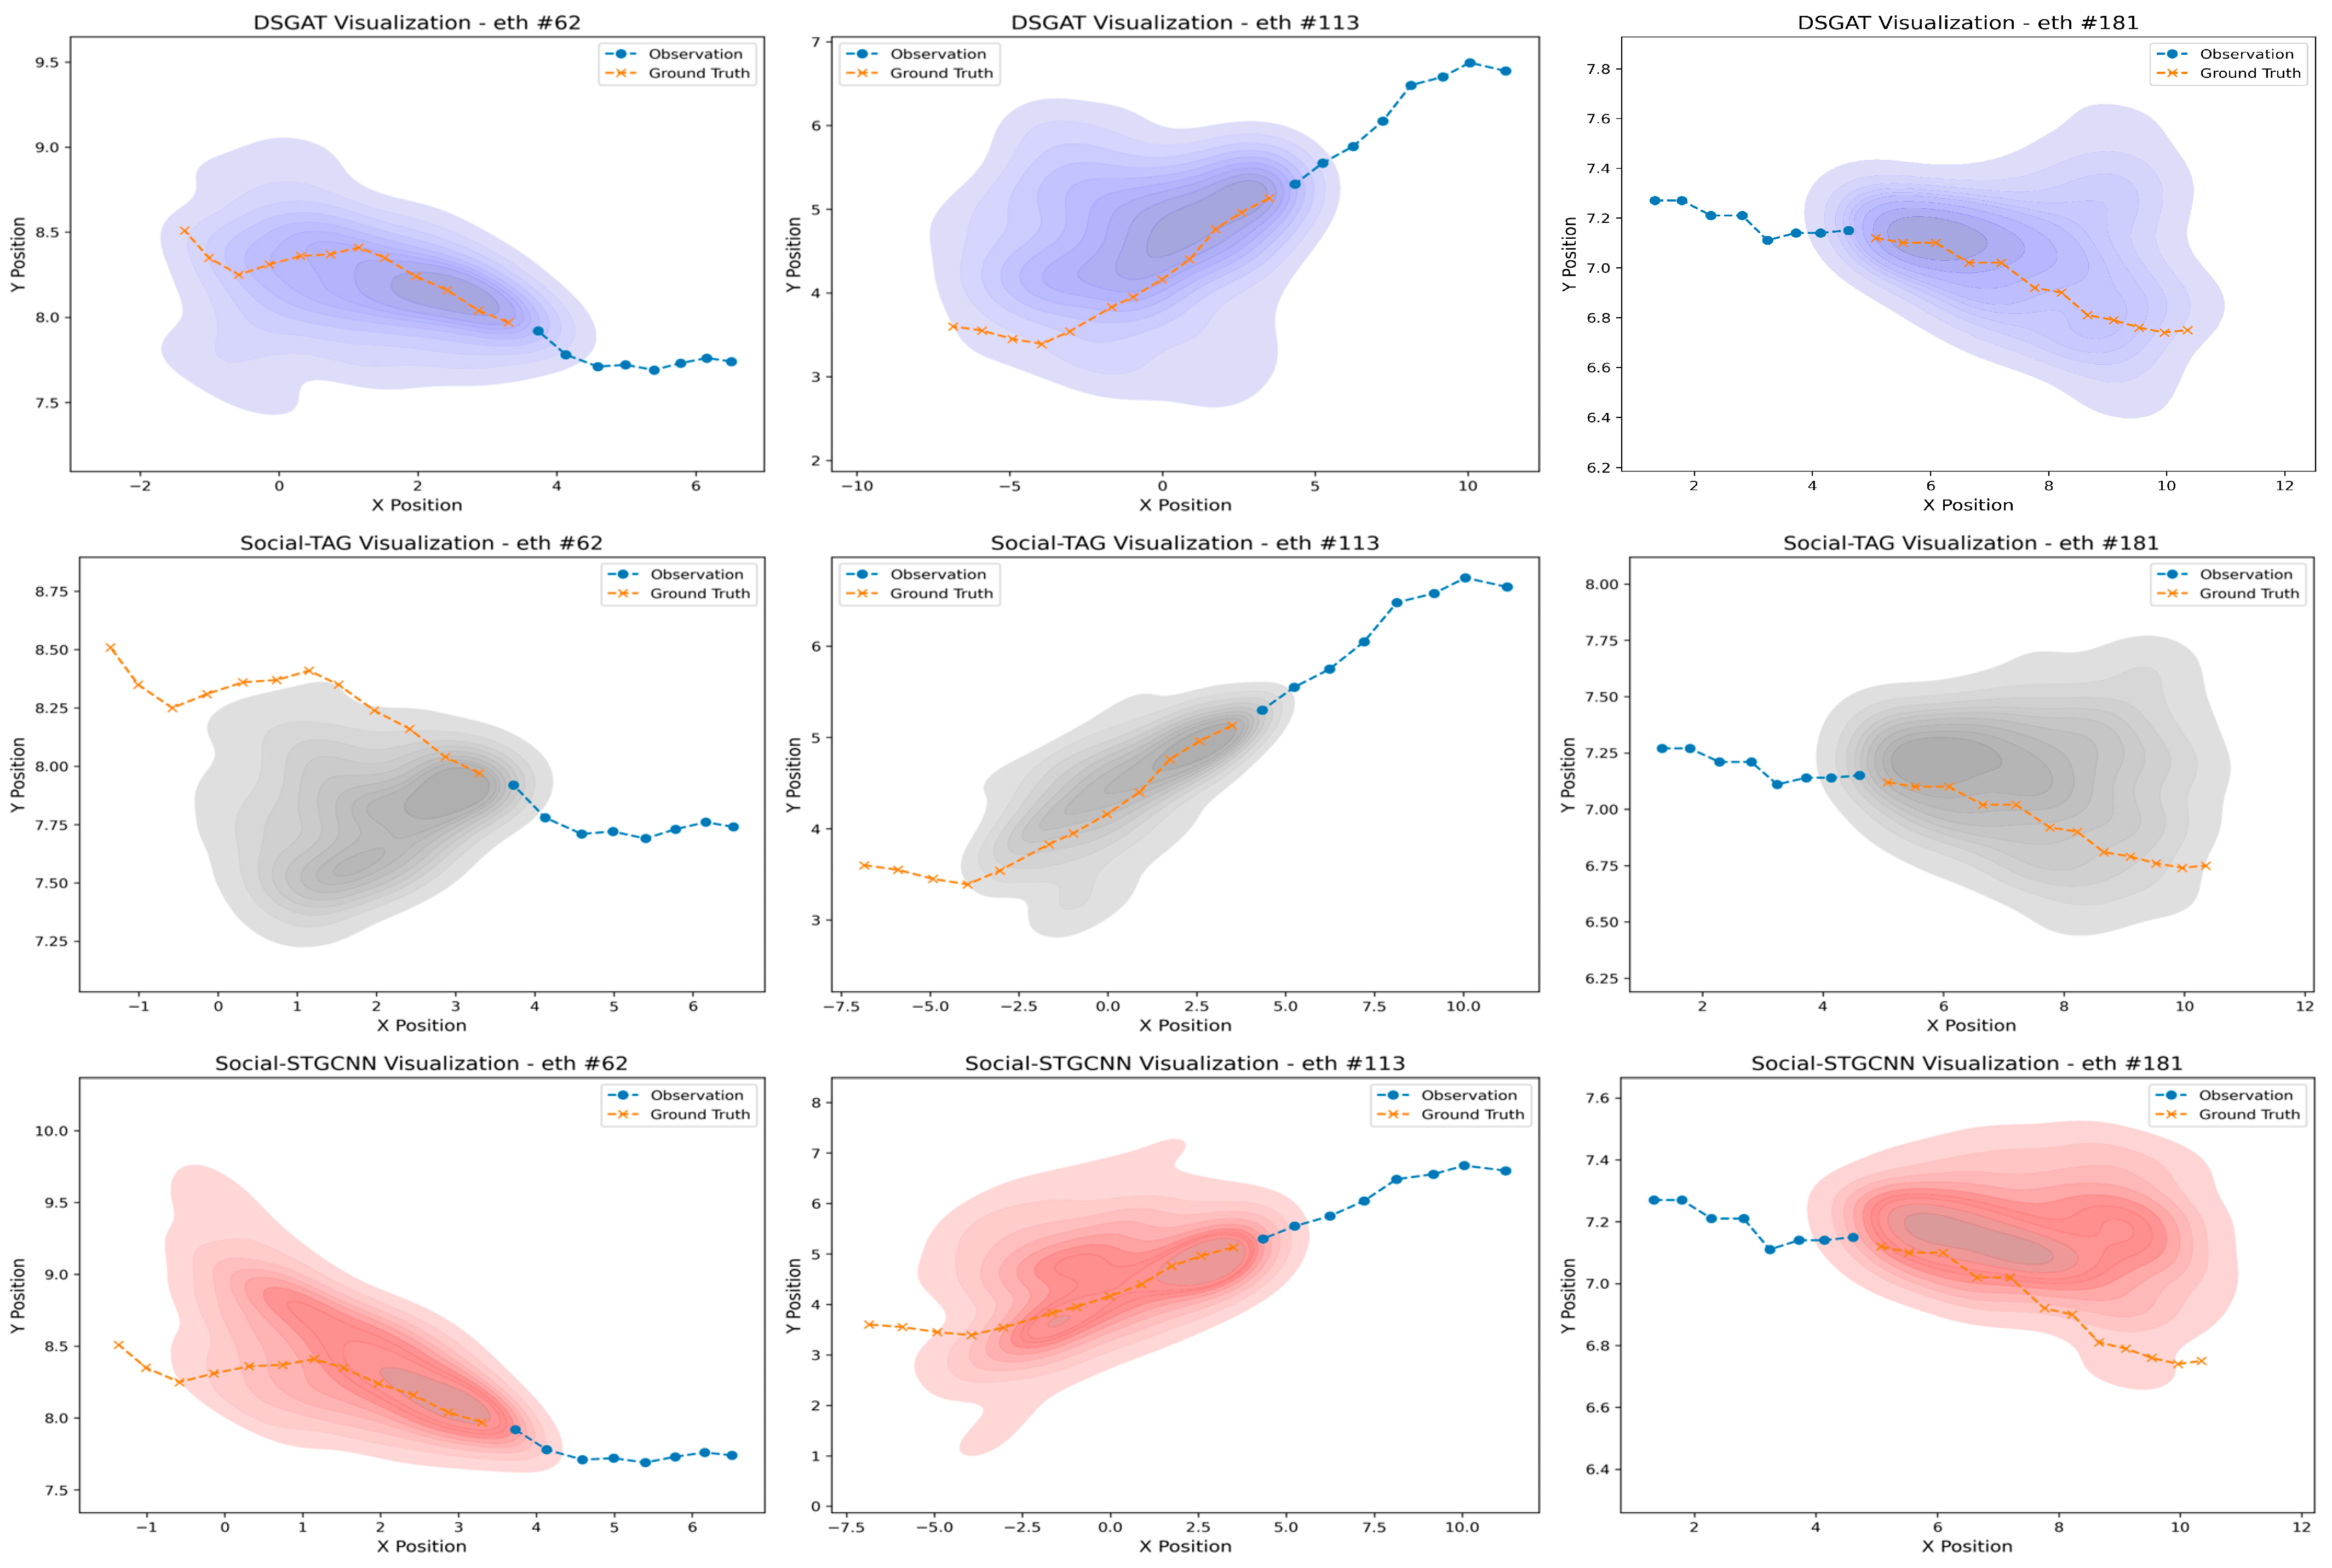
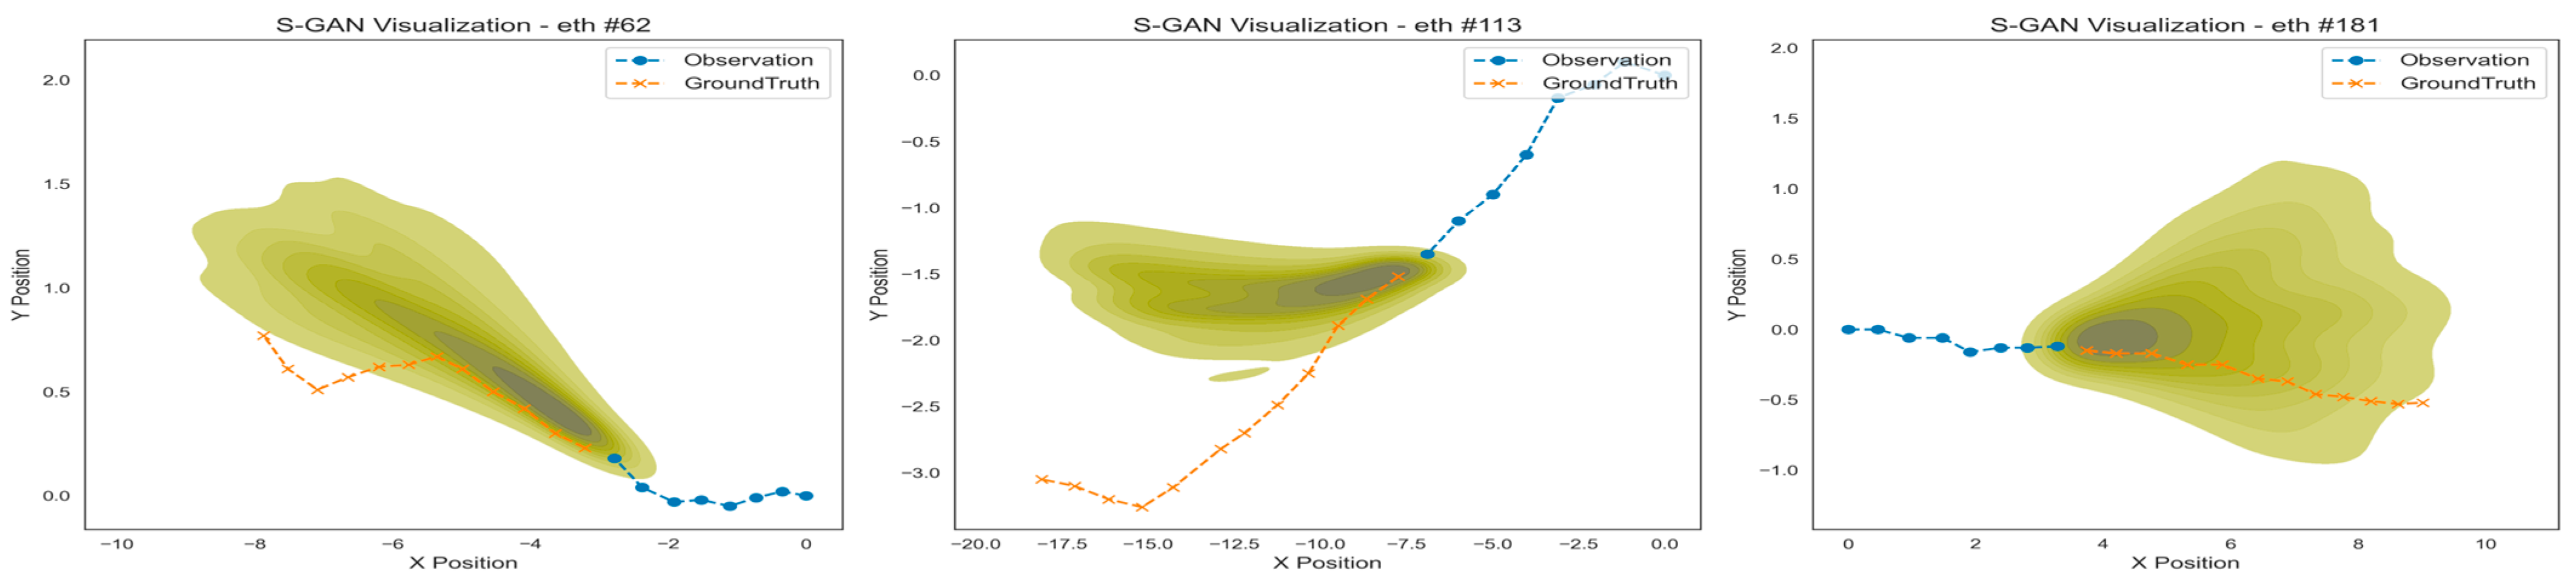
4.6. Qualitative Analysis

Based on the quantitative analysis results, our proposed model demonstrates promising performance on the ETH and UCY datasets. In this section, we conduct qualitative analysis through trajectory prediction visualizations. Representative predicted trajectories are selected to illustrate the effectiveness and rationality of our approach. A systematic qualitative comparative analysis is implemented to evaluate the multi-model trajectory prediction performance. Taking the ETH test dataset as an example, we randomly select pedestrian trajectories for visual predictive analysis across four models.
As illustrated in Figure 6, each row from top to bottom corresponds to a distinct model, while each column from left to right represents the same pedestrian. The models are arranged vertically as DSGAT, Social-TAG, Social-STGCNN, and Social-GAN from top to bottom. The selected pedestrians (left to right) are numbered 62, 113, and 181. Observed trajectories are depicted as blue dotted lines, ground truth trajectories are depicted as yellow cross-marked lines, and model predictions are visualized through probability density clouds. The darker regions in these clouds indicate higher probability zones for pedestrian movement paths, effectively reflecting the spatial anticipation patterns.
Through the probability density visualization in Figure 6, it is evident that the DSGAT model proposed in this study exhibits significant advantages in estimating the trajectory probability distributions. Its generated trajectories accurately capture the overall movement trends of pedestrians. This advantage primarily stems from the model’s effective integration of multidimensional pedestrian interaction information, including spatial relative positions, movement velocities, directions, and group characteristics, enabling the precise modeling of the trajectory probability distributions.
Comparative experiments show that while Social-STGCNN remains competitive in short-term predictions (t < 1.2 s) using Euclidean-based social graph convolution, its oversimplified social feature representation causes a significant deterioration in the direction and displacement estimation accuracy during medium- to long-term predictions (t ≥ 2.4 s). Similarly, Social-TAG’s exclusion of velocity features results in a 28.6% reduced effective prediction radius, manifesting a pronounced performance decay in the later prediction phases.
Our comprehensive analysis confirms that the proposed method achieves more rational trajectory distribution modeling through probability density estimation, not only accurately capturing the motion trend characteristics but also maintaining stable performance over temporal sequences. These results substantiate the efficacy of multimodal social feature fusion strategies for pedestrian trajectory prediction in complex scenarios.

5. Conclusions

This paper introduces a novel pedestrian trajectory prediction model based on a dual social graph attention network. Unlike previous approaches, we incorporate additional pedestrian features into the model and design a directed relationship attention function to compute the directed interactions between pedestrians. Additionally, we quantify group features in the crowd using a group attention function, which significantly improves the prediction of pedestrian intentions.
The experimental results on the ETH and UCY datasets demonstrate the effectiveness of our approach. With the introduction of richer feature inputs, the model’s predictive performance is further improved. Furthermore, this paper presents a spatiotemporal weighted attention network for directed weighted temporal graphs to enhance the model’s ability to aggregate the information from such graphs. In our approach, the directed weighted graph extracted by using the relationship attention function works in conjunction with the spatiotemporal weighted attention network. This method better aligns with real-world movement patterns, reflecting pedestrians’ decision-making logic and actual behaviors.
Our proposed method demonstrates the effectiveness on the ETH and UCY datasets, suggesting its potential scalability to large-scale pedestrian scenarios. However, the validity of the threshold-based crowd segmentation approach in dense crowd scenarios or other datasets still requires further validation on additional test sets. Furthermore, this study primarily focuses on modeling the interactions among pedestrians, without incorporating physical scene information. The absence of scene context may limit the model’s perception and decision-making capabilities when dealing with complex terrain scenarios in real-world environments. In future work, we plan to explore additional pedestrian feature information and validate our method across more diverse scenarios to comprehensively model pedestrian characteristics and enhance the accuracy of trajectory prediction.

Author Contributions

Conceptualization, X.L. and Y.L.; methodology, X.L.; software, X.L.; validation, X.L., Z.Y., and J.L.; formal analysis, X.L.; investigation, Z.Y.; resources, X.L.; data curation, J.L.; writing—original draft preparation, X.L.; writing—review and editing, X.L.; visualization, Z.Y.; supervision, X.L.; project administration, Y.L.; funding acquisition, Y.L. All authors have read and agreed to the published version of the manuscript.

Funding

This research received no external funding.

Institutional Review Board Statement

Not applicable.

Informed Consent Statement

Not applicable.

Data Availability Statement

The original contributions presented in this study are included in the article. Further inquiries can be directed to the corresponding author.

Conflicts of Interest

The authors declare no conflicts of interest.

References

  1. Zhang, C.; Berger, C. Pedestrian Behavior Prediction Using Deep Learning Methods for Urban Scenarios: A Review. IEEE Trans. Intell. Transp. Syst. 2023, 24, 10279–10301. [Google Scholar] [CrossRef]
  2. Golchoubian, M.; Ghafurian, M.; Dautenhahn, K.; Azad, N.L. Pedestrian Trajectory Prediction in Pedestrian-Vehicle Mixed Environments: A Systematic Review. IEEE Trans. Intell. Transp. Syst. 2023, 24, 11544–11567. [Google Scholar] [CrossRef]
  3. Helbing, D.; Molnár, P. Social Force Model for Pedestrian Dynamics. Phys. Rev. E 1995, 51, 4282–4286. [Google Scholar] [CrossRef]
  4. Kim, S.; Guy, S.J.; Liu, W.; Wilkie, D.; Lau, R.W.H.; Lin, M.C.; Manocha, D. BRVO: Predicting Pedestrian Trajectories Using Velocity-Space Reasoning. Int. J. Robot. Res. 2015, 34, 201–217. [Google Scholar] [CrossRef]
  5. Jiang, J.; Yan, K.; Xia, X.; Yang, B. A Survey of Deep Learning-Based Pedestrian Trajectory Prediction: Challenges and Solutions. Sensors 2025, 25, 957. [Google Scholar] [CrossRef]
  6. Sighencea, B.I.; Stanciu, R.I.; Căleanu, C.D. A Review of Deep Learning-Based Methods for Pedestrian Trajectory Prediction. Sensors 2021, 21, 7543. [Google Scholar] [CrossRef] [PubMed]
  7. Fernando, T.; Denman, S.; Sridharan, S.; Fookes, C. Soft + Hardwired attention: An LSTM framework for human trajectory prediction and abnormal event detection. Neural Netw. 2018, 108, 466–478. [Google Scholar] [CrossRef]
  8. Leon, F.; Gavrilescu, M. A Review of Tracking and Trajectory Prediction Methods for Autonomous Driving. Mathematics 2021, 9, 660. [Google Scholar] [CrossRef]
  9. Shao, L.; Ling, M.; Yan, Y.; Xiao, G.; Luo, S.; Luo, Q. Research on Vehicle-Driving-Trajectory Prediction Methods by Considering Driving Intention and Driving Style. Sustainability 2024, 16, 8417. [Google Scholar] [CrossRef]
  10. Shi, L.; Wang, L.; Long, C.; Zhou, S.; Zhou, M.; Niu, Z.; Hua, G. SGCN: Sparse Graph Convolution Network for Pedestrian Trajectory Prediction. In Proceedings of the 2021 IEEE/CVF Conference on Computer Vision and Pattern Recognition (CVPR), Nashville, TN, USA, 20–25 June 2021; pp. 8990–8999. [Google Scholar]
  11. Huang, Y.; Bi, H.; Li, Z.; Mao, T.; Wang, Z. STGAT: Modeling Spatial-Temporal Interactions for Human Trajectory Prediction. In Proceedings of the 2019 IEEE/CVF International Conference on Computer Vision (ICCV), Seoul, Republic of Korea, 27 October–2 November 2019; pp. 6271–6280. [Google Scholar]
  12. Alahi, A.; Goel, K.; Ramanathan, V.; Robicquet, A.; Fei-Fei, L.; Savarese, S. Social LSTM: Human trajectory prediction in crowded spaces. In Proceedings of the 2016 IEEE Conference on Computer Vision and Pattern Recognition (CVPR), Las Vegas, NV, USA, 27–30 June 2016; pp. 961–971. [Google Scholar]
  13. Xue, H.; Huynh, D.Q.; Reynolds, M. SS-LSTM: A Hierarchical LSTM Model for Pedestrian Trajectory Prediction. In Proceedings of the 2018 IEEE Winter Conference on Applications of Computer Vision (WACV), Lake Tahoe, NV, USA, 12–15 March 2018; pp. 1186–1194. [Google Scholar]
  14. Hasan, I.; Setti, F.; Tsesmelis, T.; Bue, A.D.; Cristani, M.; Galasso, F. “Seeing is believing”: Pedestrian trajectory forecasting using visual frustum of attention. In Proceedings of the IEEE Winter Conference on Applications of Computer Vision (WACV), Lake Tahoe, NV, USA, 12–15 March 2018; pp. 1178–1185. [Google Scholar]
  15. Yang, B.; Yan, G.; Wang, P.; Chan, C.-Y.; Song, X.; Chen, Y. A Novel Graph-Based Trajectory Predictor with Pseudo-Oracle. IEEE Trans. Neural Netw. Learn. Syst. 2022, 33, 7064–7078. [Google Scholar] [CrossRef]
  16. Sun, J.; Jiang, Q.; Lu, C. Recursive Social Behavior Graph for Trajectory Prediction. In Proceedings of the 2020 IEEE/CVF Conference on Computer Vision and Pattern Recognition (CVPR), Seattle, WA, USA, 13–19 June 2020; pp. 657–666. [Google Scholar]
  17. Zhang, X.; Angeloudis, P.; Demiris, Y. Dual-Branch Spatio-Temporal Graph Neural Networks for Pedestrian Trajectory Prediction. Pattern Recognit. 2023, 142, 109633. [Google Scholar] [CrossRef]
  18. Ellis, D.; Sommerlade, E.; Reid, I. Modelling pedestrian trajectory patterns with Gaussian processes. In Proceedings of the 2009 IEEE 12th International Conference on Computer Vision Workshops, ICCV Workshops, Kyoto, Japan, 27 September–4 October 2009; pp. 1229–1234. [Google Scholar]
  19. Yin, D.; Jiang, R.; Deng, J.; Li, Y.; Xie, Y.; Wang, Z.; Zhou, Y.; Song, X.; Shang, J.S. MTMGNN: Multi-time multi-graph neural network for metro passenger flow prediction. GeoInformatica 2023, 27, 77–105. [Google Scholar] [CrossRef]
  20. Bicocchi, N.; Mamei, M. Investigating ride sharing opportunities through mobility data analysis. Pervasive Mob. Comput. 2014, 14, 83–94. [Google Scholar] [CrossRef]
  21. Cavallaro, C.; Verga, G.; Tramontana, E.; Muscato, O. Multi-Agent Architecture for Point of Interest Detection and Recommendation. In Proceedings of the CEUR Workshop Proceedings, Parma, Italy, 26–28 June 2019; Volume 2404, pp. 98–104. [Google Scholar]
  22. Guo, Y.; Zhang, Y.; Boulaksil, Y.; Tian, N. Multi-dimensional spatiotemporal demand forecasting and service vehicle dispatching for online car-hailing platforms. Int. J. Prod. Res. 2022, 60, 1832–1853. [Google Scholar] [CrossRef]
  23. Zou, G.; Lai, Z.; Ma, C.; Tu, M.; Fan, J.; Li, Y. When Will We Arrive? A Novel Multi-Task Spatio-Temporal Attention Network Based on Individual Preference for Estimating Travel Time. IEEE Trans. Intell. Transp. Syst. 2023, 24, 11438–11452. [Google Scholar] [CrossRef]
  24. Zong, M.; Chang, Y.; Dang, Y.; Wang, K. Pedestrian Trajectory Prediction in Crowded Environments Using Social Attention Graph Neural Networks. Appl. Sci. 2024, 14, 9349. [Google Scholar] [CrossRef]
  25. Liu, S.; Liu, H.; Bi, H.; Mao, T. CoL-GAN: Plausible and Collision-Less Trajectory Prediction by Attention-Based GAN. IEEE Access 2020, 8, 101662–101671. [Google Scholar] [CrossRef]
  26. Pang, S.M.; Cao, J.X.; Jian, M.Y.; Lai, J.; Yan, Z.Y. BR-GAN: A Pedestrian Trajectory Prediction Model Combined with Behavior Recognition. IEEE Trans. Intell. Transp. Syst. 2022, 23, 24609–24620. [Google Scholar] [CrossRef]
  27. Dou, W.; Lu, L. SISGAN: A Generative Adversarial Network Pedestrian Trajectory Prediction Model Combining Interaction Information and Scene Information. Appl. Sci. 2024, 14, 9537. [Google Scholar] [CrossRef]
  28. Gupta, A.; Johnson, J.; Fei-Fei, L.; Savarese, S.; Alahi, A. Social GAN: Socially Acceptable Trajectories with Generative Adversarial Networks. In Proceedings of the 2018 IEEE/CVF Conference on Computer Vision and Pattern Recognition (CVPR), Salt Lake City, UT, USA, 18–23 June 2018; pp. 2255–2264. [Google Scholar]
  29. Zhou, X.; Zhang, Y.; Wang, Y.; Liu, Z. CSR: Cascade Conditional Variational Auto Encoder with Socially-aware Regression for Pedestrian Trajectory Prediction. Pattern Recognit. 2023, 133, 109030. [Google Scholar] [CrossRef]
  30. Zhou, H.; Yang, X.; Ren, D.; Huang, H.; Fan, M. CSIR: Cascaded Sliding CVAEs with Iterative Socially-Aware Rethinking for Trajectory Prediction. IEEE Trans. Intell. Transp. Syst. 2023, 24, 14957–14969. [Google Scholar] [CrossRef]
  31. Mohamed, A.; Qian, K.; Elhoseiny, M.; Claudel, C. Social-STGCNN: A Social Spatio-Temporal Graph Convolutional Neural Network for Human Trajectory Prediction. In Proceedings of the 2020 IEEE/CVF Conference on Computer Vision and Pattern Recognition (CVPR), Seattle, WA, USA, 13–19 June 2020; pp. 14412–14420. [Google Scholar]
  32. Kipf, T.N.; Welling, M. Semi-supervised classification with graph convolutional networks. In Proceedings of the International Conference on Learning Representations, Toulon, France, 24–26 April 2017. [Google Scholar]
  33. Petar, V.; Cucurull, G.; Casanova, A.; Romero, A.; Pietro, L.; Bengio, Y. Graph Attention Networks. In Proceedings of the International Conference on Learning Representations, Vancouver, BC, Canada, 30 April–3 May 2018. [Google Scholar]
  34. Youssef, T.; Zemmouri, E.; Bouzid, A. STM-GCN: A Spatiotemporal Multi-Graph Convolutional Network for Pedestrian Trajectory Prediction. J. Supercomput. 2023, 79, 20923–20937. [Google Scholar] [CrossRef]
  35. Sighencea, B.I.; Stanciu, I.R.; Căleanu, C.D. D-STGCN: Dynamic Pedestrian Trajectory Prediction Using Spatio-Temporal Graph Convolutional Networks. Electronics 2023, 12, 611. [Google Scholar] [CrossRef]
  36. Kosaraju, V.; Sadeghian, A.; Martín-Martín, R.; Reid, I.; Rezatofighi, H.; Savarese, S. Social-bigat: Multimodal trajectory forecasting using bicycle-gan and graph attention networks. Adv. Neural Inf. Process. Syst. 2019, 32, 137–146. [Google Scholar]
  37. Grassia, M.; Mangioni, G. wsGAT: Weighted and Signed Graph Attention Networks for Link Prediction. In Complex Networks & Their Applications X: Volume 1, Proceedings of the Tenth International Conference on Complex Networks and Their Applications; Springer: Cham, Switareland, 2022; pp. 369–375. [Google Scholar]
  38. Pellegrini, S.; Ess, A.; Van Gool, L. Improving Data Association by Joint Modeling of Pedestrian Trajectories and Groupings. In Proceedings of the 11th European Conference on Computer Vision, Heraklion, Greece, 5–11 September 2010; pp. 452–465. [Google Scholar]
  39. Lerner, A.; Chrysanthou, Y.; Lischinski, D. Crowds by example. Comput. Graph. Forum 2007, 26, 655–664. [Google Scholar] [CrossRef]
  40. Amir, S.; Vineet, K.; Ali, S.; Noriaki, H.; Hamid, R.; Silvio, S. Sophie: An attentive gan for predicting paths compliant to social and physical constraints. In Proceedings of the IEEE Conference on Computer Vision and Pattern Recognition, Long Beach, CA, USA, 15–20 June 2019; pp. 1349–1358. [Google Scholar]
  41. Sekhon, J.; Fleming, C. SCAN: A Spatial Context Attentive Network for Joint Multi-Agent Intent Prediction. In Proceedings of the AAAI Conference on Artificial Intelligence, Virtually, 2–9 February 2021; Volume 35, pp. 6119–6127. [Google Scholar]
Figure 1. The architecture of the DSGAT network that we proposed. Our method aggregates the directed social features of pedestrians based on a directed social attention function, and quantifies group features based on a group attention function.
Applsci 15 04285 g001
Figure 2. (a) Pedestrians in scene; (b) omni-directional information aggregation; (c) pedestrian directed interactions; (d) directed information aggregation.
Applsci 15 04285 g002aApplsci 15 04285 g002b
Figure 3. The social feature between pedestrians i and j at different times.
Applsci 15 04285 g003
Figure 4. Group division in crowds.
Applsci 15 04285 g004
Figure 5. Frame examples from the five subsets of the ETH and UCY datasets. (a) Campus environment; (b) hotel surroundings; (c) university campus; (d) mall plaza; (e) mall plaza.
Applsci 15 04285 g005
Figure 6. The figure shows the predicted trajectory distribution. The dotted line represents the observed trajectory, and the cross line represents the true trajectory.
Applsci 15 04285 g006aApplsci 15 04285 g006b
Table 1. The specific details of the ETH/UCY dataset.
DatasetScene DescriptionFramesPedestriansTime
ETH Campus12,380367518 s
HOTELHotel Surrounding18,060420774 s
UNIVUniversity Campus9830849393 s
ZARA1Mall Environment9010148361 s
ZARA2Mall Environment10,520204420 s
Table 2. This table uses Average Displacement Error (ADE) and Final Displacement Error (FDE) as evaluation metrics (in meters) to compare baseline methods on the ETH and UCY datasets.
MethodETHHOTELUNIVZARA1ZARA2AVG
Social-GAN0.81/1.520.72/1.610.60/1.260.34/0.690.42/0.840.58/1.18
Social-BiGAT0.69/1.290.49/1.010.55/1.320.30/0.620.36/0.750.48/1.00
Sophie0.70/1.430.76/1.670.54/1.240.30/0.630.38/0.780.54/1.15
SCAN0.84/1.580.44/0.900.63/1.330.31/0.850.37/0.760.51/1.08
Social-TAG0.61/1.000.37/0.560.51/0.870.33/0.500.30/0.490.42/0.68
Social-STGCNN0.64/1.110.49/0.850.44/0.790.34/0.530.30/0.480.44/0.75
D-STGCN0.63/1.030.37/0.580.46/0.780.35/0.560.29/0.480.42/0.68
SISGAN0.63/0.950.58/1.620.50/1.100.31/0.680.30/0.730.46/1.01
STGAT0.65/1.120.35/0.660.52/1.100.34/0.690.29/0.600.43/0.83
DSGAT(our)0.60/0.970.34/0.540.42/0.760.31/0.490.29/0.470.39/0.64
Table 3. In the ablation experiments, “Social” and “Group” refer to the individual and group feature modules, respectively, while “Basel” indicates the baseline model without these modules.
BaselSocialGroupETHHOTELUNIVZARA1ZARA2AVG
0.66/1.210.45/0.770.49/0.910.37/0.600.35/0.560.46/0.81
0.68/1.270.43/0.710.54/0.970.36/0.550.33/0.530.47/0.80
0.61/1.050.38/0.600.44/0.740.34/0.530.31/0.500.42/0.68
0.60/0.970.34/0.540.42/0.760.31/0.490.29/0.470.39/0.64
Table 4. Experiments on different calculation methods for directed weighted graphs.
MethodAVERAGE ADEAVERAGE FDE
M1(DGCN)0.410.68
M2(Weighting Factor)0.440.73
M3(Addition)0.470.78
M4(WSGAT)0.390.64
Disclaimer/Publisher’s Note: The statements, opinions and data contained in all publications are solely those of the individual author(s) and contributor(s) and not of MDPI and/or the editor(s). MDPI and/or the editor(s) disclaim responsibility for any injury to people or property resulting from any ideas, methods, instructions or products referred to in the content.

