1. Introduction
The prediction of the seakeeping behavior of ships for a variety of probable environmental and operational conditions has wide application in the shipping industry, providing important information about the design and efficient/safe operation of modern ships. For a ship sailing in waves, the basic controllable parameters are the forward speed and the heading to the waves, so the ship operability study aims to determine in which sea states, described by a significant wave height (HS) and peak spectral periods (Tp), the ship can maintain a given course and speed.
In ship design, ship operability studies could be utilized to determine the operability index (OI), which represents basically the proportion of time a ship is accessible for perfect operation [
1]. The OI considers simultaneously the wave characteristics of the sailing area, the dynamic ship response to the waves, and the ship mission. The ship OI may be used as a decision-making tool when acquiring a new ship for a specific service, to compare the comfort level of different ships [
2], and for ship form optimization [
3]. There are variations of the OI, such as the operability robustness index (ORI), a performance criterion used to assess the robustness of a vessel in different sea states [
4]. The Habitability Index (HI) refers to the assessment of onboard comfort and livability, particularly for passenger vessels [
5]. The Comfort Index (CI) is used to assess passenger comfort aboard vessels, especially on longer journeys. This index considers factors like motion sickness, noise levels, and vibrations, using probabilistic methods to predict comfort levels under various sea conditions. It allows operators to anticipate discomfort and optimize routes to minimize passenger distress [
6].
In ship operations, operability studies are used for real-time decisions in Decision Support Systems (DSS), where the time frame may be hours (tactical decisions) or days (strategic decisions relating to route planning) [
7]. Tactical decisions are made at the navigation bridge, related to the choice of ship speed and course having an impact on the ship motions and loads due to the wave action. In that respect, the following commands could be given: no change is required, speed reduction, course change, or speed and course change [
8]. The strategic decision is to determine, before the mission, which route the ship may take, duly accounting for structural safety, the total travel time, fuel consumption, etc. A strategic decision about ship routing is, therefore, a multi-attribute decision-making process [
9]. Examples of operational decision-making include predicting first-order vessel responses as a key component of decision support systems, examining the effects of uncertainties in sea state descriptions on operational limits, and presenting a new model for adaptive weather routing based on seakeeping analysis and optimization, aimed at reducing operational risks [
10,
11,
12]. Operability analysis as a part of weather routing is presented in [
13].
In the common ship operability studies, the seakeeping calculations and assessments are based on specific ship-inherent and environmental data and assumptions. Thus, seakeeping tools are employed assuming their results as ground truth, while seakeeping limiting values are also considered as fixed, prescribed values. However, different seakeeping theories may result in rather different outcomes of the operability studies [
14]. The uncertainties associated with the sea state descriptions used in the numerical analysis influence the operational limits (in terms of
HS and
Tp) [
11]. The effect of the seakeeping criteria on the seakeeping performance assessment for passenger vessels shows that the OI is strongly affected by the chosen limiting values [
15].
It becomes evident from this review that operability studies are dependent not only on inherent (or aleatory) uncertainties of random sea surface elevation and wave environmental variations in ship operating zones, but also on the knowledge-based (or epistemic) uncertainties, encompassing modeling uncertainties of seakeeping theories and tools and uncertainties of seakeeping limiting values [
16]. Obviously, both uncertainty types need to be included in the consistent probabilistic ship operability analysis [
17].
The concept of the risk-based Navigation Decision Assistant (NDA) was proposed initially in [
7]. The concept described the evaluation of probabilities and consequences, accounting for the uncertainties of the input variables. Another concept of the risk-based DSS was introduced, incorporating aleatory and epistemic uncertainties related to the parameters of the problem of ship motions in waves [
18]. It is concluded that the system can be applied to both the ship’s operational assessment and the design procedure, but there is a need to improve the efficiency of the probabilistic assessment for practical onboard applications [
19]. A procedure to incorporate random variables and associated uncertainties in the calculations of the outcrossing rates that are the basis for risk-based DSS is suggested in [
20].
The present study aims to continue this development of the risk-based DSS by formulating and solving the probabilistic problem of ship operability analysis for different seakeeping limiting criteria. Epistemic uncertainties are included in this operability study, resulting in probabilistic operability polar plots being more informative compared to the “deterministic” polar plots. While previous studies (e.g., [
18,
19]) included seakeeping uncertainties in operability analysis, the present work extends these studies by incorporating uncertainties in operability limiting values. The limit state equations are formulated and solved using Comrel 2021 software for structural reliability analysis. This study also proposes extending the conventional OI for ship design to the Probabilistic Operability Index (POI) as a more rational measure of ship operability. The potential application of probabilistic operability diagrams for tactical DSS is also shown.
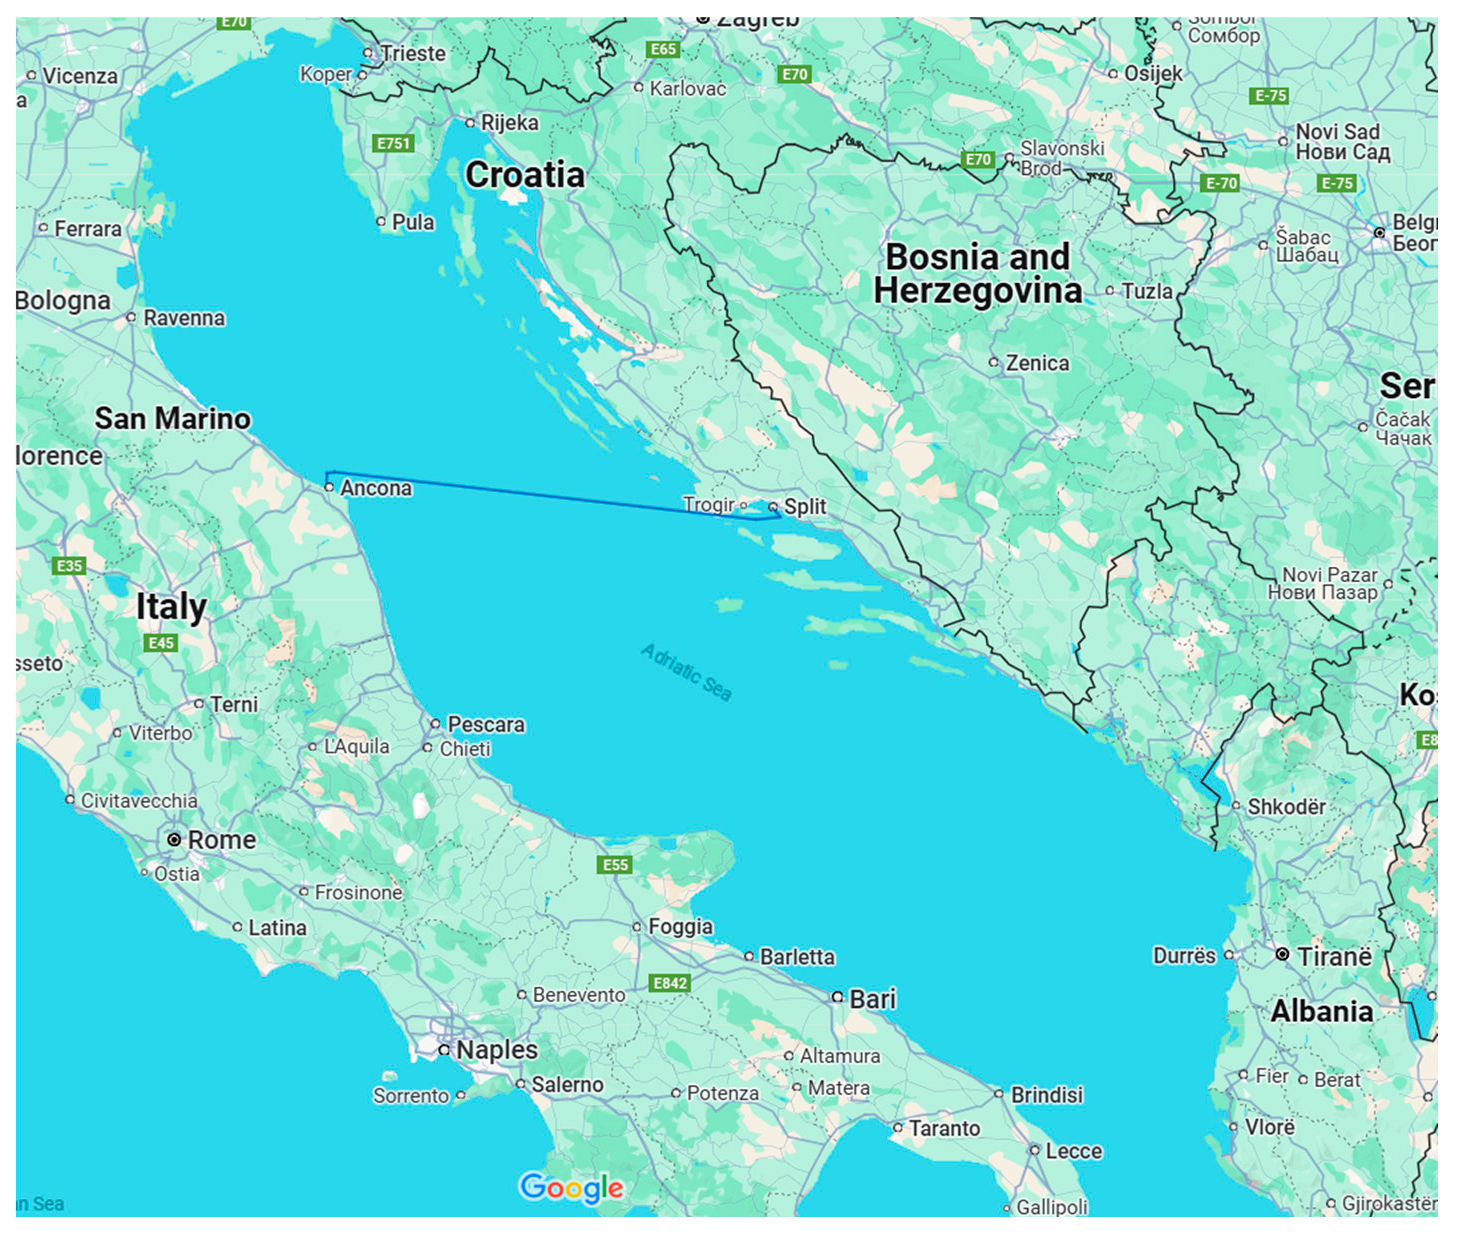
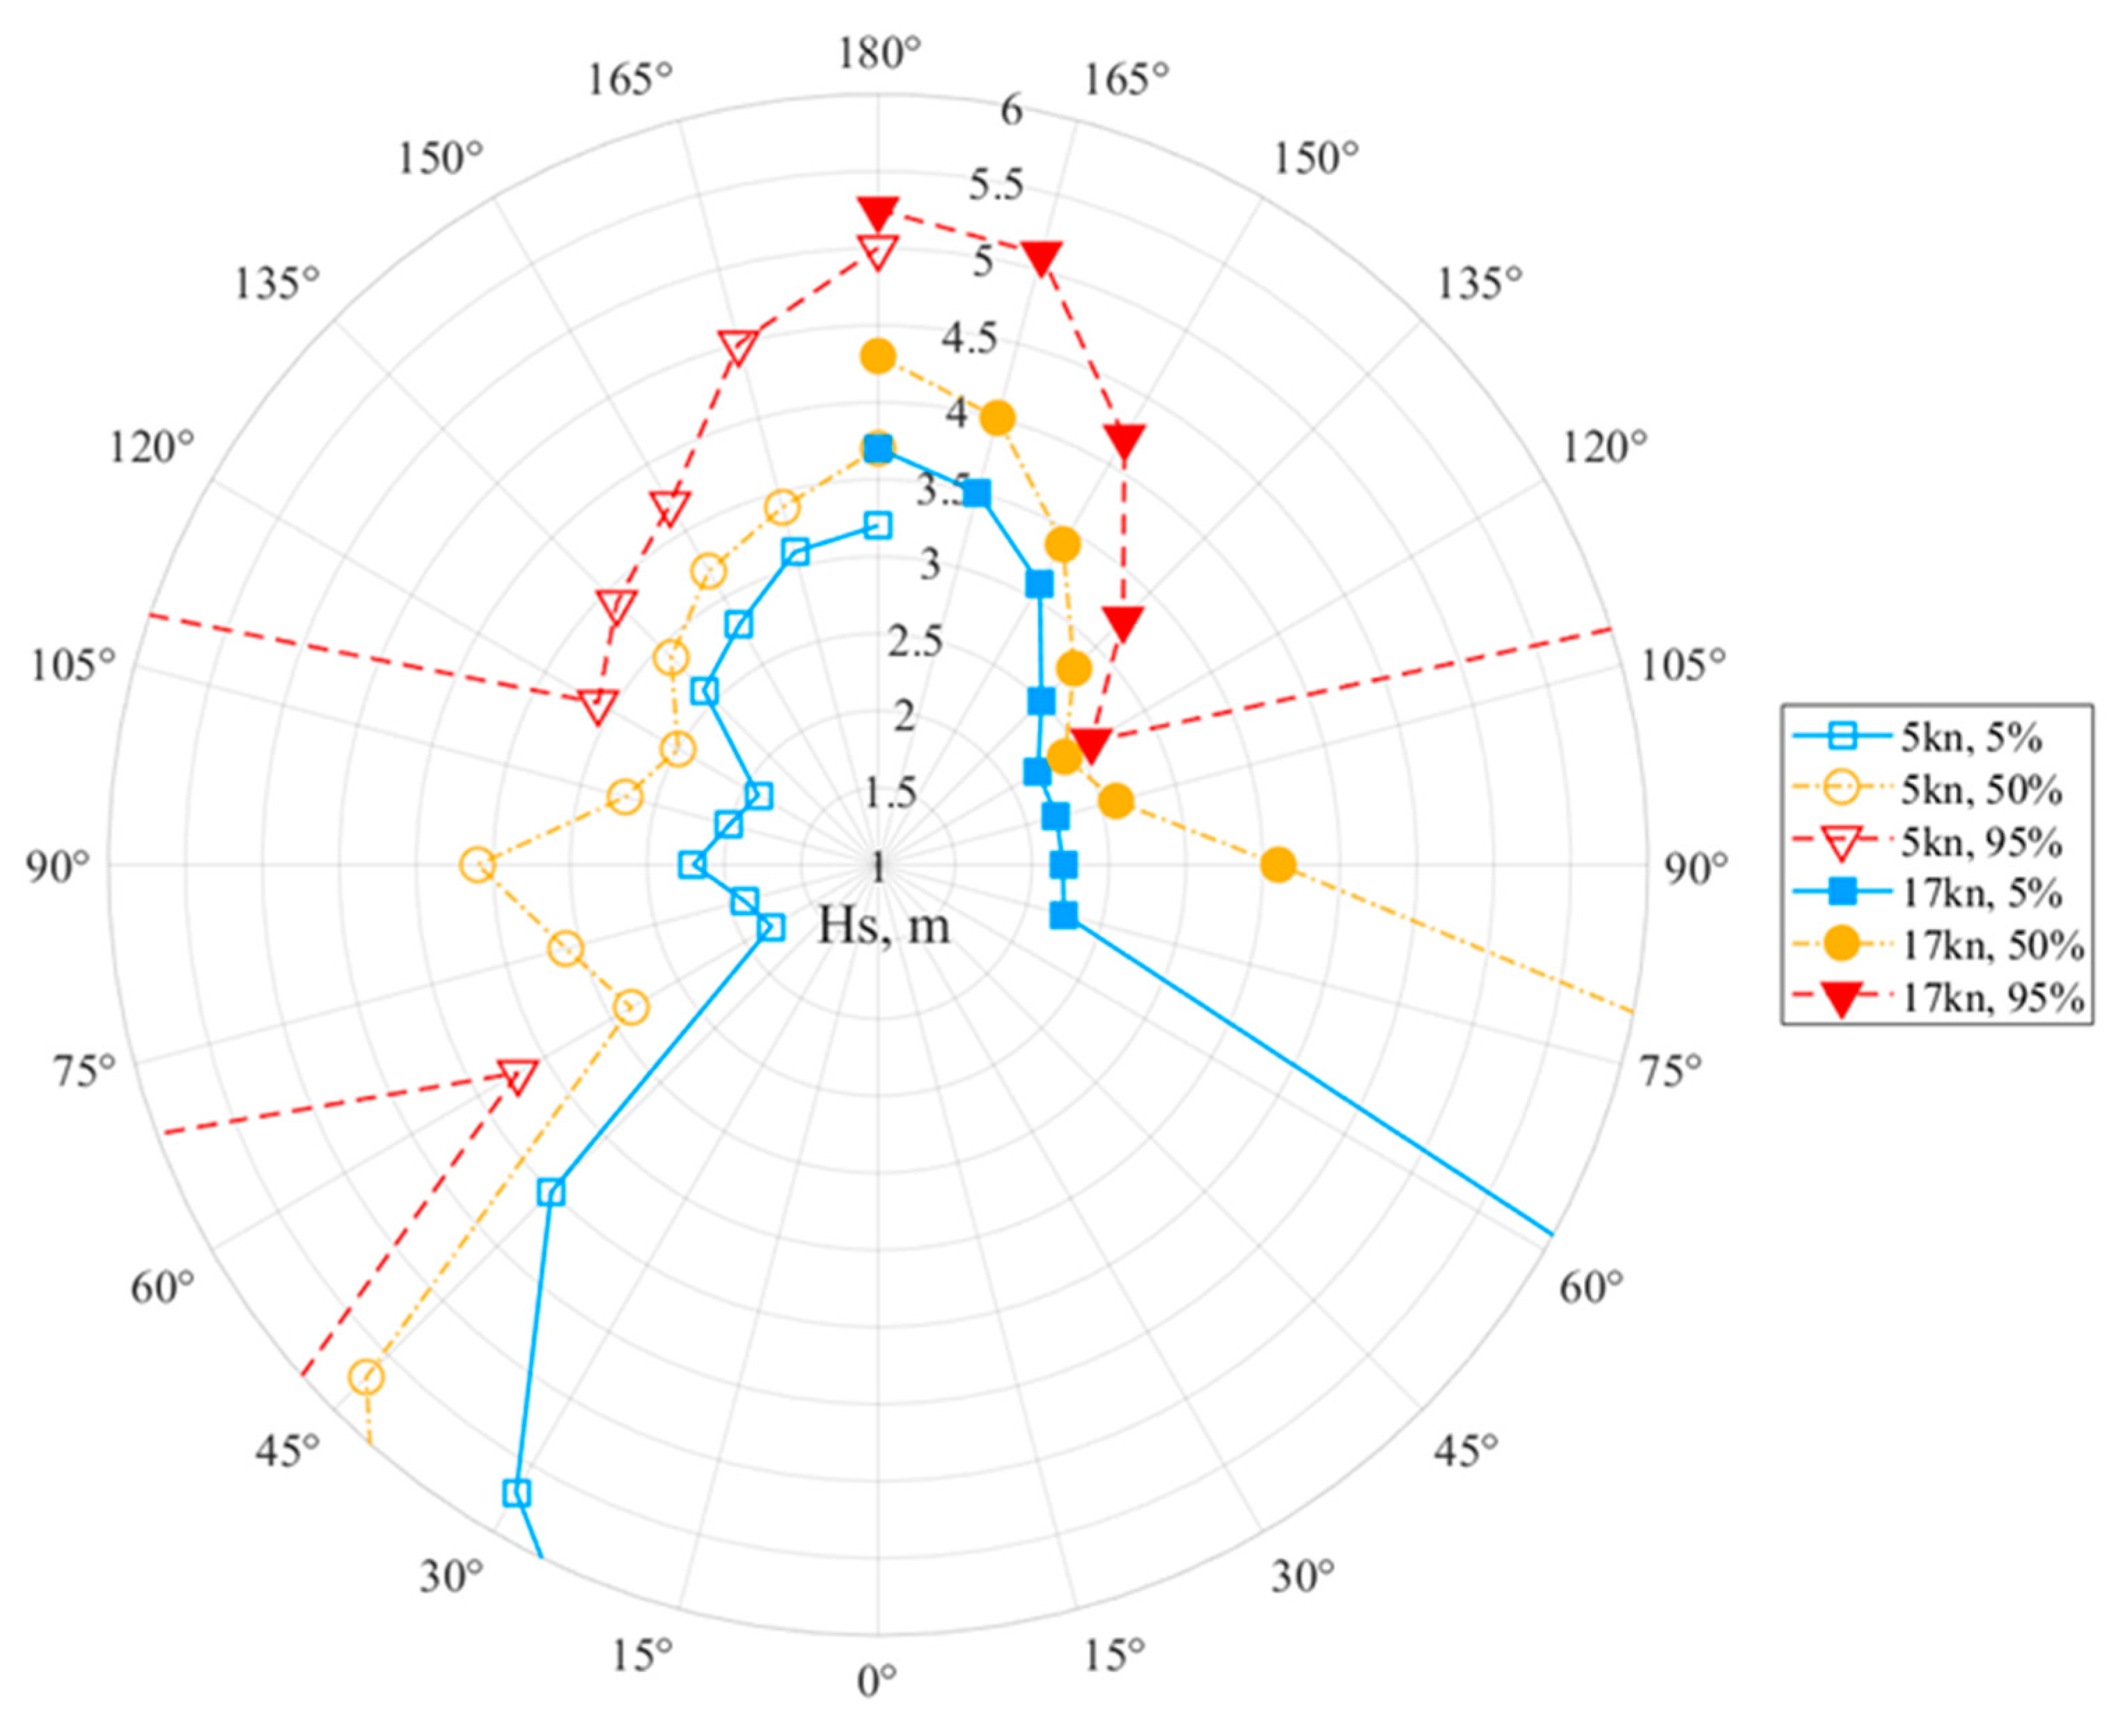
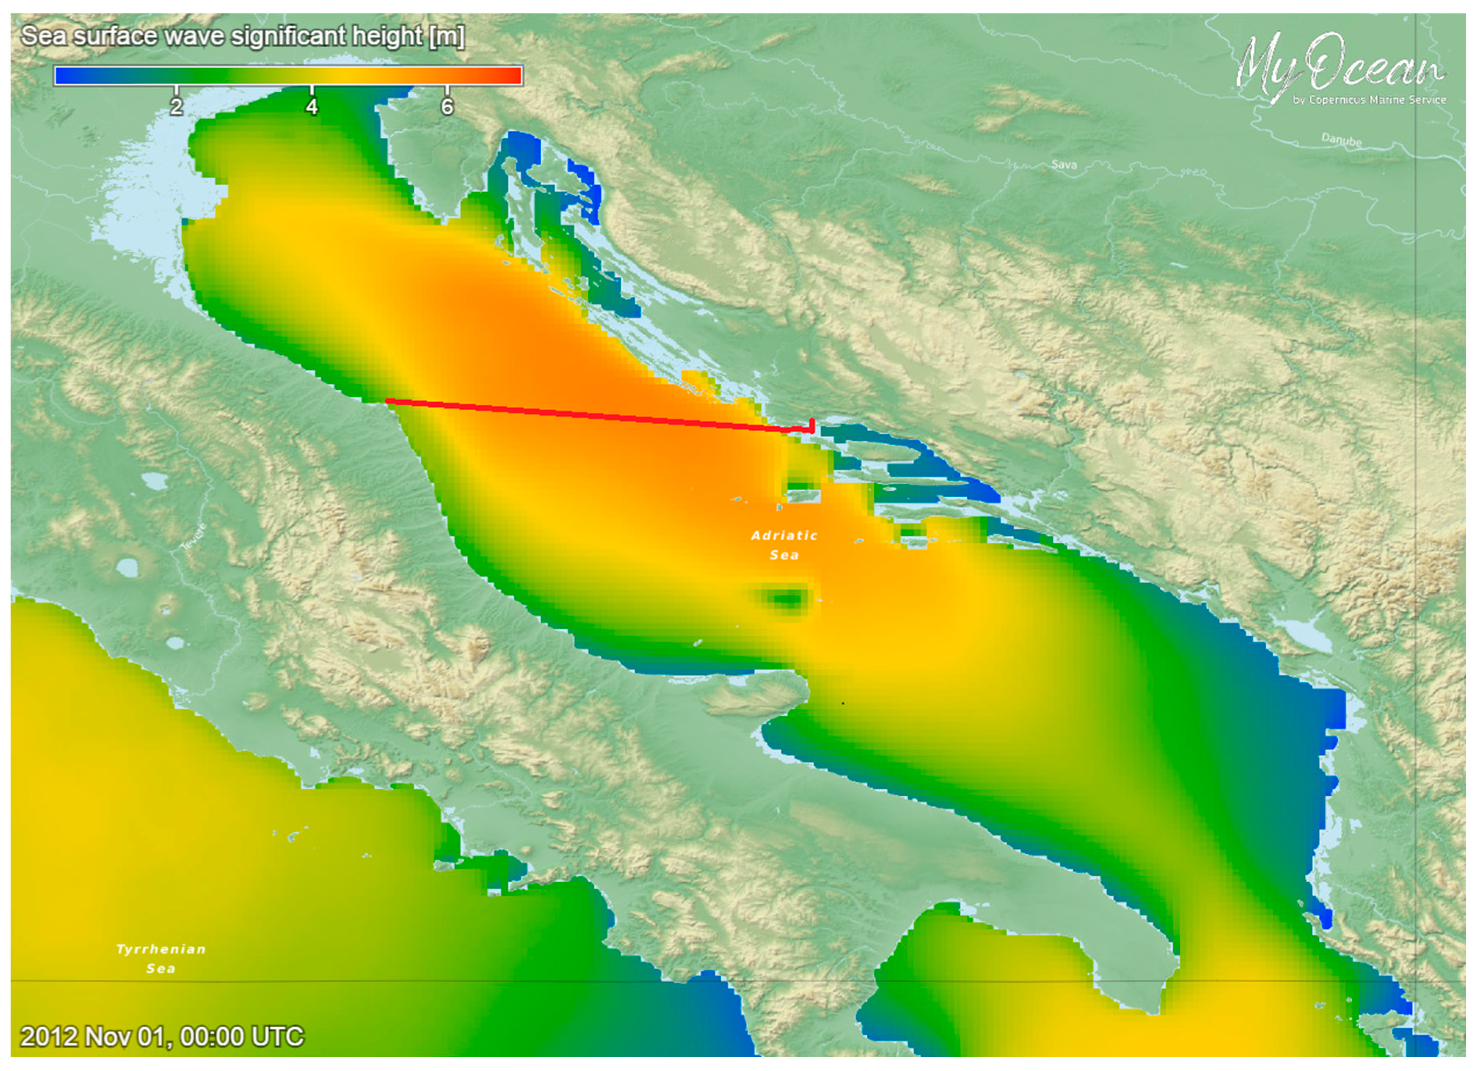
An examination of probabilistic operability is provided for a passenger ship traveling on the actual sailing route across the Adriatic Sea. Fuel consumption and corresponding CO
2 emissions along common ferry routes in the Adriatic have recently been studied in [
21]. To demonstrate the concept of probabilistic operability analysis, a simplified seakeeping approach is used, where transfer functions of heave, pitch, and roll are calculated by closed-form expressions (CFE), formulated in [
22]. The model uncertainty of CFE for heave and pitch is defined by comparison to the model-scale experiments for a relatively large number of ships [
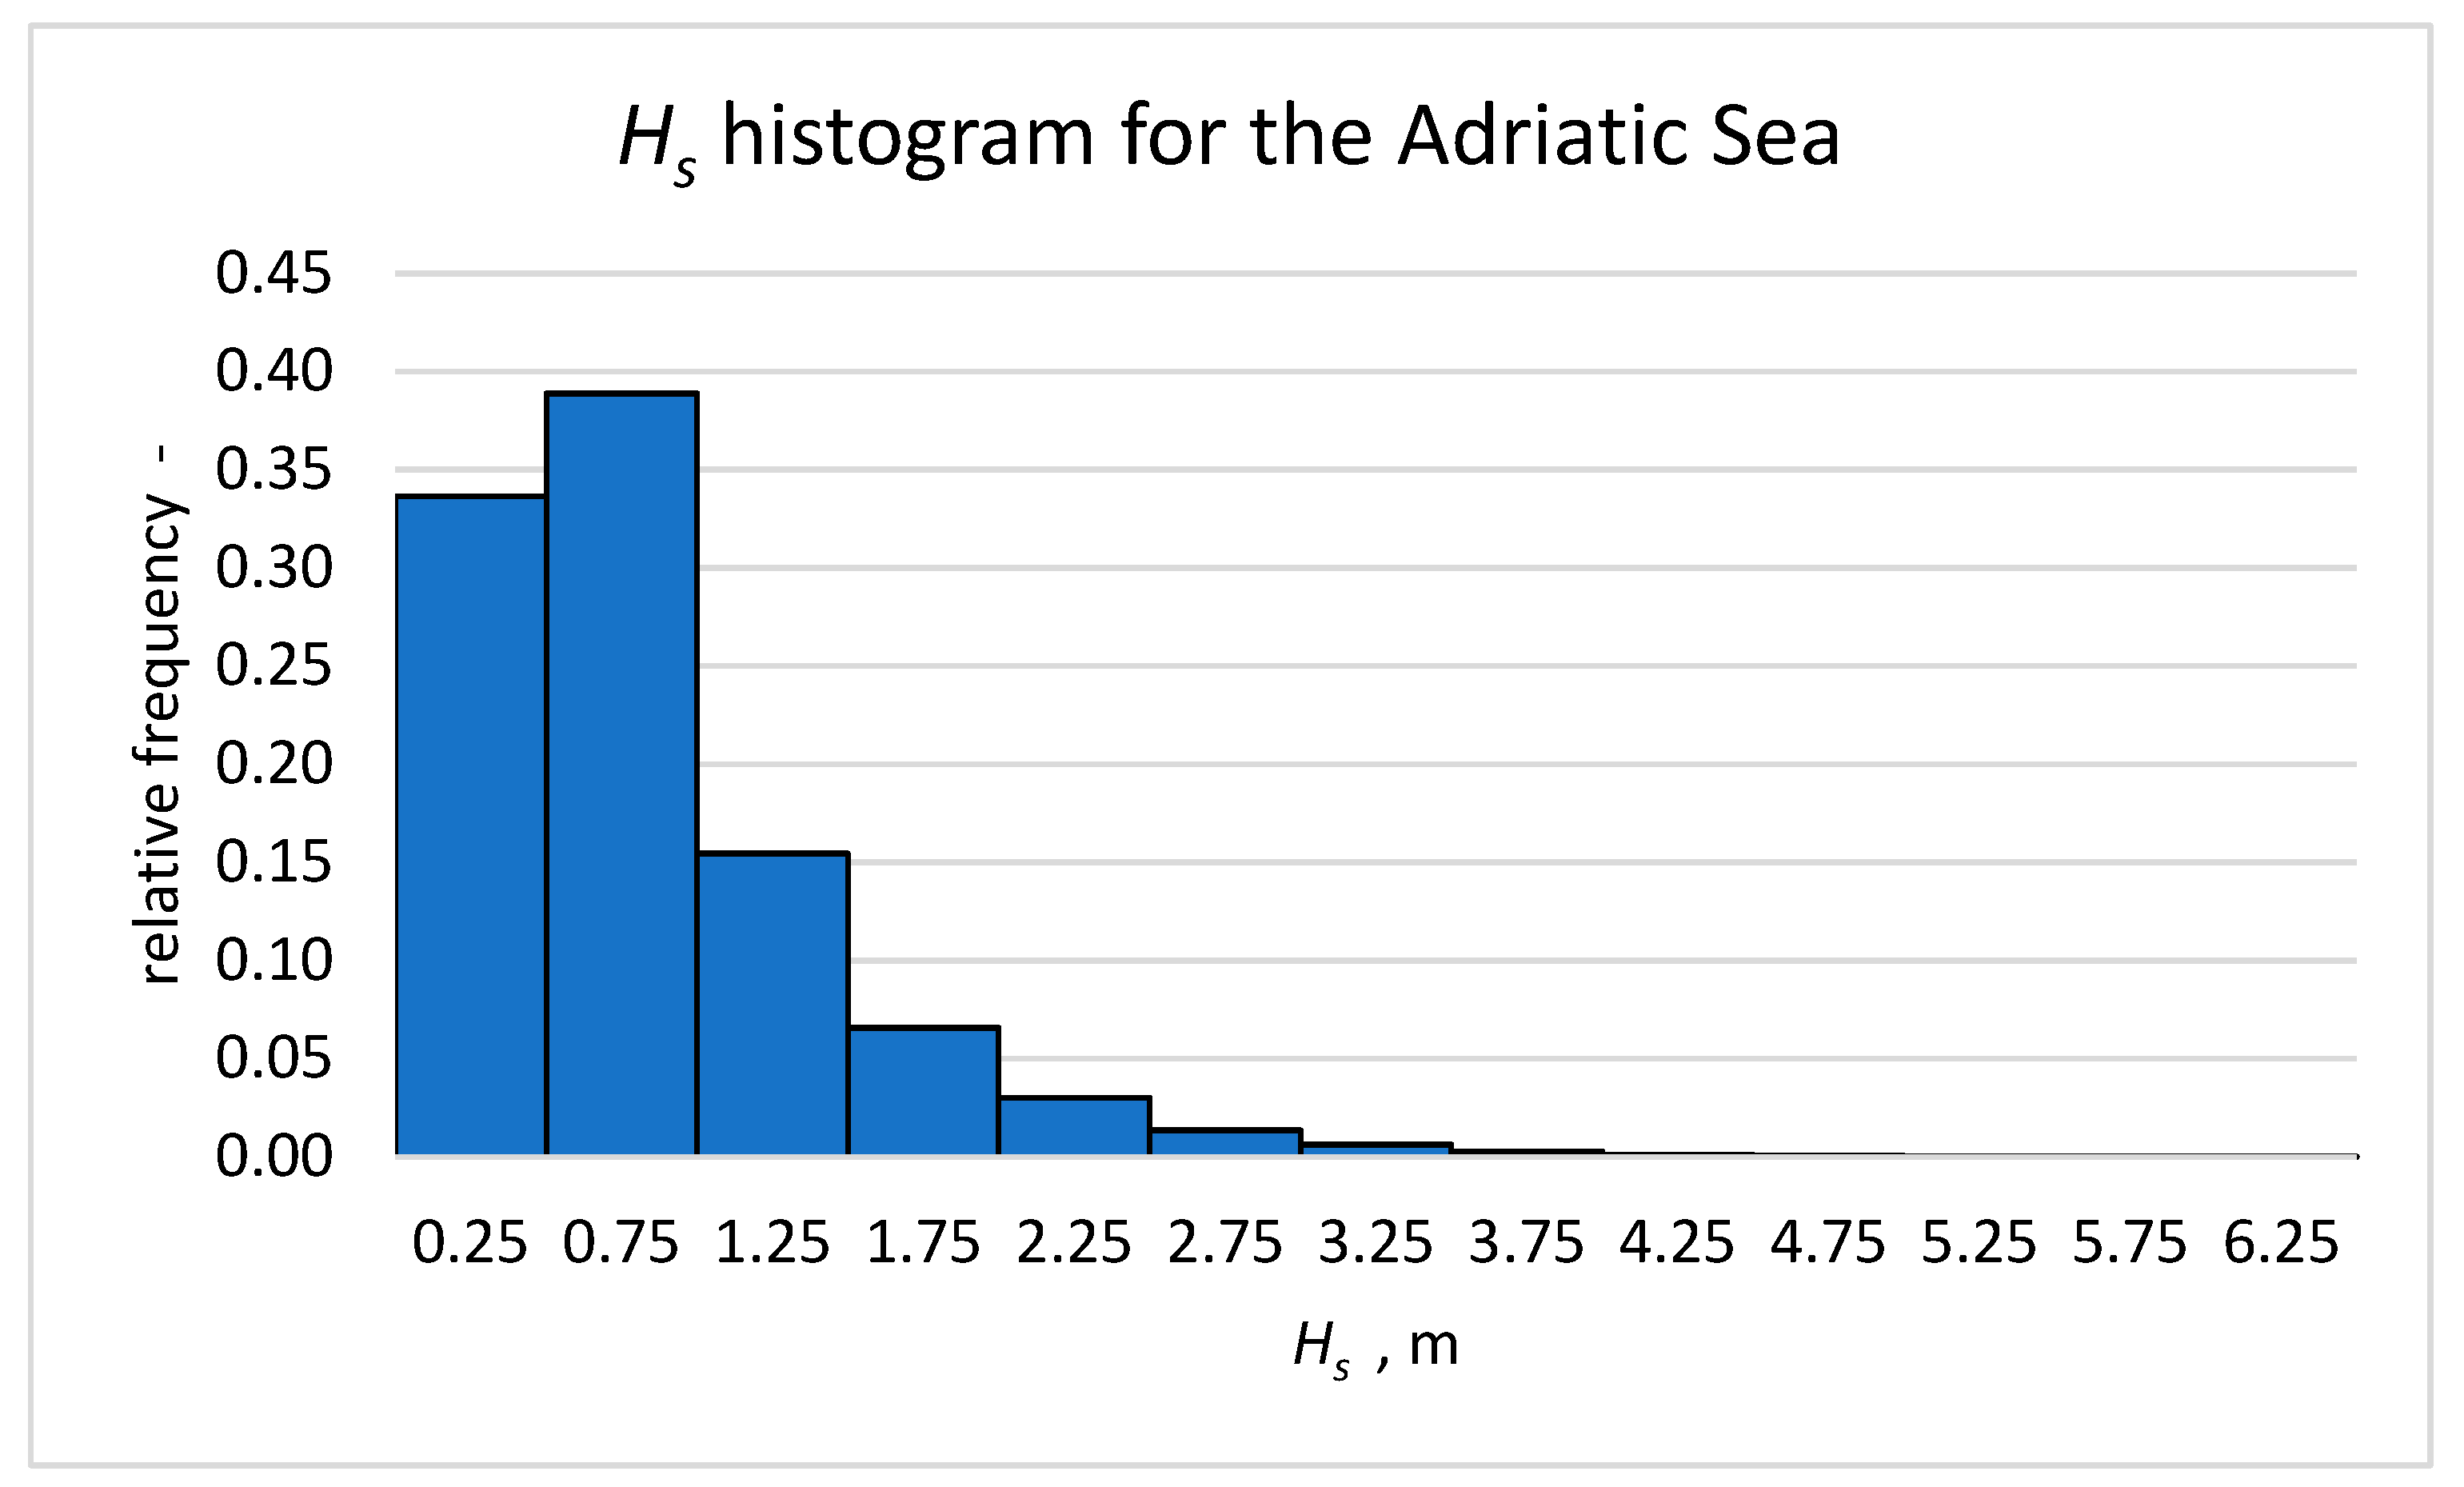
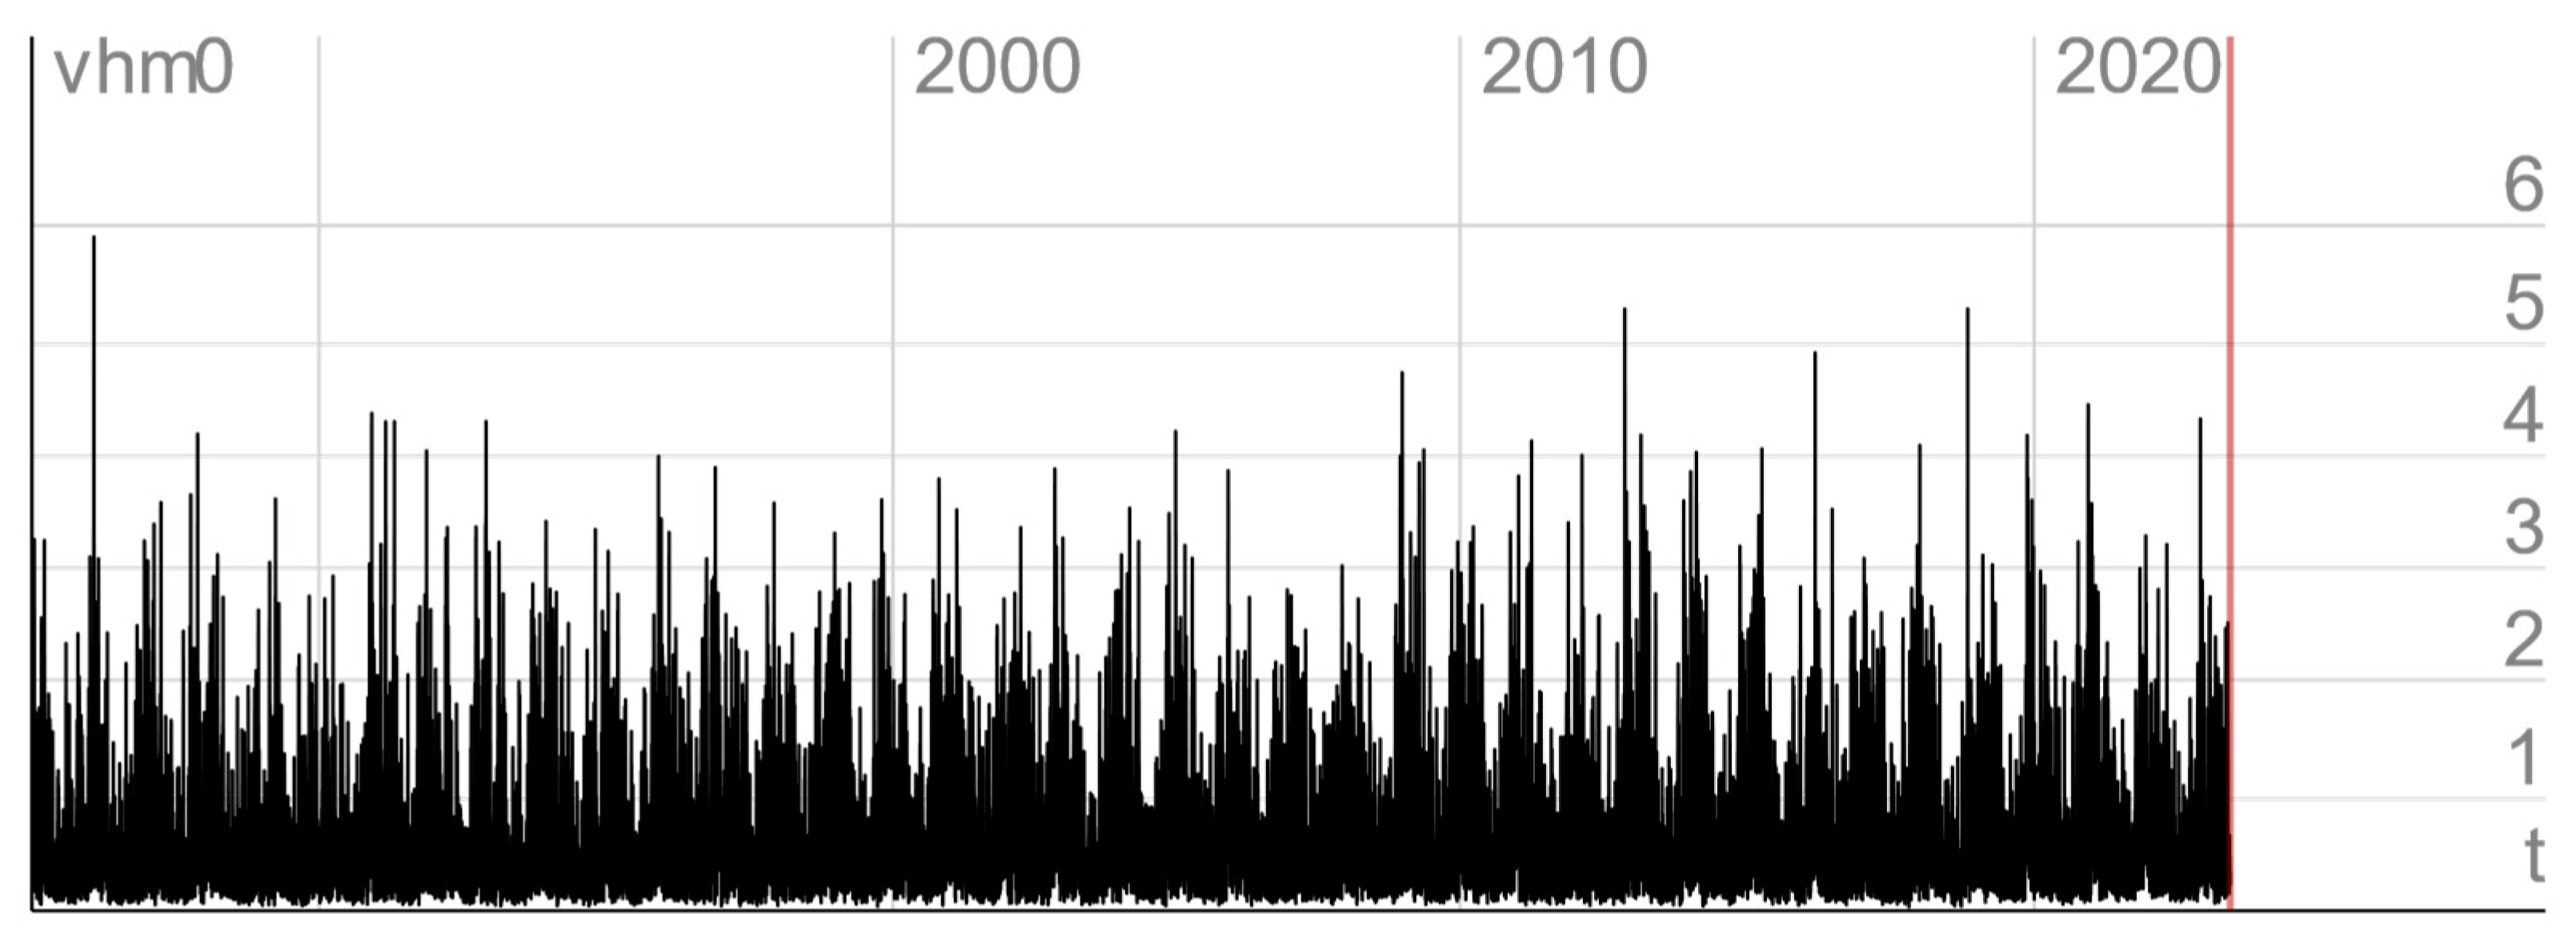
23]. In previous studies, model uncertainties in seakeeping methods were assumed. In contrast, this study consistently employs a seakeeping method while explicitly defining the corresponding modeling uncertainty. For the sake of simplicity, a single-parameter wave spectrum, which is representative for the Adriatic Sea, defined only by a significant wave height, is used for the description of short-term sea conditions. A histogram of sea states along the sailing route is obtained from the wave hindcast database, described in [
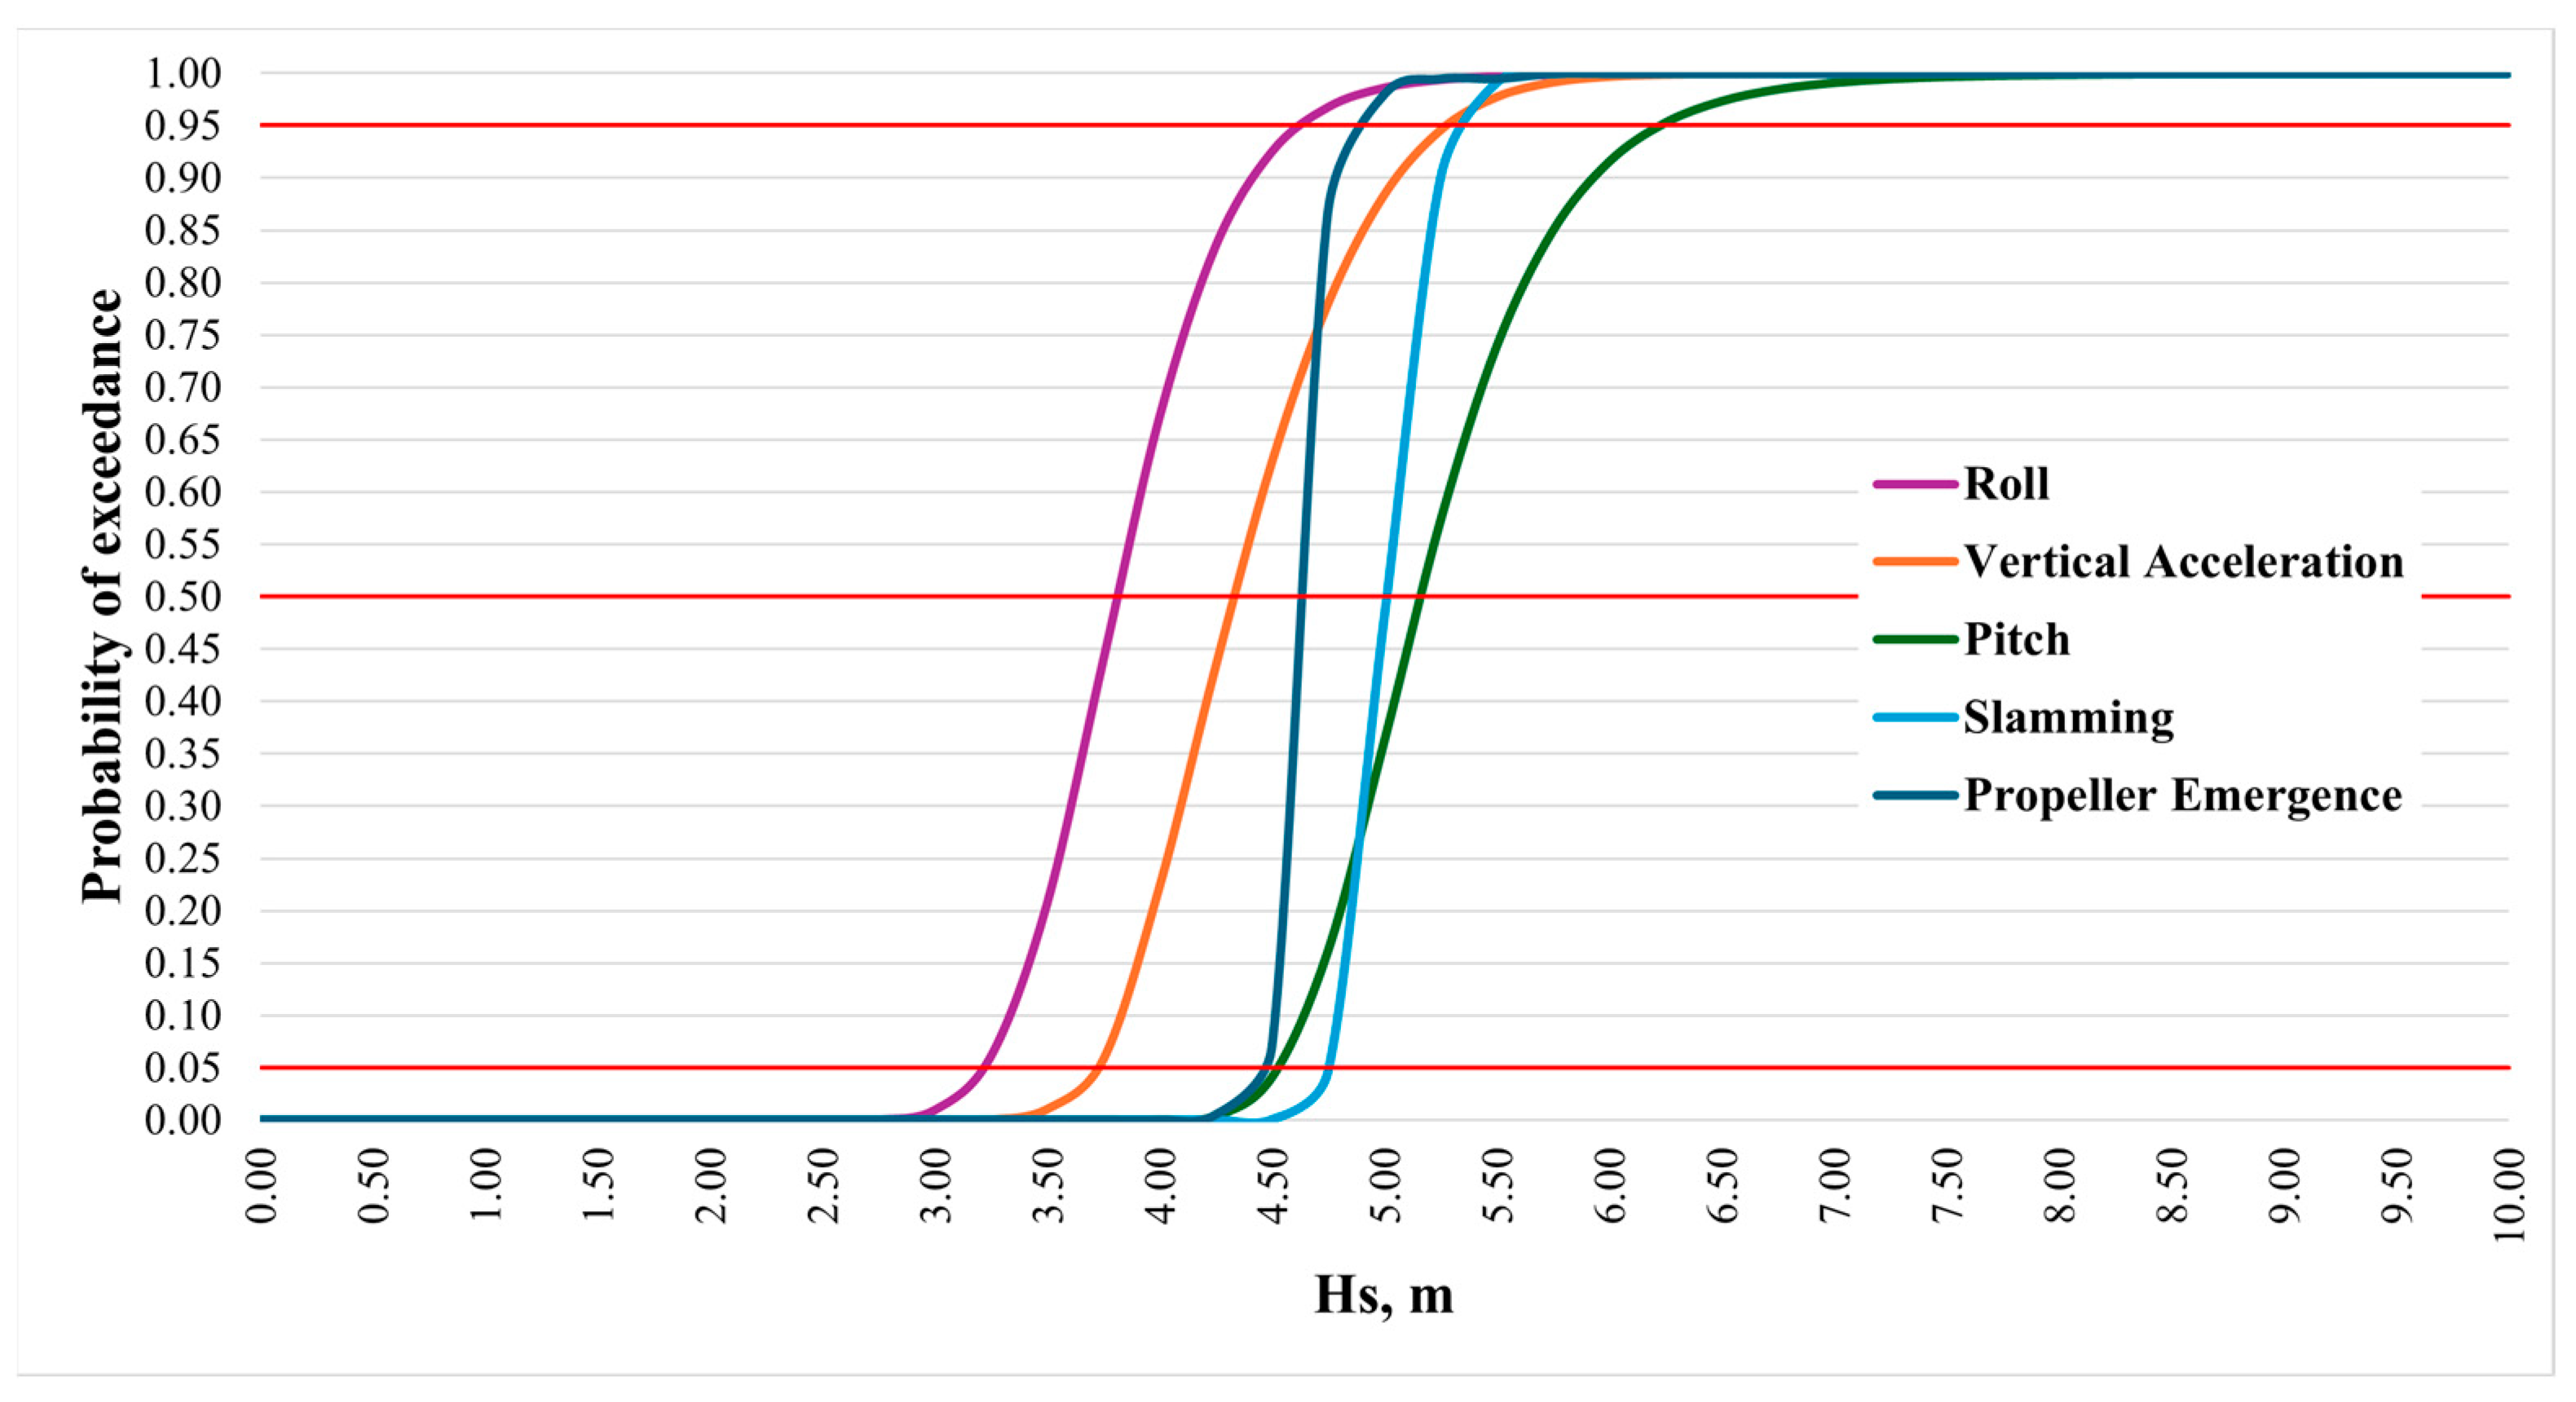
24]. The seakeeping limiting criteria of roll, pitch, vertical acceleration on forward perpendicular, slamming, and propeller emergence are considered as random variables to illustrate the procedure. The second-order reliability method (SORM) is used to calculate probabilities of exceedance of the seakeeping criteria, and the results are presented in probabilistic polar plots.
This paper is organized as follows. The seakeeping method, wave spectrum model, uncertainty model of CFE based on a frequency-independent model error, reliability analysis, and risk-based decision making are described in
Section 2. The results of the operability analysis for the case ship are given in
Section 3. The discussion section includes the application of the POI in ship design, potential usage of probabilistic operability plots in ship operation, correlation of the results with past experience on the sailing route concerned, and limitations of the developed model. Conclusions and recommendations for future development are given in the last section of this paper.
2. Methods
2.1. Seakeeping Analysis
Linear seakeeping analysis is used in the present study. The analysis consists of the computation of transfer functions in the frequency domain and the definition of the wave energy spectrum. Then, the response spectrum is calculated by multiplying the square of transfer functions by the wave spectrum. Spectral moments are then obtained by integrating the response spectrum.
2.1.1. Transfer Functions
Transfer functions for heave and pitch are calculated using semi-analytical closed-form expressions (CFE) [
22]. These simple formulas are determined for the motion of a prismatic barge in the vertical plane using standard linear strip theory assumptions, assuming a constant sectional added mass equal to the displaced water volume and ignoring the coupling components between pitch and heave. The main ship attributes—length
L, breadth
B, draft
T, block coefficient
Cb, and speed
V—are the only necessary input data for the procedure.
In this section, the procedure is briefly outlined, while details may be found in the original reference [
22].
The frequency response functions for heave (
and pitch (
are given as:
where
F and
G are heave and pitch forcing function, and:
where
k is the wave number,
T is draft,
A is approximation of the sectional hydrodynamic damping,
B is breadth of ship, and
is parameter:
where
Fn is Froude number,
L is the ship length, and
is heading of the ship.
The transfer functions of vertical motion
and vertical acceleration
at the forward perpendicular are given as:
where
xFP is the longitudinal distance of the forward perpendicular from the center of gravity, and
is the encounter frequency.
The transfer function for roll motion is obtained by solving the equation of the motion for roll in regular waves, and it can be written as:
where
is the amplitude of the excitation moment;
TN is the natural roll period;
C44 is the restoring moment coefficient; and
B44 is the hydrodynamic roll damping for the ship which is considered 20% in this study.
The CFEs are semi-analytical formulae, so they can be easily calculated using a usual spreadsheet application. CFEs have been used for seakeeping predictions in conceptual design, enabling an efficient sensitivity analysis regarding operational profiles and different wave environments [
25]. CFEs have also been used in hydro-elastic studies [
26], for the computation of extreme wave loads using the hindcast wave database, and for tuning the transfer function for the prediction of ship responses [
27].
In the present paper, CFEs are considered for the development of the risk-based ship DSS for heavy weather maneuvering. The numerical efficiency of DSS could be crucial if DSS is used for decision making onboard the ship on heavy seas [
19]. CFEs have already been considered for DSS application in [
28].
2.1.2. Wave Spectrum
Short-term stationary irregular sea states are for engineering purposes traditionally described by wave energy spectrum. The formulation of the wave energy spectrum depends on the geographical area under consideration with local bathymetry and the severity of the sea state. The Pierson–Moskowitz spectrum and JONSWAP spectrum are frequently applied for wind seas. The former was originally proposed for a fully developed sea in the open ocean, while the latter is appropriate for fetch limited seas, describing developing sea states.
The shipping route in the Adriatic Sea is considered in the present study. For such an enclosed sea, modification of the JONSWAP type of wave spectrum is used. Tabain’s single-parameter wave spectrum, developed specifically for the Adriatic, has been used for naval architecture and marine engineering applications [
29]. Recently, Tabain’s spectrum was optimized using a wave database obtained by combining satellite measurements and numerical re-analysis [
30]. Thus, the following one-parameter spectral formulation relevant to the Adriatic Sea is used:
where
ωm = 2π/
Tp is the peak of the wave energy spectrum.
Obviously, that one-parameter formulation cannot cover all combinations of significant wave heights and zero-crossing periods occurring in the Adriatic [
24].
2.1.3. Ship Response in Short-Term Irregular Waves
The ship’s response spectrum’s general equation is expressed as:
where
is the encounter frequency and
is the encounter wave spectrum.
The variance of the ship response represents the area under the response spectrum:
The root mean square (RMS) represents the standard deviation, and it is obtained as the square root of the response variance.
2.1.4. Model Uncertainty of Transfer Functions
The Frequency Independent Model Error (FIME) is developed and utilized to formulate the model uncertainty of transfer functions [
31]. The fundamental concept of FIME involves multiplying transfer functions by a constant fit factor
φ, which is expressed as follows:
where
and
are measured and calculated transfer functions at the frequency
respectively. This allows the transfer function to be adjusted to match, on average, with the experimental results at all frequencies.
According to its geometrical meaning,
φ is the slope of the regression line that must pass through the origin when comparing experimental and calculated transfer functions. The theory overestimates the experimental results when
φ is less than 1, whereas it underestimates readings when
φ is more than 1 [
17].
By comparing transfer functions computed by CFEs with model-scale experiments for 13 ships of various types, speeds, and relative heading angles, the parameter
φ was found for heave and pitch in [
23]. Using linear multivariate regression analysis, the dependence of
φ on the main parameters was expressed as:
where
,
, and
are Froude number, block coefficient, and heading angle, respectively.
Table 1 provides the regression coefficients and intercept [
23].
Values in
Table 1 represent a mean value for each speed and heading angle and a standard deviation of 0.19 and 0.27 is determined for pitch and heave, respectively, in [
23]. Due to the lack of relevant comparisons with experiments, mean value and standard deviation for the model uncertainty of the roll angle are assumed in the present study as 2.5 and 0.2, respectively. The normal distribution is used to represent the model uncertainty of the seakeeping calculations.
2.2. Seakeeping Criteria
Most seakeeping criteria are concerned with operability, i.e., crew ability and willingness to operate a vessel and all its installed equipment in a specified seaway. Operability criteria are typically expressed in terms of roll and pitch angles, roll motion, vertical and lateral acceleration, deck wetness, propeller emergence, and slamming. In addition, there is a group of criteria expressing the interaction between ship motion and human reactions, such as motion sickness incidence and motion-induced interruptions. Limiting values of these criteria are not standardized and do not cover all vessel types, but there are well-established criteria sets referring to the overall vessel system’s operability or habitability of the vessel. There are different reasons for discrepancies in criteria between different sources, even if they refer to the similar ship types, such as complexities and inaccuracies of motion prediction methods and discrepancies in the definition of seakeeping amongst naval architects and how vessel owners viewed seakeeping. A critical review of currently used standards and criteria is provided in [
32].
An example of discrepancies of limiting values among different operability standards is given for the case of vertical acceleration at forward perpendicular in [
8]. The limiting values read from 0.2 g RMS according to NATO and US Coast Guard Standards, to 0.275 g RMS according to NORDFORSK for Merchant ships less than 100 m in length. There are also other options to express the limiting value of vertical acceleration at the forward perpendicular, such as the probability of exceeding individual acceleration amplitudes and Subjective Magnitude (SM) values [
33]. Limiting values for some criteria are less scattered, e.g., limiting value for RMS of the pitch angle of 1.5° is often found [
8].
The brief review in the preceding paragraph indicates that limiting values are uncertain and that captains could have a different attitude against limiting values for operability criteria. In other words, it is reasonable to consider limiting operability values as random variables. The definition of parameters of probability distributions of such random variables is a challenging task. Performing a questionnaire among experienced seafarers, such as the one presented in [
34], could be the right way to define these parameters. The main problem found was the lack of onboard measurements, thus preventing clear quantification of the seakeeping limiting criteria. A large spread among answers to some of the questions, e.g., estimation of pitch angle, was found. That finding about the uncertainty of operability limiting values supports the necessity of their probabilistic description, as proposed in the present study.
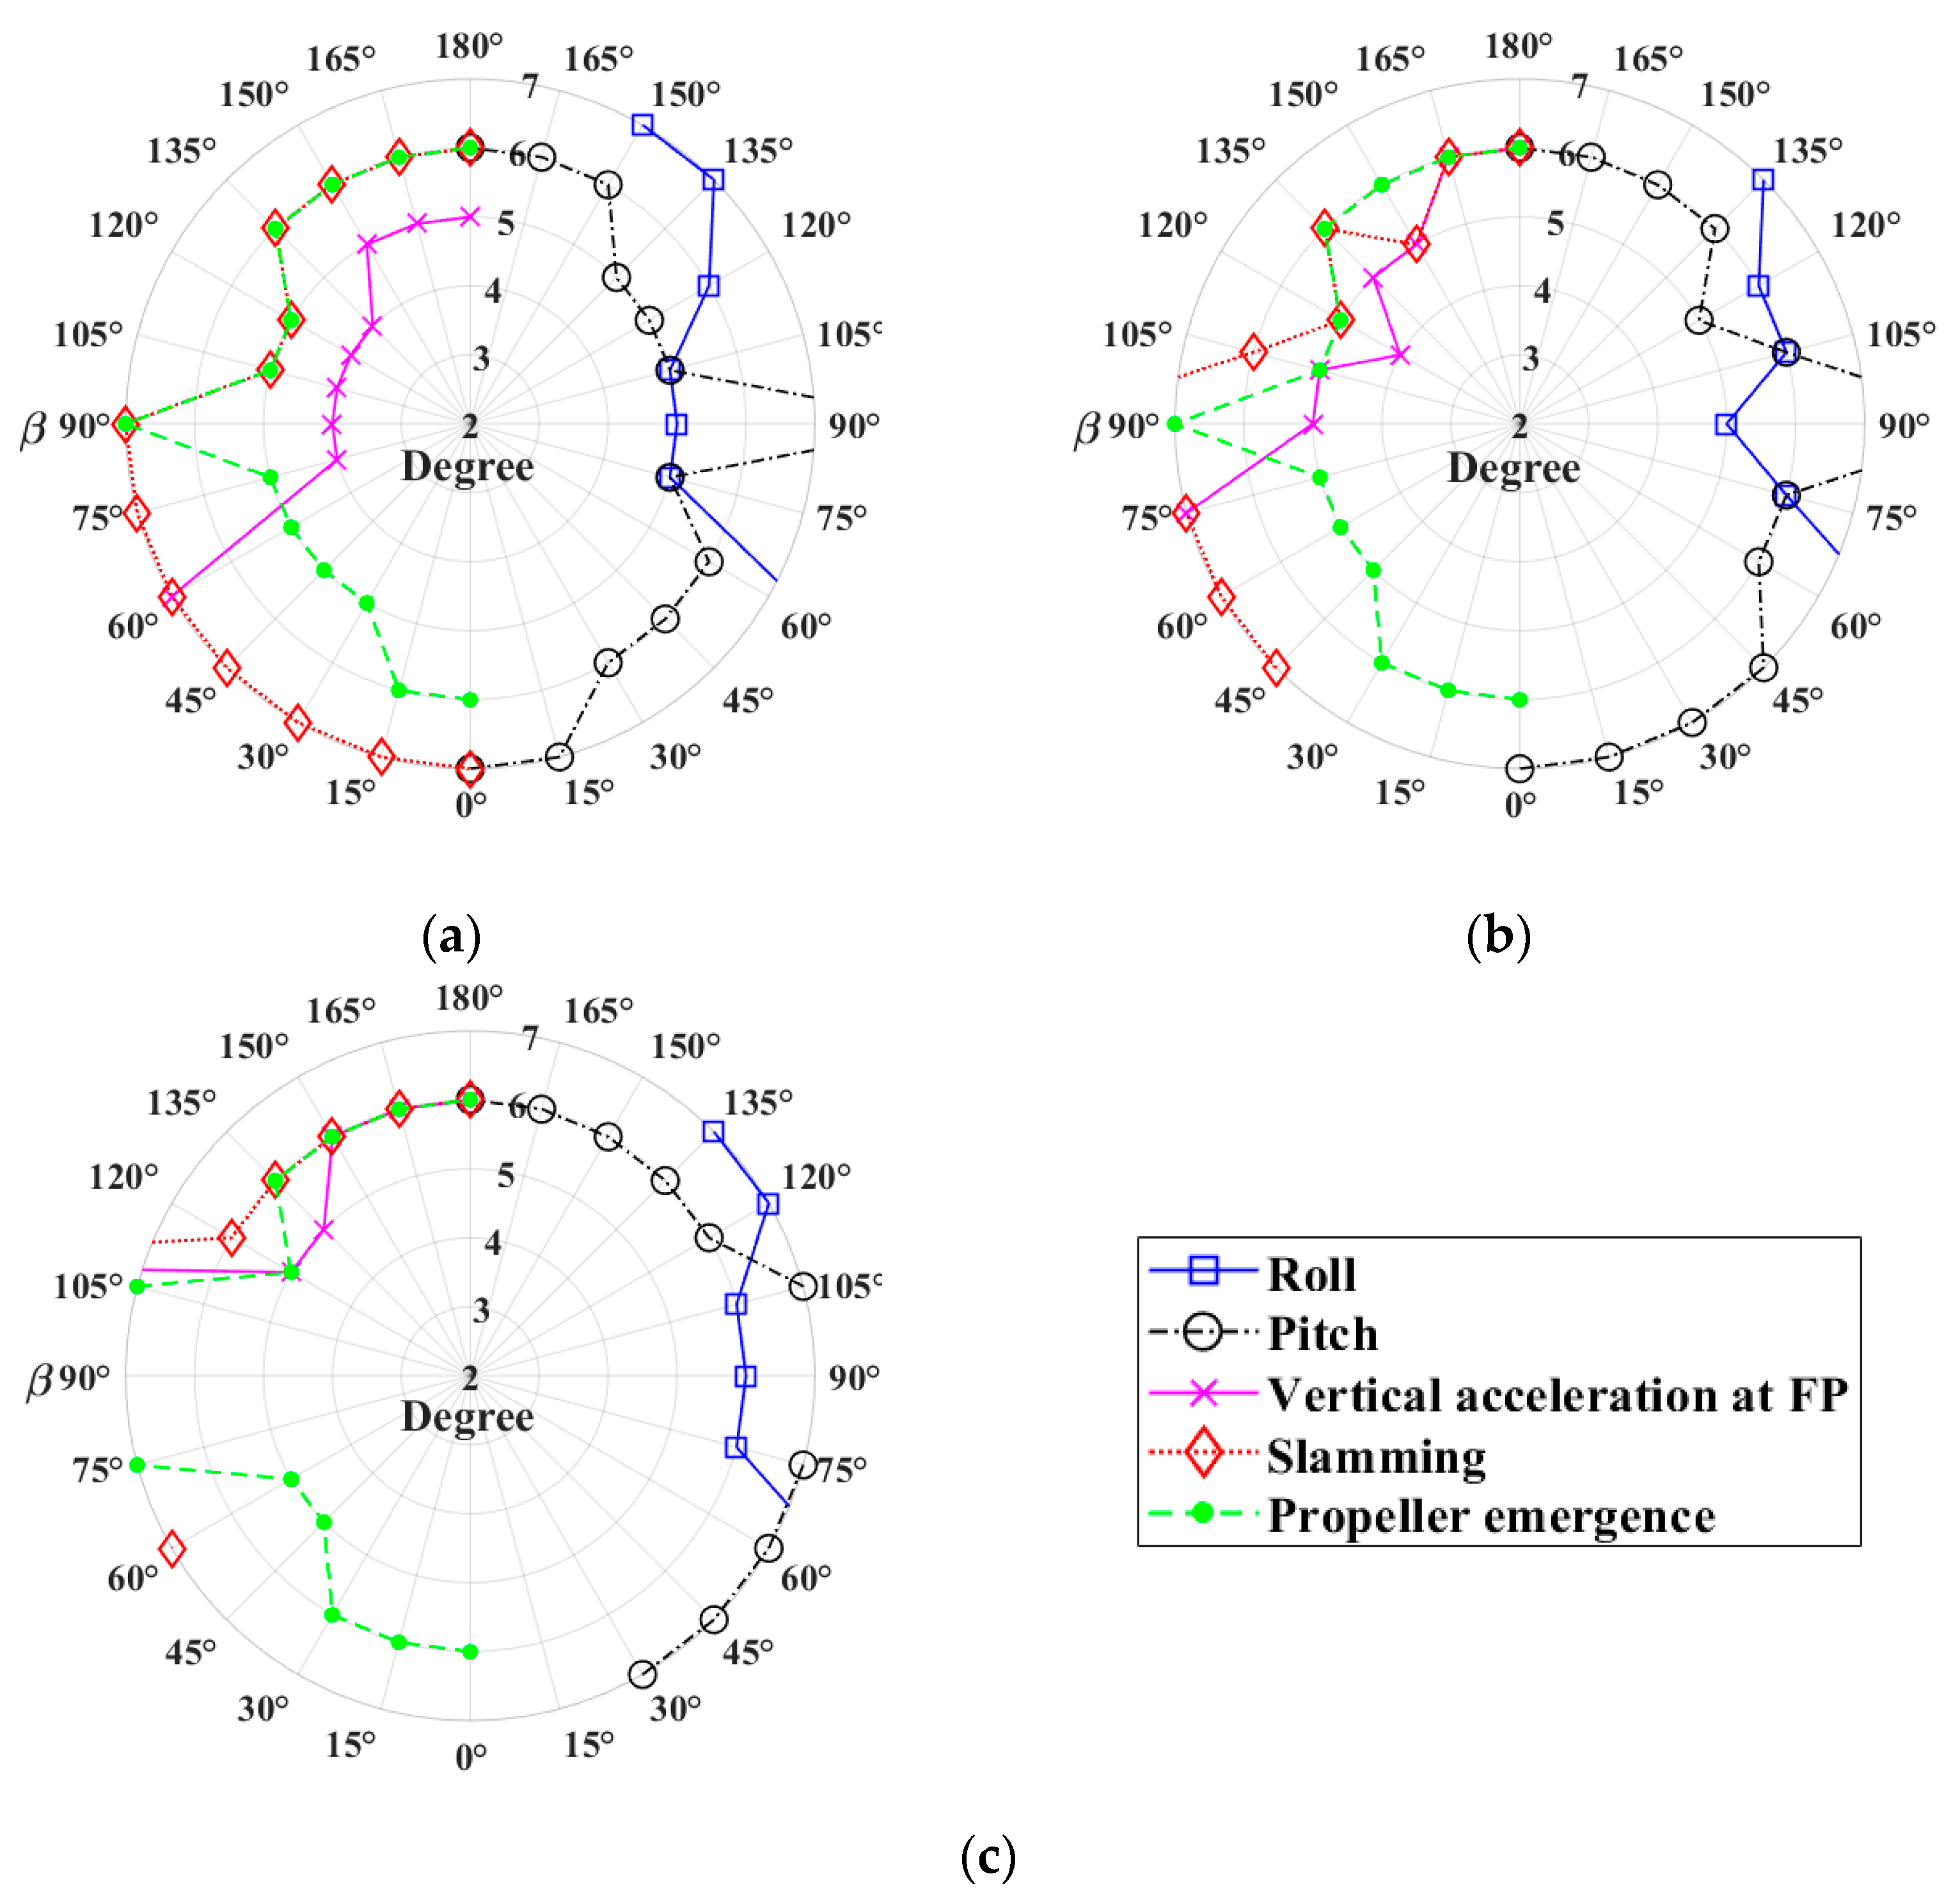
For illustration of the procedure, the mean values of the operability limiting value are taken from those given in
Table 2, while their coefficient of variation (CoV) is assumed as 0.05 in all cases. Gaussian distribution is used to model this uncertainty.
2.3. Reliability Problem Formulation
As explained in the preceding section, the accuracy of the seakeeping calculations is uncertain, as well as limiting values of seakeeping criteria. Therefore, the seakeeping criteria are exceeded with a certain probability, which is calculated based on the limit state functions. In general, the limit state function
g(
X) is given as:
where
is a vector of random variables and
g takes negative value when the limiting criterion is exceeded. In the present study, the random variables are epistemic uncertainties of the seakeeping results and criteria.
To describe the procedure, let us consider the simplest limit state function, which is for pitch angle. The limit state function, in this case, reads:
in Equation (16) is a normally distributed random variable representing pitch criterion, with a mean value equal to 1.5°, according to
Table 2, and CoV of 0.05.
is also normally distributed with the mean value calculated by Equation (14), depending on the heading angle and ship speed, and a standard deviation of 0.19.
is a transfer function of pitch, given by Equation (2), while the wave energy spectrum
is defined by Equations (8)–(10). The limit state function for the roll is defined in similar way, only that the random variable representing criterion uncertainty
with a mean value of
is used. The transfer function of roll motion is
, defined by Equation (7).
The limit state function for vertical acceleration at FP is a bit more complicated, as the transfer function for vertical acceleration at FP (Equation (6)) depends on heave and pitch transfer functions (Equation (5)). Each of these transfer functions is multiplied by the corresponding epistemic uncertainty, calculated by Equation (14), using parameters from
Table 1. The limit state function is then readily defined using an expression like Equation (16).
The limit state function for propeller emergence requires the calculation of the probability of the propeller emergence:
where
Dp is the propeller blade tips’ depth, while
is the variance of the relative motion at the location of the propeller. The transfer function of the relative motion is given by an expression analogous to Equation (5). Transfer functions of heave and pitch are multiplied by corresponding modeling uncertainties. The limit state function for propeller emergence is then given as:
where
is normal distribution with a mean value of 0.25, according to
Table 2, and with assumed CoV of 0.05.
The slamming probability,
ps, employed in the slamming limit state function, is given as:
where
Te is the effective draft;
m0_r is the variance of the relative vertical motion at ship FP;
vkr is the critical vertical velocity; and
m0_v is the variance of the relative velocity at FP. Critical velocity is calculated from Ochi’s equation:
where LP is a ship length between perpendiculars.
The limit state function for bow slamming is then given as:
where
is a normal distribution with a mean value of 0.03, according to
Table 2, and with assumed CoV of 0.05. Model uncertainties in heave and pitch are used in the definition of the variances of the ship relative motion and velocity.
2.4. Reliability Analysis
The software program Comrel is used for reliability analysis, and the basic steps to perform the analysis are [
35]:
Formulating the limit state functions in standard mathematical notation;
Preparation of the stochastic model for the variables;
Selecting computation options;
Performing the reliability analysis with embedded Symbolic Processor;
Analysis of the results and graphical post-processing.
Second-Order Reliability Method (SORM) is chosen as the computational option for reliability analysis. First-Order Reliability Method (FORM), which is often used in ship structural reliability analysis, is not performing well in all cases, as some of the limit state functions are complex, including integration, and are formulated in several lines.
The Multiple Runs option was used for calculation over different periods, and in one pass, the calculation was made for all significant wave heights HS, and each pass calculated for different angles β.
Except for Comrel, other commercial and in-house software tools have been used for risk-based DSS concepts. Specifically, the commercial probability analysis program PROBAN was used in [
18], while the in-house structural system reliability analysis program RELSYS was used in [
36].
2.5. Risk-Based Perspective
A review and analysis of general risk definitions, perspectives, and scientific approaches to risk analysis in the maritime transportation application area are provided in [
37]. The results indicate that risk is strongly associated with probability, though alternative views exist. Additionally, various scientific approaches to risk analysis have been identified. More recently, a multi-attribute-based assessment model has been proposed in [
38] to support decision making on risk control options. A discussion on risk assessment and key risk factors affecting ferry navigation safety is presented in [
39].
The prevailing approach to risk analysis in maritime defines the risk (
R) as the product of the probability of an event (
P) and its associated consequence (
C), e.g., [
7]. The total risk for a combination of
N uncorrelated serial events is given as:
while the expression for the case of correlated events may be found in [
7]. In addition, each individual risk
Ri may be multiplied by the company-specific aversion factor
Ai.
While the probabilities of an adverse event are obtained through reliability analysis, the associated consequences are determined via consequence analysis, categorized as follows:
Safety of people (loss of life, injuries, and health);
Risk to the maritime environment;
Economic risk (damage to ship structure, equipment and cargo, including total loss, and loss of reputation).
Quantifying the first two categories in monetary terms is controversial and typically beyond the scope of risk-based DSS. Events related to these risk categories generally have a low probability of occurrence (less than 10
−3). Such extremely hazardous situations are classified as “intolerable” risks that must be mitigated regardless of cost. These risks may be considered at the ship design stage and addressed through proper masters’ training or qualitative guidance [
18].
Additionally, due to the well-known “tail sensitivity” issue in structural reliability analysis, the probabilities of such rare events are highly dependent on the uncertainty model used and cannot be applied universally [
7]. In risk terminology, DSS is used in the “As Low as Reasonably Practicable” (ALARP) region, which lies between “intolerable” and “negligible” (broadly acceptable) risk levels [
40].
The economic losses necessary for risk estimation can be expressed as:
where
represents damage to cargo;
accounts for damage to equipment;
represents damage to ship;
is costs related to delays;
represents costs associated with loss of reputation.
The latter component,
, includes factors such as passenger seasickness, reduced crew performance, and the consequences of delays, all of which directly impact the economic viability and reputation of maritime services [
18]. Estimates of economic losses should ideally be provided by the owner or operator, preferably supported by data from insurance companies [
7].
An example of a consequence analysis for an oil tanker, including specific costs associated with potential hull failure or the exceedance of specific limit states, is presented in [
36]. In that study, total consequences are divided into:
Direct consequences, i.e., losses due to damage or failure itself;
Indirect consequences, i.e., losses related to system failures or malfunctions that result in external monetary impacts.
The primary risk control parameters for a ship sailing in waves are forward speed and heading relative to waves. For each combination of these parameters, the probability of exceeding seakeeping criteria is determined through reliability analysis, while the total risk is calculated using Equation (22).
Some alternative combinations of ship speed and heading angles will likely result in lower total risk compared to the current settings, suggesting that risk reduction can be achieved. However, at the same time, altering speed and/or course will certainly increase anticipated voyage costs, such as higher fuel consumption due to a longer route.
The risk criterion is expressed as the ratio of the potential cost
and the related certain cost
, i.e.,
where
and represent the risk of the current and alternative combination of speed and heading, respectively;
is the increased costs because of choosing alternative sailing parameters;
M is the risk control ratio, typically greater than 1, which serves as the decision criterion for the ship master when making maneuvering choices in heavy weather.
More elaborated discussion on the risk control options using Equation (24) is provided in [
18].
5. Conclusions
This study contributes by formulating and solving limit state functions for various ship operability criteria, incorporating epistemic uncertainties in seakeeping responses and uncertainties in operability limiting values. The reliability analysis was conducted using Comrel software, employing the second-order reliability method.
The results of this study are presented in probabilistic operability diagrams, i.e., polar plots providing significant wave heights and heading angles for which seakeeping criteria will be exceeded with certain probabilities. Probabilistic operability diagrams are more informative than “deterministic” diagrams, and this approach could be further extended for use in risk-based decision making, providing that consequences of exceeding seakeeping criteria are defined.
The probabilistic approach can be used in ship design as the decision-making tool when acquiring a new ship for a specific service. For that purpose, a novel probabilistic operability index is defined, representing an extension of the commonly used operability index. Furthermore, the approach can be used as a part of an advanced, risk-based tactical decision support system, assisting ship masters in making real-time decisions on heavy weather maneuvering.
It was also shown how the proposed system can be validated using numerical wave databases, in this case, Mediterranean Sea Wave Reanalysis and Mediterranean Sea Waves Analysis and Forecast, both part of the Copernicus Marine Service.
Recommendations for Future Development
This study is limited to a passenger ferry operating on a route in the Adriatic Sea. However, the analysis can be extended to other ship types, such as container ships and tankers, which operate in significantly more severe oceanic conditions. The influence of strong winds, including crosswinds and headwinds, on the ship maneuverability should also be considered. Additionally, incorporating a wave–structure interaction could be crucial for certain vessel types, such as large container ships.
To ensure the reliability of the model, validation using ships operating in extreme conditions is necessary. Furthermore, integrating artificial intelligence methods could enhance the model’s predictive accuracy.


