Article

Research on Advance Rate Effects and Their Regulation of Strata Pressure Behavior in Deeply Buried Weakly Cemented Longwall Panels Under High-Intensity Mining Conditions

1
Shandong Key Laboratory of Intelligent Prevention and Control of Dynamic Disaster in Deep Mines, Qingdao 266590, China
2
College of Energy and Mining Engineering, Shandong University of Science and Technology, Qingdao 266590, China
*
Author to whom correspondence should be addressed.
Appl. Sci. 2025, 15(8), 4266; https://doi.org/10.3390/app15084266
Submission received: 28 February 2025 / Revised: 9 April 2025 / Accepted: 10 April 2025 / Published: 12 April 2025

Abstract

:
This study investigates the exacerbated strata pressure manifestations induced by high-intensity mining in medium-deep weakly cemented coal seams in western China. An integrated research methodology combining theoretical analysis, field measurements, and numerical simulation was employed to develop a mechanical model of overburden fracture structures in weakly cemented mining faces, systematically revealing the dynamic effects of face advance rate on strata pressure behavior. The results demonstrate that the advance rate not only significantly governs the evolutionary patterns of roof caving and weighting intervals but also exhibits nonlinear correlations with the distribution characteristics of abutment pressure. Furthermore, microseismic parameters effectively characterize the response of strata pressure intensity to advance rate variations. The proposed dynamic control methodology provides both theoretical foundations for safe mining in weakly cemented strata and innovative technical solutions for ground control in deep high-intensity mining operations.

1. Introduction

With the exploitation of coal resources, shallow coal seams are being progressively depleted, driving coal mining operations to extend from superficial strata to deeper geological horizons [1,2,3]. The intensification of mining activities has led to increased occurrences of strata pressure manifestations and related geomechanical hazards [4,5,6]. The regulation of mining intensity proves critical for minimizing energy release in surrounding rock masses during extraction processes, which serves as a fundamental measure for preventing strata pressure anomalies [7]. Under predetermined working face dimensions and mining height, the advancement rate emerges as the predominant factor controlling mining intensity, thereby establishing a direct correlation between face advance velocity and the intensity of strata pressure manifestations. This necessitates systematic investigation into the advancement rate-dependent effects on ground pressure behavior in mining panels.
Current research landscape regarding advancement rate impacts on coal extraction has been substantially enriched through scholarly contributions: Ordin et al. [8] provided theoretical and empirical evidence that increasing the face advancing rate in coal mines significantly reduces absolute methane emissions, establishing a parabolic relationship model between methane release, cutter–loader feed speed, and productivity. Zhang et al. [9] demonstrated that rockburst prevention measures in longwall faces inevitably compromise normal advancement rates, prolonging the exposure duration of fragmented coal seams to atmospheric conditions and consequently elevating spontaneous combustion risks. Liu et al. [10] developed a novel methodology for calculating safe advancement rates under compound hazards, integrating characteristics of coal spontaneous combustion with real-time microseismic and gas monitoring data throughout mining cycles. Linkov [11] demonstrated through field studies at the Kizel Coal Mine that elevating the mining speed from 0.27 m/min to 0.54 m/min resulted in a sharp increase in rockburst occurrence. Napier et al. [12] utilized numerical simulations to reveal that adopting lower advance rates effectively enhances face stability during extraction in high-stress regions. Nawrocki [13] developed a one-dimensional semi-analytical solution to investigate the face advance rate based on the time-dependent behavior of coal seams. The analysis indicated that rapid extraction generates zones of high stress concentration near the longwall face. Ogelekska et al. [14] conducted comparative studies in two mining fields of the Lubin Copper Mine, showing that increased face advance rates correlate with elevated seismic hazard levels. Deng et al. [15] quantitatively verified the correlation between advancement rates and energy accumulation through numerical simulations and underground microseismic monitoring, revealing increased stress concentration coefficients in coal–rock masses under accelerated mining conditions. Yu et al. [16] established that higher advancement rates extend roof fracture propagation distances while intensifying the frequency of energy events associated with overburden fragmentation. Li et al. [17] identified a positive correlation between mining velocity and energy accumulation in coal seams, significantly increasing rockburst susceptibility. Jia et al. [18] quantified the enhancement of mining-induced stress peaks, plastic zone widths, and elastic energy storage with increased face advance speeds. Keneti et al. [19] demonstrated that excavation in high-stress rock formations generates a yield zone ahead of the working face. Rapid face advance rates prevent stabilization of this yield zone, consequently increasing rockburst potential. Prakash et al. [20] conducted subsidence monitoring at Longwall Panel 1 of Adriyala Mine, revealing an inverse correlation between the face advance rate and mining-induced surface subsidence. Eremin et al. [21] postulated that challenging mining conditions combined with high advance rates induce pronounced stress disequilibrium in roof strata, floor strata, and interpanel coal pillars. Jooste et al. [22] established that the distance from peak abutment pressure to the coal face is functionally dependent on the advance rate, with higher rates causing pressure peaks to migrate toward the face while elevating strain burst risks.
This paper focuses on Panel 12308 at the Hongqingliang Coal Mine in Inner Mongolia, characterized by weak rockburst propensity. Through integrated theoretical analysis, field monitoring, and numerical modeling, we investigate the advancement rate effects on strata pressure behavior and develop corresponding control strategies for deep weakly cemented soft rock strata under high-intensity mining conditions. The research outcomes provide theoretical foundations for optimizing advancement rates in analogous geotechnical environments.

2. Engineering Geological Conditions

2.1. Engineering Geological Profile

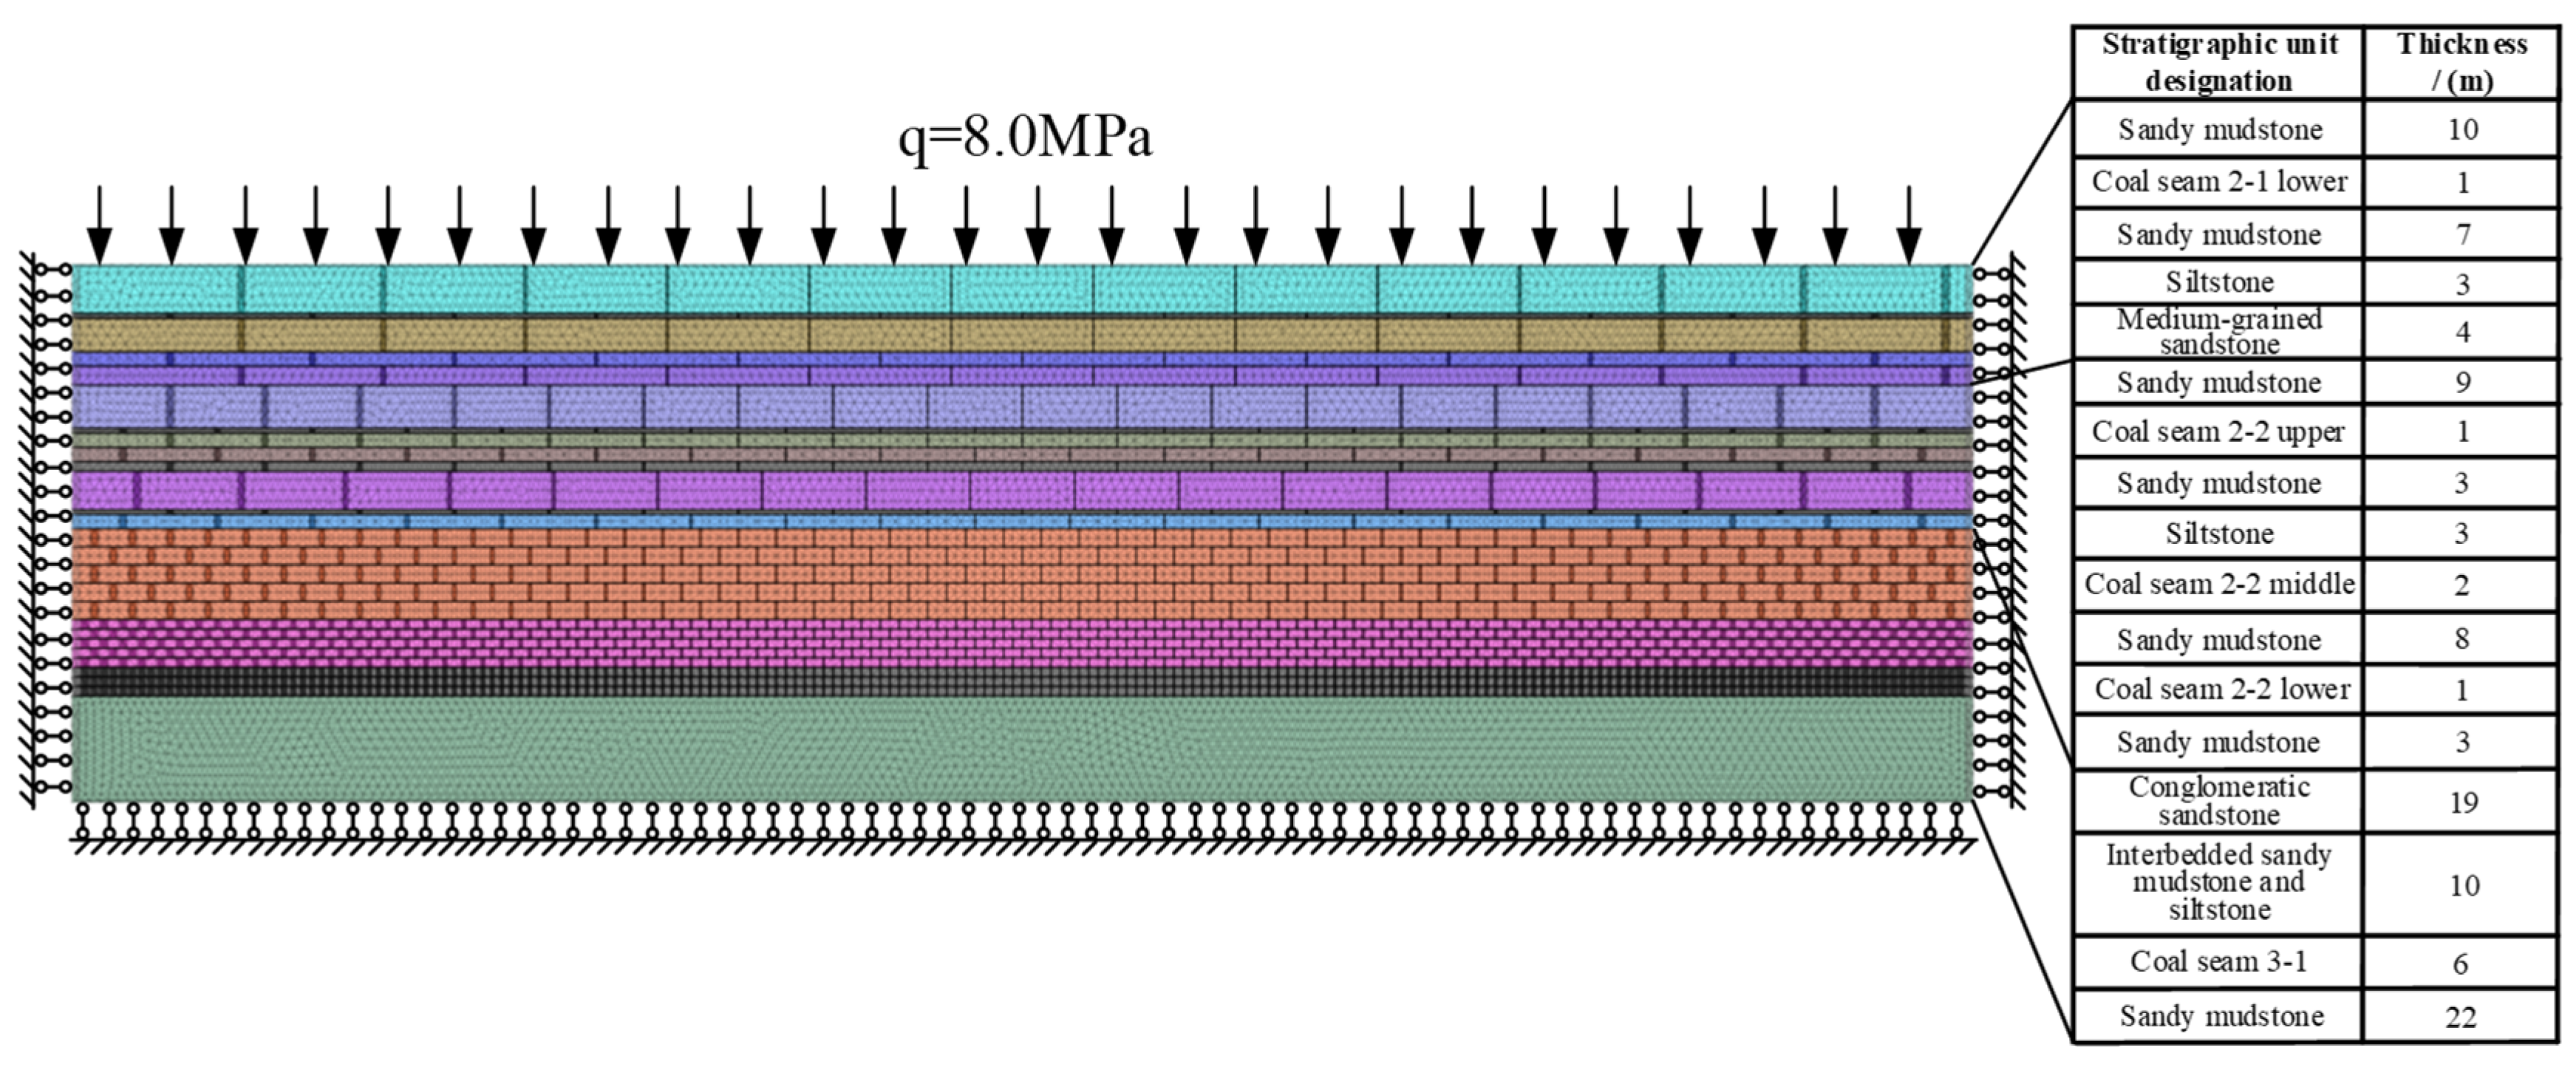
The present mine primarily extracts the 3-1 coal seam with an annual production capacity of 6 million tons. The seam occurs at an average burial depth of approximately 420 m, exhibiting a dip angle ranging from 0° to 6° (average 3°). The 12308 longwall panel demonstrates a strike length of 1877 m and a dip length of 300.5 m, with its mining layout plan illustrated in Figure 1. The 12038 working face extracts coal seams with an average mining height of 6.3 m, employing fully mechanized single-pass full-seam height mining technology. The operation adopts the inclined longwall retreat mining method with full caving for roof control. The immediate roof strata in this district predominantly consist of sandy mudstone, interbedded sandy mudstone and siltstone, and conglomeratic sandstone. The floor strata are principally composed of weakly cemented sandy mudstone, classified as soft rock, characterized by low strength, poor cementation, and susceptibility to argillization upon water contact. The comprehensive stratigraphic columnar section of the 12308 fully mechanized face is presented in Figure 2.

2.2. Support Configuration of the Working Face

The 12308 longwall face employs shield-type hydraulic supports for ground control. Both the headgate and tailgate ends are reinforced with specialized headgate hydraulic supports, while the gate roads utilize advanced hydraulic supports in combination with single props for forward abutment control. The support system configuration comprises 176 hydraulic units in total, including 169 face supports, 5 headgate hydraulic supports, and 2 transition hydraulic supports. The hydraulic face supports exhibit a setting pressure of 10,020 kN and a rated working resistance of 15,000 kN.

2.3. Advance Rate Conditions of the 12308 Working Face

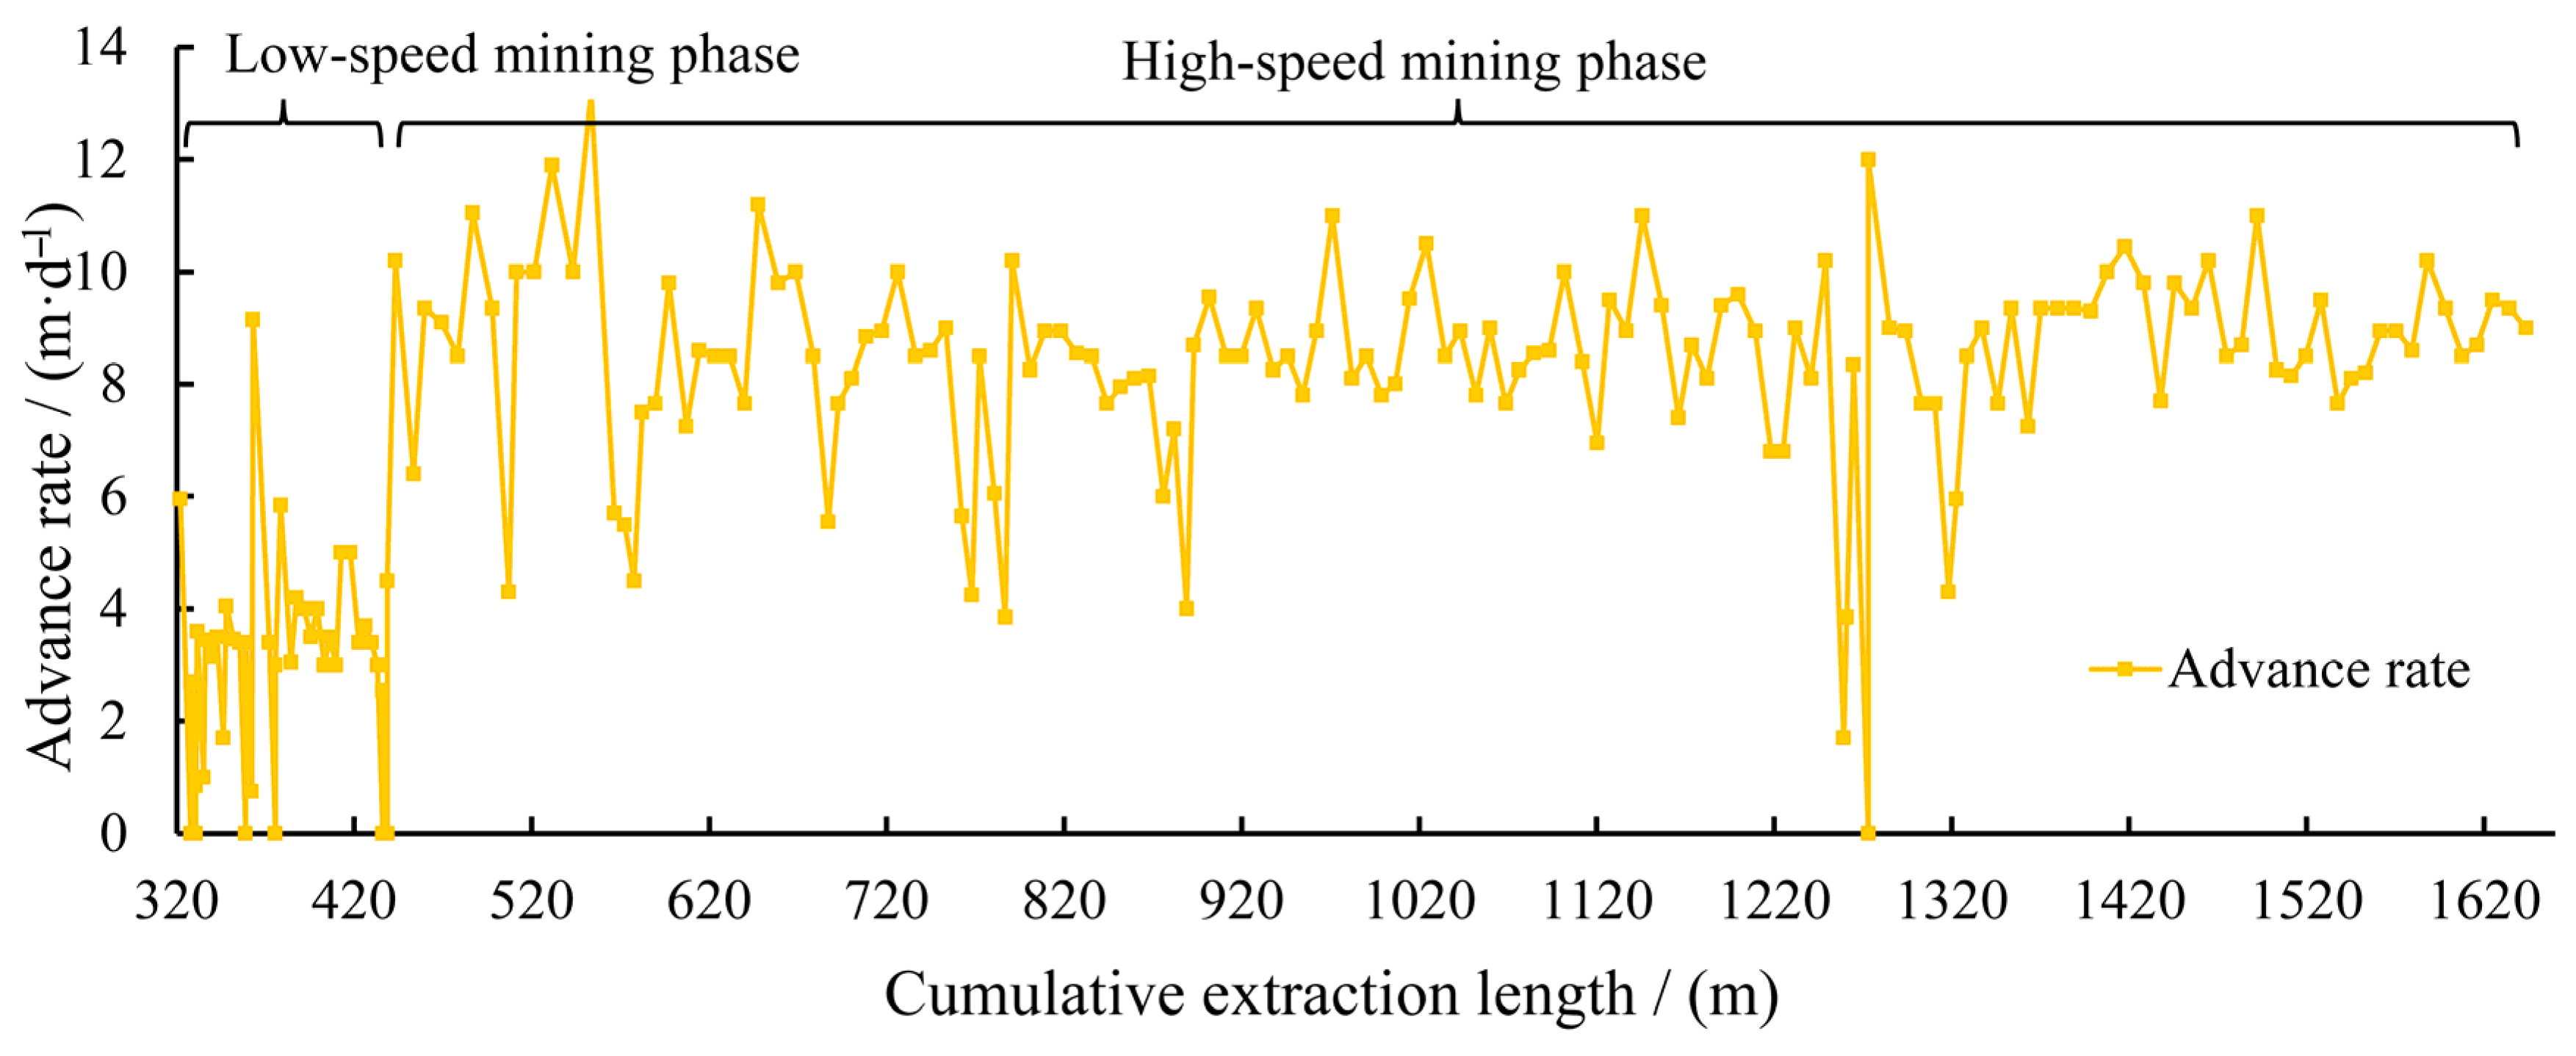
During the coal extraction process, the mining operations progressed through both the initial mining phase and the regular extraction phase, with the advance rate variations throughout these stages being quantitatively illustrated in Figure 3.
As shown in Figure 3, during the routine mining phase of the longwall face, the inadequate pre-mining detection of geological discontinuities (including faults, folds, and collapse columns) resulted in a constrained initial advance rate. The face advance rate during the low-speed mining stage ranged from 2~4 m/d, with an average value of 3.7 m/d, whereas the high-speed mining stage exhibited an advance rate of 8~10 m/d, averaging 8.34 m/d.

3. Influence of Face Advancing Rate on Roof Caving Interval

3.1. Establishment and Design of Numerical Model

(1)
Numerical Model Construction
This numerical simulation investigates roof caving characteristics under different mining advance rates using 3DEC 7.0 software. 3DEC 7.0, developed by Itasca Consulting Group, is a three-dimensional discrete element method (DEM)-based numerical modeling software specifically designed for analyzing discontinuous media (e.g., jointed rock masses, fractured structures).
The numerical model was established based on geological conditions and field measurements from Panel 12308 of the Hongqingliang Coal Mine. The model dimensions were designed as follows, according to actual coal seam distribution: 300 m in the x-direction, 3 m in the y-direction, and 134 m in the z-direction. Horizontal constraints were applied to lateral boundaries, fixed constraints to the bottom boundary, and free boundary conditions to the top surface. A uniformly distributed load of 8.0 MPa was applied to simulate overburden pressure. The computational model of Panel 12308 is shown in Figure 4.
(2)
Constitutive Models and Mechanical Parameters of Coal–Rock Mass
The selection of constitutive models in 3DEC critically determines the accuracy of rock mass behavior characterization. Built-in models include Mohr–Coulomb, strain-softening, strain-hardening, and creep models. Given that weakly cemented sandstone dominates the study area with shear-dominated progressive failure mechanisms, the Mohr–Coulomb model was adopted due to its strong correlation with the linear “shear strength-normal stress” relationship.
The mechanical parameters of coal/rock masses were determined through uniaxial compression tests, tensile strength tests, and shear strength tests (Table 1). The joint mechanical parameters are listed in Table 2.
(3)
Numerical Simulation Scheme
Considering actual advancing rate variations at Panel 12308, the simulation was designed with a total mining distance of 240 m using the full-seam mining method. A 30 m boundary coal pillar was reserved for the 3-1 coal seam. Four advancing rate scenarios (4 m/d, 6 m/d, 8 m/d, and 10 m/d) were simulated, with 5000 equilibrium steps required after each excavation increment. Pressure monitoring lines were installed above the roof to observe abutment pressure evolution during mining.

3.2. Simulation of Immediate Roof Initial Caving Intervals Under Different Advance Rates

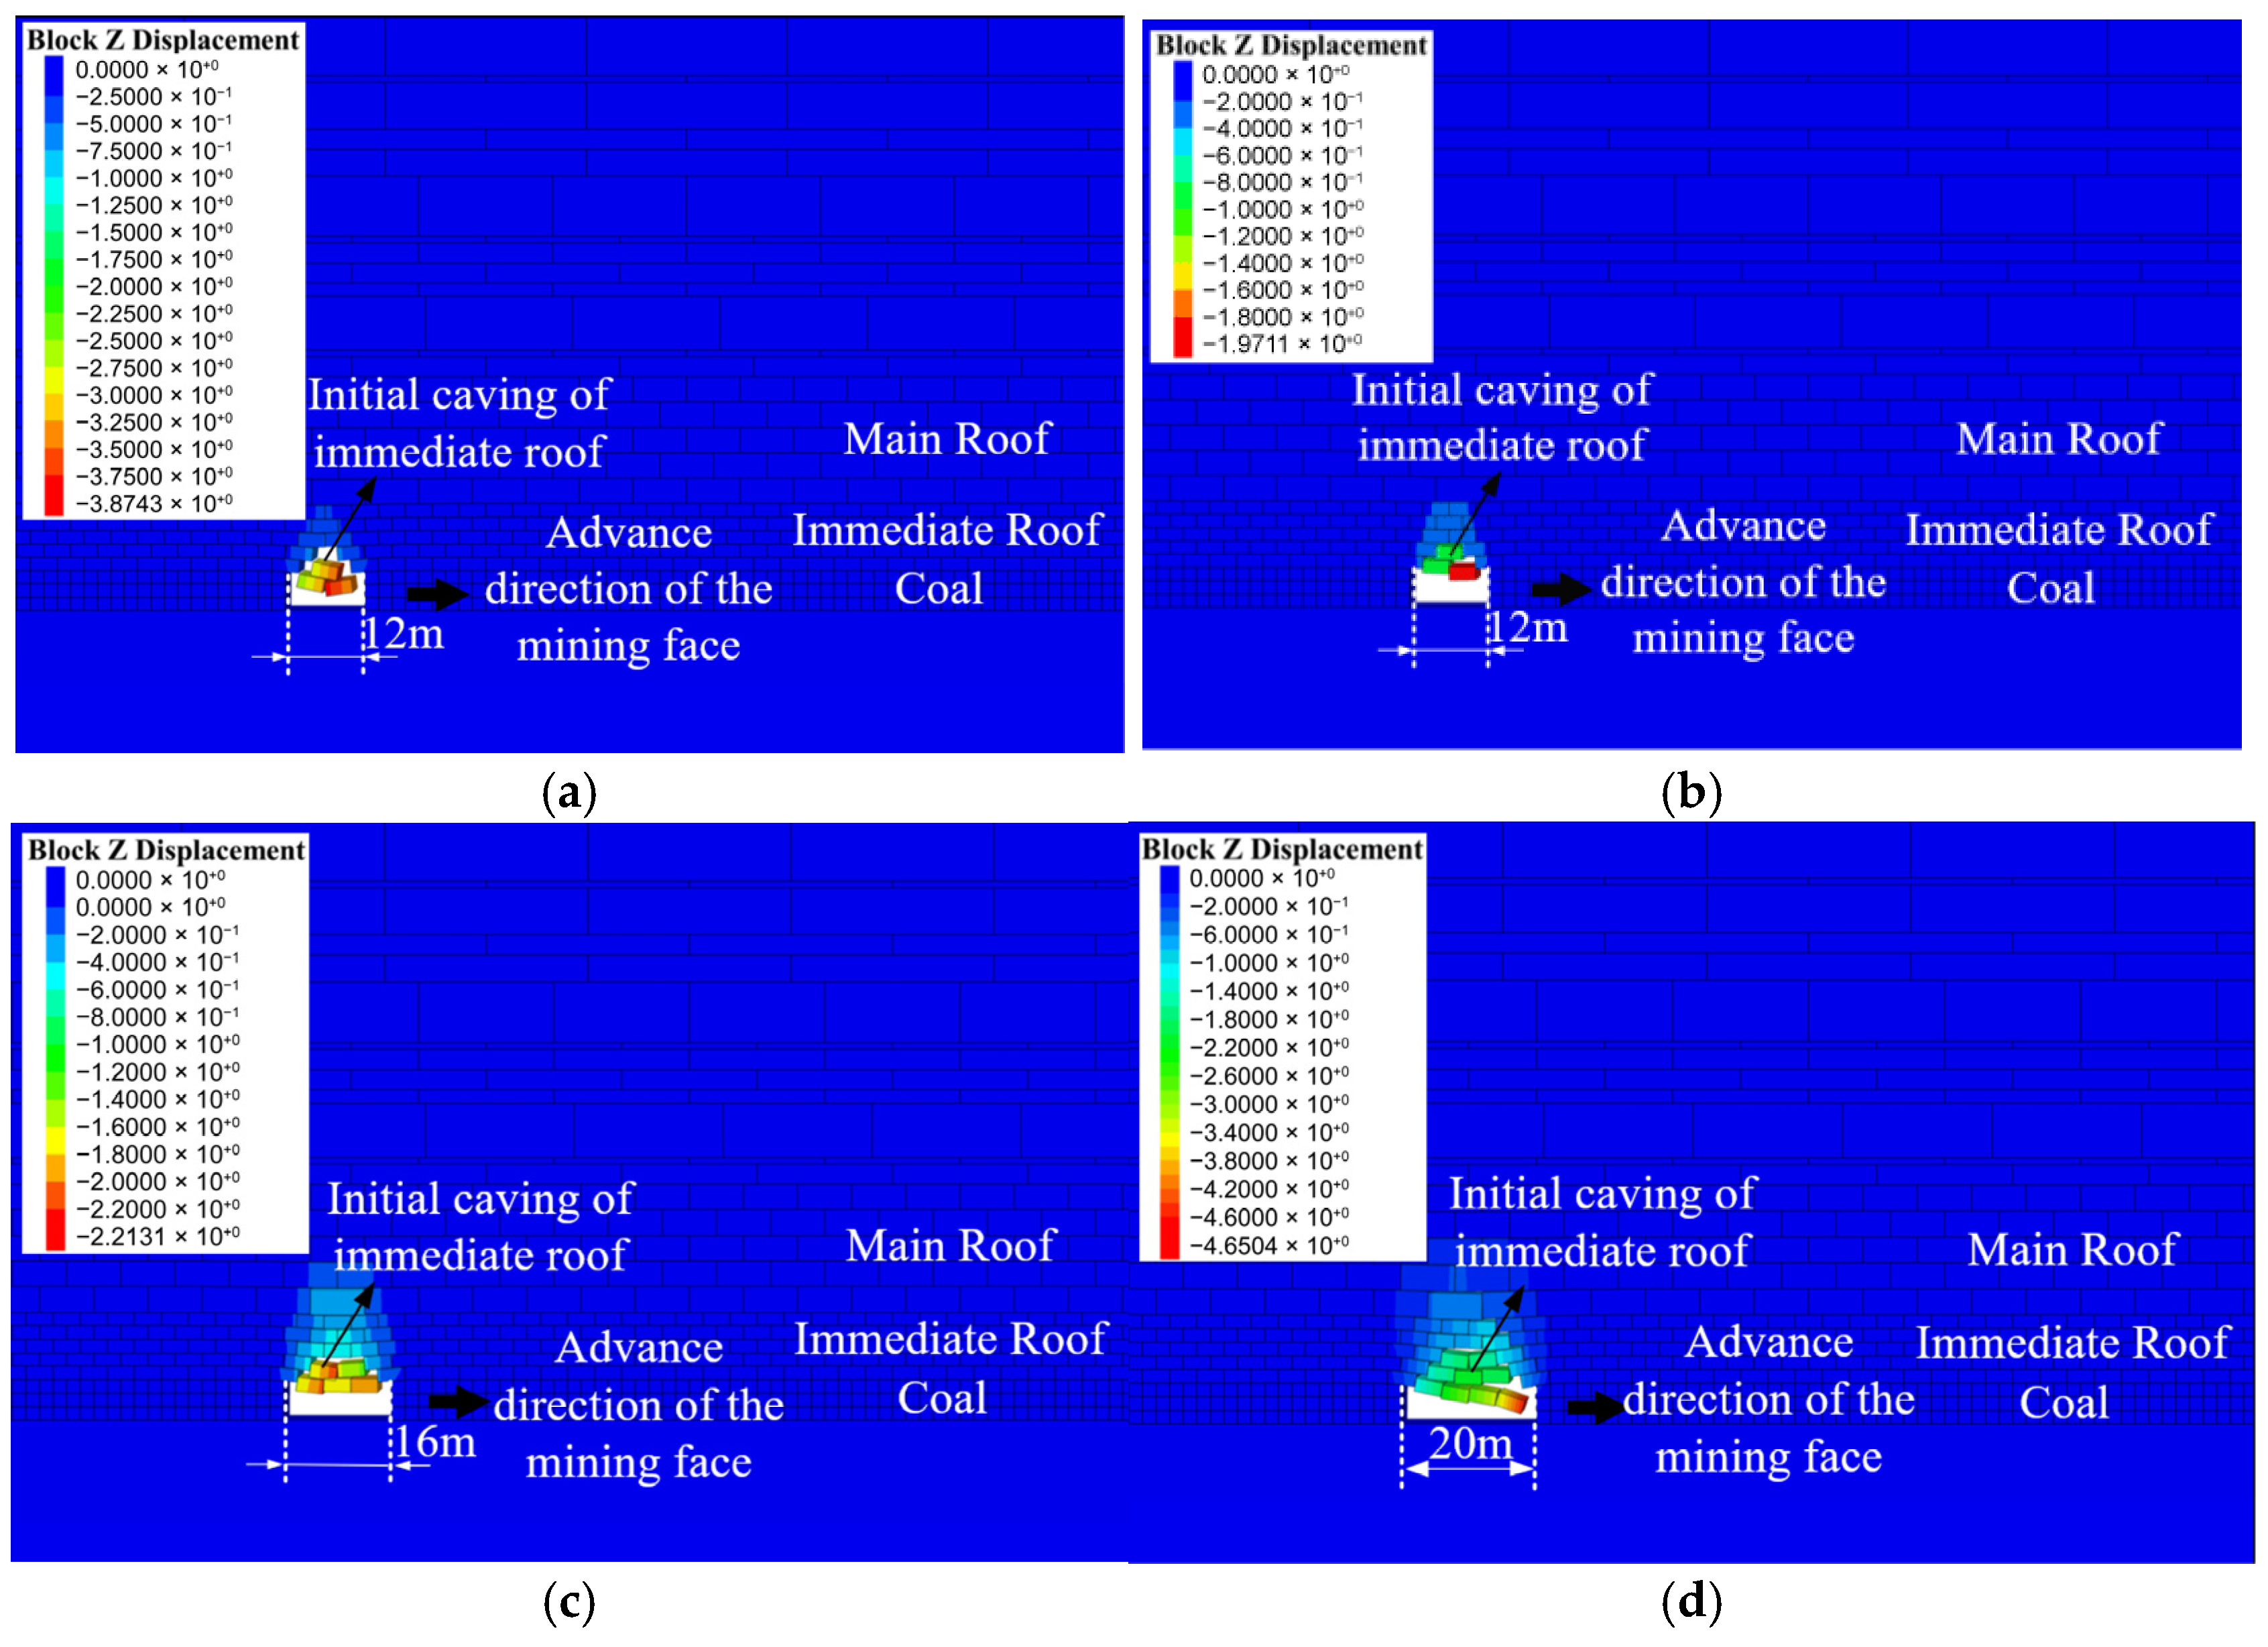
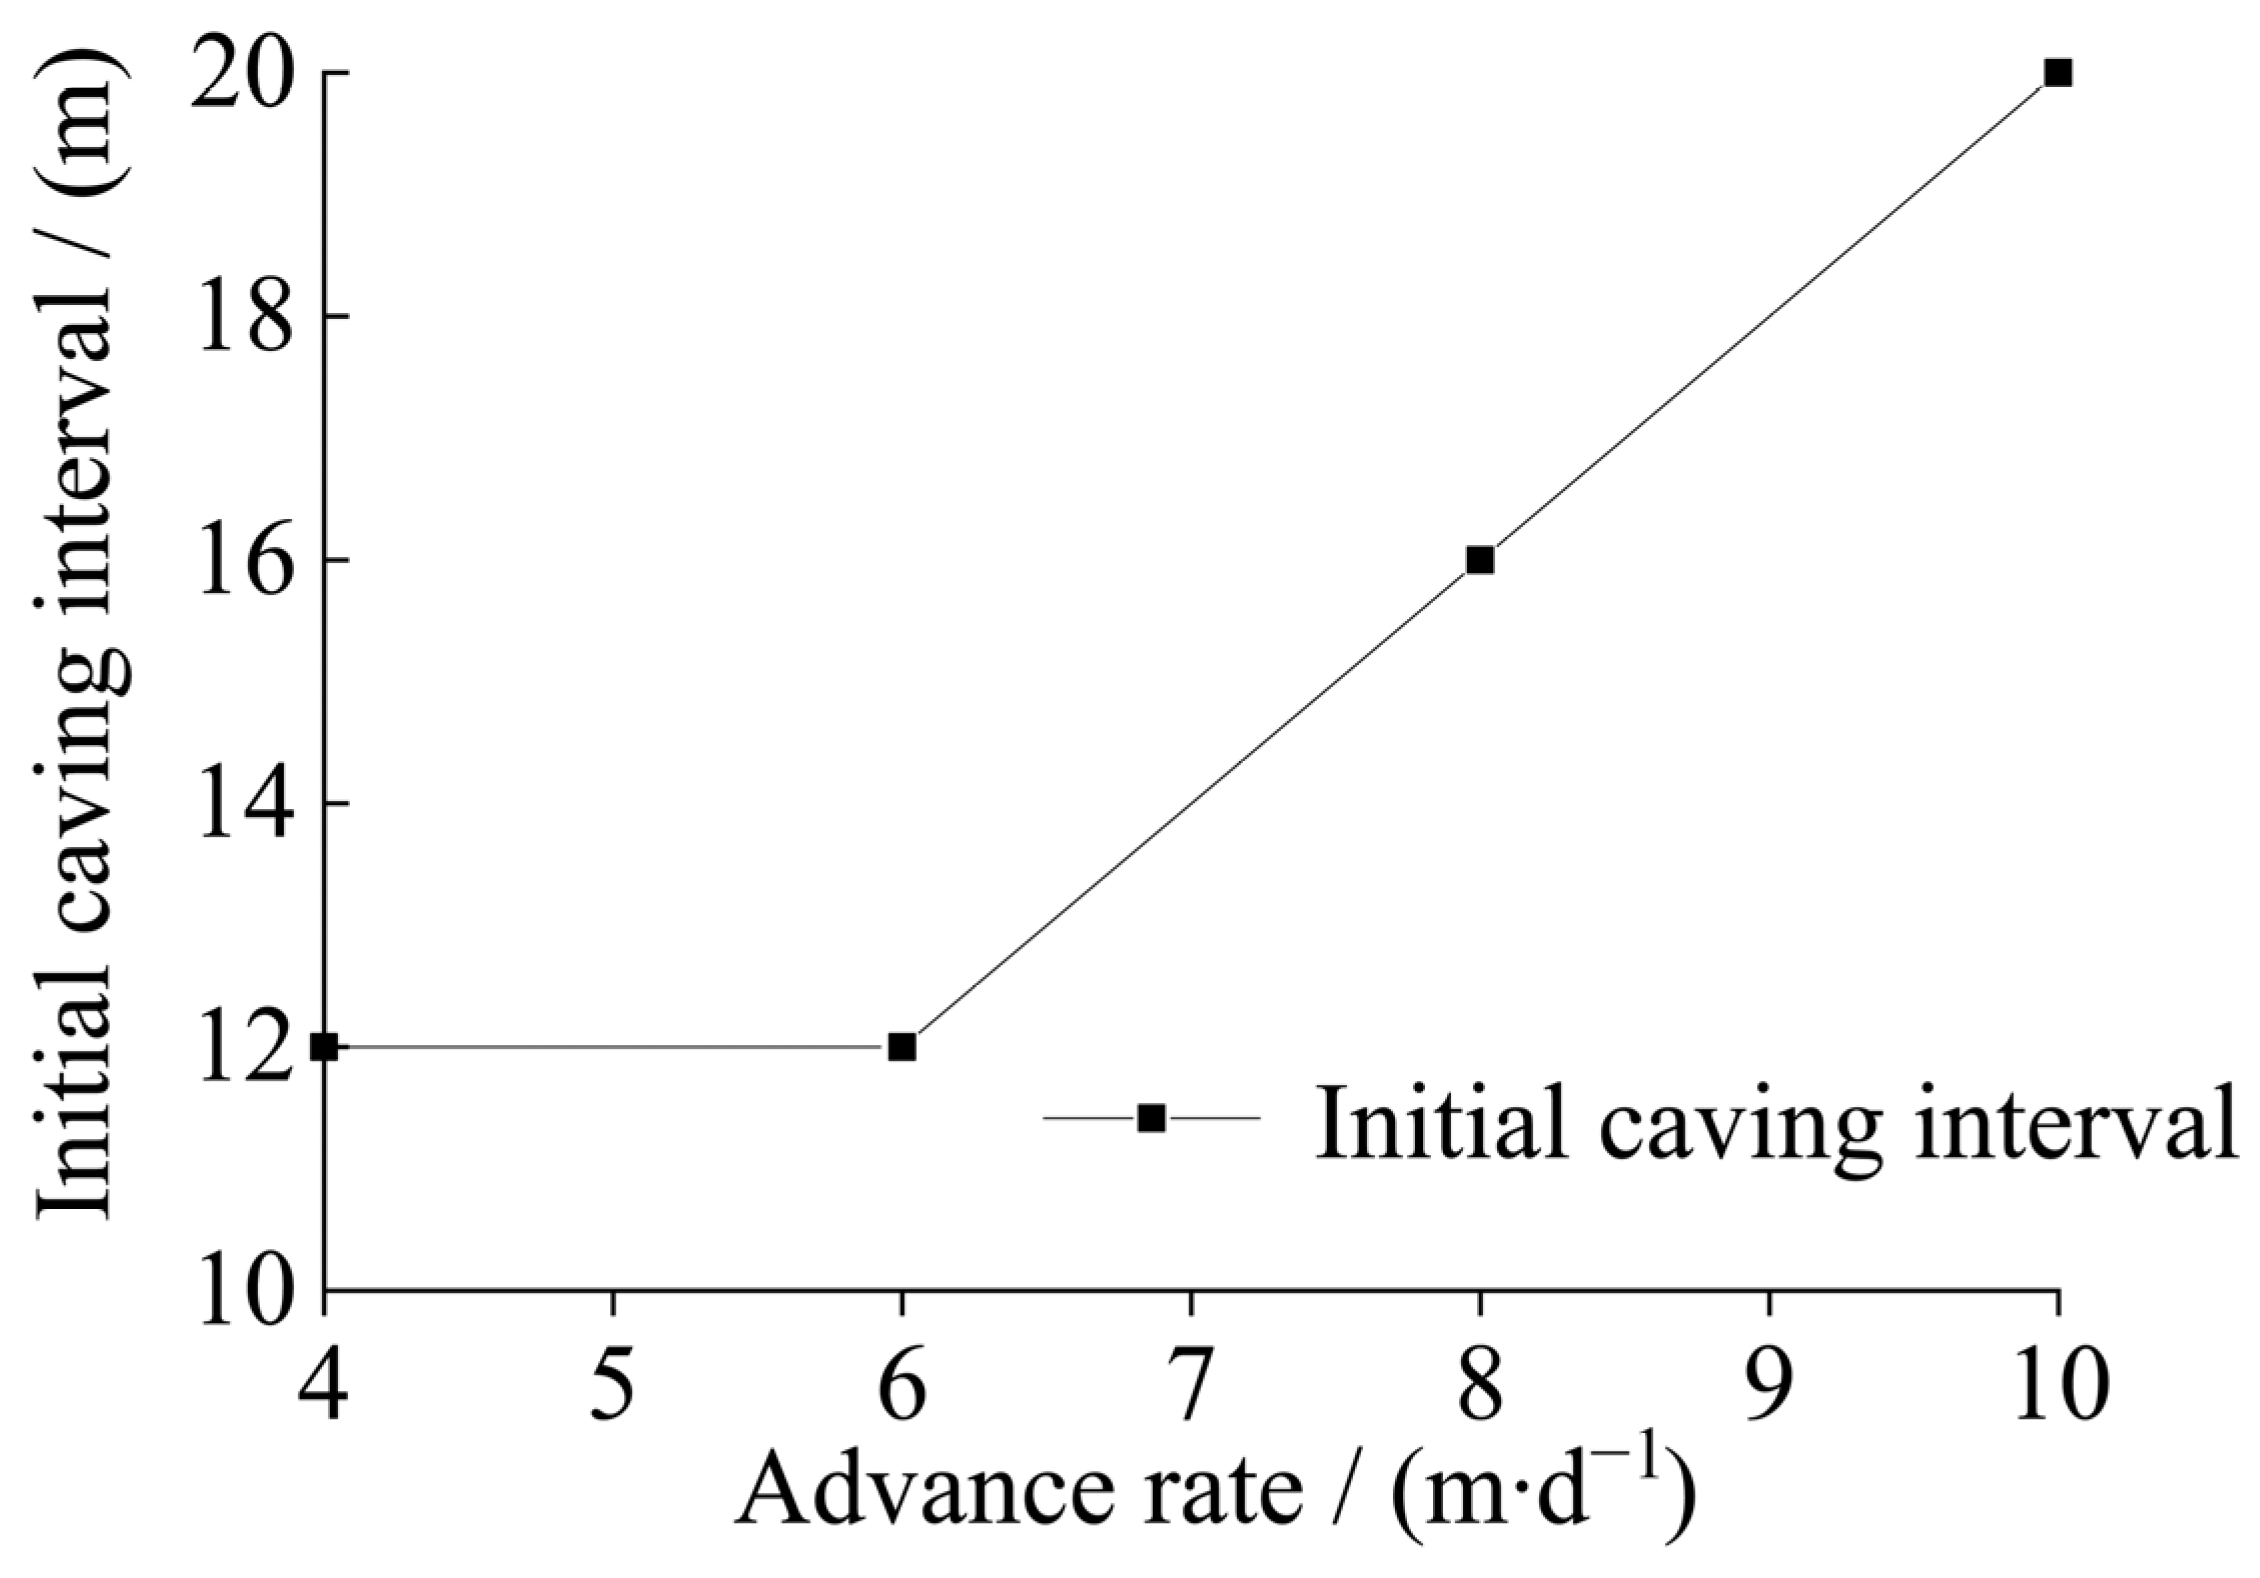
Field measurements indicated that the initial caving interval of the immediate roof during the initial mining stage was 12.4 m. Based on this empirical value, numerical simulations were conducted to investigate the initial caving interval under different face advancing rates. The caving patterns of the immediate roof under various advancing rates are illustrated in Figure 5, with corresponding initial caving parameters detailed in Figure 6.
Notably, the horizontal distance between immediate roof caving positions and the coal wall remained consistent across all advancing rates, with collapse zones consistently located directly above the coal wall. The initial caving interval exhibited a progressive increase with higher advancing rates: from 12 m at 4 m/d to 20 m at 10 m/d. This phenomenon is attributed to insufficient time for stress redistribution within the immediate roof strata under rapidly advancing conditions, thereby extending the caving interval.

3.3. Simulation of Main Roof Initial Weighting Intervals Under Different Advance Rates·

Field measurements revealed that during the initial mining phase, the initial caving interval of the main roof measured 54 m. Building upon this, simulations were conducted to investigate its variation under different advance rates.
Figure 7 illustrates the initial weighting behavior of the main roof under varying advance rates, with key parameters summarized in Table 3. The initial weighting interval of the main roof increases progressively with higher advance rates: 52 m at 4 m/d (minimum) and 60 m at 10 m/d (maximum). Caving positions under all rates occur 1~4 m ahead of the coal wall, with maximal offsets observed at 4 m/d and 10 m/d.
Based on the simulation results of overlying strata collapse positions under different mining advance rates, it is demonstrated that the caving intervals of both the immediate roof and main roof exhibit an increasing trend with accelerated advance rates. Among the four simulated schemes, the minimum advance rate of 4 m/d corresponds to an immediate roof caving interval of 12 m and a main roof caving interval of 52 m, while the maximum advance rate of 10 m/d yields respective values of 20 m and 60 m. The maximum discrepancy in both cases measures 8 m. The simulation analysis aligns fundamentally with field-measured data, particularly in terms of roof collapse positioning relative to the coal wall, which displays negligible spatial variation. This parametric study conclusively indicates that the mining advance rate exerts limited influence on both immediate roof caving and main roof failure mechanisms.

3.4. Theoretical Study on the Influence of Advance Rate on the First Weighting Interval of the Main Roof

During the face advance process, variations in the advance rate significantly influence the weighting interval. Under low and constant advance rates, the overlying strata gradually bend and subside as the face progresses. The slower advance allows sufficient time for strata caving. In contrast, higher advance rates lead to inadequate stress redistribution within surrounding rock masses, resulting in elevated stress concentration coefficients. This inhibits effective pressure relief in the stope periphery, thereby increasing the load borne by the exposed lower strata. As the face advances, the unsupported span progressively extends while roof fracturing remains limited, ultimately enlarging the weighting interval. The kinematic model of overburden strata movement under different advance rates is illustrated in Figure 8.
As shown in Figure 8, the increase in advance rate leads to an extension of the unsupported span of the main roof (i.e., L1 < L2) due to the hysteresis in load transfer within the main roof. This phenomenon is attributed to the enhanced tensile strength of the strata, which itself results from the increased loading rate.
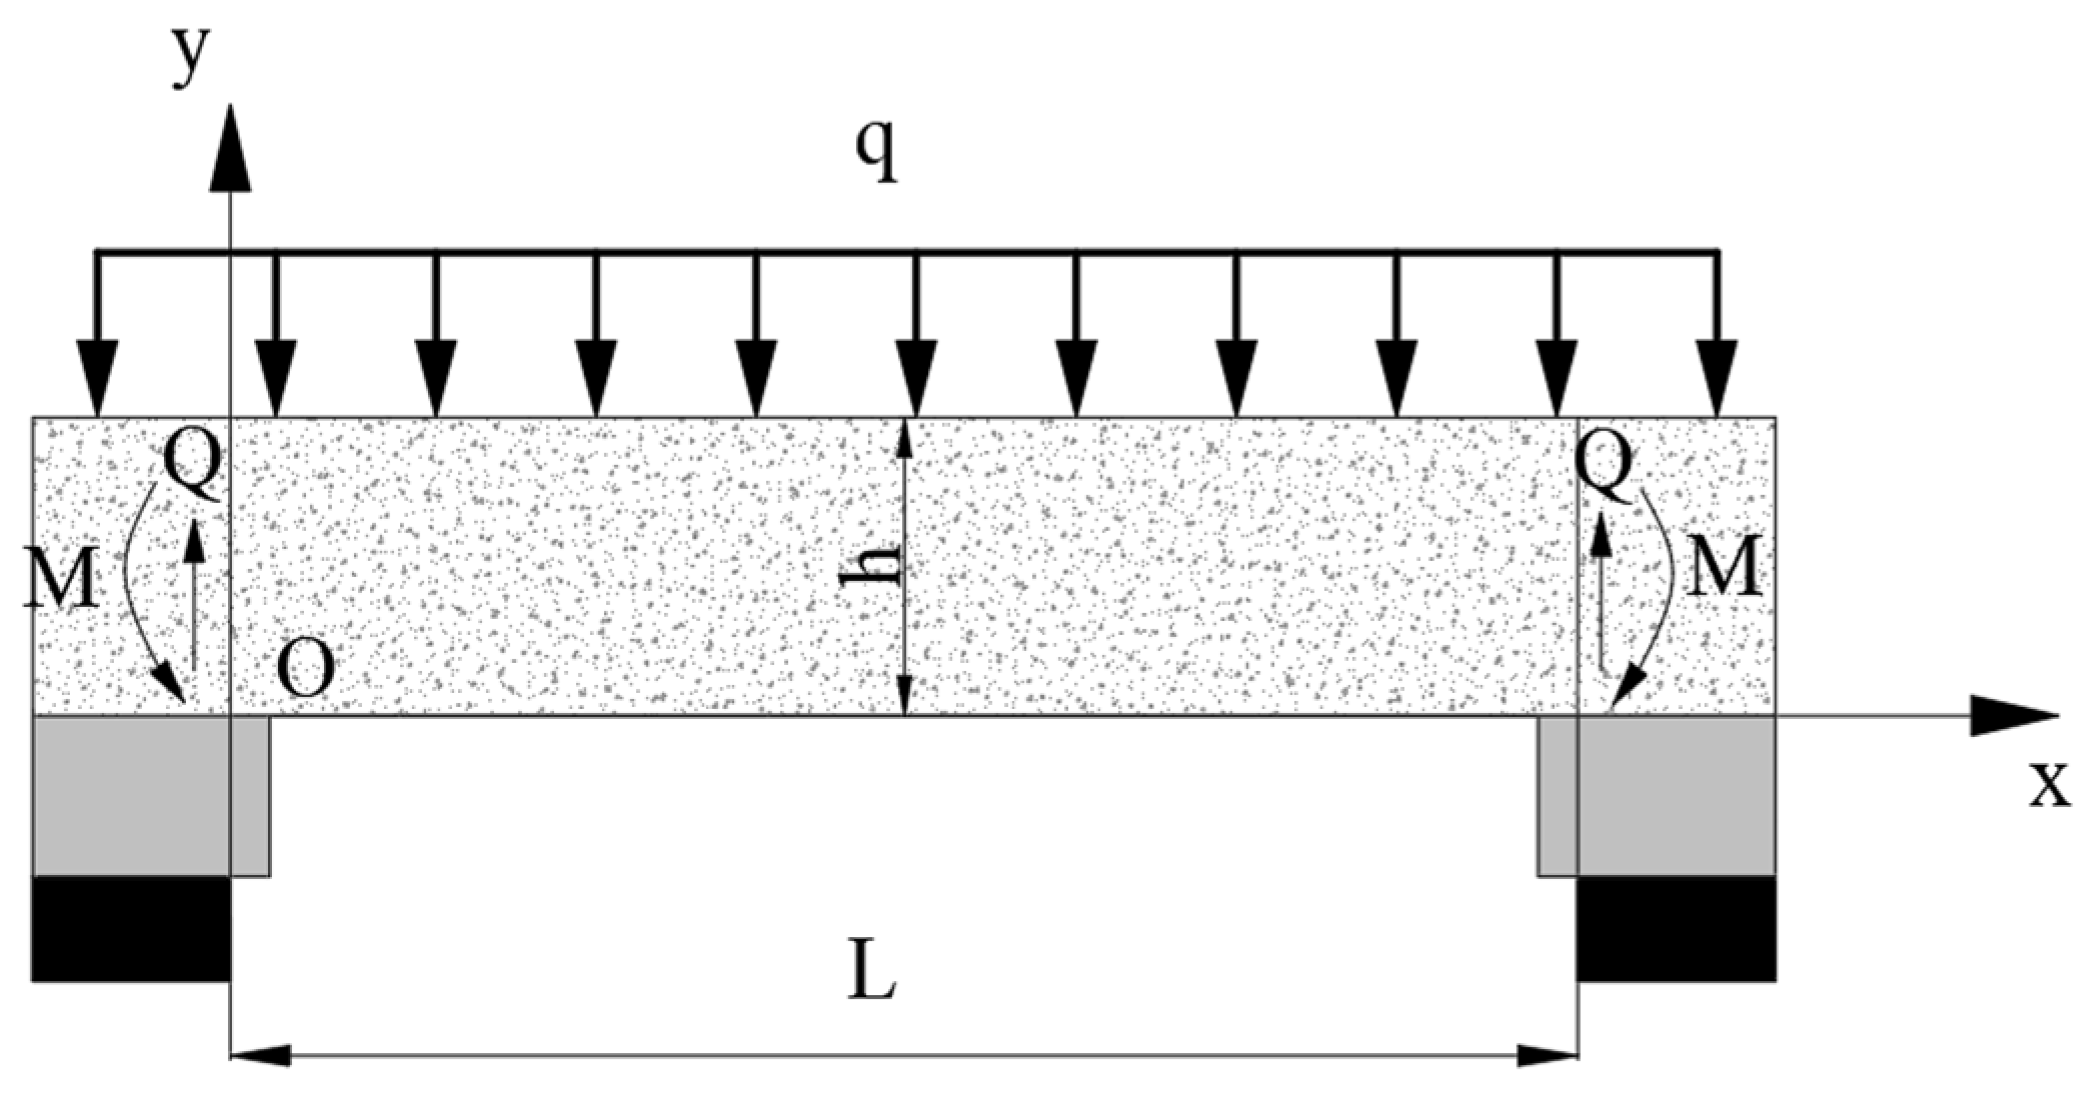
Based on Academician Qian Minggao’s “Voussoir Beam” theory, the main roof is modeled as a fixed-end beam subjected to uniformly distributed loads at both ends, as schematically illustrated in Figure 9. The critical fracture condition occurs when the maximum tensile stress at the bending moment extremum reaches the rock’s tensile strength RT.
The maximum bending moment occurs at both ends of the fixed-end beam. The formula for the maximum bending moment is
M max = 1 12 q L 2
The section modulus in bending is
W = h 2 6
According to the strength criterion, it can be derived that
σ max = M max W = q L 2 2 h 2
When σmax = RT, that is, when the tensile strength of the rock strata is reached at this location, fracture initiates. By combining Equations (1)–(3) through derivation, the critical caving span of the beam at fracture can be obtained as
L 1 = h 2 R T q
where
q—load applied to the main roof (MPa), q = γ H ;
γ —unit weight of the strata (kN/m3);
H—overburden depth (m);
h—thickness of the main roof (m).
Since Equation (4) is derived for an idealized theoretical model, the influence of weak strata necessitates the introduction of a geological weakness coefficient k based on engineering rock mass classification standards. This leads to the final formula for the initial weighting step distance of the main roof:
L w = k h 2 R T q
The range of k values is directly correlated with common rock mass classification standards. The k value increases with improved rock mass integrity, aligning with the scoring trends of classification systems. The specific values are listed in Table 4.
Next, the advance rate will be incorporated into the model. Assuming the model’s working face advance rate is vm with an advance time tm, the actual working face advance rate is vs. with a corresponding advance time ts, and the working face layout length is d. If the rock beam maintains a constant advance rate prior to fracture, the initial weighting interval in the model before roof breakage is defined as L = vmtm. In practical mining operations, this interval becomes L = vptp. Since vmtm = vptp, the model’s advance rate can be derived as
v m = t s t m v s
The ratio of the actual advance time to the modeled advance time is approximately equivalent to the ratio of the actual working face layout length to the width of the rock beam in the model. Let β = t s / t m . Given that the rock beam width in the model is defined as a unit width of 1 m, and the working face layout length is d, the ratio of the actual working face layout length to the model rock beam width is defined as d. Thus, β = d. Based on the operational parameters of Panel 12308, d is assigned a value of 300.
Substituting the above relational expressions into Equation (3), the maximum tensile stress during rock beam fracture in the initial weighting period is obtained as
σ max = q ( v m t m ) 2 2 h 2 = q ( β v s t m ) 2 h 2
By solving the partial derivative of σmax with respect to tm, we derive
σ max = σ max t m = σ max L L t m = β q L v s h 2
As demonstrated by Equation (8), the rate of change in maximum tensile stress exhibits a positive correlation with the advance rate. Specifically, higher advance rates ( v s ) result in accelerated variation rates of σmax, thereby increasing the rock mass failure velocity.
Furthermore, experimental studies have demonstrated that the tensile strength of coal–rock masses exhibits an approximately linear relationship with the axial stress rate under uniaxial compression. Based on this finding, the following empirical relationship can be formulated:
R T = a σ + b
In the equation, σ′ denotes the stress rate, MPa/s; a and b are constants determined through loading experiments.
By combining Equations (8) and (9), the expression for RT can be derived as
R T = a β q L v s h 2 + b
Subsequently, substituting Equation (10) into Equation (5) and solving the quadratic equation yield the computational formula for the initial weighting span of the main roof:
L w = k 2 a β v s + k 4 a 2 β 2 v s 2 + 2 k 2 h 2 b q
Equation (11) does not account for the effects of joints and moisture in the rock layers, both of which significantly impact roof stability. Therefore, corrections for joints and moisture must be incorporated.
Higher joint density (Jv) degrades rock mass integrity and reduces tensile strength (RT). A joint influence factor kj is introduced here, defined as
k j = 1 J v J v , c r i t
where
Jv—joint density, joints/m3;
Jv,crit—critical joint density (threshold at which the rock mass completely loses continuity), joints/m3.
By coupling the joint influence factor kj into the final formula for the initial weighting step distance (Equation (11)), the revised expression becomes
L w = k j ( k 2 a β v s + k 4 a 2 β 2 v s 2 + 2 k 2 h 2 b q )
It is evident from Equation (11) that the initial weighting span L w exhibits a positive correlation with the advance rate v s . This theoretical derivation aligns with the results obtained from numerical simulations.

4. Influence of Advance Rate on Front Abutment Pressure

4.1. Theoretical Analysis of Front Abutment Pressure

A mechanical model was established with the coal seam as an elastic body, as shown in Figure 10, to theoretically analyze the evolution law of advanced abutment pressure under different mining speeds. Referencing Wang’s [23] theoretical research on stope front abutment pressure, the moving coordinate system xoy and fixed coordinate system x′o′y′ were defined. The moving coordinate system xoy, along with the distributed load on the overlying strata of the main roof, moves relative to the fixed coordinate system x′o′y′ at a constant velocity.
Based on this theoretical derivation, the front abutment pressure acting on the coal seam is expressed as
σ y = k e β 1 x ( A cos β 2 x + B sin β 2 x ) + q
where
A = | 1 2 1 E I q l 2 , 2 β 1 β 2 1 E I q l , 3 β 2 β 1 2 β 2 3 | | β 1 2 β 2 2 , 2 β 1 β 2 3 β 1 β 2 2 β 1 3 , 3 β 2 β 1 2 β 2 3 | B = | β 1 2 β 2 2 , 1 2 1 E I q l 2 3 β 1 β 2 2 β 1 3 , 1 E I q l | | β 1 2 β 2 2 , 2 β 1 β 2 3 β 1 β 2 2 β 1 3 , 3 β 2 β 1 2 β 2 3 |
β 1 = k 4 E I m v s 2 4 E I β 2 = k 4 E I + m v s 2 4 E I
In the equation, EI is the stiffness of the main roof beam (where E denotes the elastic modulus of the main roof, I represents the moment of inertia of the main roof, I = b h 3 12 , b is the rock beam width, and h is the thickness of the main roof), MN/m;
where
k′—foundation stiffness (defined as the load per unit deformation applied to a unit beam), MN/m;
q—uniform force on the base top, MN/m2;
m—mass per unit length of the main roof;
x—distance ahead of the coal mining face within the stope, m;
l—width of working face.
Equation (14) demonstrates that, with other parameters held constant, the front abutment pressure on the coal seam is solely dependent on the velocity v. The computational results from Wang [23] reveal that as the advance rate increases, the peak front abutment pressure intensifies, and its peak location progressively shifts toward the front abutment zone of the working face.

4.2. Field Monitoring of Front Abutment Pressure in the 12308 Working Face

The abutment pressure was monitored using the KJ743 system, a dynamic surrounding rock stress monitoring device commonly employed in coal mines and underground engineering. Its measurement principle is based on vibrating wire sensor technology, integrated with fiber-optic transmission and digital signal processing, enabling real-time and continuous monitoring of rock mass stress.
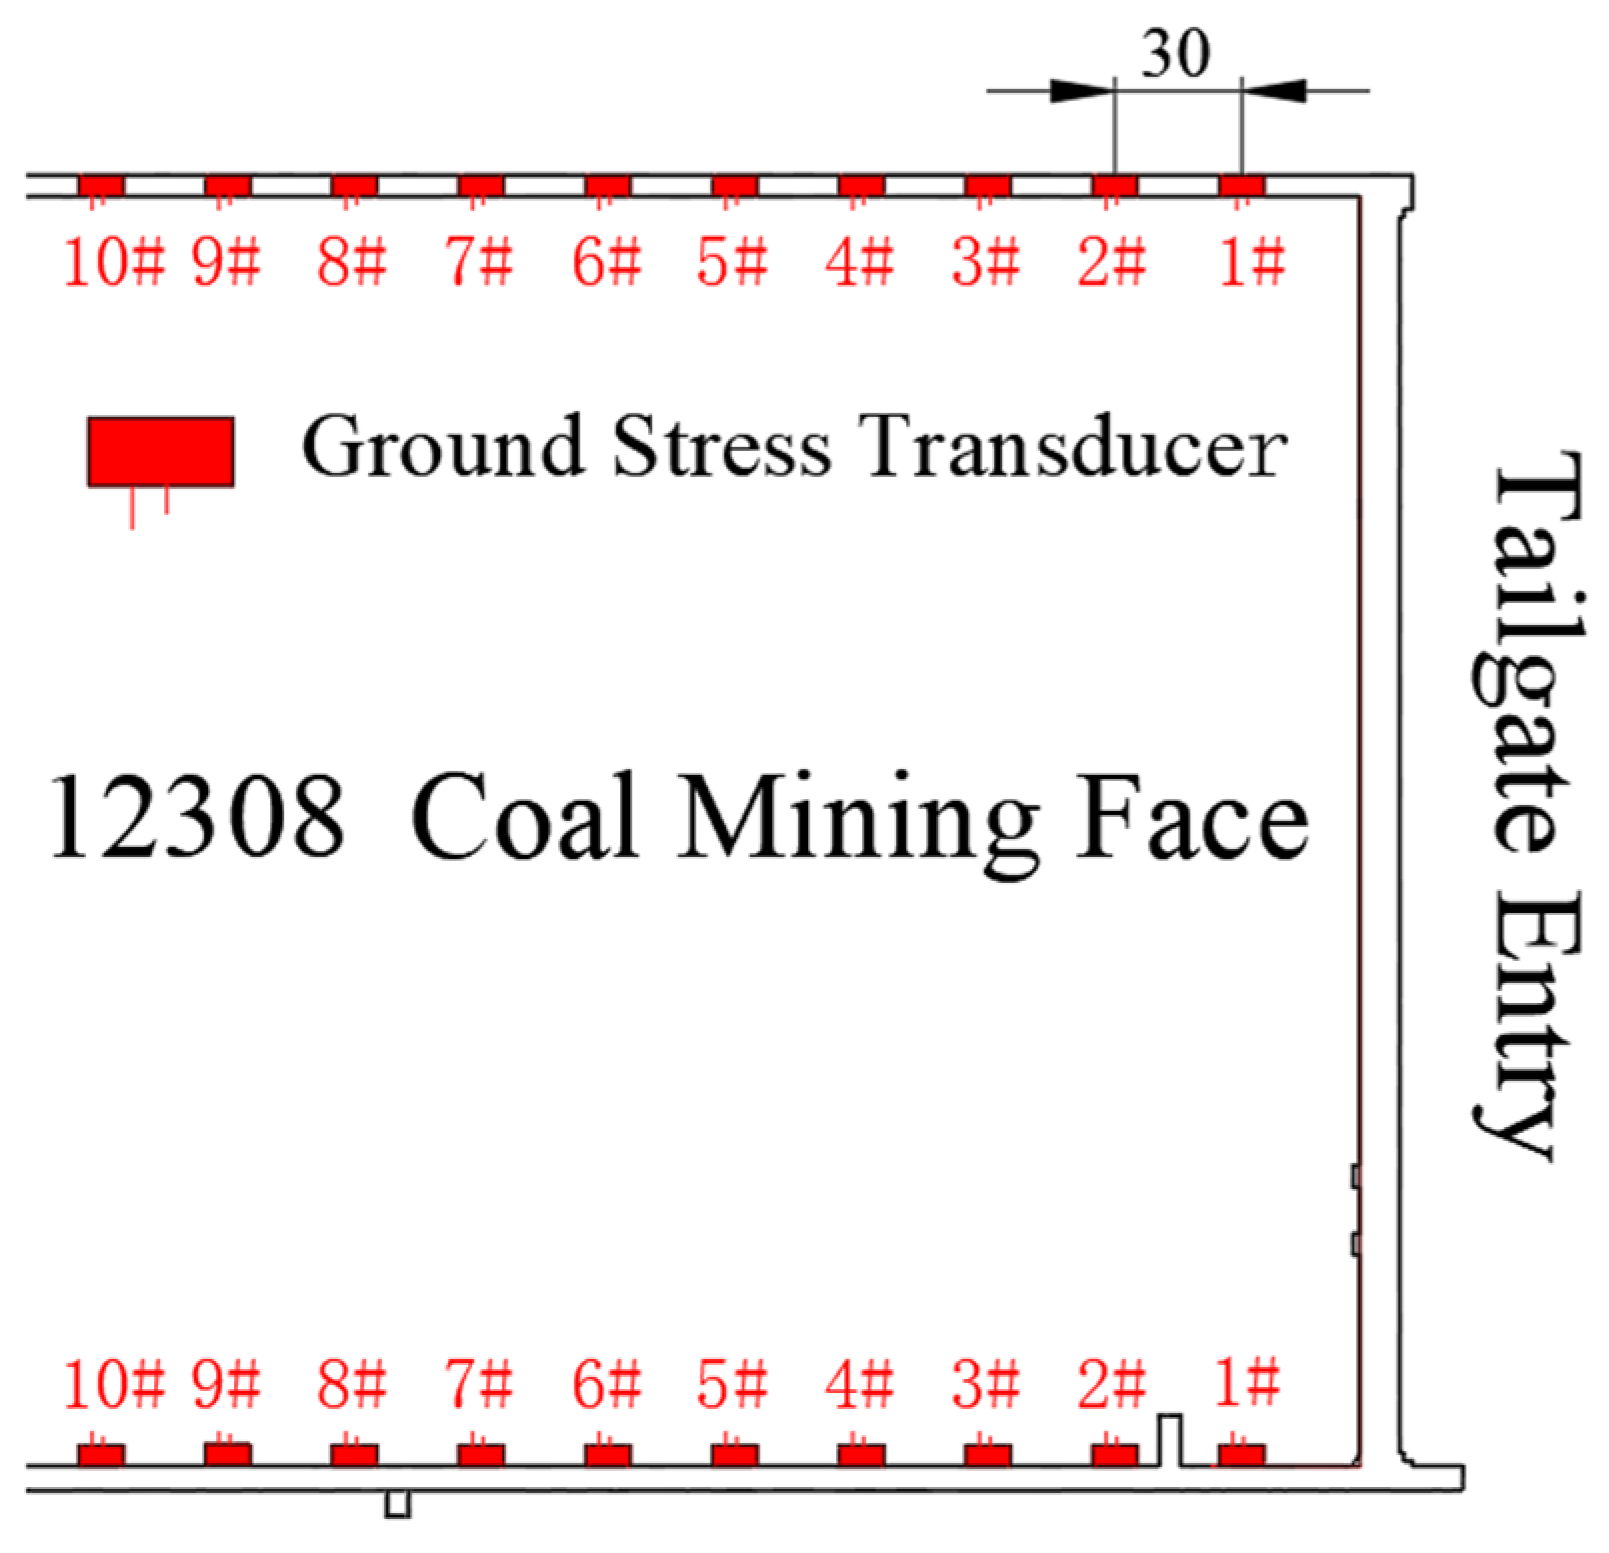
Monitoring points were arranged starting 30 m outward from the open-off cut along the 12308 belt entry and return airway. Each monitoring group consisted of two boreholes with drilling depths of 8 m and 12 m. A total of 10 monitoring groups were deployed at 30 m intervals. The layout of borehole stress meters at the working face is illustrated in Figure 11.
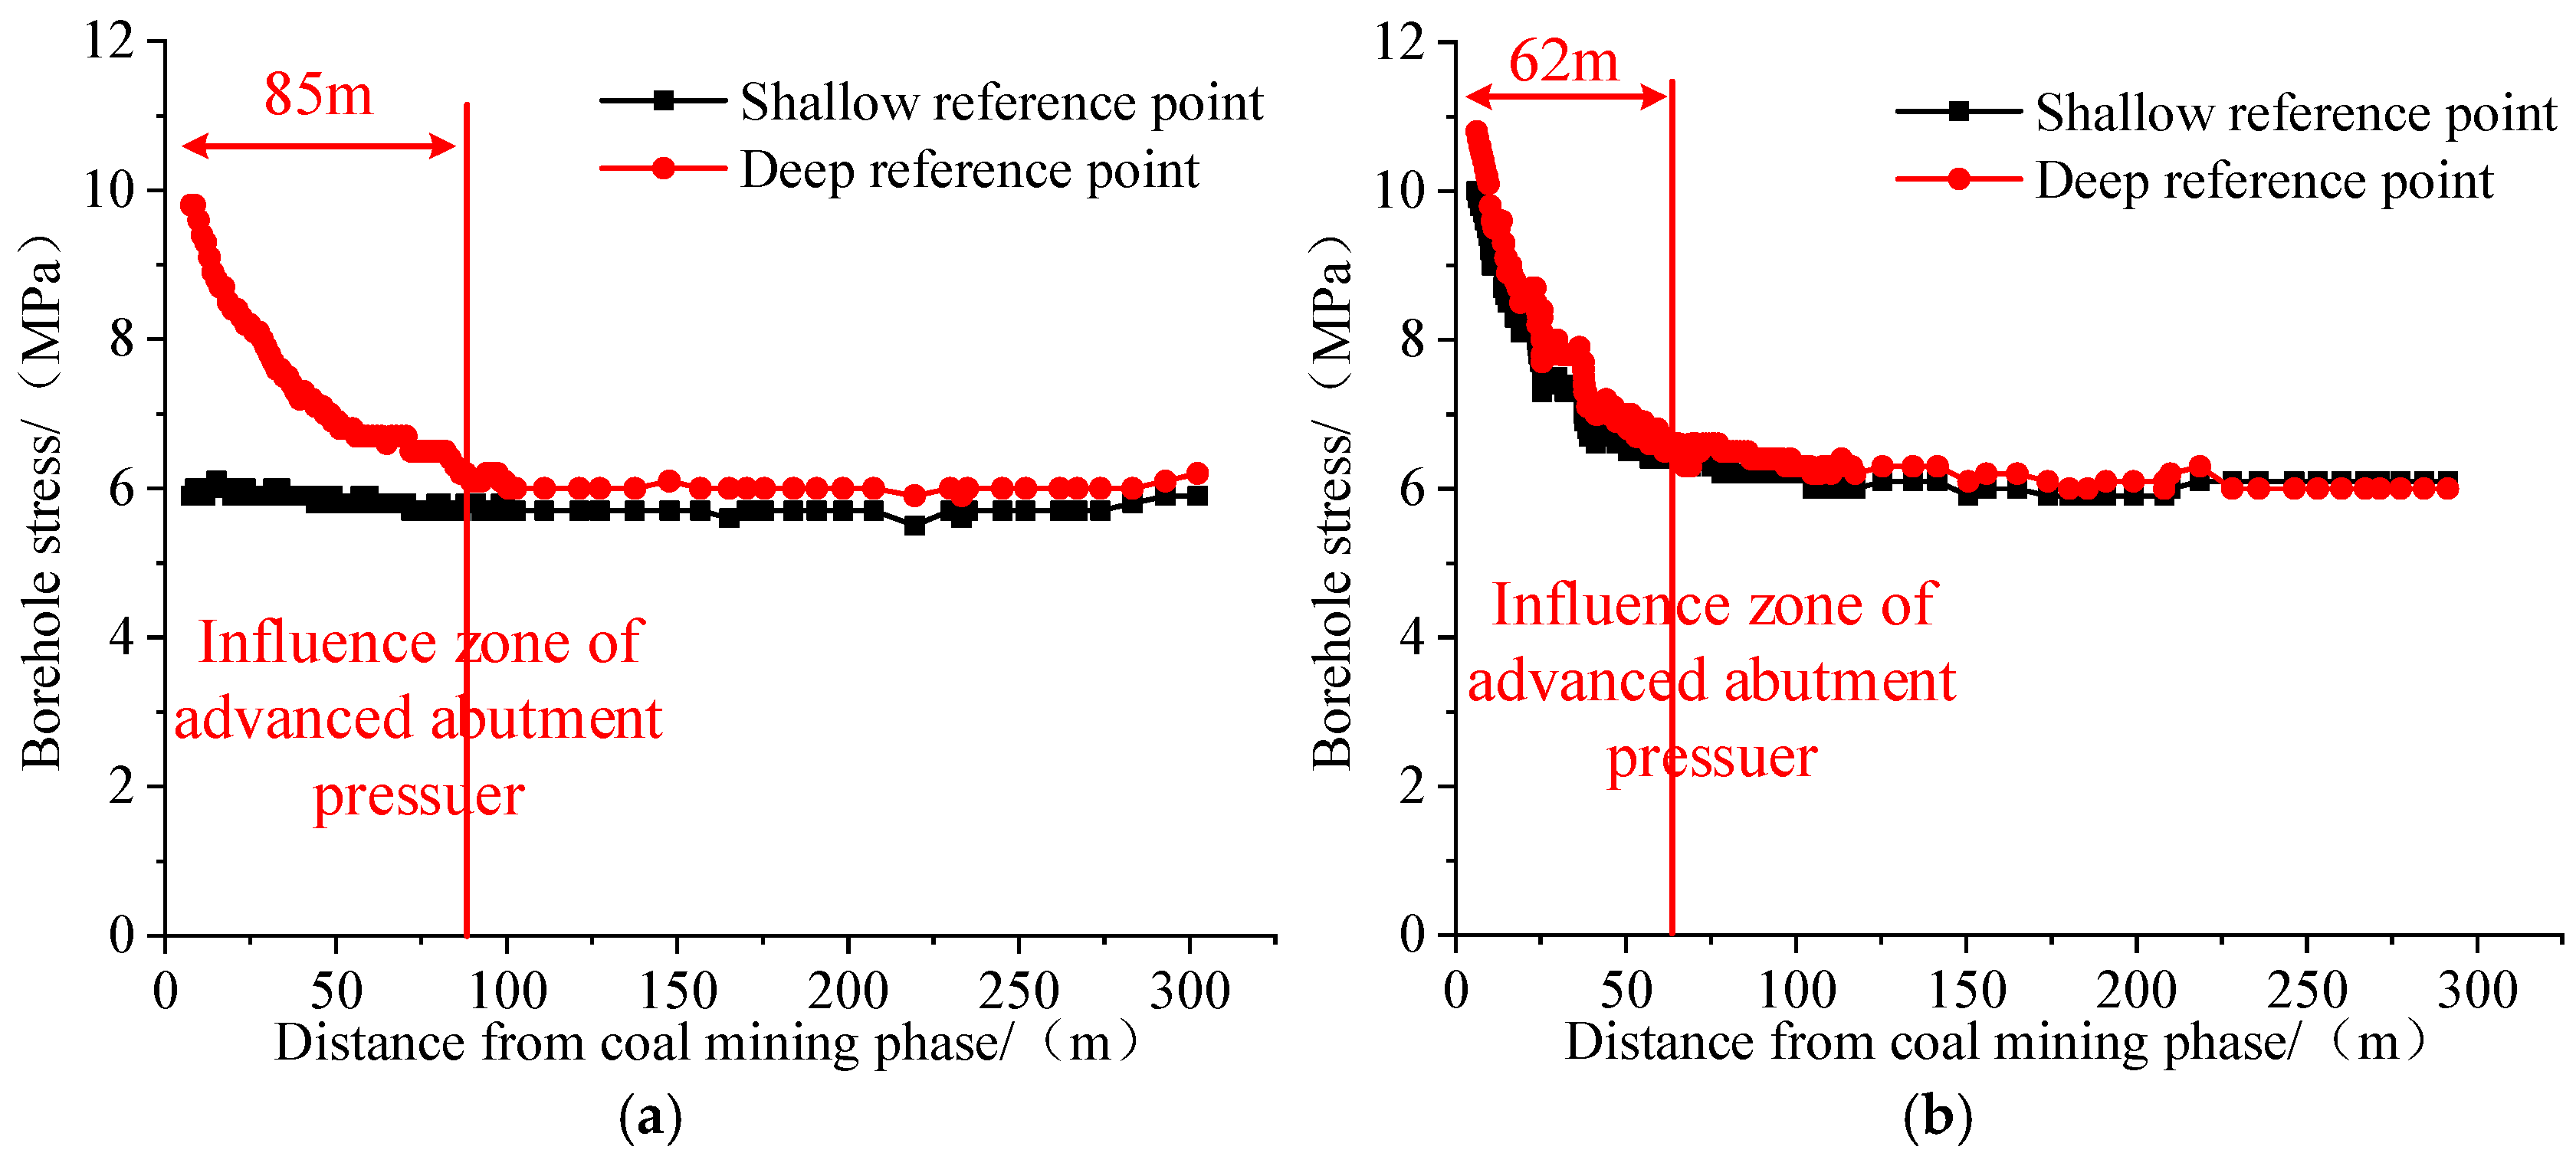
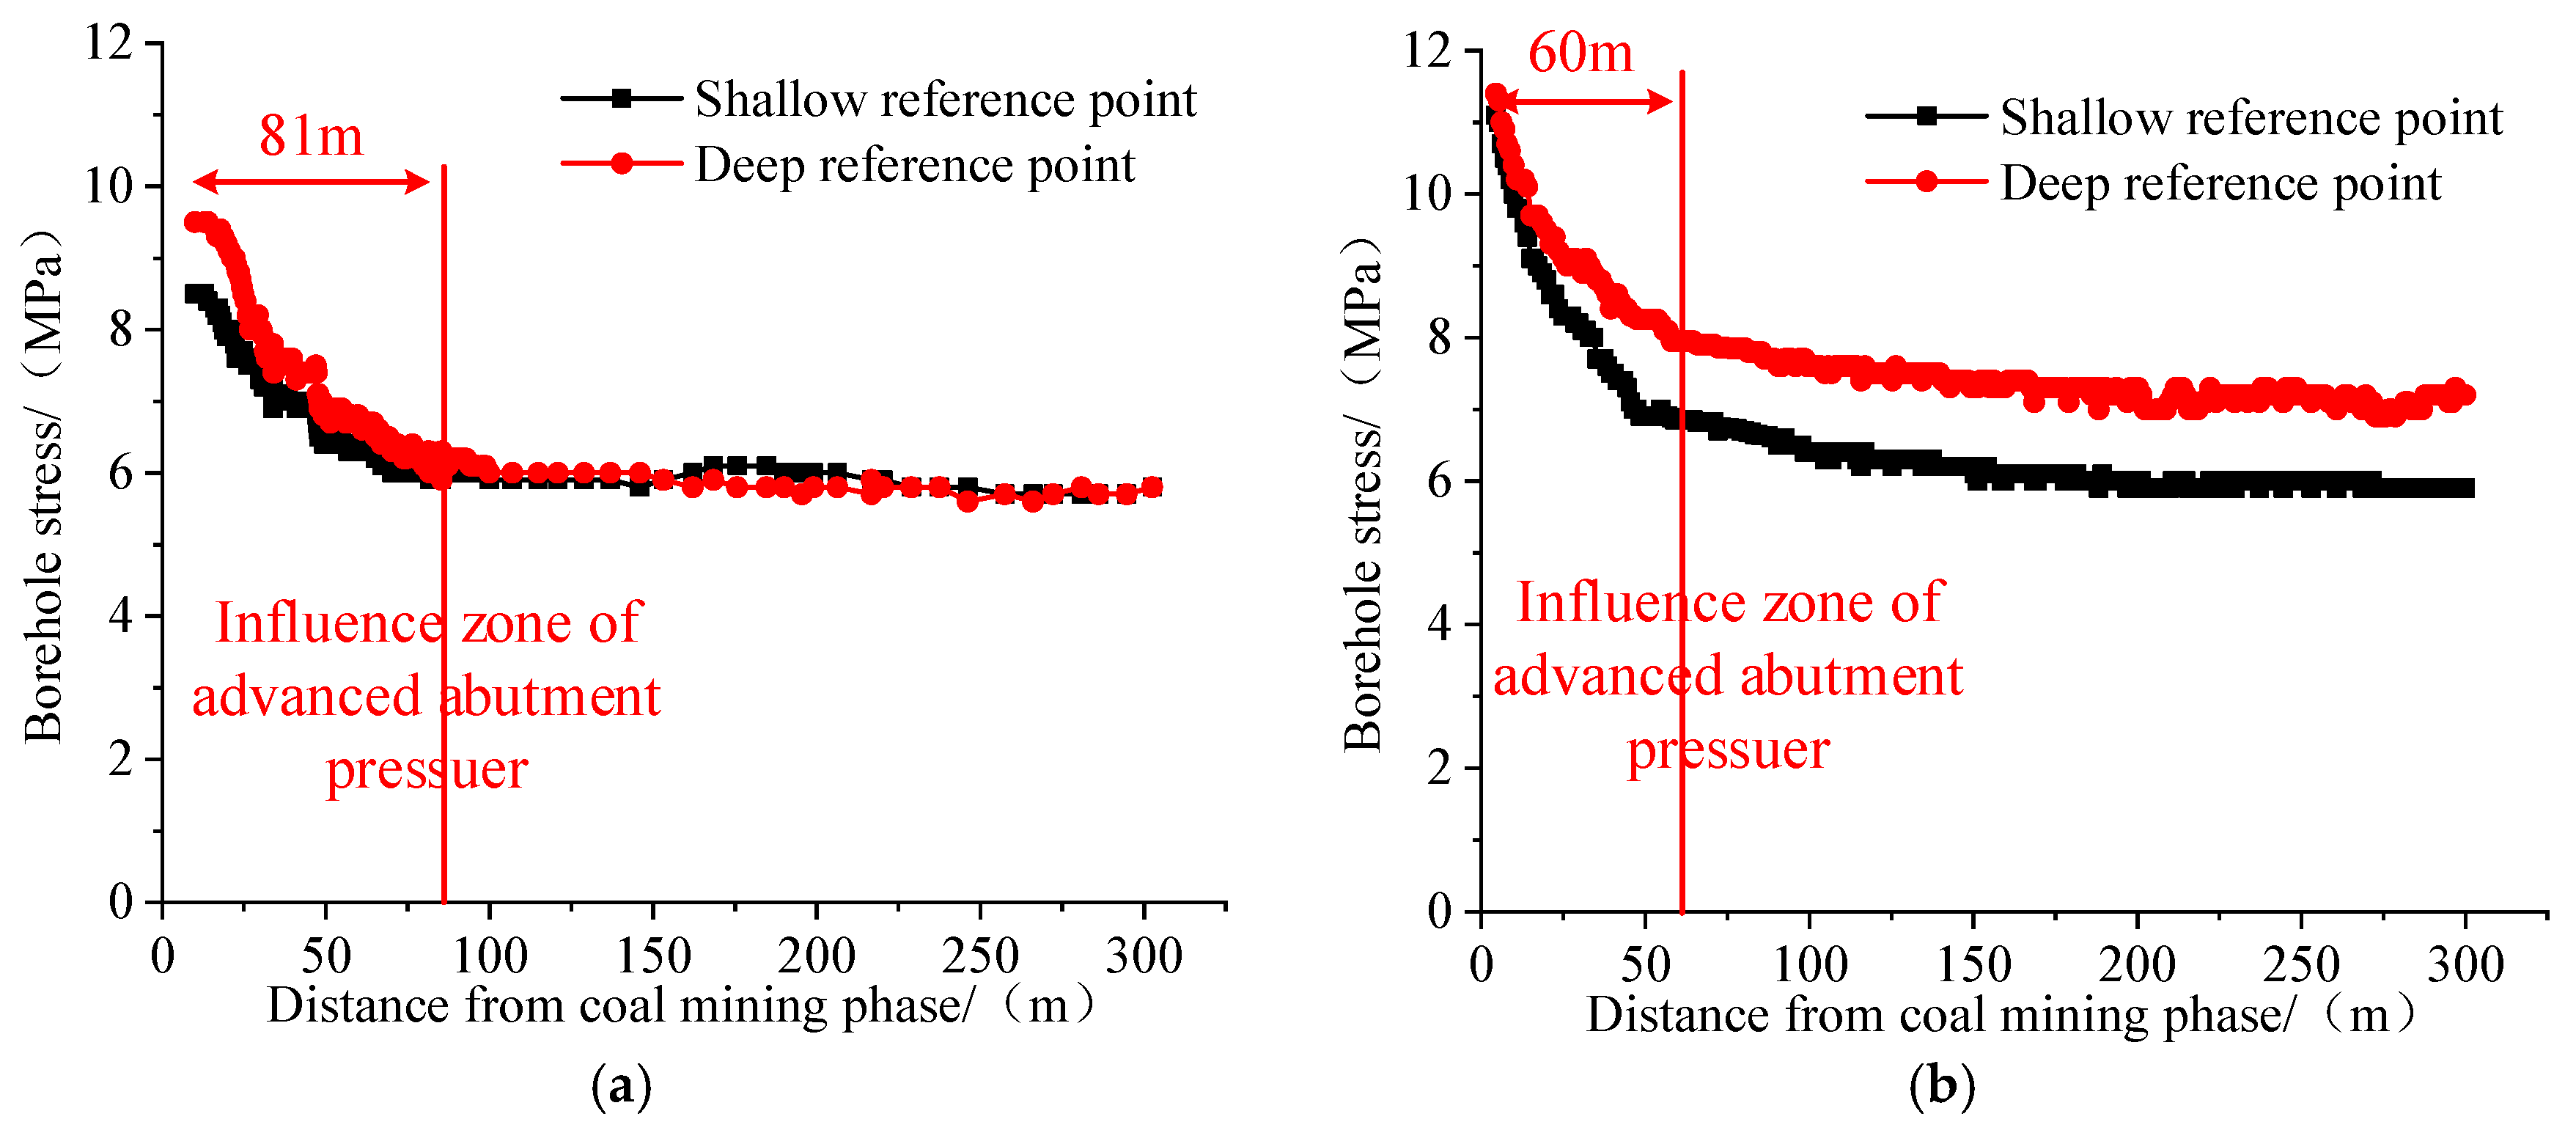
Statistical results of borehole stress data from the 12308 working face are presented in Figure 12 and Figure 13. Comparative analyses were conducted for stress data on both the return entry and belt entry sides, with the derived trend curves summarized in Table 5.
A comparative analysis reveals that under high-speed advancing conditions compared to low-speed operations, the influence range of abutment pressure decreased from 83 m to 61 m (26.5% reduction), while the peak stress magnitude increased by 1.63 MPa (18.1% enhancement). Concurrently, the distance between the peak stress location and the coal wall diminished by 3.4 m (38.6% decrease). These findings collectively demonstrate that three critical abutment pressure characteristics—influence range, peak magnitude, and peak-to-wall distance—are governed by face advancing rate effects.
Specifically, increasing advancing rates induce progressive contraction of the pressure-affected zone, amplify stress concentration magnitudes, and shift peak stress positions toward the coal wall. Field-measured data align closely with theoretical predictions, confirming the consistency between empirical observations and analytical models.

4.3. Numerical Simulation Study of Front Abutment Pressure Under Different Advance Rates

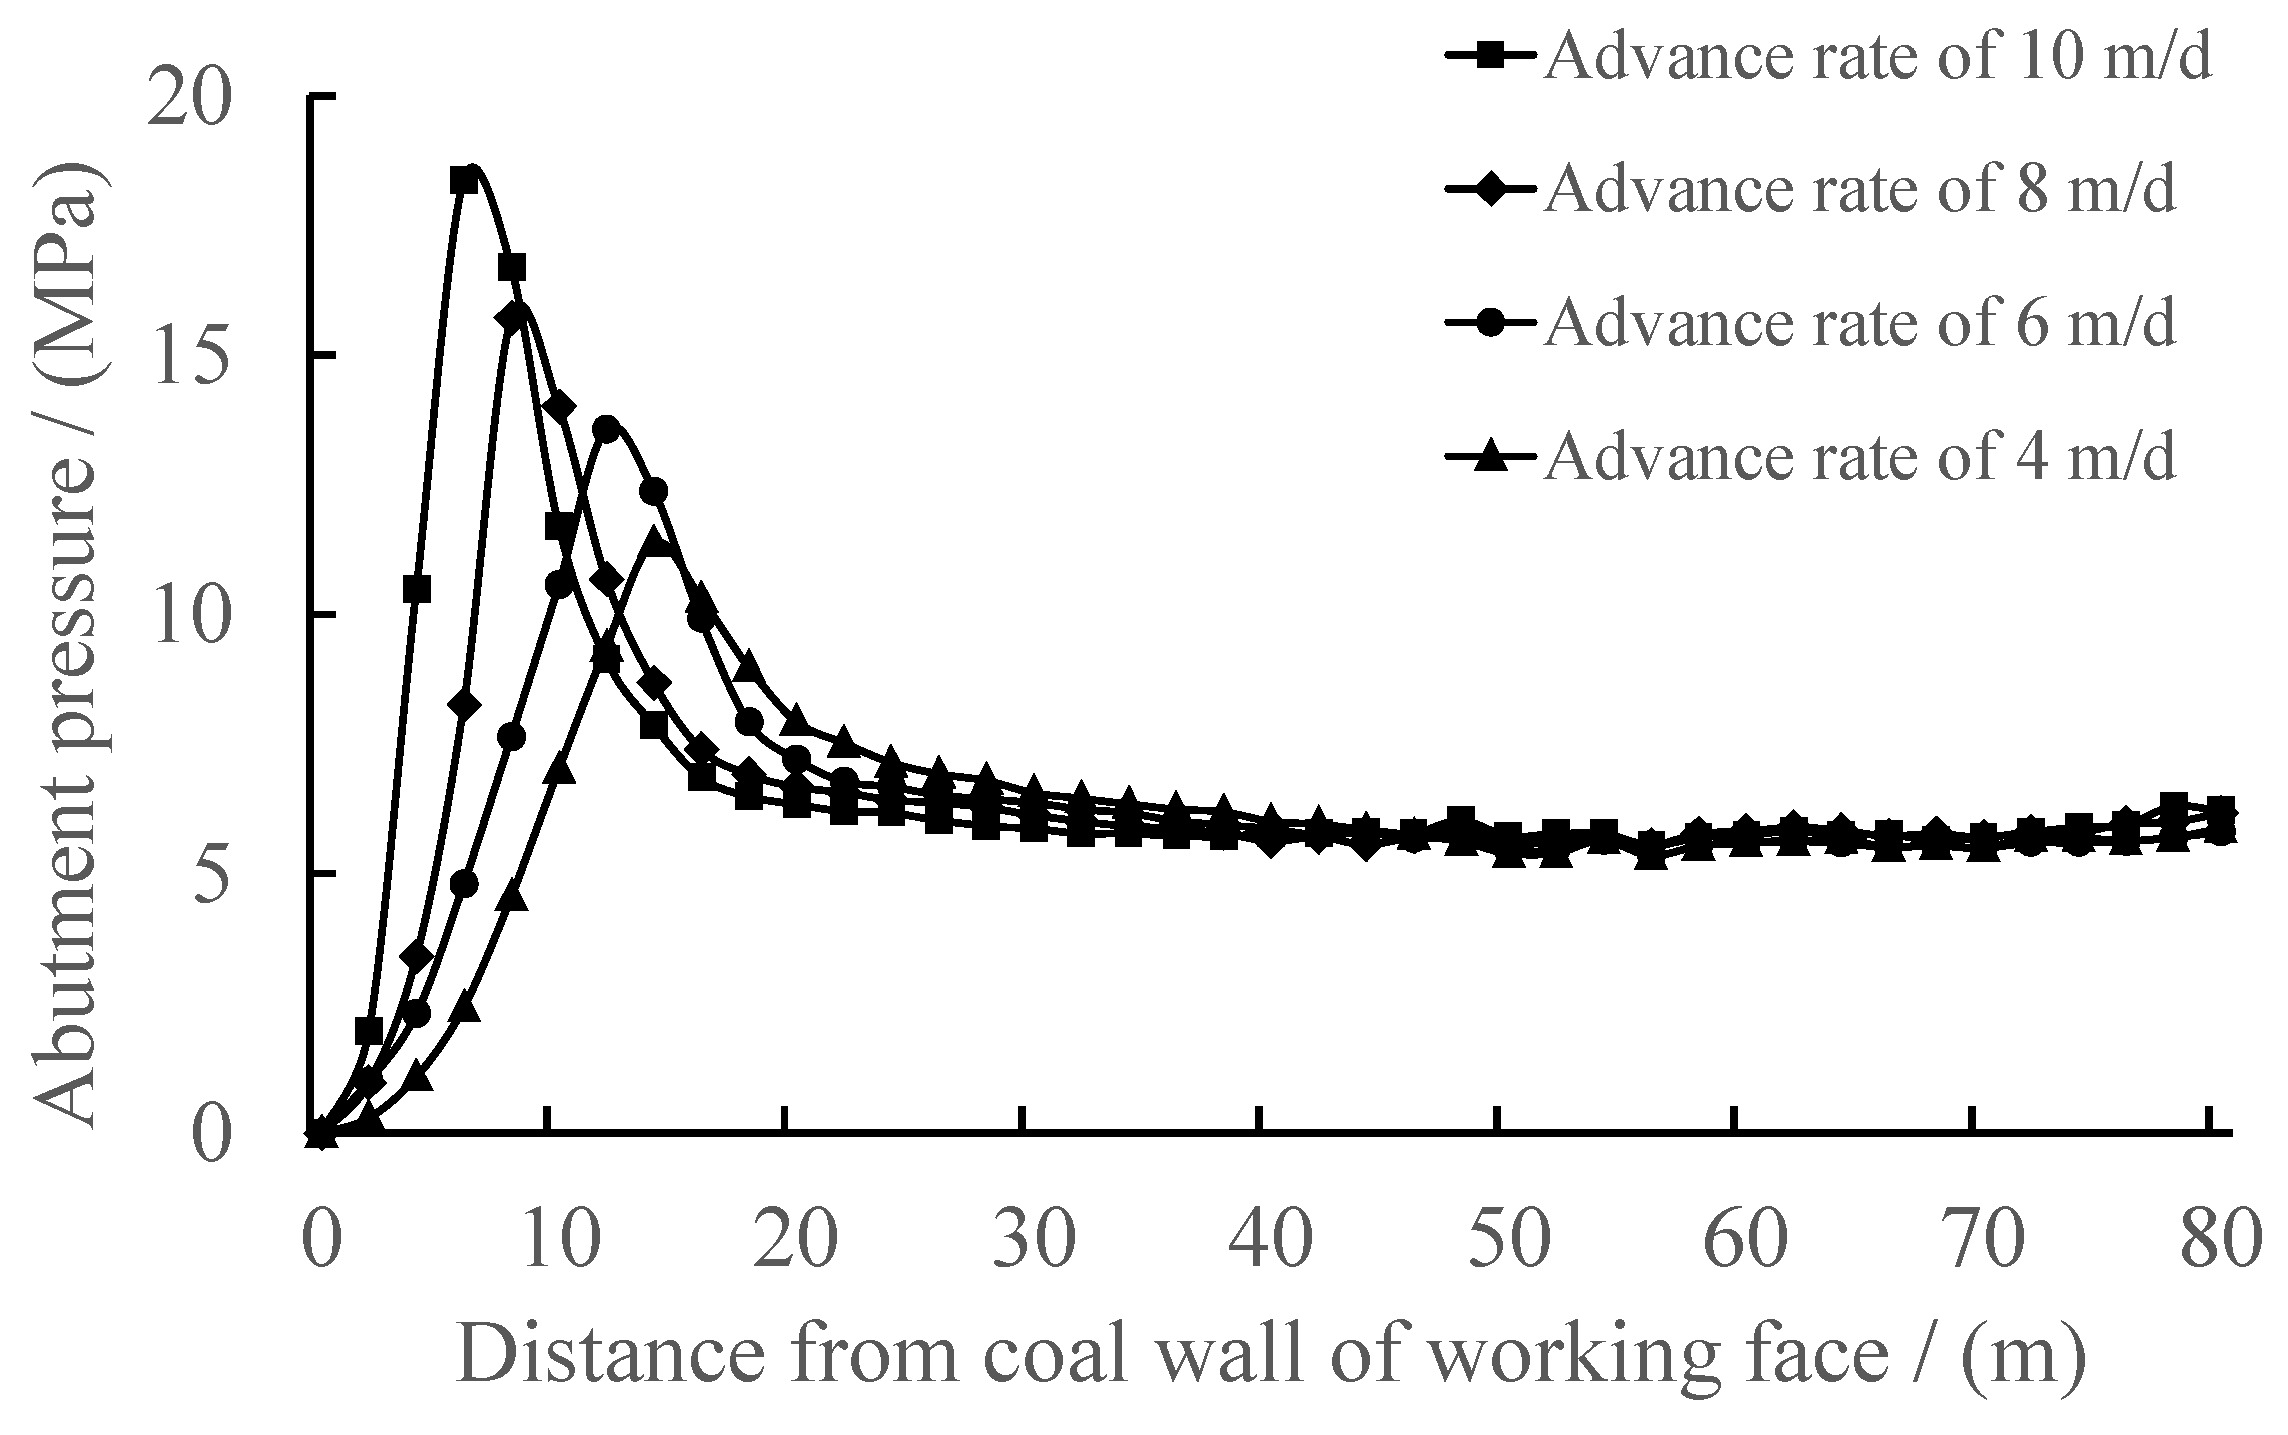
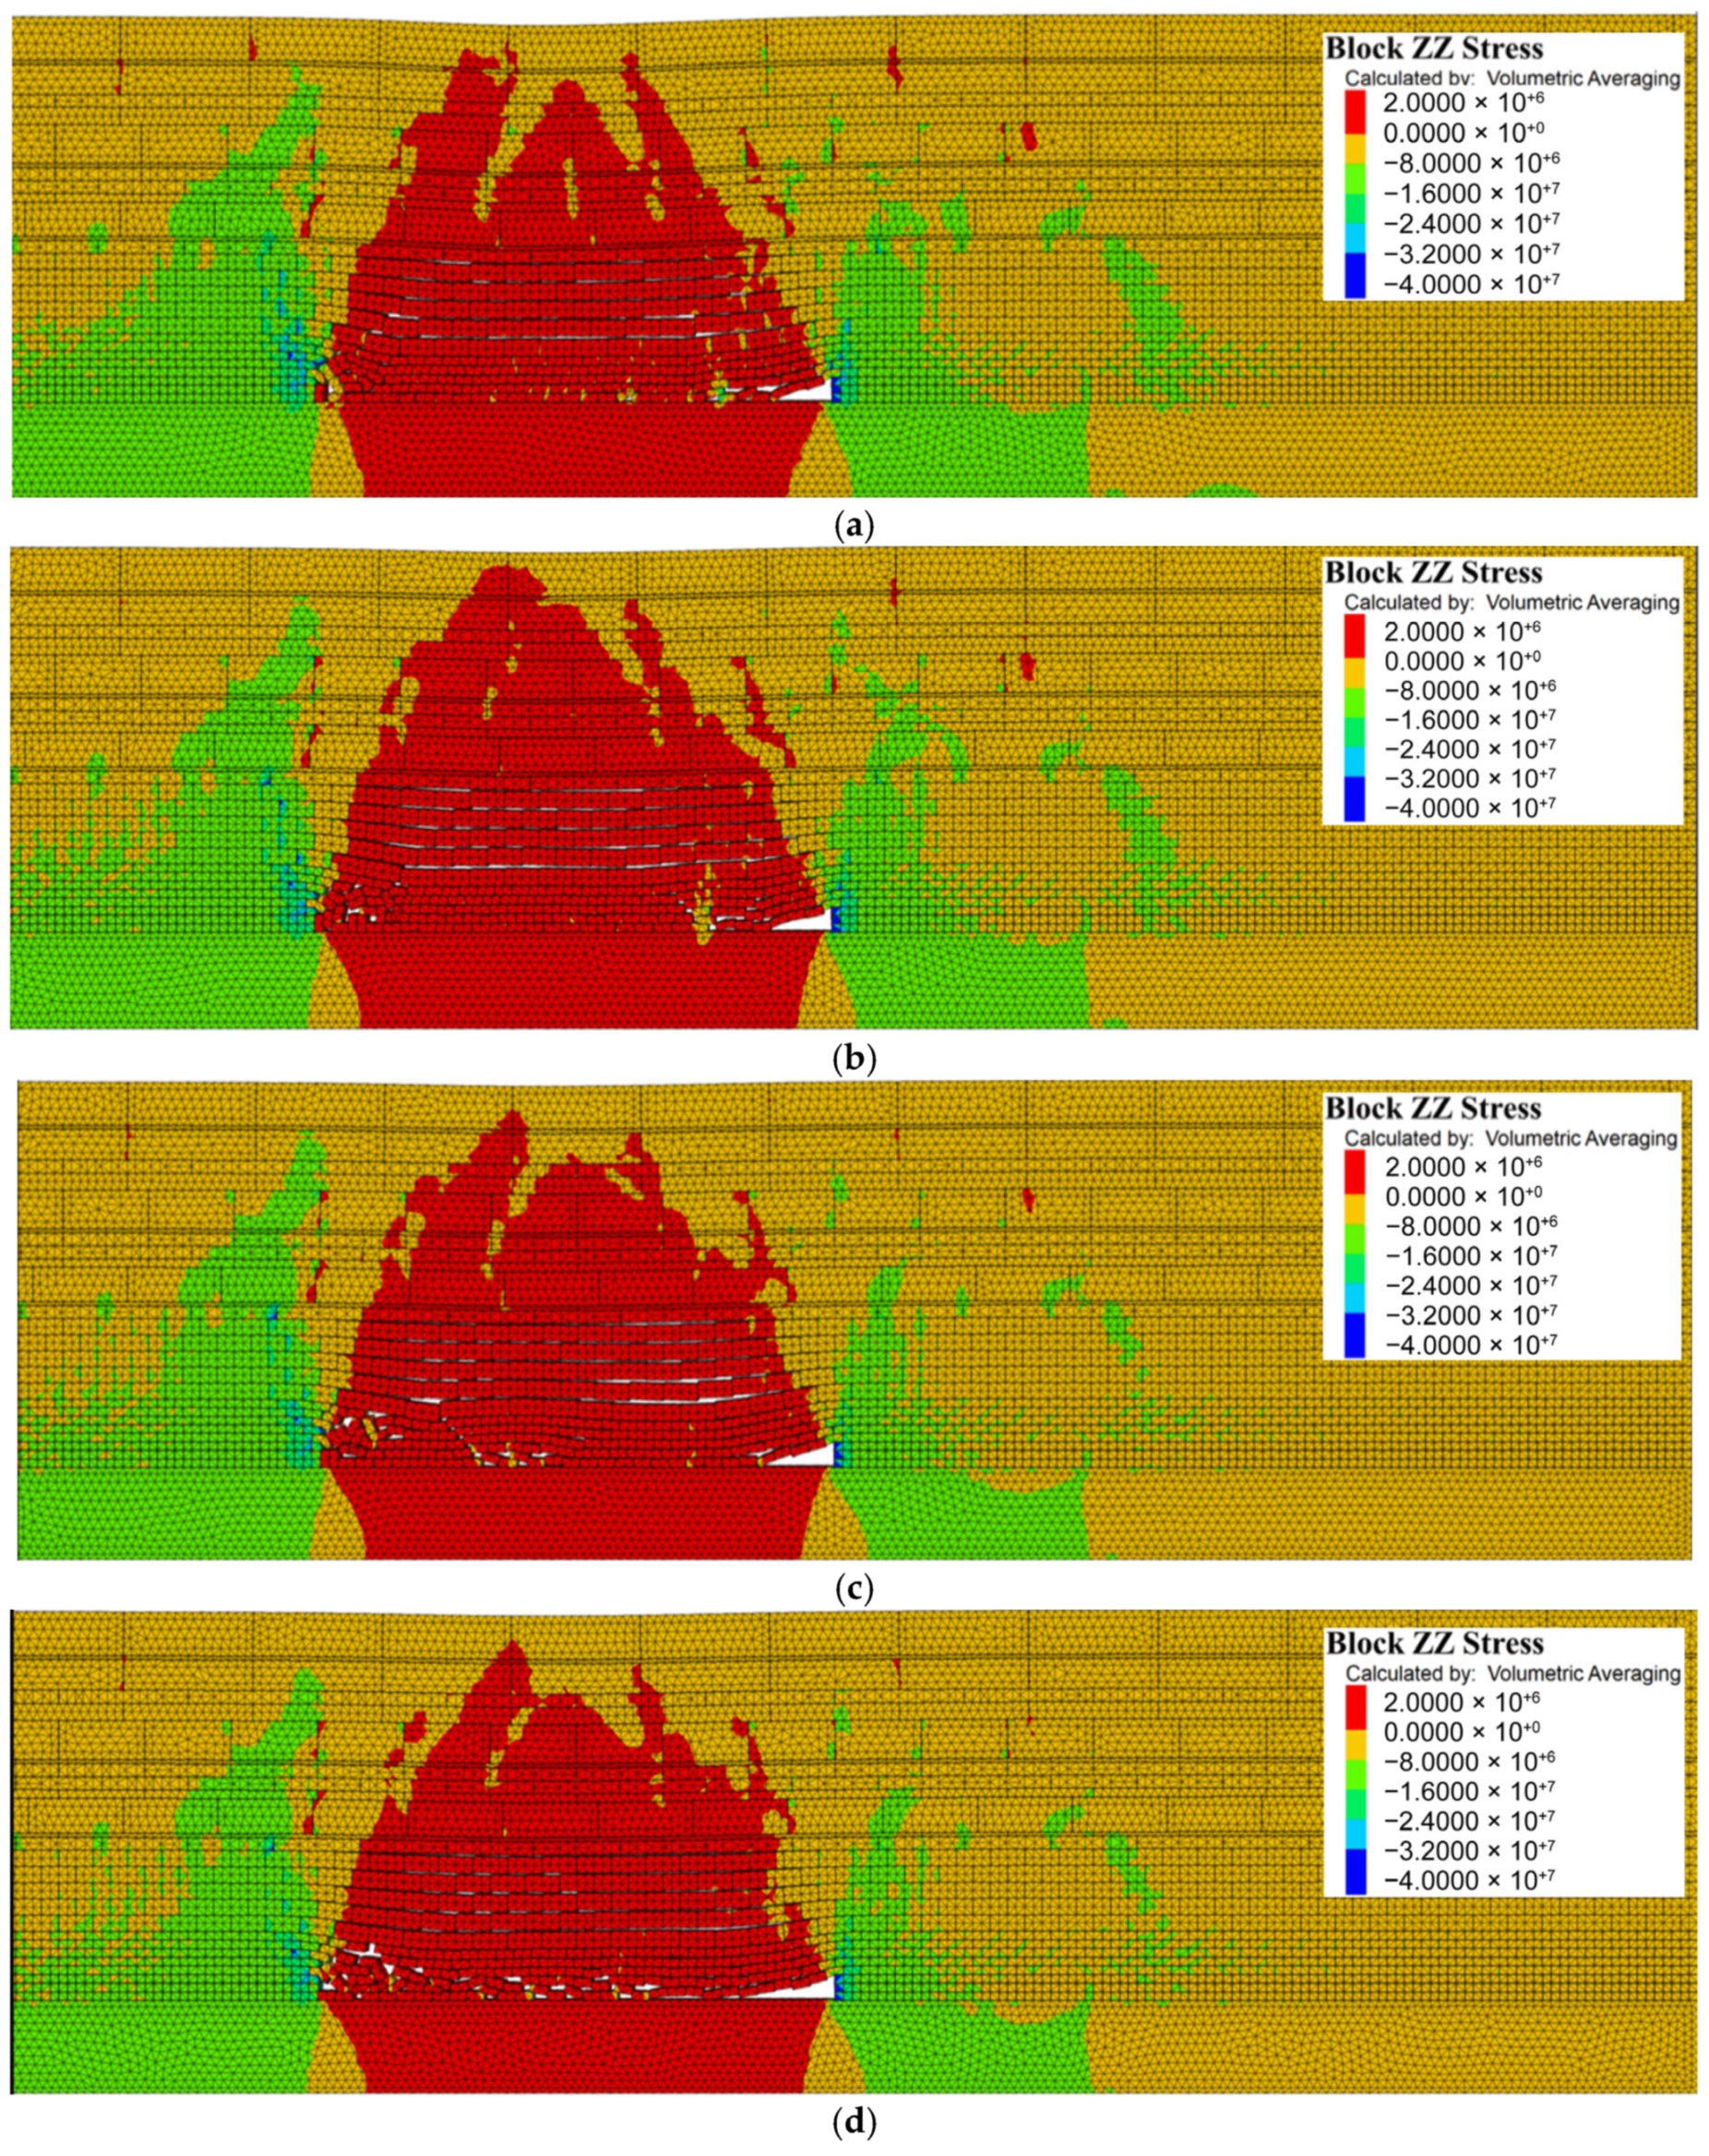
Based on the numerical model established in Section 3.1, in accordance with the actual advance rate variations in the 12308 face, simulations were conducted for a 240 m face advancement under four advance rates: 4 m/d, 6 m/d, 8 m/d, and 10 m/d. To monitor stress evolution in the roof strata during advancement, a pressure monitoring line was installed above the roof. The front abutment pressure curves under different advance rates are shown in Figure 14, while vertical stress distributions are presented in Figure 15.
As can be seen from Figure 14, at 4 m/d, the peak front abutment pressure reached 11.4 MPa, located 14 m ahead of the coal wall. At 6 m/d, the peak pressure increased to 13.5 MPa, with the peak position shifting to 12 m from the coal wall. At 8 m/d, the peak pressure rose to 15.7 MPa, positioned 8 m ahead of the coal wall. At 10 m/d, the peak pressure surged to 18.3 MPa, occurring 6 m from the coal wall.
These results demonstrate that the advance rate significantly governs both the magnitude of peak front abutment pressure and its distance from the coal wall. As the advance rate increases, the peak pressure escalates while its location migrates closer to the coal wall. The simulation outcomes align closely with theoretical predictions and field measurements, validating the consistency of the findings.

5. Effects of Advance Rate on Shield Resistance and Microseismic Event Distribution

5.1. Field Monitoring of Shield Resistance in the 12308 Working Face

Hydraulic supports at the upper, middle, and lower sections of the 12308 longwall face were selectively analyzed to isolate the advance rate as the sole variable. Shield resistance curves from equivalent advancement distances during low-speed (≤4 m/d) and high-speed (≥8 m/d) mining phases were comparatively evaluated, as shown in Figure 16, Figure 17 and Figure 18.
According to the above measured results, the data of the upper, middle, and lower brackets are analyzed and summarized, as shown in Table 6 below.
The comparative analysis clearly demonstrates that during low-speed mining, the periodic weighting parameters average 12.3 cycles in frequency, 10.3 m in interval, and 14,226.7 kN in intensity. Upon transitioning to high-speed mining, the periodic weighting frequency decreases to 8.7 cycles (Δ = −3.6 cycles), while the weighting interval increases to 15.1 m (Δ = +31.8%). The weighting intensity exhibits a marginal rise to 14,332.2 kN (Δ = +1%), indicating negligible enhancement.
These findings confirm that increased advance rates reduce periodic weighting frequency while moderately extending intervals, with negligible impact on intensity.

5.2. Field Monitoring of Microseismic Event Distribution in the 12308 Working Face

During the advancing process of Panel 12308, the KJ768 microseismic monitoring system was deployed to monitor and warn against rockburst hazards. When internal stresses exceed local strength limits in rock masses during mining or geological activities, microscopic fracturing (e.g., crack propagation, grain boundary slip) occurs, releasing elastic strain energy. This energy propagates as elastic waves (P-waves and S-waves), forming microseismic events. The KJ768 system detects these elastic wave signals to invert fracture locations, energy magnitudes, and rock mass damage levels.
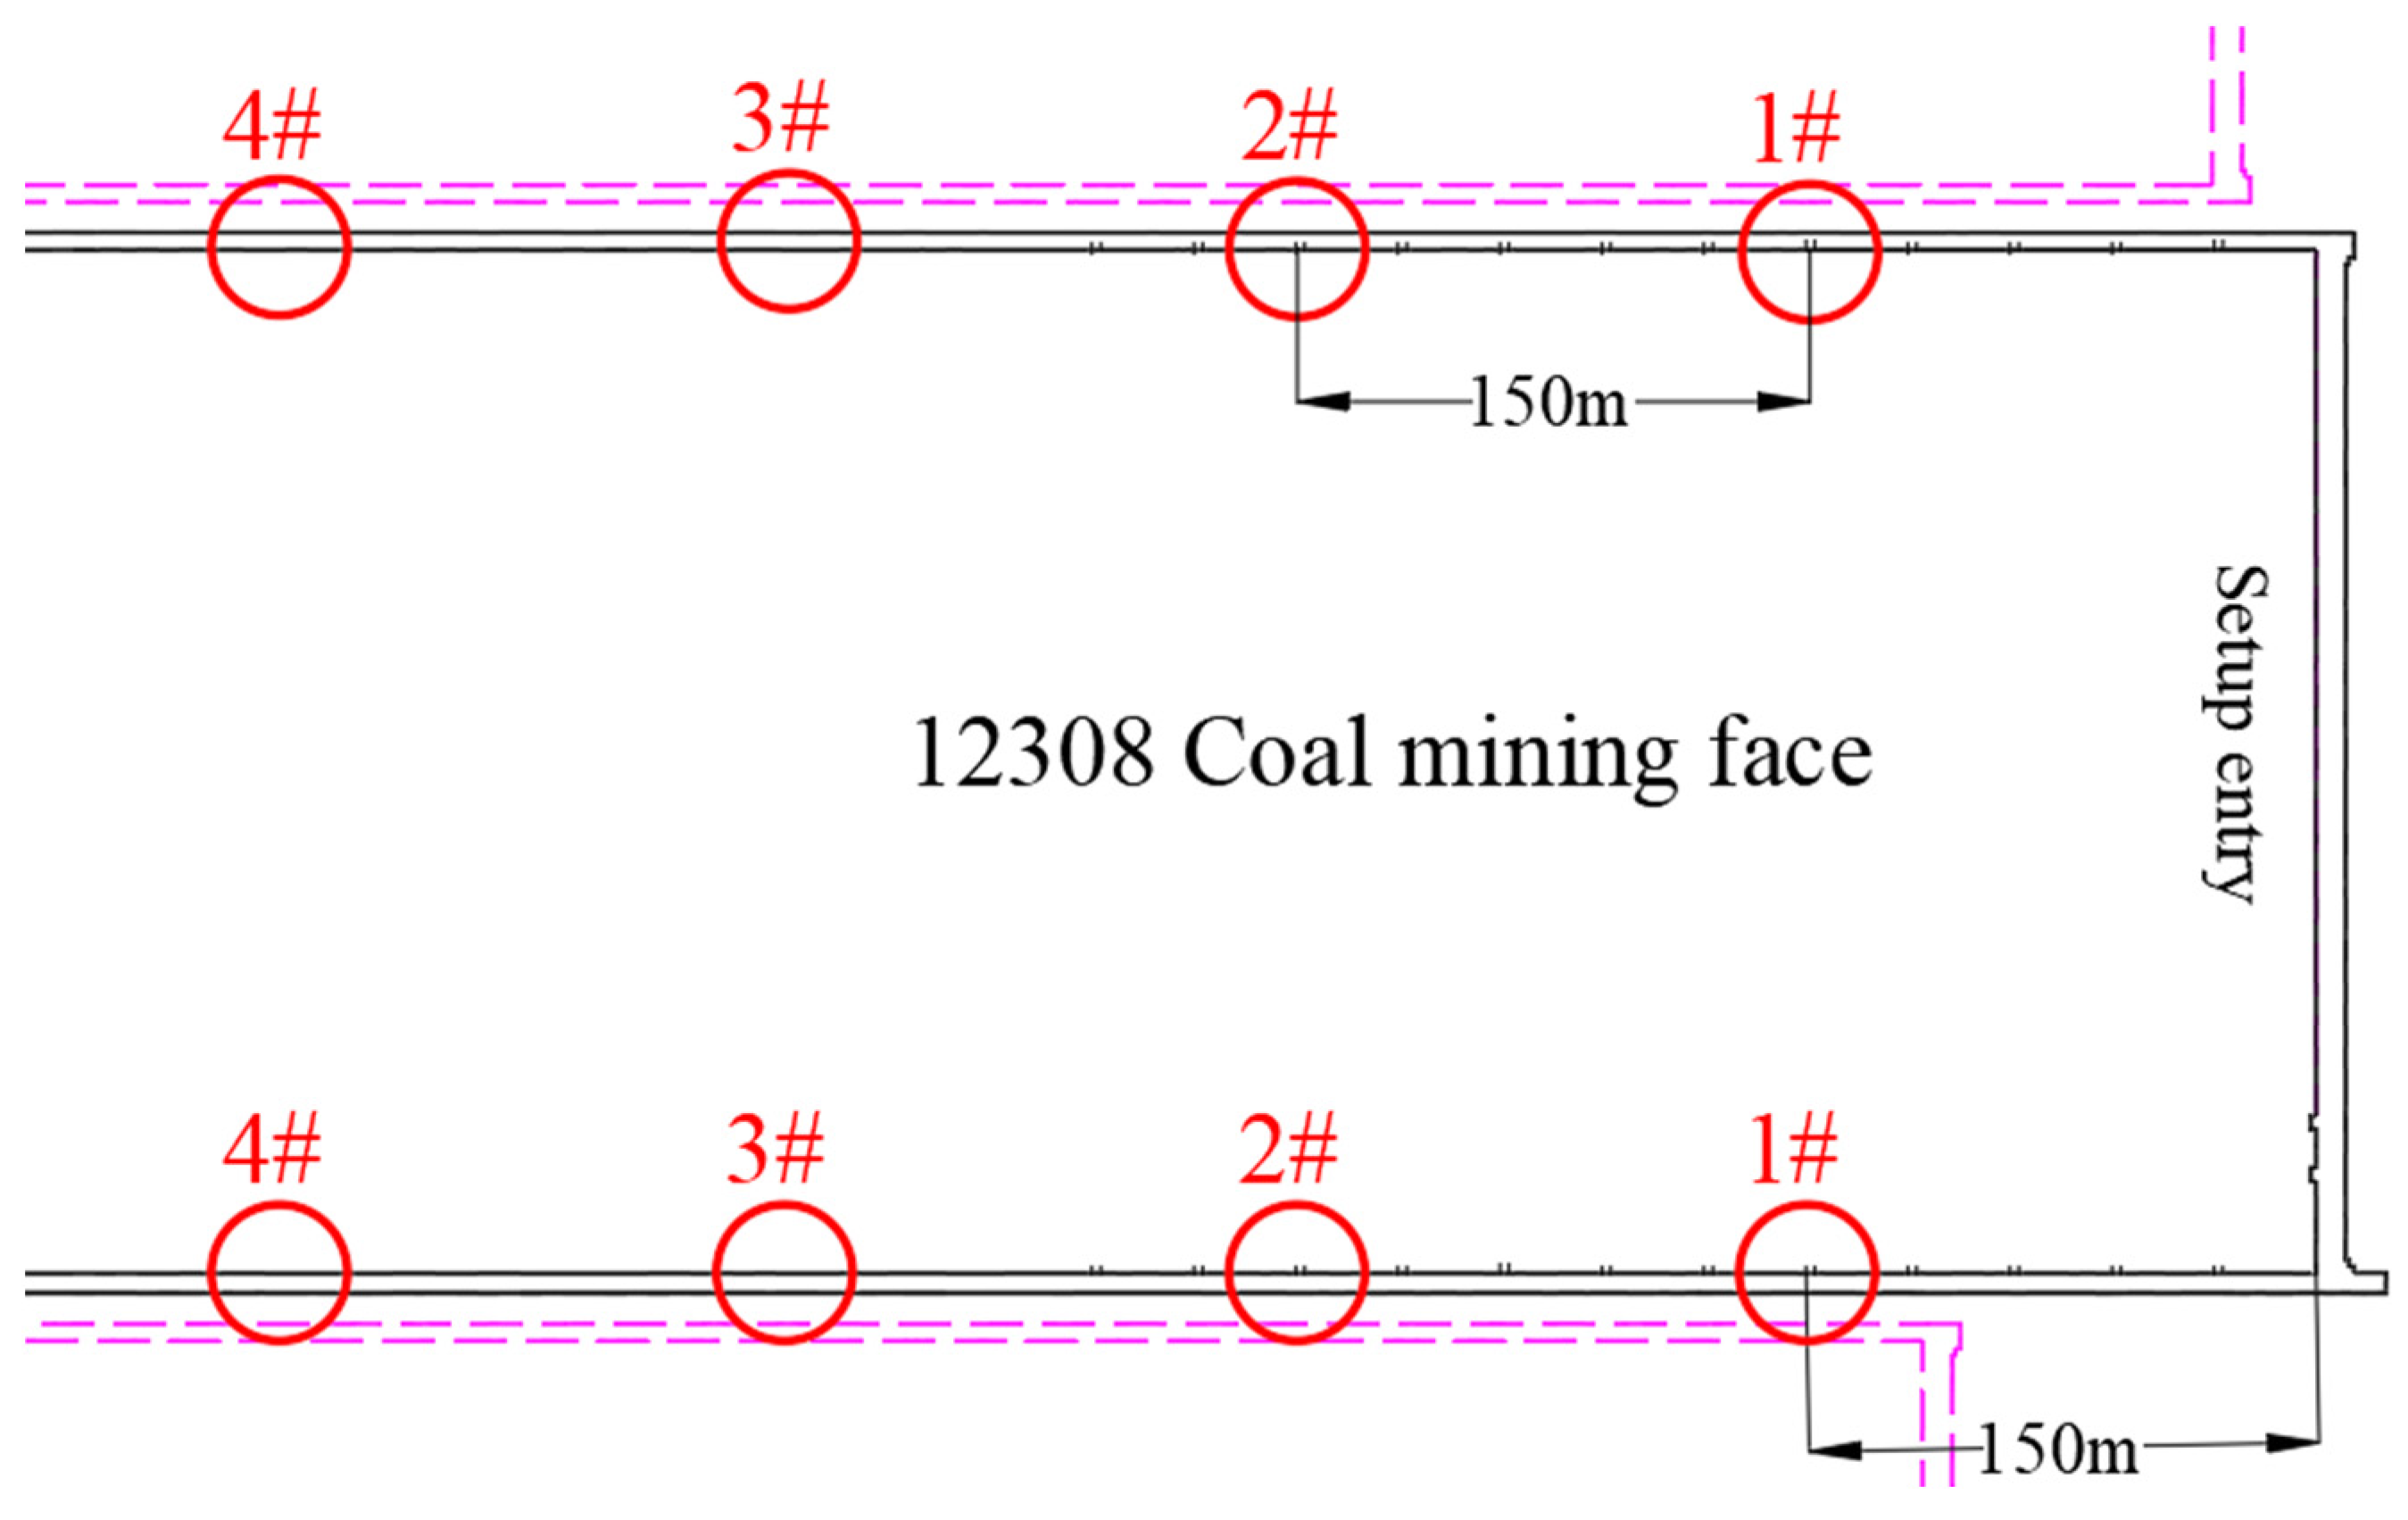
The layout of microseismic monitoring points is shown in Figure 19. The system configuration includes two microseismic monitoring substations, eight geophones, and ancillary equipment. One substation was installed in the power supply chamber of the 12308 belt entry and the other at the entrance of the 12308 return airway. Sensor groups were arranged as follows: Starting 150 m outward from the open-off cut along the belt entry and return airway, the first group of monitoring points was deployed. Four sensor groups were installed in the belt entry (on the non-mining side), with a spacing of 150 m between each group. Similarly, four sensor groups were installed in the return airway (on the mining side), also spaced 150 m apart. As the working face advanced to approximately 40 m ahead of the first sensor group, additional sensor groups were added in both entries. Data signals were transmitted from underground substations to the surface ground pressure monitoring room, enabling 24 h continuous monitoring.
Microseismic events during mining were classified using maximum energy (Emax) and peak frequency as critical thresholds to distinguish between rockburst-free and rockburst-prone conditions. The microseismic early-warning classification is detailed in Table 7.
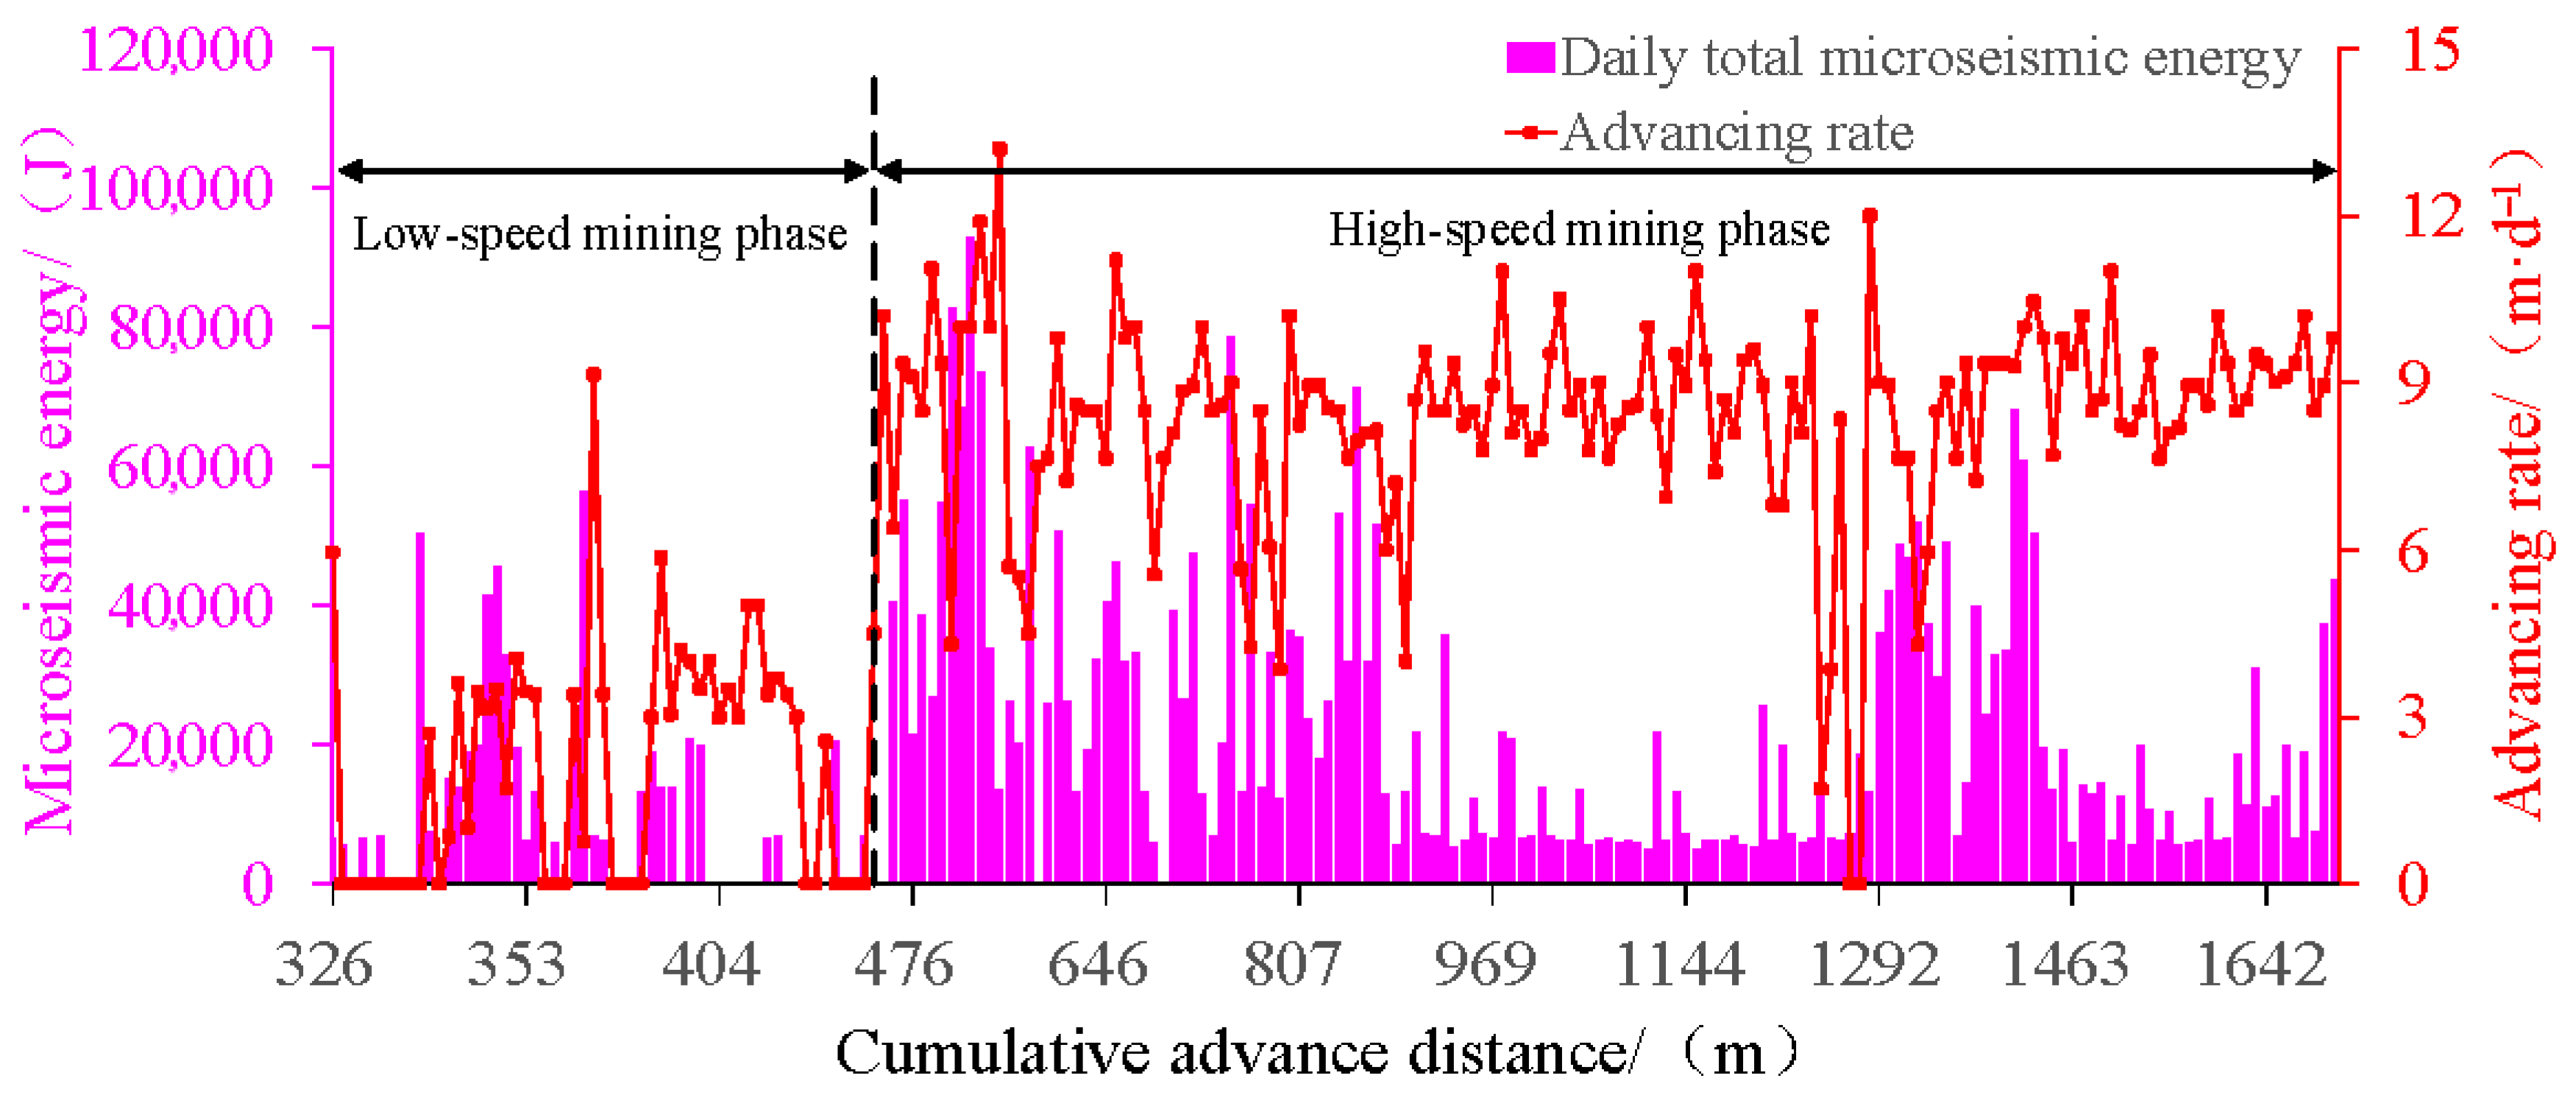
Integrated with actual field production activities, the correlation diagrams between the daily face advancing rate, daily microseismic event frequency, and daily total microseismic energy at Panel 12308 are presented in Figure 20 and Figure 21, categorizing microseismic behaviors into low-speed and high-speed advancing phases.
Analysis of the data presented in Figure 20 and Figure 21 reveals the following outcomes: During the low-speed advancing phase, a total of 82 microseismic events were recorded, averaging 1.4 events per day, while the high-speed advancing phase exhibited 502 microseismic events, averaging 3.4 events per day. The cumulative energy of microseismic events during the low-speed phase measured 5.46 × 10⁵ J, with a daily average energy of 9.4 × 10³ J, whereas the high-speed phase demonstrated a significantly higher cumulative energy of 3.33 × 10⁶ J and a daily average energy of 2.2 × 10⁴ J. Comparative characteristics of microseismic event distribution patterns across different advancing phases are systematically summarized in Table 8.
As evidenced by the comparative analysis presented in Table 8, a statistically significant correlation exists between mining advance rates and microseismic activity. Specifically, accelerated mining advance rates are associated with increased frequency of microseismic events (142.9% higher in high-speed mining phases compared to low-speed phases) and elevated cumulative energy release (134% increase). However, the maximum single-event energy release remains largely unaffected by variations in advance rates, with no occurrence of large-energy events.

6. Dynamic Regulation Evaluation Methodology for Strata Pressure Manifestations

Microseismic events are phenomena characterized by the release of elastic waves resulting from localized fracturing due to stress imbalance within rock masses. Their intrinsic nature reflects the dynamic process of energy accumulation and release in coal–rock masses under mining-induced disturbances [24]. Microseismic monitoring evaluates rock mass stability by detecting elastic waves generated by internal microfractures. Through real-time acquisition of elastic wave signals triggered by microfractures, microseismic monitoring systems quantitatively characterize the spatiotemporal evolution of mining-induced stress fields. Microseismic events arise from the coupled effects of mining-induced stress redistribution, overburden deformation, and caving [25]. Given the real-time capability of microseismic monitoring, utilizing multidimensional parameters (event frequency, energy release rate) as the primary basis for face advancing rate adjustment demonstrates scientific validity and technical rationality.
Microseismic daily energy and event frequency serve as primary indicators for dynamic regulation. By analyzing their temporal variations, anomalies during advancement can be identified. For granular phase-specific analysis, mining operations were categorized as follows:
(1)
Low-speed phase: Cumulative advancement = 126 m;
(2)
High-speed steady phase: Cumulative advancement = 742 m;
(3)
High-speed unsteady phase: Cumulative advancement = 508 m (total high-speed advancement = 1250 m).
Microseismic energy data were statistically analyzed using 10 kJ/d intervals to calculate the percentage distribution across energy ranges, as shown in Figure 22. The results indicate that during the low-speed advancing phase and high-speed steady advancing phase, microseismic energy predominantly fell within the 0–20 kJ/d range, exhibiting regular distribution patterns dominated by low-energy, high-frequency events. In contrast, the high-speed unsteady advancing phase displayed microseismic energy concentrated in the 10~20 kJ/d (20.9%), 30~40 kJ/d (19.4%), and >50 kJ/d (20.9%) ranges, demonstrating significant energy dispersion and fluctuation. Cumulative statistics of microseismic energy intervals (10 kJ/d increments) are presented in Figure 23. The cumulative energy distribution for the low-speed and high-speed steady phases followed an approximate curvilinear trend, while the high-speed unsteady phase exhibited an approximate linear cumulative increase.
Cumulative energy analysis using 10 kJ/d intervals (Figure 22) reveals the following: (1) Low-speed and high-speed steady phases: Cumulative energy follows a near-curvilinear ascending trend. (2) High-speed unsteady phase: Cumulative energy exhibits a near-linear ascending pattern.
Based on Figure 23, 40 kJ/d is established as the critical threshold for the low-speed phase, serving as a microseismic energy-based production-limiting criterion. Due to the absence of a valid threshold in the unsteady phase, 50 kJ/d from the high-speed steady phase is adopted as the corresponding threshold for high-speed operations. When thresholds are breached, the advance rate is reduced by two cutting cycles/d (equivalent to ~1.2 m/d) until energy stabilizes.
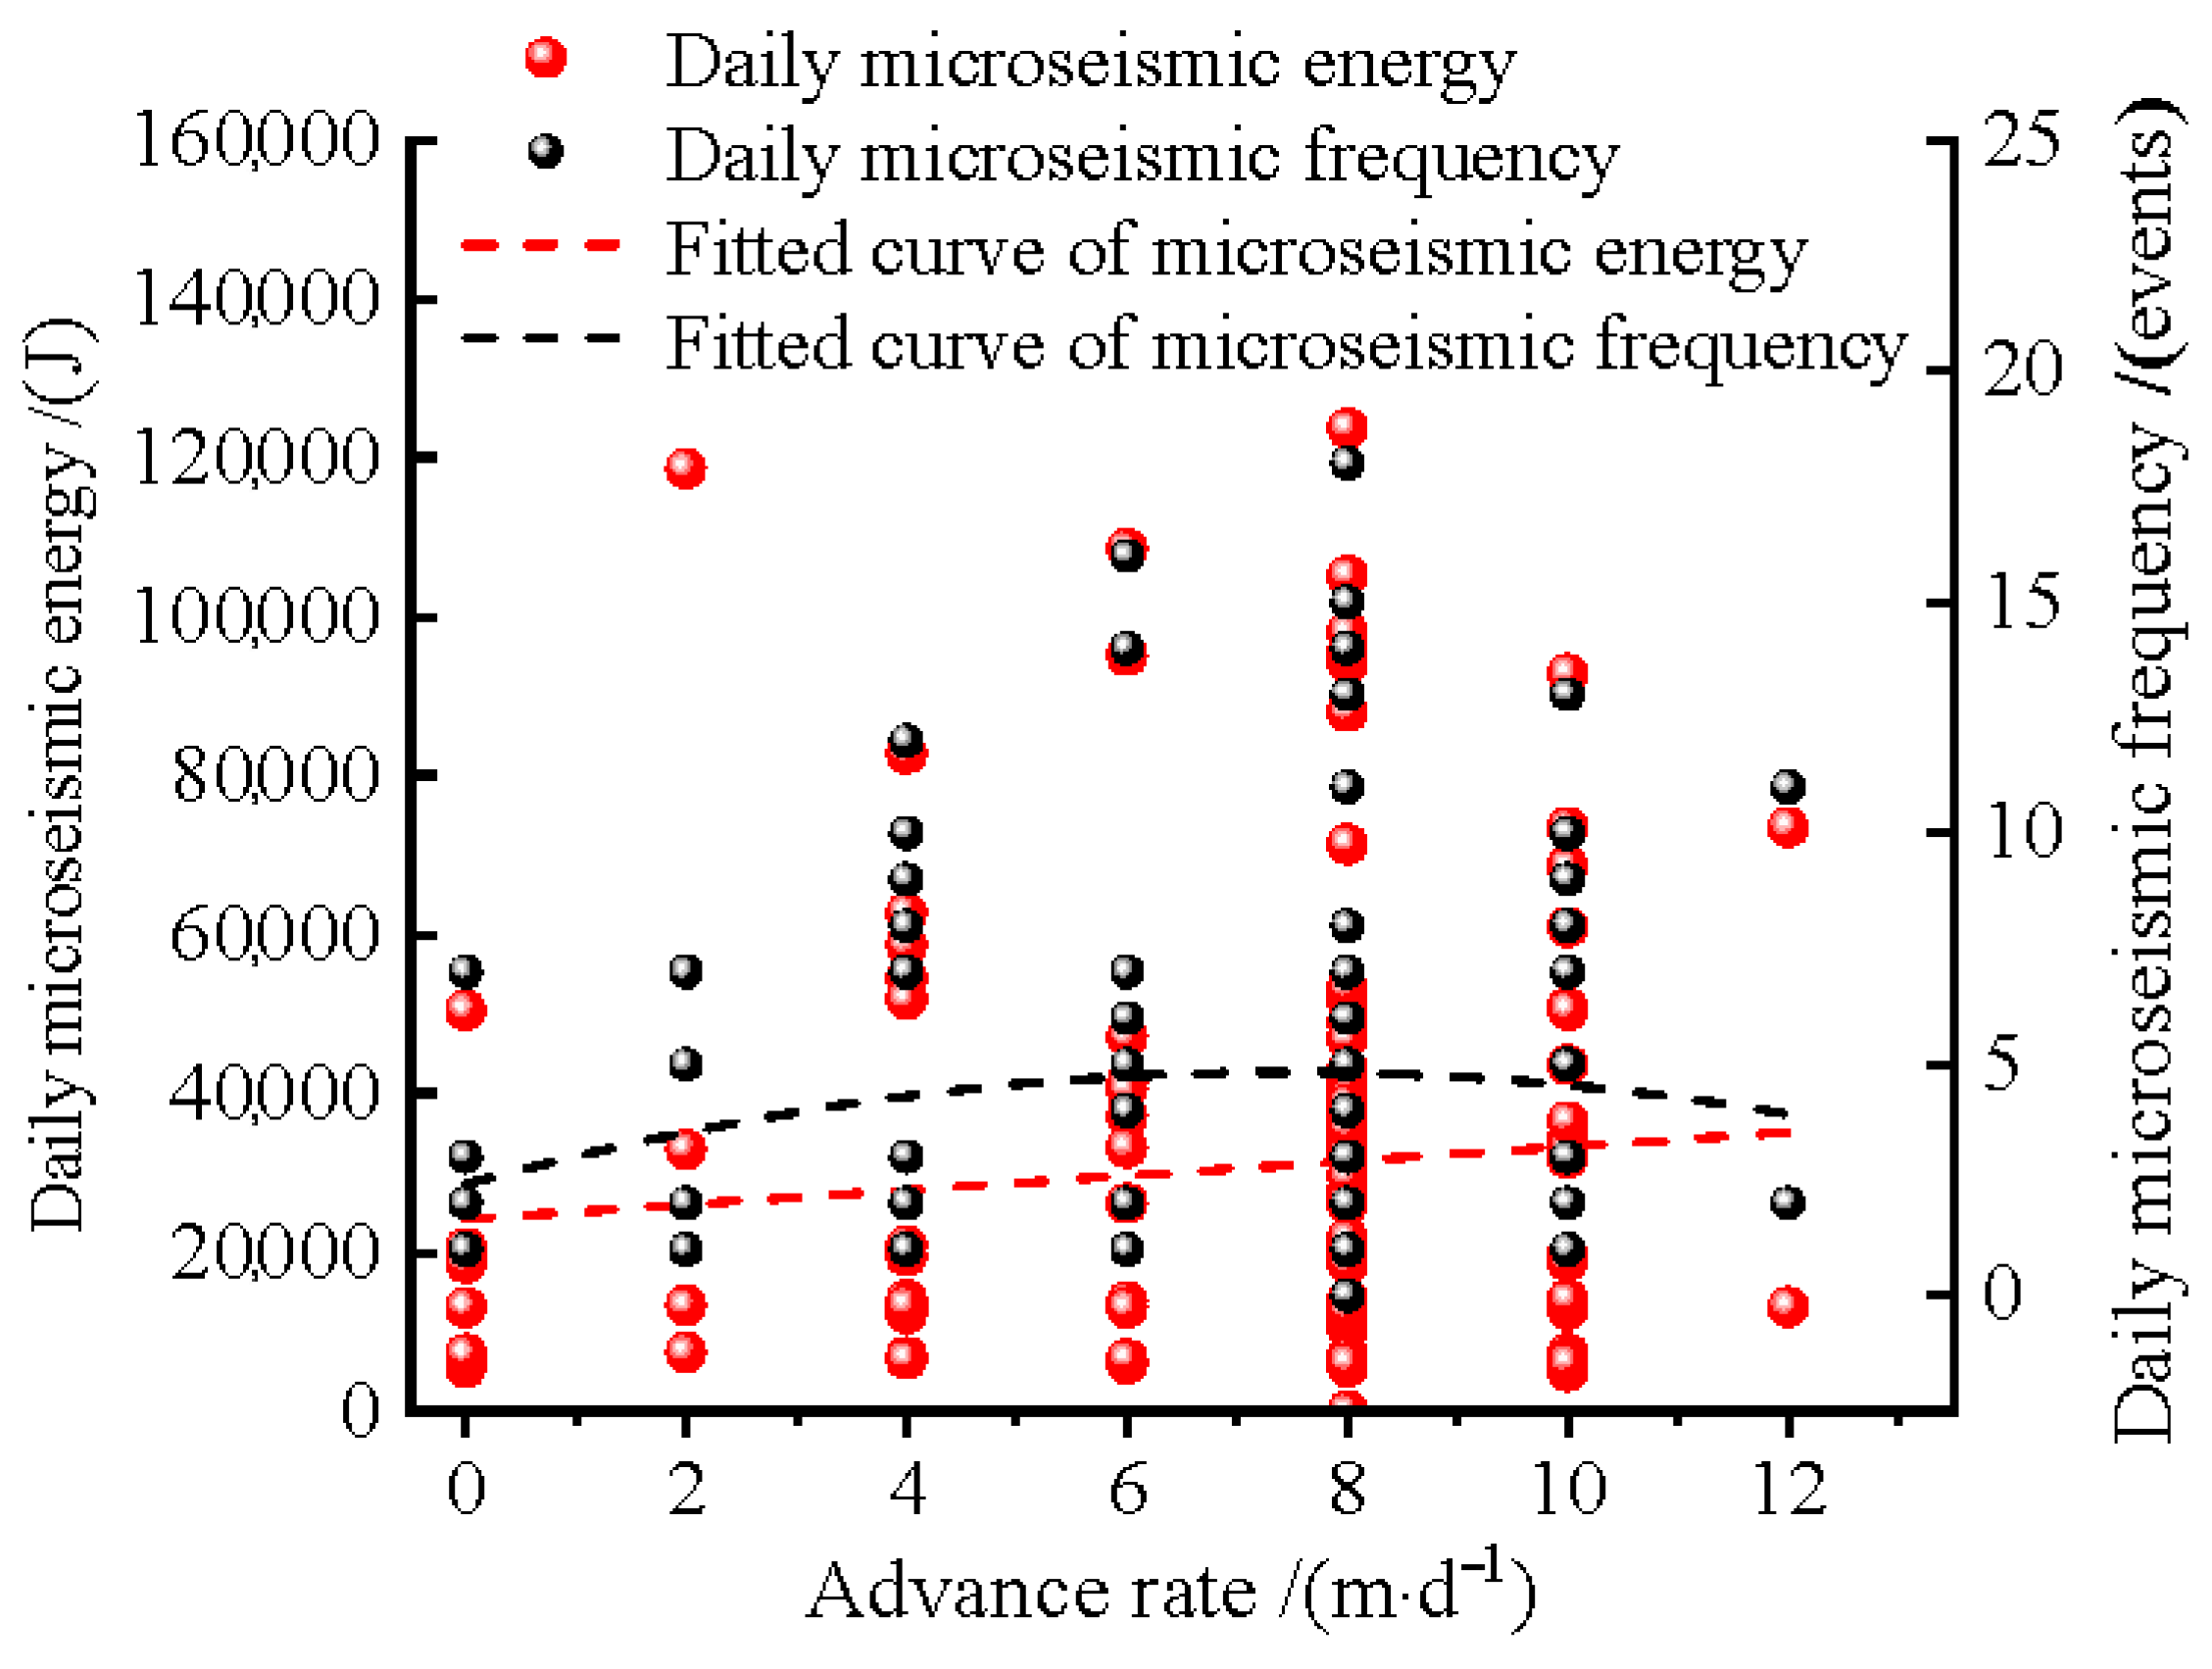
To conduct a more precise analysis of microseismic energy variations under different mining advance rates, the relationship between daily total energy and event frequency was extracted from the dataset in Figure 20 and Figure 21 for specific advancement velocities of 0 m/d, 2 m/d, 4 m/d, 6 m/d, 8 m/d, 10 m/d, and 12 m/d. The statistical compilation of these extracted correlations is systematically presented in Figure 24.
The statistical regression model correlating mining advance rates with daily cumulative microseismic energy release, derived from scatter data analysis, is mathematically expressed as
y 1 = 908.366 v s + 24195.43
The scatter plot-derived empirical formula characterizing the correlation between mining advance rates and daily microseismic event frequency is mathematically defined as
y 2 = 0.04384 v s 2 + 0.65306 v s + 2.40326
As evidenced by the analytical results presented in Figure 24, the mining advance rate demonstrates a linear correlation with daily cumulative microseismic energy release while exhibiting a nonlinear relationship with daily microseismic event frequency. Notably, when the working face advance rate exceeds 6 m/d, a distinct decline in microseismic event frequency is observed, accompanied by a stabilization of energy–frequency coupling dynamics.
The daily single-event microseismic energy Ew is employed to assess the influence of the face advancing rate vs. on strata pressure manifestations, expressed as E w = y 1 / y 2 , where y 1 represents the functional relationship between the daily total microseismic energy and advancing rate, and y 2 denotes the correlation between the daily microseismic event frequency and advancing rate. This formulation thus establishes the mathematical relationship between the daily single-event microseismic energy Ew and face advancing rate vs:
E w = 908.366 v s + 24195.43 0.04384 v s 2 + 0.65306 v + 2.40326
Higher single-event microseismic energy values correlate with an increased likelihood of inducing strata pressure manifestations. This causal relationship is graphically represented in Figure 25, which illustrates the correlation curve between the face advancing rate and single-event microseismic energy.
As illustrated in Figure 25, the daily single-event microseismic energy attains its minimum value at an advance rate of 6 m/d, corresponding to a reduced probability of high-energy events. When the advance rate falls below 6 m/d, the energy released per microseismic event exhibits a linear increasing trend. Conversely, at advance rates exceeding 6 m/d, the single-event energy demonstrates a nonlinear growth pattern. From the perspective of microseismic energy optimization, the most rational advance rate for the 12308 working face is determined to be 6 m/d.
Based on the case conditions of this study, the optimal excavation rate of 6 m/d can serve as a preliminary recommended value. However, in practical applications, it should be dynamically adjusted according to the engineering context. For instance, if the roof strata exhibit high joint density or the mudstone contains elevated water content, the excavation rate should be reduced to prevent roof instability.
The aforementioned regulation methodology has been implemented at the Hongqingliang Coal Mine. This approach not only effectively confines strata pressure manifestations within safe and rational thresholds but also ensures consistent production output. Furthermore, it provides actionable guidance for strata pressure control, achieving a 73% reduction in support yield incidents and maintaining shield resistance within 92~98% of the rated capacity (15,000 kN) during high-speed phases.

7. Main Conclusions

(1)
Research on roof caving intervals under different advancing rates reveals that both the initial caving interval of the immediate roof and the first weighting interval of the main roof exhibit dependence on advancing rates. Specifically, these intervals increase progressively with higher advancing rates.
(2)
Through the establishment of a mechanical model for overburden fracture structures, combined with theoretical analysis, field measurements, and numerical simulations, it is demonstrated that abutment pressure ahead of the working face correlates significantly with advancing rates. Increasing advancing rates reduce the influence range of abutment pressure while amplifying its peak magnitude and shifting the peak location toward the coal wall.
(3)
An investigation into support resistance under varying advancing rates indicates a clear relationship between the periodic weighting interval of the main roof and advancing rates. Transitioning from low-speed (e.g., 4 m/d) to high-speed advancing (e.g., 10 m/d) increases the periodic weighting interval by 31.8% and intensifies the weighting magnitude by 1%.
(4)
Microseismic activity demonstrates a distinct advancing rate effect. Both the daily microseismic event frequency and cumulative energy escalate with increasing advancing rates. During high-speed advancing phases, the average daily event counts rise from 1.4 events/d to 3.4 events/d, while daily energy increases from 9.4 × 10³ J to 2.2 × 10⁴ J, representing a 59.3% enhancement.
(5)
A critical threshold of 40 kJ/d is established as the production-limiting criteria for microseismic energy during low-speed advancing phases. Similarly, 50 kJ/d serves as the critical threshold for high-speed phases. Upon reaching these thresholds, strategic reduction in advancing rates is recommended, specifically by reducing daily advance distance by two cutting cycles.
(6)
A dynamic control methodology for strata pressure manifestations is proposed, centering on advancing rate optimization. By analyzing the relationship between single-event microseismic energy release and advancing rates, the optimal advancing rate for Panel 12308 is determined as 6 m/d, which was validated through practical applications.

Author Contributions

Conceptualization, F.Y.; Writing—review and editing, F.Y.; Funding acquisition, F.Y.; Supervision, F.Y.; Writing—original draft preparation, B.L.; Methodology, B.L.; Visualization, B.L.; Software, J.Y.; Validation, B.L. and J.Y.; Investigation, B.L. and J.Y. All authors have read and agreed to the published version of the manuscript.

Funding

This research was funded by the Youth Program of the National Natural Science Foundation of China (grant number: 51704181) and the Natural Science Foundation of Shandong Province (grant number: ZR2022ME158). The article processing charge (APC) was supported by Prof. Fenghai Yu.

Institutional Review Board Statement

Not applicable.

Informed Consent Statement

Not applicable.

Data Availability Statement

The original contributions presented in this study are included in the article material. Further inquiries can be directed to the corresponding author.

Acknowledgments

We would like to express our sincere gratitude to Haohua Hongqingliang Mining Co., Ltd., Ordos City for providing the original data used in this study. We also extend our sincere appreciation to Jianchong Chen and Bo Wang from the company for their valuable data support and contributions to this research.

Conflicts of Interest

The authors declare no conflict of interest.

References

  1. Xie, H.; Gao, M.; Zhang, R.; Peng, G.; Wang, W.; Li, A. Study on the Mechanical Properties and Mechanical Response of Coal Mining at 1000 m or Deeper. Rock. Mech. Rock. Eng. 2019, 52, 1475–1490. [Google Scholar] [CrossRef]
  2. Ranjith, P.G.; Zhao, J.; Ju, M.; De Silva, R.V.S.; Rathnaweera, T.D.; Bandara, A.K.M.S. Opportunities and Challenges in Deep Mining: A Brief Review. Engineering 2017, 3, 546–551. [Google Scholar] [CrossRef]
  3. Ghorbani, Y.; Nwaila, G.T.; Zhang, S.E.; Bourdeau, J.E.; Canovas, M.; Arzua, J.; Nikadat, N. Moving towards deep underground mineral resources: Drivers, challenges and potential solutions. Resour. Policy 2023, 80, 103222. [Google Scholar] [CrossRef]
  4. Cao, J.; Dou, L.; Konietzky, H.; Zhou, K.; Zhang, M. Failure mechanism and control of the coal bursts triggered by mining-induced seismicity: A case study. Environ. Earth Sci. 2023, 82, 168. [Google Scholar] [CrossRef]
  5. Zhou, X.; Liu, X.; Wang, X.; Liu, Y.; Xie, H.; Du, P. Acoustic Emission Characteristics of Coal Failure Under Triaxial Loading and Unloading Disturbance. Rock Mech. Rock Eng. 2023, 56, 1043–1061. [Google Scholar] [CrossRef]
  6. Hu, J.; He, M.; Li, H.; Tao, Z.; Liu, D.; Cheng, T.; Peng, D. Rockburst Hazard Control Using the Excavation Compensation Method (ECM): A Case Study in the Qinling Water Conveyance Tunnel. Engineering 2024, 34, 154–163. [Google Scholar] [CrossRef]
  7. Waqar, M.F.; Guo, S.; Qi, S. A Comprehensive Review of Mechanisms, Predictive Techniques, and Control Strategies of Rockburst. Appl. Sci. 2023, 13, 3950. [Google Scholar] [CrossRef]
  8. Ordin, A.A.; Timoshenko, A.M. Coalbed methane release as a function of coal breakup. J. Min. Sci. 2016, 52, 524–529. [Google Scholar] [CrossRef]
  9. Zhang, S.; Fan, G.; Jiang, S.; Fan, Z.; Li, S.; Ni, H. Dual-hazard control mechanism of burst-prone and spontaneous combustion coalface considering effect of retreat speed. Energy Rep. 2021, 7, 278–288. [Google Scholar] [CrossRef]
  10. Liu, X.; Zhou, X.; Zhang, Z.; Zhang, H.; Gu, Z.; Zhang, S.; Yan, G. Compound disaster characteristics of rock burst and coal spontaneous combustion in island mining face: A case study. Case Stud. Therm. Eng. 2024, 63, 105240. [Google Scholar] [CrossRef]
  11. Linkov, A. Rockbursts and the instability of rock masses. Int. J. Rock Mech. Min. Sci. Geomech. Abstr. 1996, 33, 727–732. [Google Scholar] [CrossRef]
  12. Napier, J.; Malan, D. Simulation of tabular mine face advance rates using a simplified fracture zone model. Int. J. Rock Mech. Min. Sci. 2018, 109, 105–114. [Google Scholar] [CrossRef]
  13. Nawrocki, P.A. One-dimensional, semi-analytical solution for time-dependent behaviour of a seam. Int. J. Numer. Anal. Meth. Geomech. 1995, 19, 59–74. [Google Scholar] [CrossRef]
  14. Gogolewska, A.; Junik, P. Seismic hazard related to rate of face advance in Lubin copper ore mine. Min. Sci. 2013, 20, 87–99. [Google Scholar] [CrossRef]
  15. Deng, Z.-G.; Wang, S.; Mo, Y.-L.; Liu, W.-J. Influence of Mining Speed on Stope Energy in Deep Mines. Appl. Geophys. 2024. [Google Scholar] [CrossRef]
  16. Yu, X.; Gao, M.; Zhao, H.; Zhao, S.; Zhao, H. Research on the Laws of Overlying Rock Fracture and Energy Release under Different Mining Speeds. Appl. Sci. 2024, 14, 3222. [Google Scholar] [CrossRef]
  17. Li, W.; Tu, S.; Tu, H.; Liu, X.; Miao, K.; Zhao, H.; Ma, J.; Tang, L.; Li, Y. A New Method to Assess Thick, Hard Roof-Induced Rock Burst Risk Based on Mining Speed Effect on Key Energy Strata. Sustainability 2022, 14, 15054. [Google Scholar] [CrossRef]
  18. Jia, C.; Jia, C.; Lai, X.; Lai, X.; Cui, F.; Cui, F.; Feng, G.; Feng, G.; He, S.; He, S.; et al. Study on Multisize Effect of Mining Influence of Advance Speed in Steeply Inclined Extrathick Coal Seam. Lithosphere 2022, 2022, 9775460. [Google Scholar] [CrossRef]
  19. Keneti, A.; Sainsbury, B. Review of published rockburst events and their contributing factors. Engineering Geology. 2018, 246, 361–373. [Google Scholar] [CrossRef]
  20. Prakash, A.; Kumar, A.; Verma, A.; Mandal, S.K.; Singh, P.K. Trait of subsidence under high rate of coal extraction by longwall mining: Some inferences. Sādhanā 2021, 46, 216. [Google Scholar] [CrossRef]
  21. Eremin, M.O.; Makarov, P.V. Mathematical Modeling of Stress-Strain Evolution in the Rock Mass around a Mine Opening. Evaluation of the Steps of First Roof Caving at Different Thicknesses of the Main Roof. Phys. Mesomech. 2019, 22, 287–295. [Google Scholar] [CrossRef]
  22. Jooste, Y.; Malan, D.F. Rock engineering aspects of a modified mining sequence in a dip pillar layout at a deep gold mine. J. South. Afr. Inst. Min. Metall. 2015, 115, 1097–1112. [Google Scholar] [CrossRef]
  23. Wang, D.-Y. Study of Impact of Mining Rate on Abutment Pressure of Stope. Coal Technol. 2014, 33, 94–96. (In Chinese) [Google Scholar]
  24. Brady, B.H.G.; Brown, E.T. Rock Mechanics for Underground Mining; Springer: Berlin/Heidelberg, Germany, 2006. [Google Scholar]
  25. Jiang, F.-X.; Xun, L.; Yang, S. Study on microseismic monitoring for spatial structure of overlying strata and mining pressure field in longwall face. Yantu Gongcheng Xuebao/Chin. J. Geotech. Eng. 2003, 25, 23. [Google Scholar]
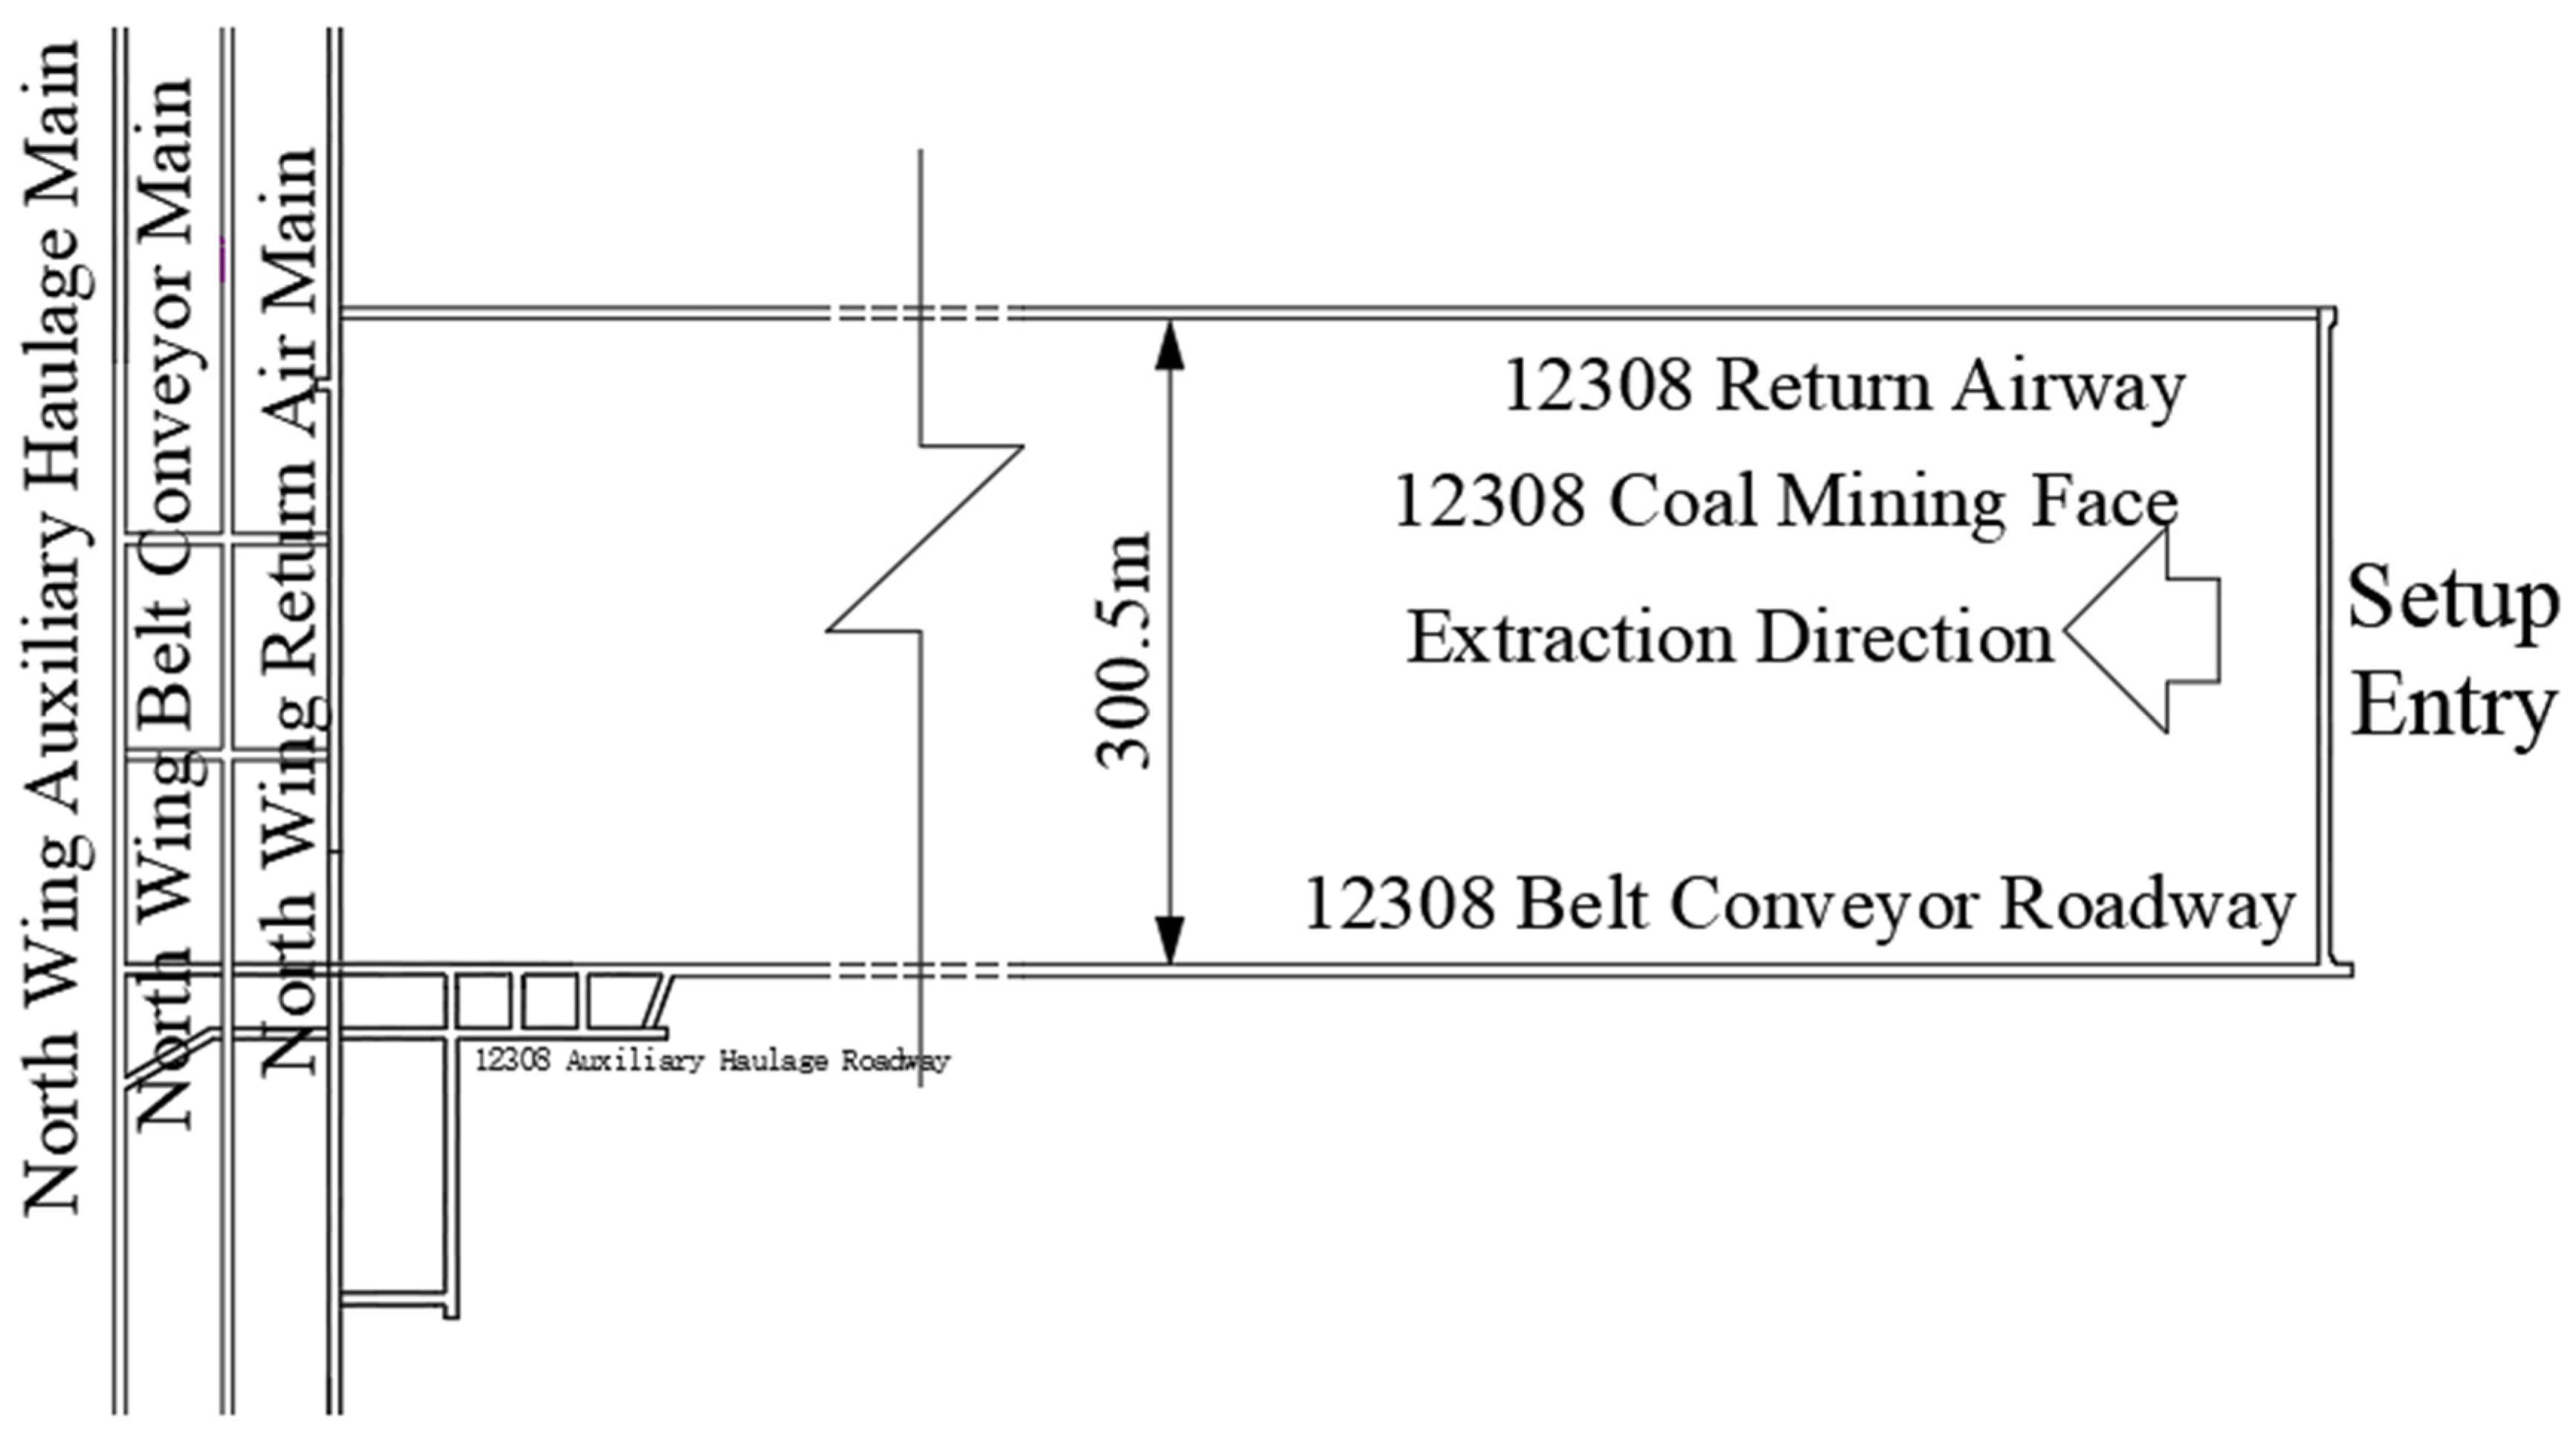
Figure 1. Mining layout plan of the 12308 working face.
Applsci 15 04266 g001
Figure 2. Composite stratigraphic column of the 12308 working face.
Applsci 15 04266 g002
Figure 3. Schematic diagram of advance rates.
Applsci 15 04266 g003
Figure 4. Schematic diagram of computational model.
Applsci 15 04266 g004
Figure 5. Immediate roof caving patterns under different advance rates: (a) 4 m/d; (b) 6 m/d; (c) 8 m/d; (d) 10 m/d.
Applsci 15 04266 g005
Figure 6. Immediate roof caving parameters under different advance rates.
Applsci 15 04266 g006
Figure 7. Main roof caving patterns under different advance rates: (a) 4 m/d; (b) 6 m/d; (c) 8 m/d; (d) 10 m/d.
Applsci 15 04266 g007
Figure 8. Overburden movement models under different advance rates. (a) Low-speed mining phase; (b) high-speed mining phase.
Applsci 15 04266 g008
Figure 9. Computational model of fixed-end beam theory.
Applsci 15 04266 g009
Figure 10. Mechanical model for front abutment pressure calculation.
Applsci 15 04266 g010
Figure 11. Layout plan of borehole stress meters in the 12308 working face.
Applsci 15 04266 g011
Figure 12. Front abutment pressure evolution curves in the 12308 return entry. (a) Low-speed mining phase; (b) high-speed mining phase.
Applsci 15 04266 g012
Figure 13. Front abutment pressure evolution curves in the 12308 belt entry. (a) Low-speed mining phase; (b) high-speed mining phase.
Applsci 15 04266 g013
Figure 14. Front abutment pressure distribution curves under different advance rates.
Applsci 15 04266 g014
Figure 15. Schematic diagrams of front abutment pressure distribution under different advance rates: (a) 4 m/d at 120 m advance; (b) 6 m/d at 120 m advance; (c) 8 m/d at 120 m advance; (d) 10 m/d at 120 m advance.
Applsci 15 04266 g015
Figure 16. Relationship between advance rate and shield resistance (upper section). (a) Low-speed mining phase; (b) high-speed mining phase.
Applsci 15 04266 g016
Figure 17. Relationship between advance rate and shield resistance (middle section). (a) Low-speed mining phase; (b) high-speed mining phase.
Applsci 15 04266 g017
Figure 18. Relationship between advance rate and shield resistance (lower section). (a) Low-speed mining phase; (b) high-speed mining phase.
Applsci 15 04266 g018
Figure 19. Layout of microseismic monitoring points.
Applsci 15 04266 g019
Figure 20. Relationship between face advancing rate and daily microseismic event frequency at Panel 12308.
Applsci 15 04266 g020
Figure 21. Correlation between face advancing rate and daily total microseismic energy at Panel 12308.
Applsci 15 04266 g021
Figure 22. Statistical distribution of microseismic energy intervals under different advance rates. (a) Low-speed phase; (b) high-speed steady phase; (c) high-speed unsteady phase.
Applsci 15 04266 g022
Figure 23. Cumulative microseismic energy intervals under different advance rates. (a) Low-speed phase; (b) high-speed steady phase; (c) high-speed unsteady phase.
Applsci 15 04266 g023
Figure 24. Scatter plots of daily microseismic energy vs. frequency under different advance rates.
Applsci 15 04266 g024
Figure 25. Relationship between advance rate and single-event microseismic energy.
Applsci 15 04266 g025
Table 1. Physical-mechanical parameters of coal/rock mass.
Sequential StrataStratigraphic Unit DesignationDensity (kg/m3)Elastic Modulus (GPa)Cohesion (MPa)Internal Friction Angle/°Tensile Strength (MPa)
17Sandy mudstone21201.763.41401.55
16Coal seam
2-1 lower
14600.571.88240.22
15Sandy mudstone21201.763.41401.55
14Siltstone18900.62.42320.33
13Medium-grained sandstone23504.214.7323.2
12Sandy mudstone21201.123.41401.55
11Coal seam
2-2 upper
14600.571.88240.22
10Sandy mudstone20400.783.41401.13
9Siltstone18700.62.42350.25
8Coal seam
2-2 middle
14400.571.88240.22
7Sandy mudstone20300.783.41401.11
6Coal seam
2-2 lower
14600.571.88240.22
5Sandy mudstone20400.783.41401.13
4Conglomeratic sandstone24505.44.5292.1
3Sandy mudstone20700.783.41400.86
2Coal seam 3-114400.572.2240.3
1Sandy mudstone21621.763.41300.92
Table 2. Mechanical parameters of coal/rock joints.
Sequential StrataJoint SurfaceNormal Stiffness (GPa)Tangential Stiffness (GPa)Cohesion (MPa)Internal Friction Angle/°Tensile Strength (MPa)
17Sandy mudstone5.54.274.5250.6
16Coal seam
2-1 lower
3.82.43.2240.25
15Sandy mudstone5.54.274.5250.6
14Siltstone4.24.274.8260.2
13Medium-grained sandstone8.55.29.2321.0
12Sandy mudstone5.54.274.5250.6
11Coal seam
2-2 upper
3.82.43.2240.25
10Sandy mudstone5.54.274.5250.6
9Siltstone4.24.274.8260.2
8Coal seam
2-2 middle
3.82.43.2240.25
7Sandy mudstone5.54.274.5250.6
6Coal seam
2-2 lower
3.82.43.2240.25
5Sandy mudstone5.54.274.5250.6
4Conglomeratic sandstone6.25.28.7281.2
3Sandy mudstone5.54.274.5250.6
2Coal seam 3-13.82.33.2240.23
1Sandy mudstone5.54.273.5250.6
Table 3. Main roof caving parameters under different mining advance rates.
Advance Rate/(m∙d−1)Initial Weighting Interval/(m)Position Relative to Coal Wall/(m)
4524
6542
8561
10601
Table 4. k value range.
Rock Mass DescriptionRMR Score RangeQ Value RangeCorresponding k Value
Fault influence zone, intensely weathered rock zone20–40 (Class IV Rock Mass)0.1–1.00.50~0.65
Crushed limestone with argillaceous infilling40–60 (Class III Rock Mass)1.0–4.00.65~0.75
Massive sandstone with closed joint development60–80 (Class II Rock Mass)4.0–100.75~0.85
Intact granite with joint spacing > 3 m80–100 (Class I Rock Mass)>100.85~0.90
Table 5. Statistical comparison of borehole stress.
StageInfluence Zone of Advanced Abutment Pressure/(m)Peak Value of Advanced Abutment Pressure/(MPa)Distance from Coal Wall to Peak Position/(m)
Low-speed mining phase839.278.8
High-speed mining phase6110.95.4
Table 6. Summary of relationships between working face advance rates and periodic weighting characteristics.
StageSupport PositionWeighting FrequencyPeriodic Weighting Interval/(m)Support Load During Weighting/(kN)Remarks
Low-speed mining phaseUpper1310.214,091.6
Middle1210.314,454.6
Lower1210.514,133.9
12.310.314,226.7Average
High-speed mining phaseUpper915.414,235.7
Middle815.514,529.4
Lower914.414,231.4
8.715.114,332.2Average
Table 7. Rockburst microseismic early-warning classification.
Warning Level12308 Coal Mining FaceResponse Measures
A
No rockburst risk
Emax ≤ 1.0 × 10⁴ J
Frequency ≤ 70/d
Normal production.
B
Weak rockburst risk
1.0 × 10⁴ J < Emax ≤ 1.1 × 10⁴ J
70/d < Frequency ≤ 80/d
Normal excavation and mining operations, strengthen monitoring.
C
Moderate rockburst risk
1.1 × 10⁴ J < Emax ≤ 1.3 × 10⁴ J
80/d < Frequency ≤ 90/d
Reduce the advancing speed, carry out hazard-relieving measures, and resume the advancing speed after verifying that the hazard is eliminated.
D
Severe rockburst risk
Emax > 1.3 × 10⁴ J
Frequency > 90/d
Stop operations, evacuate personnel from the dangerous area, take hazard-relieving measures after the hazard level drops to the moderate rockburst level, and resume production after verifying that the hazard is eliminated.
Table 8. Relationships between microseismic events and mining advance rates.
Stage NameAdvance Rate Range/(m·d−1)Advance Rate/(m·d−1)Microseismic Event Count/(Times·d−1)Total Energy of Microseismic Events/(J·d−1)Emax/J
Low-speed mining phase2~43.71.49.4 × 1037.7 × 103
High-speed mining stage8~108.43.42.2 × 1047.9 × 103
Disclaimer/Publisher’s Note: The statements, opinions and data contained in all publications are solely those of the individual author(s) and contributor(s) and not of MDPI and/or the editor(s). MDPI and/or the editor(s) disclaim responsibility for any injury to people or property resulting from any ideas, methods, instructions or products referred to in the content.