Article

Study on the Impact of Diaphragm Deformation on Fatigue Performance and Maintenance Strategies in Steel Bridge Decks

1
College of Civil and Transportation Engineering, Hohai University, Nanjing 210098, China
2
College of Civil Engineering, Jiangsu Open University, Nanjing 210036, China
*
Author to whom correspondence should be addressed.
Appl. Sci. 2025, 15(8), 4245; https://doi.org/10.3390/app15084245
Submission received: 15 March 2025 / Revised: 7 April 2025 / Accepted: 8 April 2025 / Published: 11 April 2025

Abstract

:
Localized diaphragm (transversal plate) deformation and buckling were identified at the arc notch region during structural inspections of an operational steel bridge. To evaluate the potential structural consequences, alterations in the fatigue performance and stress characteristics induced by this deformation were systematically investigated through in situ monitoring combined with numerical simulation. It was demonstrated that the global load-transfer mechanism of the orthotropic steel deck (OSD) system remained minimally compromised. While within the localized deformation zone, the stress magnitudes at the diaphragm-to-U-rib (DU) welds were observed to be significantly amplified, and the stress concentration zones were found to be relocated to geometrically depressed regions. Based on the deformation-stage mechanical responses, the strategic employment of residual compressive stress generated through controlled hammer peening was proposed for counteracting stress escalation at DU welds recently caused by diaphragm buckling, whereas steel plate reinforcement strategies were recommended for mitigating progressive deformation development.

1. Introduction

Orthotropic steel decks (OSDs), characterized by their composite structure of deck plates, longitudinal stiffeners, and transversal diaphragms, are extensively employed in long-span steel bridge construction due to their advantageous strength-to-weight ratios [1,2]. Nevertheless, these structural systems have been demonstrated to be particularly vulnerable to fatigue damage under repetitive vehicular loading, with crack initiation being exacerbated by welding imperfections, residual stresses, and component interaction constraints [3,4]. Field investigations have revealed that diaphragm-to-U-rib welded connections (DUs) consistently emerge as critical fatigue-prone components in operational OSD systems [5].
Strategic perforations in diaphragms are conventionally designed to permit uninterrupted longitudinal rib continuity, though these geometric discontinuities have been shown to induce constraint attenuation at connection interfaces. Recent analytical studies have further confirmed that such aperture configurations in the diaphragm plate significantly compromise structural integrity by modifying stiffness distribution patterns and promoting localized buckling phenomena, ultimately leading to stress intensification near notch boundaries [6,7,8]. Notably, permanent diaphragm deformations at notch regions have been documented in multiple in-service bridges through advanced monitoring campaigns [9,10]. While parametric investigations focusing on notch geometry optimization (e.g., radius dimensions and diaphragm thickness variations) and assembly tolerances have been systematically conducted [11,12,13], the precise implications of diaphragm buckling on fatigue performance evolution and its associated mechanical response modifications remain insufficiently characterized.
A comprehensive investigation was conducted through integrated field measurements and numerical analysis to elucidate the deformation-induced stress redistribution mechanisms. Stress monitoring data from instrumented bridges were correlated with finite element modeling results to analyze diaphragm deformation impacts on both the stress characteristics and fatigue performance. Based on the mechanistically derived stress evolution patterns, a novel treatment scheme was proposed to overcome the adverse fatigue performance caused by diaphragm buckling, which improved the maintenance efficiency and provided a reference for similar projects.

2. Real Bridge Test-Based Fatigue Performance Analysis

2.1. Type of Diaphragm Deformation

The diaphragm deformation and buckling observed at the minimum section of an arc notch in a diaphragm-to-U-rib (DU) welded joint were detected in a real bridge. These deformations were located within the same splicing plate and were continuously distributed across multiple U-ribs, forming an S-shaped cross-section due to buckling, as shown in Figure 1.

2.2. Stress Test Scheme

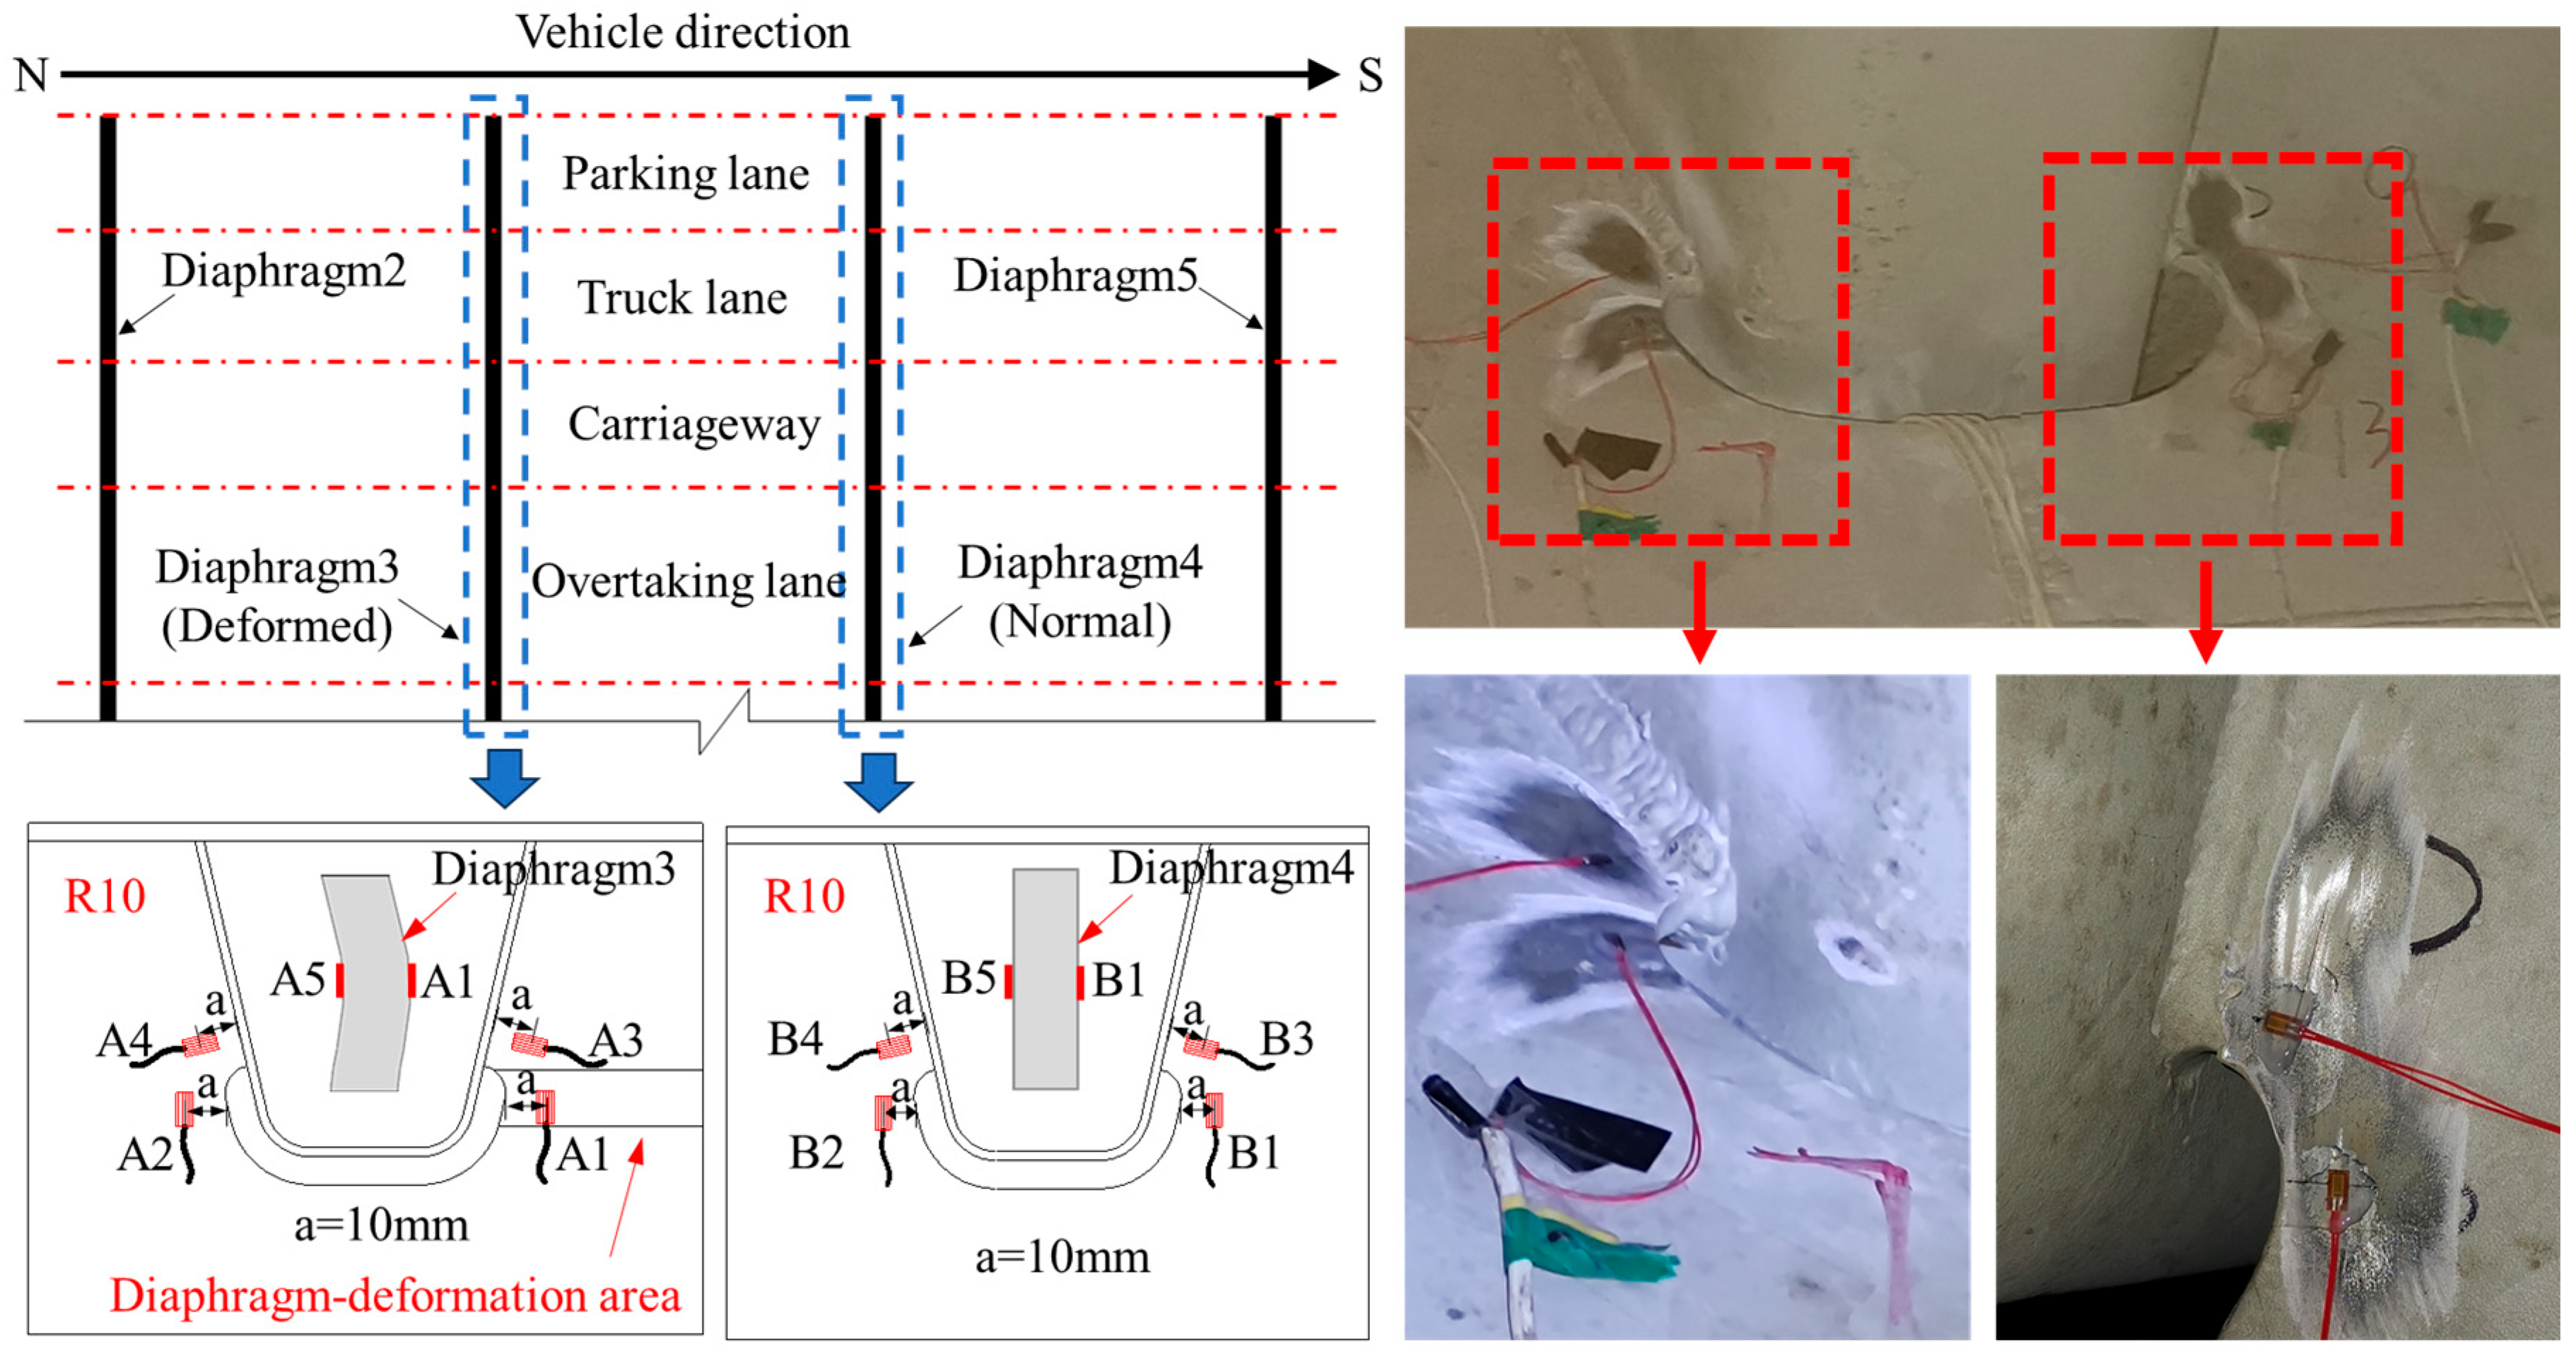
To determine the influence of diaphragm buckling on fatigue performance, the stress test data of a real bridge with diaphragm buckling were measured. The experimental investigation focused on a long-span suspension bridge with steel box-girders showing diaphragm deformation (Figure 1). Comparative stress analyses were conducted on matching U-rib pairs (R10) in neighboring diaphragms—including both a deformed (diaphragm-3) and undeformed (diaphragm-4) specimen—to account for potential variations in vehicle loading positions. In addition, field data from steel bridge inspections reveal that fatigue cracks in diaphragm-to-U-rib (DU) welds predominantly initiate at the diaphragm weld toe. These cracks initially propagate along the weld direction, with stress perpendicular to the weld orientation playing a dominant role in crack initiation. Consequently, particular attention should be paid to stresses normal to the weld direction. Based on the existing literature and observed crack characteristics in real bridges, this study employed the stress component perpendicular to the weld direction (one of the principal stress projections) to qualitatively assess the influence of diaphragm deformation on the fatigue performance of diaphragm-to-U-rib (DU) welded joints. This simplified analytical approach was justified for the purpose of qualitative fatigue evaluation in the current investigation. Strain gauges were strategically positioned on both the DU weld and arc notch surfaces, aligned with the normal stress direction at consistent 10 mm spacings (Figure 2). The specific numbering scheme for these gauges is illustrated in the corresponding figure below [11]. The measuring points A1 and A5 located on diaphragm-3 were pasted on the raised side and the sunken side, respectively, the positions of which were same. The measuring points B1 and B5 were located in the same position on both sides of diaphragm-4. The stress test in this study was conducted during normal bridge operation, capturing the structural response to actual traffic loading conditions.

2.3. Influence of Fatigue Performance

2.3.1. Deformed Region of Diaphragm-3 Collapse

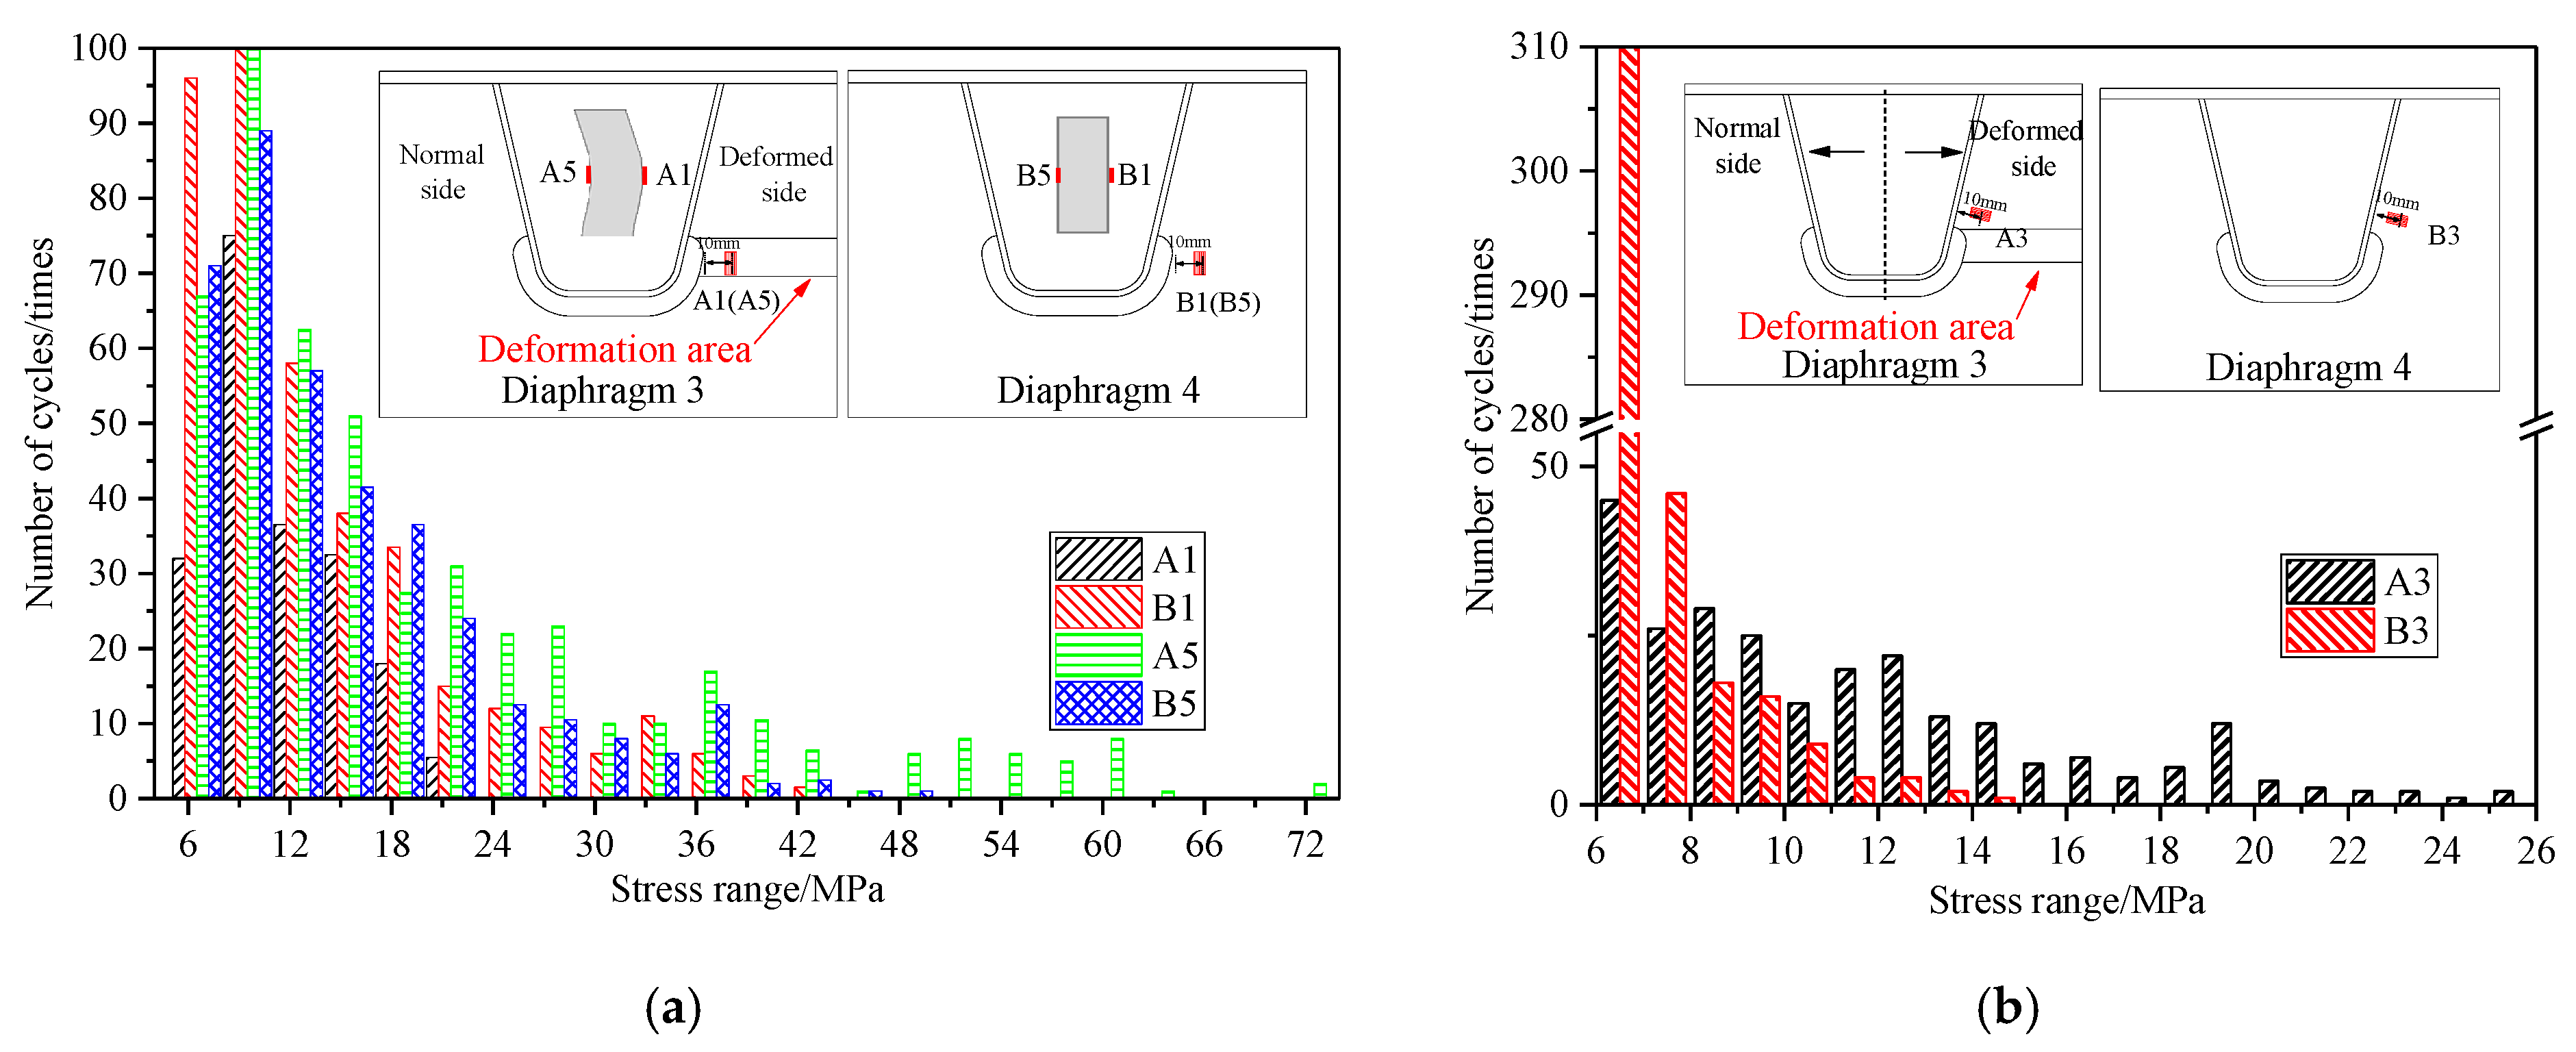
In order to determine the influence of diaphragm deformation on the fatigue performance of DU welded joints in the collapse region, a program was written according to the principle of the rain-flow method [14,15] (see Appendix A), and the stress time–history curve obtained from the test was converted into a fatigue stress spectrum. The stress histories over 2 h were collected, and the developed rain-flow counting method was used to count the stress ranges and the corresponding number of cycles of each measuring point, as shown in Figure 3. According to then Eurocode3 specifications [16], the DU welded joints in steel bridge decks follow the FAT71 fatigue strength curve. Consequently, stress ranges below 5 MPa were excluded from the spectrum analysis, as they have a negligible impact on fatigue damage accumulation [11,17,18,19]. For arc notches (see Figure 3a), the maximum stress ranges of the measuring points B1 and B5 are 42 MPa and 47 MPa, respectively. However, the maximum stress ranges of the measuring points A1 and A5 decrease by 50% and increase by 35.6%, respectively, which indicates that the out-of-plane deformation of the deformed side in diaphragm-3 is significantly enhanced.
For the DU weld (see Figure 3b), compared with the normal diaphragm, the maximum stress range of the deformed diaphragm increased by nearly 50%, which illustrates that the DU weld (A3) of diaphragm-3 (i.e., the deformation diaphragm) was subjected to greater stress ranges and more fatigue damage than diaphragm-4 (i.e., the normal diaphragm). Therefore, diaphragm deformation could lead to a higher risk of cracking on the deformed collapse region of diaphragm-3.

2.3.2. Normal Side of Diaphragm-3

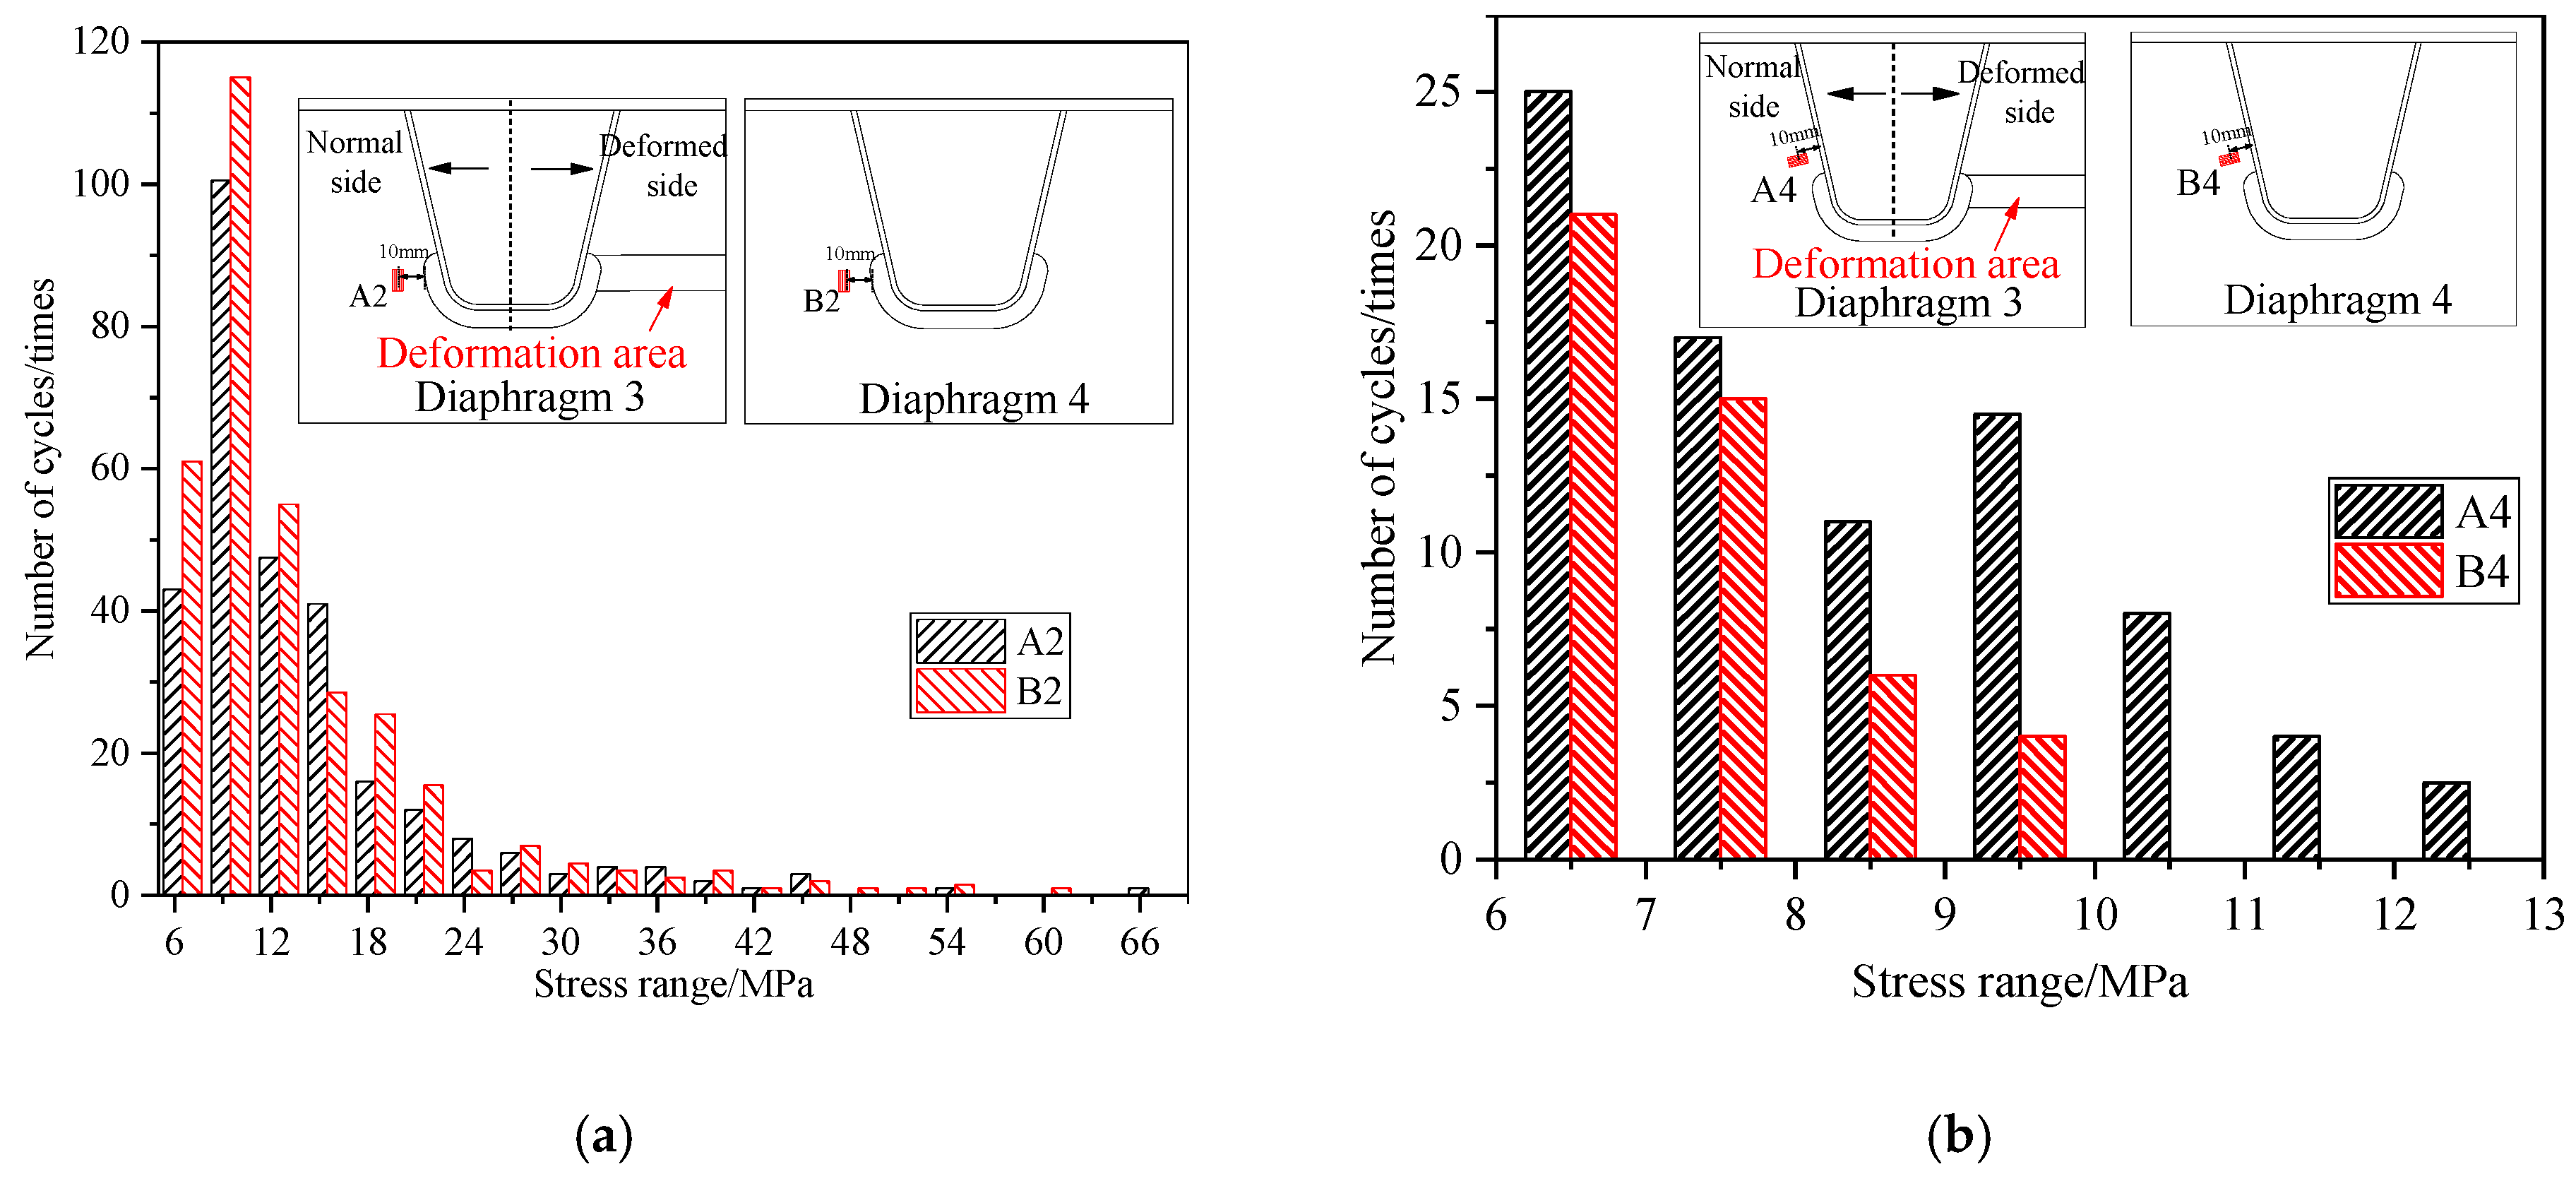
To clarify the influence of the diaphragm collapse region on the fatigue performance of the normal sides in diaphragm-3, the measuring points were set on the DU weld and the arc notch, respectively. The test results are shown in Figure 4. For the arc notch (see Figure 4a), the stress range of measuring point A2 (i.e., diaphragm-3) was consistent with that of measuring point B2 (i.e., diaphragm-4) and the cycle numbers of high stress amplitude. For the DU weld (Figure 4b), the stress ranges of measuring point A4 (i.e., diaphragm-3) and measuring point B4 (i.e., diaphragm-4) were small, and the stress ranges and cycle numbers were similar. Therefore, the diaphragm deformation had little effect on the fatigue damage of the normal side of diaphragm-3.

3. Effect on Stress Characteristics by Numerical Simulation

3.1. Finite Element Modeling

A finite element analysis was performed using Abaqus v6.16 to investigate the stress redistribution resulting from diaphragm collapse. The computational models incorporated both the steel bridge deck (Q345qD steel, made in Jinan, China, E = 206 GPa, ν = 0.3) and pavement layer (60 mm thickness, E = 1000 MPa, ν = 0.3), with perfect bonding assumed at their interface. A linear elastic material behavior was adopted, as the study focused on stress characteristics rather than fatigue crack propagation.
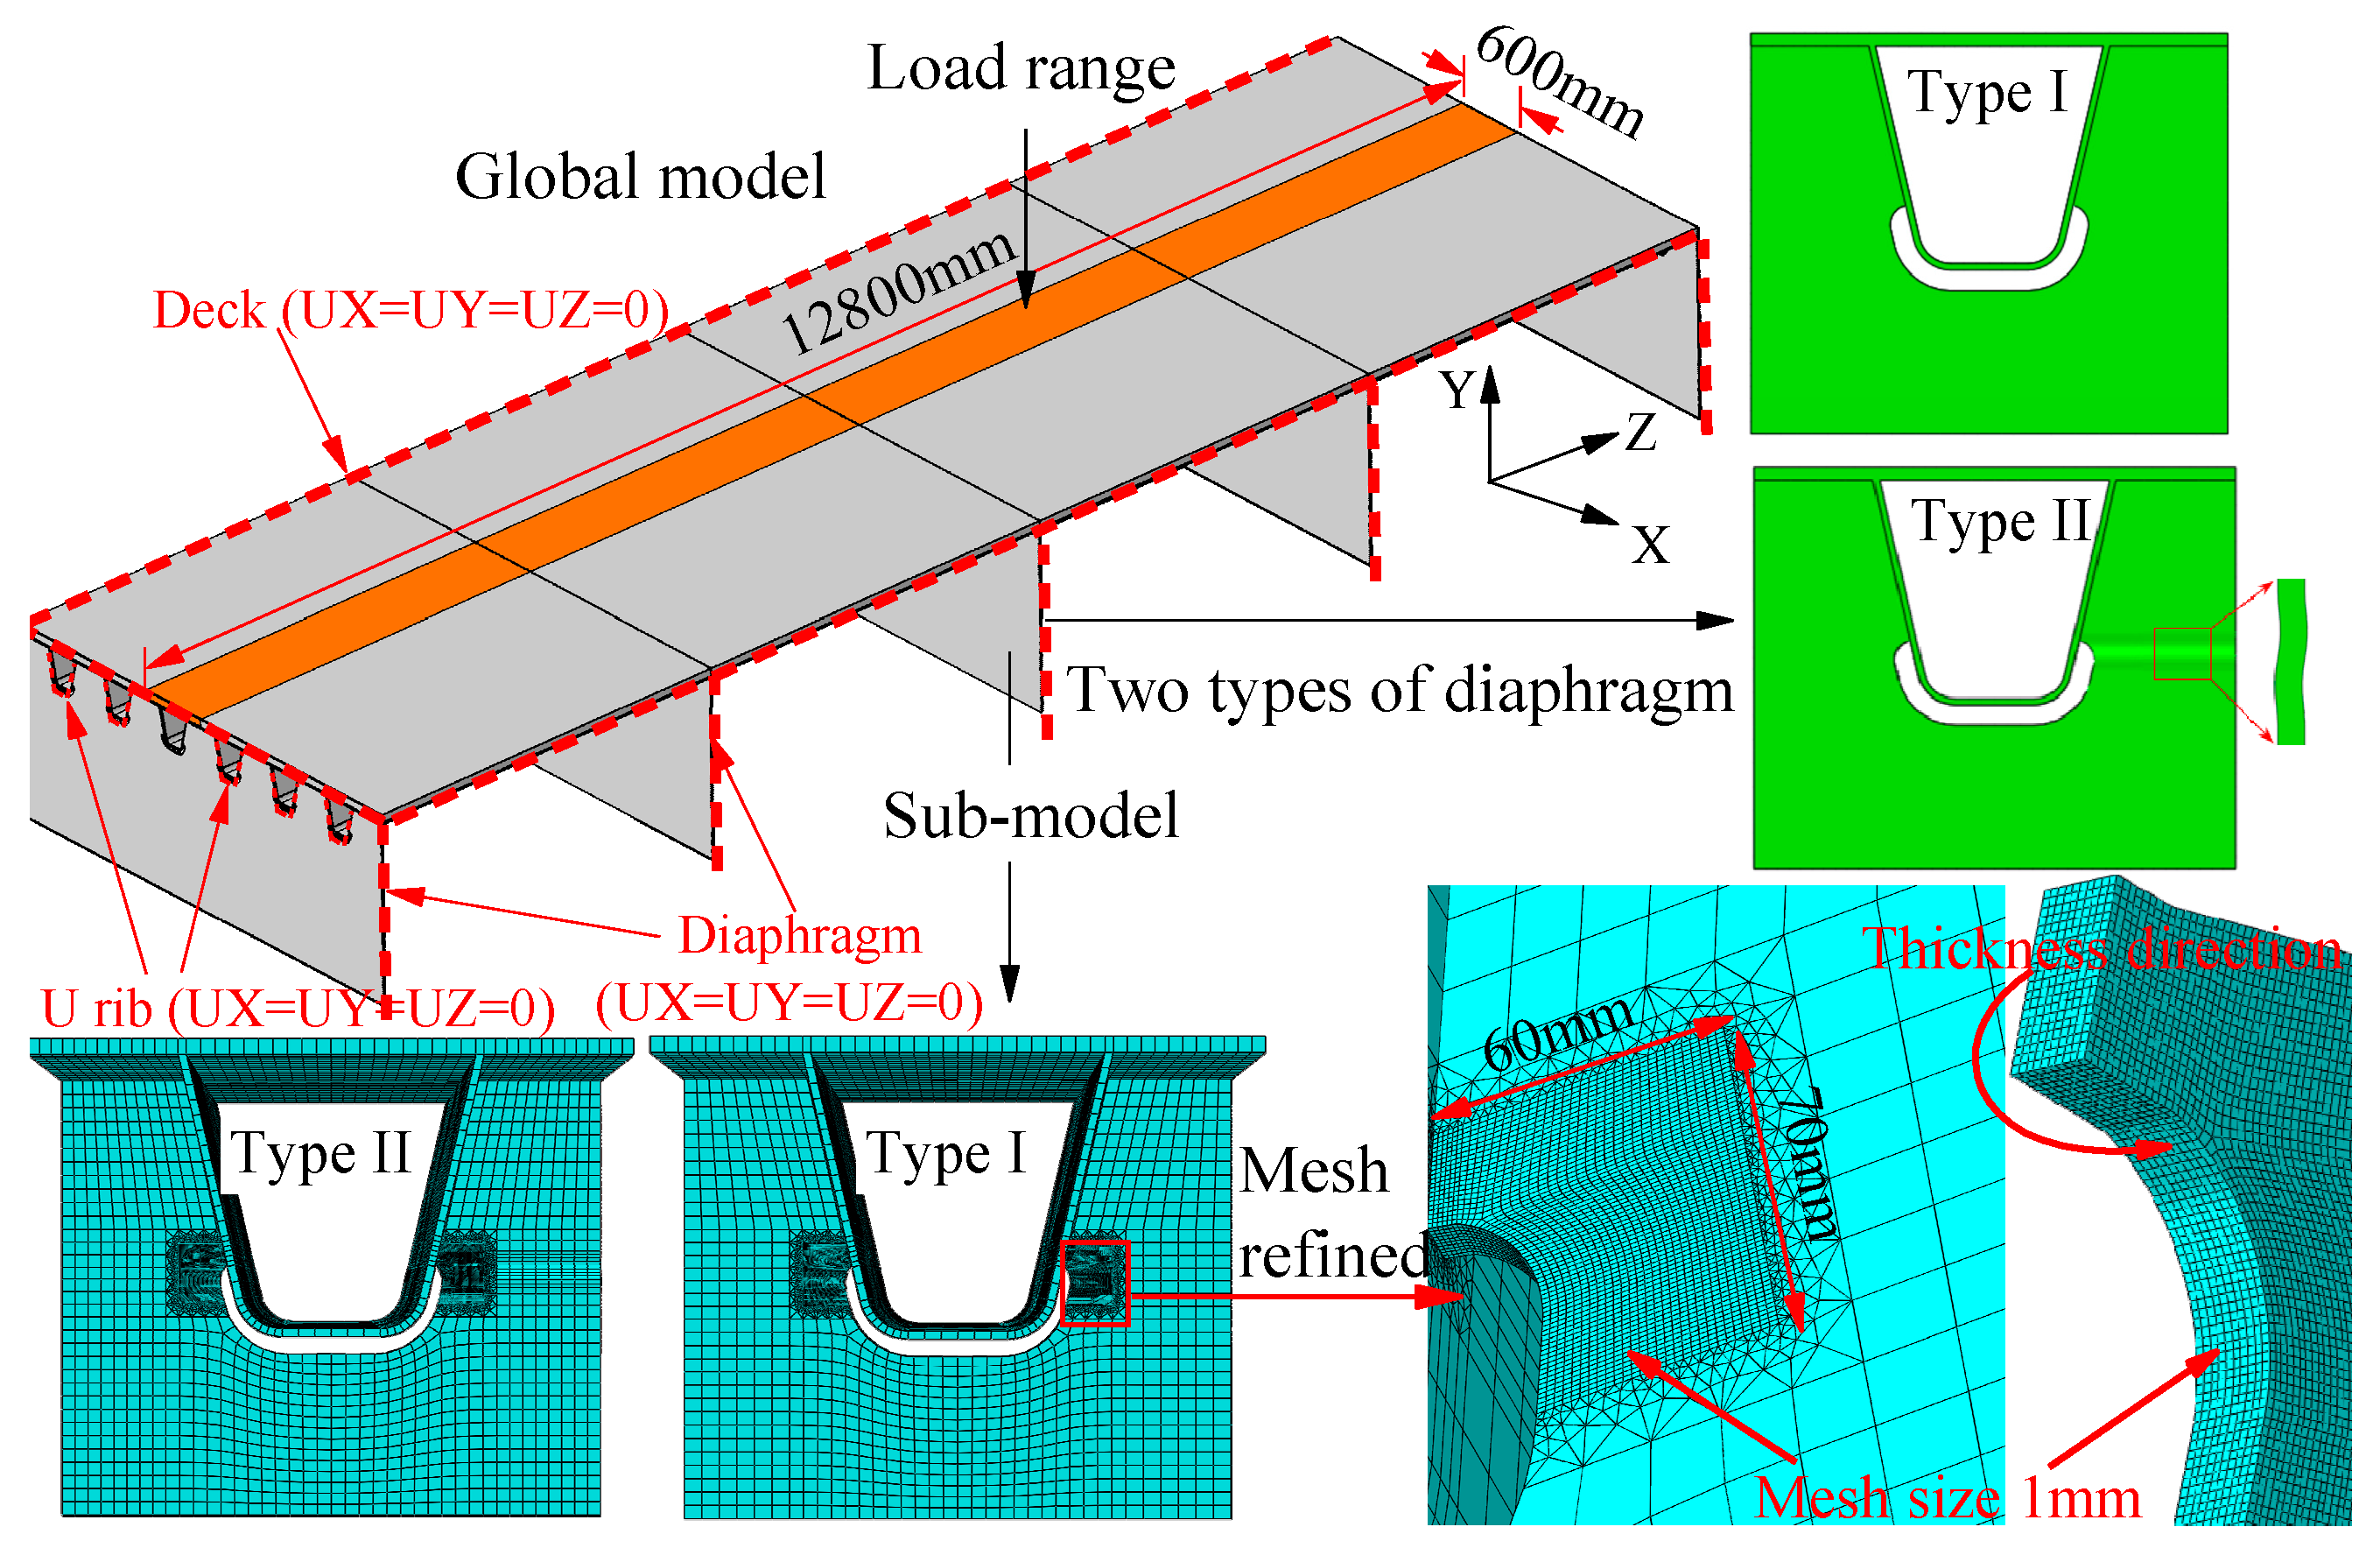
A comprehensive segmental bridge deck model was developed to assess the stress distributions across various wheel load configurations and establish sub-model boundary conditions. The global model encompassed five diaphragms spaced at 3200 mm intervals and six U-ribs with 600 mm spacings, spanning 12,800 mm in length and 4200 mm in width [11]. The structural components were modeled with the following specifications: (1) U-rib profile, 280 mm in height with 300 mm upper and 169.3 mm lower flange widths; (2) thickness parameters, 16 mm (deck), 10 mm (diaphragm), and 8 mm (U-rib web); and (3) mesh configuration, 50 mm eight-node hexahedral elements for all components
The loading protocol employed a single wheel configuration from the JTG D64 standard fatigue vehicle [20], with a 0.5 MPa contact pressure distributed over a 600 × 200 mm rectangular area (Figure 5). Consistent with the established practices [21,22,23], this simplified loading approach was implemented to evaluate the critical stress conditions. The longitudinal load positioning followed a 250 mm incremental scheme, covering the complete span of the longitudinal axis of the global model. While gravitational effects are inherently present in structural components, this study focused specifically on diaphragm deformation-induced stress variations at fatigue-prone details of orthotropic steel decks, and therefore, ignored the gravitational effects from the FE analysis [11,24].
The global modeling approach incorporated diaphragm deformation effects, with a particular focus on the central U-rib pair of the third diaphragm. From these, a representative sub-model was extracted for a detailed analysis (Figure 6). The model symmetry permitted simplification to a single U-rib for computational efficiency, while maintaining analytical rigor. The global model employed a 50 mm mesh consisting of eight-node linear brick elements (C3D8R), comprising 81,000 elements and 140,000 nodes. Fixed constraints (UX = UY = UZ = 0) were applied at cross-sections of the deck plate, diaphragms, and U-ribs to prevent rigid body displacements under vehicular loading. For the comparative analysis, two distinct sub-model configurations were established as follows: Type I (undeformed diaphragm reference case) and Type II (deformed diaphragm case). Both configurations maintained identical dimensions of 600 mm (width) × 400 mm (length) to ensure consistent evaluation conditions. The mesh size was set to 25 mm, and the mesh size of the area of interest was defined to 1 mm (i.e., the number of elements in the direction of the diaphragm thickness was 10). The element type of the sub-model was the same as that of the global model. The sub-model was discretized using four-node linear brick elements (C3D10), with refined and unrefined regions containing 130,000 elements and 170,000 nodes, respectively. Displacement boundary conditions were applied at the sub-model cross-sections using the corresponding results from the global model analysis. Both the global and sub-models were implemented as three-dimensional models to ensure computational reliability [25]. The stress analysis employed the von Mises criterion [26], which effectively characterizes fatigue failure in metallic materials through its evaluation of equivalent stress distributions.

3.2. Analysis of the Influence Scope

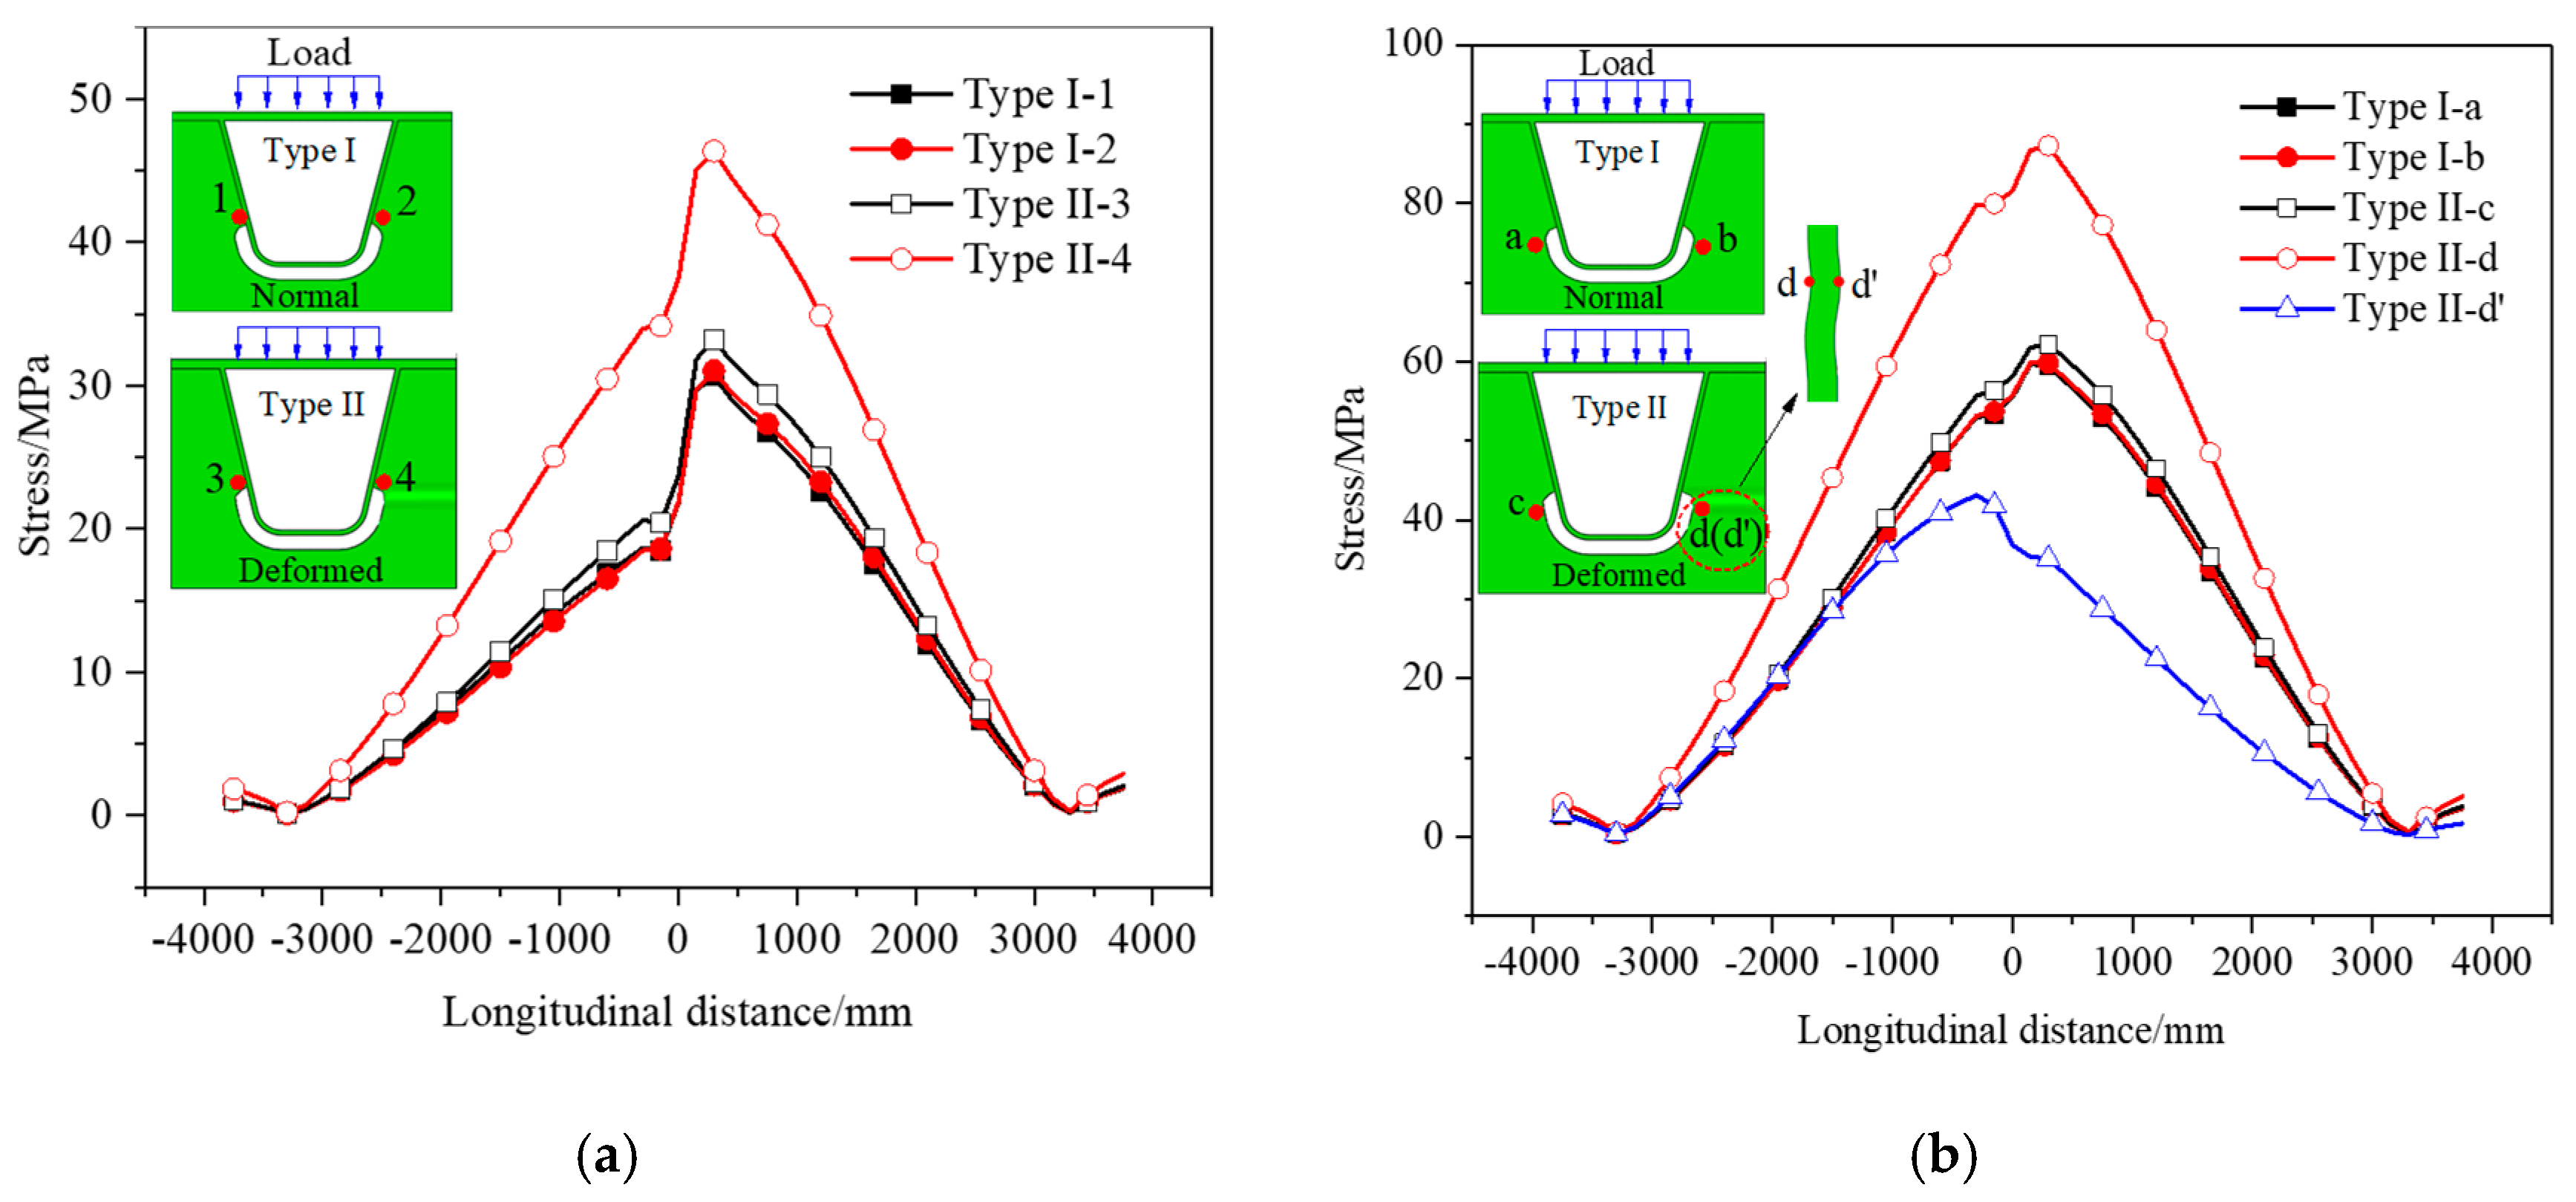
The overall impact was analyzed to determine the effect scope of diaphragm deformation. Type II-3 and Type II-4, located on the normal side and the deformed side of the DU, respectively, represented the stress points of the DU weld, as shown in Figure 7a. Compared with the normal DU welded joint, the Type II-3 diaphragm changed by a little, while the Type II-4 diaphragm increased by nearly 60%. The Type II-d and Type II-d′ diaphragms, located on the deformed side of the DU welded joint, respectively, represented the stress on the sunken side and the raised side of the arc notch, as shown in Figure 7b. Both an increase in the sunken-side stress and a decrease in the raised-side stress occur. Therefore, diaphragm deformation only affects the stress on the deformed side of the DU, and it does not affect the stress of the other components on the adjacent normal side. In addition, the FE results are consistent with the tested results in Section 2.3, which proves that the FE model is correct.

3.3. Analysis of In-Plane and Out-of-Plane Deformation

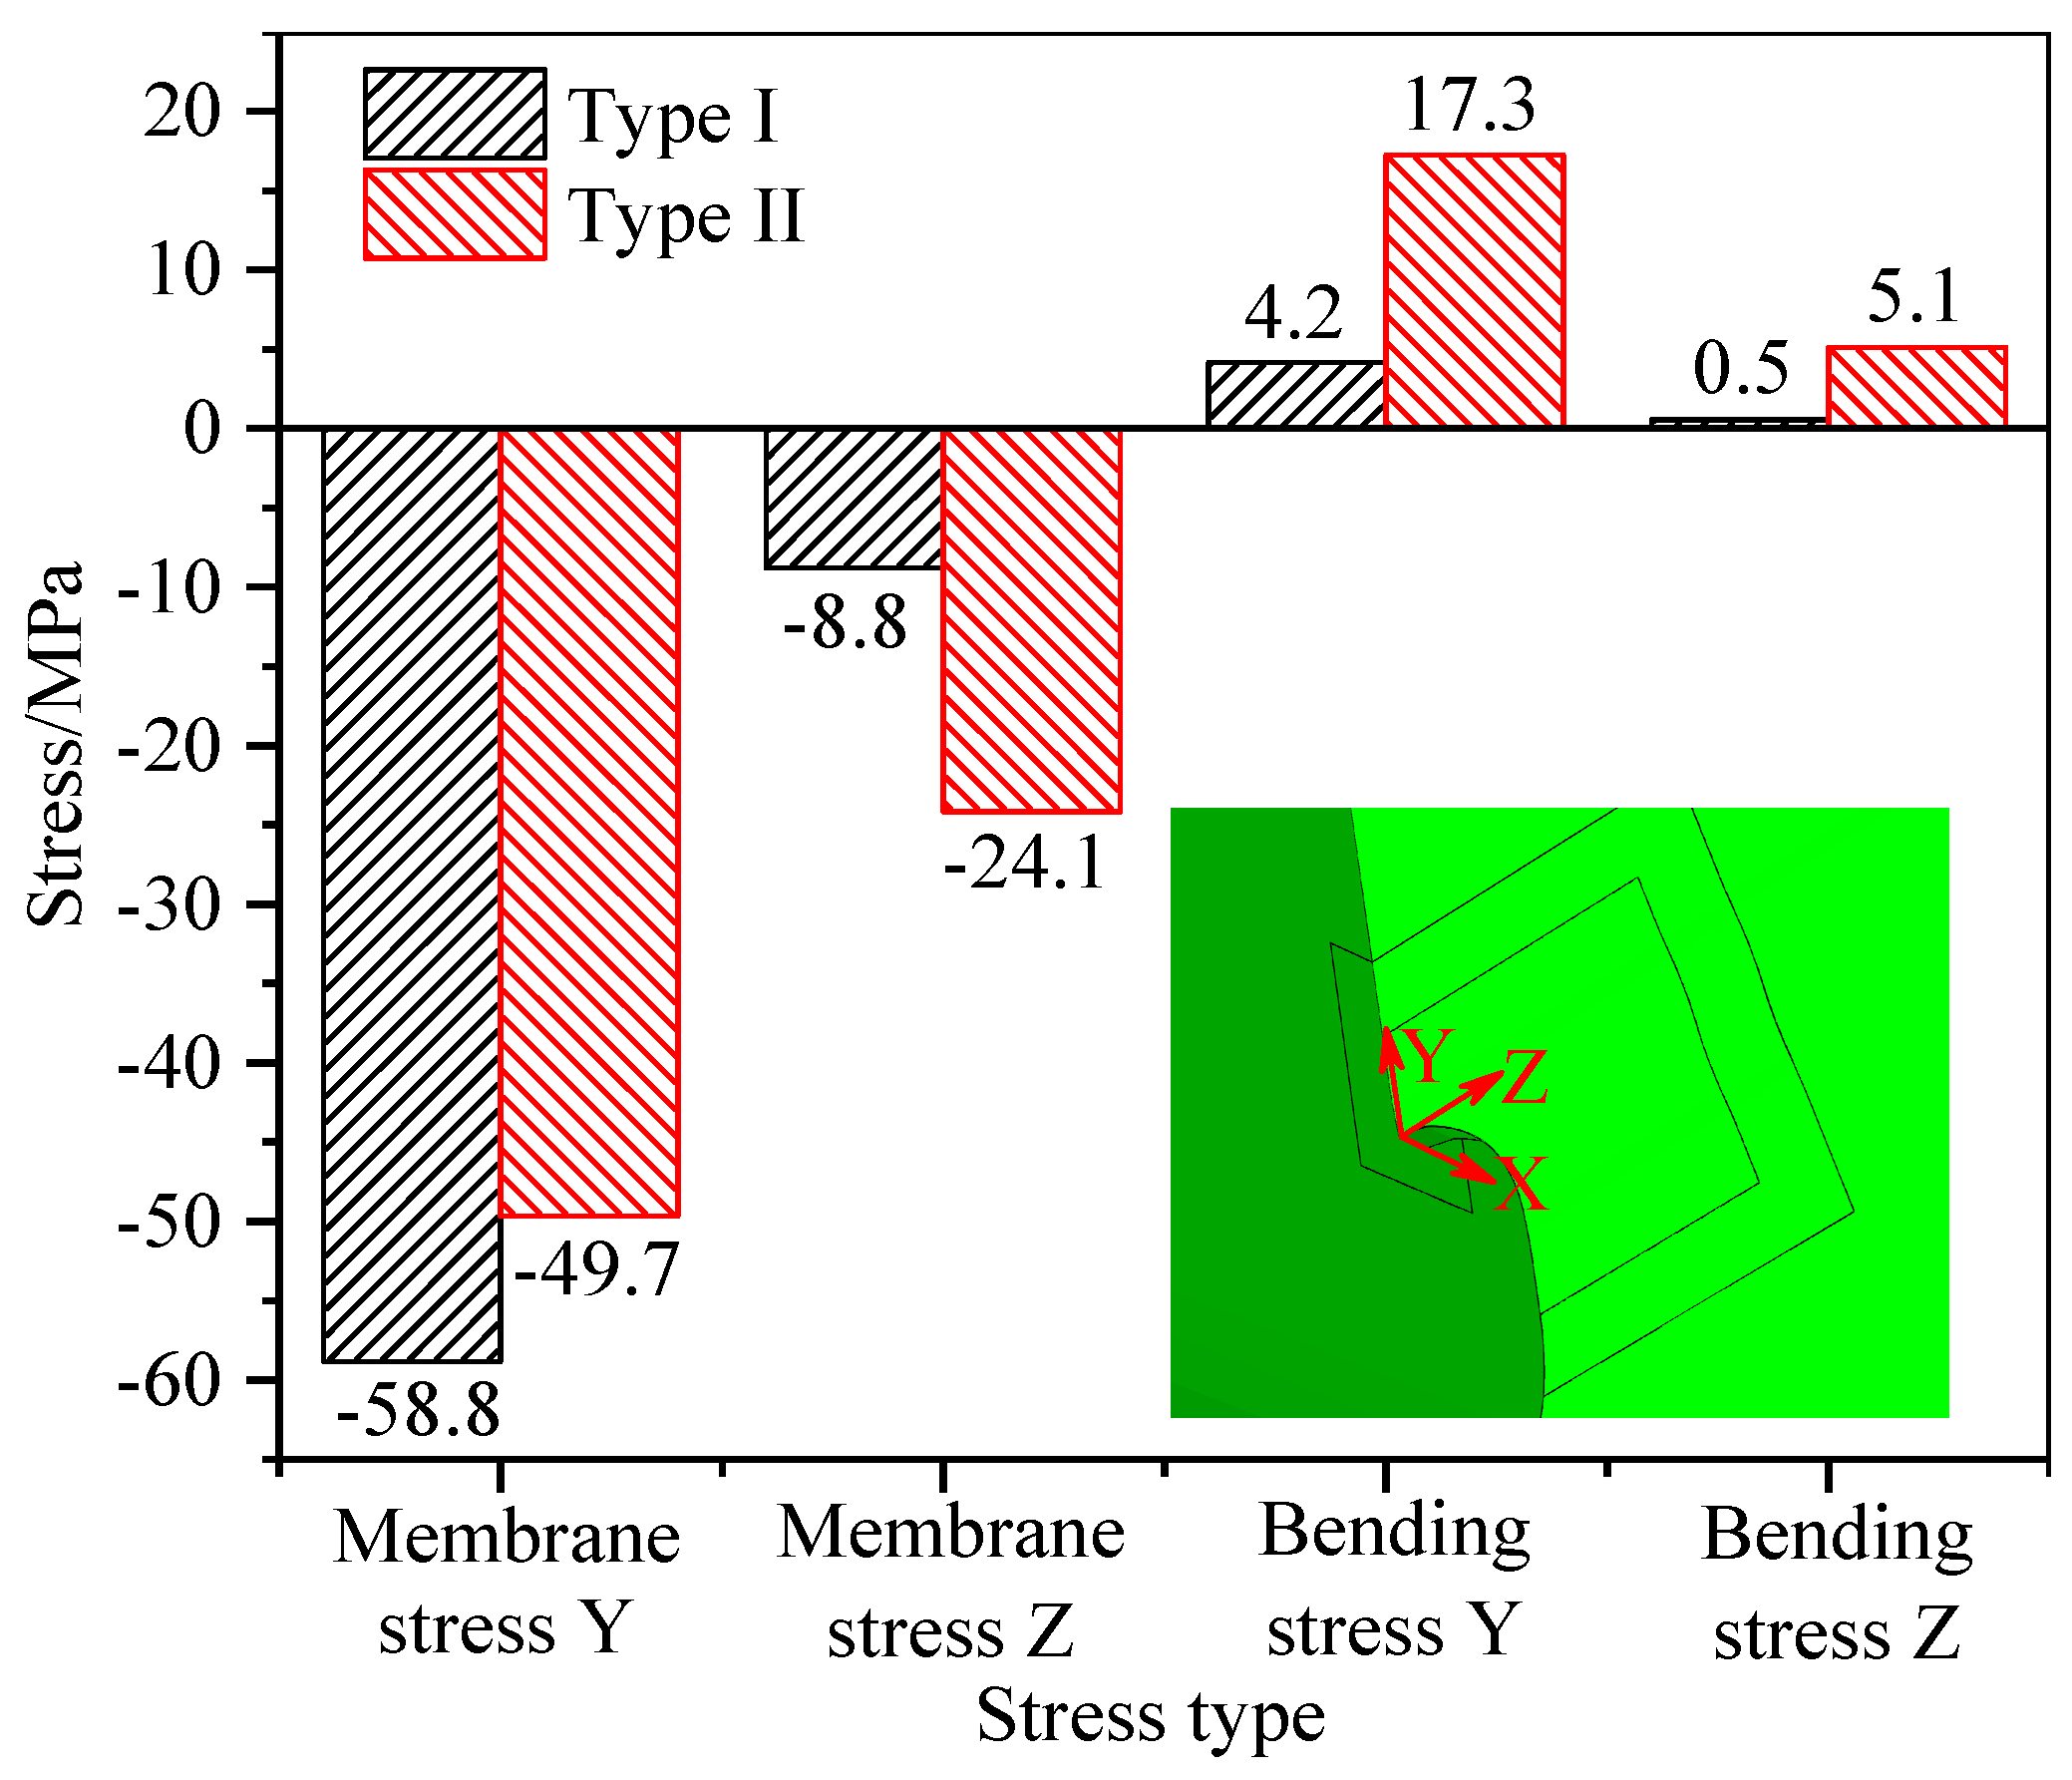
Diaphragm deformation leads to a difference in stiffness between both sides of the U-rib weld, and a potential change in the stress characteristics of the DU change. Therefore, the in-plane and out-of-plane deformation of the diaphragm was analyzed. The membrane stress and bending stress were obtained by stress linearization (the stress in the X direction was almost 0), corresponding to the in-plane and out-of-plane deformation, respectively (see Figure 8). In addition to a slight decrease in the membrane stress in the Y direction, the other stresses increased significantly, especially the stress perpendicular to the weld (membrane stress Z and bending stress Z), which increased by nearly 10 times at its maximum. Therefore, diaphragm deformation leads to more complex stress components on the deformed side of the DU and increases the risk of DU weld cracking.

3.4. Analysis of Local Stress Characteristics

To analyze the differences in the stress characteristics, the stress nephogram of the deformation area in the DU welded joint was extracted, as shown in Figure 9. The analysis revealed a pronounced shift in the stress concentration loci, indicating altered load-transfer pathways. For the normal diaphragm (Type I), the stress concentration location was the same on both sides of the diaphragm, while for the Type II diaphragm, the stress concentration location was transferred to the sunken part of the deformed deformation.
To determine the changes in the stress concentration and stress values, the stresses along the arc notch (Path1 and Path2) and the DU weld (see Path3 and Path4) were extracted, as shown in Figure 10. For the arc notch, the maximum stress of the Type I diaphragm was 62 MPa, while the maximum stress of Path1 and Path2 in the Type II diaphragm increased by 48.3% and 72.6%, respectively, and the positions of the maximum stress on Path1 and Path2 were inconsistent, which proves that the stress concentration points increased and transferred to the sunken part. For the DU weld, the stresses of Path3 and Path4 in the Type II diaphragm increased by 64% and 42%, on average.
Diaphragm deformation elevates fracture susceptibility in DU welds, with cracks typically propagating along the weld seam or at oblique angles, complicating repair efforts. These findings underscore the need for preemptive interventions to mitigate deformation-induced cracking risks.

4. Maintenance Schemes

4.1. Hammer Peening Strengthening

Under combined vehicular loading and welding-induced residual stresses, DU welds are subjected to sustained tensile stress states, rendering them particularly susceptible to fatigue crack initiation and propagation [5,27,28,29]. The presence of diaphragm deformation has been demonstrated to exacerbate these tensile stress conditions, thereby significantly elevating the fracture risk at critical weld locations. While conventional remedial measures, including stress-relief hole drilling and notch geometry modifications, have been implemented in operational bridges, these post-cracking interventions are inherently limited by their structural invasiveness and may potentially compromise the original load-bearing integrity. Consequently, the development of non-destructive, rapid implementation preventive strategies has been identified as a critical research priority.
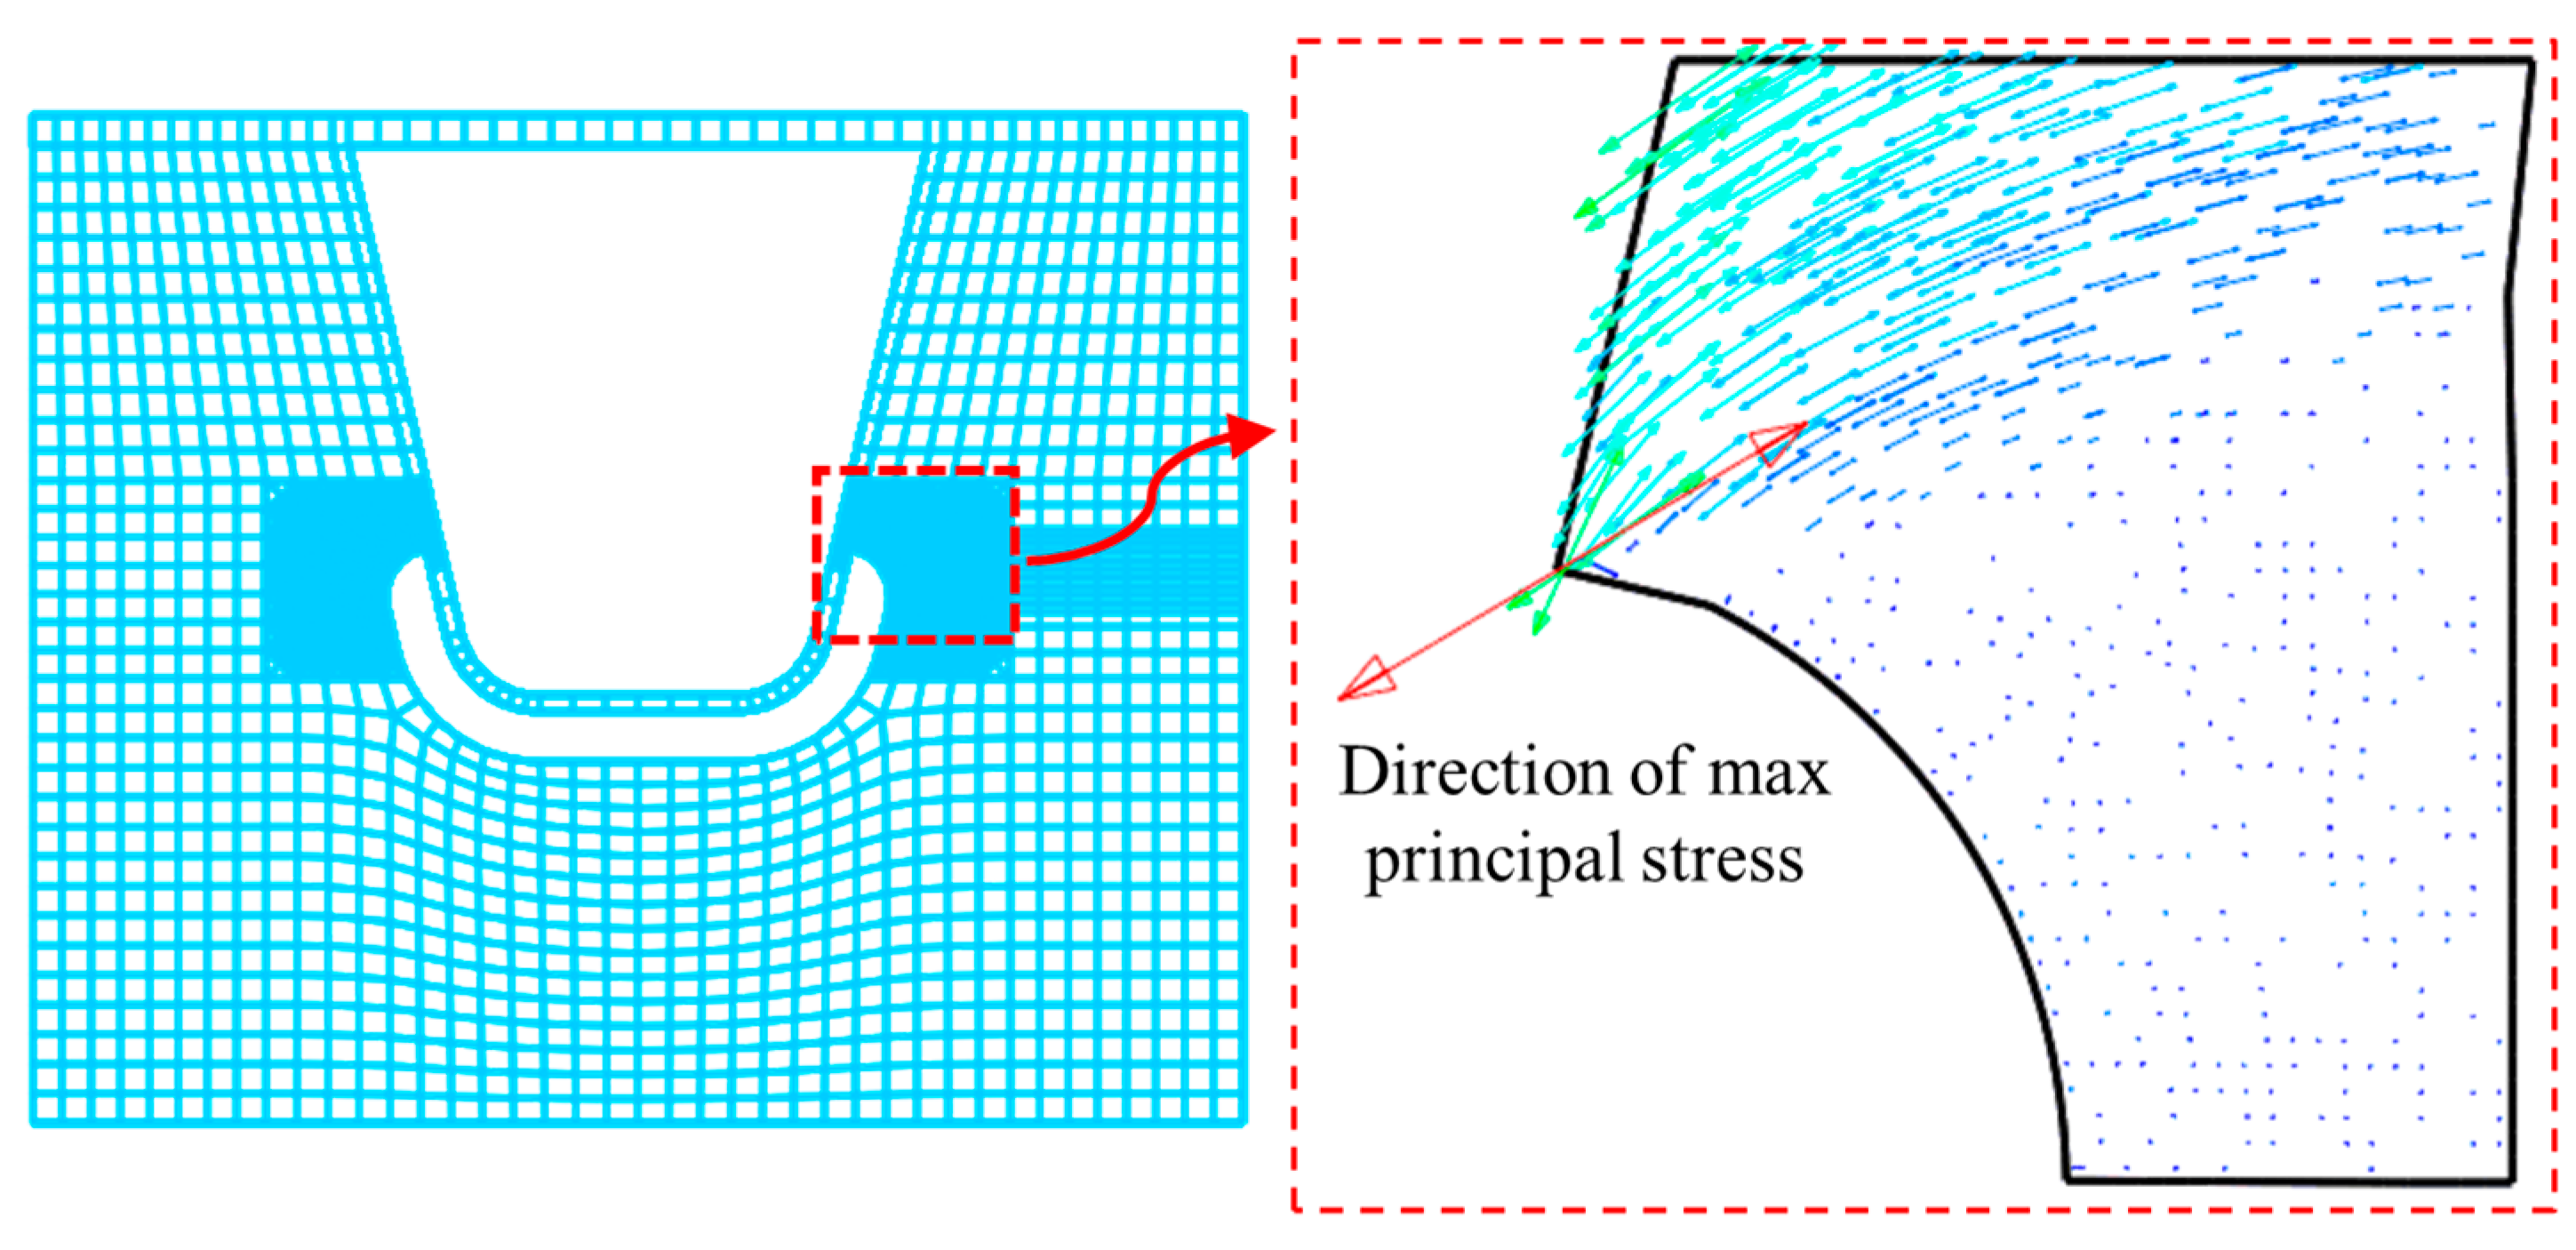
To establish a scientifically grounded preventive framework, the principal stress distributions in the DU welds were analyzed, as illustrated in Figure 11. The maximum principal stress was consistently observed to manifest as tensile stress oriented perpendicular to the weld axis, with characteristic angular deviations. Furthermore, as established in Section 3, diaphragm deformation induces measurable stress intensification at DU weld locations. Based on these mechanistic insights, the strategic application of residual compressive stresses through controlled surface treatment techniques was proposed as an effective countermeasure. This approach was designed to neutralize deformation-induced tensile stress components through targeted stress state modification, thereby enhancing fatigue resistance while maintaining structural continuity.
Hammer peening represents a non-destructive surface treatment technique that has been demonstrated to effectively delay fatigue crack initiation through two synergistic mechanisms as follows: (1) the enhancement of surface material densification and (2) the introduction of beneficial compressive residual stresses. When applied to DU welds, this technique induces compressive stress fields that modify local stress distributions, thereby extending fatigue life. In the present study, a three-pass hammer peening protocol was implemented at deformation-affected DU weld locations to ensure optimal treatment quality. The treatment parameters were carefully controlled, with a 50 mm peening length along the weld axis, 90 Hz impact frequency, and 5 × 5 mm hammer head contact area. The operational stability was maintained by limiting the hammer peening height to below 5 mm during all procedures.
The hammer peening process was systematically executed through three distinct stages, as illustrated in Figure 12 [11]. The treatment sequence was designed as follows: (a) vertical impacts were applied to the diaphragm surface, generating localized plastic deformation at the weld–diaphragm intersection zones; (b) subsequent vertical impacts were directed at the weld surface, producing continuous depressed plastic deformation profiles along the weld–diaphragm interface; (c) the final impacts were concentrated at the weld–diaphragm intersection regions to achieve uniform surface deformation profiles and ensure geometric continuity. This sequential approach has been shown to optimize stress redistribution while maintaining structural integrity.
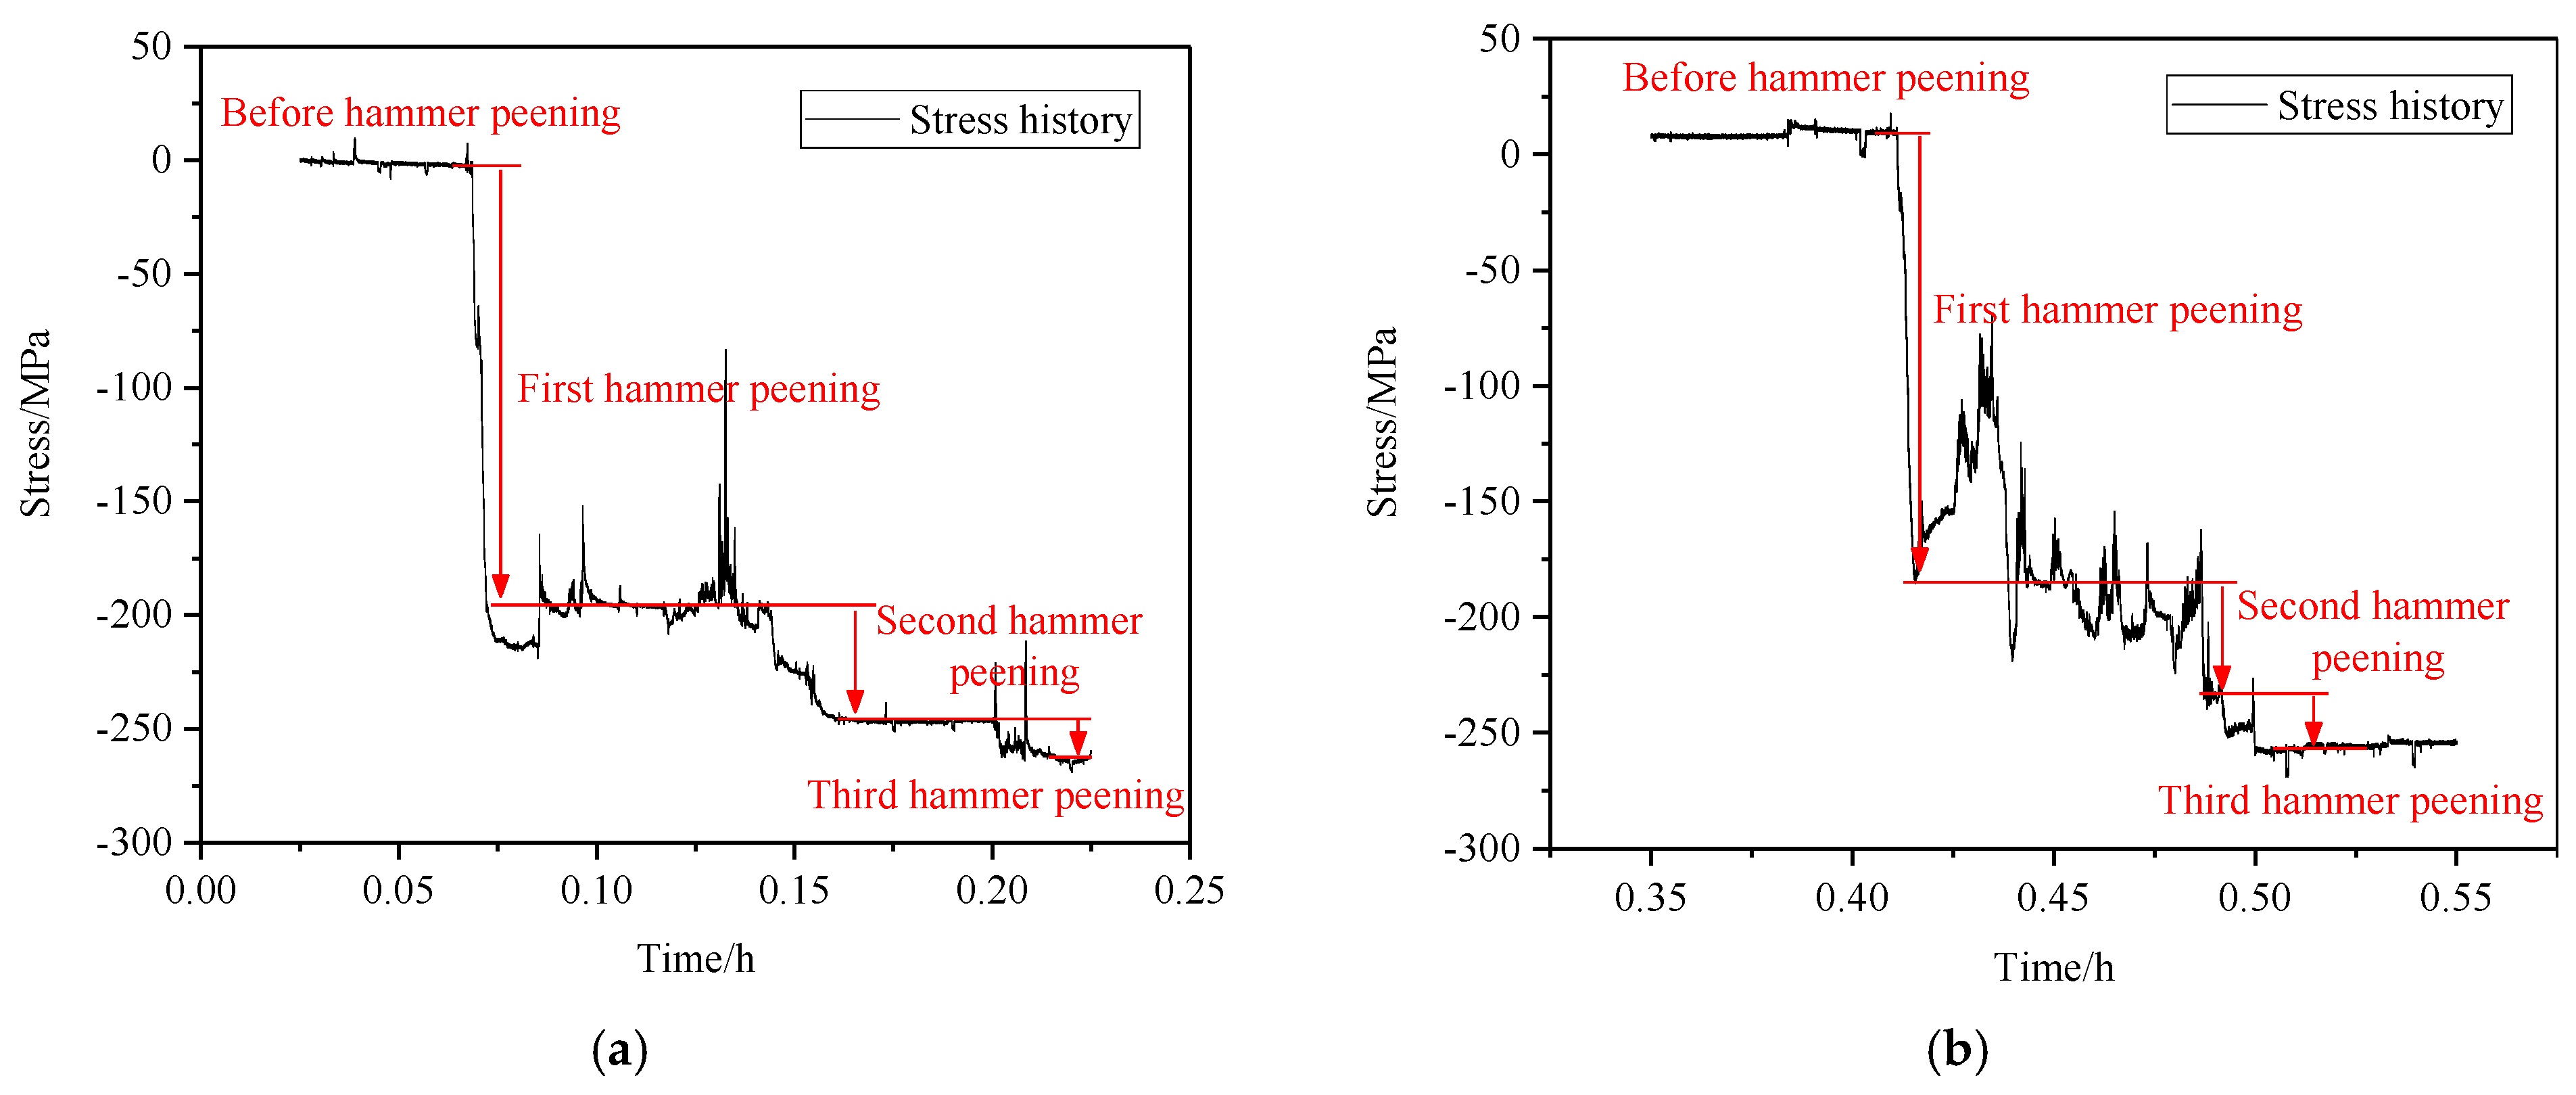
To validate the efficacy of the implemented preventive measures and quantitatively assess the structural modifications induced by the hammer peening, comprehensive in situ stress monitoring was conducted on an operational bridge, with the experimental setup illustrated in Figure 13. Stress response data were acquired under actual traffic loading conditions at a sampling frequency of 256 Hz, enabling a detailed comparison of the stress histories at DU weld locations before and after the treatment, as presented in Figure 14. The pre-treatment measurements revealed that the DU welds exhibited characteristic tension–compression stress cycles or pure tensile stress cycles. Following hammer peening implementation, compressive residual stresses averaging 250 MPa were successfully introduced, resulting in the complete transformation of stress cycle patterns to predominantly compressive states. The measured residual compressive stresses were oriented normal to the weld direction.
The magnitude of the Induced compressive stresses was demonstrated to significantly exceed that of the deformation-induced tensile stress components, effectively establishing a compressive stress regime at the treated DU weld locations under operational loading conditions. This stress state modification, characterized by favorable stress ratio alterations, has been shown to effectively delay fatigue crack initiation and propagation. The experimental results conclusively demonstrate that hammer peening represents a non-invasive strengthening technique capable of substantially enhancing the fatigue performance in deformation-affected DU welds while maintaining structural integrity.

4.2. Steel Plate Strengthening

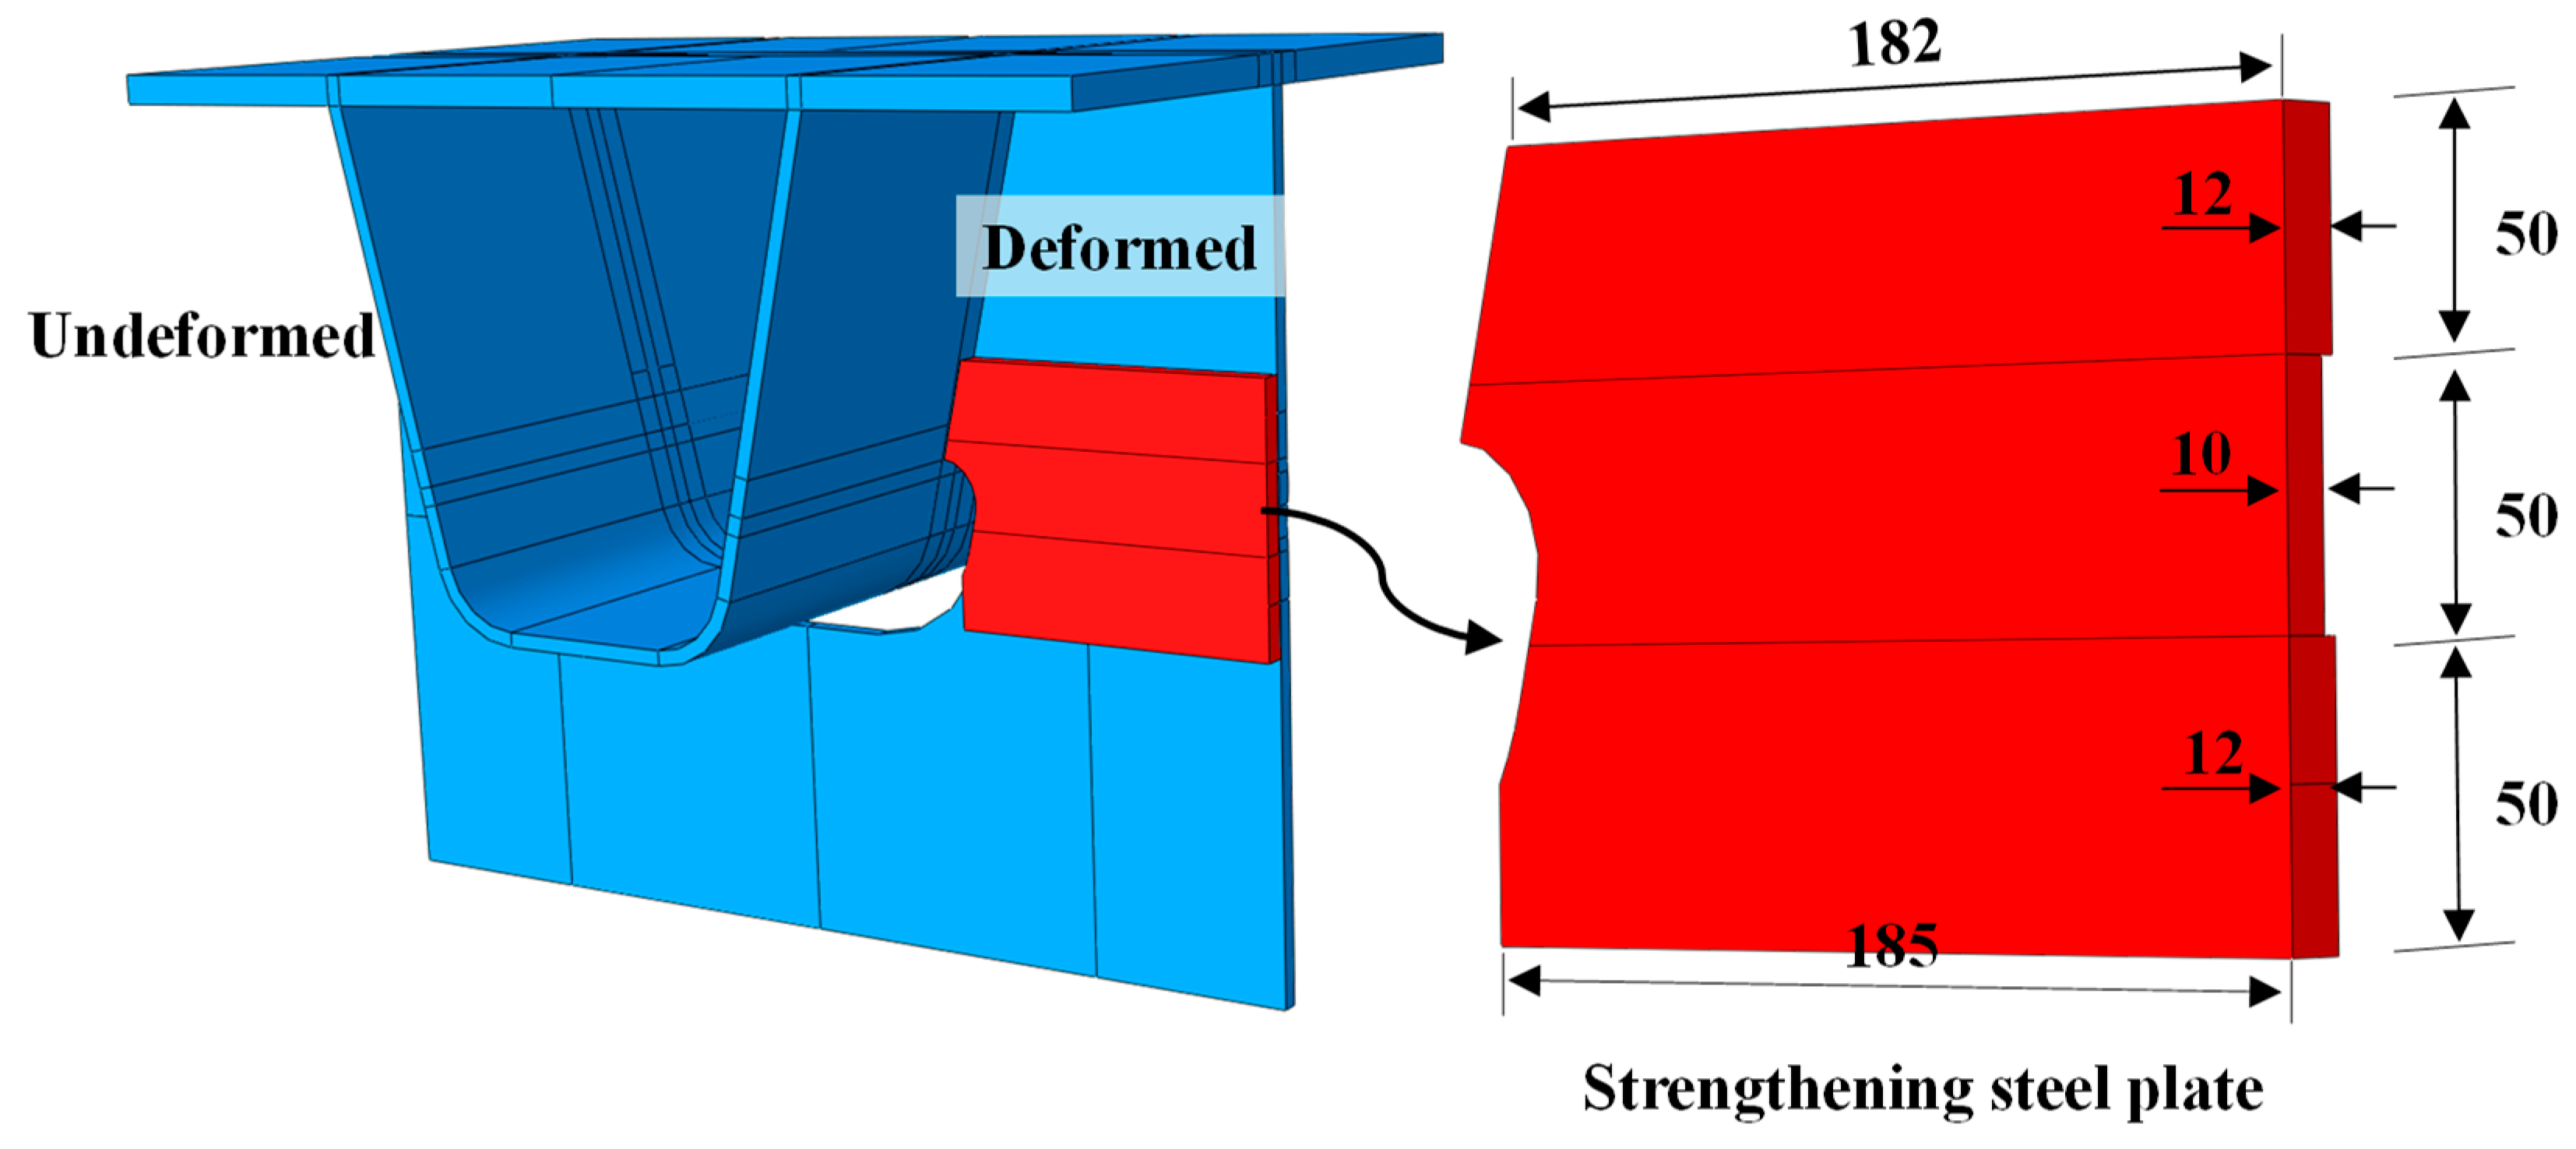
According to the above analysis, the disequilibrium of stiffness on both sides of the U ribs caused by diaphragm deformation changed the stress state of the DU and increased the risk of fatigue cracking. Therefore, setting a steel plate at the deformation part was considered to improve the stress state of the DU. The scheme and steel plate size are shown in Figure 15. The steel plate was tied to the deformed diaphragm in the FEM.
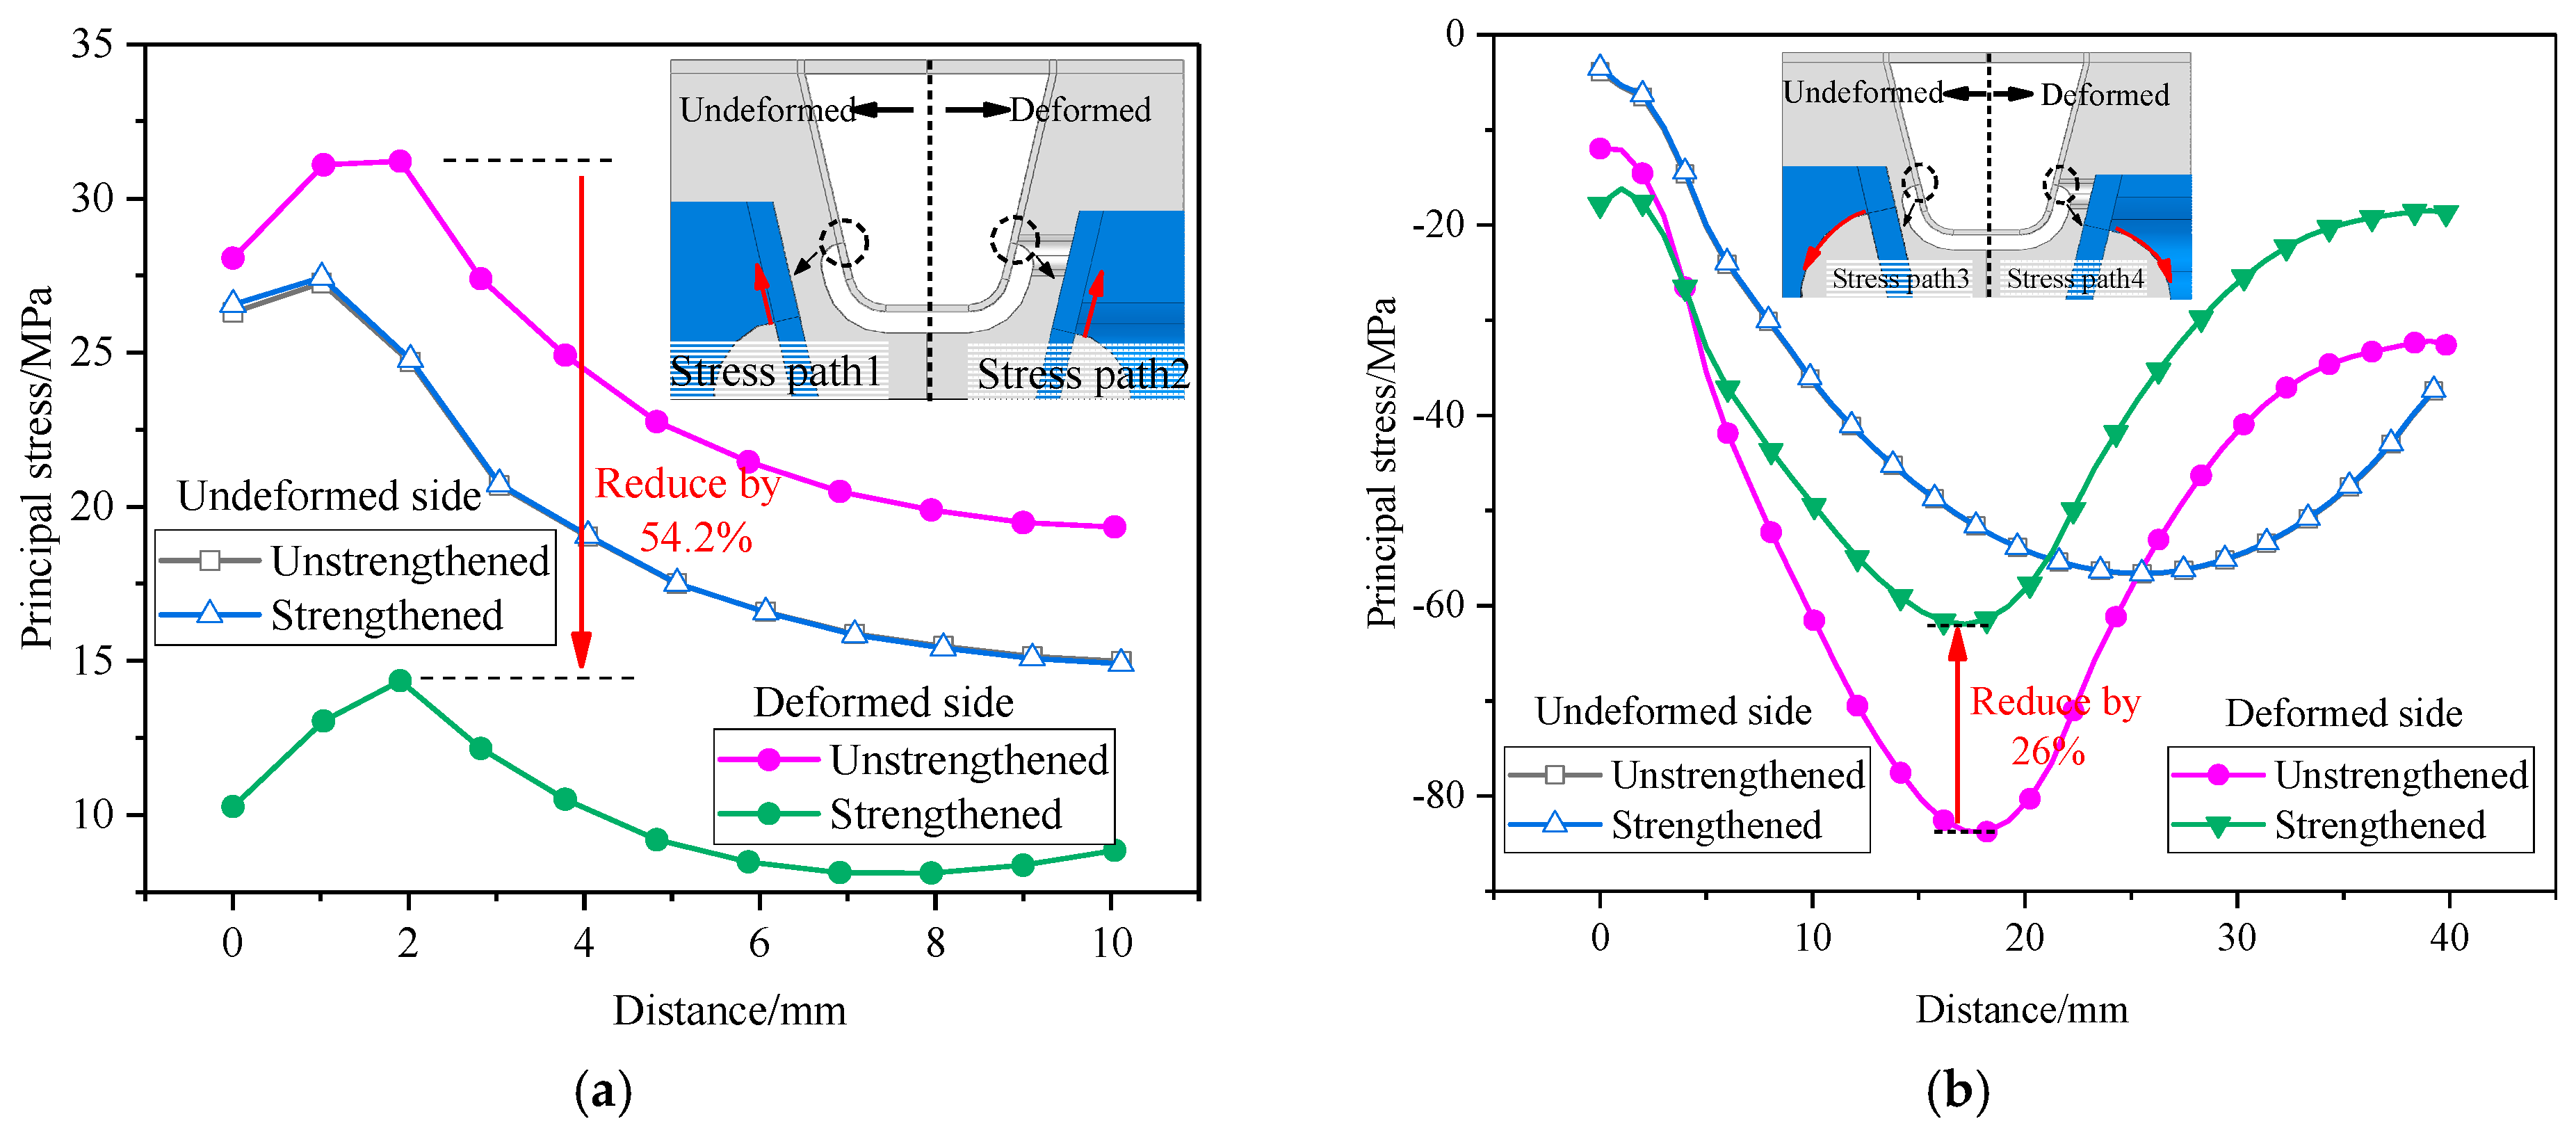
To clarify the effect of steel plate strengthening, the principal stresses of the DU weld and arc notch in the deformation area were analyzed. Figure 16a shows that the DU weld stresses on the undeformed side did not change before and after reinforcement, while the DU weld stresses on the deformed side changed significantly after reinforcement and the peak stress decreased by 54.2%. Figure 16b shows that the arc notch on the undeformed side was in a state of compression before and after reinforcement, and the stresses did not change; meanwhile, the peak stress of the arc notch on the deformed side decreased by 26% after reinforcement, which also indicates that the stiffness of the arc notch was strengthened. In conclusion, on the deformed side of the DU, the steel plate strengthening method could improve the stiffness of the deformation area and effectively reduce the principal stress of the DU weld and the arc notch. For the undeformed side of the DU, steel plate strengthening does not affect the stress state of the original structure and could be used to improve the mechanical performance of the deformation area.

4.3. Classified Maintenance Suggestions

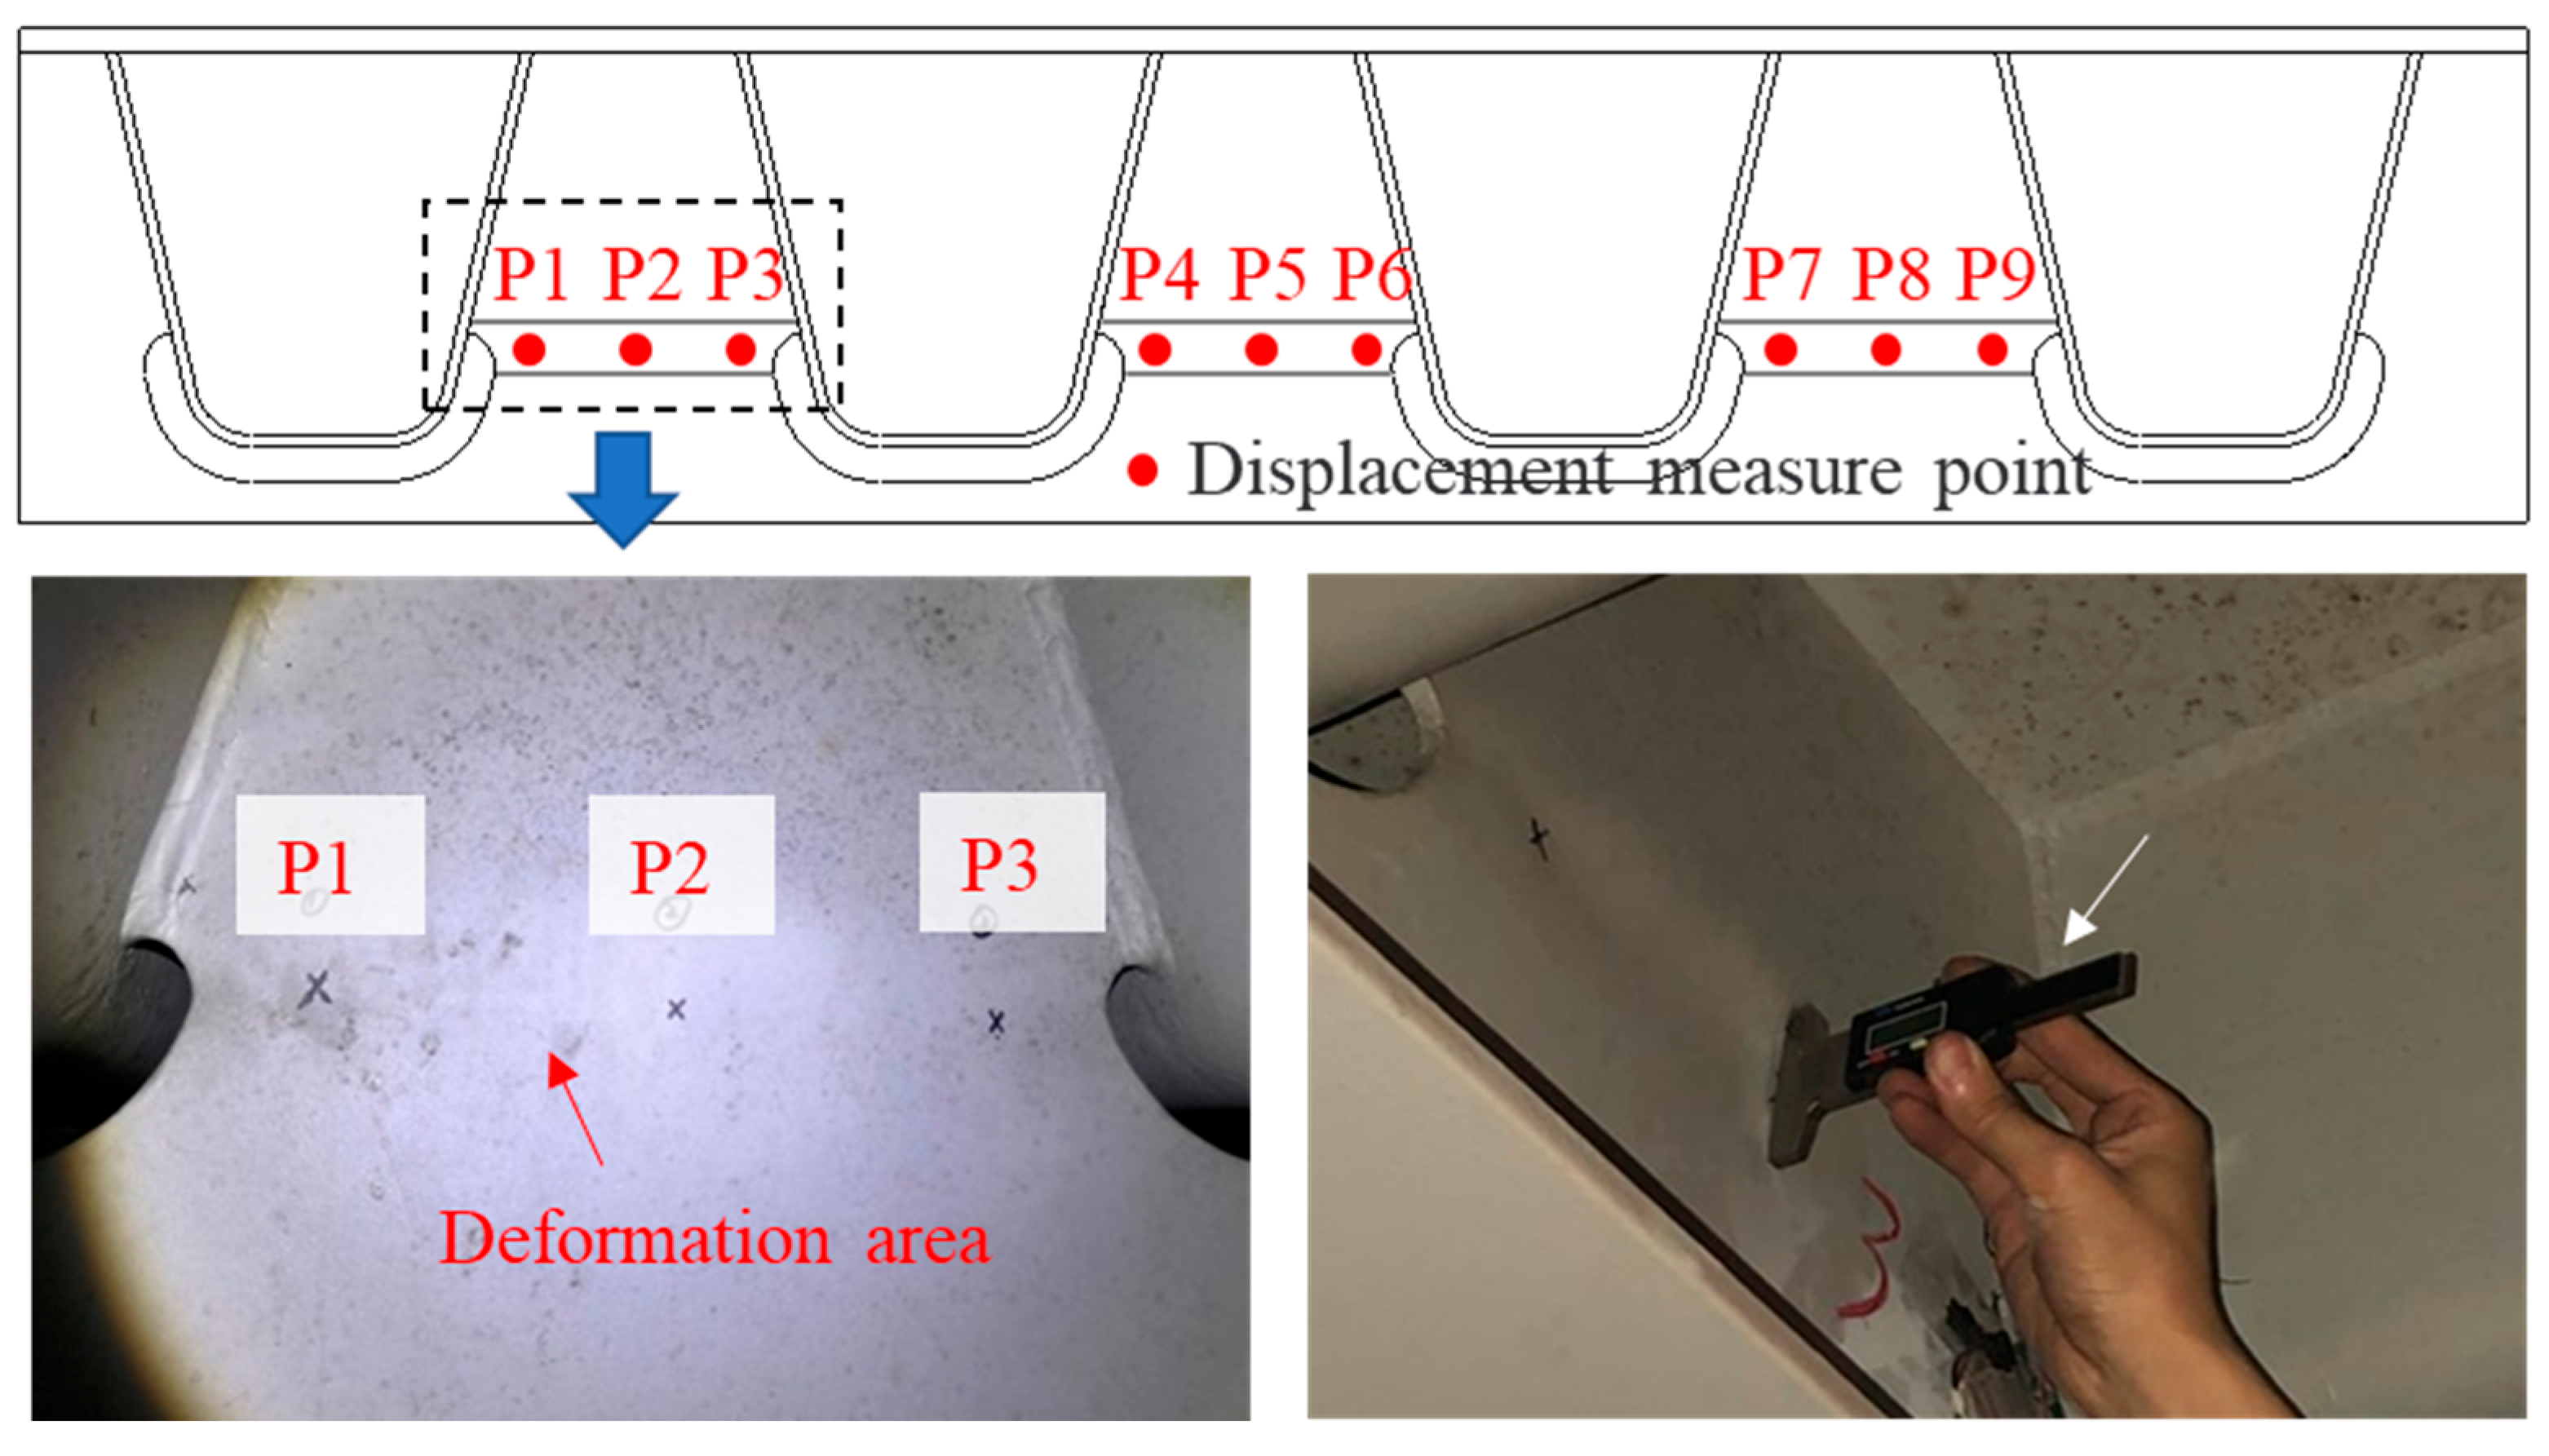
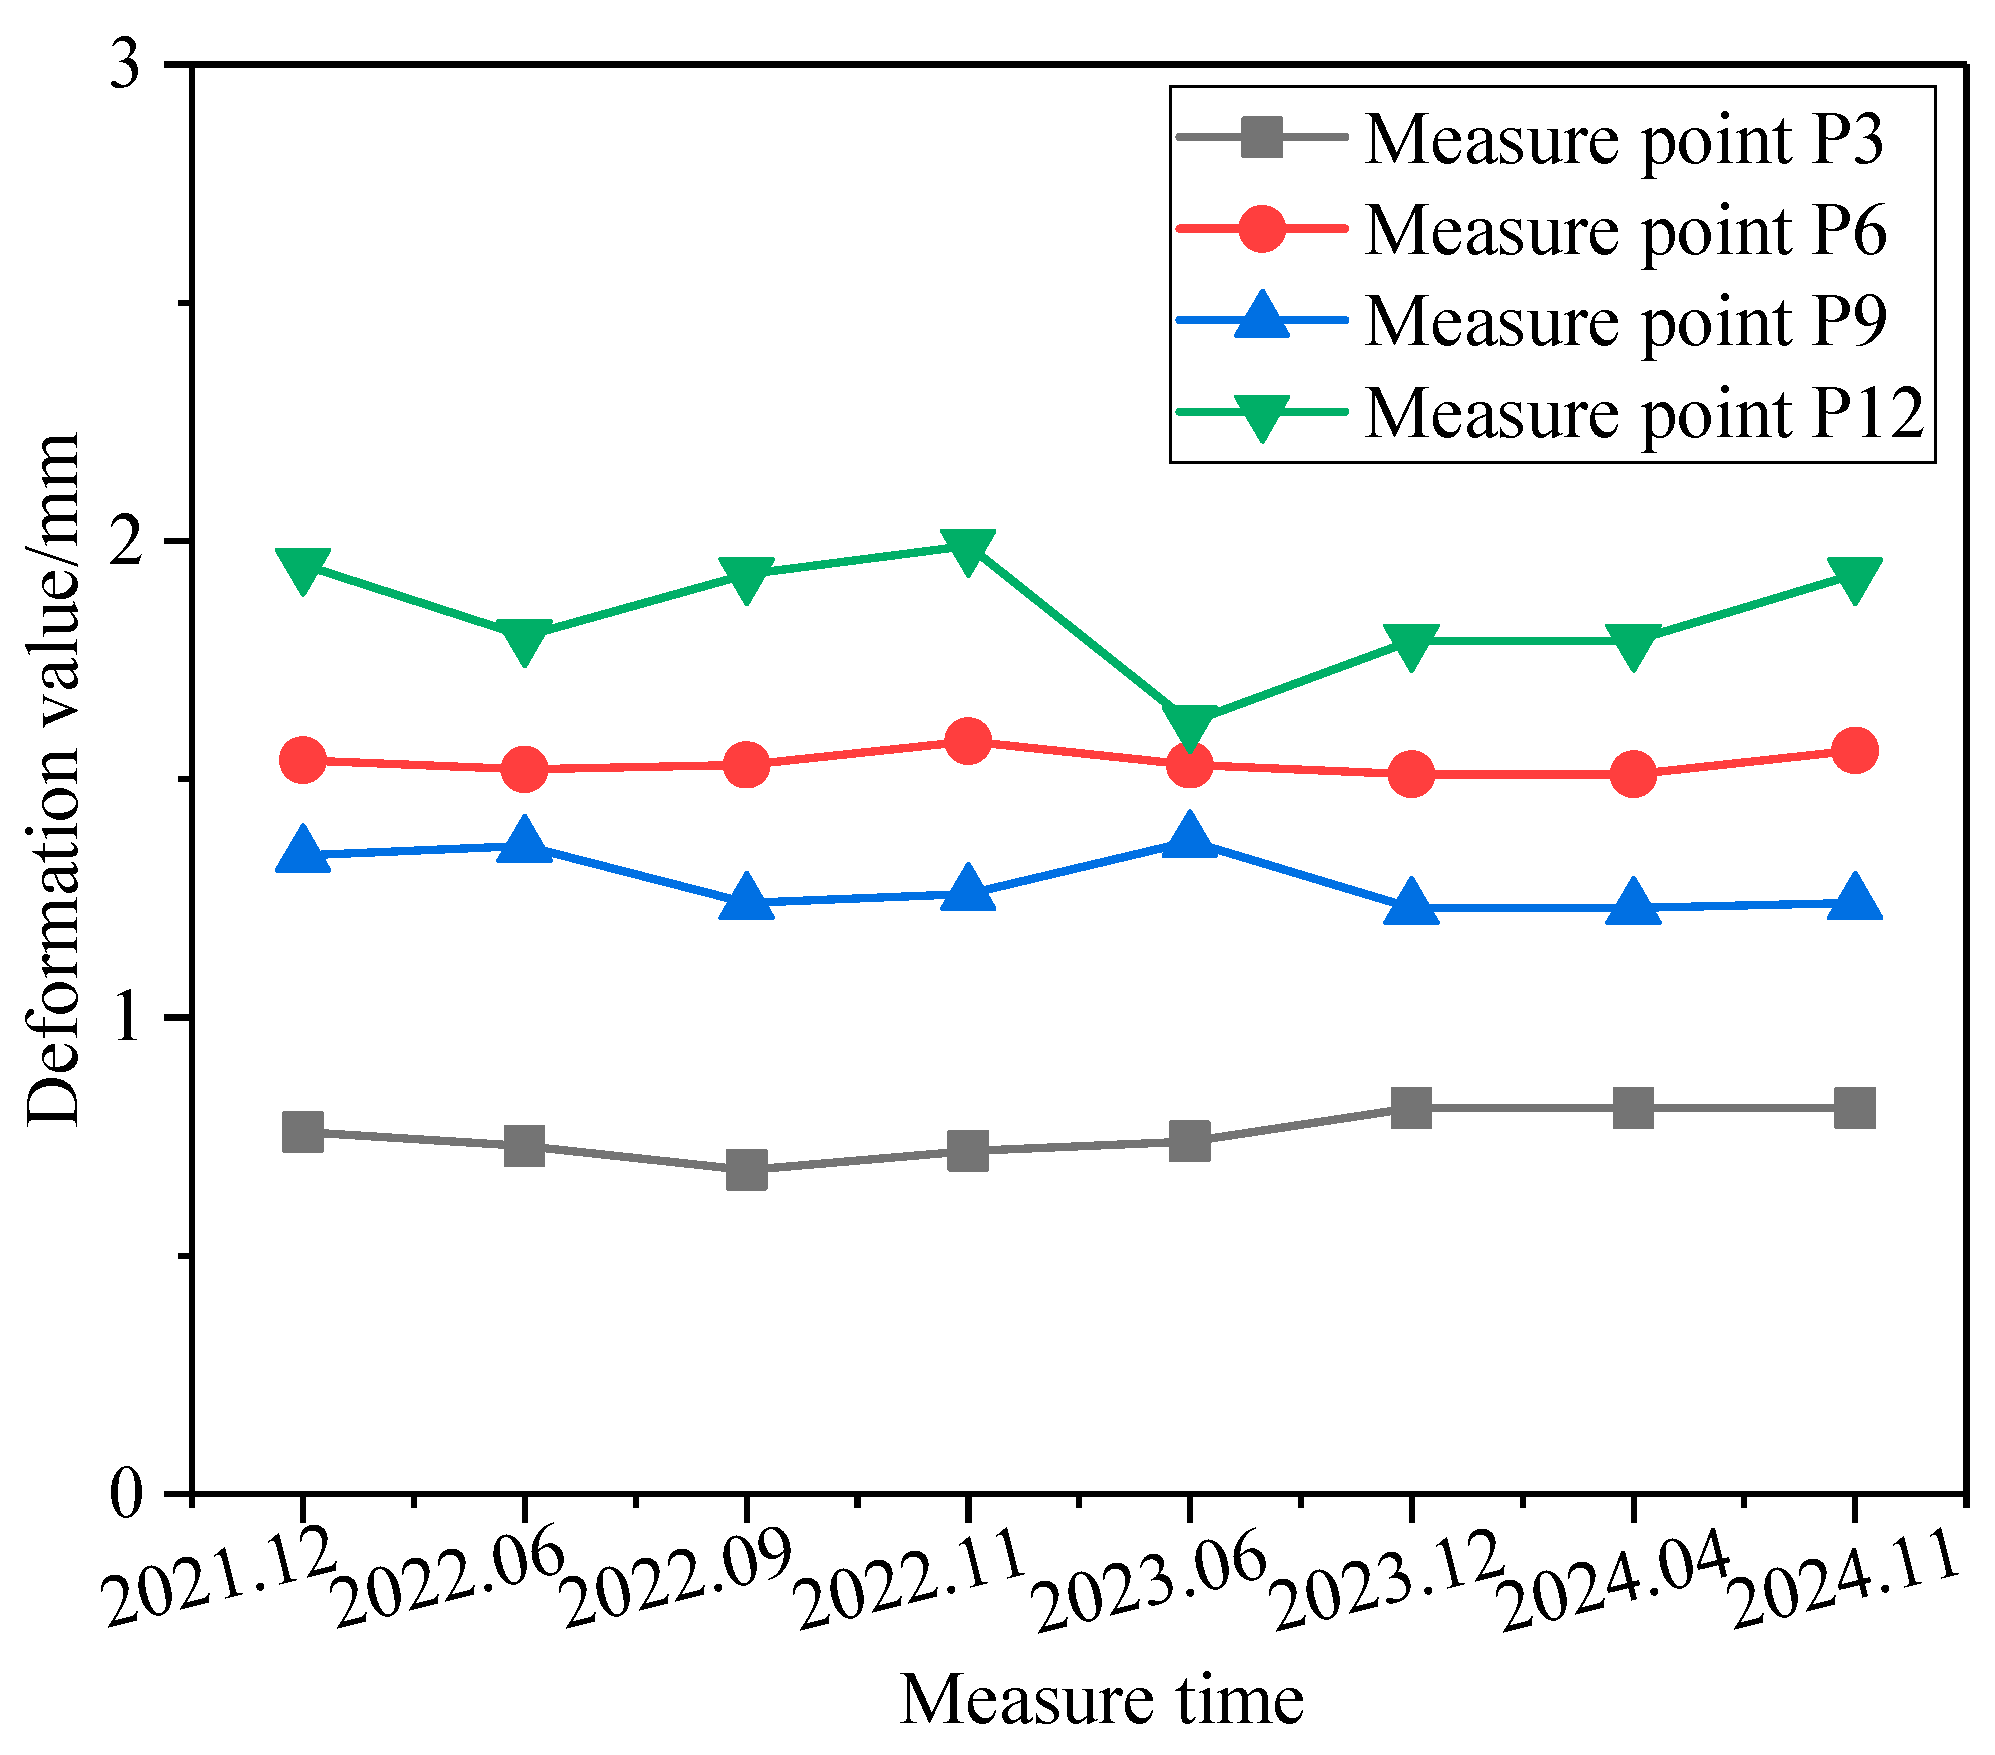
According to the above analysis, diaphragm deformation only affects the stress state of the details on the deformed side of the DU weld, but it has little effect on the overall stress. Therefore, only maintenance measures should be carried out for the details on the deformed side. Considering that the arc notch is mainly subjected to compressive stress (Figure 16b) and is not affected by welding defects and other factors, the cracking risk is small compared with the DU weld, which means that priority can be given to the preventive maintenance of DU welds in the deformed area. In addition, according to long-term follow-up monitoring (see Figure 17 and Figure 18), diaphragm deformation is currently in a stable state, which indicates that there is no need to reinforce the deformed parts. The long-term monitoring data of the diaphragm deformation are presented in Appendix B. To maintain the integrity of the structure and avoid secondary damage, it is suggested that the DU weld in the deformed area be strengthened by hammer peening.
Considering that diaphragm deformation could further develop under vehicle load, it is suggested to enhance the detection of OSD and measure the deformation value regularly. Once deformation is found to increase or tend to increase, a steel plate can be applied at the deformed part in time, as shown in Figure 15. Steel plate strengthening can not only enhance the bearing capacity of the deformed part, but it may also improve fatigue performance.

5. Conclusions

This study presented the effects of diaphragm deformation and buckling on the fatigue performance and stress characteristics of diaphragm-to-U-rib (DU) welds. A classified maintenance scheme was proposed to relieve the adverse impact caused by diaphragm deformation. The conclusions are as follows:
(1)
Field measurements reveal distinct stress responses to diaphragm deformation. While the structural stress and fatigue performance at the normal regions of DU welded joints remain largely unchanged, the distorted regions show significant stress amplification, with stress ranges increasing by 50%. These results highlight the importance of prioritizing inspection of distortion-affected areas in operational bridges.
(2)
On the distorted side of the diaphragm, stresses in the DU weld and both in-plane and out-of-plane deformations perpendicular to the weld increase significantly. Stress concentrations shift from the arc notch section toward the depressed zone of the diaphragm, accompanied by a rise in both the number of stress concentration points and the simulated stress magnitude, the latter increasing by 72.6%, elevating the risk of DU welded joint cracking.
(3)
Based on the mechanical behavior of the deformed region, it is suggested to implement regular inspections and graded maintenance strategies corresponding to the progression of the deformation. For areas exhibiting minor and stable deformation, hammer peening proves effective for enhancing fatigue resistance at this stage. However, steel plate reinforcement is more appropriate when addressing advanced diaphragm deformation.
This study investigates the effects of diaphragm deformation on the stress characteristics of orthotropic steel decks (OSDs) and proposes scientifically grounded treatment strategies. While the primary causative factors of diaphragm deformation in this case remain undetermined, subsequent investigations will examine the following three potential contributors: material defects, manufacturing deviations, and load sensitivity. These analyses are expected to establish fundamental guidelines for the optimal design and construction of comparable structures.

Author Contributions

Conceptualization: C.L.; methodology: C.L.; software: C.L. and Y.Y.; validation: C.L. and Y.Y.; formal analysis: C.L. and Z.L.; investigation: C.L. and Y.Y.; resources: B.J.; data curation: C.L. and Z.L.; writing—original draft preparation: C.L.; writing—review and editing: B.J. and Y.Y.; visualization: Z.L.; supervision: B.J.; project administration: B.J.; funding acquisition, B.J. and Y.Y. All authors have read and agreed to the published version of the manuscript.

Funding

This research is funded by the National Natural Science Foundation of China [Grant No. 52378153] and the Construction System Technology Project of Jiangsu [Grant No. 2024ZD035].

Institutional Review Board Statement

Not applicable.

Informed Consent Statement

Not applicable.

Data Availability Statement

The original contributions presented in this study are included in the article. Further inquiries can be directed to the corresponding author.

Conflicts of Interest

The authors declare no conflicts of interest.

Abbreviations

OSDOrthotropic steel deck
DUDiaphragm-to-U-rib

Appendix A

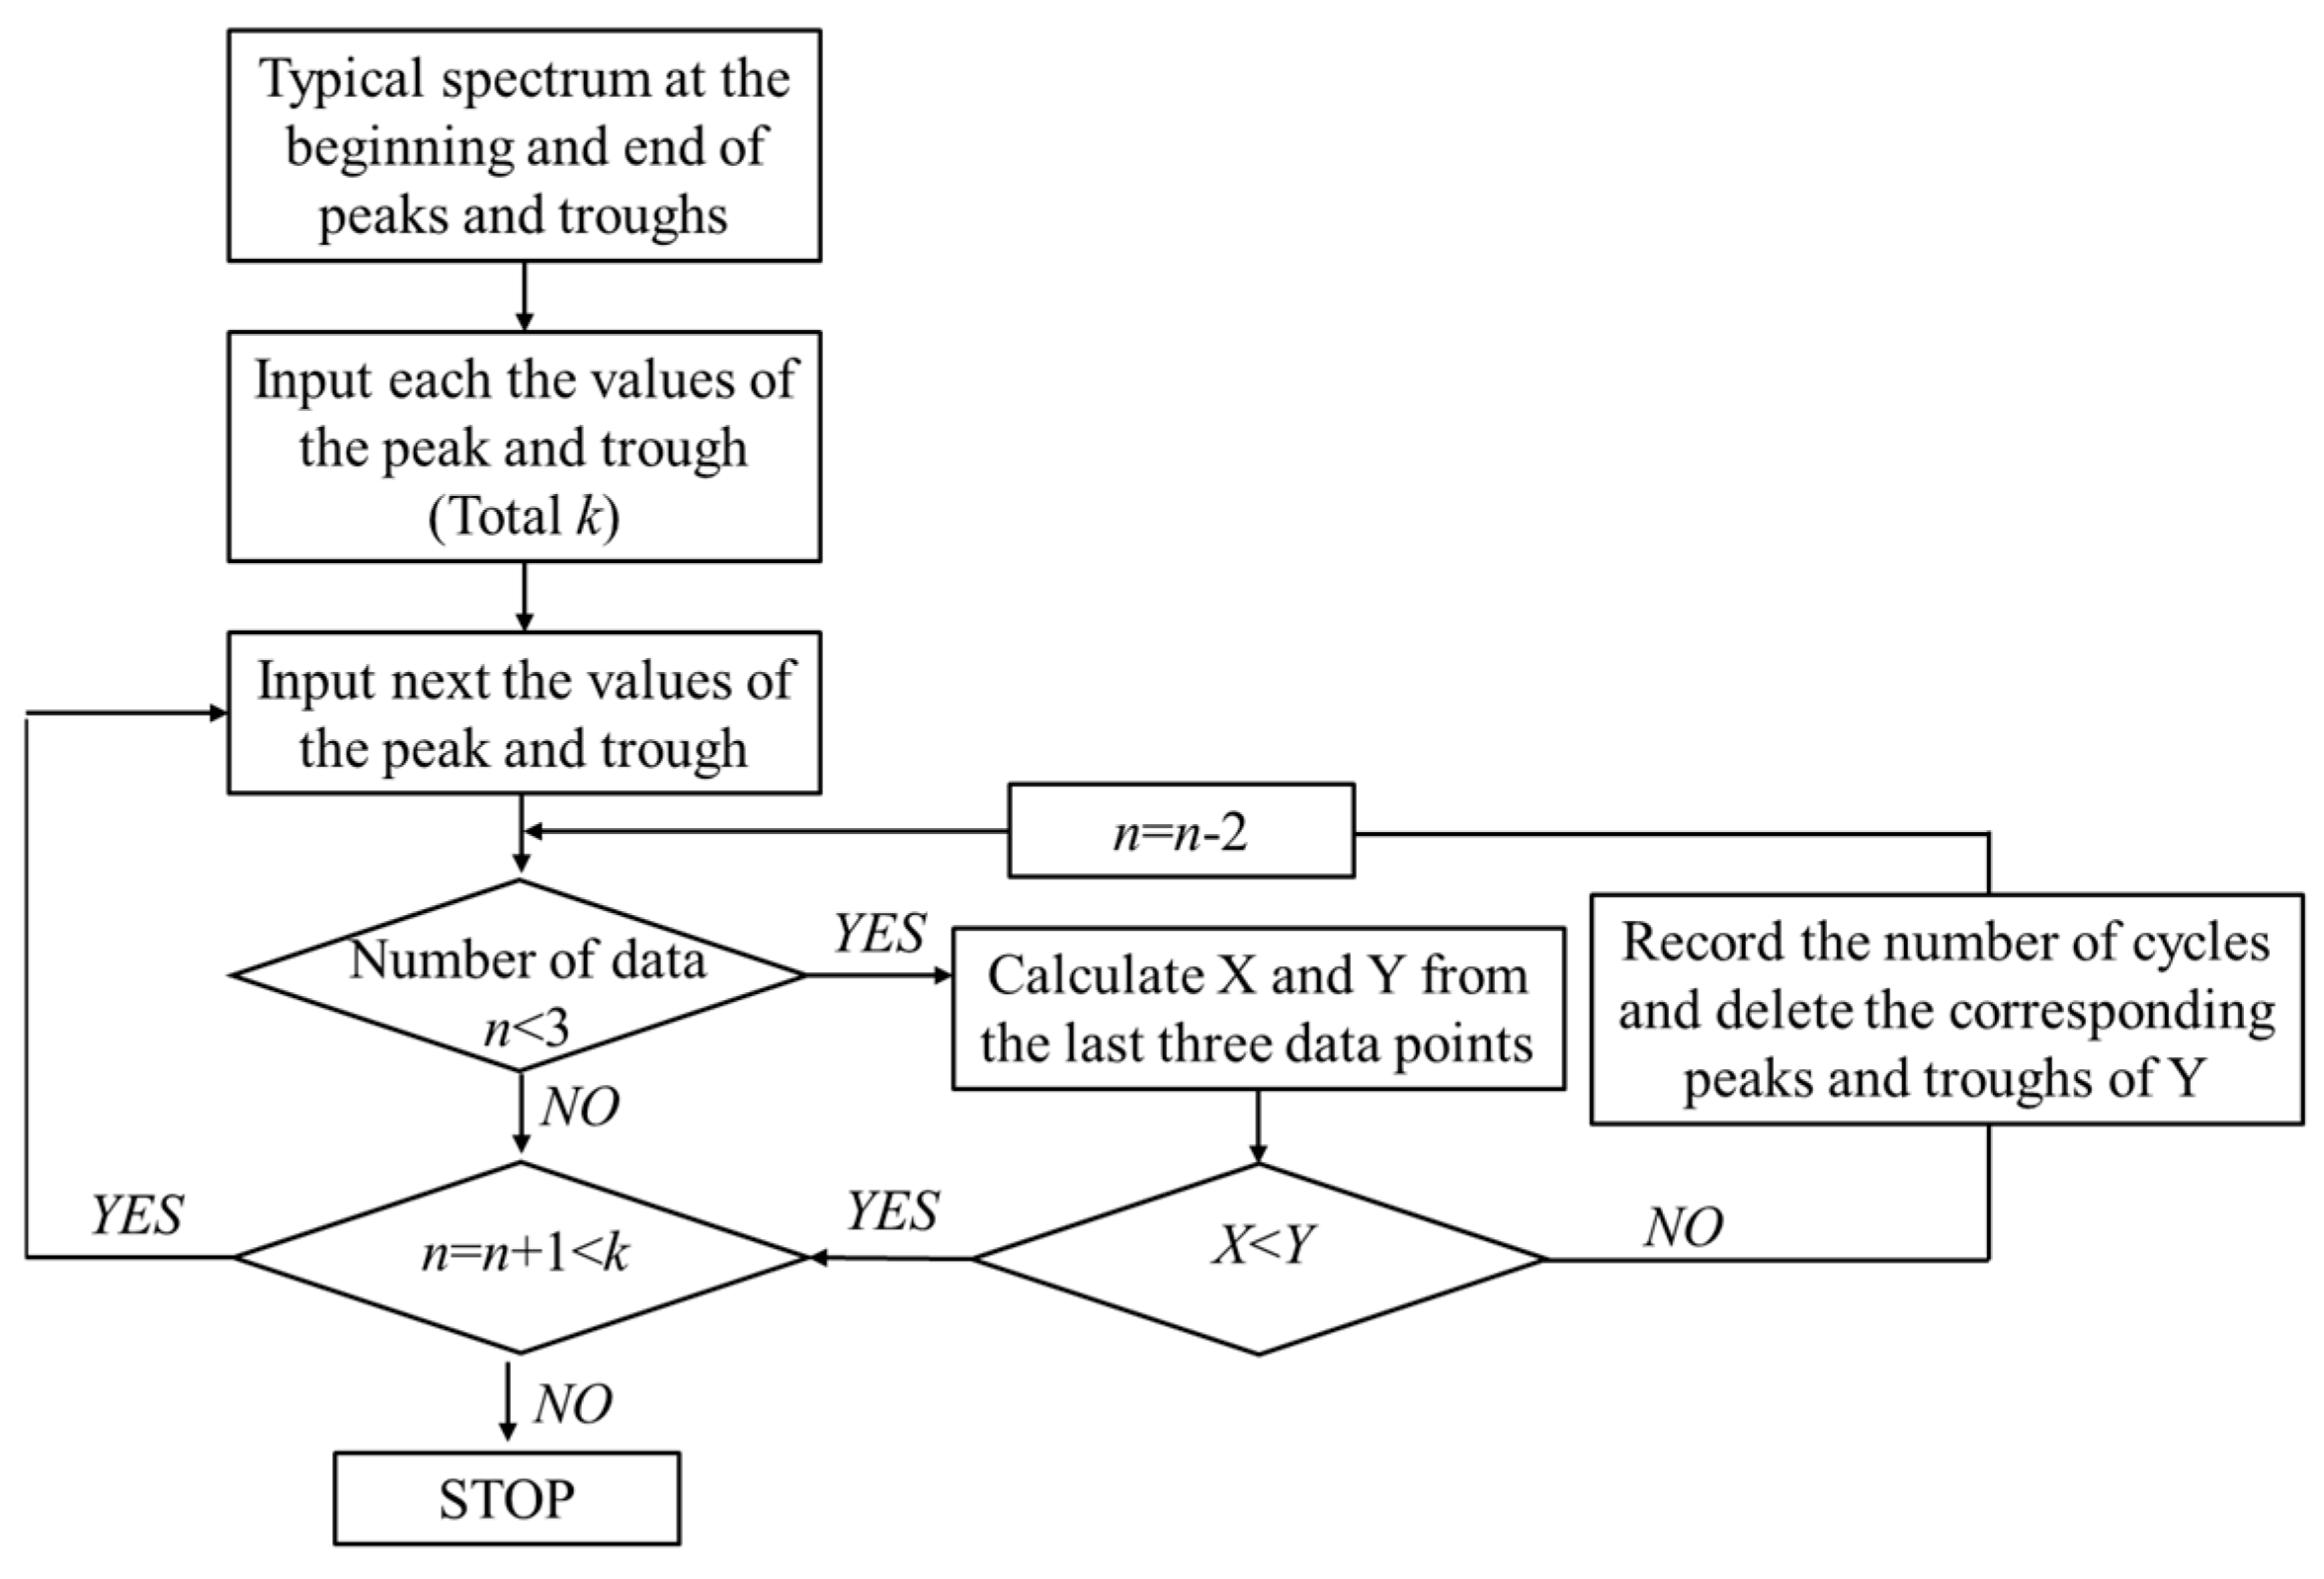
To facilitate the development of the rain-flow program, it is important to clarify the calculation rules of the rain-flow method, providing a reference for the program preparation. The detailed steps are as follows: (1) Select a typical segment of the spectrum, beginning at the crest or trough of the wave, and input the values for each crest and trough in the order of the load spectrum until the data are complete. (2) Input the values of the next peak and trough. If the data processing is complete, stop. (3) If the number of data points is fewer than three, return to step (2). If the number of data points is three or more, calculate the variables X and Y, based on the three entered peaks and troughs. The absolute difference between data point 1 and data point 2 is Y, and the absolute difference between data points 2 and 3 is X. (4) Compare the values of X and Y. If X < Y, return to step (2); if X > Y, proceed to step (5). (5) Record the variable Y as a loop, delete the corresponding peaks and troughs for Y, and return to step (3). The simplified framework of the rain-flow counting technique is illustrated in Figure 2.
Figure A1. Calculation procedure of the simplified rain-flow method.
Applsci 15 04245 g0a1

Appendix B

The long-term tracking measuring points of diaphragm deformation are shown in Figure A1. Table A1 shows the tracking data of the deformed values. “-” in Table A1 represents invalid data. From the tracking data, it can be seen that the deformed values are small, and deformation is always in a stable state.
Table A1. Tracking detection of deformation development.
Displacement Measure PointsDeformation Values/mm
2021.122022.062022.092022.112023.62023.122024.042024.11
P11.281.261.301.321.361.301.301.36
P21.421.281.62-1.441.491.491.34
P30.760.730.680.720.740.810.810.81
P41.17-0.921.090.980.940.940.99
P51.291.341.411.461.341.251.251.36
P61.541.521.531.581.531.511.511.56
P71.501.421.411.481.461.321.32-
P8-1.191.181.161.231.081.081.07
P91.341.361.241.261.371.231.231.24
P10-0.881.160.970.530.980.980.8
P110.80.920.990.890.761.86-0.82
P121.951.801.931.991.621.791.791.93

References

  1. Oh, C.K.; Bae, D. Fatigue test of an advanced orthotropic steel deck system using high performance steel for bridges. Int. J. Steel Struct. 2013, 13, 93–101. [Google Scholar] [CrossRef]
  2. Liu, J.; Guo, T.; Feng, D.M.; Liu, Z.X. Fatigue performance of rib-to-deck joints strengthened with FRP angles. J. Bridge Eng. 2018, 23, 04018060.1–04018060.14. [Google Scholar] [CrossRef]
  3. Wang, K.N.; Jie, Z.Y.; Liang, S.D.; Zhuge, P. Fatigue assessment of U-rib full penetration welded joints based on local methods. J. Constr. Steel Res. 2023, 200, 107684. [Google Scholar] [CrossRef]
  4. Luo, P.J.; Zhang, Q.H.; Bao, Y.; Bu, Y.Z. Fatigue performance of welded joint between thickened-edge U-rib and deck in orthotropic steel deck. Eng. Struct. 2019, 181, 699–710. [Google Scholar] [CrossRef]
  5. Jiang, F.; Ding, Y.L.; Song, Y.S.; Geng, F.F.; Wang, Z.W. Digital Twin-driven framework for fatigue life prediction of steel bridges using a probabilistic multiscale model: Application to segmental orthotropic steel deck specimen. Eng. Struct. 2021, 241, 112461. [Google Scholar] [CrossRef]
  6. Srinivasa, C.V.; Kumar, W.P.P.; Kumar, M.T.P.; Bangar, A.R.; Kumar, P.; Rudresh, M.S. Experimental and numerical studies on buckling of laminated composite skew plates with circular holes under uniaxial compression. Mech. Adv. Mater. Struct. 2017, 24, 304–317. [Google Scholar] [CrossRef]
  7. He, J.X.; Ren, M.F.; Huang, Q.Z.; Shi, S.S.; Chen, H.R. Buckling behavior of compression-loaded advanced grid stiffened composite cylindrical shells with reinforced cutouts. Polym. Polym. Compos. 2011, 19, 357–362. [Google Scholar] [CrossRef]
  8. Di, Z.; Zheng, X.T.; Wu, T.C. Damage characteristics of open-hole laminated composites subjected to longitudinal loads. Compos. Struct. 2019, 230, 111474. [Google Scholar] [CrossRef]
  9. Li, X.W. Analysis of Plate Parts Local Damage at the Pivot Point of Steel Box Girder During Construction. Master’s Thesis, Chongqing Jiaotong University, Chongqing, China, 2018. (In Chinese). [Google Scholar] [CrossRef]
  10. Yan, R.Z.; Zhu, M.H.; Wang, S.; Zhou, J.T.; LIu, X.Y. Damage mechanism analysis for steel box girder of a sea-crossing bridge during temporary storage process and strengthening measures. World Bridges 2019, 47, 80–85. (In Chinese) [Google Scholar] [CrossRef]
  11. Yao, Y.; Ji, B.H.; Li, Y.F.; Fu, Z.Q.; Chen, Z.Z. Diaphragm splicing deviation in steel bridge deck: Effect on fatigue performance and its preventive measures. J. Perform. Constr. Facil. 2021, 35, 04021008. [Google Scholar] [CrossRef]
  12. Wang, B.H. Fatigue assessment of the diaphragm-to-rib welded connection in orthotropic steel deck using effective notch stress approach. J. Fail. Anal. Prev. 2015, 15, 65–73. [Google Scholar] [CrossRef]
  13. Corte, W.D. Parametric study of floorbeam cutouts for orthotropic bridge decks to determine shape factors. J. Bridge Struct. 2009, 5, 75–85. [Google Scholar] [CrossRef]
  14. Chen, C.Y. Fatigue and Fracture, 1st ed.; Huazhong University of Science & Technology Press: Wuhan, China, 2002; pp. 37–41. (In Chinese) [Google Scholar]
  15. Amzallag, C.; Gerey, J.P.; Robert, J.L.; Bahuaud, J. Standardization of the rainflow counting method for fatigue analysis. Int. J. Fatigue 1994, 16, 287–293. [Google Scholar] [CrossRef]
  16. EN 1993-1-9; Eurocode3: Design of Steel Structures, Part 1-9: Fatigue Strength of Steel Structure. European Commission: Brussels, Belgium, 2003.
  17. Kwon, K.; Frangopol, D.M. Bridge fatigue reliability assessment using probability density functions of equivalent stress range based on field monitoring data. Int. J. Fatigue 2010, 32, 1221–1232. [Google Scholar] [CrossRef]
  18. Liu, M.; Frangopol, D.M.; Kwon, K. Optimization of retrofitting distortion-induced fatigue cracking of steel bridges using monitored data under uncertainty. Eng. Struct. 2010, 32, 3467–3477. [Google Scholar] [CrossRef]
  19. Chmelko, V. Cyclic anelasticity of metals. Kov. Mater. Met. Mater. 2014, 52, 353–359. [Google Scholar] [CrossRef]
  20. JTG D64; Specification for Design of Highway Steel Bridge. JTG (Highway China) Transportation: Beijing, China, 2015. (In Chinese)
  21. Wang, Y.X.; Fu, Z.Q.; Ge, H.B.; Ji, B.H.; Hayakawa, N. Cracking reasons and features of fatigue details in the diaphragm of curved steel box girder. Eng. Struct. 2021, 201, 109767. [Google Scholar] [CrossRef]
  22. Kainuma, S.; Yang, M.Y.; Jeong, Y.S.; Inokuchi, S.; Kawabata, A.; Uchida, D. Experiment on fatigue behavior of rib-to-deck weld root in orthotropic steel decks. J. Constr. Steel Res. 2016, 119, 113–122. [Google Scholar] [CrossRef]
  23. Cheng, B.; Cao, X.E.; Ye, X.H.; Cao, Y.S. Fatigue tests of welded connections between longitudinal stringer and deck plate in railway bridge orthotropic steel decks. Eng. Struct. 2017, 153, 32–42. [Google Scholar] [CrossRef]
  24. Zhu, J.C.; Barsoum, I.; Barsoum, Z.; Khurshid, M. Evaluation of local stress-based fatigue strength assessment methods for cover plates and T-joints subjected to axial and bending loading. Fatigue Fract. Eng. Mater. Struct. 2022, 45, 2531–2548. [Google Scholar] [CrossRef]
  25. Chmelko, V.; Harakal, M.; Žlábek, P.; Margetin, M.; Ďurka, R. Simulation of Stress Concentrations in Notches. Metals 2022, 12, 43. [Google Scholar] [CrossRef]
  26. Han, T.; He, X.Q.; En, Y.F. Hermetically metal sealing random vibration damage mechanism and fatigue life prediction. Appl. Mech. Mater. 2013, 423–426, 1501–1505. [Google Scholar] [CrossRef]
  27. Wu, J.; Qiang, B.; Liao, X.X.; Kang, L.; Yao, C.R.; Li, Y.D. Experimental investigation and numerical simulation of welding residual stress in orthotropic steel deck with diaphragm considering solid-state phase transformation. Eng. Struct. 2022, 250, 113415. [Google Scholar] [CrossRef]
  28. Cui, C.; Zhang, Q.H.; Bao, Y.; Bu, Y.Z.; Luo, Y. Fatigue life evaluation of welded joints in steel bridge considering residual stress. J. Constr. Steel Res. 2019, 153, 509–518. [Google Scholar] [CrossRef]
  29. Dai, X.H.; Zhang, X.M.; Meng, C.; Guo, Y.W.; Zhu, Y.Y.; Yuanzhou, Z.Y. The Maintenance effect of diaphragm-to-rib fatigue cracks in orthotropic steel deck via steel plate reinforcement. Appl. Sci. 2023, 13, 10368. [Google Scholar] [CrossRef]
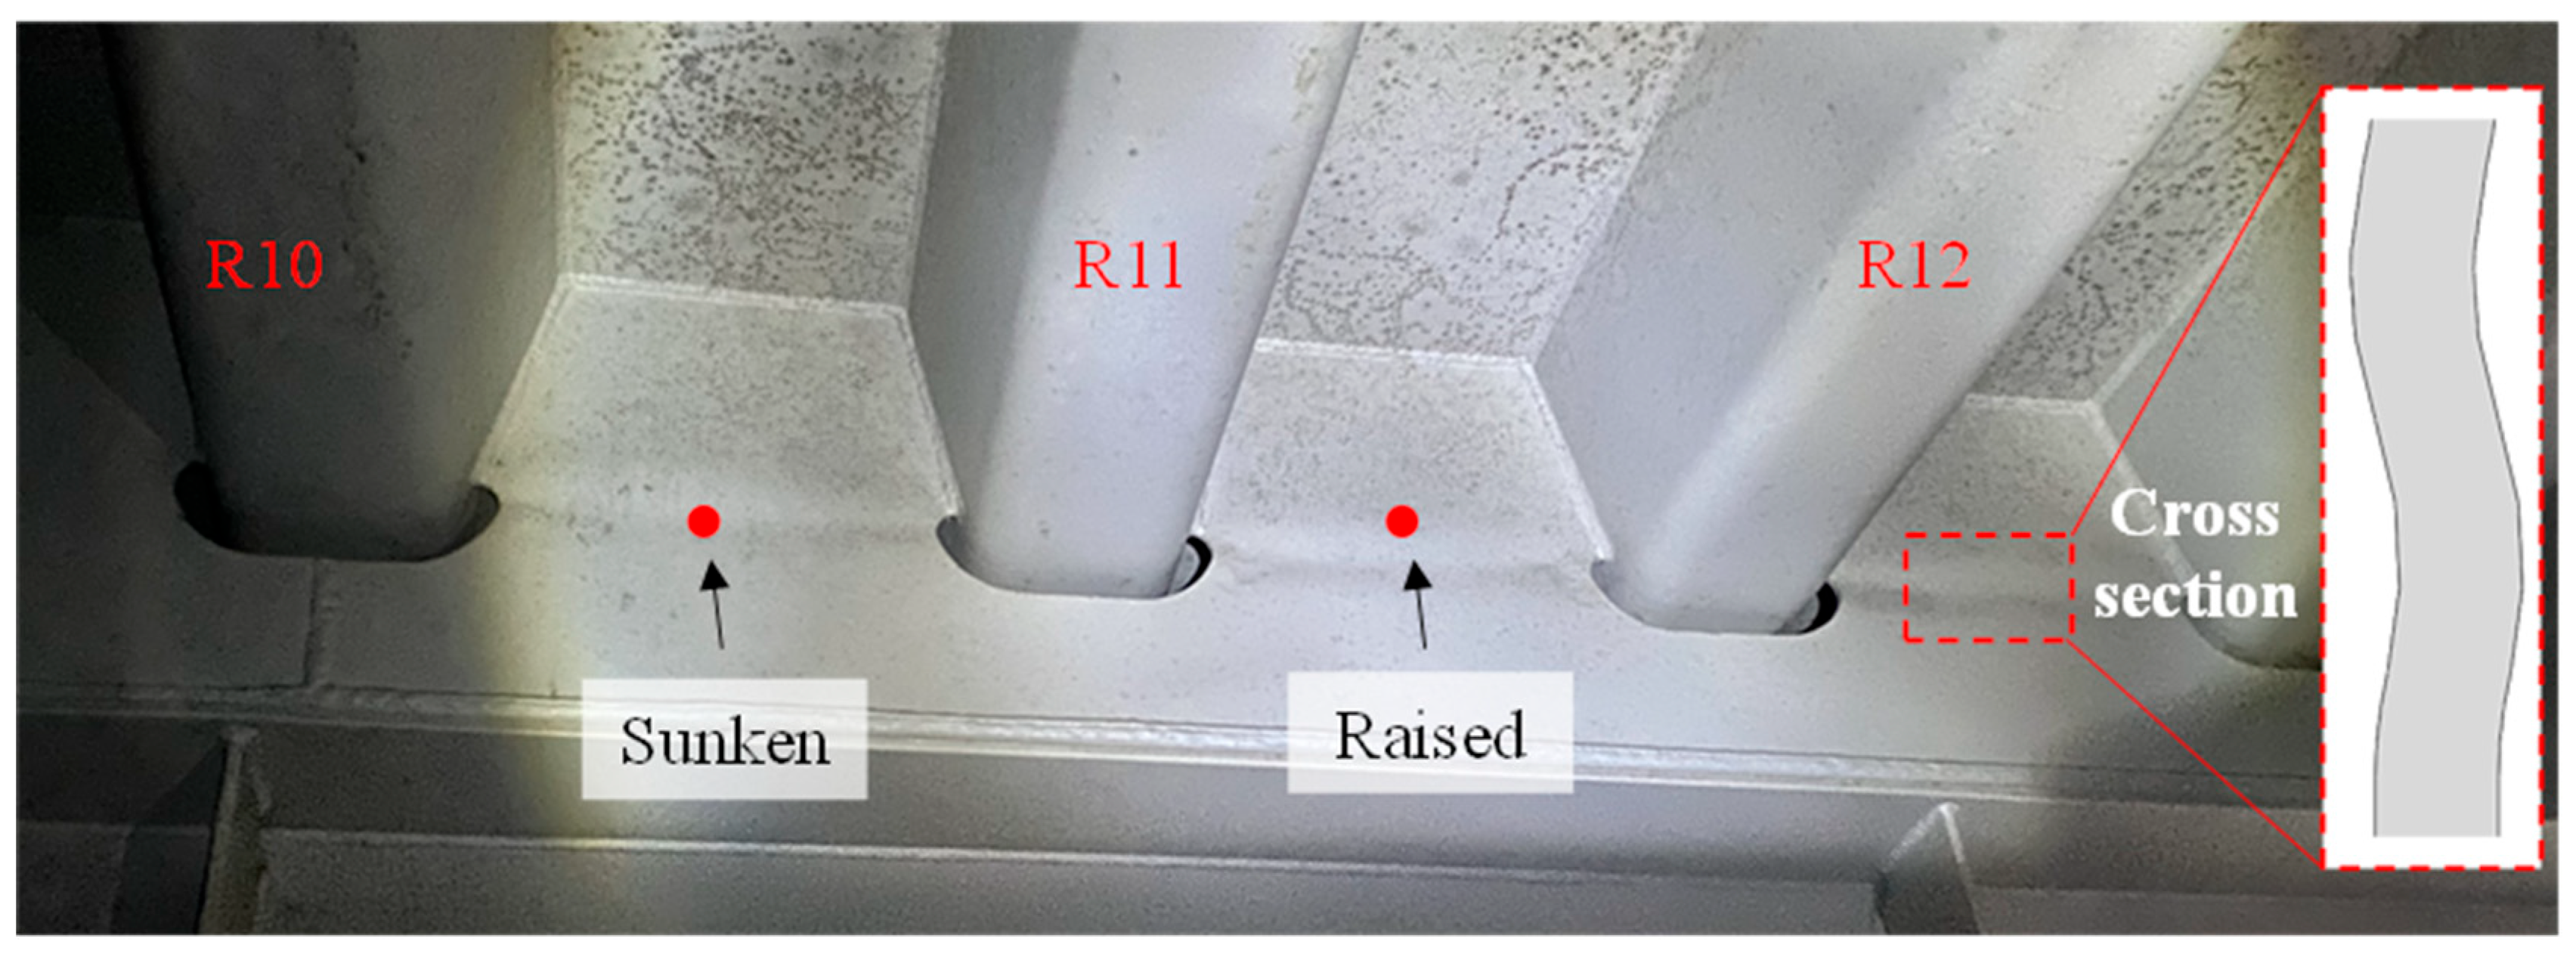
Figure 1. Diaphragm plate buckling.
Applsci 15 04245 g001
Figure 2. Strain gauge locations in the stress test scheme for a real bridge.
Applsci 15 04245 g002
Figure 3. Comparison of the stress range spectrum between the normal and deformed sides of the diaphragm: (a) arc notch; (b) DU weld.
Applsci 15 04245 g003
Figure 4. Comparison of the stress range spectrum on the normal side of diaphragm-3 and -4: (a) arc notch; (b) DU weld.
Applsci 15 04245 g004
Figure 5. Model standard fatigue vehicle load.
Applsci 15 04245 g005
Figure 6. Finite element model and mesh.
Applsci 15 04245 g006
Figure 7. Stress variations in the diaphragm under different loading positions: (a) DU weld; (b) arc notch.
Applsci 15 04245 g007
Figure 8. Bending stress and membrane stress.
Applsci 15 04245 g008
Figure 9. Stress field or nephogram around the arc notch.
Applsci 15 04245 g009
Figure 10. Stress change: (a) along the arc notch; (b) along the DU weld.
Applsci 15 04245 g010
Figure 11. Maximum principal stress distribution of DU weld.
Applsci 15 04245 g011
Figure 12. Process of hammer peening.
Applsci 15 04245 g012
Figure 13. Hammer peening operation on the deformation area in a real bridge.
Applsci 15 04245 g013
Figure 14. Stress histories before and after hammer peening: (a) HA−1; (b) HA−2.
Applsci 15 04245 g014
Figure 15. Strengthening plan.
Applsci 15 04245 g015
Figure 16. Stress comparison before and after strengthening: (a) along the DU weld; (b) along the arc notch.
Applsci 15 04245 g016
Figure 17. Displacement measure points for deformation monitoring.
Applsci 15 04245 g017
Figure 18. Changing trends of diaphragm deformation.
Applsci 15 04245 g018
Disclaimer/Publisher’s Note: The statements, opinions and data contained in all publications are solely those of the individual author(s) and contributor(s) and not of MDPI and/or the editor(s). MDPI and/or the editor(s) disclaim responsibility for any injury to people or property resulting from any ideas, methods, instructions or products referred to in the content.