

Intrusion Detection Method Based on Preprocessing of Highly Correlated and Imbalanced Data

 ,
,  , and
, and
Abstract
1. Introduction
1.1. Motivation
1.2. State of the Art
1.3. Objectives and Contribution
- Addressing classification challenges related to imbalanced data, where a small number of intrusion detection examples can lead to critical false negatives.
- Developing techniques for reducing the feature space when dealing with highly correlated data.
- Evaluating the effectiveness of different classifiers as base models and optimizing their parameters.
- Proposing an intrusion detection method based on the preprocessing of highly correlated and imbalanced data.
2. Materials and Methods
3. Results
3.1. Data Collection and Preprocessing
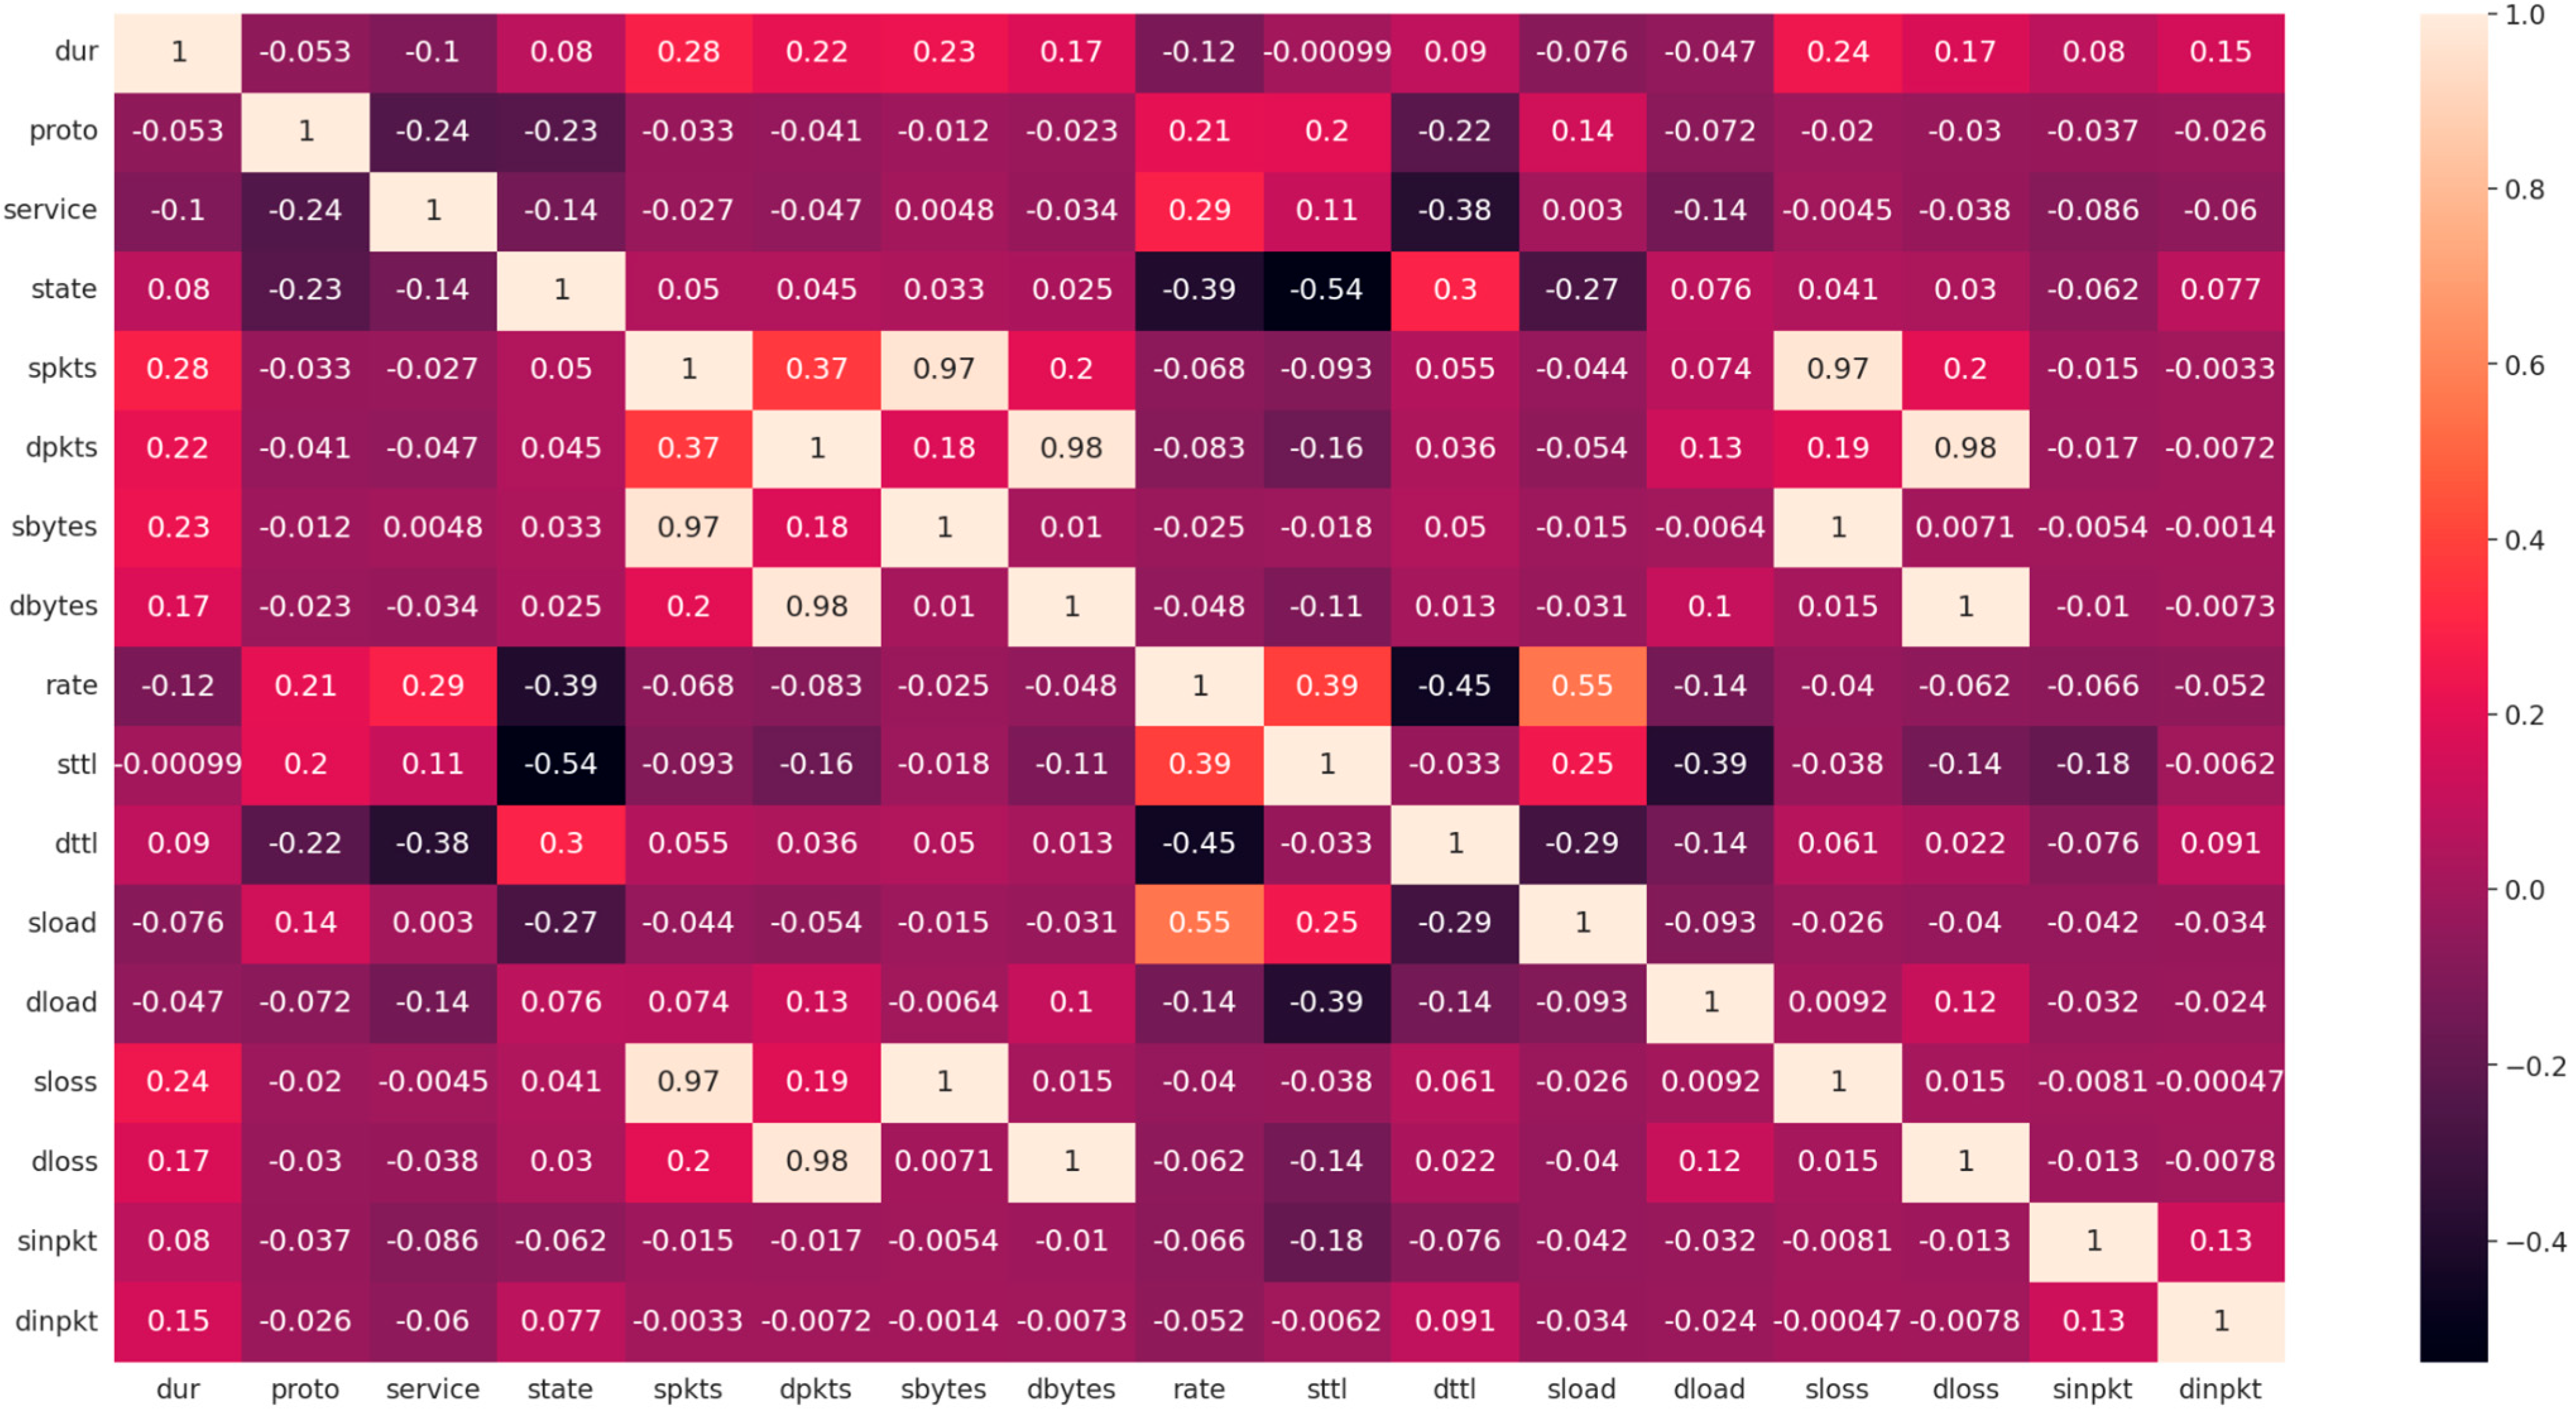
3.2. Feature Engineering
Data Balancing Procedure
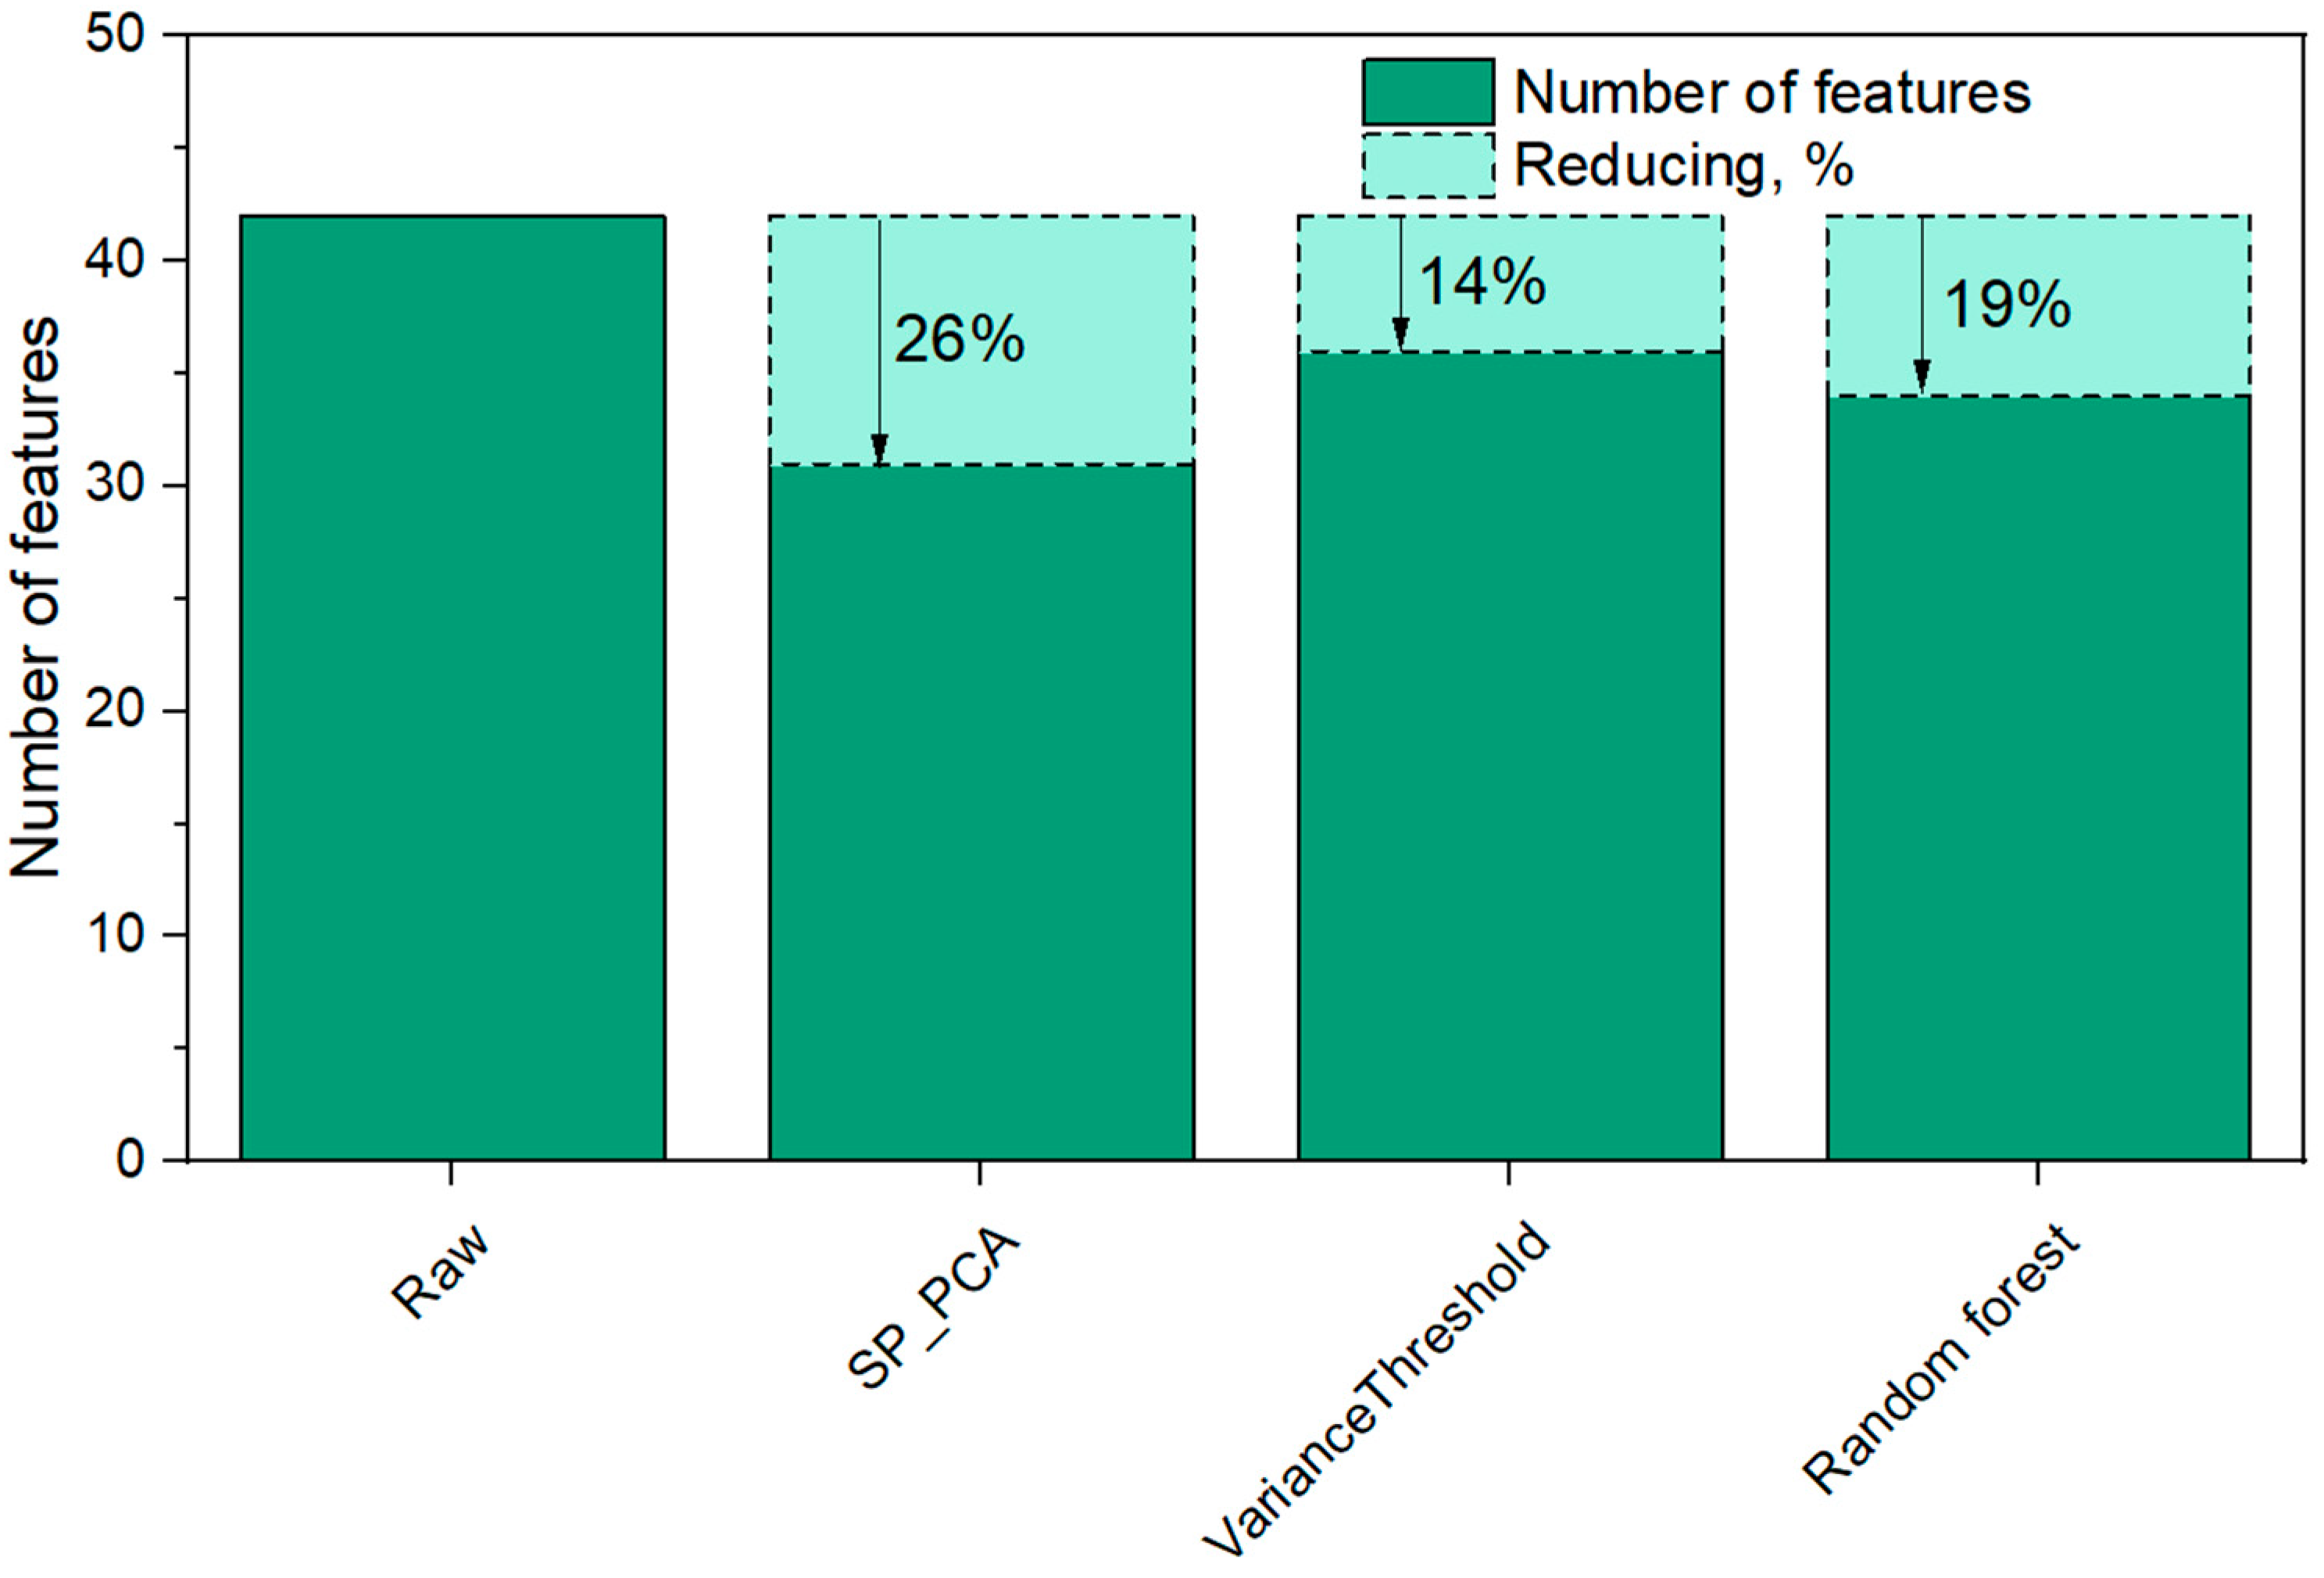
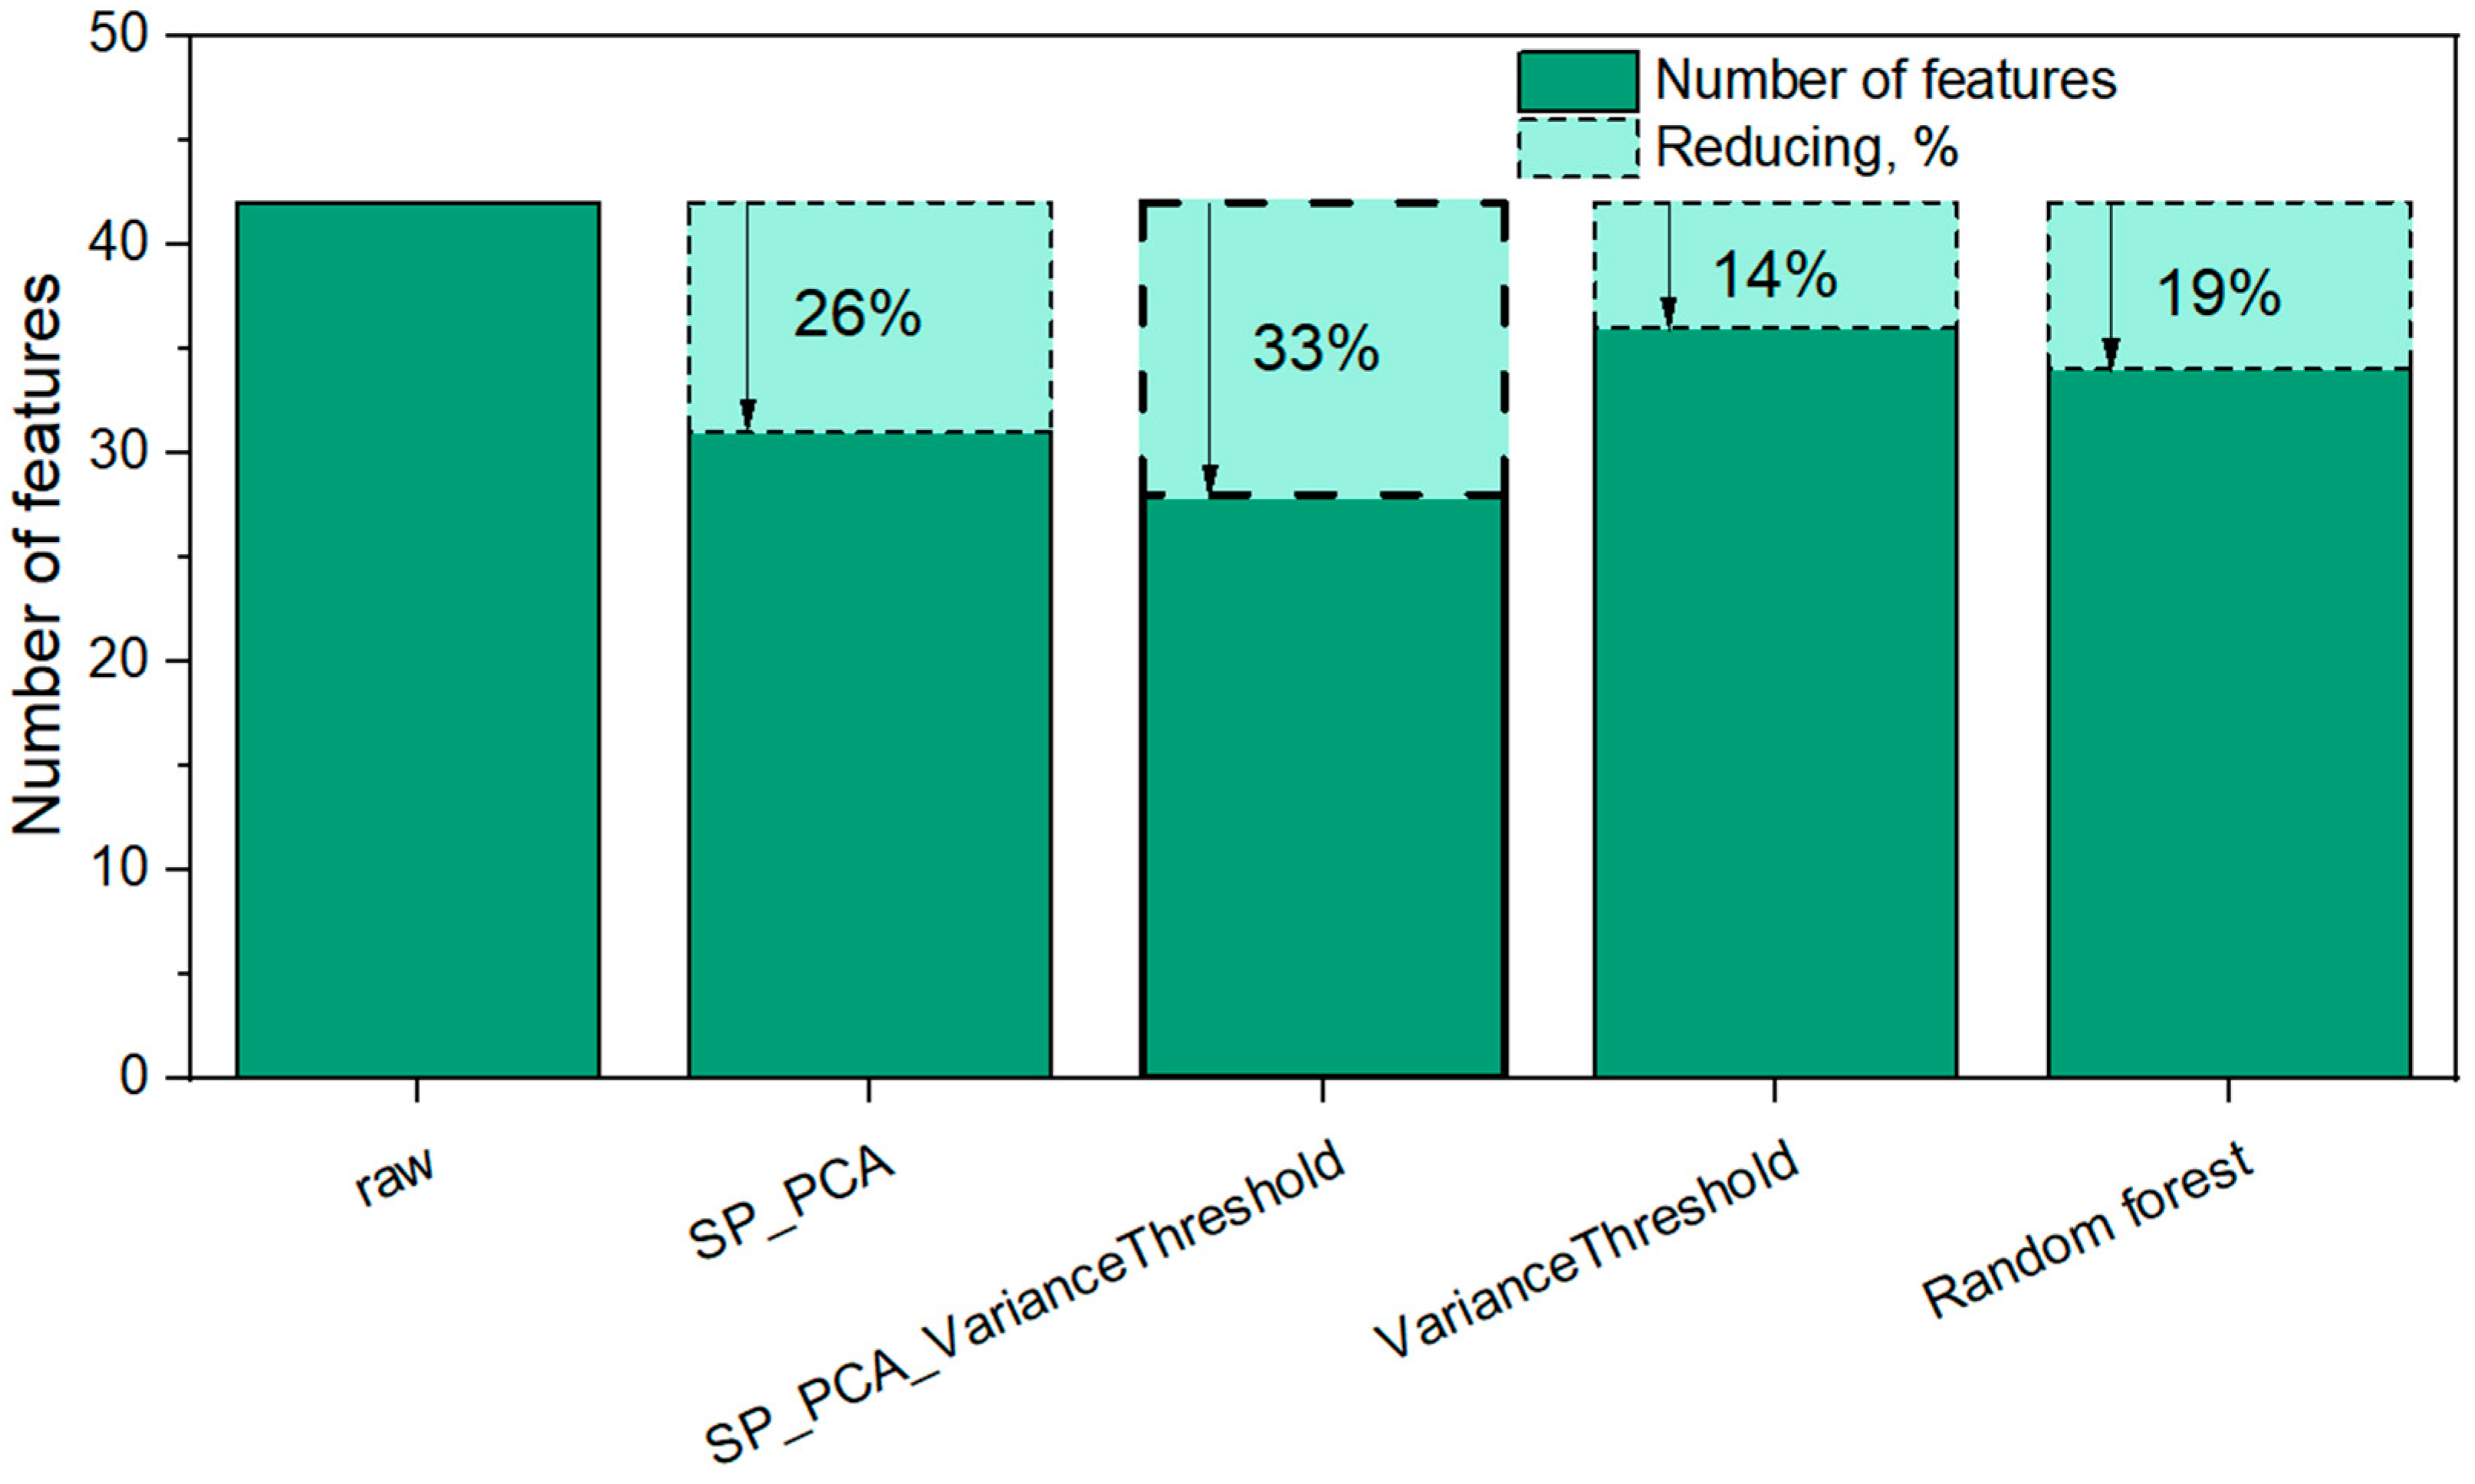
3.3. Construction of Features Reducing Procedure SP_PCA
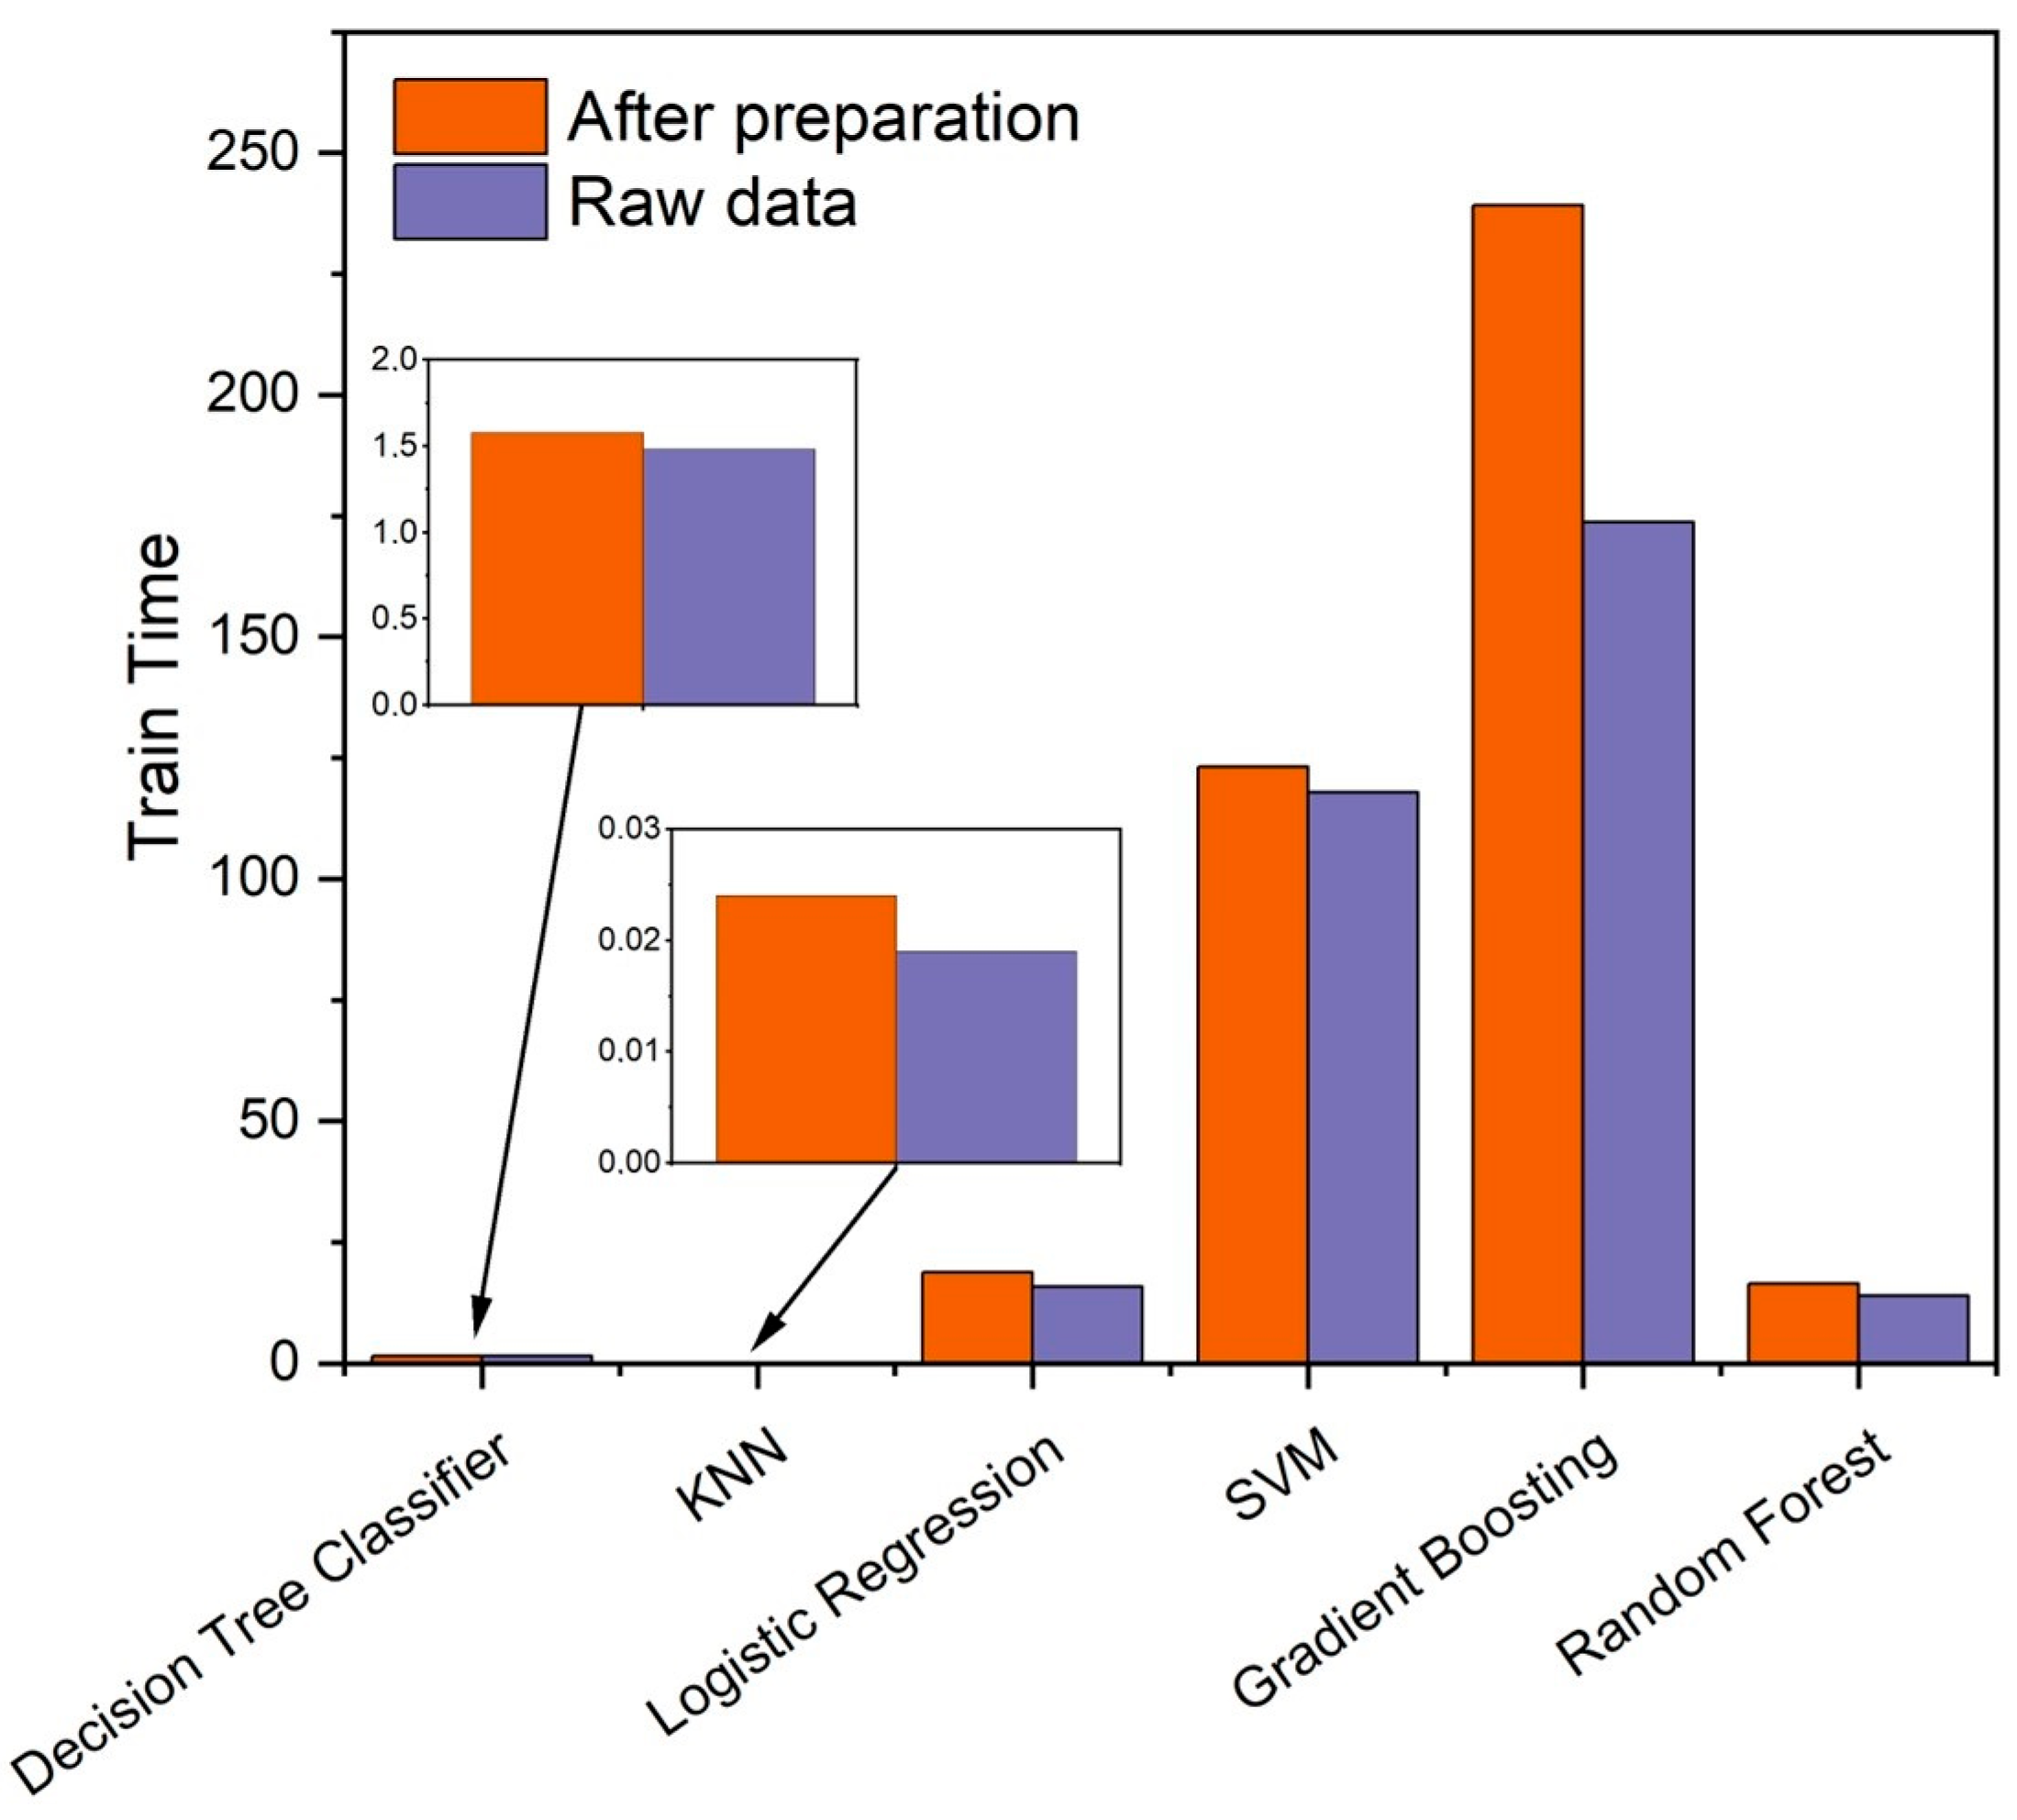
3.4. Model Selection, Training, and Evaluation
3.4.1. Evaluation of the Effectiveness of Using the SMOTEENN Algorithm
- SVM: Kernel selection—linear, regularization parameter (C)—1.0, gamma parameter for RBF kernel—‘scale’;
- KNN: Number of neighbors (k)—5, distance metric—‘minkowski’;
- Naive Bayes: Class priors—none, smoothing coefficient (alpha)—1 × 10⁻⁹;
- Perceptron: Learning rate—‘constant’, activation function—linear, maximum number of epochs—1000.
- Criterion for measuring the quality of a split—‘gini’;
- Minimum number of samples required to split an internal node—2;
- Minimum number of samples required to be at a leaf node—1;
- Maximum depth of the tree—none (unlimited);
- No maximum feature parameter was specified.
- Bagging—80 base classifiers;
- Random Forest—100 base classifiers;
- Adaboost—50 base classifiers;
- Gradient Boosting—100 base classifiers.
3.4.2. Evaluation the Effectiveness of Using the Feature Space SP_PCA Reduction Procedure
3.4.3. Evaluation of the Effectiveness of the Integrated Use of the SP_PCA and VarianceThreshold Reduction Procedure
4. Discussion
5. Conclusions
Author Contributions
Funding
Institutional Review Board Statement
Informed Consent Statement
Data Availability Statement
Conflicts of Interest
References
- Check Point Software’s 2023 Cyber Security Report. Available online: https://gp.gov.ua/ua/posts/pro-zareyestrovani-kriminalni-pravoporushennya-ta-rezultati-yih-dosudovogo-rozsliduvannya-2 (accessed on 20 June 2024).
- Moskalenko, V.; Kharchenko, V.; Semenov, S. Model and Method for Providing Resilience to Resource-Constrained AI-System. Sensors 2024, 24, 5951. [Google Scholar] [CrossRef] [PubMed]
- Amarudin, R.; Ferdiana, A.; Widyawan. A Systematic Literature Review of Intrusion Detection System for Network Security: Research Trends, Datasets and Methods. In Proceedings of the 4th International Conference on Informatics and Computational Sciences (ICICoS), Semarang, Indonesia, 10–11 November 2020; pp. 1–6. [Google Scholar] [CrossRef]
- Tai, J.; Alsmadi, I.; Zhang, Y.; Qiao, F. Machine Learning Methods for Anomaly Detection in Industrial Control Systems. In Proceedings of the IEEE International Conference on Big Data (Big Data), Atlanta, GA, USA, 10–13 December 2020; pp. 2333–2339. [Google Scholar] [CrossRef]
- Bicego, M.; Rossetto, A.; Olivieri, M.; Londoño-Bonilla, J.; Orozco-Alzate, M. Advanced KNN Approaches for Explainable Seismic-Volcanic Signal Classification. Math. Geosci. 2022, 55, 59–80. [Google Scholar] [CrossRef]
- Malhotra, S.; Bali, V.; Paliwal, K.K. Genetic Programming and K-Nearest Neighbour Classifier Based Intrusion Detection Model. In Proceedings of the 7th International Conference on Cloud Computing, Data Science & Engineering—Confluence, Noida, India, 12–13 January 2017; pp. 42–46. [Google Scholar] [CrossRef]
- Khreich, W.; Khosravifar, B.; Hamou-Lhadj, A.; Talhi, C. An Anomaly Detection System Based on Variable N-Gram Features and One-Class SVM. Inf. Softw. Technol. 2017, 91, 186–197. [Google Scholar] [CrossRef]
- Salau, A.O.; Assegie, T.A.; Akindadelo, A.T.; Eneh, J.N. Evaluation of Bernoulli Naive Bayes Model for Detection of Distributed Denial of Service Attacks. Bull. Electr. Eng. Inform. 2023, 12, 1203–1208. [Google Scholar] [CrossRef]
- Kamarudin, M.H.; Maple, C.; Watson, T.; Sofian, H. Packet Header Intrusion Detection with Binary Logistic Regression Approach in Detecting R2L and U2R Attacks. In Proceedings of the Fourth International Conference on Cyber Security, Cyber Warfare, and Digital Forensic (CyberSec), Jakarta, Indonesia, 29–31 October 2015; pp. 101–106. [Google Scholar] [CrossRef]
- Meng, L.; Bai, B.; Zhang, W.; Liu, L.; Zhang, C. Research on a Decision Tree Classification Algorithm Based on Granular Matrices. Electronics 2023, 12, 4470. [Google Scholar] [CrossRef]
- Zhu, B.; Wang, J.; Zhang, X. Fuzzy Decision Tree Based on Fuzzy Rough Sets and Z-Number Rules. Axioms 2024, 13, 836. [Google Scholar] [CrossRef]
- Paul, S.; Kundu, R.K. A Bagging MLP-based Autoencoder for Detection of False Data Injection Attack in Smart Grid. In Proceedings of the IEEE Power & Energy Society Innovative Smart Grid Technologies Conference (ISGT), Singapore, 1–5 November 2022; pp. 1–5. [Google Scholar] [CrossRef]
- Wang, W.; Zhu, M.; Zeng, X.; Ye, X.; Sheng, Y. Malware Traffic Classification Using Convolutional Neural Network for Representation Learning. In Proceedings of the 2017 International Conference on Information Networking (ICOIN), Da Nang, Vietnam, 11–13 January 2017. [Google Scholar] [CrossRef]
- Ashfaq, M. HCRNNIDS: Hybrid Convolutional Recurrent Neural Network-Based Network Intrusion Detection System. Processes 2021, 9, 834. [Google Scholar] [CrossRef]
- Laghrissi, F.; Douzi, S.; Douzi, K. Intrusion Detection Systems Using Long Short-Term Memory (LSTM). J. Big Data 2021, 8, 65. [Google Scholar] [CrossRef]
- Zhang, Z.; Kong, S.; Xiao, T.; Yang, A. A Network Intrusion Detection Method Based on Bagging Ensemble. Symmetry 2024, 16, 850. [Google Scholar] [CrossRef]
- Bakhshipour, A. Cascading Feature Filtering and Boosting Algorithm for Plant Type Classification Based on Image Features. IEEE Access 2021, 9, 82021–82030. [Google Scholar] [CrossRef]
- Semenov, S.; Mozhaiev, O.; Kuchuk, N.; Mozhaiev, M.; Tiulieniev, S.; Gnusov, Y.; Yevstrat, D.; Chyrva, Y.; Kuchuk, H. Devising a Procedure for Defining the General Criteria of Abnormal Behavior of a Computer System Based on the Improved Criterion of Uniformity of Input Data Samples. East.-Eur. J. Enterp. Technol. 2022, 6, 40–49. [Google Scholar] [CrossRef]
- Cui, Z.G.; Cao, Y.; Wu, L.; Liu, H.N.; Qiu, Z.F.; Chen, C.W. Research on Preprocessing Technology of Building Energy Consumption Monitoring Data Based on Machine Learning Algorithm. Build. Sci. 2018, 34, 94–99. [Google Scholar] [CrossRef]
- Krawczyk, B. Learning from Imbalanced Data: Open Challenges and Future Directions. Prog. Artif. Intell. 2016, 5, 221–232. [Google Scholar] [CrossRef]
- Abdi, L.; Sattar, H. To Combat Multi-Class Imbalanced Problems by Means of Over-Sampling Techniques. IEEE Trans. Knowl. Data Eng. 2016, 28, 238–251. [Google Scholar] [CrossRef]
- Madhavi, M.; Nethravathi, N.P. Intrusion Detection in Networks Using Gradient Boosting. In Proceedings of the 2023 International Conference on Advances in Electronics, Communication, Computing and Intelligent Information Systems (ICAECIS), Bangalore, India, 19–21 April 2023; pp. 139–145. [Google Scholar] [CrossRef]
- Zhang, J.; Zulkernine, M.; Haque, A. Random-Forests-Based Network Intrfabric usion Detection Systems. IEEE Trans. Syst. Man Cybern. Part C (Appl. Rev.) 2008, 38, 649–659. [Google Scholar] [CrossRef]
- Varma, C.; Babu, G.; Sree, P.; Sai, N.R. Usage of Classifier Ensemble for Security Enrichment in IDS. In Proceedings of the 2022 International Conference on Automation, Computing and Renewable Systems (ICACRS), Pudukkottai, India, 13–15 December 2022; pp. 420–425. [Google Scholar] [CrossRef]
- El Houda, Z.A.; Brik, B.; Khoukhi, L. Ensemble Learning for Intrusion Detection in SDN-Based Zero Touch Smart Grid Systems. In Proceedings of the 2022 IEEE 47th Conference on Local Computer Networks (LCN), Edmonton, AB, Canada, 26–29 September 2022; pp. 149–156. [Google Scholar] [CrossRef]
- Necati, D.; Dalkiliç, G. Modified Stacking Ensemble Approach to Detect Network Intrusion. Turk. J. Electr. Eng. Comput. Sci. 2018, 26, 35. [Google Scholar] [CrossRef]
- Zwane, S.; Tarwireyi, P.; Adigun, M. Ensemble Learning Approach for Flow-Based Intrusion Detection System. In Proceedings of the 2019 IEEE AFRICON, Accra, Ghana, 25–27 September 2019; pp. 1–8. [Google Scholar] [CrossRef]
- Gavrylenko, S.; Hornostal, O. Application of Heterogeneous Ensembles in Problems of Computer System State Identification. Adv. Inf. Syst. 2023, 7, 5–12. [Google Scholar] [CrossRef]
- Semenov, S.G.; Liqiang, Z.; Weiling, C.; Davydov, V. Development of a Mathematical Model for the Software Security Testing First Stage. East. -Eur. J. Enterp. Technol. 2021, 3, 24–34. [Google Scholar] [CrossRef]
- Mounika, K.; Rao, P.V. IDCSNet: Intrusion Detection and Classification System Using Unified Gradient-Boosted Decision Tree Classifier. In Proceedings of the 2022 International Conference on Automation, Computing and Renewable Systems (ICACRS), Pudukkottai, India, 13–15 December 2022; pp. 1159–1164. [Google Scholar] [CrossRef]
- Zhang, Y.; Deng, L.; Wei, B. Imbalanced Data Classification Based on Improved Random-SMOTE and Feature Standard Deviation. Mathematics 2024, 12, 1709. [Google Scholar] [CrossRef]
- Gavrylenko, S.; Poltoratskyi, V. Metod pidvyshchennia operatyvnosti klasyfikatsii danykh za rakhunok zmenshennia koreliatsii oznak, Systemy upravlinnia, navihatsii ta zviazku, Poltava: Natsionalnyi universytet. Poltav. Politekh. Im. Yuriia Kondratiuka 2023, 4, 71–75. [Google Scholar] [CrossRef]
- Gavrylenko, S.; Poltoratskyi, V.; Nechyporenko, A. Intrusion detection model based on improved transformer. Adv. Inf. Syst. 2024, 8, 94–99. [Google Scholar] [CrossRef]


| Normal | 37,000 |
| Exploits | 11,132 |
| Fuzzers | 6062 |
| DoS | 4089 |
| Type of Data | Classifier | Mean Evaluation Metrics | |||
|---|---|---|---|---|---|
| Precision | Recall | F1 Score | Accuracy | ||
| Imbalanced | Bagging | 0.632711 | 0.606747 | 0.619223 | 0.859308 |
| Random Forest | 0.652189 | 0.605505 | 0.631143 | 0.864856 | |
| Adaboost | 0.469637 | 0.571573 | 0.479471 | 0.552188 | |
| Gradient Boosting | 0.677363 | 0.622911 | 0.638217 | 0.862682 | |
| Perceptron | 0.448027 | 0.48171 | 0.375484 | 0.690192 | |
| Naive Bayes | 0.240122 | 0.508604 | 0.295897 | 0.450958 | |
| SVM | 0.593755 | 0.34801 | 0.413315 | 0.766314 | |
| KNN | 0.57165 | 0.483343 | 0.518767 | 0.805204 | |
| Balanced | Bagging | 0.932608 | 0.934367 | 0.933333 | 0.954493 |
| Random Forest | 0.946865 | 0.942628 | 0.943628 | 0.961703 | |
| Adaboost | 0.609027 | 0.739865 | 0.623658 | 0.535241 | |
| Gradient Boosting | 0.864355 | 0.866288 | 0.863651 | 0.910774 | |
| Perceptron | 0.755742 | 0.735643 | 0.738974 | 0.802861 | |
| Naive Bayes | 0.577641 | 0.684165 | 0.611498 | 0.699735 | |
| SVM | 0.757607 | 0.792579 | 0.772734 | 0.834756 | |
| KNN | 0.886423 | 0.901735 | 0.893365 | 0.920925 | |
| Model of Classifier | Performance Metrics | Balanced Data Without Feature Reduction | Feature-Reducing Methods | ||
|---|---|---|---|---|---|
| SP_PCA | Variance Threshold | Random Forest | |||
| Decision Tree Classifier | Average F1 score | 0.91 | 0.95 | 0.95 | 0.95 |
| Train Time, s | 1.579 | 1.412 | 1.919 | 1.481 | |
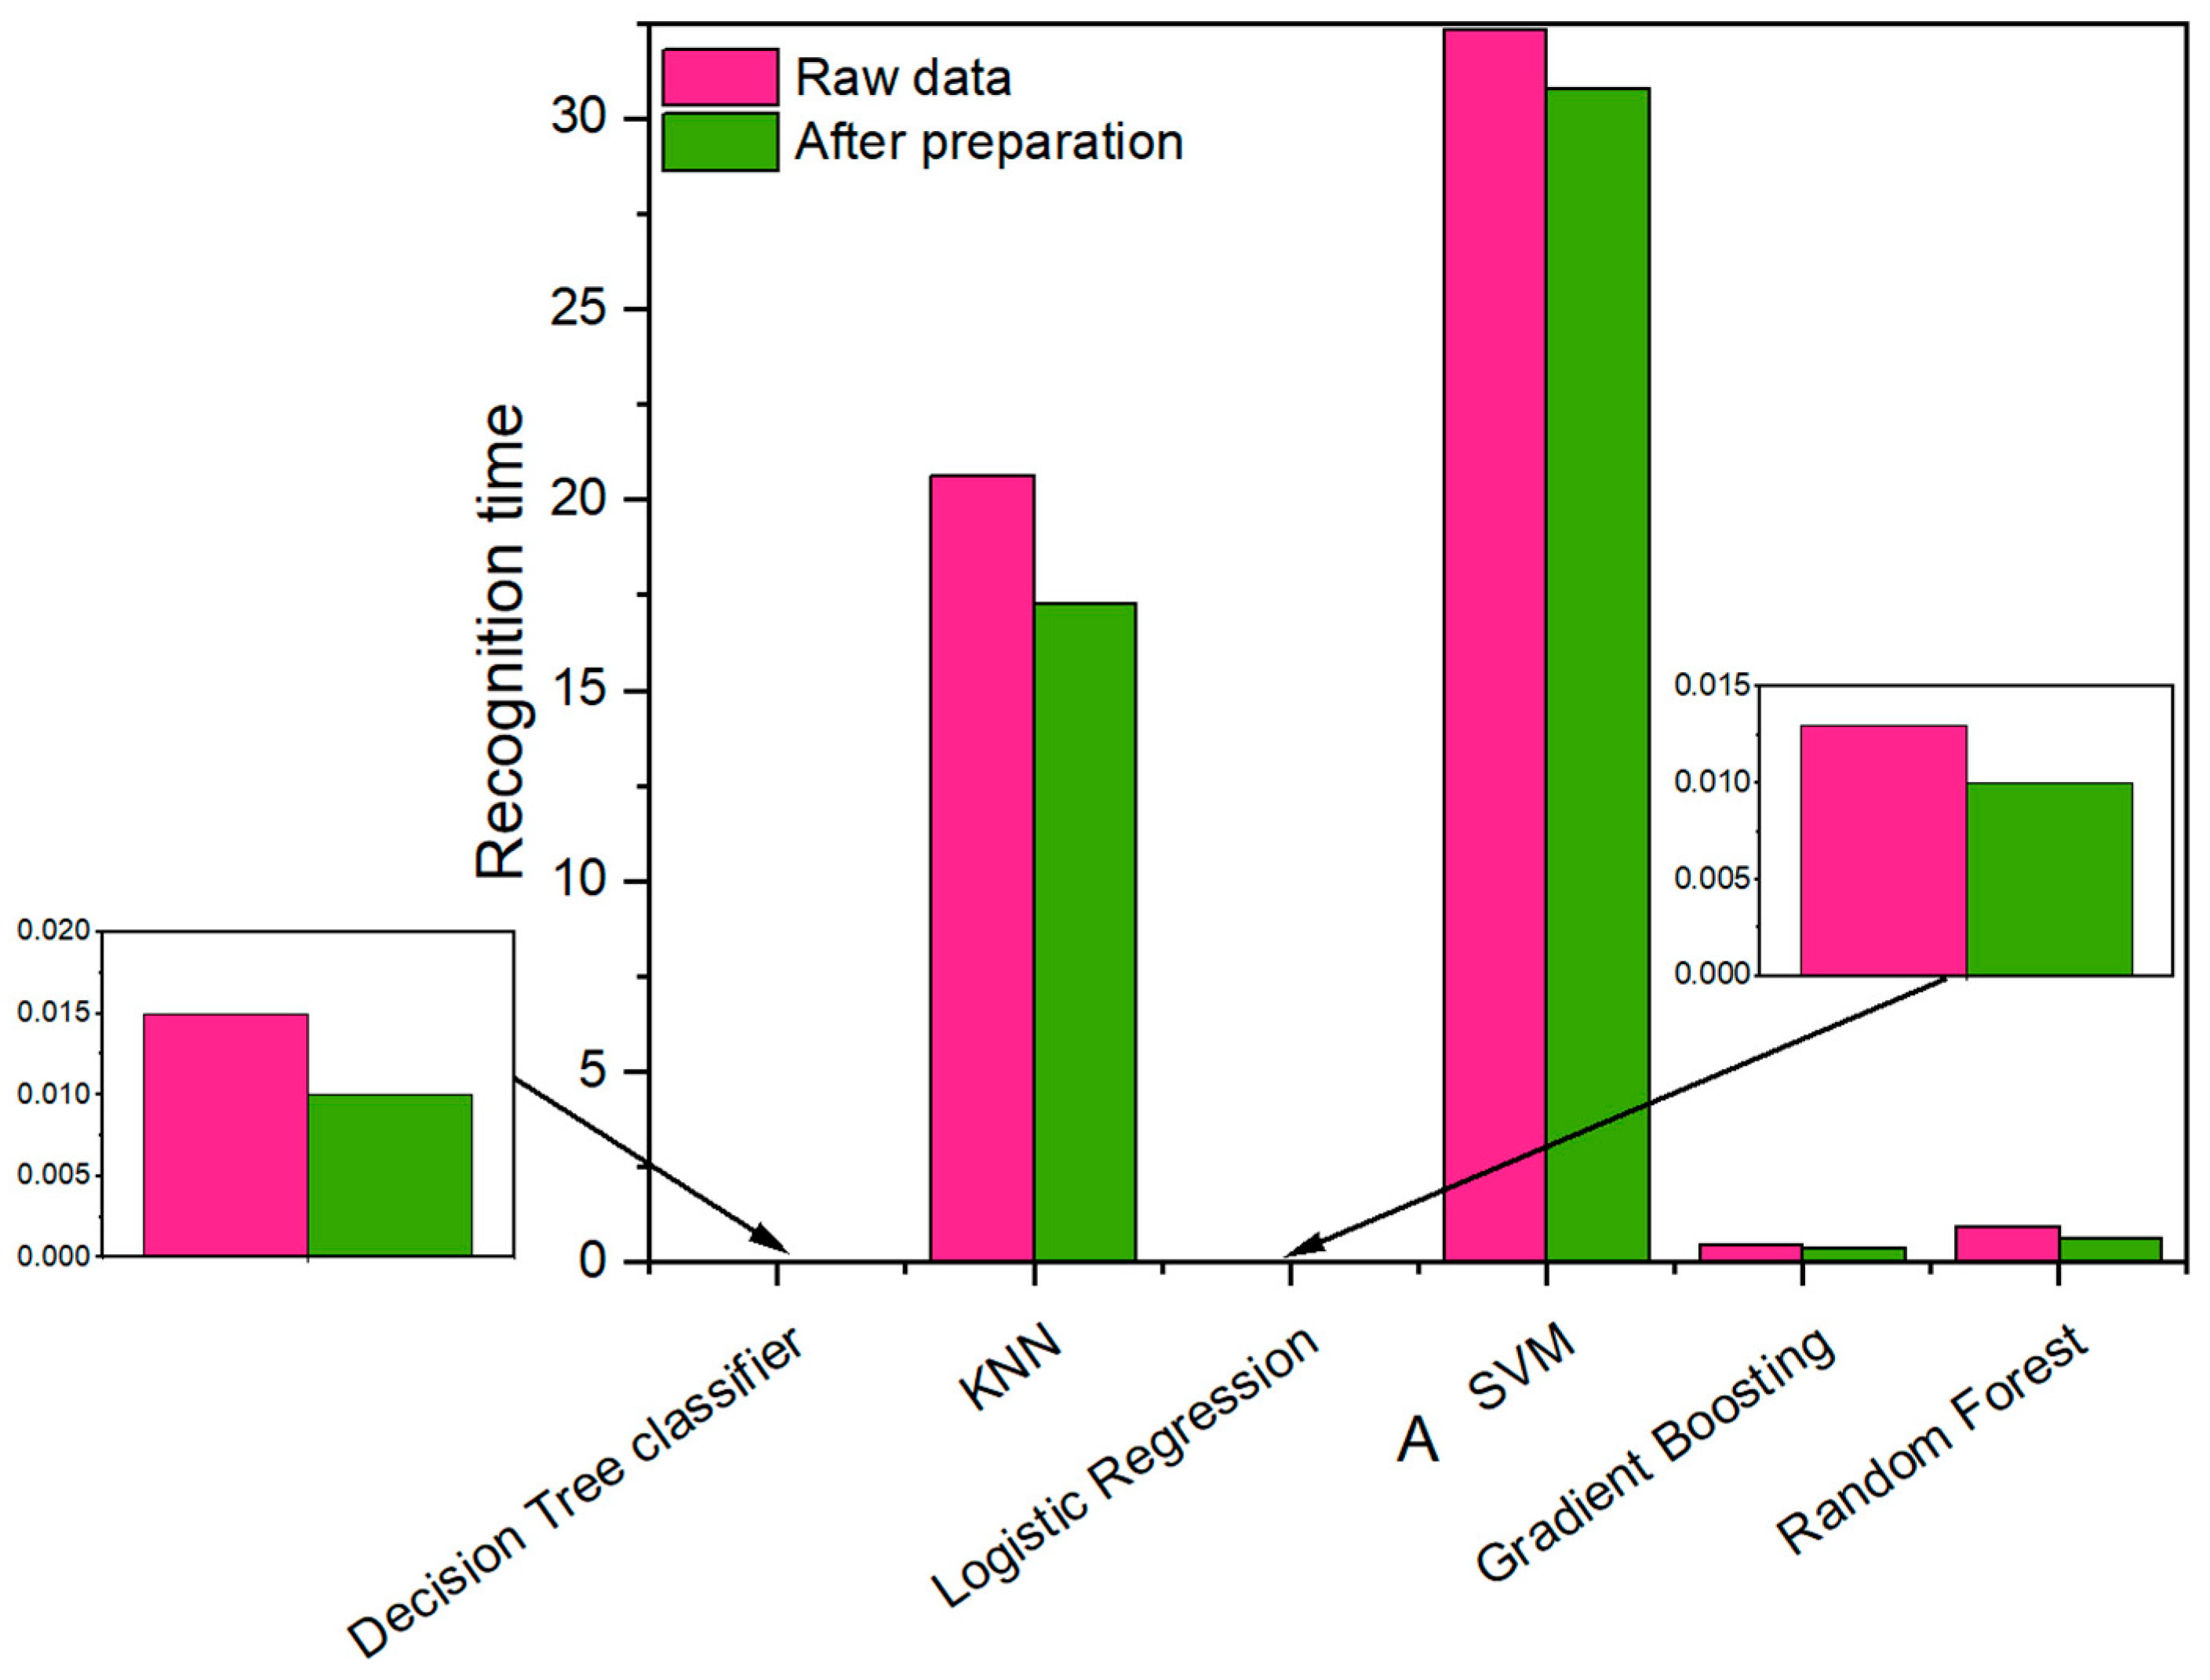
| Recognition Time, s | 0.015 | 0.01 | 0.009 | 0.012 | |
| KNN | Average F1 score | 0.89 | 0.94 | 0.94 | 0.93 |
| Train Time, s | 0.024 | 0.021 | 0.02 | 0.019 | |
| Recognition Time, s | 20.628 | 19.961 | 19.12 | 19.299 | |
| Logistic Regression | Average F1 score | 0.83 | 0.83 | 0.84 | 0.83 |
| Train Time, s | 18.735 | 15.357 | 16.187 | 13.823 | |
| Recognition Time, s | 0.013 | 0.01 | 0.011 | 0.017 | |
| SVM | Average F1 score | 0.77 | 0.84 | 0.85 | 0.85 |
| Train Time, s | 123.201 | 93.34 | 81.508 | 108.484 | |
| Recognition Time, s | 32.33 | 32.708 | 23.8 | 25.256 | |
| Gradient Boosting | Average F1 score | 0.86 | 0.92 | 0.92 | 0.92 |
| Train Time, s | 239.169 | 209.948 | 266.502 | 228.647 | |
| Recognition Time, s | 0.455 | 0.306 | 0.33 | 0.37 | |
| Random Forest | Average F1 score | 0.95 | 0.97 | 0.97 | 0.97 |
| Train Time, s | 16.507 | 15.575 | 20.359 | 16 | |
| Recognition Time, s | 0.958 | 0.689 | 0.696 | 0.825 | |
Disclaimer/Publisher’s Note: The statements, opinions and data contained in all publications are solely those of the individual author(s) and contributor(s) and not of MDPI and/or the editor(s). MDPI and/or the editor(s) disclaim responsibility for any injury to people or property resulting from any ideas, methods, instructions or products referred to in the content. |
© 2025 by the authors. Licensee MDPI, Basel, Switzerland. This article is an open access article distributed under the terms and conditions of the Creative Commons Attribution (CC BY) license (https://creativecommons.org/licenses/by/4.0/).
Share and Cite
Semenov, S.; Krupska-Klimczak, M.; Czapla, R.; Krzaczek, B.; Gavrylenko, S.; Poltorazkiy, V.; Vladislav, Z. Intrusion Detection Method Based on Preprocessing of Highly Correlated and Imbalanced Data. Appl. Sci. 2025, 15, 4243. https://doi.org/10.3390/app15084243
Semenov S, Krupska-Klimczak M, Czapla R, Krzaczek B, Gavrylenko S, Poltorazkiy V, Vladislav Z. Intrusion Detection Method Based on Preprocessing of Highly Correlated and Imbalanced Data. Applied Sciences. 2025; 15(8):4243. https://doi.org/10.3390/app15084243
Chicago/Turabian StyleSemenov, Serhii, Magdalena Krupska-Klimczak, Roman Czapla, Beata Krzaczek, Svitlana Gavrylenko, Vadim Poltorazkiy, and Zozulia Vladislav. 2025. "Intrusion Detection Method Based on Preprocessing of Highly Correlated and Imbalanced Data" Applied Sciences 15, no. 8: 4243. https://doi.org/10.3390/app15084243
APA StyleSemenov, S., Krupska-Klimczak, M., Czapla, R., Krzaczek, B., Gavrylenko, S., Poltorazkiy, V., & Vladislav, Z. (2025). Intrusion Detection Method Based on Preprocessing of Highly Correlated and Imbalanced Data. Applied Sciences, 15(8), 4243. https://doi.org/10.3390/app15084243