Article

Optimization of Processing Parameters of Powder Metallurgy for Preparing AZ31/GNP Nanocomposites Using Taguchi Method

by
Sachin Kumar Sharma
1,*,
Lozica Ivanović
2,*,
Sandra Gajević
2,*,
Lokesh Kumar Sharma
3,
Yogesh Sharma
4,
Slavica Miladinović
2 and
Blaža Stojanović
2
1
Surface Science and Tribology Lab, Department of Mechanical Engineering, Shiv Nadar Institute of Eminence, Gautam Buddha Nagar, Greater Noida 201314, Uttar Pradesh, India
2
Faculty of Engineering, University of Kragujevac, Sestre Janjić 6, 34000 Kragujevac, Serbia
3
Department of Physics, GLA University, Mathura 281406, Uttar Pradesh, India
4
Department of Physics, Faculty of Applied and Basic Sciences, SGT University, Gurugram 122505, Haryana, India
*
Authors to whom correspondence should be addressed.
Appl. Sci. 2025, 15(8), 4181; https://doi.org/10.3390/app15084181
Submission received: 2 March 2025 / Revised: 1 April 2025 / Accepted: 8 April 2025 / Published: 10 April 2025

Abstract

:
The systematic optimization approach highlights the potential of powder metallurgy and GNP reinforcement to enhance the mechanical properties of AZ31 magnesium alloys, making them suitable for lightweight structural applications. The present study employs the Taguchi approach to optimize the processing parameters of powder metallurgy for the fabrication of AZ31/graphene nanoplatelet (1.75 wt.%GNP) composites. The process parameters are varied at three levels, i.e., compaction pressure (250 MPa, 300 MPa, and 350 MPa), sintering temperature (500 °C, 550 °C, and 600 °C), and sintering time (45 min, 60 min, and 75 min) using an L9 orthogonal array. The impact of these parameters on microhardness and compressive strength was analyzed using a signal-to-noise (SN) ratio and an analysis of variance (ANOVA) approach. The results indicate that compaction pressure significantly influences both microhardness (72.99%) and compressive strength (68.38%), followed by sintering temperature and sintering time. Optimal parameter combinations (350 MPa, 600 °C, and 60 min) yielded maximum microhardness (108.5 Hv) and compressive strength (452.2 MPa). Regression models demonstrated strong predictive capabilities with R² values exceeding 85%. This study underscores the importance of efficient parameter optimization to achieve enhanced material properties in a cost-effective manner.

1. Introduction

Magnesium and its alloy-based composite are effectively used as matrix material due to their remarkable mechanical properties offering a high strength-to-weight ratio and high damping ratio [1]. Irrespective of superior mechanical properties, low corrosion resistance and high wear rate are often considered major problems when dealing with magnesium alloy as they gradually decrease the strength of magnesium and its alloy [2]. Therefore, the metal matrix composite has low-density magnesium alloy as a matrix reinforced with particles or fibers that involve high stiffness and high resistance to wear along with offering greater strength [3]. The research scenario suggested that the metal matrix composite has carbon-based nanoparticles as a reinforcing agent, enhancing the mechanical properties of the composite [4]. However, the amount of reinforcement in the magnesium alloy matrix is crucial in deciding the uniform composition of nano-powder in the matrix that hinders the crack propagation around the grain boundary and the agglomeration of powder in the composite [5]. The small addition of graphene nanoparticles to the AZ31 alloy significantly improves the mechanical properties and widens its application field, but the uniform dispersion of graphene nanoparticles in the magnesium-based alloy composite is always a challenging task [6]. The mechanical properties of magnesium alloy-based matrix composite depend upon the percentage and types of reinforcement, matrix and fiber composition, fabrication approaches, and processing parameters [7]. The amount of reinforcement is crucial in controlling the porosity of the composites, whereas the types of reinforcement encounter the final characteristics of the composites.
Various fabrication approaches are liquid infiltration, stir casting, disintegrated melt deposition, and powder metallurgy [8]. Powder metallurgy (PM) is regarded as the most appropriate method for preparing the magnesium alloy-based composite, involving the high utilization of material with no or less time machining for the final product obtained [9]. The formation of complex shapes with ease is obtained with the help of powder metallurgy via isostatic pressing [10]. Wu et al. observed an improvement in mechanical properties with 0.5 wt.% GNPs in Mg-based matrix composite by powder metallurgy route [11]. Kavimani et al. [12] investigated the mechanical behavior of Mg-MMCs reinforced with weight fractions (0.2 wt.% to 0.5 wt.%) of r-GO (reduced-graphene oxide) by PM that showed that minimal micro-voids and cracks were established with 0.3 wt.% of r-GO, a clear surface with some micro-voids was obtained with 0.4 wt.% of r-GO, and a large number of cracks were formed with 0.5 wt.% of r-GO, resulting in a decrease in the mechanical characteristics of the composites. Raja et al. [13] analyzed the improvement in elongation and hardness with 0.6 wt.% of GNP in AZ31 alloy matrix composites. Rashad et al. [14] fabricated an AZ31 alloy with weight fractions (0.25 to 1 wt.%) of carbon-based reinforcement formed by the powder metallurgy methodology. The microhardness and failure strain were found to be increased by increasing the percentage of reinforcement without any significant change in the tensile strength as compared to the base material. Jayakumar et al. [15] analyzed the fracture mechanism of the AZ31 alloy with a weight fraction (0.33 to 1 wt.%) of carbon-based reinforcement formed by PM. A continuous increase in porosity with a reduction in density was obtained by increasing the amount of carbon-based reinforcing particles in the AZ31 alloy. Zhou et al. [16] analyzed the influence of carbon-based reinforcing particles (0.5 to 4 wt.%) on the mechanical characteristics of AZ31 matrix-based composites formed by powder metallurgy. There was a slight increase in porosity from 0.5 to 2 wt.%, but after that, a drastic increase in porosity was observed that led to crack propagation as well as an agglomeration of reinforcement in the matrix material.
Further, PM allows the uniform distribution of carbon-based nanoparticles in the matrix material [17]. Powder metallurgy encompassing critical stages such as powder compaction and sintering, offers significant potential for fabricating high-performance composites. Among the key processing parameters, compaction pressure, sintering temperature, and sintering time are crucial in determining the microstructure and, consequently, the mechanical properties of the final composite [18]. Compaction pressure affects the densification and bonding between powder particles while sintering temperature and time control grain growth, diffusion, and porosity elimination [19]. Comparing the role of processing parameters with other approaches such as laser powder bed fusion (LPBF), the overall characteristics of the material directly correlate [20]. Therefore, it is essential to optimize these parameters to achieve the desired balance of mechanical strength, hardness, and durability. The Taguchi method has been widely employed in recent years as an effective statistical approach for optimizing powder metallurgy parameters. Kumar et al. [21] demonstrated the use of the Taguchi method to optimize compaction pressure, sintering time, and sintering temperature to enhance the microhardness of Al-CNT 2 composites. Similarly, Sahoo et al. [22] applied the Taguchi approach to identify optimal conditions for the densification and mechanical strength of steel-based composites, revealing the significance of compaction pressure and sintering temperature. Calaph et al. [23] applied Taguchi optimization in hybrid metal matrix composites and found that properly tuned sintering time and temperature significantly improved tensile properties. The objective of this study is the optimization of the processing parameters for AZ31 alloy reinforced with 1.75 wt.% of graphene nanoplatelets (GNP), focusing on the optimal GNP weight fraction. Using the Taguchi method with an L9 orthogonal array, the effects of compaction pressure, sintering temperature, and sintering time on microhardness and compressive strength are analyzed through signal-to-noise (SN) ratios and ANOVA. This study also aims to develop predictive regression models to establish quantitative relationships between process parameters and mechanical properties, ensuring accurate and reliable optimization.

2. Materials and Methods

2.1. Matrix and Reinforcement Material
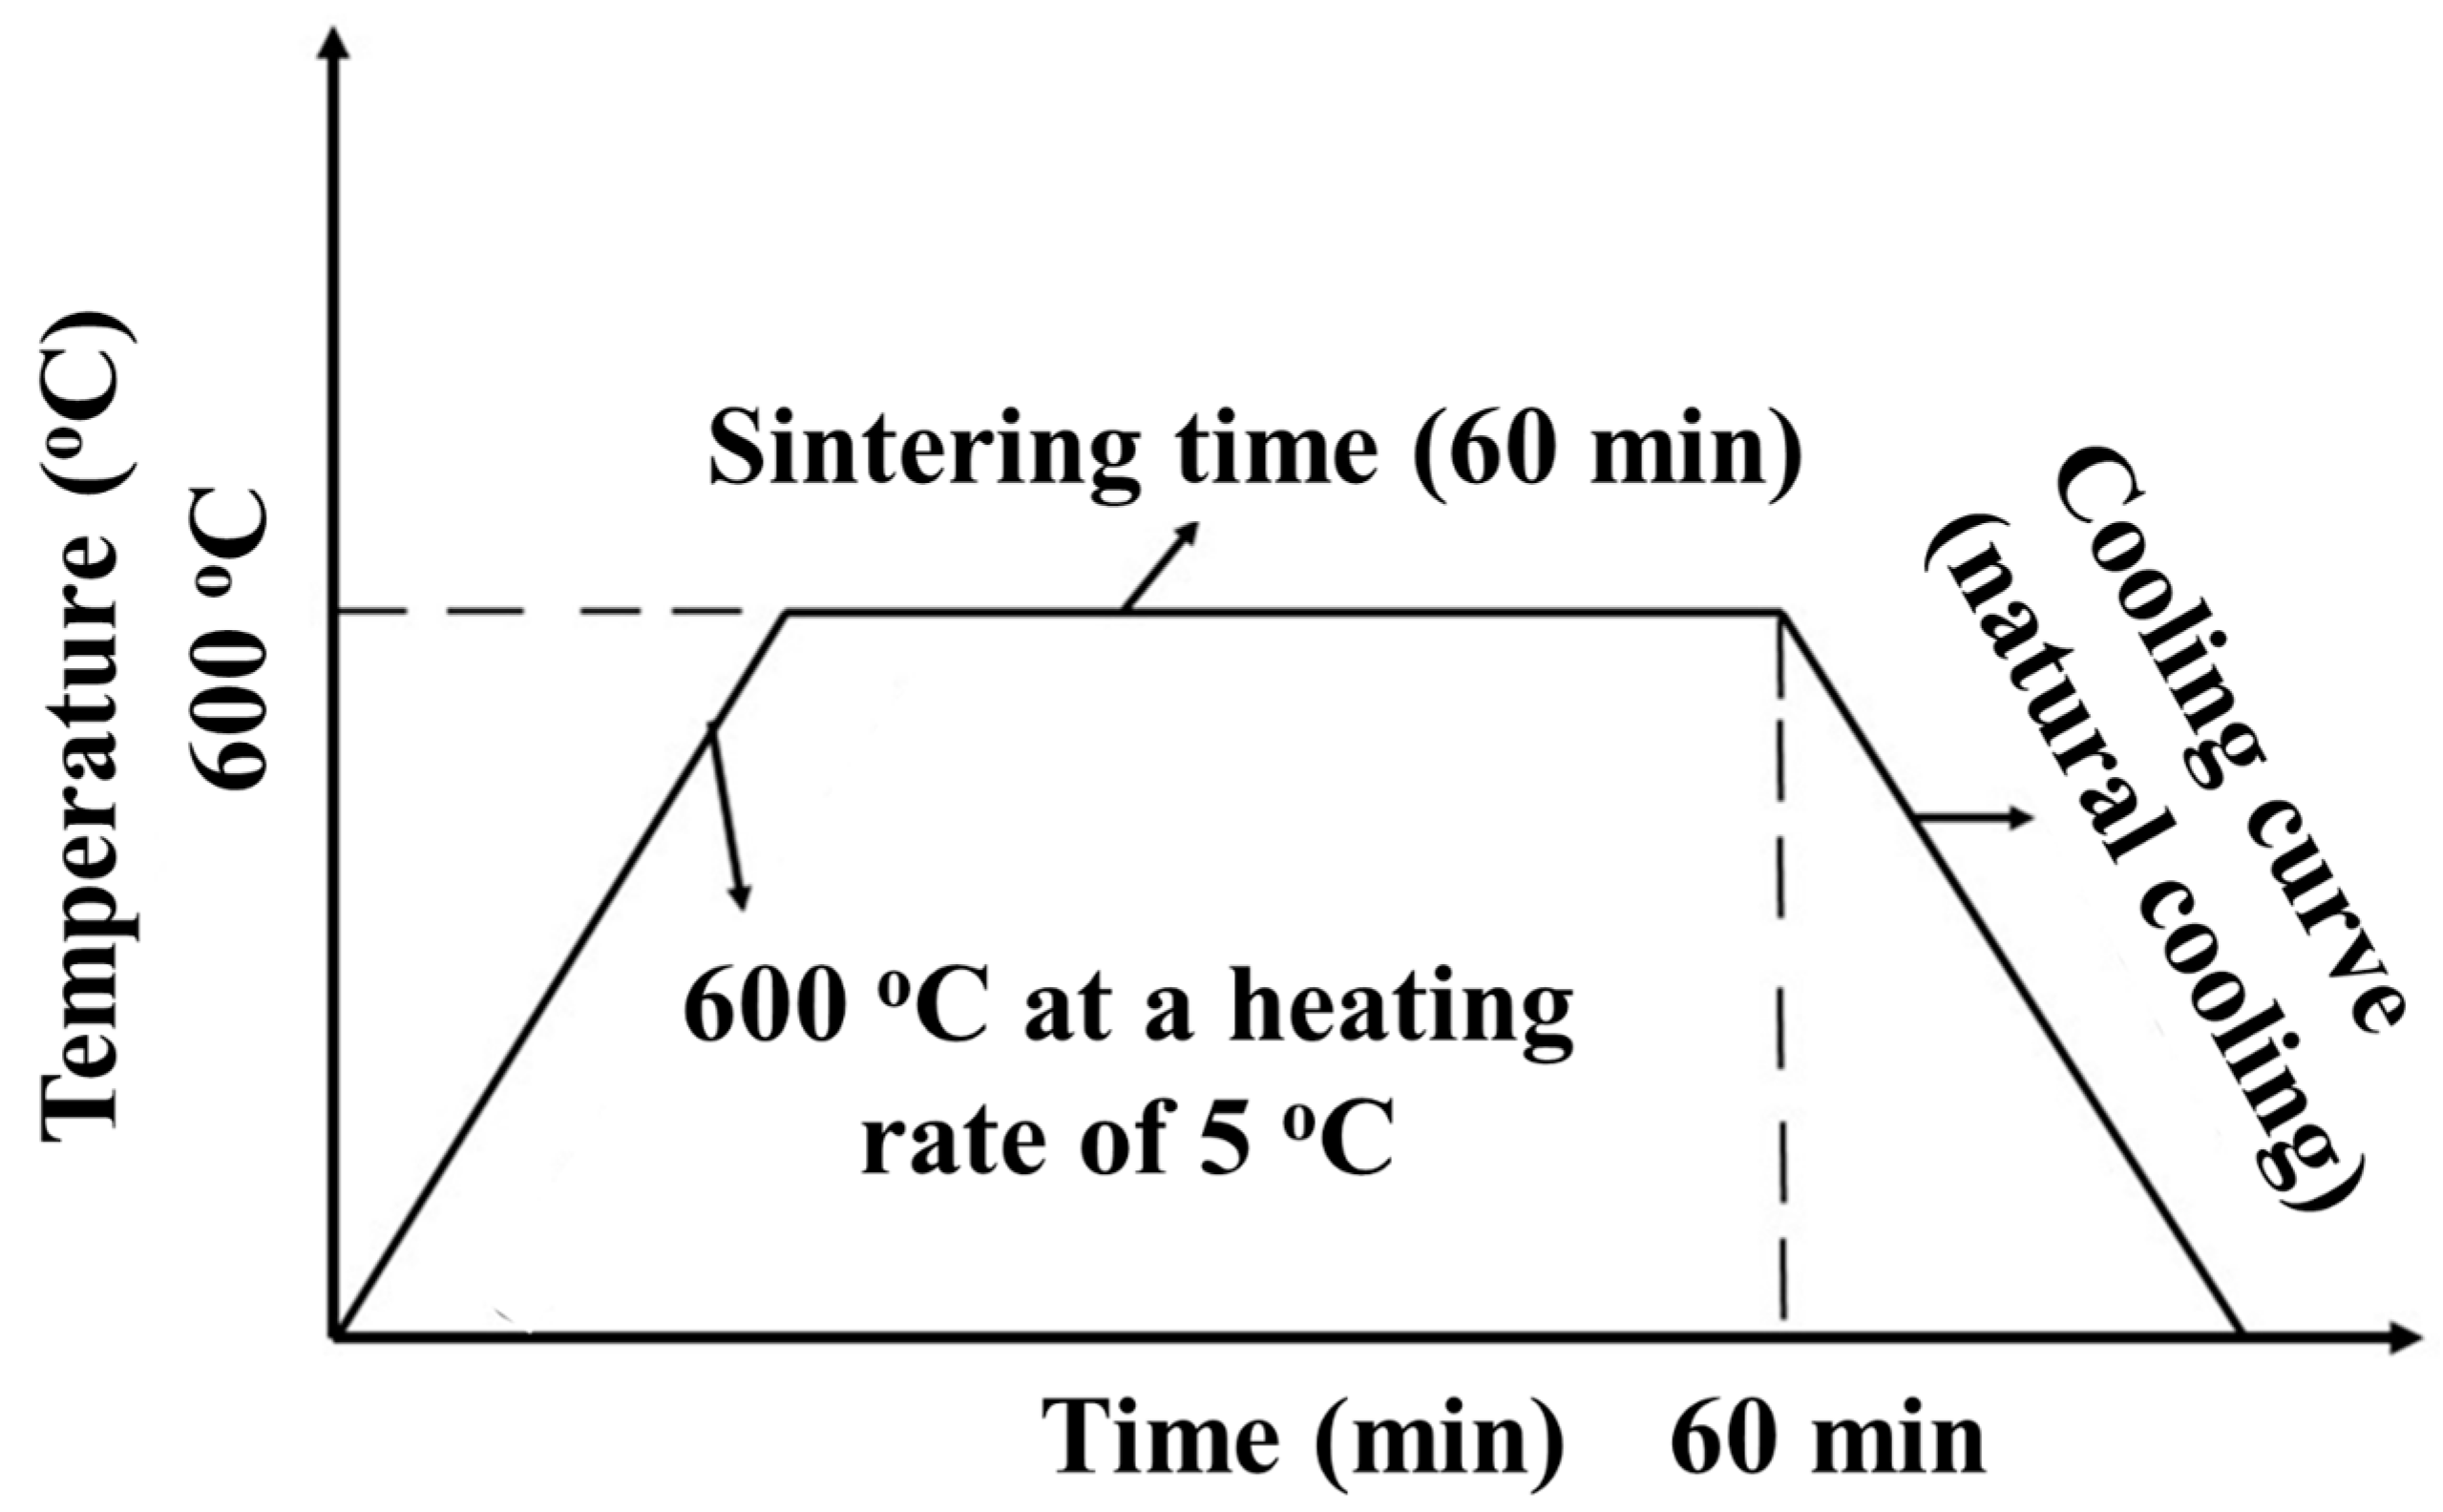
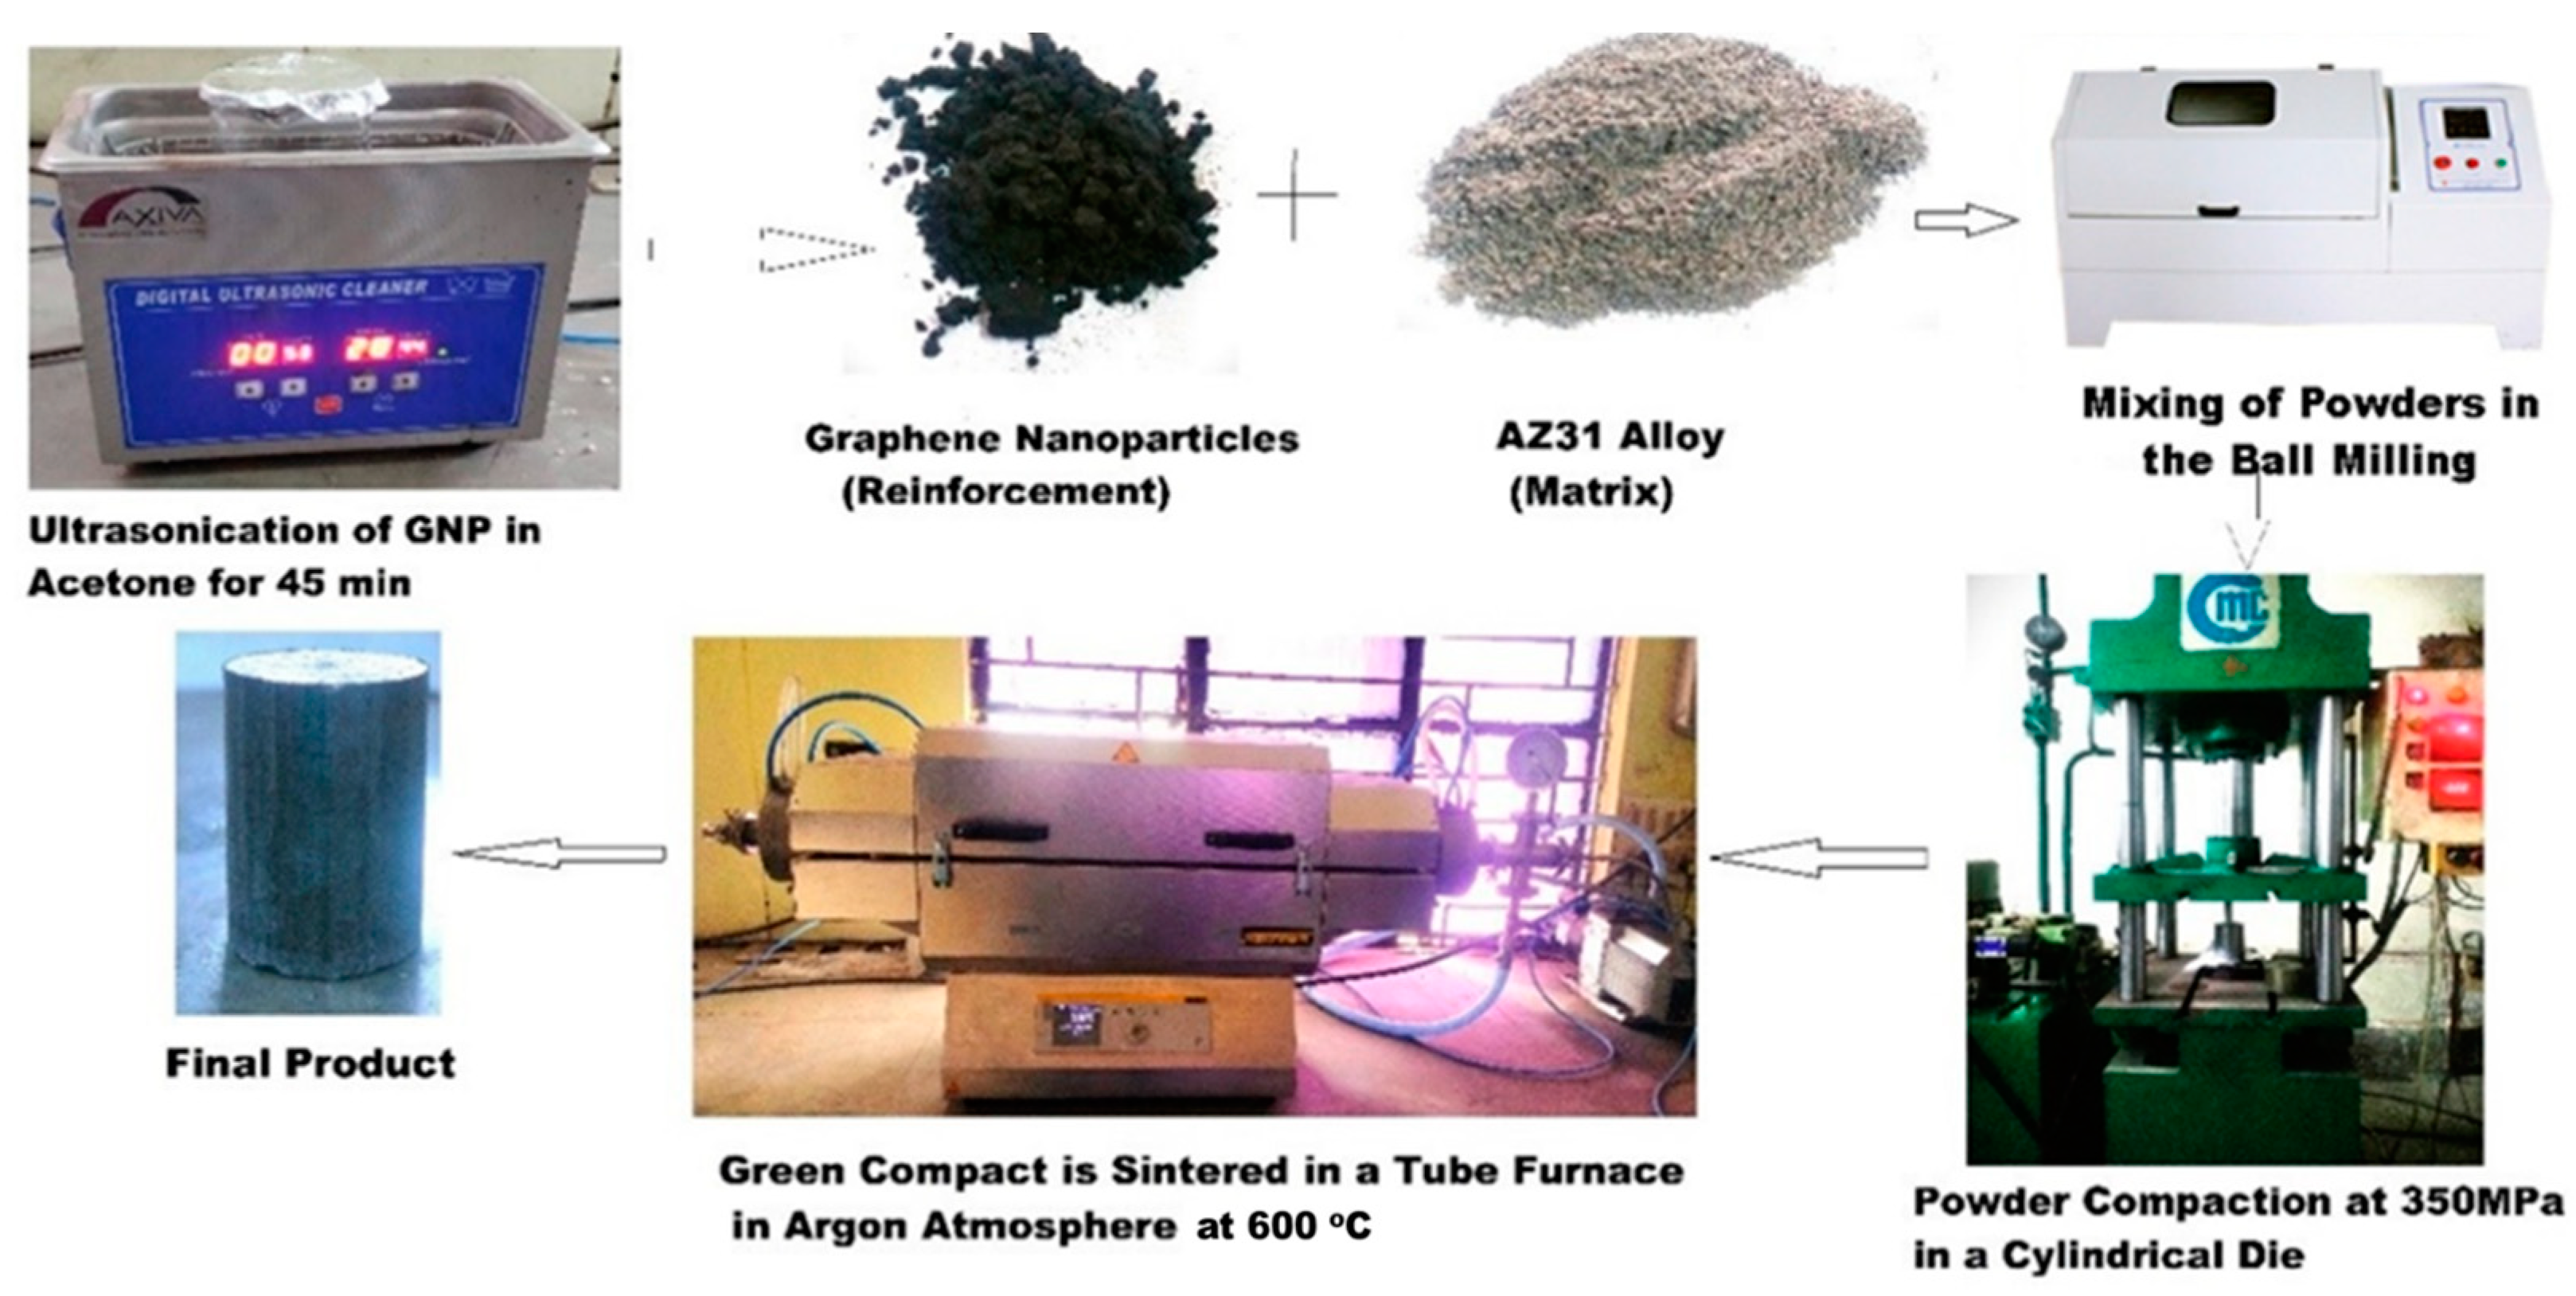
The AZ31 alloy was selected as a matrix material that acts as a bonding element in the composite for the distribution and transfer of load from the matrix to reinforcement [21]. The composition of the AZ31 alloy is illustrated in Table 1. Table 2 indicates the properties of the AZ31 alloy. The average particle size of the AZ31 alloy is 150 µm. AZ31 alloy powder is manufactured by Parasmani Metals, Mumbai, India. Graphene nanoparticles (GNP) were used as a reinforcing agent in the AZ31 matrix to improve the mechanical properties of the composite. The properties of graphene nanoparticles are listed in Table 3. The average particle size of graphene nanoparticles is 5–10 nm. The material powder is manufactured by Platonic Nanotech Pvt. Ltd., Jharkhand, India. Carbon-based nanoparticles provide a strong bonding strength in the composite subject to improvement in wear resistance and compressive strength of the composite [24].

2.2. Methodology

AZ31 alloy matrix material reinforced with graphene nanoparticles was prepared using a powder metallurgy route to form a metal matrix composite. Initially, ultrasonication of graphene nanoparticles was performed in an acetone solution for 45 min to avoid the agglomeration of nanoparticles while mixing them with the AZ31 alloy. After ultrasonication, the AZ31 alloy was added to the slurry of nanoparticles to ensure the agglomeration-free mixing of nanoparticles in the metal matrix composite. Then, after the evaporation of acetone from the mixture (containing matrix and reinforcement powder), the powders were placed in a stainless-steel jar and 0.3 wt.% stearic acid was added to the mixture to minimize cold-welding during planetary ball milling. The powders were then ball-milled at 500 rpm for 1 h with stainless-steel ball diameter of 3 mm under an argon inert atmosphere at a flow rate of 200 mL/min. Argon gas was used as a protective atmosphere in the jar to minimize oxidation. The weight ratio of the stainless-steel milling balls to mixture powder was 20:1 [25]. Thereafter, the homogenous mixture of powders was compacted in a stainless-steel cylindrical die of diameter 20 mm at compaction pressures of 250 MPa, 300 MPa, and 350 MPa, with zinc steroid used as a lubricant to prepare the green compact. The green compact was then sintered at sintering temperatures of 500 °C, 550 °C, and 600 °C in a tube furnace by creating a vacuum inside the furnace. The heating rate for sintering was taken as 5 °C/min. The sintering times were taken as 45 min, 60 min, and 75 min for sintering. From a cooling perspective, natural cooling via opening the pump valve was incorporated into the furnace. The sintering curve for the preparation of the composites is shown in Figure 1. Argon gas was supplied in the tube furnace at a flow rate of (300 mL/min) which prevents the oxidation of magnesium material in the sintering process, allowing the proper diffusion of the material in the pores to enhance the bonding strength between the reinforcing agent and matrix material. After sintering, the final sample was obtained with ϕ20 × 20 mm dimension which was used to evaluate the mechanical properties for the optimized process parameter of composite. The schematic process of fabrication of the magnesium alloy-based metal matrix composite using the powder metallurgy route is illustrated in Figure 2.

2.3. Characterization, Testing, and Experimentation

The microstructure of the composite was analyzed by Scanning Electron Microscopy (SEM) (JEOL, JSM-7610FPlus, Akishima, Japan). The existence of GNP in the composite material was analyzed using X-ray diffraction (XRD) (Bruker D8 Discover, Karlsruhe, Germany). Porosity measurement was carried out using image analysis techniques on SEM micrographs, where image processing software like ImageJ (version 1.54d) converts images into binary formats to distinguish pores from solid regions. The porosity percentage was calculated by determining the total pore area relative to the observed area. Grain size was measured using the linear intercept method (ASTM E112), where parallel lines are drawn over SEM images, and grain boundaries intersected by these lines are counted [26]. The average grain size (d) was then calculated using d = L/N, where L was the total line length and N was the number of interceptions. The compressive strength of the composite and AZ31 alloy was analyzed using a compression test by a universal testing machine (Instron 3366, Norwood, MA, USA). The specimen used for the compression test was prepared using ASTM standard E9 [27]. The length-to-diameter ratio for the compression test was taken as 0.8, as illustrated in ASTM standard E9, and the strain rate is given as 0.0005 s−1 [26]. Microhardness was accomplished by using a micro-Vickers hardness tester as per ASTM Standard E384 [28]. However, the samples were required to be polished on 400–1500 grit papers along with polished via Al2O3 (alumina powder). Then, the samples were dipped in a 100 mL solution (97% ethanol and 3% nitric acid) for around 10 s before measuring the microhardness of the composite [29]. The seven trails were performed on the polished surface, involving a 1 kgf load with a dwell time of 15 s, and the average value of microhardness was recorded.

Optimization Technique: Taguchi Method

The Taguchi method was a robust experimental design tool used to systematically collect data and analyze the effects of process variables on a specific response variable, which was influenced by these parameters, while also facilitating the development of high-quality systems [30]. In this study, three control factors were selected for the experimental design (Table 4), i.e., compaction pressure (A), sintering temperature (B), and sintering time (C), with each factor evaluated at three levels.
An L9 orthogonal array was selected for experimental design. The experimental results were converted into signal-to-noise (SN) ratios, where the signal represents the mean value and the noise corresponds to the standard deviation. The Taguchi method employs the SN ratio to evaluate quality characteristics based on various types of loss functions. SN ratios can be categorized into three types of characteristics: smaller-is-better, larger-is-better, and nominal-is-best [31]. For this study, the larger-is-better type characteristic was taken, and the SN ratio was calculated by using Equation (1), as given below:
SN = - 10   log 10 ( 1 n i = 1 n 1 / y i 2 )
where y1, y2, …, yn are the experimental results and n is the number of experiments. The SN ratio transformation was used to maximize microhardness and compressive strength. Table 5 showed the experimental design using L9 orthogonal array indicating the symbolic representation of the sample prepared. By analyzing the SN ratio, it was possible to determine statistically significant parameters.

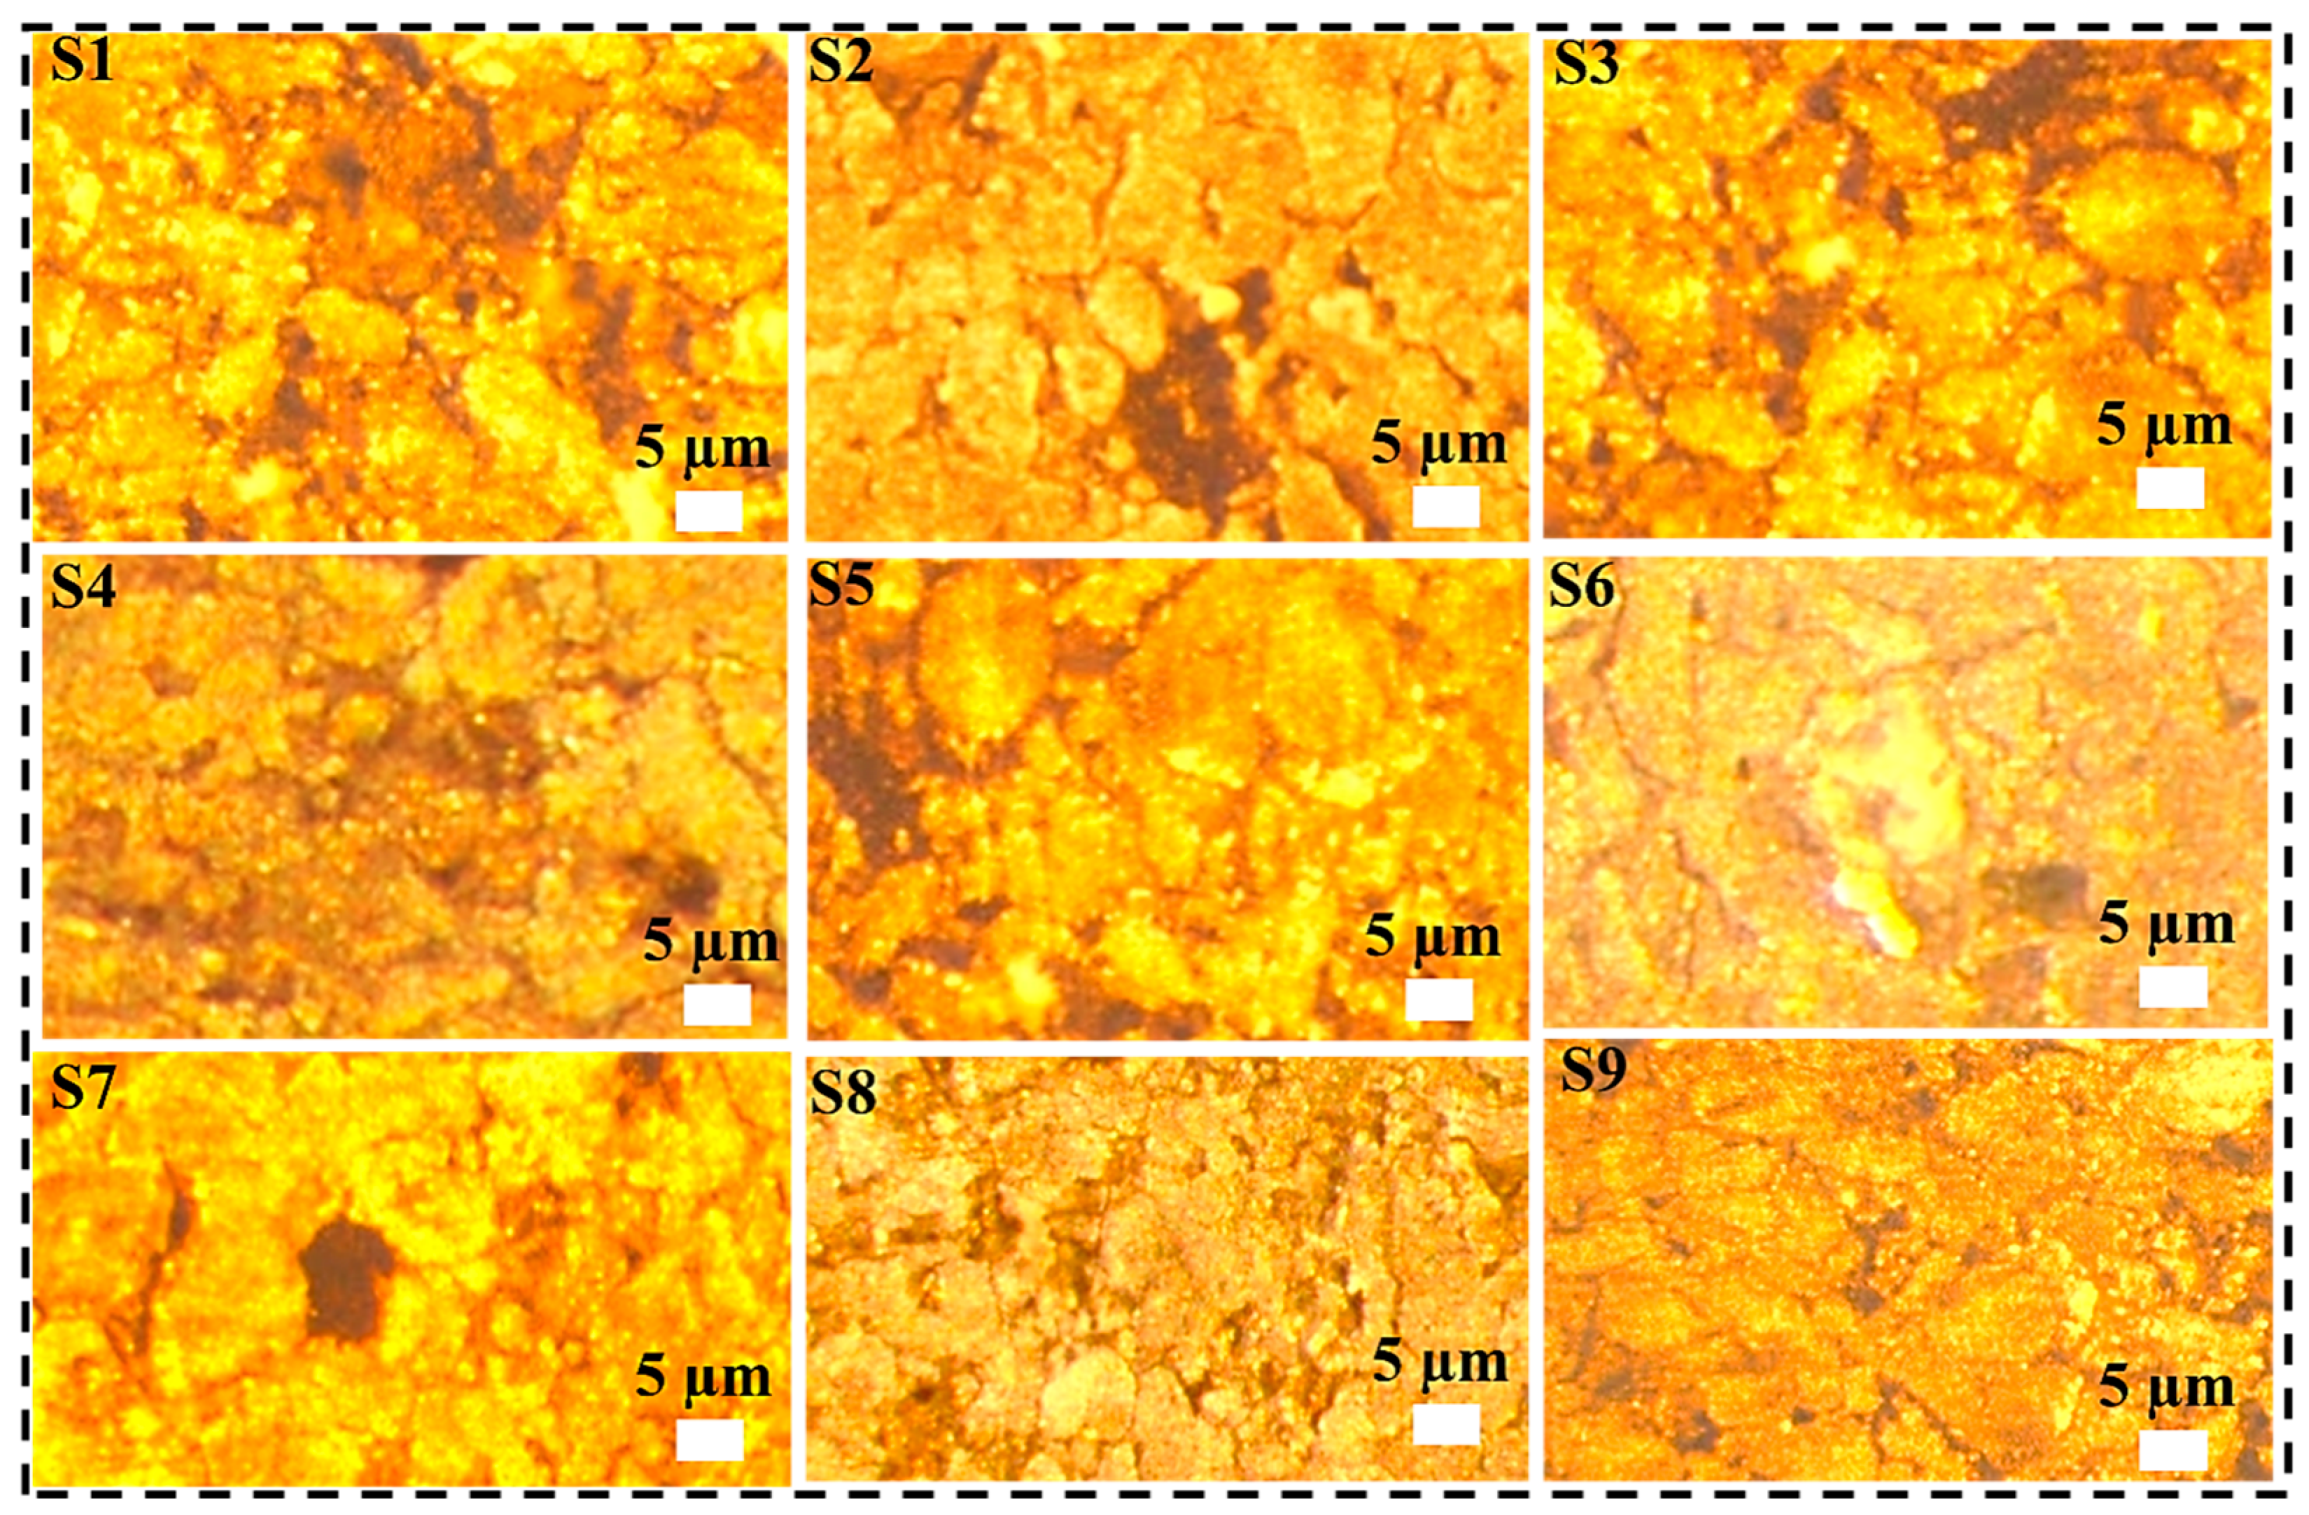
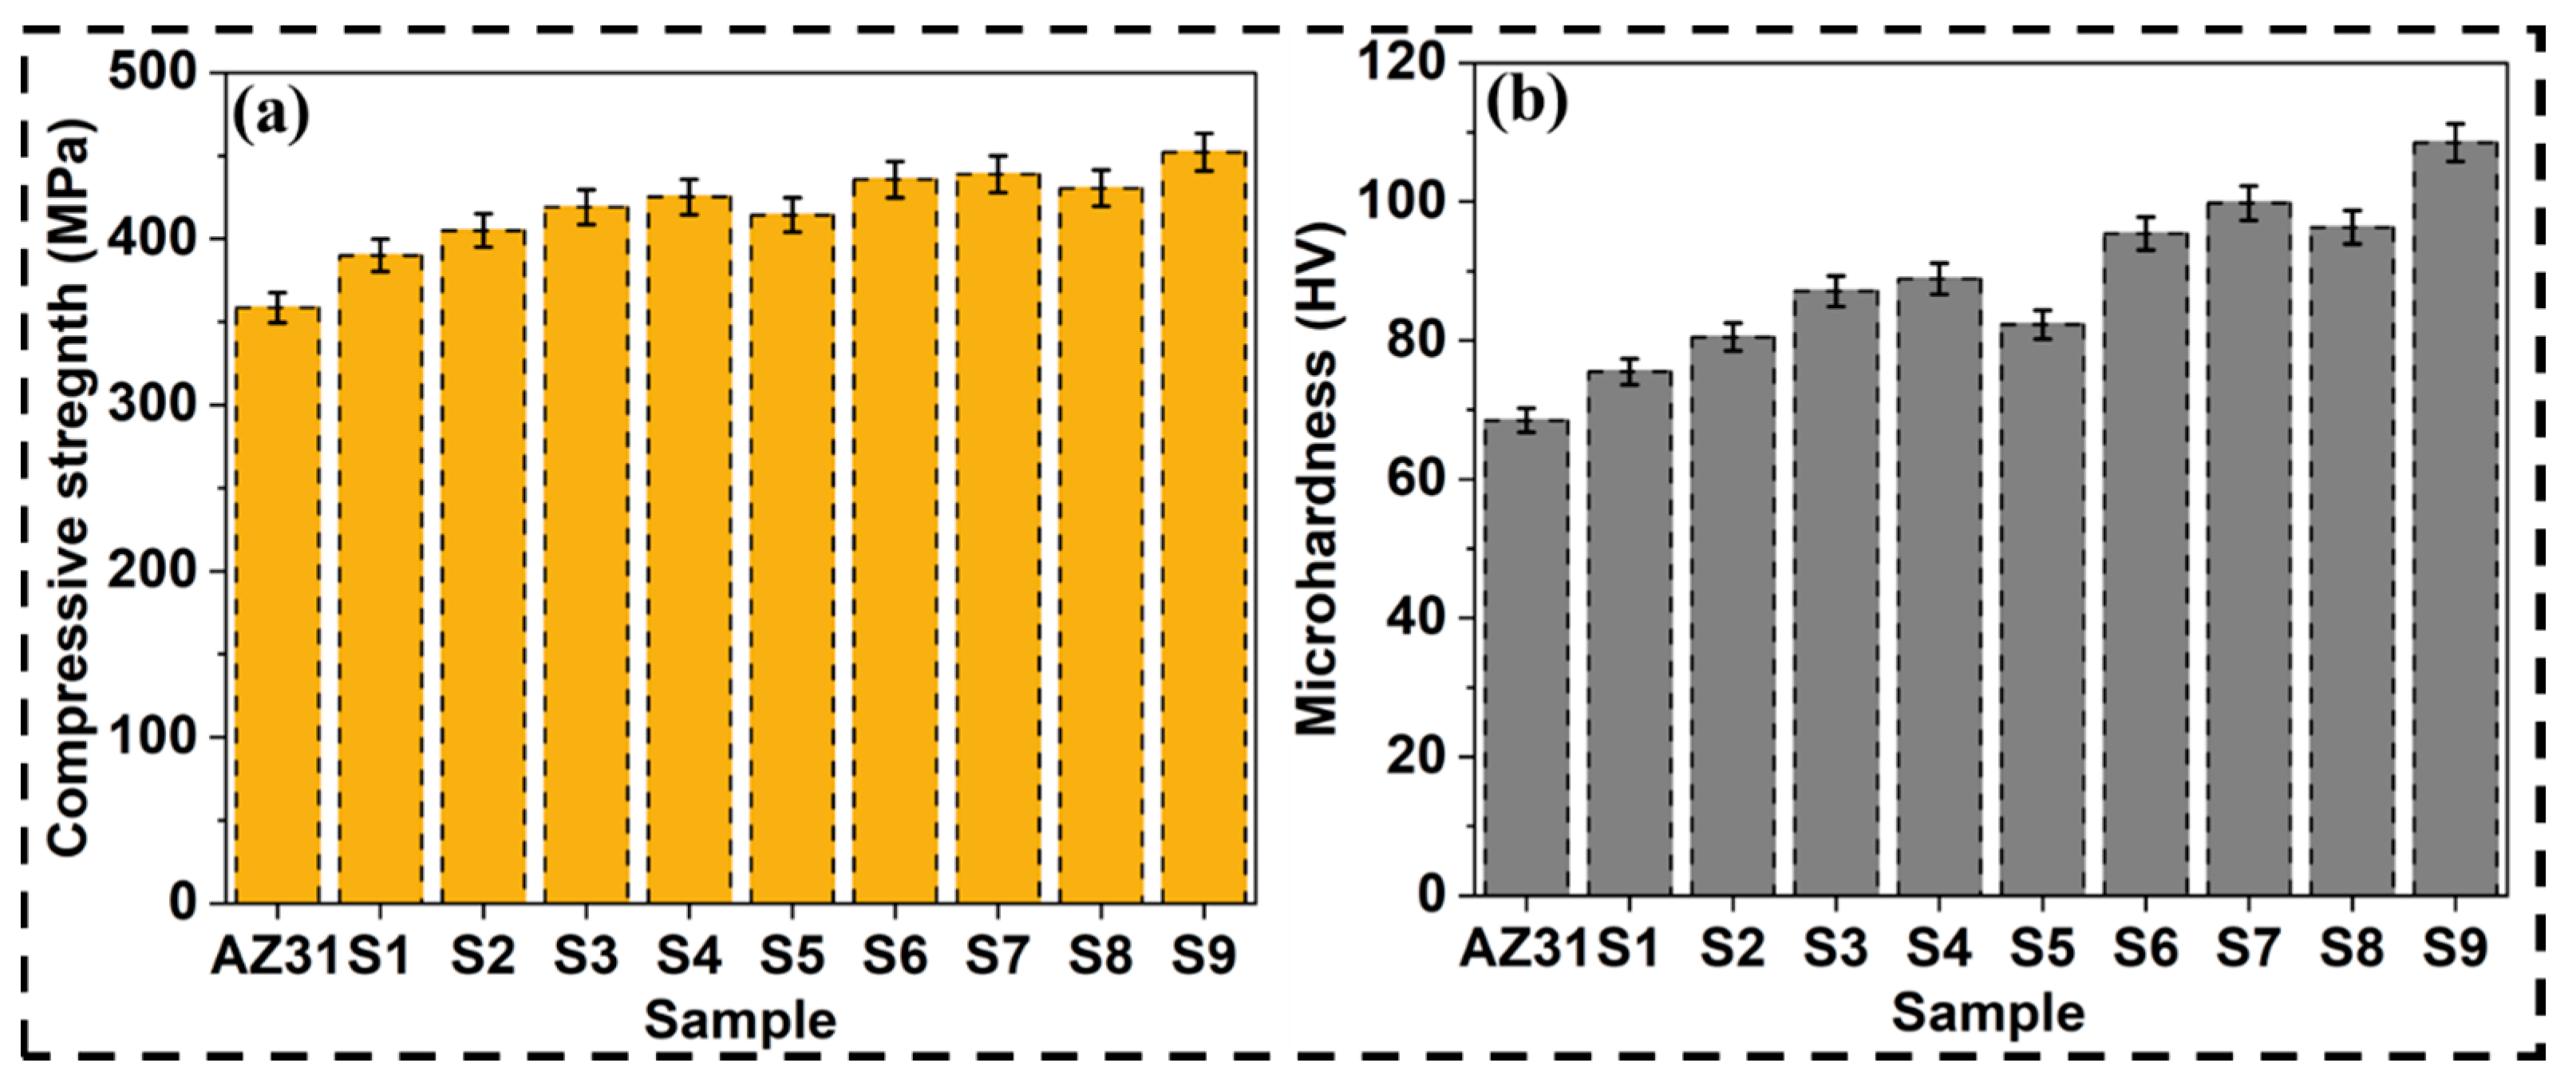
3. Results and Discussion

The microstructural analysis of all samples, as illustrated in Figure 3, provides critical insights into the influence of sintering parameters (sintering time, sintering temperature, and compaction pressure) on material densification. The micrographs of specimens S1, S2, and S3 reveal significant porosity, primarily attributed to the lower compaction pressure applied during processing. This results in inadequate particle rearrangement and reduced packing density, leading to an increased presence of micro-voids. A direct correlation was observed between compaction pressure and porosity reduction. As compaction pressure increases, the material exhibits improved particle cohesion, which minimizes void formation. Additionally, sintering time and temperature play a crucial role in enhancing densification. Prolonged sintering duration coupled with elevated sintering temperatures facilitate enhanced atomic diffusion and grain boundary migration, promoting effective pore elimination. The combined effect of these parameters accelerates mass transport, reducing residual porosity and increasing overall density. The micrographs of the S9 specimen, subjected to the highest compaction pressure, extended sintering time, and elevated sintering temperature, exhibit a significant reduction in micro-voids. This improvement is attributed to enhanced diffusion kinetics, which results in more efficient reinforcement distribution within the matrix material. The uniform dispersion of reinforcement phases, coupled with optimized sintering conditions, contributes to improved mechanical integrity and superior densification. These findings highlight the interplay between processing parameters and microstructural evolution, emphasizing the necessity of optimizing sintering conditions for superior composite performance.
The XRD pattern for AZ31/1.75wt.% GNP composites at different processing parameters was mainly analyzed to reveal the presence of different phases and peaks present in the composites. The formations of peaks and phases were directly linked to the processing parameters. The peaks and phases obtained are the results of processing parameters of powder metallurgy (mixing the powders, compaction pressure, and sintering time and temperature). Therefore, the result mainly depicted the presence of the α-Mg phase in all the composites formed. The absence of β-Mg17Al12 phase peaks in all the compositions was detected in the XRD. Other than peaks and phases depiction, the results of XRD were also crucial in analyzing whether AZ31 alloy reacts with GNP or not since the absence of peaks related to interfacial products was consistent in all the compositions of AZ31/GNP composites. This provides suitable evidence that there was no reaction taking place between the matrix and reinforcement. Other than that, no literature has indicated the reaction of Mg with GNP. The presence of the MgO peak provided evidence of strong covalent and ionic interaction at the interface between Mg/MgO and MgO/graphene. This replaced the weak van der Waals bonding between graphene and Mg alloy and provided a hindrance to the dislocations. Hence, the existence of the MgO phase is assumed, finding a resemblance with the strong interfacial bonding strength between the matrix and reinforcement. Since it has been reported in the microstructure that the addition of graphene nanoparticles was attributed to grain refinement, the evidence was concluded by XRD result data. As the graphene nanoparticles served as the nucleation substrate for the α-Mg phase to provide a reduction in the grain growth. Therefore, most peak (α-Mg phase) depictions were acting as a nucleation site for grain reduction. Other than that, the microstructure formed inferred that GNP was distributed along the α-Mg phase that was accompanied by the presence of MgO oxide.
The addition of graphene nanoparticles in the AZ31 matrix composite enhances grain refinement compared to the base alloy AZ31. Figure 4b shows the variation in grain refinement with compaction pressure, sintering temperature, and sintering time. The result indicated that the effective densification of reinforcement in the matrix reduces the grain size more effectively imparting the proper bonding between the matrix and reinforcement. The proper infusion of reinforcement in the matrix further reduces the porosity (%) of the composite as shown in Figure 4c. Therefore, the reduction in grain size and porosity (%) ultimately enhances the mechanical properties of the composite compared to the base alloy.
The compressive strength of the composite was depicted to be increased with the addition of graphene nanoparticles compared to the base alloy (AZ31). It is due to the effective transfer of loads from the matrix to graphene nanoparticles that occurred owing to the good wettability of graphene nanoparticles in the magnesium matrix. Thus, a good mechanical bonding was revealed between the reinforcement and matrix. The mechanical bonding between the reinforcement and the matrix was enhanced during the sintering process, allowing the effective diffusion of reinforcing material occurring in the matrix and enabling the improvement in the compressive strength of the composite. Figure 5a shows the compressive strength for all the samples prepared at different process parameters. The compressive strength of the composite is obtained to be higher for the S9 sample than the base AZ31 alloy (358 MPa). The effective infusion of nanoparticles in the composite at the optimized parameter signifies the proper diffusion between reinforcement in the AZ31 alloy. Therefore, the bonding strength between the reinforcement and matrix material increased which resulted in better compressive strength. The microhardness of the composite was also observed to be increased with the addition of graphene nanoparticles and obtained to be higher for the S9 sample (108.5 HV) as shown in Figure 5b. The proper diffusion of reinforcement resists localized deformation in the matrix during the indentation. Thus, a high value of microhardness was observed for the S9 sample compared to other samples and the base alloy.

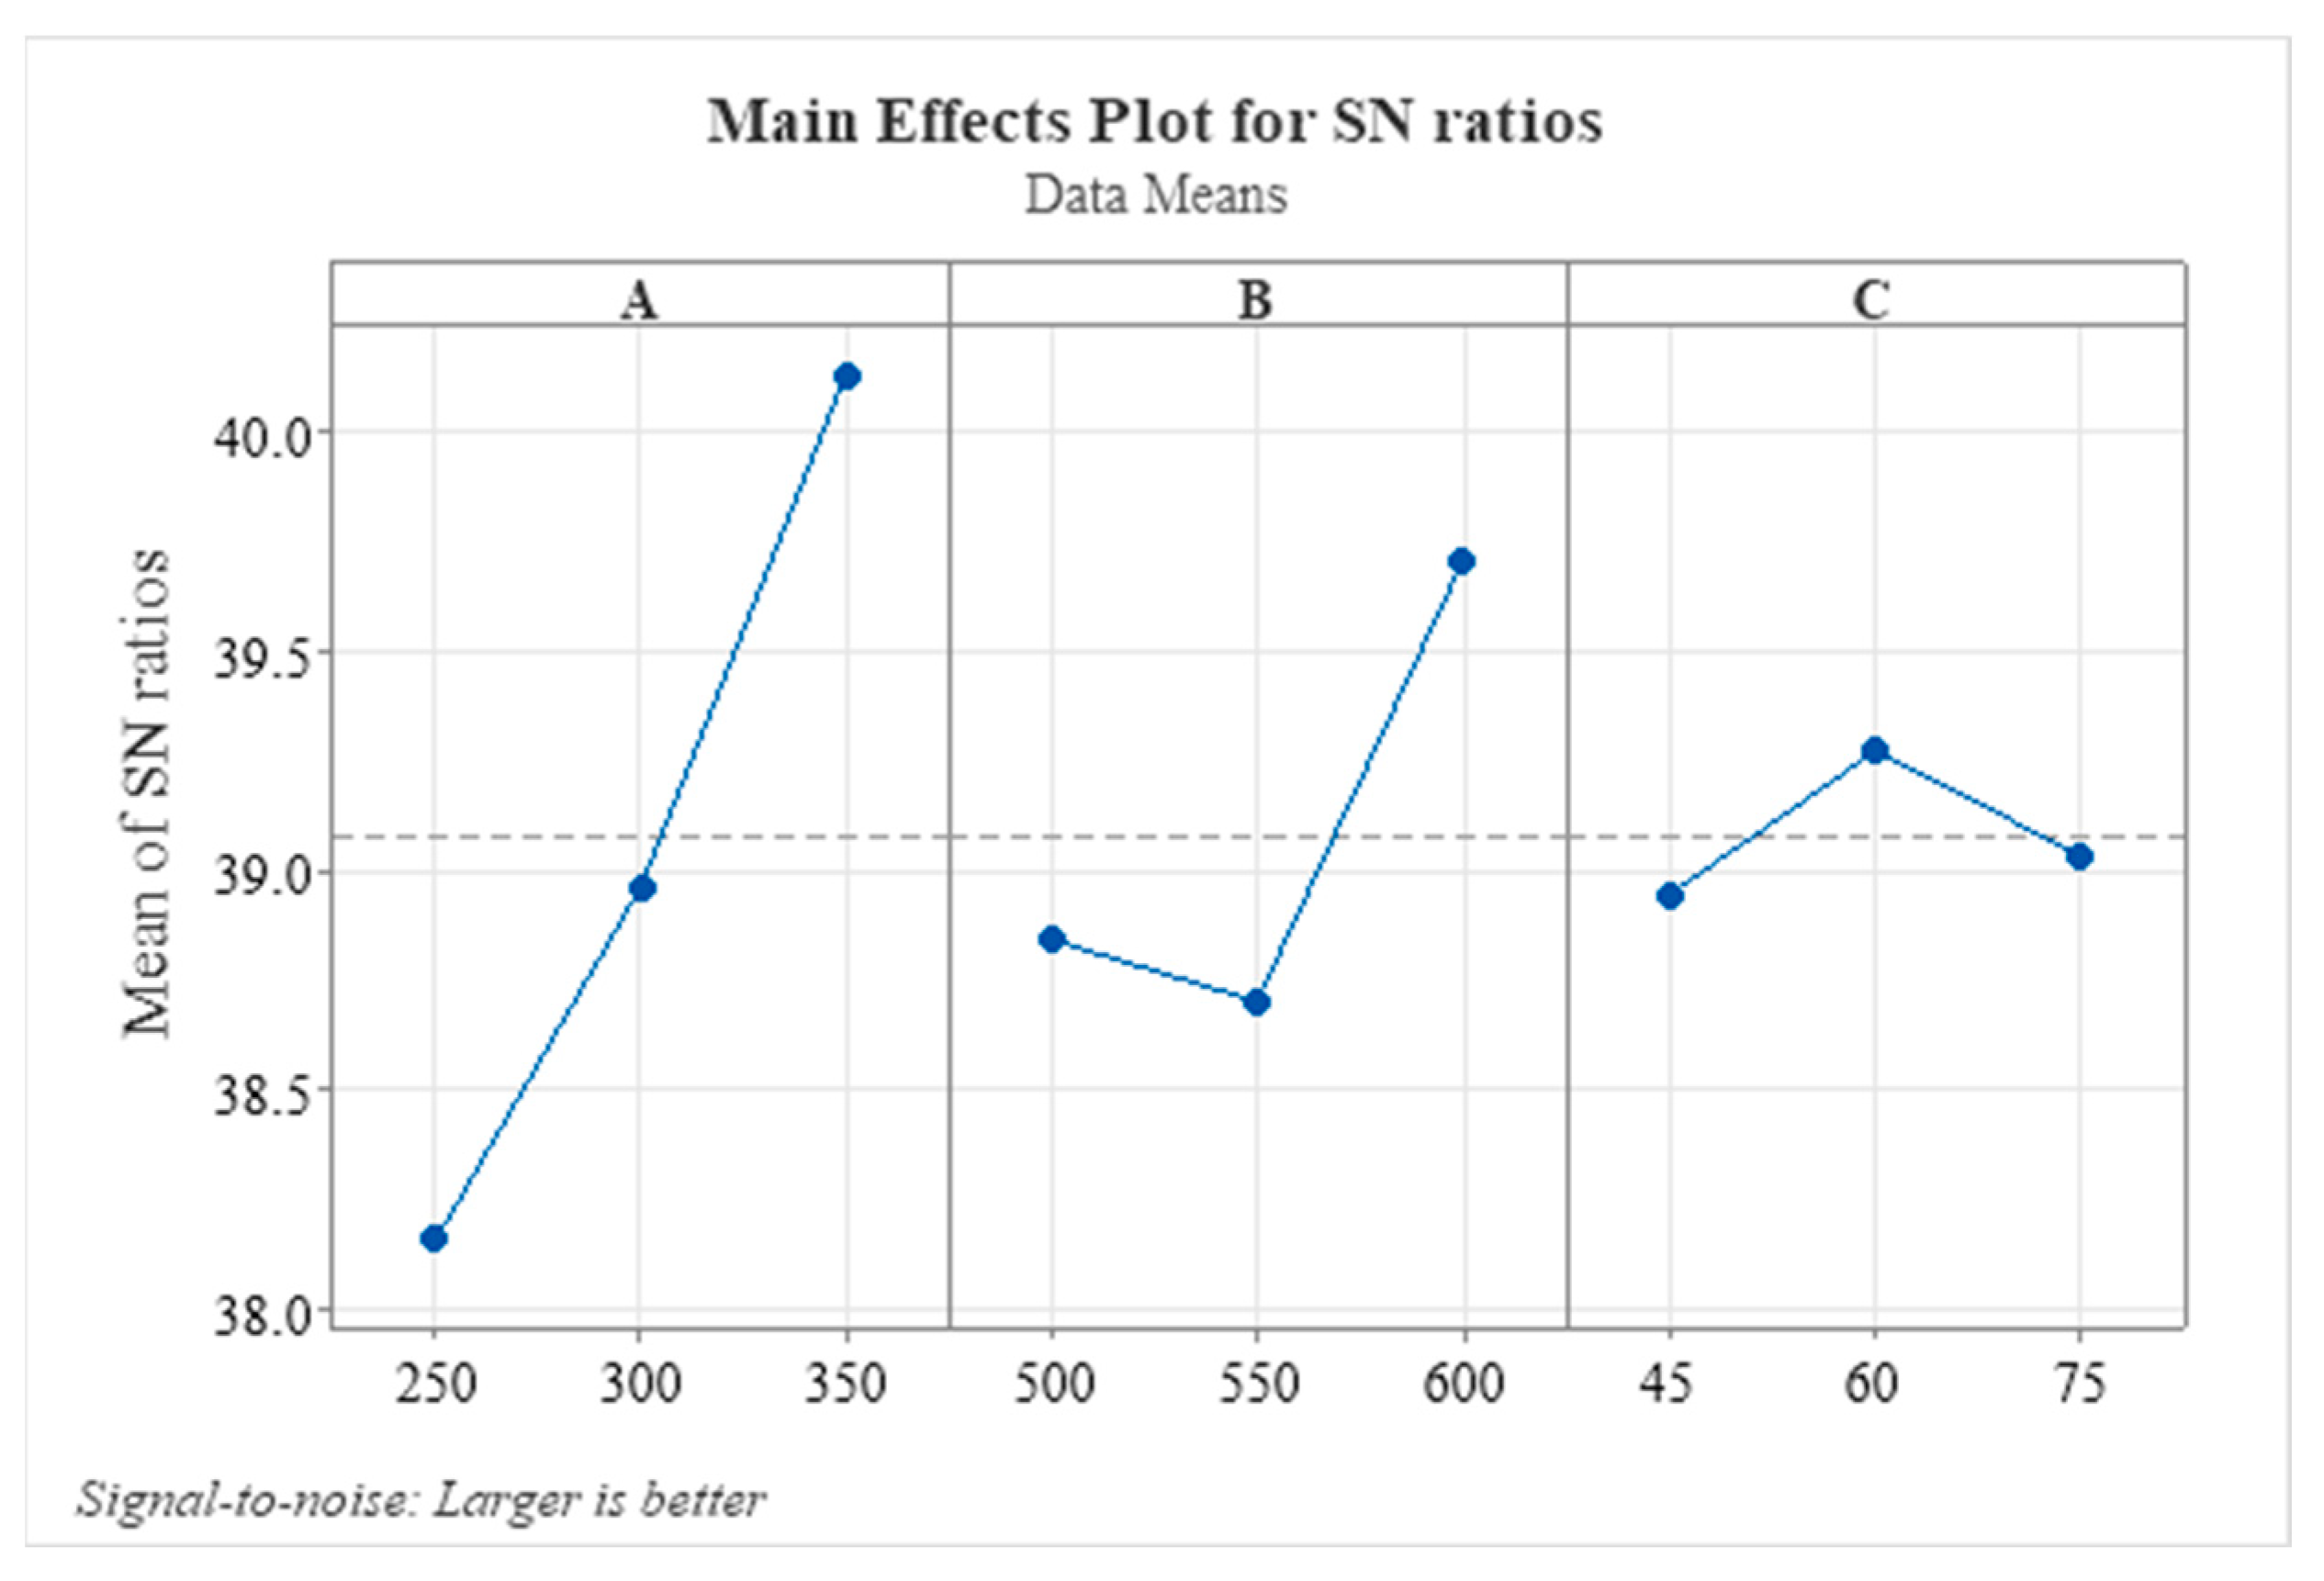
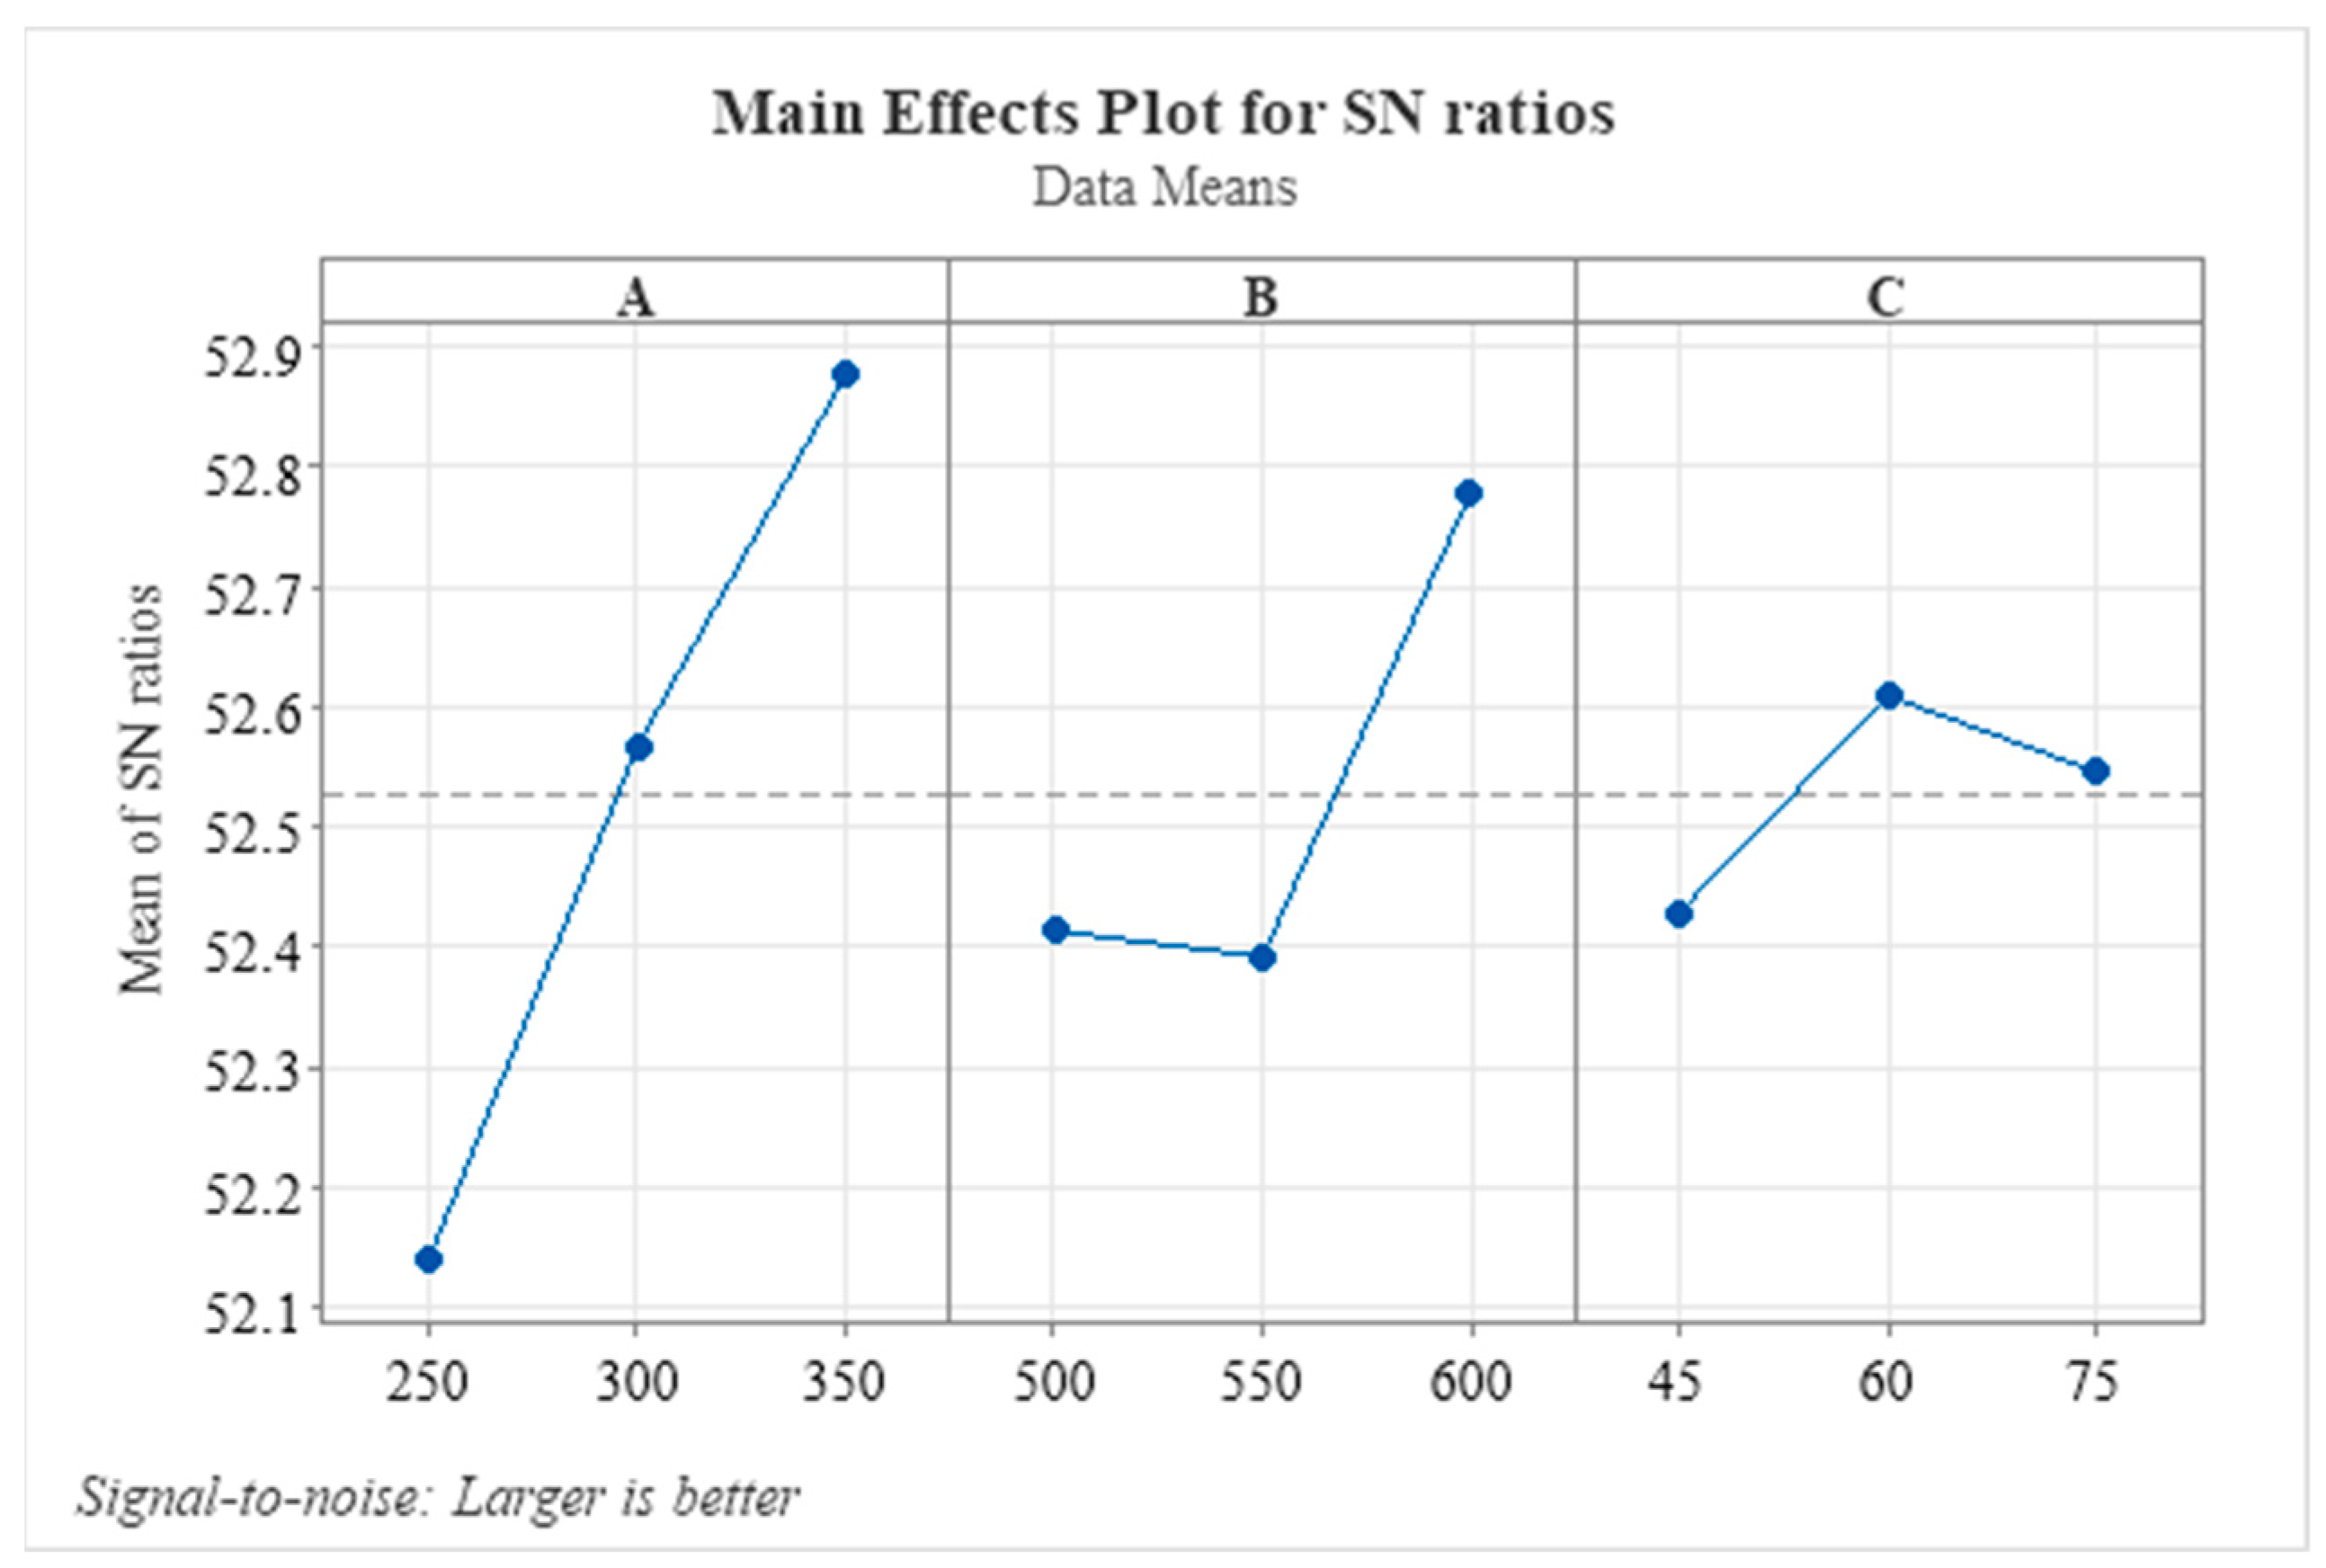
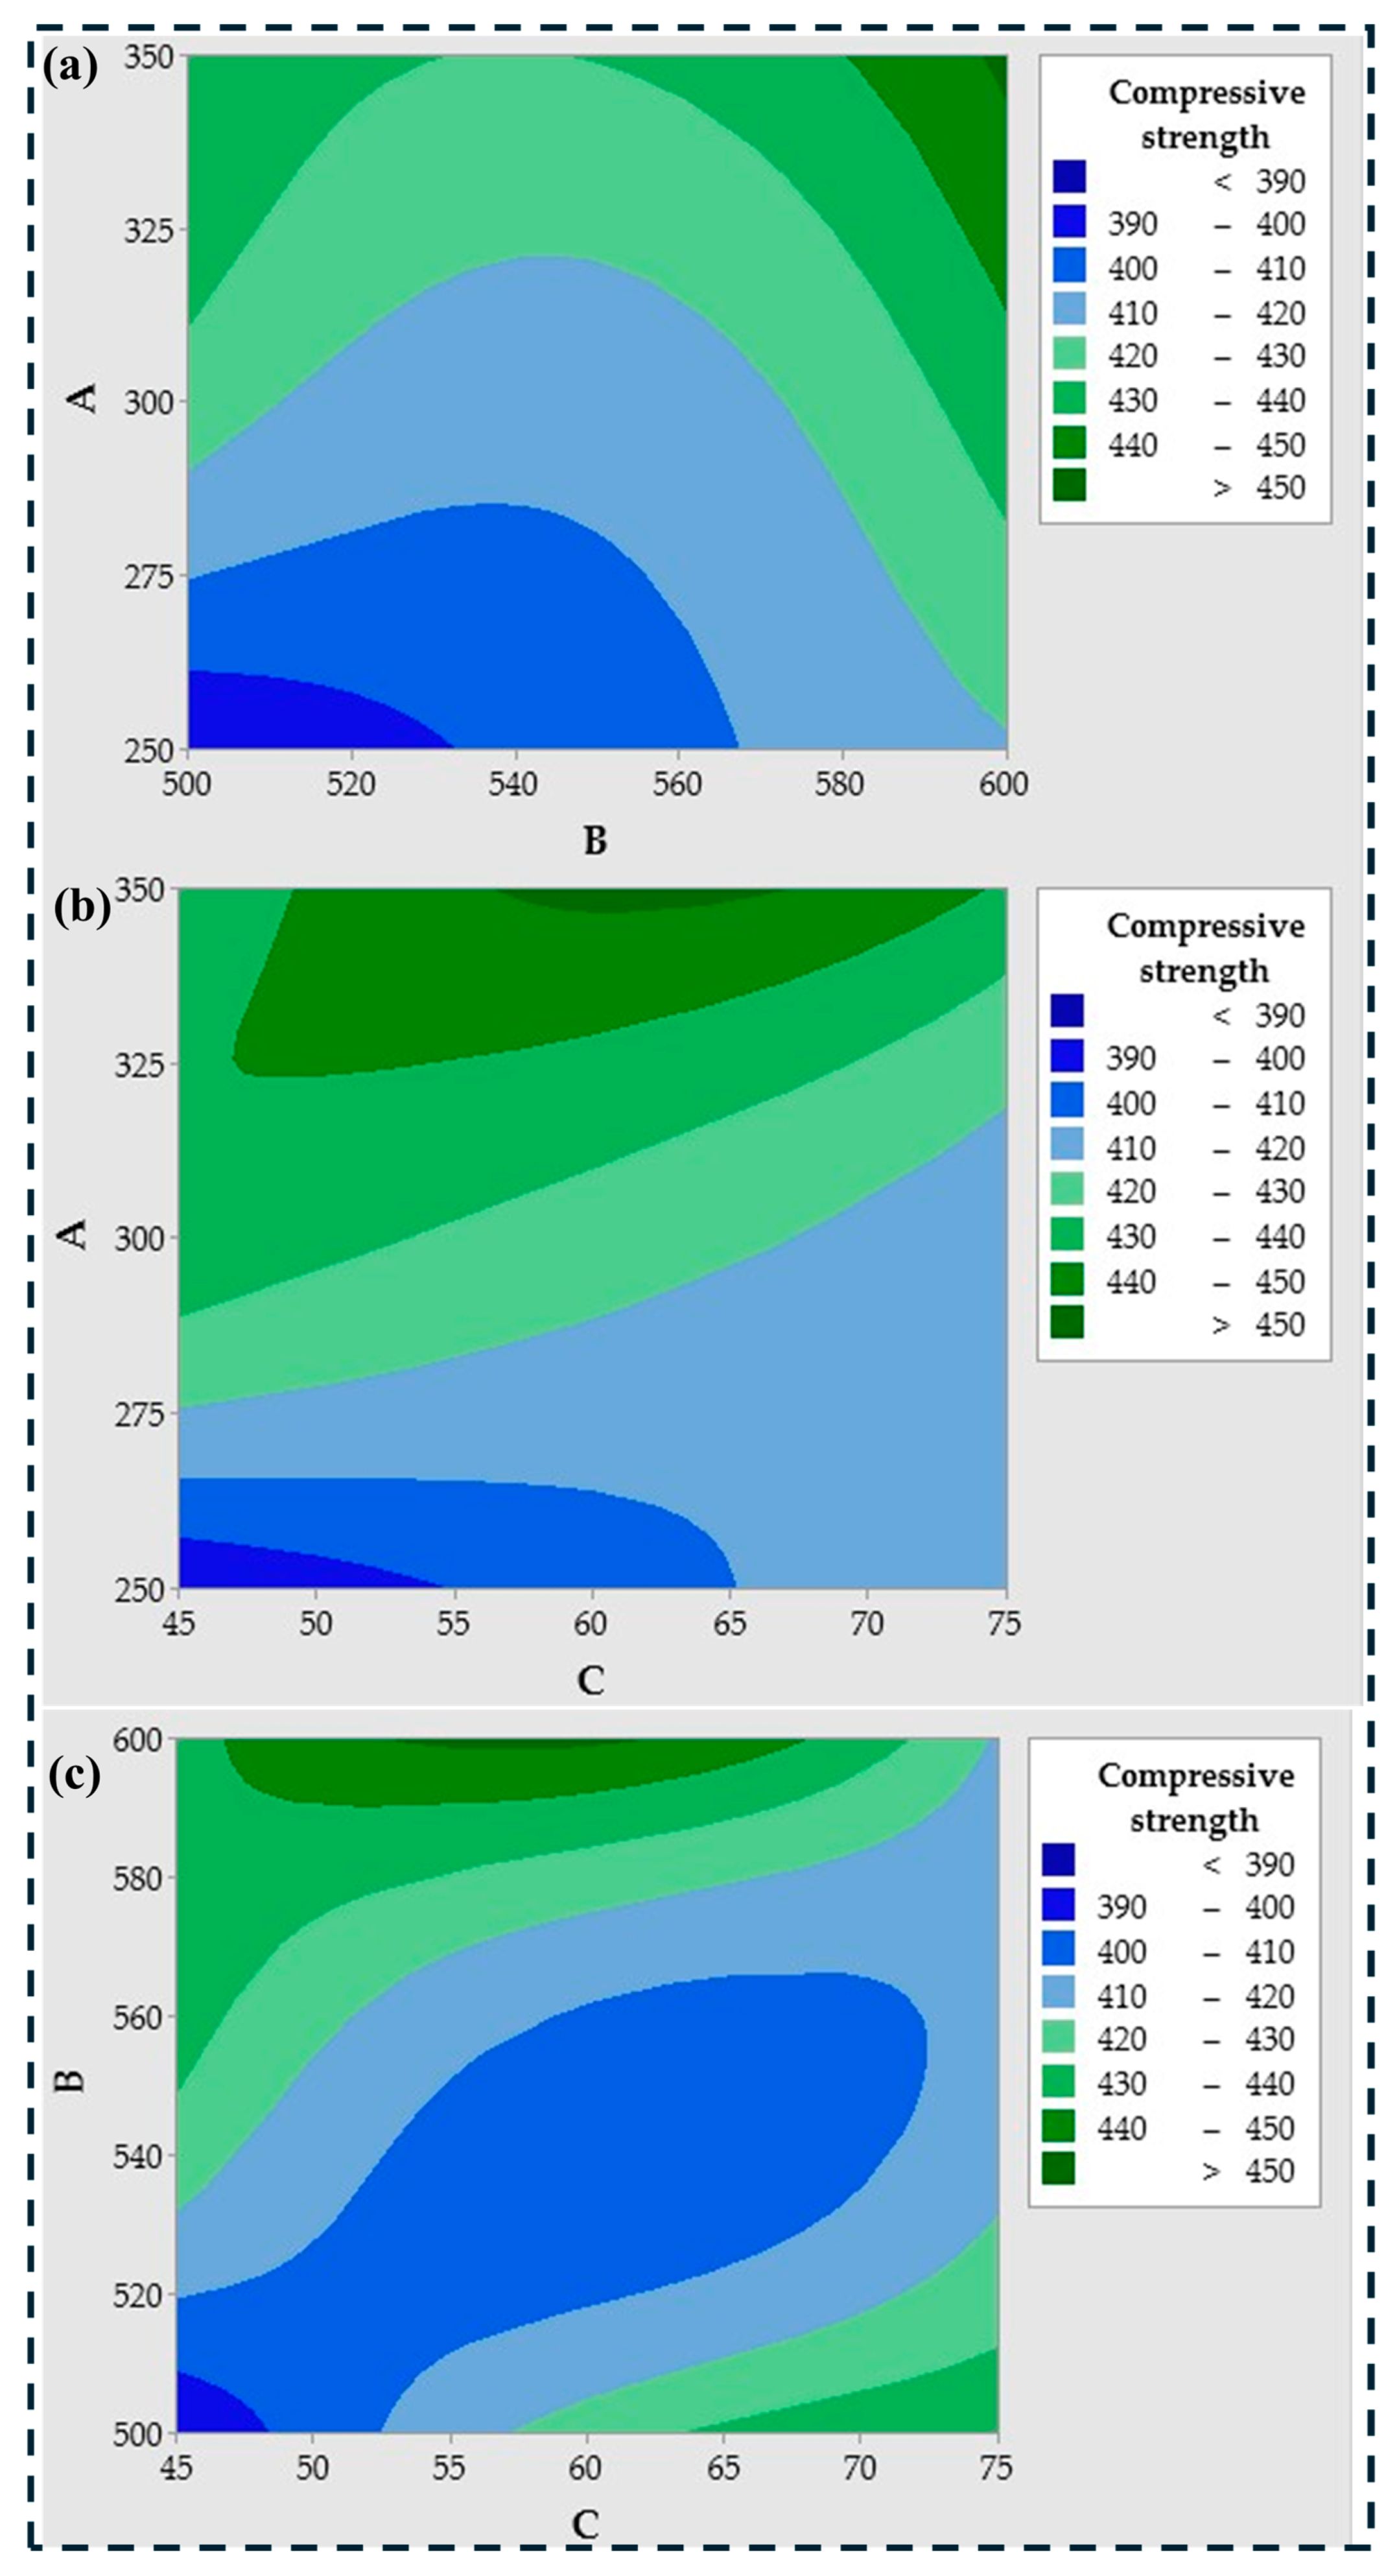
3.1. Statistical Analysis

The results for microhardness and compressive strength, along with their corresponding signal-to-noise (SN) ratios, are presented in Table 6. Regardless of the type of quality loss function applied, the transformation of experimental results into SN ratios allows for a consistent interpretation signifying that a higher SN ratio provides better performance. These experimental outcomes were further analyzed using an analysis of variance (ANOVA) to determine the effects of the control factors, i.e., compaction pressure, sintering temperature, and sintering time on the microhardness and compressive strength of the material. Additionally, ANOVA assessed the interactions between these processing parameters. The analysis was conducted at a significant level of 5%, equivalent to a 95% confidence level. The results of the ANOVA are summarized in Table 7 and Table 8. Table 7, specifically, presents the response table for SN ratios, which ranks the control factors based on their influence on microhardness and compressive strength. The ranking was determined using the delta value, which reflects the range of SN ratio variations caused by each factor. The outcomes revealed that the compaction pressure exerts the greatest influence on microhardness, followed by sintering temperature. However, sintering time had the least influence on microhardness. A similar trend was observed for compressive strength, where compaction pressure was the dominant factor, followed by sintering temperature and sintering time.
The percentage contribution analysis highlights the influence of individual control factors on both microhardness and compressive strength. For microhardness, compaction pressure was identified as the most significant factor, contributing 72.99% to the observed variations. This indicates that compaction pressure plays a dominant role in determining the microhardness of the material as it directly affects the densification and bonding of powder particles. Sintering temperature was the second most influential factor, contributing 22.01%, as it governs grain growth and diffusion, which were critical for enhancing material hardness. Sintering time, however, had a relatively minor influence on microhardness, accounting for only 2.14% of the variation. A similar pattern of influence was observed when analyzing compressive strength. Compaction pressure once again emerged as the most significant factor, with a contribution of 68.38%. This underscores the importance of adequate compaction in improving load-bearing capacity of the composite. Sintering temperature contributed 23.38%, highlighting its role in reducing porosity and improving the mechanical integrity of the material. Sintering time showed a modest contribution of 4.18%, indicating that while it plays a role in enhancing compressive strength, its impact is less pronounced compared to the other two factors. These findings demonstrate the critical role of compaction pressure and sintering temperature in optimizing mechanical properties.
The ANOVA analysis for microhardness and compressive strength provides a detailed analysis of the contributions of individual control factors are compaction pressure (A), sintering temperature (B), and sintering time (C) subtending towards the variation in mechanical properties (Table 8). For microhardness, compaction pressure emerges as the most dominant factor, contributing 72.99% to the total variation, as reflected in its sequential sum of squares (Seq SS) value of 5.8445. This indicates that compaction pressure has the strongest influence on densification and particle bonding, which directly enhances the hardness of the material. The sintering temperature was the second most significant factor, contributing 22.01% (Seq SS = 1.7620), as it controls grain growth and diffusion processes that further improve hardness. Sintering time, with a minimal contribution of 2.14% (Seq SS = 0.1710), has a negligible impact on microhardness compared to the other factors. The residual error accounts for only 2.86% of the variation, demonstrating the robustness of the model. The model’s fit was supported by high R-squared (R2 = 97.14%) and adjusted R-squared values (R2(adj) = 88.54%), indicating that the selected factors explain most of the observed variation. For compressive strength, a similar trend was observed, with compaction pressure being the most influential factor, contributing 68.38% (Seq SS = 0.82748). This highlights its critical role in enhancing the load-bearing capacity of the material. Sintering temperature follows with a contribution of 23.38% (Seq SS = 0.28296), as it reduces porosity and strengthens the composite. Sintering time contributes only 4.18% (Seq SS = 0.05064), indicating its relatively minor influence. The residual error accounts for 4.05% of the variation, reflecting the reliability of the model. The R-squared value (R2 = 95.95%) and adjusted R-squared value (R2(adj) = 83.81%) further confirm the model’s accuracy in capturing the relationship between the factors and compressive strength. In both cases, the F-values indicate the significance of the factors. Compaction pressure had the highest F-values (25.48 for microhardness and 16.90 for compressive strength), confirming its dominant influence. However, the p-values suggest statistical significance only for compaction pressure in microhardness (p = 0.038), while the contributions of sintering temperature and time were not statistically significant (p > 0.05). Similarly, for compressive strength, none of the factors are statistically significant at the 5% level (p > 0.05), though compaction pressure approaches significance (p = 0.056). These results emphasize the critical role of compaction pressure while highlighting opportunities to further refine sintering conditions for enhanced material performance.
The graphical interpretation of the results from Table 6 was illustrated in Figure 6 and Figure 7, which presents the main effect plots for the signal-to-noise (SN) ratios of microhardness and compressive strength. The graphs depict the influence of each control factor, i.e., compaction pressure (A), sintering temperature (B), and sintering time (C) on the response variables. In the plots, if the line corresponding to a controlling factor was nearly horizontal, it indicates that the factor had a negligible effect on the response variable. Conversely, a steeply sloping line signifies a significant influence, as the response variable changes considerably with variations in that control factor. Therefore, the steepness of the slopes in the plots enables the identification of the most influential factors. From the analysis, the optimal combination of control factor levels was determined to be A3:B3:C2, corresponding to the highest compaction pressure (350 MPa), the highest sintering temperature (600 °C), and a medium sintering time (60 min). This combination yields the maximum values for both microhardness and compressive strength. The high compaction pressure ensures superior particle bonding and densification, the elevated sintering temperature promotes efficient grain growth and porosity reduction, and the medium sintering time allows sufficient diffusion without causing excessive grain coarsening.
Further analysis of the factors reveals the following: Factor A (compaction pressure) shows that higher levels of this factor contribute to more stable and improved values for both microhardness and compressive strength. This factor plays a significant role in reducing variation and noise in the process, leading to more stable and precise results in both parameters. Factor B (sintering temperature) had a nonlinear impact: the middle level causes variations in both parameters, leading to fluctuations in S/N ratios. However, higher levels of factor B improve the stability of the process, making it more controlled and resulting in better values for both microhardness and compressive strength. This explains the trend observed in the plots—the middle level introduces instability, while higher levels stabilize the results. Factor C (sintering time) shows that the second level was optimal for achieving stable and precise values of both microhardness and compressive strength. At this level, the process was optimized for minimal variation and noise. However, the third level increases noise, which reduces the precision of controlling both parameters, explaining the decrease in the S/N ratio at this level. These insights, derived from the analysis of the main effect plots, confirm that the combination of A3:B3:C2 is indeed the optimal setting, ensuring the highest levels of both microhardness and compressive strength while maintaining process stability and precision.
The experimental testing results for microhardness can be effectively illustrated through the color-coded maps of microhardness (Figure 8a–c). The distinct shades in color-coded maps represent the relationship between microhardness and process parameters of powder metallurgy. Figure 8a highlights the dependence of microhardness on compaction pressure and sintering temperature. From the figure, it was evident that an increase in both compaction pressure and sintering temperature leads to an increase in microhardness values. This is because higher compaction pressure results in denser material, while higher sintering temperature encourages better bonding and grain growth, which in turn, improves the overall hardness of the material. The color-coded maps show the distribution of microhardness values: light blue indicates values from 85 HV, while dark blue corresponds to values below 80 HV. The green color shades range from 90 HV (lightest green) to over 105 HV (darkest green). These color gradients allow clear identification of areas where microhardness was higher or lower, providing useful insights into how varying process parameters affect the material’s hardness. Figure 8b shows the correlation between compaction pressure and sintering time, and Figure 8c focuses on the influence of sintering temperature and sintering time. The data demonstrate that increasing both compaction pressure and sintering temperature leads to a rise in microhardness values, which suggests that these factors contribute positively to the material’s overall hardness. Furthermore, the analysis of compaction pressure and sintering time (Figure 8b) indicates that microhardness peaks when sintering time was extended from approximately 55 to 70 min, at higher compaction pressures. This was due to the fact that extending sintering time allows more time for diffusion and bonding between particles, which enhances microhardness, but excessive time may result in grain coarsening, thus reducing the hardness. The color coding in Figure 8 helps to identify regions with varying levels of microhardness. The lowest values were marked in dark blue, providing a clear visual indication of areas that exhibit reduced hardness. This was particularly useful for visualizing the areas where the process parameters were not optimized, and where adjustments were necessary to achieve the desired performance characteristics. These insights were critical for understanding how process variables influence the material’s mechanical properties, guiding the optimization of sintering parameters to achieve desired performance characteristics. Similarly, the experimental testing results for compressive strength can be effectively illustrated through the color-coded maps of microhardness (Figure 9a–c). The distinct shades in color-coded maps represent the relationship between microhardness and process parameters of powder metallurgy. As with microhardness, the color-coded maps for compressive strength clearly display the influence of the process parameters on the material’s strength. The lowest compressive strength values were marked in shades of dark blue, ranging from 410 MPa (lightest blue) to values below 390 MPa (darkest blue), while the highest compressive strength values were indicated in green, with the lightest green shade representing 420 MPa and the darkest green representing up to 450 MPa. Figure 9a highlights the dependence of compressive strength on compaction pressure and sintering temperature. Figure 9b shows the correlation between compaction pressure and sintering time, and Figure 9c focuses on the influence of sintering temperature and sintering time on the compressive strength of the composite. From these figures, it was apparent that compressive strength increases significantly with higher sintering temperatures (around 600 °C) and sintering times between 55 min and 65 min. This suggests a strong interplay between these parameters improving both microhardness and compressive strength. In addition, these maps were a valuable tool for the further optimization of the sintering process. By identifying the exact ranges where maximum compressive strength was achieved, process parameters can be fine-tuned for the most efficient production of high-performance materials. The figures also illustrate how varying sintering time and temperature impact the material’s structure, with longer sintering times enhancing densification and the strength of the material, but also potentially leading to undesirable grain growth if overextended. To further improve the credibility of the regression models, future work will focus on validating these models through cross-validation techniques and/or additional experimental data. This validation step was critical to ensure that the models’ predictions were reliable and generalizable to other processing conditions.

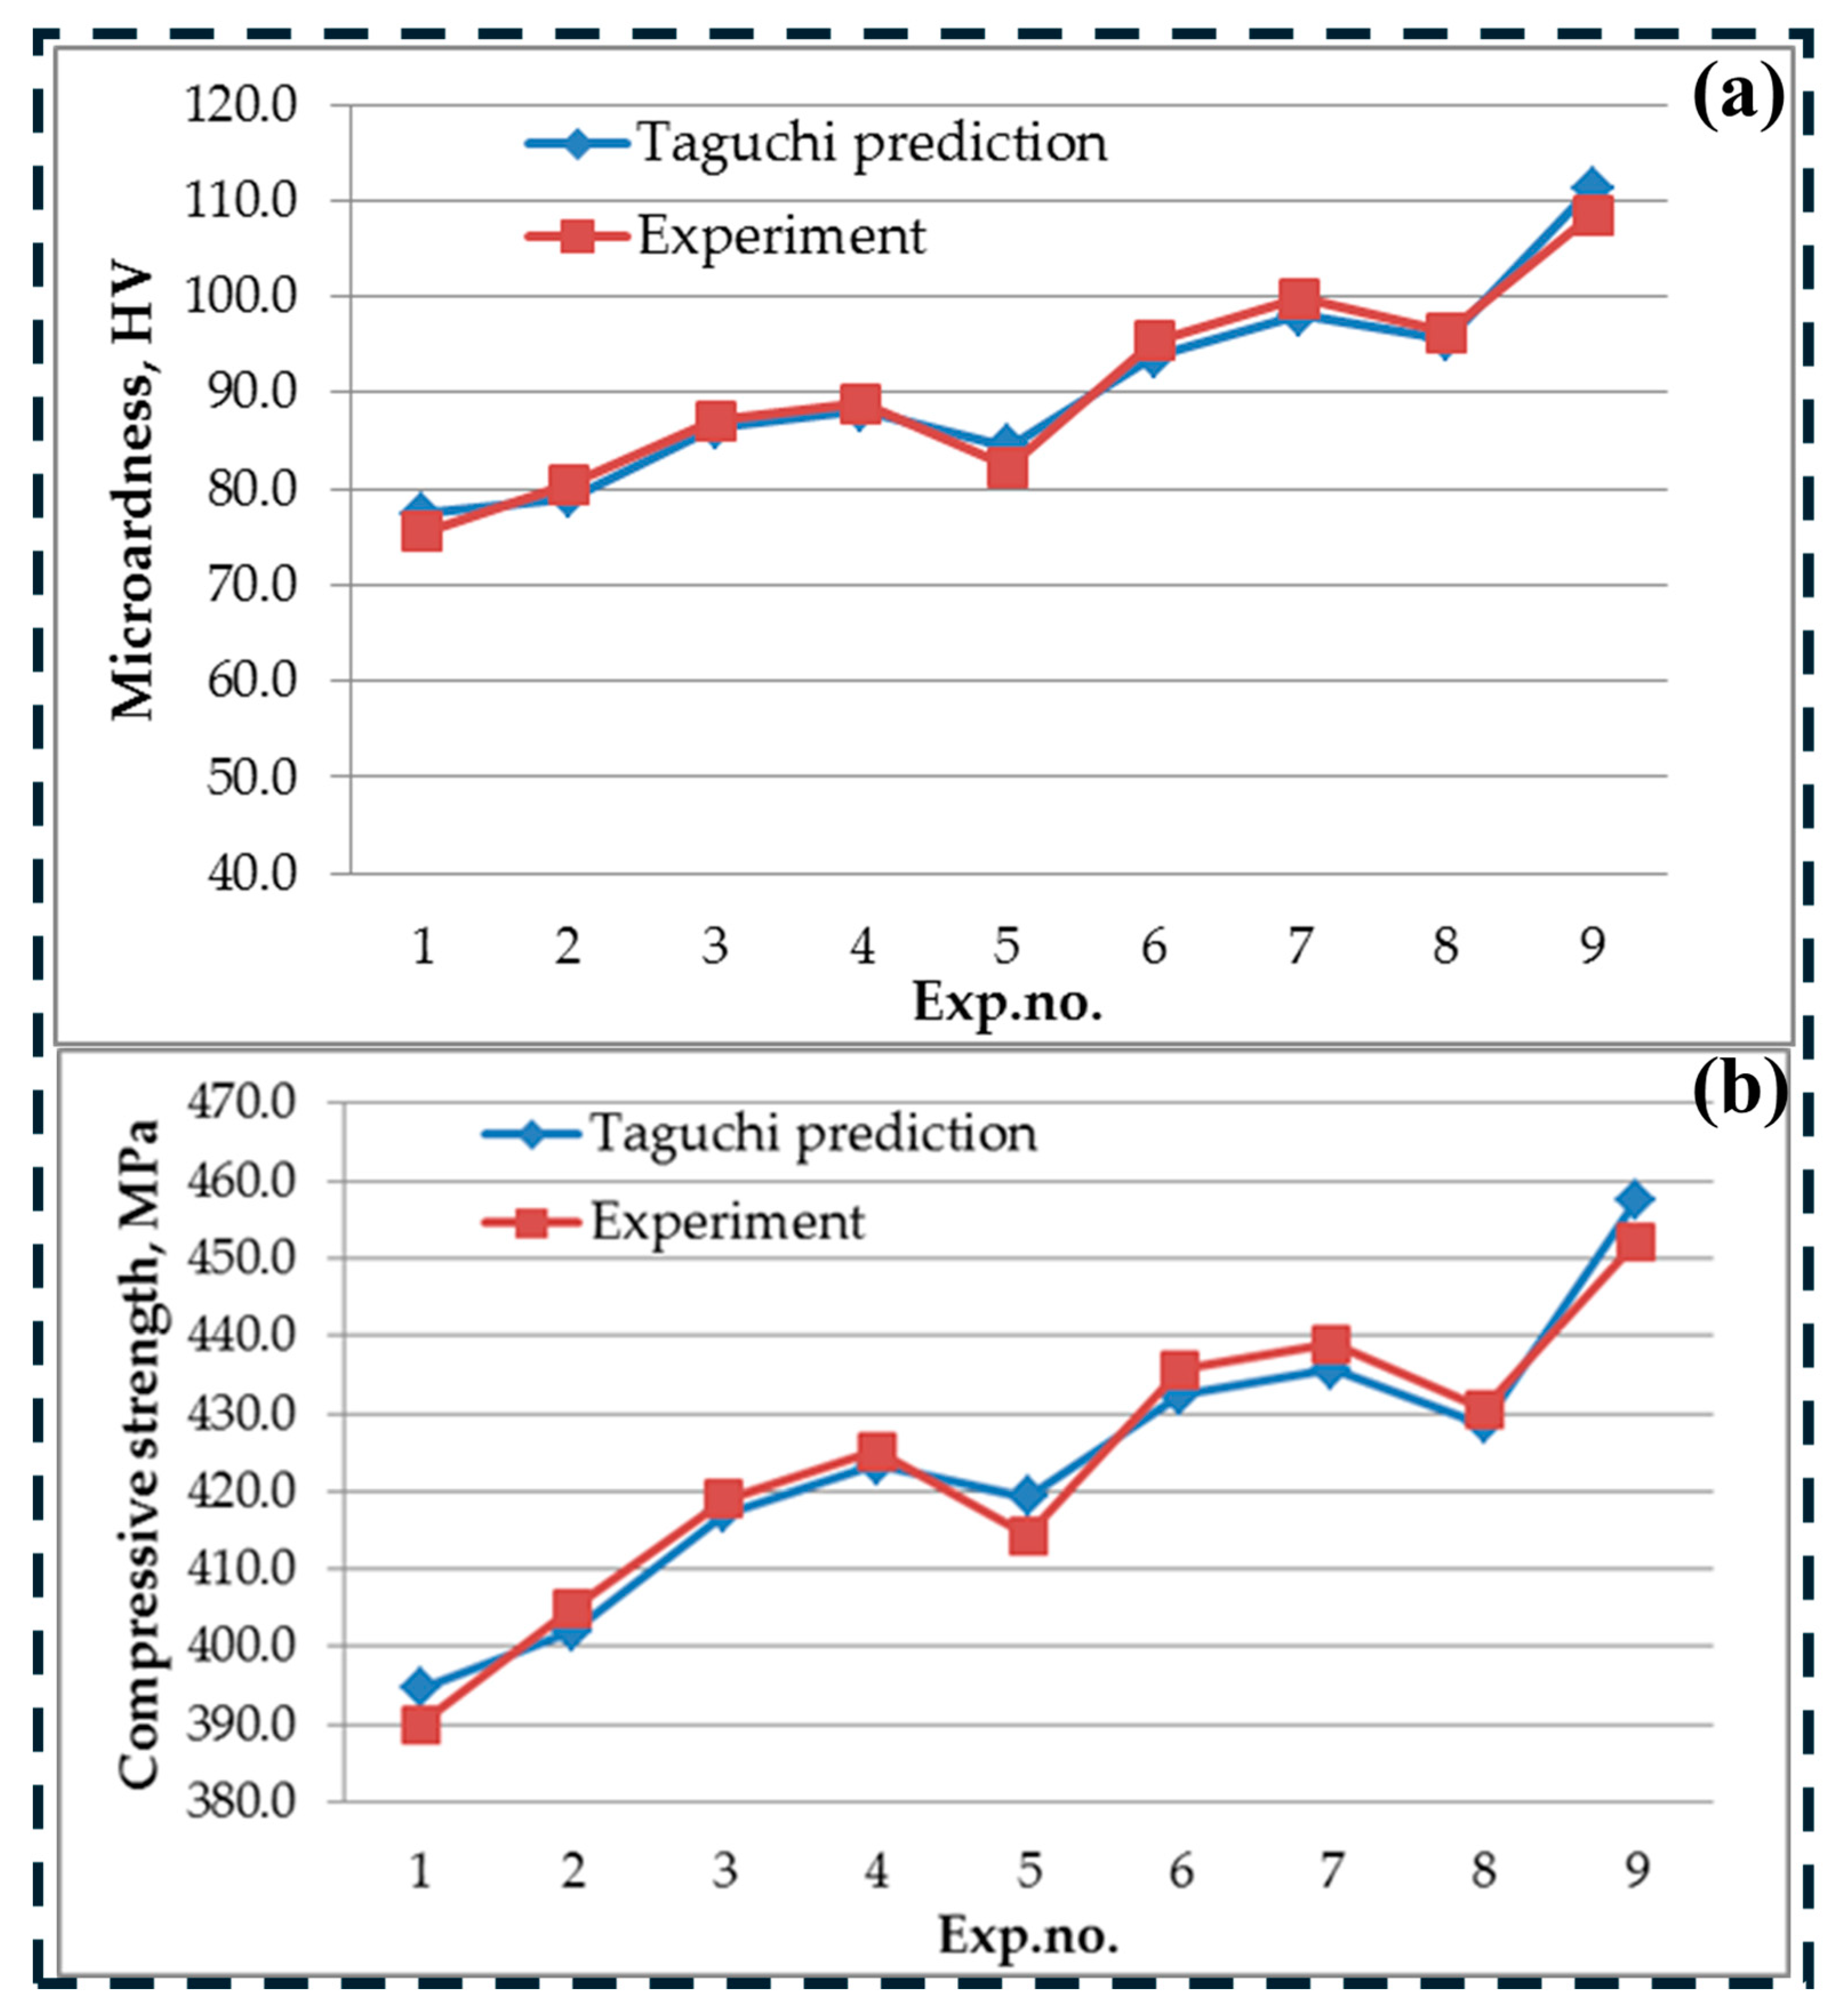
3.2. Validation of Results

In order to evaluate the reliability of the predictions obtained by the Taguchi analysis, the relative error between the experimental and predicted values was calculated. The results show that the deviations remain within acceptable limits, with the maximum relative error for microhardness and compressive strength being 2.51% and 6.01%, while the average relative error was 1.69% and 3.73%, respectively. These findings indicate a high degree of accuracy and reliability of the model, which provides a basic validation of the proposed approach within a limited dataset. Additionally, in order to illustrate and visualize the predicted and experimental values, Figure 10a,b shows a comparative analysis between the experimental and predicted results for both output quantities. The outcomes show that the predicted values were very close to the experimental results, with minimal deviations. This strong correlation between experimental and predicted values confirms the validity of the applied model. Moreover, considering that the analysis and experiments were conducted with a minimal set of only nine experiments, it can be further concluded that the prediction accuracy was remarkably high despite the limited dataset.

4. Conclusions

The study successfully optimized the processing parameters for AZ31/1.75 wt.% GNP composites using the Taguchi method, identifying compaction pressure as the most influential factor on both microhardness and compressive strength, followed by sintering temperature and sintering time. The optimal combination (350 MPa, 600 °C, 60 min) significantly improved mechanical properties, yielding a microhardness of 108.5 Hv and compressive strength of 452.2 MPa. Low porosity (%) and reduced grain size are accountable for an improvement in the mechanical properties of the composite compared to the base alloy. Regression models demonstrated strong predictive accuracy, reinforcing the reliability of the optimization process. The findings of this study have important implications for the development of lightweight, high-strength magnesium-based composites, particularly for aerospace and automotive applications. By optimizing processing parameters, this research provides a cost-effective approach to enhancing material performance. However, one limitation of this study was the lack of experimental validation for the regression models beyond the training dataset. Future work will focus on cross-validation techniques and additional experiments to confirm model accuracy across different processing conditions. Further investigations into the long-term mechanical stability and wear resistance of these composites will also be valuable for practical applications. By addressing these limitations and expanding the scope of analysis, future studies can further refine the optimization process and broaden the applicability of AZ31/GNP composites in advanced engineering applications.

5. Summary

The study identified 350 MPa compaction pressure, 600 °C sintering temperature, and 60 min sintering time as the optimal processing parameters for AZ31/1.75 wt.% GNP composites. These conditions led to significant mechanical improvements, with microhardness reaching 108.5 Hv (compared to 49 Hv for the base AZ31 alloy) and compressive strength increasing to 452.2 MPa (from 358 MPa). Among the parameters, compaction pressure had the highest impact, contributing 72.99% to microhardness variation and 68.38% to compressive strength variation, followed by sintering temperature and sintering time. The microstructural analysis confirmed enhanced densification, reduced porosity, and uniform graphene nanoplatelet dispersion, which contributed to improved mechanical properties. XRD analysis further validated the presence of α-Mg phases and MgO, indicating strong interfacial bonding without adverse reactions. The reliability of the findings was reinforced through statistical validation, with regression models exhibiting R2 values greater than 85%. Additionally, experimental validation showed minimal deviations, with a maximum relative error of ≤2.51% for microhardness and ≤6.01% for compressive strength, confirming the high predictive accuracy of the optimization approach. These findings highlight the effectiveness of parameter optimization in enhancing material performance, making AZ31/GNP composites suitable for lightweight, high-strength applications in the aerospace and automotive industries.

Author Contributions

Conceptualization, S.K.S., L.K.S. and Y.S.; Methodology, S.K.S., L.I., S.G., L.K.S. and Y.S.; Validation, S.M. and B.S.; Investigation, S.K.S.; Writing—original draft, S.K.S.; Writing—review and editing, S.K.S., L.I., S.G., S.M. and B.S.; Funding acquisition, L.I., S.G., S.M. and B.S. All authors have read and agreed to the published version of the manuscript.

Funding

This research received no external funding.

Institutional Review Board Statement

Not applicable.

Informed Consent Statement

Not applicable.

Data Availability Statement

The original contributions presented in this study are included in the article.

Conflicts of Interest

The authors declare no conflict of interest.

References

  1. Anbuchezhiyan, G.; Mubarak, N.M.; Karri, R.R.; Khalid, M. A synergistic effect on enriching the Mg–Al–Zn alloy-based hybrid composite properties. Sci. Rep. 2022, 12, 20053. [Google Scholar] [CrossRef] [PubMed]
  2. Bahmani, A.; Lotfpour, M.; Taghizadeh, M.; Kim, W.J. Corrosion behavior of severely plastically deformed Mg and Mg alloys. J. Magnes. Alloys 2022, 10, 2607–2648. [Google Scholar] [CrossRef]
  3. Abazari, S.; Shamsipur, A.; Bakhsheshi-Rad, H.R.; Ismail, A.F.; Sharif, S.; Razzaghi, M.; Ramakrishna, S.; Berto, F. Carbon nanotubes (CNTs)-reinforced magnesium-based matrix composites: A comprehensive review. Materials 2020, 13, 4421. [Google Scholar] [CrossRef]
  4. Bhoi, N.K.; Singh, H.; Pratap, S. Developments in the aluminum metal matrix composites reinforced by micro/nano particles–A review. J. Compos. Mater. 2020, 54, 813–833. [Google Scholar] [CrossRef]
  5. Krstic, J.; Jovanovic, J.; Gajevic, S.; Miladinovic, S.; Vaxevanidis, N.; Kiss, I.; Stojanovic, B. Application of Metal Matrix Nanocomposites in Engineering. Adv. Eng. Lett. 2024, 3, 180–190. [Google Scholar] [CrossRef]
  6. Meher, A.; Mahapatra, M.M.; Samal, P.; Vundavilli, P.R. A review on manufacturability of magnesium matrix composites: Processing, tribology, joining, and machining. CIRP J. Manuf. Sci. Technol. 2022, 39, 134–158. [Google Scholar] [CrossRef]
  7. Eacherath, S.; Murugesan, S. Synthesis and characterization of magnesium-based hybrid composites—A review. Int. J. Mater. Res. 2018, 109, 661–672. [Google Scholar] [CrossRef]
  8. Sharma, S.K.; Saxena, K.K.; Salem, K.H.; Mohammed, K.A.; Singh, R.; Prakash, C. Effects of various fabrication techniques on the mechanical characteristics of metal matrix composites: A review. Adv. Mater. Process. Technol. 2024, 10, 277–294. [Google Scholar] [CrossRef]
  9. Fang, Z.Z.; Paramore, J.D.; Sun, P.; Chandran, K.R.; Zhang, Y.; Xia, Y.; Cao, F.; Koopman, M.; Free, M. Powder metallurgy of titanium–past, present, and future. Int. Mater. Rev. 2018, 63, 407–459. [Google Scholar] [CrossRef]
  10. Attia, U.M. Cold-isostatic pressing of metal powders: A review of the technology and recent developments. Crit. Rev. Solid State Mater. Sci. 2021, 46, 587–610. [Google Scholar] [CrossRef]
  11. Wu, L.; Wu, R.; Hou, L.; Zhang, J.; Sun, J.; Zhang, M. Microstructure and mechanical properties of CNT-reinforced AZ31 matrix composites prepared using hot-press sintering. J. Mater. Eng. Perform. 2017, 26, 5495–5500. [Google Scholar] [CrossRef]
  12. Kavimani, V.; Soorya Prakash, K.; Thankachan, T. Investigation of graphene-reinforced magnesium metal matrix composites processed through a solvent-based powder metallurgy route. Bull. Mater. Sci. 2019, 42, 1–9. [Google Scholar] [CrossRef]
  13. Raja, K.S.; Srikanth, S.; Arif, S.; ArunKumar, T.; Hemanandh, J.; Ganesan, S.; Kumar, J.S. Mechanical and Micro-structural behaviour of graphene coated with magnesium alloy. Mater. Today Proc. 2021, 44, 3589–3594. [Google Scholar] [CrossRef]
  14. Rashad, M.; Pan, F.; Asif, M.; Li, L. Enhanced ductility of Mg–3Al–1Zn alloy reinforced with short length multi-walled carbon nanotubes using a powder metallurgy method. Prog. Nat. Sci. Mater. Int. 2015, 25, 276–281. [Google Scholar] [CrossRef]
  15. Jayakumar, J.; Raghunath, B.K.; Rao, T.H. Investigation on fracture mechanisms in Mg alloy AZ31 nano composites reinforced with multi wall carbon nano tubes. Int. J. Innov. Res. Sci. Eng. Technol. 2013, 2, 4753–4758. [Google Scholar]
  16. Zhou, M.; Qu, X.; Ren, L.; Fan, L.; Zhang, Y.; Guo, Y.; Quan, G.; Tang, Q.; Liu, B.; Sun, H. The effects of carbon nanotubes on the mechanical and wear properties of AZ31 alloy. Materials 2017, 10, 1385. [Google Scholar] [CrossRef]
  17. Zhang, B.T.; Zheng, X.; Li, H.F.; Lin, J.M. Application of carbon-based nanomaterials in sample preparation: A review. Anal. Chim. Acta 2013, 784, 1–17. [Google Scholar] [CrossRef] [PubMed]
  18. Sadeghi, B.; Shamanian, M.; Cavaliere, P.; Ashrafizadeh, F. Effect of processing parameters on the microstructural and mechanical properties of aluminum–carbon nanotube composites produced by spark plasma sintering. Int. J. Mater. Res. 2018, 109, 900–909. [Google Scholar] [CrossRef]
  19. Fang, Z.Z.; Wang, H. Densification and grain growth during sintering of nanosized particles. Int. Mater. Rev. 2008, 53, 326–352. [Google Scholar] [CrossRef]
  20. Barrionuevo, G.O.; Ramos-Grez, J.A.; Sánchez-Sánchez, X.; Zapata-Hidalgo, D.; Mullo, J.L.; Puma-Araujo, S.D. Influence of the processing parameters on the microstructure and mechanical properties of 316L stainless steel fabricated by laser powder bed fusion. J. Manuf. Mater. Process. 2024, 8, 35. [Google Scholar] [CrossRef]
  21. Kumar, N.; Soren, S.; Prasad, R.; Singh, Y.; Nautiyal, H.; Sharma, A.; Tiang, S.S.; Lim, W.H. Optimization of sintering process parameters by taguchi method for developing Al-CNT-Reinforced powder composites. Crystals 2023, 13, 1352. [Google Scholar] [CrossRef]
  22. Sahoo, S.; Jha, B.B.; Mantry, S. Optimization of process parameters of hot consolidated steel matrix composites by taguchi method. JOM 2024, 76, 818–828. [Google Scholar] [CrossRef]
  23. Calaph, Y.C.; Shanawaz, A.M.; SankarGanesh, P.S.P.; Kavitha, S.; Gnanakumar, N.; Arunprasath, K. Optimization study of hybrid aluminium metal matrix composite using proposed Taguchi method. Interactions 2024, 245, 95. [Google Scholar] [CrossRef]
  24. Tahir, N.A.M.; Abdollah, M.F.B.; Tamaldin, N.; Amiruddin, H.; Mohamad Zin, M.R.B. A brief review on the wear mechanisms and interfaces of carbon based materials. Compos. Interfaces 2018, 25, 491–513. [Google Scholar] [CrossRef]
  25. Wei, L.K.; Abd Rahim, S.Z.; Al Bakri Abdullah, M.M.; Yin, A.T.M.; Ghazali, M.F.; Omar, M.F.; Nemeș, O.; Sandu, A.V.; Vizureanu, P.; Abdellah, A.E.H. Producing metal powder from machining chips using ball milling process: A review. Materials 2023, 16, 4635. [Google Scholar] [CrossRef]
  26. Zhang, X.; Wang, Y.; Chen, T.; Xu, H.; Ma, J. Achieving a heterogeneous lamella-structured aluminum alloy with excellent synergy of strength and ductility by powder thixoforming. Mater. Sci. Eng. A 2022, 838, 142781. [Google Scholar] [CrossRef]
  27. ASTM E9-09; Standard Test Methods of Compression Testing of Metallic Materials at Room Temperature. ASTM International: West Conshohocken, PA, USA, 2018.
  28. ASTM E384-08; Standard Test Method for Microindentation Hardness of Materials. ASTM International: West Conshohocken, PA, USA, 2010.
  29. Mokhtari, S.; Eftekhari Yekta, B.; Marghussian, V.; Ahmadi, P.T. Synthesis and characterization of biodegradable AZ31/calcium phosphate glass composites for orthopedic applications. Adv. Compos. Hybrid Mater. 2020, 3, 390–401. [Google Scholar] [CrossRef]
  30. Veličković, S.; Stojanović, B.; Babić, M.; Vencl, A.; Bobić, I.; Vadaszne Bognar, G.; Vučetić, F. Parametric optimization of the aluminium nanocomposites wear rate. J. Braz. Soc. Mech. Sci. Eng. 2019, 41, 19. [Google Scholar] [CrossRef]
  31. Gajević, S.; Miladinović, S.; Güler, O.; Özkaya, S.; Stojanović, B. Optimization of dry sliding wear in hot-pressed Al/B4C metal matrix composites using Taguchi method and ANN. Materials 2024, 17, 4056. [Google Scholar] [CrossRef]
Figure 1. Schematic representation of the sintering curve during sintering process highlights the sintering time and temperature.
Applsci 15 04181 g001
Figure 2. Processing approach of powder metallurgy used to fabricate the composite.
Applsci 15 04181 g002
Figure 3. Surface characterization of AZ31/1.75wt.%GNP prepared at different compaction pressures, sintering temperatures, and sintering times. The annotation for the symbol used in the microstructures from S1 to S9 is depicted in Table 5.
Applsci 15 04181 g003
Figure 4. The characterization of the synthesized samples: (a) X-ray diffraction (XRD) patterns of samples S1–S9, highlighting the presence of the α-Mg phase and MgO phase. The diffraction peaks confirm the phase composition of the developed materials, with consistent peak intensities across different samples. (b) Grain refinement of the samples compared to AZ31, demonstrating a progressive reduction in grain size from S1 to S9. The decreasing trend in grain size indicates effective grain refinement through the applied processing parameters. (c) The porosity percentage of the synthesized samples, showing a gradual reduction in porosity from S1 to S9. The lower porosity in later samples suggests improved densification and material integrity, which can positively influence mechanical properties.
Applsci 15 04181 g004
Figure 5. (a) Compressive strength and (b) microhardness of composite at different levels with variable process parameters of powder metallurgy approach.
Applsci 15 04181 g005
Figure 6. Main effects plot for the signal-to-noise ratio for microhardness of composite at various process parameters of powder metallurgy. The annotation for A, B, and C is depicted in Table 4.
Applsci 15 04181 g006
Figure 7. Main effects plot for the signal-to-noise ratio for compressive strength of composite at various process parameters of powder metallurgy. The annotation for A, B, and C is depicted in Table 4.
Applsci 15 04181 g007
Figure 8. Dependence of microhardness on (a) compaction pressure and sintering temperature, (b) compaction pressure and sintering time, and (c) sintering temperature and sintering time. The annotation for A, B, and C is depicted in Table 4.
Applsci 15 04181 g008
Figure 9. Dependence of compressive strength on (a) compaction pressure and sintering temperature, (b) compaction pressure and sintering time, and (c) sintering temperature and sintering time. The annotation for A, B, and C is depicted in Table 4.
Applsci 15 04181 g009
Figure 10. Comparison of experimental and predicted values obtained using the Taguchi method for (a) microhardness (HV) and (b) compressive strength (MPa). The graphs illustrate a strong correlation between the experimental data and the Taguchi-predicted values across 9 trials. The minimal deviations observed between the two datasets indicate the high accuracy and reliability of the predictive model.
Applsci 15 04181 g010
Table 1. Composition of AZ31 alloy provided by the manufacturer.
ElementsMgAlZnMnSiCuFeNi
Distribution (%)95.092.801.750.200.100.050.0050.005
Table 2. Properties of AZ31 alloy provided by the manufacturer.
S. NoPropertiesAZ31 Alloy
1.Tensile strength260 MPa
2.Yield strength 200 MPa
3.Purity99%
4.Density1.77 g/cc
5.Elongation15%
6.Brinell hardness49 BHN
Table 3. Properties of graphene nanoparticles provided by the manufacturer.
S. NoPropertiesGraphene Nanoparticles
1.Purity>99%
2.Tensile modulus>1000 GPa
3.Length5–10 microns
4.Thickness5–10 nm
5.Density2.5 g/cc
6.Thermal conductivity2000 watt/m-k
7.Surface area200–240 m2/g
8.Number of layersLayers
Table 4. Control factors and their levels.
Symbol NotationControl FactorUnitLevel 1Level 2Level 3
ACompaction pressureMPa250300350
BSintering temperature°C500550600
CSintering timemin456075
Table 5. Experimental design using L9 orthogonal array.
SampleABC
S125050045
S225055060
S325060075
S430050060
S530055075
S630060045
S735050075
S835055045
S935060060
Table 6. Experimental results using L9 orthogonal array.
SampleMicrohardness (Hv)Compressive Strength (MPa)S/N for
Microhardness (dB)
S/N for Compressive
Strength (dB)
Prediction for
Microhardness (dB)
Prediction for Compressive Strength (dB)
S175.539037.558951.821337.780051.9243
S280.540538.115952.149137.965652.0835
S387.141938.800452.444338.729652.4069
S488.9425.238.978052.571938.907352.5344
S582.3414.338.308052.346338.529052.4493
S695.4435.739.591052.783839.440752.7181
S799.8438.939.982652.847339.832352.7817
S896.3430.539.672552.679539.601852.6420
S9108.5452.240.708653.106640.929653.2097
Table 7. Response table for signal-to-noise ratio (larger-is-better).
MicrohardnessCompressive Strength
LevelABCABC
138.1638.8438.9452.1452.4152.43
238.9638.7039.2752.5752.3952.61
340.1239.7039.0352.8852.7852.55
Delta1.961.000.330.740.390.18
Rank123123
Table 8. Analysis of variance for signal-to-noise ratio (larger-is-better).
Microhardness
SourceDFSeq SSAdj SSAdj MSFp%
A25.84455.84452.9222525.480.03872.99
B21.76201.76200.881017.680.11522.01
C20.17100.17100.085500.750.5732.14
Residual Error20.22930.22930.11467 2.86
Total88.0069 100.00
R-Sq (97.14%), R-Sq(adj) (88.54%)
Compressive Strength
SourceDFSeq SSAdj SSAdj MSFp%
A20.827480.827480.4137416.900.05668.38
B20.282960.282960.141485.780.14823.38
C20.050640.050640.025321.030.4924.18
Residual Error20.048970.048970.02448 4.05
Total81.21005 100.00
R-Sq (95.95%), R-Sq(adj) 83.81%
Disclaimer/Publisher’s Note: The statements, opinions and data contained in all publications are solely those of the individual author(s) and contributor(s) and not of MDPI and/or the editor(s). MDPI and/or the editor(s) disclaim responsibility for any injury to people or property resulting from any ideas, methods, instructions or products referred to in the content.

