
Elastoplastic Constitutive Model for Energy Dissipation and Crack Evolution in Rocks


Abstract
1. Introduction
2. Elastoplastic Representation of Mechanical Properties
2.1. Elastic Parameters
2.2. Yield Function and Plastic Shear Strain
2.3. Potential Function
3. Elastoplastic Representation of Energy Dissipation and Crack Evolution
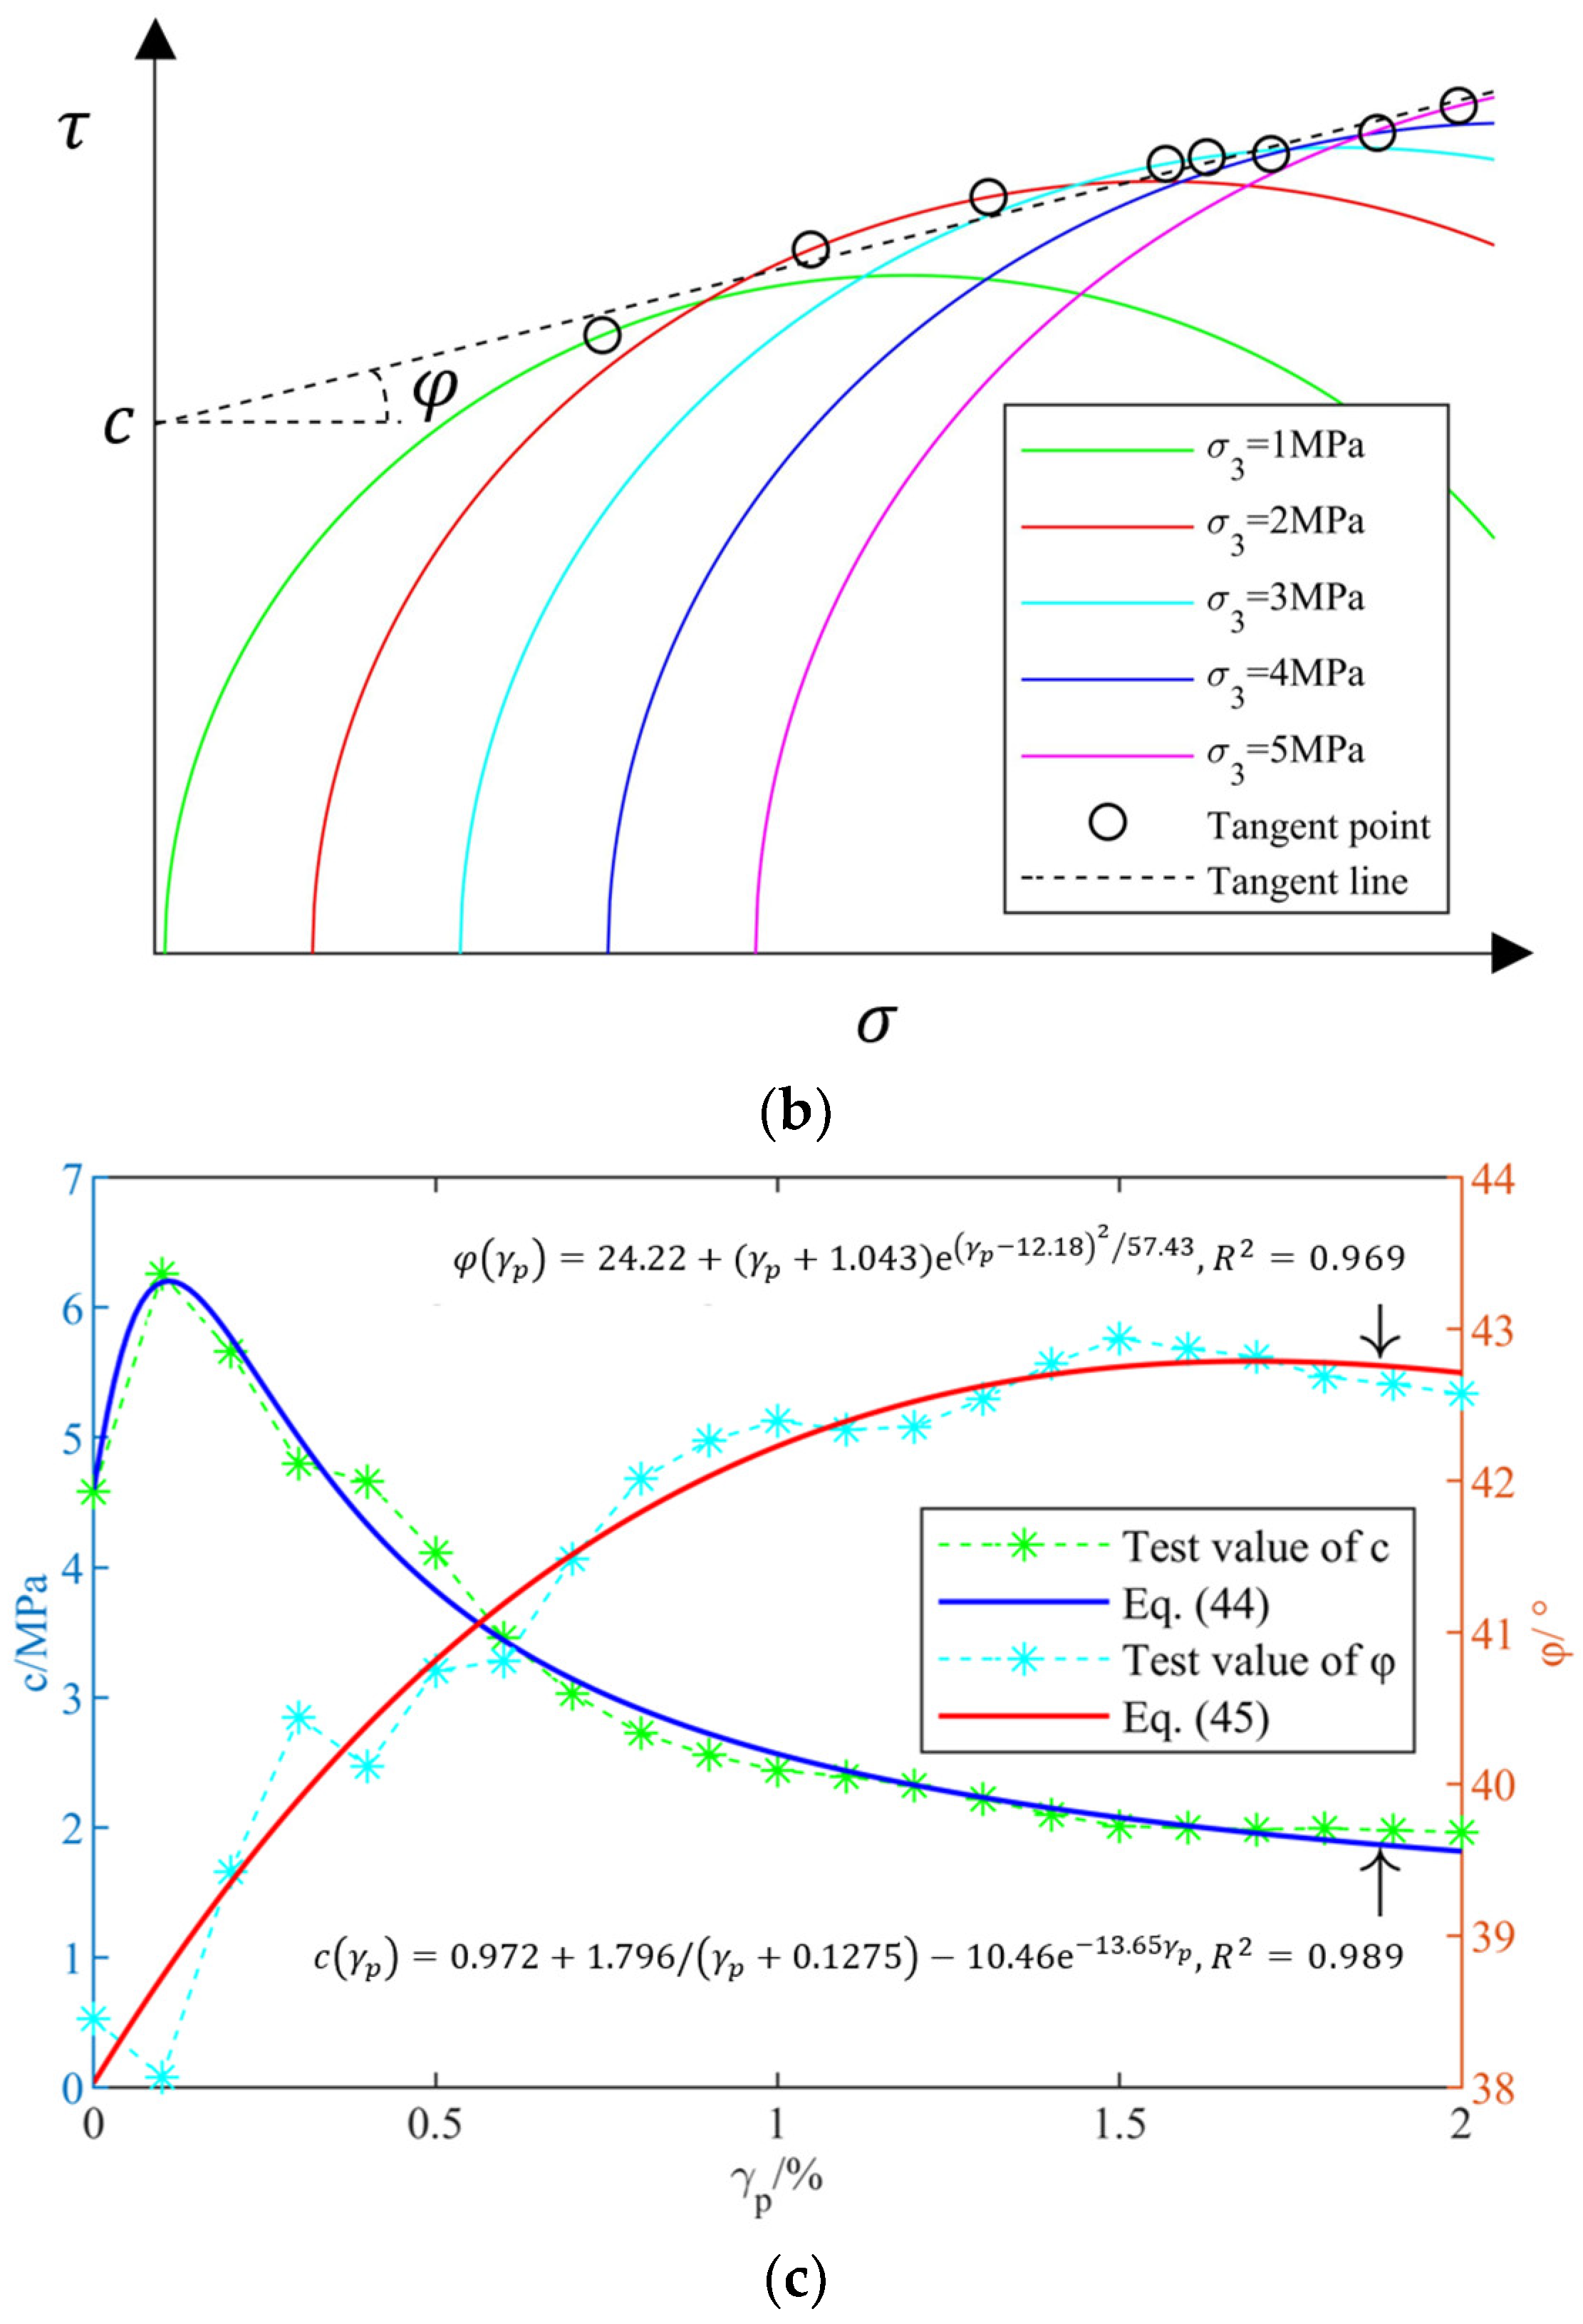
3.1. Energy Dissipation and Strength Parameters
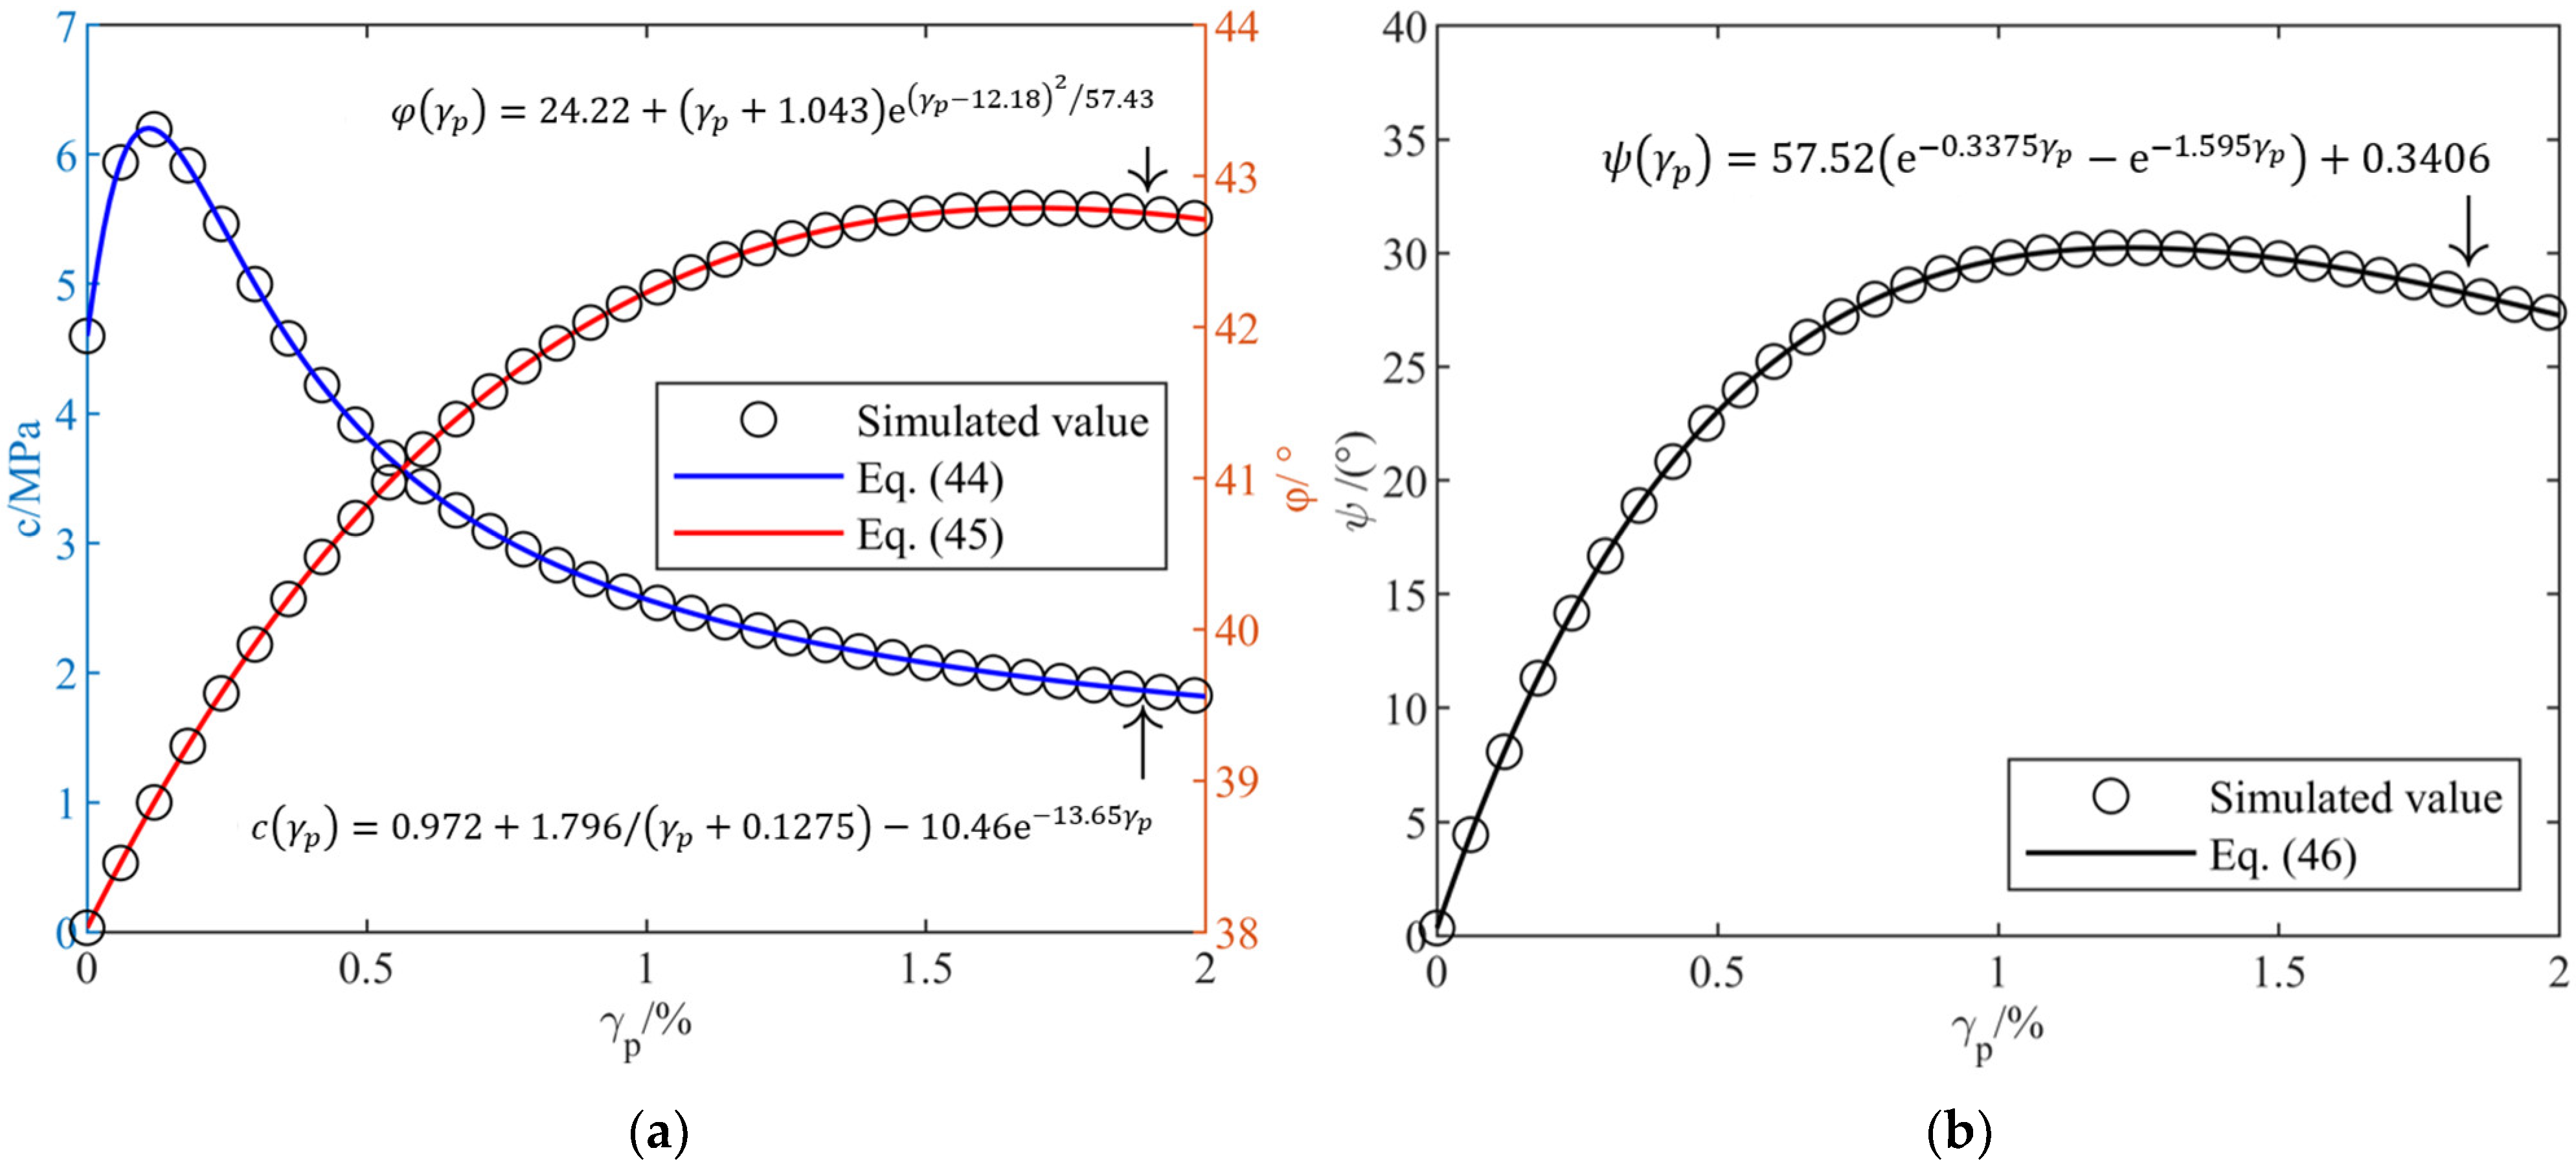
3.2. Crack Evolution and Dilatancy Angle
4. Construction and Algorithm Implementation of the Theoretical Model
5. Validation of the Theoretical Model
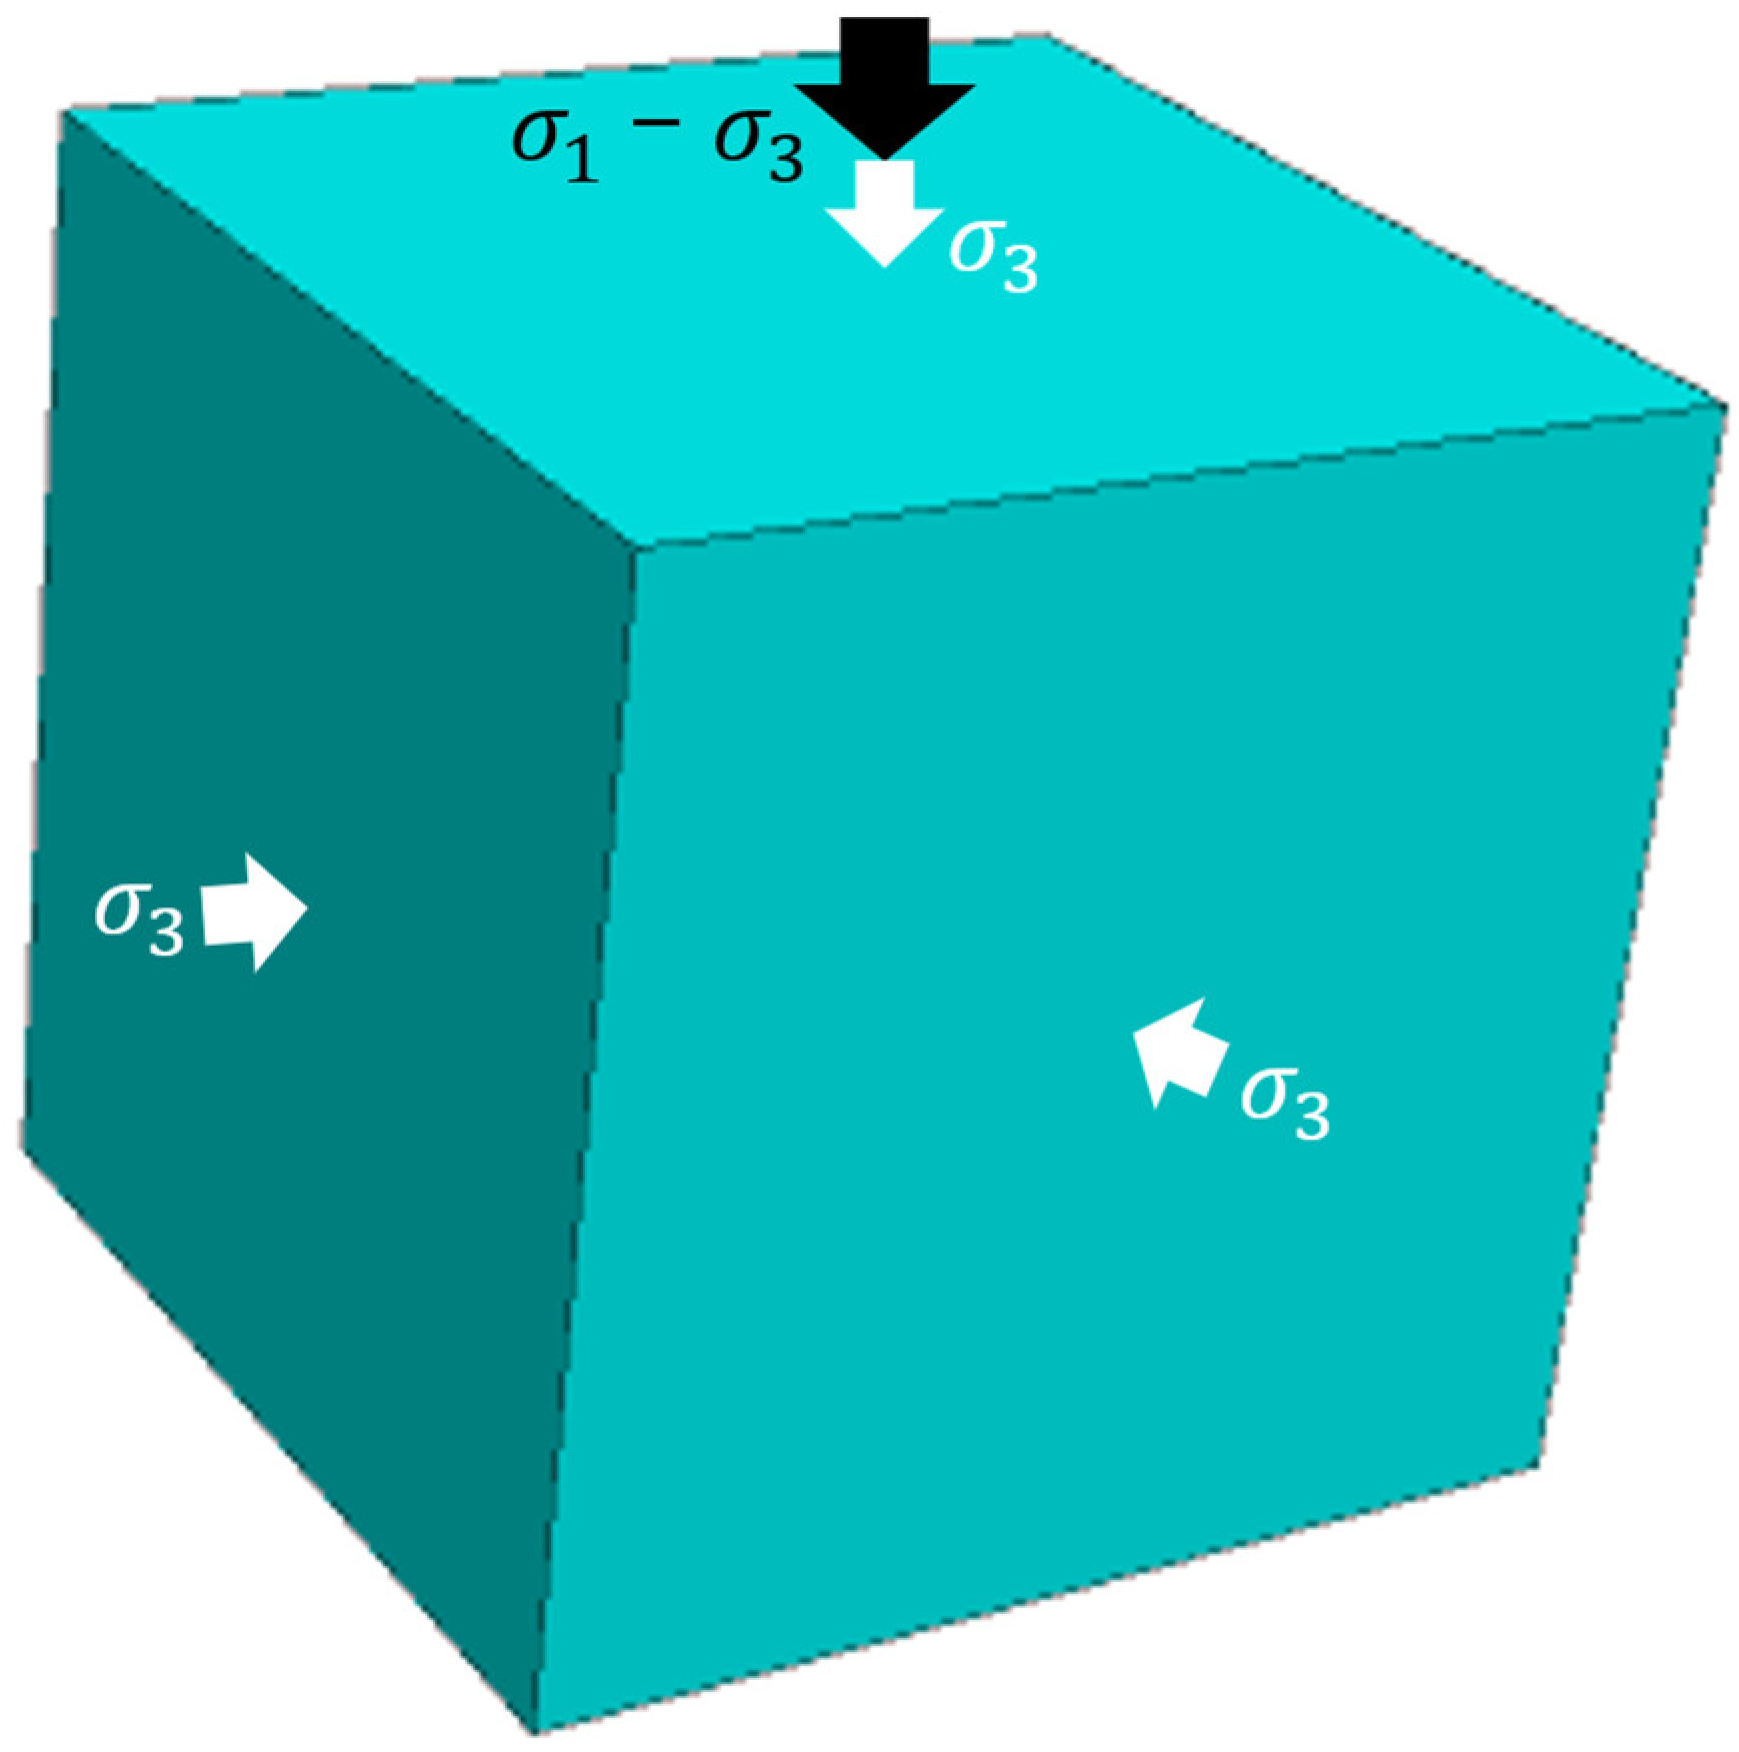
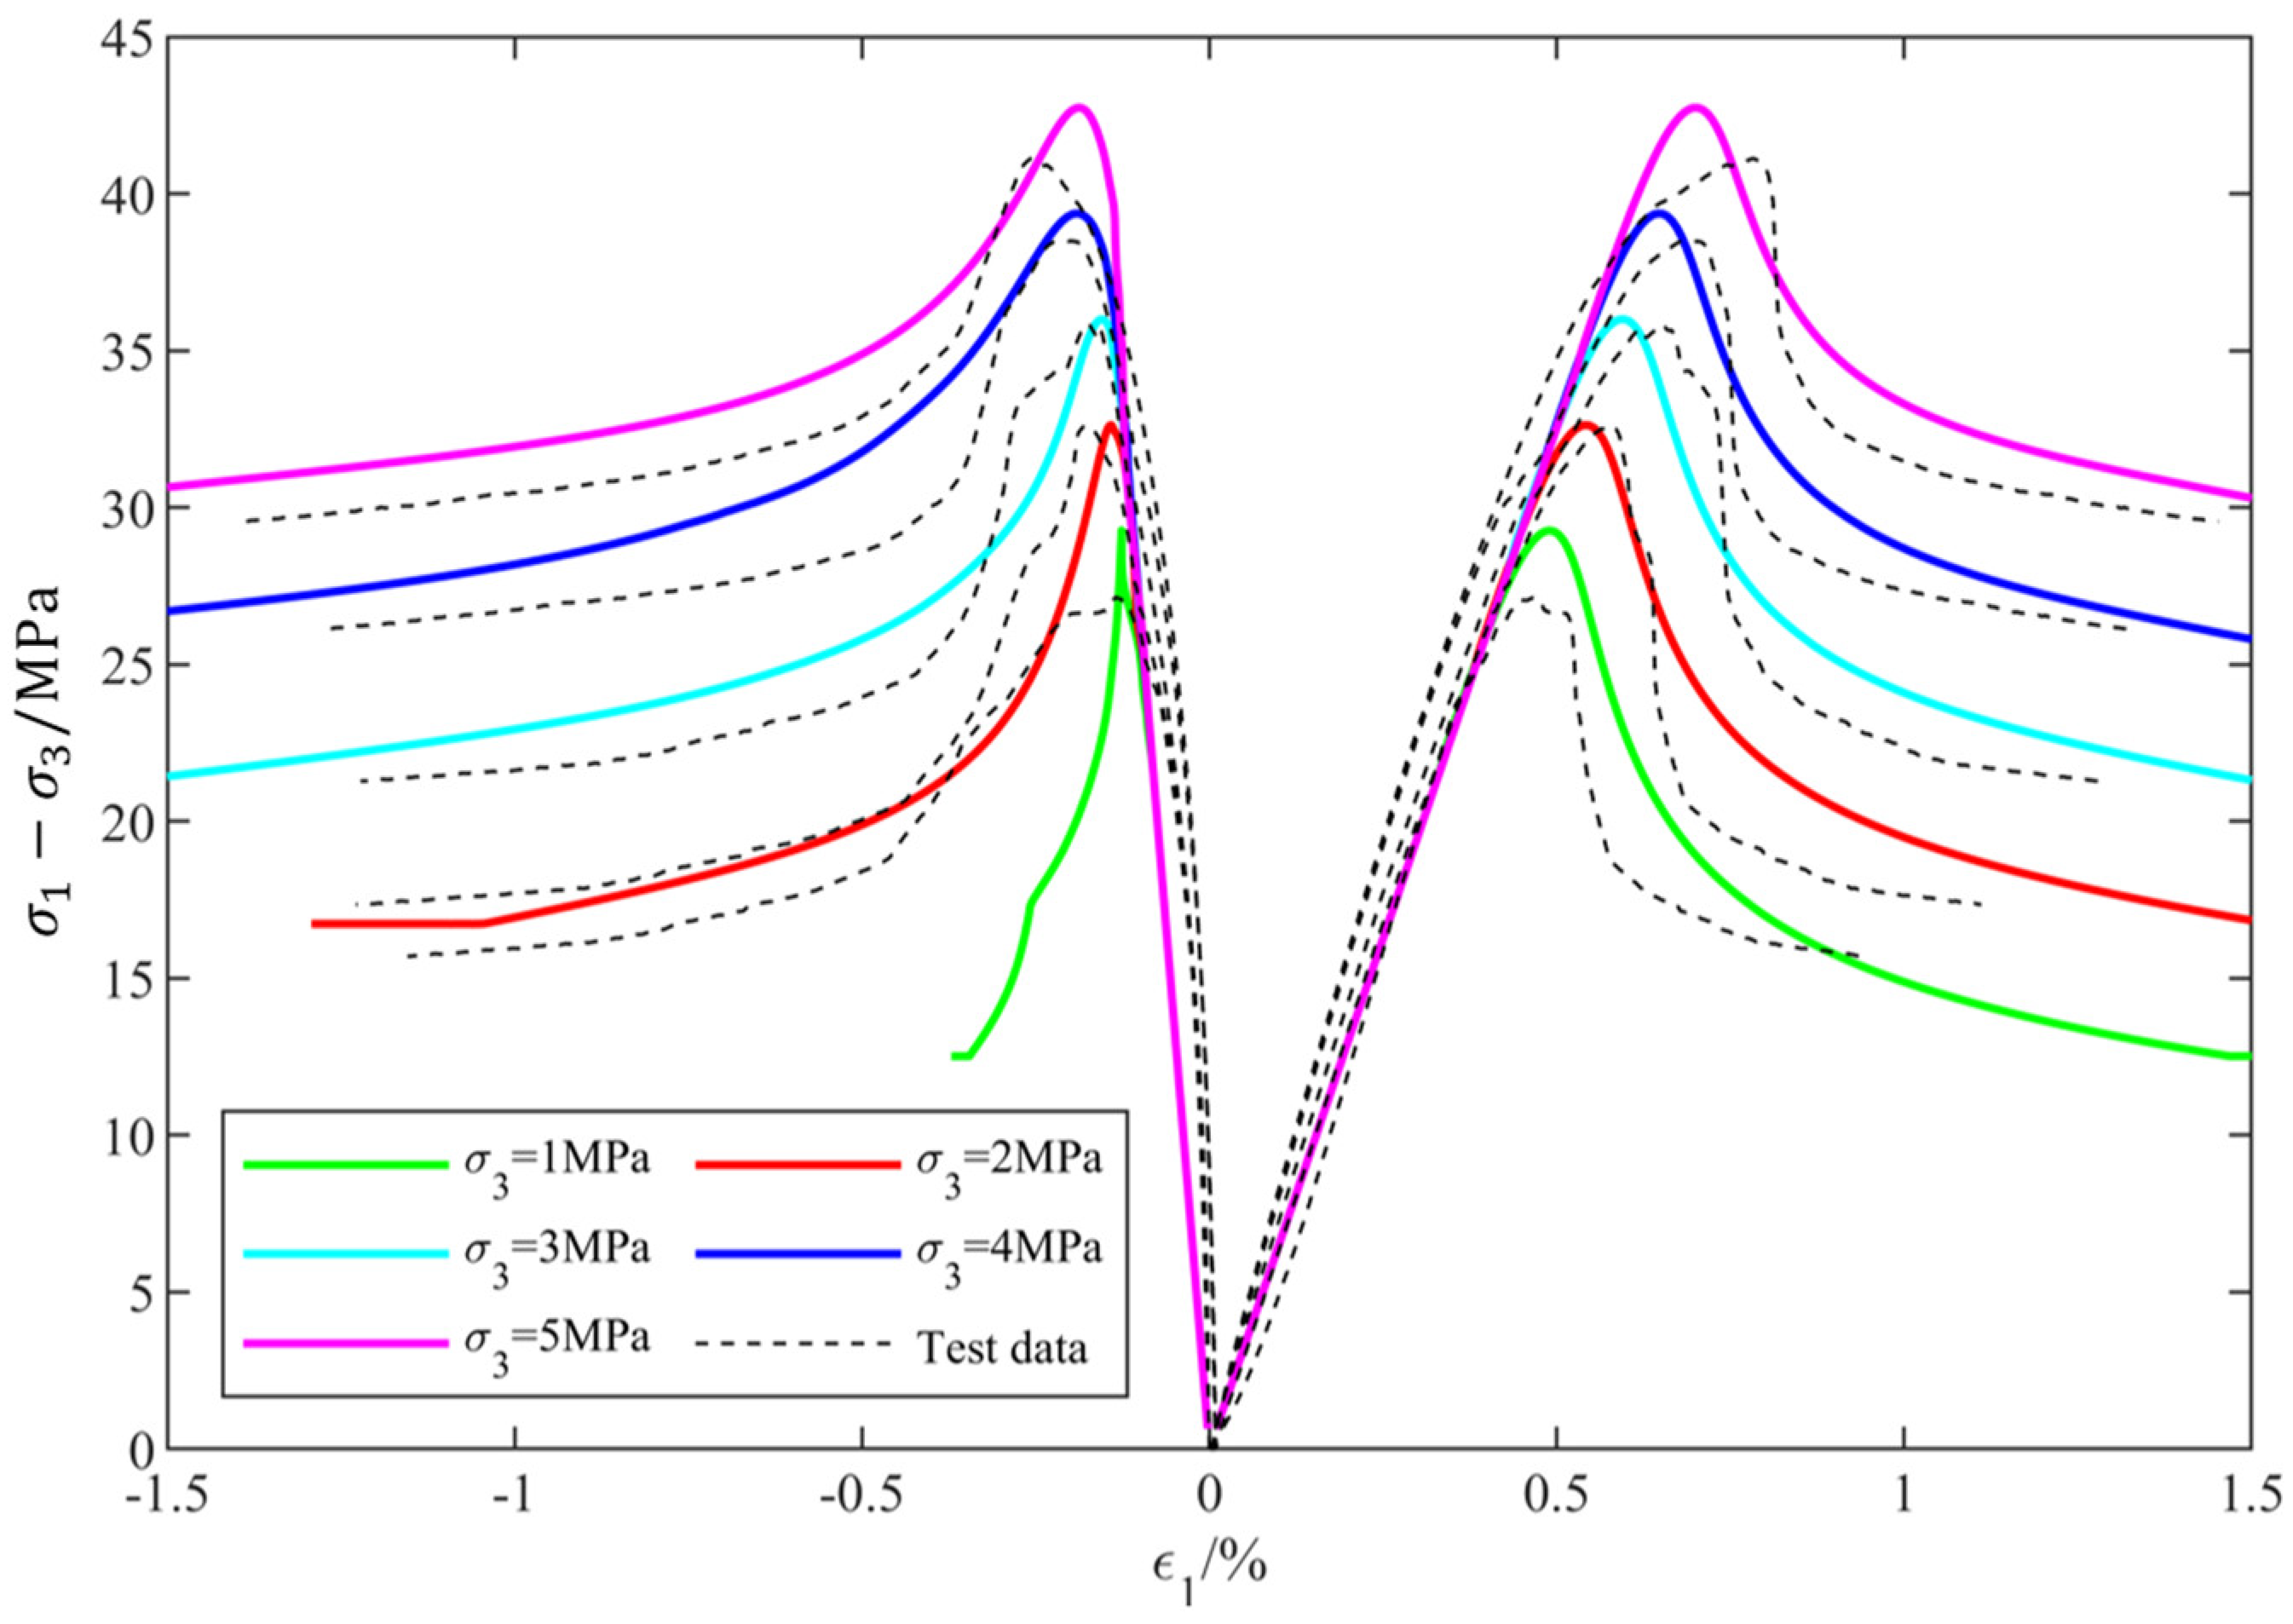
5.1. Conventional Triaxial Compression Test
5.2. Analysis of Elastic Parameters
5.3. Analysis of Strength Parameters
5.4. Analysis of Dilatancy Angle
5.5. Argillaceous Siltstone Model
5.6. Model Development and Numerical Simulation
6. Discussion
7. Conclusions
- (1)
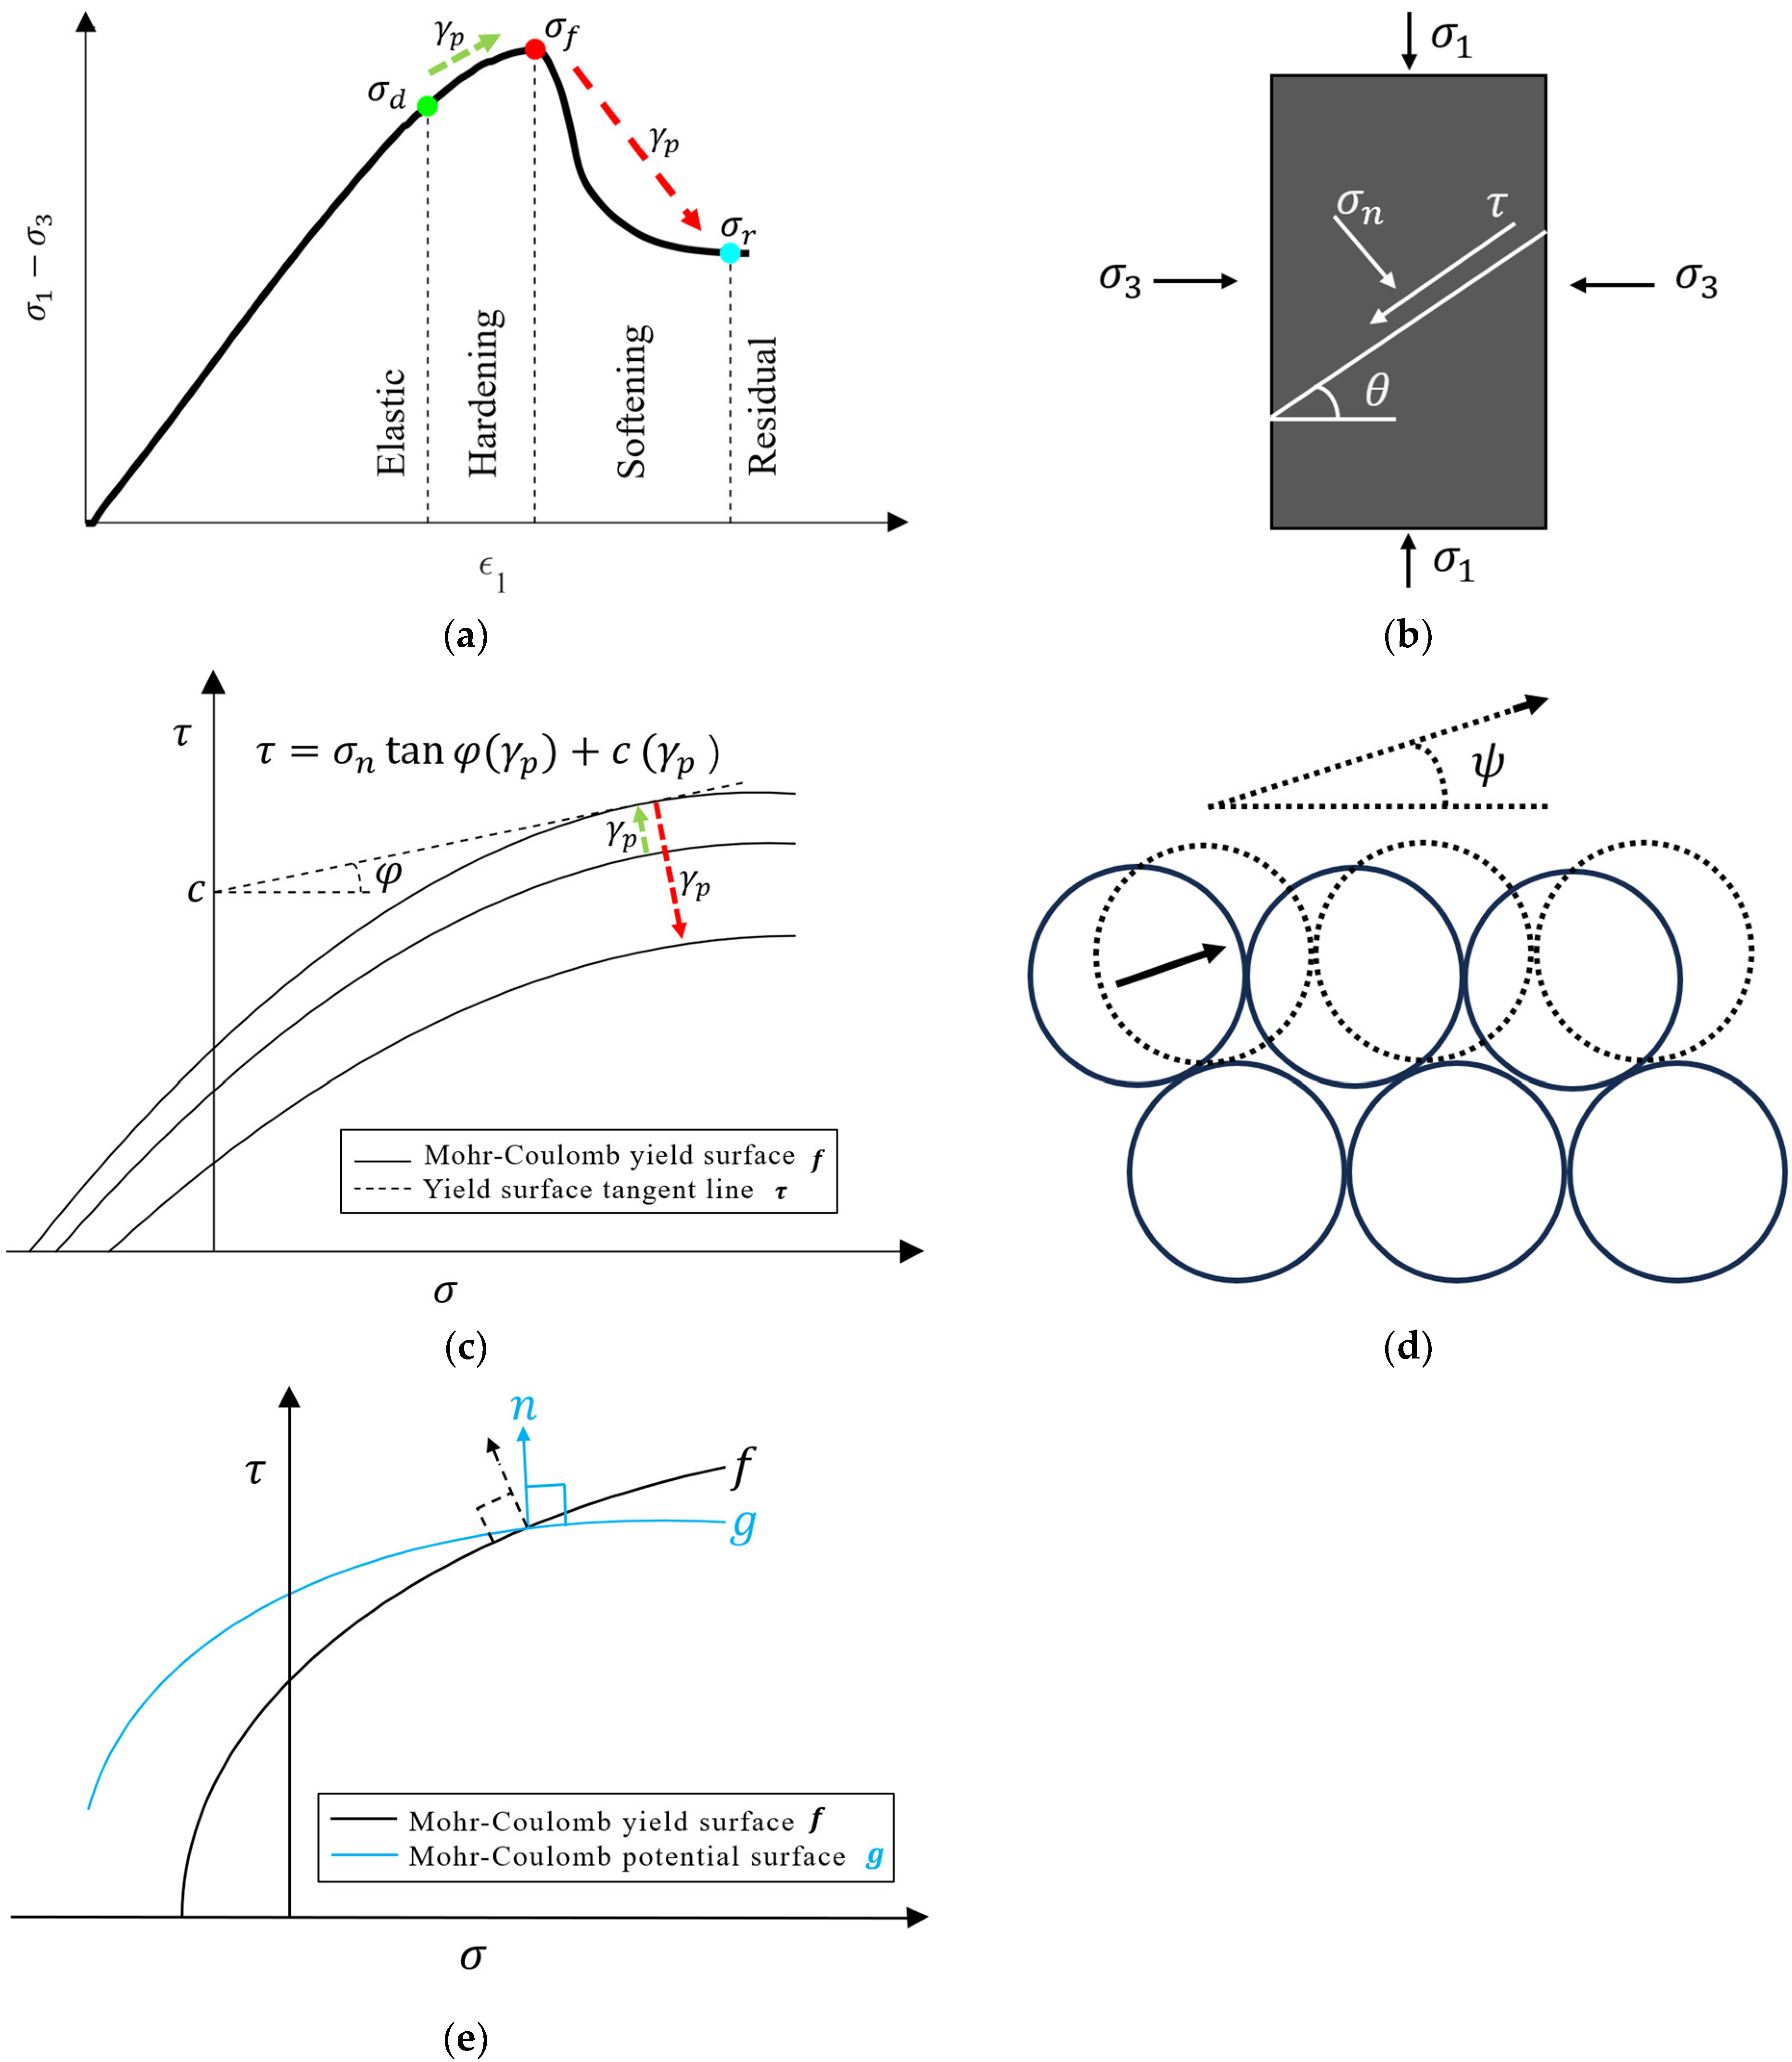
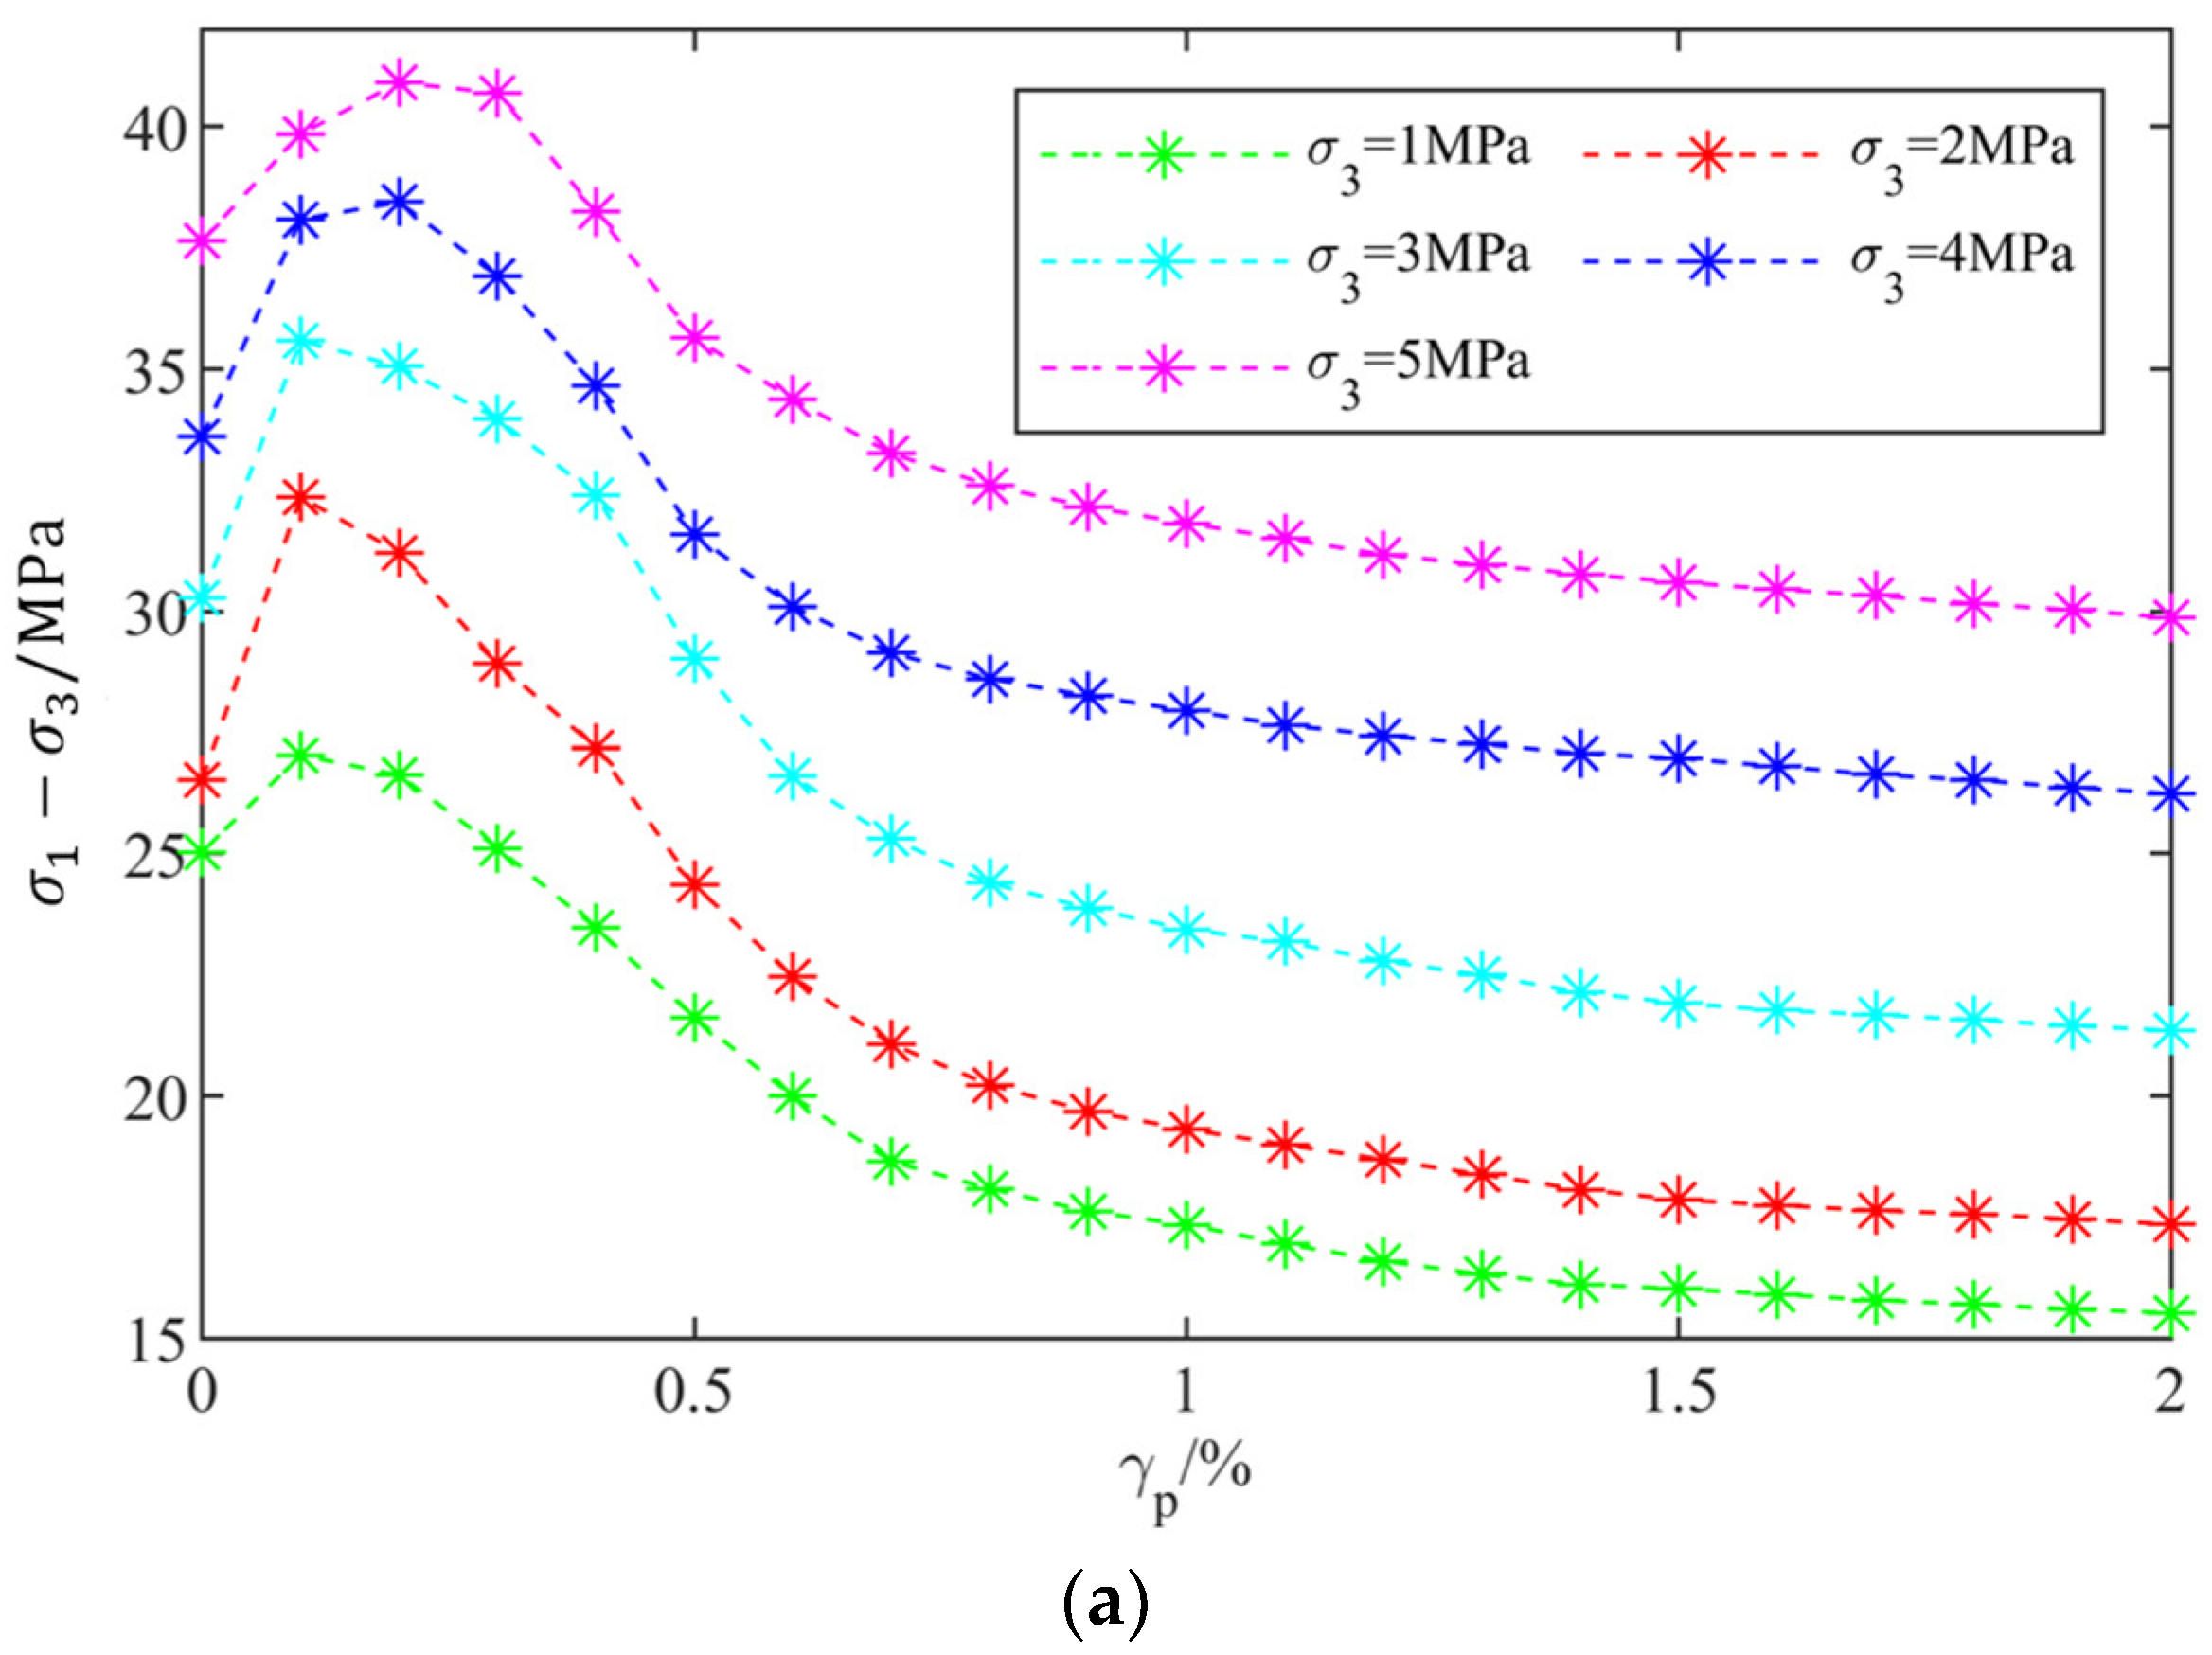
- The elastic parameters can be derived from the secant modulus of the stress–strain curve at the expansion stress and the corresponding Poisson’s ratio. The yield function and potential function can be based on the Mohr–Coulomb strength criterion. The plastic shear strain, as a plastic parameter incorporating deviatoric stress, quantifies the degree of plastic strain and reflects the current stress state. These findings lay a foundational basis for the elastoplastic modeling of rock mechanical properties.
- (2)
- The dissipated energy is defined as the integral of the stress–strain curve minus the elastic strain energy, with energy dissipation quantitatively described in terms of cohesion and internal friction angle related to the stress–strain curve. The crack volumetric strain is equivalent to plastic volumetric strain, and crack evolution can be indirectly quantified using the dilatancy angle associated with increments in plastic volumetric strain. These insights provide a theoretical basis for the elastoplastic modeling of rock energy dissipation and crack evolution.
- (3)
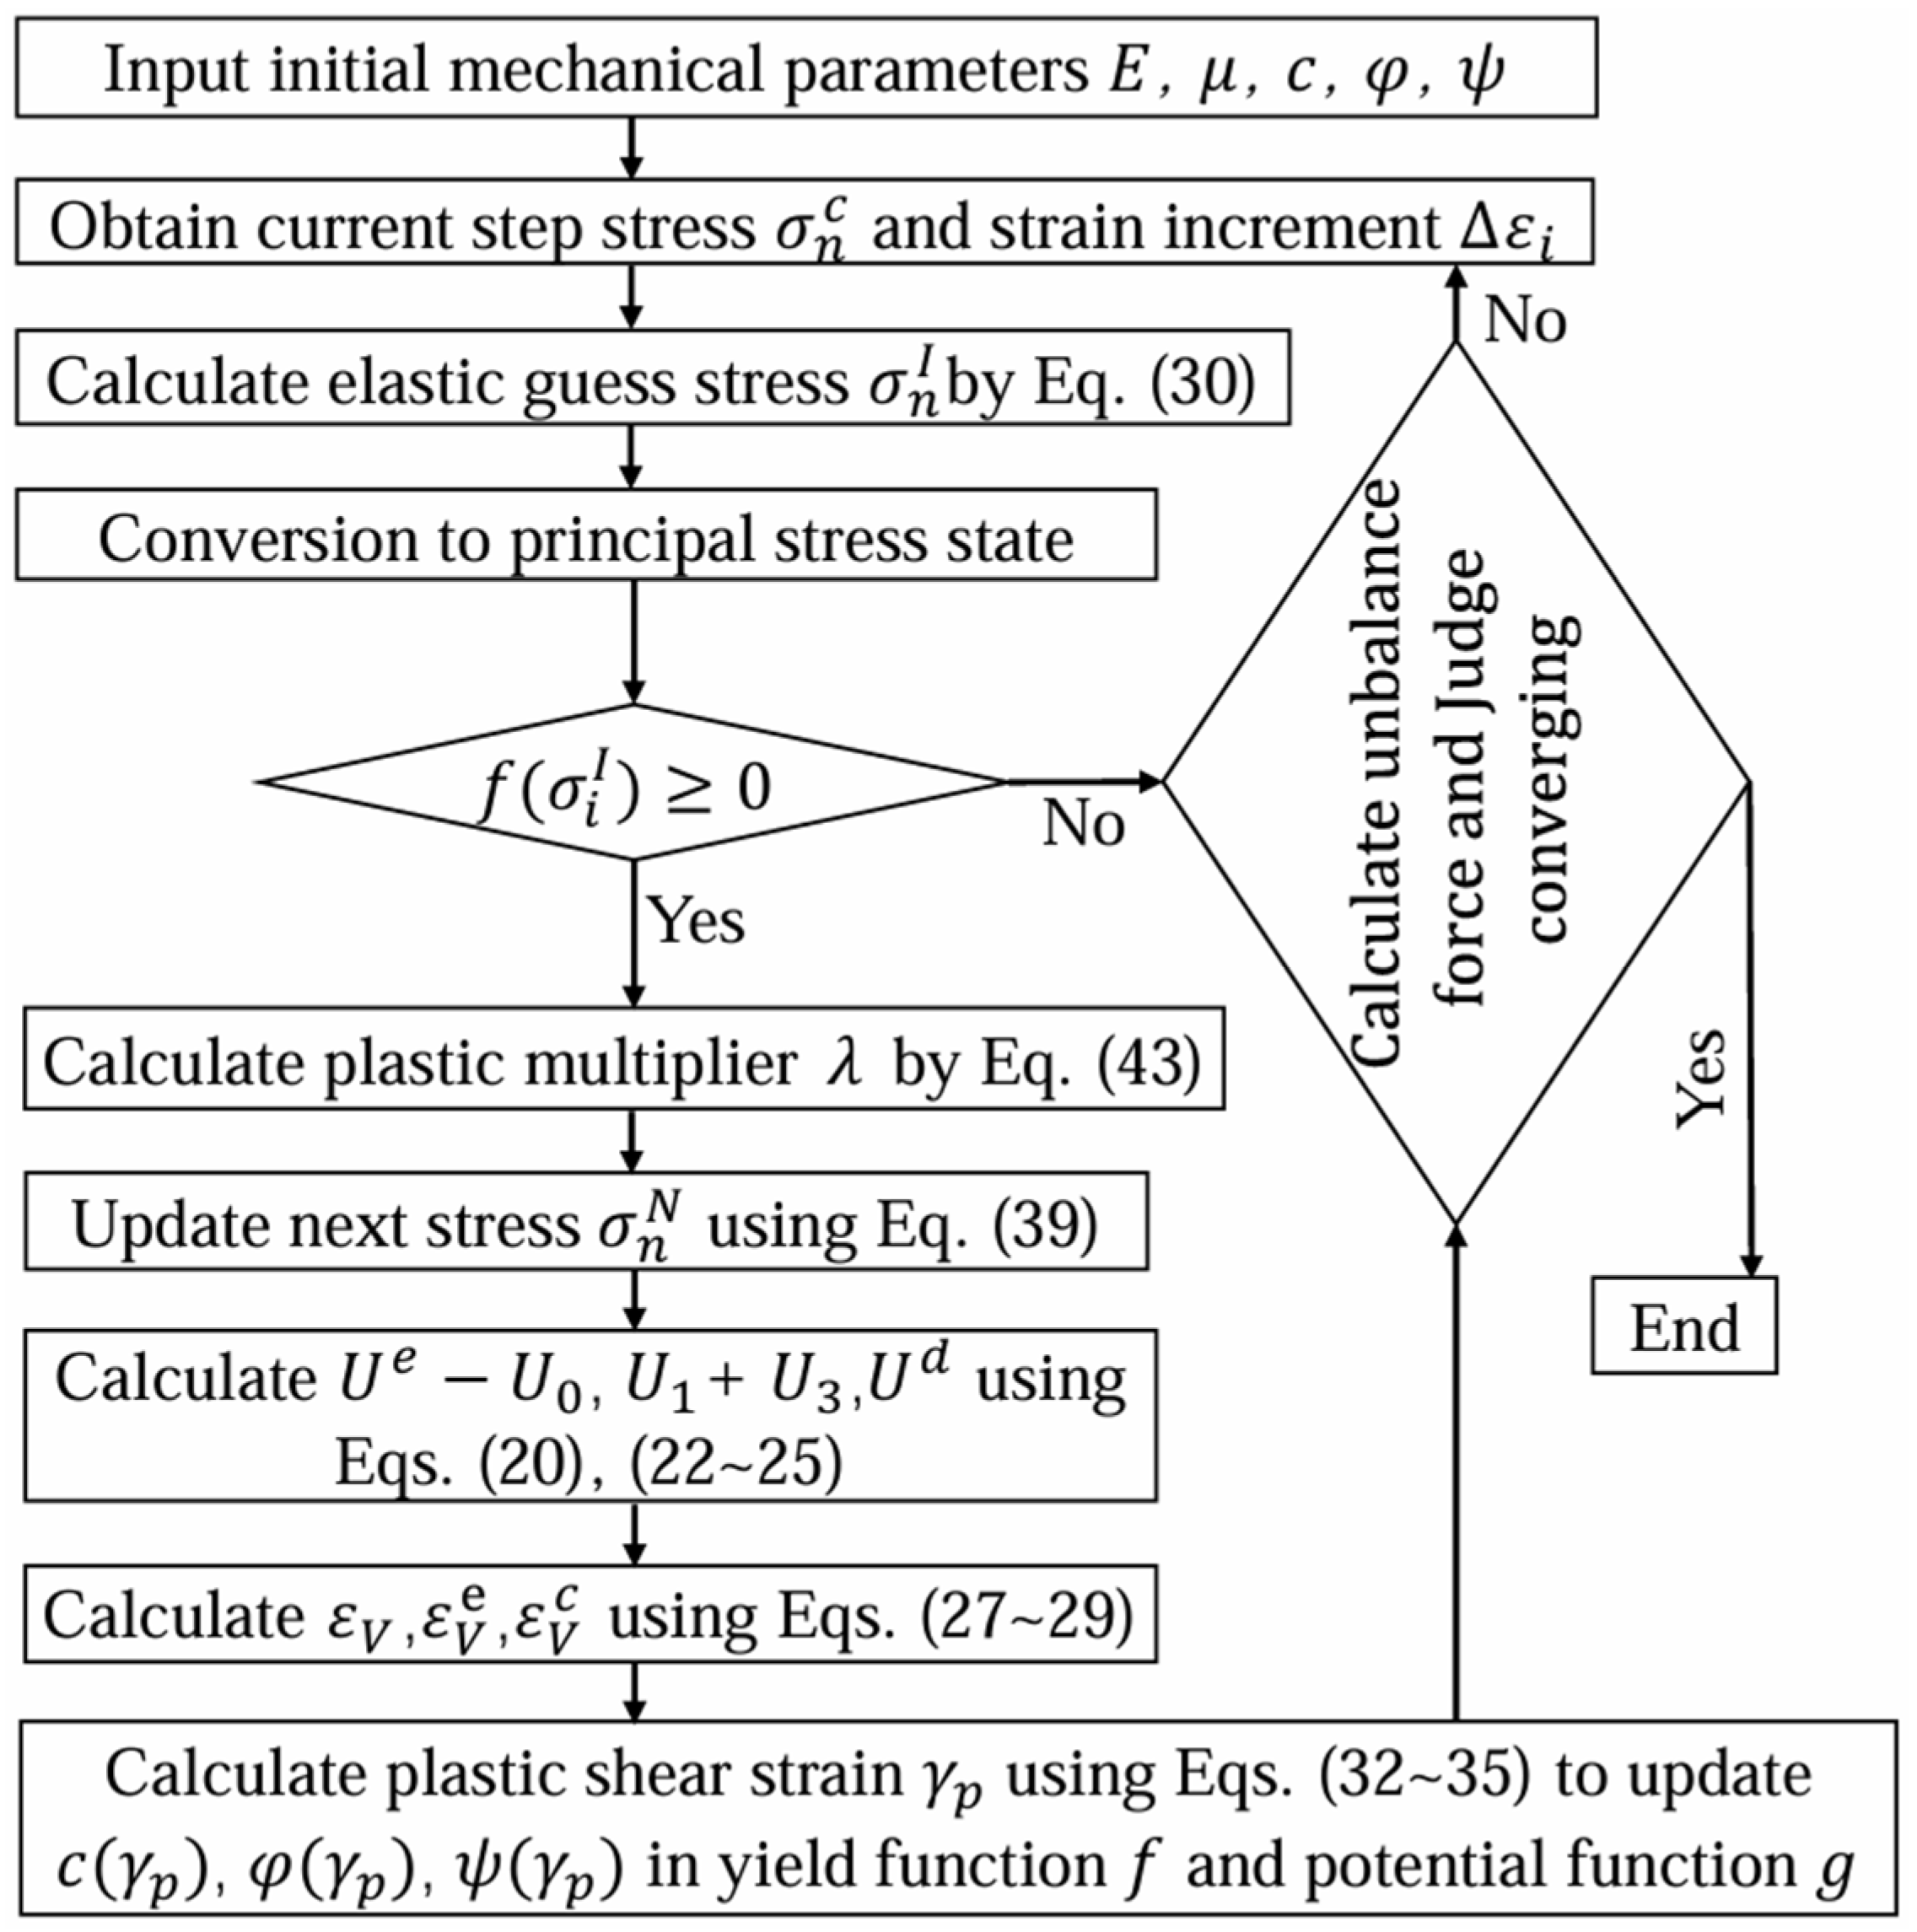
- A corresponding theoretical elastoplastic constitutive model was established, and its three-dimensional finite difference format was derived. The incremental iterative relationships among the various mechanical parameters and their detailed computational processes within FLAC3D were clarified, thus facilitating the implementation of the numerical algorithm for the theoretical model.
- (4)
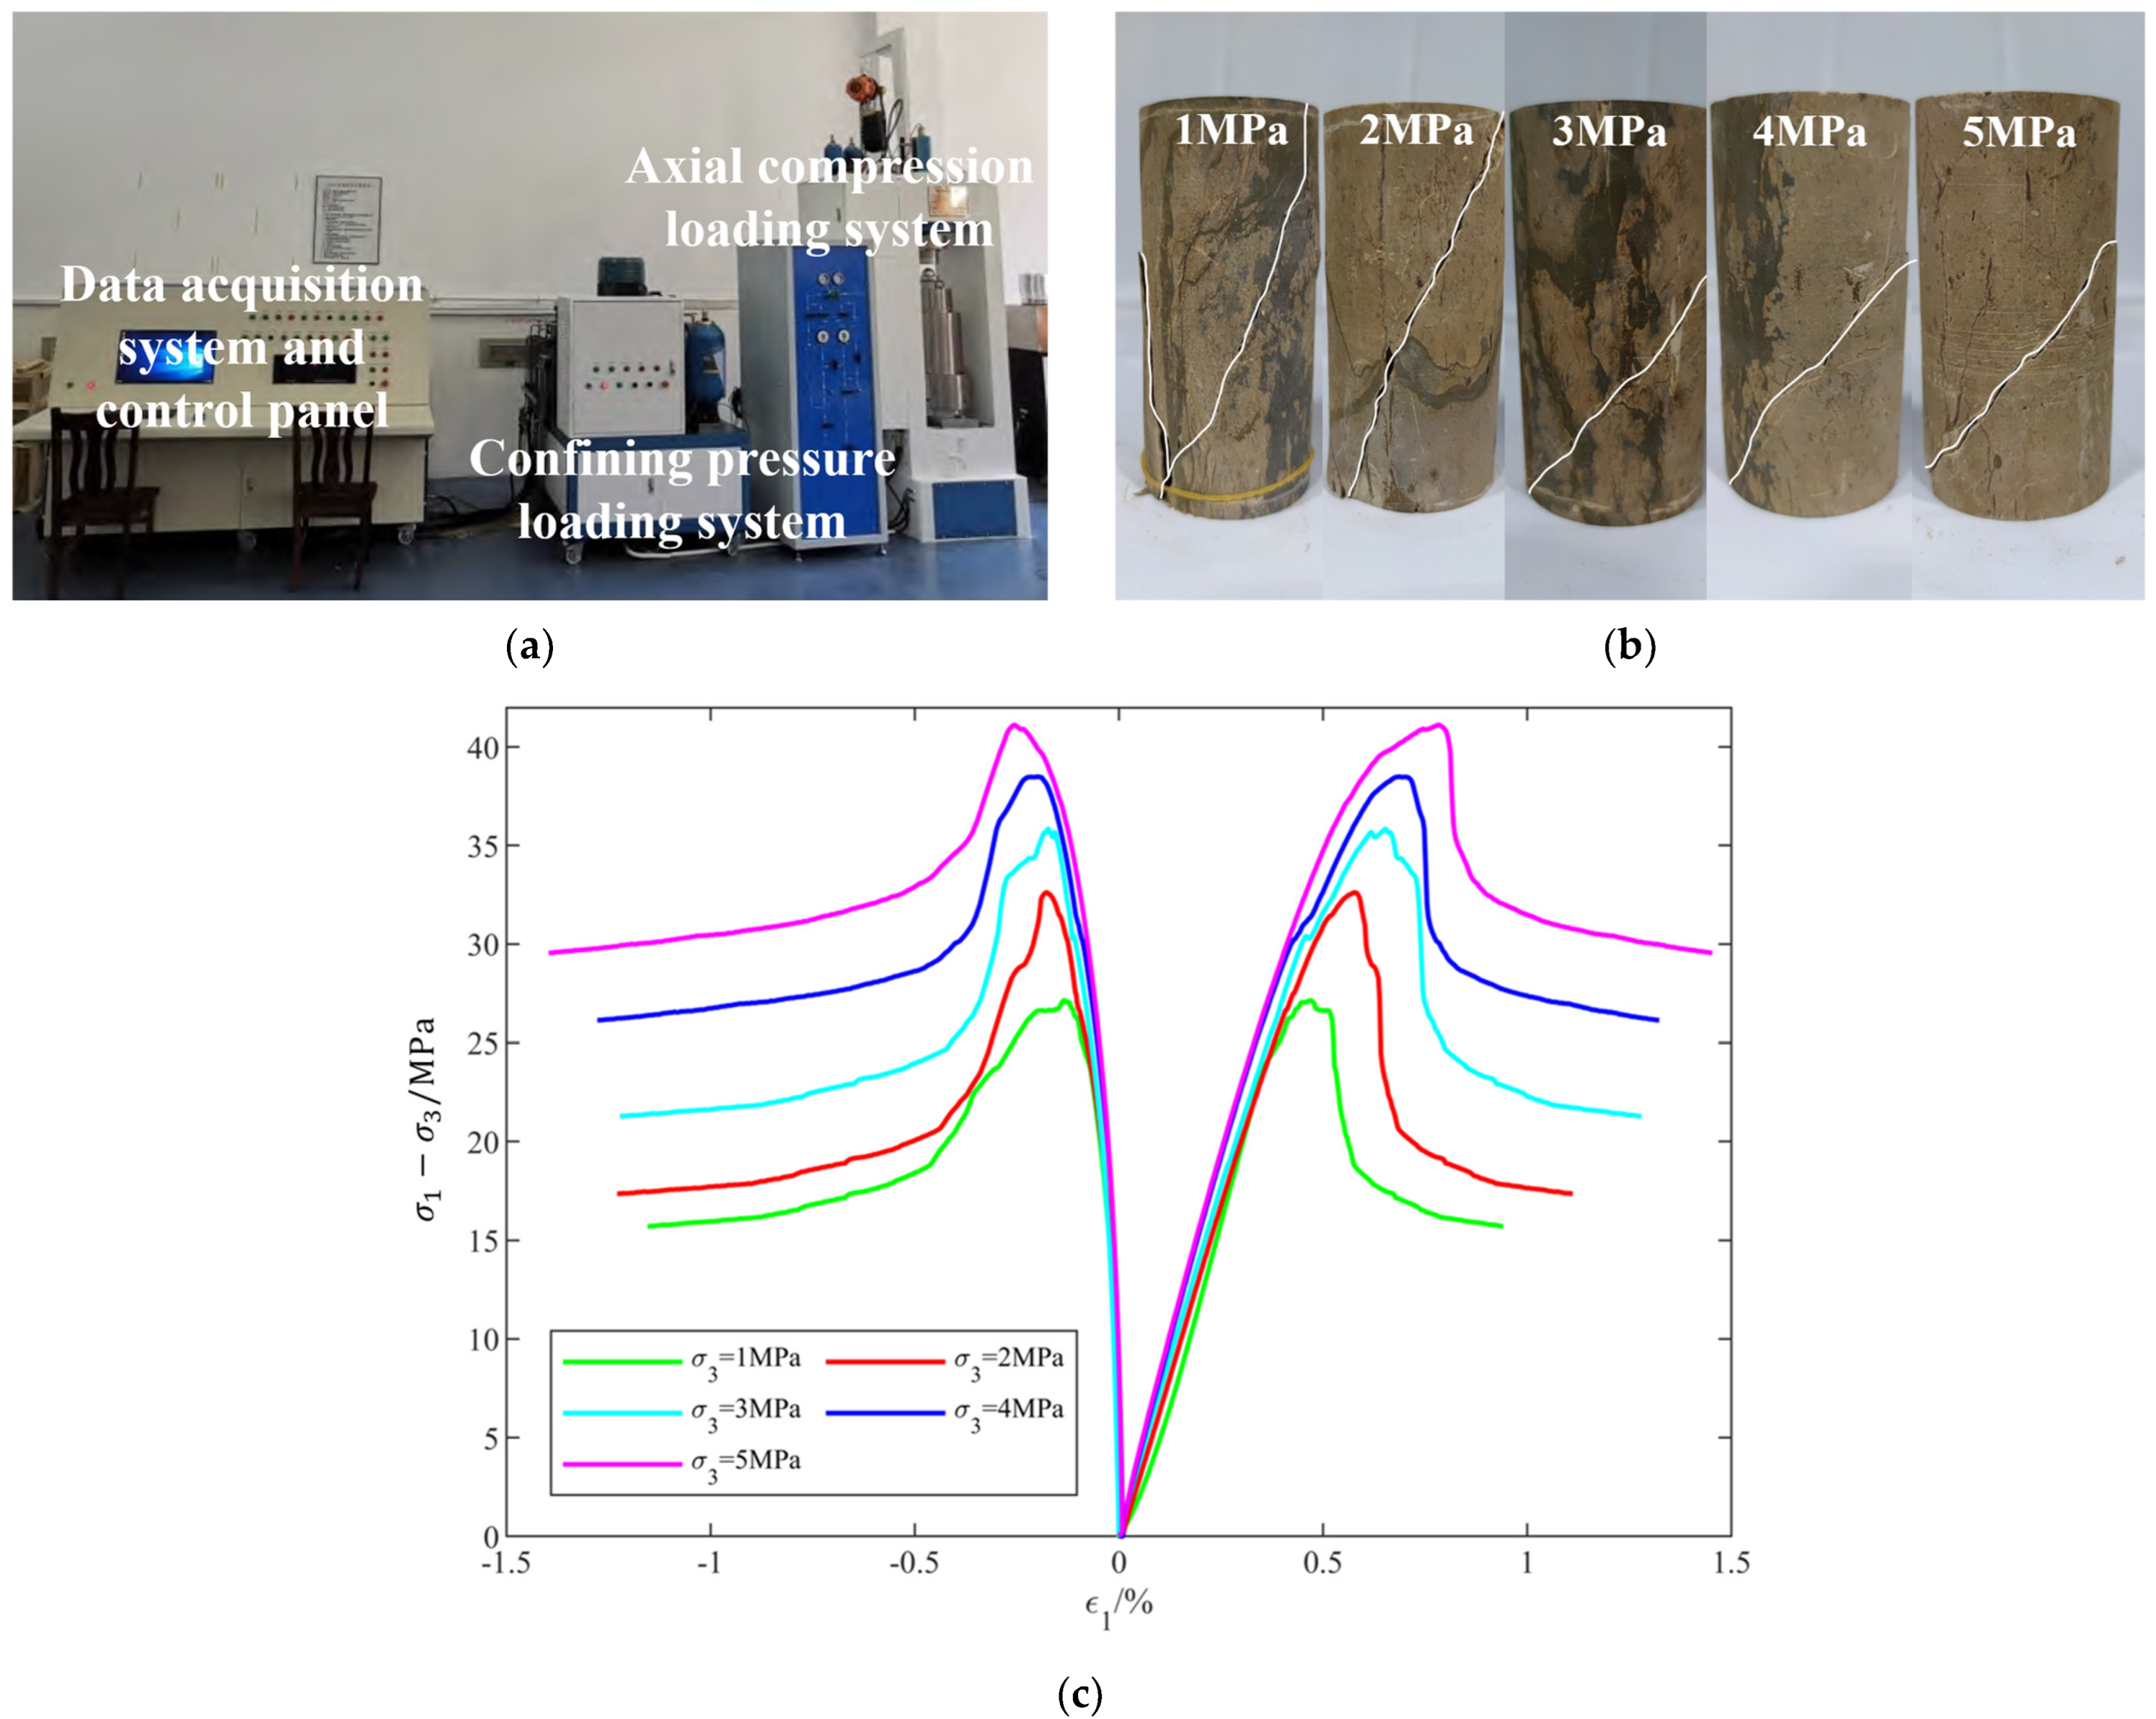
- The simulated stress–strain curves closely align with the experimental data, and the simulated dissipated energy and crack volumetric strain are consistent with the theoretical calculations. This validates that the theoretical model effectively predicts the mechanical response, energy dissipation, and crack evolution of rocks, thus providing computational support for a more accurate description and prediction of the actual failure processes of rocks.
Author Contributions
Funding
Institutional Review Board Statement
Informed Consent Statement
Data Availability Statement
Acknowledgments
Conflicts of Interest
References
- Li, S.; Long, K.; Zhang, Z.; Yao, X. Cracking process and energy dissipation of sandstone under repetitive impact loading with different loading rates: From micro to macro scale. Constr. Build. Mater. 2021, 302, 124123. [Google Scholar] [CrossRef]
- Luo, Y.; Wang, G.; Li, X.; Liu, T.; Mandal, A.K.; Xu, M.; Xu, K. Analysis of energy dissipation and crack evolution law of sandstone under impact load. Int. J. Rock Mech. Min. Sci. 2020, 132, 104359. [Google Scholar] [CrossRef]
- Li, Y.; Zhang, Q.; Gu, Q.; Wu, P.; Jiang, B. An improved strain-softening constitutive model of granite considering the effect of crack deformation. J. Rock Mech. Geotech. Eng. 2024, 16, 1202–1215. [Google Scholar] [CrossRef]
- Wang, Y.N.; Wang, L.C.; Zhou, H.Z. An experimental investigation and mechanical modeling of the combined action of confining stress and plastic strain in a rock mass. Bull. Eng. Geol. Environ. 2022, 81, 204. [Google Scholar] [CrossRef]
- Xu, H.; Zhang, Z.; Yan, J.; Jiang, Z.-P.; Zhao, L.-S.; Zhang, Y.-J. Study on mechanical properties and failure mechanism of hard rock with stiff discontinuities based on 3D printing. Eng. Fail. Anal. 2024, 161, 108225. [Google Scholar] [CrossRef]
- Zhang, H.; Lu, C.P.; Liu, B.; Liu, Y.; Zhang, N.; Wang, H.-Y. Numerical investigation on crack development and energy evolution of stressed coal-rock combination. Int. J. Rock Mech. Min. Sci. 2020, 133, 104417. [Google Scholar] [CrossRef]
- Feng, X.T.; Gao, Y.; Zhang, X.; Wang, Z.; Zhang, Y.; Han, Q. Evolution of the mechanical and strength parameters of hard rocks in the true triaxial cyclic loading and unloading tests. Int. J. Rock Mech. Min. Sci. 2020, 131, 104349. [Google Scholar] [CrossRef]
- Meng, Q.; Liu, J.F.; Ren, L.; Pu, H.; Chen, Y. Experimental study on rock strength and deformation characteristics under triaxial cyclic loading and unloading conditions. Rock Mech. Rock Eng. 2021, 54, 777–797. [Google Scholar] [CrossRef]
- Cheng, L.; Xu, H.; Li, S.; Liu, X.; Liu, Z. Characterization of crack evolution and hardening-softening in rock elastoplastic constitutive models. Comput. Geotech. 2024, 176, 106711. [Google Scholar] [CrossRef]
- Jin, J.; She, C.; Shang, P. Evolution models of the strength parameters and shear dilation angle of rocks considering the plastic internal variable defined by a confining pressure function. Bull. Eng. Geol. Environ. 2021, 80, 2925–2953. [Google Scholar] [CrossRef]
- Xiao, Y.; Qiao, Y.; He, M.; Li, H.; Cheng, T.; Tang, J. A unified strain-hardening and strain-softening elastoplastic constitutive model for intact rocks. Comput. Geotech. 2022, 148, 104772. [Google Scholar] [CrossRef]
- Xiao, Y.; He, M.; Qiao, Y.; Cai, W.; Jiang, Y.; Zhu, H. A novel implementation method of GZZ-based constitutive model into FLAC3D. Tunn. Undergr. Space Technol. 2024, 145, 105601. [Google Scholar] [CrossRef]
- Wang, J.; Apel, D.B.; Pu, Y.; Hall, R.; Wei, C. Numerical modeling for rockbursts: A state-of-the-art review. J. Rock Mech. Geotech. Eng. 2021, 13, 457–478. [Google Scholar] [CrossRef]
- Ning, J.; Gu, Q.; Wang, J.; Hu, S.; Ma, Q.; Qiu, P. Strain-softening model for marble considering the degradation of elastic Modulus. Arab. J. Sci. Eng. 2018, 43, 5635–5643. [Google Scholar] [CrossRef]
- Hansen, B. Line ruptures regarded as narrow rupture zones; basic equation based on kinematic considerations. Proc. Bruss. Conf. Earth Press. Probl. 1958, 1, 39–48. [Google Scholar]
- Vermeer, P.A.; De Borst, R. Non-associated plasticity for soils, concrete and rock. HERON 1984, 29, 3–64. [Google Scholar]
- Vermeer, P.A. Non-associated plasticity for soils, concrete and rock. In Physics of Dry Granular Media; Springer: Dordrecht, The Netherlands, 1998; pp. 163–196. [Google Scholar]
- Zhao, X.G.; Cai, M. A mobilized dilation angle model for rocks. Int. J. Rock Mech. Min. Sci. 2010, 47, 368–384. [Google Scholar] [CrossRef]
- Zhao, X.G.; Cai, M. Influence of plastic shear strain and confinement-dependent rock dilation on rock failure and displacement near an excavation boundary. Int. J. Rock Mech. Min. Sci. 2010, 47, 723–738. [Google Scholar] [CrossRef]
- Zhao, X.; Cai, M.; Cai, M. Considerations of rock dilation on modeling failure and deformation of hard rocks—A case study of the mine-by test tunnel in Canada. J. Rock Mech. Geotech. Eng. 2010, 2, 338–349. [Google Scholar]
- Feng, X.T.; Xu, H.; Yang, C.; Zhang, X.; Gao, Y. Influence of loading and unloading stress paths on the deformation and failure features of Jinping marble under true triaxial compression. Rock Mech. Rock Eng. 2020, 53, 3287–3301. [Google Scholar] [CrossRef]
- Tang, L.; Cheng, L.; Duan, W.; Chen, X.; Liu, Q. Fracture process of a simplified laboratory model for a cross-fault tunnel with rigid reinforcement rings: Experimental and numerical insights. Tunn. Undergr. Space Technol. 2025, 157, 106289. [Google Scholar] [CrossRef]
- Zhuang, D.Y.; Tang, C.A.; Liang, Z.Z.; Ma, K.; Wang, S.Y.; Liang, J.Z. Effects of excavation unloading on the energy-release patterns and stability of underground water-sealed oil storage caverns. Tunn. Undergr. Space Technol. 2017, 61, 122–133. [Google Scholar] [CrossRef]
- Wang, Y.; Gong, B.; Tang, C. Numerical investigation on fracture mechanisms and energy evolution characteristics of columnar jointed basalts with different model boundaries and confining pressures. Front. Earth Sci. 2021, 9, 763801. [Google Scholar] [CrossRef]
- Luo, S.; Gong, F.; Li, L.; Peng, K. Linear energy storage and dissipation laws and damage evolution characteristics of rock under triaxial cyclic compression with different confining pressures. Trans. Nonferrous Met. Soc. China 2023, 33, 2168–2182. [Google Scholar] [CrossRef]
- Wang, G.; Luo, Y.I.; Gong, H.; Liu, T.; Li, X.; Song, L. Investigations on the macro-meso mechanical properties and energy dissipation mechanism of granite shear fracture under dynamic disturbance. Int. J. Numer. Anal. Methods Geomech. 2023, 47, 2364–2384. [Google Scholar] [CrossRef]
- Gao, L.; Gao, F.; Zhang, Z.; Xing, Y. Research on the energy evolution characteristics and the failure intensity of rocks. Int. J. Min. Sci. Technol. 2020, 30, 705–713. [Google Scholar] [CrossRef]
- Zhou, Y.; Sheng, Q.; Li, N.; Fu, X. The influence of strain rate on the energy characteristics and damage evolution of rock materials under dynamic uniaxial compression. Rock Mech. Rock Eng. 2020, 53, 3823–3834. [Google Scholar] [CrossRef]
- Xie, H.; Li, L.; Peng, R.; Ju, Y. Energy analysis and criteria for structural failure of rocks. J. Rock Mech. Geotech. Eng. 2009, 1, 11–20. [Google Scholar] [CrossRef]
- Xie, H.P.; Li, L.Y.; Ju, Y.; Peng, R.D.; Yang, Y.M. Energy analysis for damage and catastrophic failure of rocks. Sci. China Technol. Sci. 2011, 54, 199–209. [Google Scholar] [CrossRef]
- Peng, R.; Ju, Y.; Wang, J.G.; Xie, H.; Gao, F.; Mao, L. Energy dissipation and release during coal failure under conventional triaxial compression. Rock Mech. Rock Eng. 2015, 48, 509–526. [Google Scholar] [CrossRef]
- Wang, M.; Song, Z.; Zheng, D.; Shen, W.; Gou, P.; Wei, S. Development and application of rock energy dissipation model in FLAC3D. J. China Coal Soc. 2021, 46, 2565–2573. [Google Scholar]
- Zhang, R.; Liu, Y.; Hou, S. Evaluation of rockburst risk in deep tunnels considering structural planes based on energy dissipation rate criterion and numerical simulation. Tunn. Undergr. Space Technol. 2023, 137, 105128. [Google Scholar] [CrossRef]
- Fu, B.; Hu, L. Experimental and numerical investigations on crack development and mechanical behavior of marble under uniaxial cyclic loading compression. Int. J. Rock Mech. Min. Sci. 2020, 130, 104289. [Google Scholar] [CrossRef]
- Wang, S.Y.; Sun, L.; Yang, C.; Yang, S.Q.; Tang, C.A. Numerical study on static and dynamic fracture evolution around rock cavities. J. Rock Mech. Geotech. Eng. 2013, 5, 262–276. [Google Scholar] [CrossRef]
- Xu, T.; Xu, Q.; Tang, C.; Ranjith, P.G. The evolution of rock failure with discontinuities due to shear creep. Acta Geotech. 2013, 8, 567–581. [Google Scholar] [CrossRef]
- Chen, X.; Tang, M.; Tang, C. Effect of confining pressure on the damage evolution and failure behaviors of intact sandstone samples during cyclic disturbance. Rock Mech. Rock Eng. 2022, 55, 19–33. [Google Scholar] [CrossRef]
- Li, S.; Huang, Z.; Huang, K.; Li, Y.; Peng, H.; Liang, Q.; Ma, K. Study on the evolution law and quantitative characterization of micro-crack propagation in the compressive failure process of rocks. Eng. Fail. Anal. 2024, 155, 107743. [Google Scholar] [CrossRef]
- Xu, H.; Zhang, Z.; Zhang, Y.J.; Jiang, Q.; Qiu, S.L.; Zhou, Y.Y.; Feng, G.L. Effects of natural stiff discontinuities on the deformation and failure mechanisms of deep hard rock under true triaxial conditions. Eng. Fail. Anal. 2024, 158, 108034. [Google Scholar] [CrossRef]
- Bordia, S.K. Complete stress-volumetric strain equation for brittle rock up to strength failure. Int. J. Rock Mech. Min. Sci. Geomech. Abstr. 1972, 9, 17–24. [Google Scholar] [CrossRef]
- Martin, C.D.; Chandler, N.A. The progressive fracture of Lac du Bonnet granite. Int. J. Rock Mech. Min. Sci. Geomech. Abstr. 1994, 31, 643–659. [Google Scholar] [CrossRef]
- Xu, R.; Zhang, S.; Li, Z.; Yan, X. Experimental investigation of the strain rate effect on crack initiation and crack damage thresholds of hard rock under quasi-static compression. Acta Geotech. 2023, 18, 903–920. [Google Scholar]
- Huang, X.; Shi, C.; Ruan, H.; Zhang, Y.; Zhao, W. Stable crack propagation model of rock based on crack strain. Energies 2022, 15, 1885. [Google Scholar] [CrossRef]
- Zuo, J.; Chen, Y.; Liu, X. Crack evolution behavior of rocks under confining pressures and its propagation model before peak stress. J. Cent. South Univ. 2019, 26, 3045–3056. [Google Scholar] [CrossRef]
- Itasca Consulting Group Inc. FLAC3D (Fast Lagrangian Analysis of Continua in 3 Dimensions) User’s Manual Version 6.0; Itasca Consulting Group Inc.: Minneapolis, MN, USA, 2017. [Google Scholar]


| Model Parameter | Parameter Equation |
|---|---|
| Equation (2) | |
| Equation (2) | |
| Equation (3) | |
| Equation (3) | |
| Equation (3) | |
| Equation (8) | |
| Equation (9) | |
| Equation (9) | |
| Equations (20) and (22) | |
| Equations (23) and (24) | |
| Equation (25) | |
| Equation (27) | |
| Equation (28) |
| Model Parameter | Parameter Equation |
|---|---|
| 6.51 GPa | |
| 0.244 | |
| Equation (3) | |
| Equation (44) | |
| Equation (45) | |
| Equation (8) | |
| Equation (9) | |
| Equation (46) | |
| Equations (20) and (22) | |
| Equations (23) and (24) | |
| Equation (25) | |
| Equation (27) | |
| Equation (28) |
Disclaimer/Publisher’s Note: The statements, opinions and data contained in all publications are solely those of the individual author(s) and contributor(s) and not of MDPI and/or the editor(s). MDPI and/or the editor(s) disclaim responsibility for any injury to people or property resulting from any ideas, methods, instructions or products referred to in the content. |
© 2025 by the authors. Licensee MDPI, Basel, Switzerland. This article is an open access article distributed under the terms and conditions of the Creative Commons Attribution (CC BY) license (https://creativecommons.org/licenses/by/4.0/).
Share and Cite
Cheng, L.; Yu, Z.; Liu, X. Elastoplastic Constitutive Model for Energy Dissipation and Crack Evolution in Rocks. Appl. Sci. 2025, 15, 4179. https://doi.org/10.3390/app15084179
Cheng L, Yu Z, Liu X. Elastoplastic Constitutive Model for Energy Dissipation and Crack Evolution in Rocks. Applied Sciences. 2025; 15(8):4179. https://doi.org/10.3390/app15084179
Chicago/Turabian StyleCheng, Lei, Zhi Yu, and Xinxi Liu. 2025. "Elastoplastic Constitutive Model for Energy Dissipation and Crack Evolution in Rocks" Applied Sciences 15, no. 8: 4179. https://doi.org/10.3390/app15084179
APA StyleCheng, L., Yu, Z., & Liu, X. (2025). Elastoplastic Constitutive Model for Energy Dissipation and Crack Evolution in Rocks. Applied Sciences, 15(8), 4179. https://doi.org/10.3390/app15084179