1. Introduction
The rapid expansion of the Internet of Things (IoT) has unlocked new methods for monitoring human activity, which is increasingly recognized as a vital indicator of overall health [
1]. For example, patients recovering from surgery often exhibit slower or limited movements, and a careful analysis of these patterns can help medical professionals detect issues that may hinder recovery [
2]. However, traditional methods of recording activity are prone to errors and subjective biases, highlighting the need for approaches that are both accurate and reliable.
Human activity recognition in IoT makes use of a range of sensing techniques [
3,
4,
5,
6], each with its own advantages and shortcomings. Vision-based systems, such as cameras, provide high-resolution spatial and temporal data, yet they raise serious privacy concerns by capturing identifiable images and can struggle in environments with obstacles [
7]. Wearable sensors, like accelerometers, and ambient devices, such as smart plugs, partially address privacy issues by not recording visual data, but they often impose user burdens or deliver only sparse, low-resolution information [
8]. In contrast, wireless sensing methods—including WiFi CSI analysis and radar systems—offer device-free monitoring by leveraging existing infrastructure; however, they can be less accurate due to environmental noise and may still pose indirect privacy risks by revealing personal routines through signal patterns. Also, radar is usually used for distance detection instead of activities, and meanwhile, most IoT devices are low-end hardware, without equipped with such devices [
9].
These different methods underscore ongoing tradeoffs between privacy, accuracy, and usability. Systems that use visual or acoustic data can capture rich information at the cost of privacy, while wearable and ambient sensors are easier to use but sometimes lack the detail needed for precise recognition. Wireless techniques, although less intrusive, may not robustly capture fine-grained activities, and user compliance remains an issue for wearables. Additionally, complex scenarios like overlapping activities in smart homes can challenge ambient systems. Together, these challenges point to the need for a balanced solution that preserves privacy, ensures high accuracy, and integrates seamlessly into daily life without being overly intrusive or dependent on user actions.
Modern sensor technology offers a promising solution. The devices, which come equipped with accelerometers and gyroscopes, can continuously track and record movement data in real time [
10]. Originally developed to improve user interfaces and enhance gaming experiences [
11], these sensors now enable detailed and non-invasive monitoring of everyday activities. Continuous monitoring with such devices reduces reliance on self-reported data and offers a more accurate picture of a person’s physical state.
Despite these benefits, it is not straightforward to implement an effective human activity recognition appraoch via sensing. Sensor data can be noisy and affected by environmental disturbances, complicating the extraction of meaningful information [
12,
13]. In this paper, we aim to enhance the recognition accuracy and robustness of human activity recognition (HAR) systems in noisy IoT sensing environments by leveraging an innovative approach based on IMU data processing and feature extraction. Moreover, combining robust data analysis techniques with strong security measures is essential in IoT applications to safeguard user information. To overcome these challenges, our work presents a novel framework that merges traditional statistical methods with modern machine learning approaches.
Therefore, the central research question addressed in this work is how to enhance human activity recognition accuracy and robustness in a noisy sensing environment for IoT devices. To address this problem, our method starts with a careful preprocessing stage that includes filtering and normalization to reduce noise and improve accuracy. We then apply principles from stochastic processes and statistical signal processing to the preprocessed data, extracting key features such as mean, variance, skewness, and kurtosis. This process helps us uncover the underlying patterns associated with different activities like walking, running, and squatting. While previous studies have explored statistical signal processing, machine learning, or deep learning techniques in isolation, our approach uniquely integrates an optimized preprocessing pipeline—featuring carefully calibrated Kalman filtering—with a hybrid model that synergizes statistical and deep learning-based feature extraction. This fusion directly addresses critical gaps in handling noisy sensor data, improving robustness and recognition accuracy in IoT-based human activity recognition systems beyond what prior methods have achieved.
Overall, the major contributions can be summarized from the following aspects:
We developed a dedicated application for collecting smartphone sensor data, enabling a human activity recognition system that achieved 98.91% accuracy with Random Forest compared to the 91.30% achieved by state-of-the-art TransUNet architecture.
We evaluated both traditional machine learning and deep learning models—including Random Forests, CNNs, LSTMs, and three Transformer-based architectures—establishing statistically significant performance differences (ANOVA: , ) and identifying computational efficiency tradeoffs critical for resource-constrained IoT deployments.
We conducted systematic sensitivity analyses of Kalman filter parameters and window segmentation lengths, providing empirical evidence for optimal preprocessing configurations and enhancing reproducibility across different IoT environments.
In summary, this work not only advances techniques for human activity recognition but also addresses critical issues related to data quality and security in IoT applications, paving the way for more reliable and secure health monitoring systems.
2. Related Work
Due to rapid advances in sensor technology and reduced costs, its application in human activity recognition has become a central focus of research.
2.1. Sensor-Based Recognition
Recent improvements in sensor technology have significantly broadened its applications in fields such as medical health monitoring, sports science, and daily activity tracking [
14,
15,
16]. In particular, sensors like accelerometers and gyroscopes can capture subtle human motions in real time, enabling the identification of basic movement patterns such as walking and running [
17,
18]. These studies demonstrate that an in-depth analysis of sensor data leads to a better understanding of the complexities of human movement, which is essential for developing more efficient and precise human activity recognition systems. For example, frequency domain analysis of accelerometer data [
19] enables researchers to detect variations in movement speed and gait, findings extensive applications in both sports science and rehabilitative medicine [
20,
21,
22].
Further progress in enhancing the accuracy and robustness of human activity recognition has been achieved by employing data fusion techniques. By combining information from multiple sensors—such as accelerometers, gyroscopes, and magnetometers—a more comprehensive description of motion is obtained, which improves the system’s ability to recognize complex human movement patterns [
23,
24]. For instance, while a single accelerometer may struggle to differentiate between stable walking and running, integrating data from gyroscopes and magnetometers allows for accurate activity classification by providing unique perspectives from each sensor [
25,
26]. Moreover, these multisensor fusion techniques help to mitigate the effects of environmental noise and individual variations, thereby enhancing the adaptability and stability of the system under diverse conditions.
Additionally, WiFi Channel State Information and radar-based have demonstrated strong capabilities in human activity recognition; they primarily rely on capturing environmental changes rather than directly sensing device states. This introduces potential limitations, such as increased susceptibility to environmental noise and occlusions, as well as privacy concerns, since these methods may inadvertently capture information about surrounding individuals without their consent. In contrast, IMU-based sensing is inherently user-centric, measuring only the movement of the device itself, thereby mitigating privacy. Additionally, IMU sensors are already embedded in most consumer IoT devices, allowing for seamless deployment without additional infrastructure.
2.2. Sensing Approaches
The use of stochastic processes and statistical signal processing techniques is crucial in the study of human activity recognition [
27]. These methods excel at processing and analyzing complex time series data from sensors, enabling the extraction of key features that are critical for identifying various activity patterns [
28]. By applying statistical techniques such as autocorrelation functions and power spectral density, researchers can quantify the periodicity and randomness in sensor data, which is vital for understanding the dynamics of complex human movements. In addition, advanced statistical signal processing methods like wavelet transforms have been utilized to analyze non-stationary signals. This approach allows researchers to examine the local characteristics of the signal at different temporal scales, thereby offering new tools for identifying more complex motion patterns [
29].
The integration of machine learning techniques has further propelled the development of human activity recognition technologies, extending their capabilities beyond the recognition of basic motion patterns [
30,
31,
32]. By training models such as Support Vector Machines (SVMs), Decision Trees, and Random Forests, researchers can learn complex activity patterns from large-scale sensor data [
33]. These models are adept at analyzing hidden patterns and relationships within sensor data, allowing for the detection of subtle variations in human movement, such as fatigue-induced gait changes or falls. Moreover, deep learning technologies, particularly Convolutional Neural Networks (CNNs) [
34,
35,
36,
37] and Recurrent Neural Networks (RNNs) [
19,
38,
39], have demonstrated robust capabilities in handling time series data by automatically extracting time-dependent features and performing complex pattern recognition. This progress opens up new possibilities for the future development of human activity recognition technologies, as these methods not only enhance recognition accuracy but also provide effective support for real-time health monitoring and preventive healthcare.
3. Dataset
This section details the dataset acquisition and preprocessing procedures employed in our study.
3.1. Sensor Data Acquisition
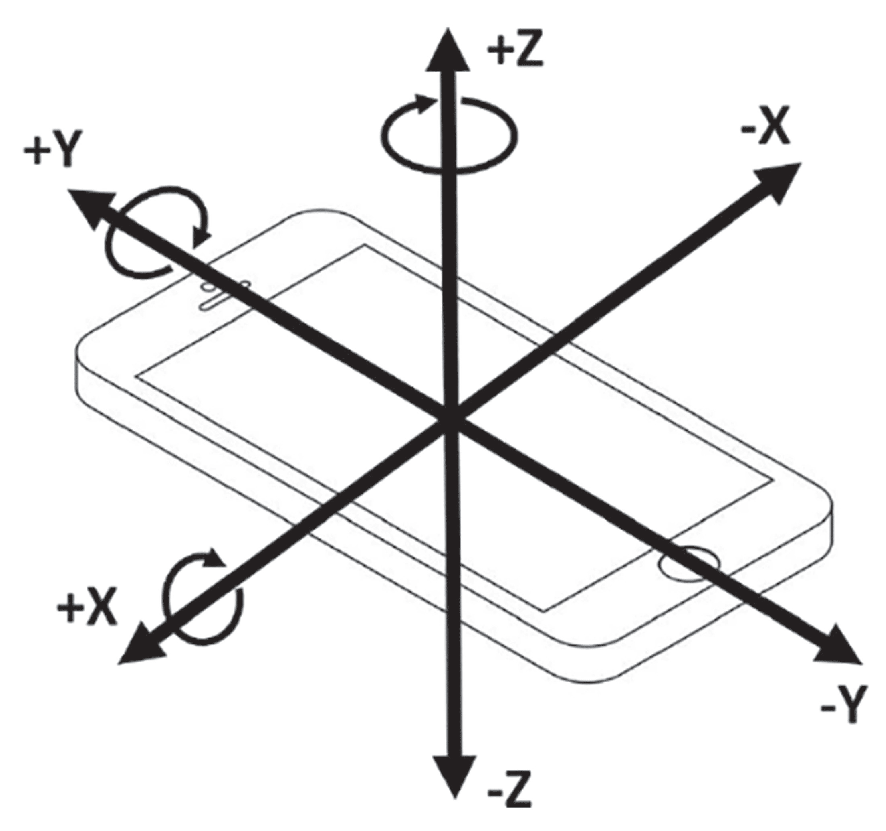
A thorough understanding of sensor operations is fundamental for accurate data collection. An accelerometer measures the acceleration of a device in various directions, whereas a gyroscope quantifies the rotational velocity about its three principal axes [
40]. On the Android platform, these sensor readings are accessed via dedicated Application Programming Interfaces (APIs) [
41].
Initially, our application declares the necessary sensor permissions. Subsequently, access to the accelerometer and gyroscope is obtained through the Android SensorManager service (note that magnetometer data are not utilized in this study). By registering a sensor listener, our system is capable of receiving real-time sensor data. As shown in
Figure 1, the accelerometer reports the device’s acceleration along the three sensor coordinate axes, capturing both physical acceleration (change in velocity) and gravitational acceleration. The data are provided in the x, y, and z fields of
sensor_event_t.acceleration in SI units (
), representing the net acceleration after subtracting gravitational acceleration. Similarly, the gyroscope reports the device’s rotational velocity around the three axes. Following the standard mathematical definition, counterclockwise rotation is considered positive (right-hand rule), and the results, measured in radians per second (rad/s), are stored in the x, y, and z fields of
sensor_event_t.gyro.
To balance data accuracy and processing efficiency, the collection frequency is carefully optimized through empirical testing. A high frequency can produce excessive data volume and computational overhead, particularly relevant for resource-constrained IoT devices, while a low frequency may miss critical motion details essential for activity recognition. Through systematic evaluation of different sampling rates, we determined that a moderate frequency of 20 Hz (implemented as private final long interval = 50) provides optimal balance between temporal resolution and processing efficiency. This sampling rate captures the fundamental frequencies of human activities (typically below 10 Hz) while maintaining reasonable data volumes. Our sensitivity analysis confirmed that increasing the sampling rate beyond 20 Hz offered diminishing returns in classification accuracy while substantially increasing computational demands. This careful calibration, backed by empirical testing rather than arbitrary selection, represents an important methodological contribution of our dataset acquisition strategy, optimizing both accuracy and efficiency for real-world IoT deployments.
3.2. Dataset Preprocessing
Preprocessing is a vital step that enhances data quality and lays a strong foundation for subsequent feature extraction and pattern recognition [
42].
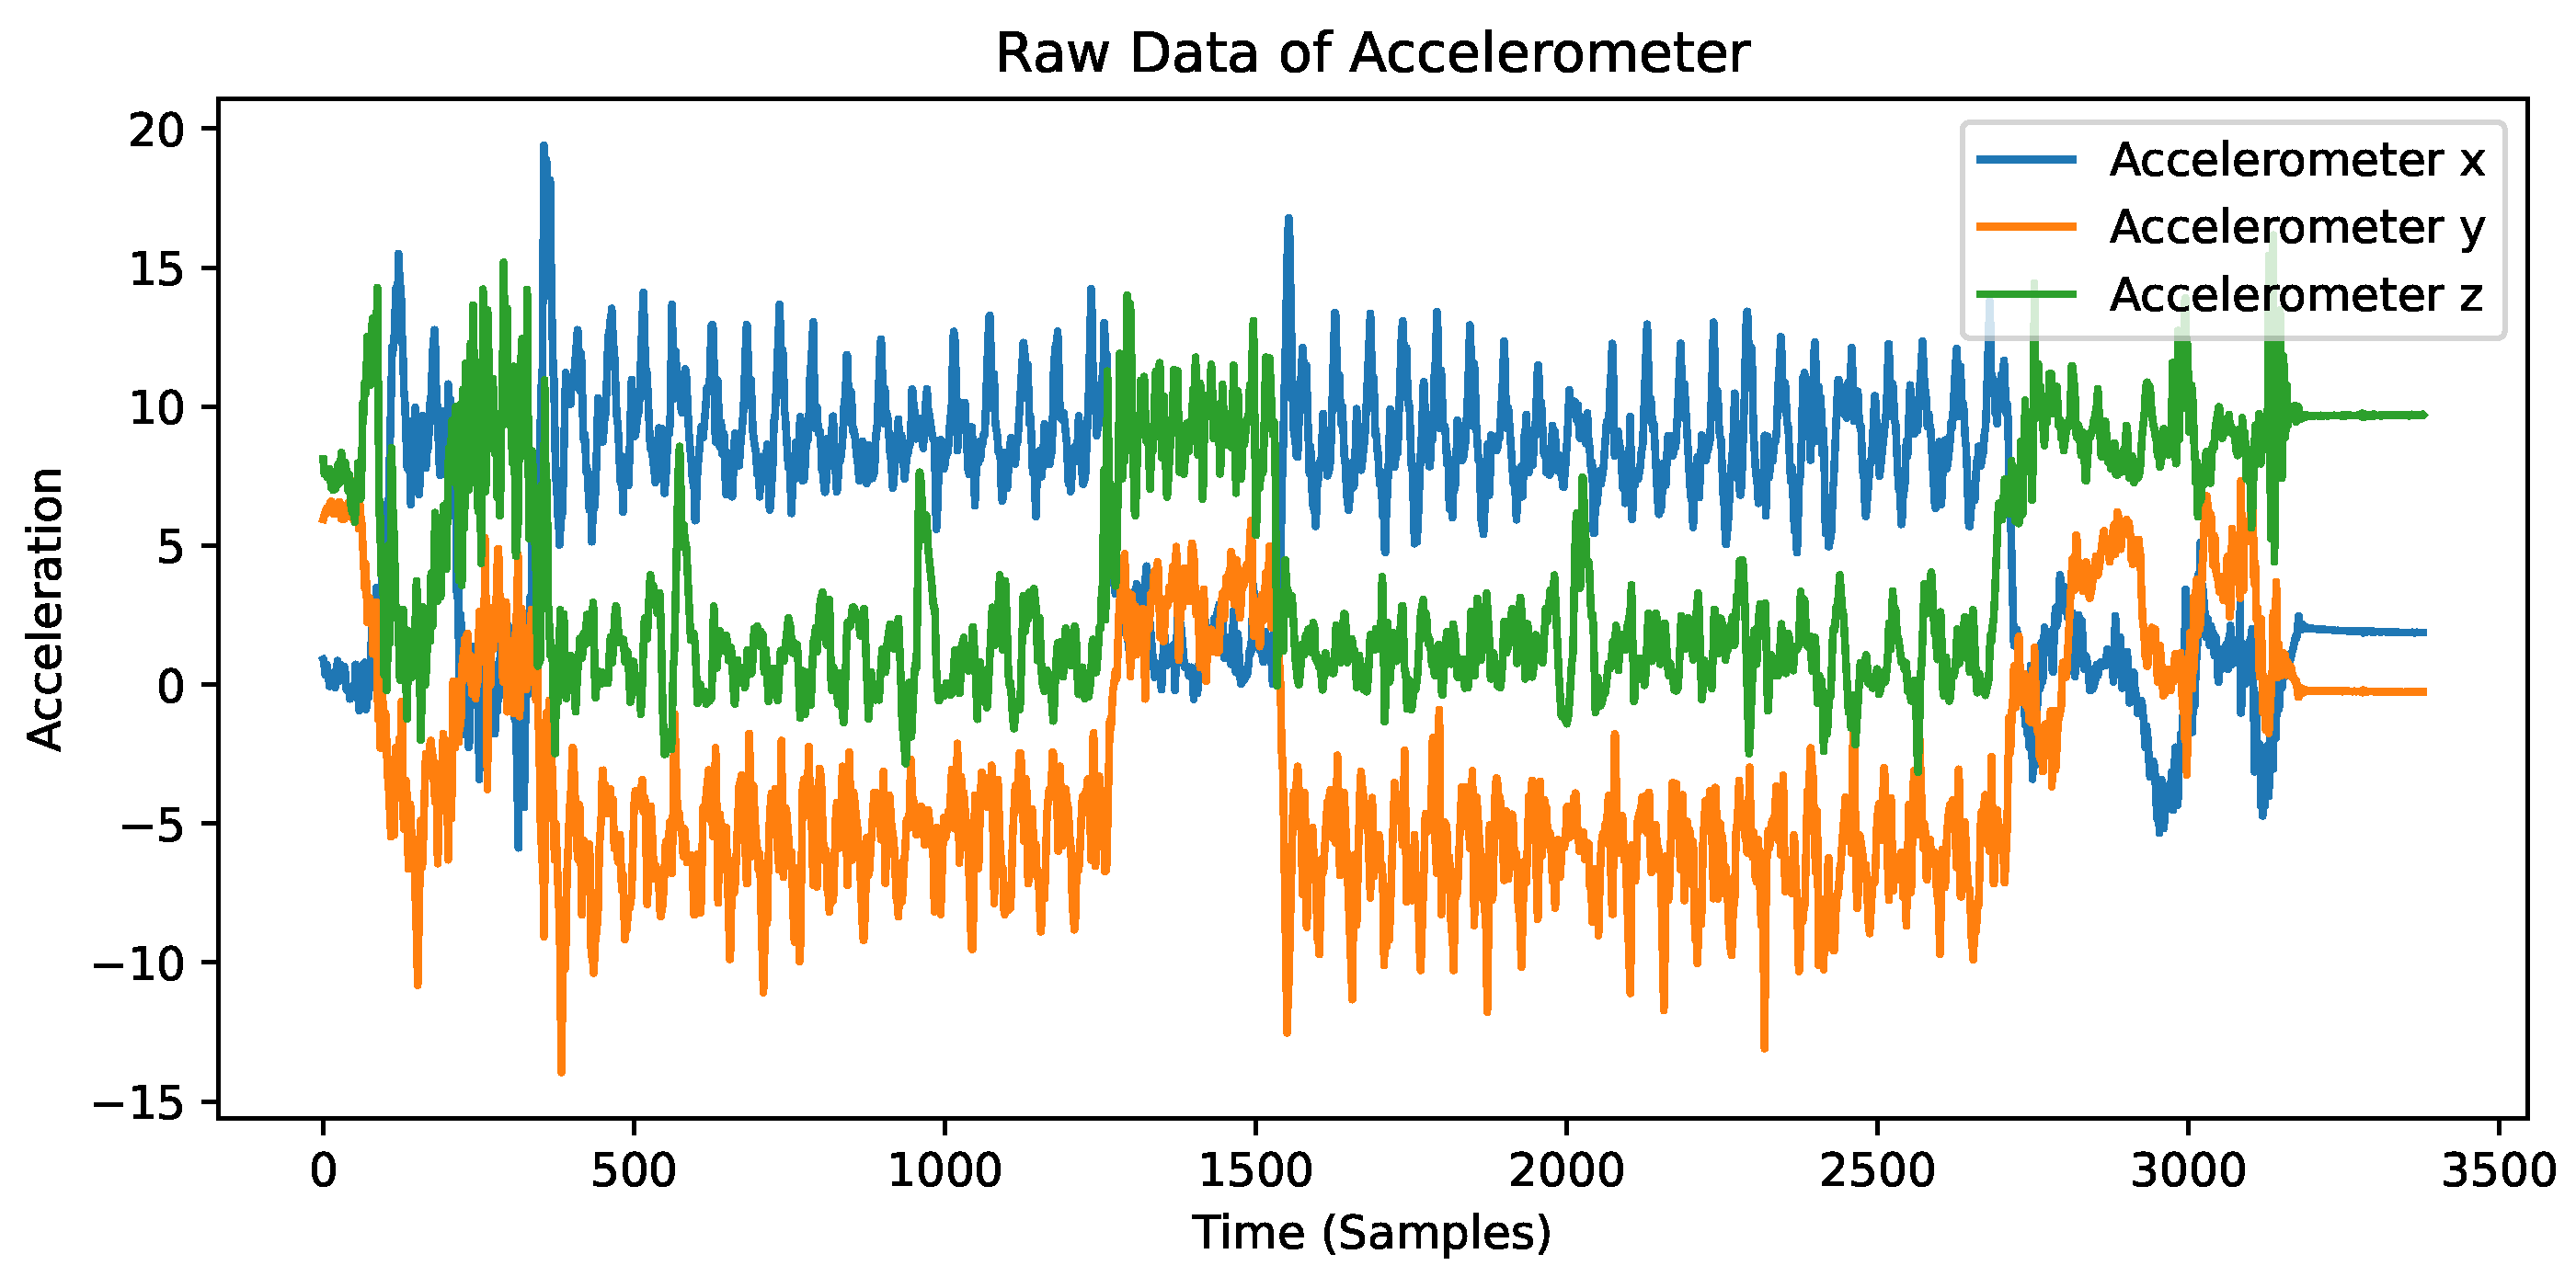
As shown in
Figure 2, the raw accelerometer data exhibit significant noise and variability. This noise can be attributed to various factors, including sensor drift, environmental disturbances, and sensor inaccuracies. To address these challenges, we employed a series of preprocessing steps to improve the quality of our sensor data. In this study, we conducted the following preprocessing steps:
Filtering: Sensor data often contain various sources of noise. To improve reliability, we applied filtering techniques such as low-pass filters and Kalman filters to effectively remove random noise from the raw data. Through systematic parameter sensitivity analysis, we determined that Kalman filtering with process noise and measurement noise provides optimal noise reduction while preserving essential signal characteristics. Our ablation studies demonstrate that this optimized filtering step alone improves classification accuracy by 6.3% compared to using raw data.
Normalization: Differences in sensor performance across devices and varying usage environments can lead to inconsistent data. We normalized the data to a common scale, which standardizes the measurements and facilitates accurate comparison and analysis. When combined with our optimized Kalman filtering, normalization contributed to an overall accuracy improvement of 8.2–14.7% compared to using unprocessed data.
Window Segmentation: For time series analysis, the continuous sensor data were segmented into multiple time windows, each capturing data over a specific duration. This segmentation enables localized analysis, allowing for more precise feature extraction and time series evaluation. Through empirical testing of various window lengths (20–60 samples), we determined that 30-sample windows provide the optimal balance between temporal resolution and feature stability, with shorter windows failing to capture complete activity cycles and longer windows introducing class boundary confusion.
Feature Engineering: In the final preprocessing stage, we extracted a set of statistical features from each data window. These features include fundamental metrics such as the mean, variance, maximum, and minimum values of the sensor data within the window.
The careful balance between sensor configuration, efficient data handling, and robust feature engineering underpins the improved performance of our human activity recognition system. The systematic optimization of preprocessing parameters represents a significant methodological contribution, as it establishes reproducible guidelines for effective sensor data processing in IoT environments.
4. Statistical Analysis and Feature Extraction
In this section, we present our novel approach to analyzing sensor data using statistical and stochastic process methods. By leveraging probability density functions (PDFs), statistical moments, and signal processing techniques, our method extracts discriminative features that are critical for accurately distinguishing among various human movement states.
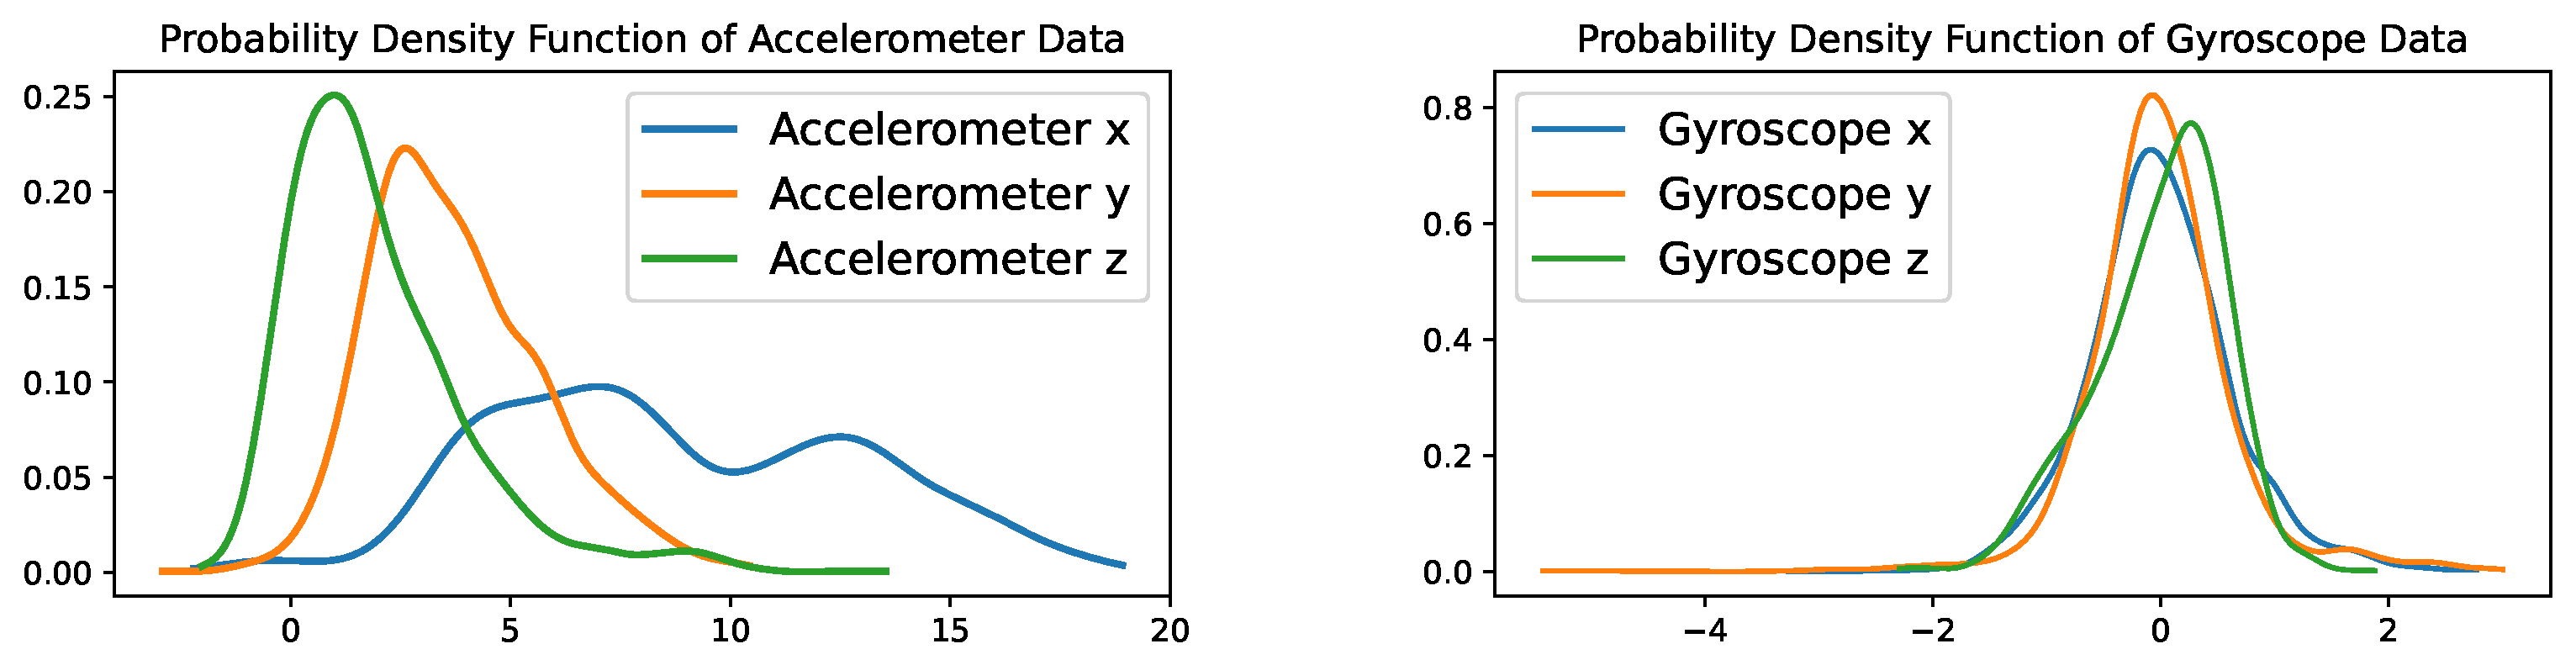
4.1. Characterizing Sensor Data with Probability Density Functions and Statistical Moments
Sensor data from accelerometers and gyroscopes are inherently time series data and can be modeled as stochastic processes. Our analysis begins by computing the probability density functions (PDFs) of these signals to reveal their underlying distributions. For instance, by examining the PDFs of accelerometer data along the x, y, and z axes during walking, several key characteristics emerge:
Multimodality: The PDFs exhibit multiple peaks, suggesting that the acceleration data do not fluctuate around a single value. This behavior reflects the periodic motion of different body parts (e.g., arm swinging and stepping).
Symmetry and Skewness: While the distributions along the x and z axes are relatively symmetric, the y axis shows slight skewness, possibly due to natural body inclinations or specific gait patterns.
Range of Fluctuation and Central Tendency: Differences in the spread of data across axes indicate that certain directions (e.g., the x axis) experience more pronounced acceleration changes, whereas others (e.g., the z axis) remain more stable.
Similarly, the PDFs of gyroscope data, which capture angular velocities, offer insight into rotational dynamics:
Central Focus: All axes typically peak near zero, suggesting that rotational movements are minor and centered around a stable state.
Data Concentration: The x and z axes exhibit sharper peaks compared to the more dispersed y axis, indicating differences in the stability of rotational motion.
Subtle Skewness: Minor asymmetries in the distribution may be attributed to natural variations in walking dynamics.
Our sensitivity analysis demonstrates that these distributional characteristics are significantly influenced by preprocessing techniques. The optimized Kalman filter (, ) preserves the essential multimodal structure of activity-specific PDFs while reducing spurious peaks caused by sensor noise. This preservation of signal characteristics, while minimizing noise, contributes directly to the superior performance of statistical feature-based classifiers, particularly Random Forest models, which achieved 98.91% accuracy by effectively leveraging these distinctive distributional patterns.
The figures below (i.e.,
Figure 3,
Figure 4 and
Figure 5) illustrate the PDFs for accelerometer and gyroscope data during walking, running, and squatting, highlighting the distinct statistical characteristics of each activity.
In addition to PDFs, first- and second-order statistical quantities such as the mean and variance provide fundamental information about the central tendency and dispersion of sensor readings. For example, higher variance in accelerometer data during running compared to walking reflects more intense movement dynamics. Higher-order statistical quantities, including skewness and kurtosis, offer further insights into the shape of the data distribution, capturing subtle differences that are crucial for fine-grained motion analysis.
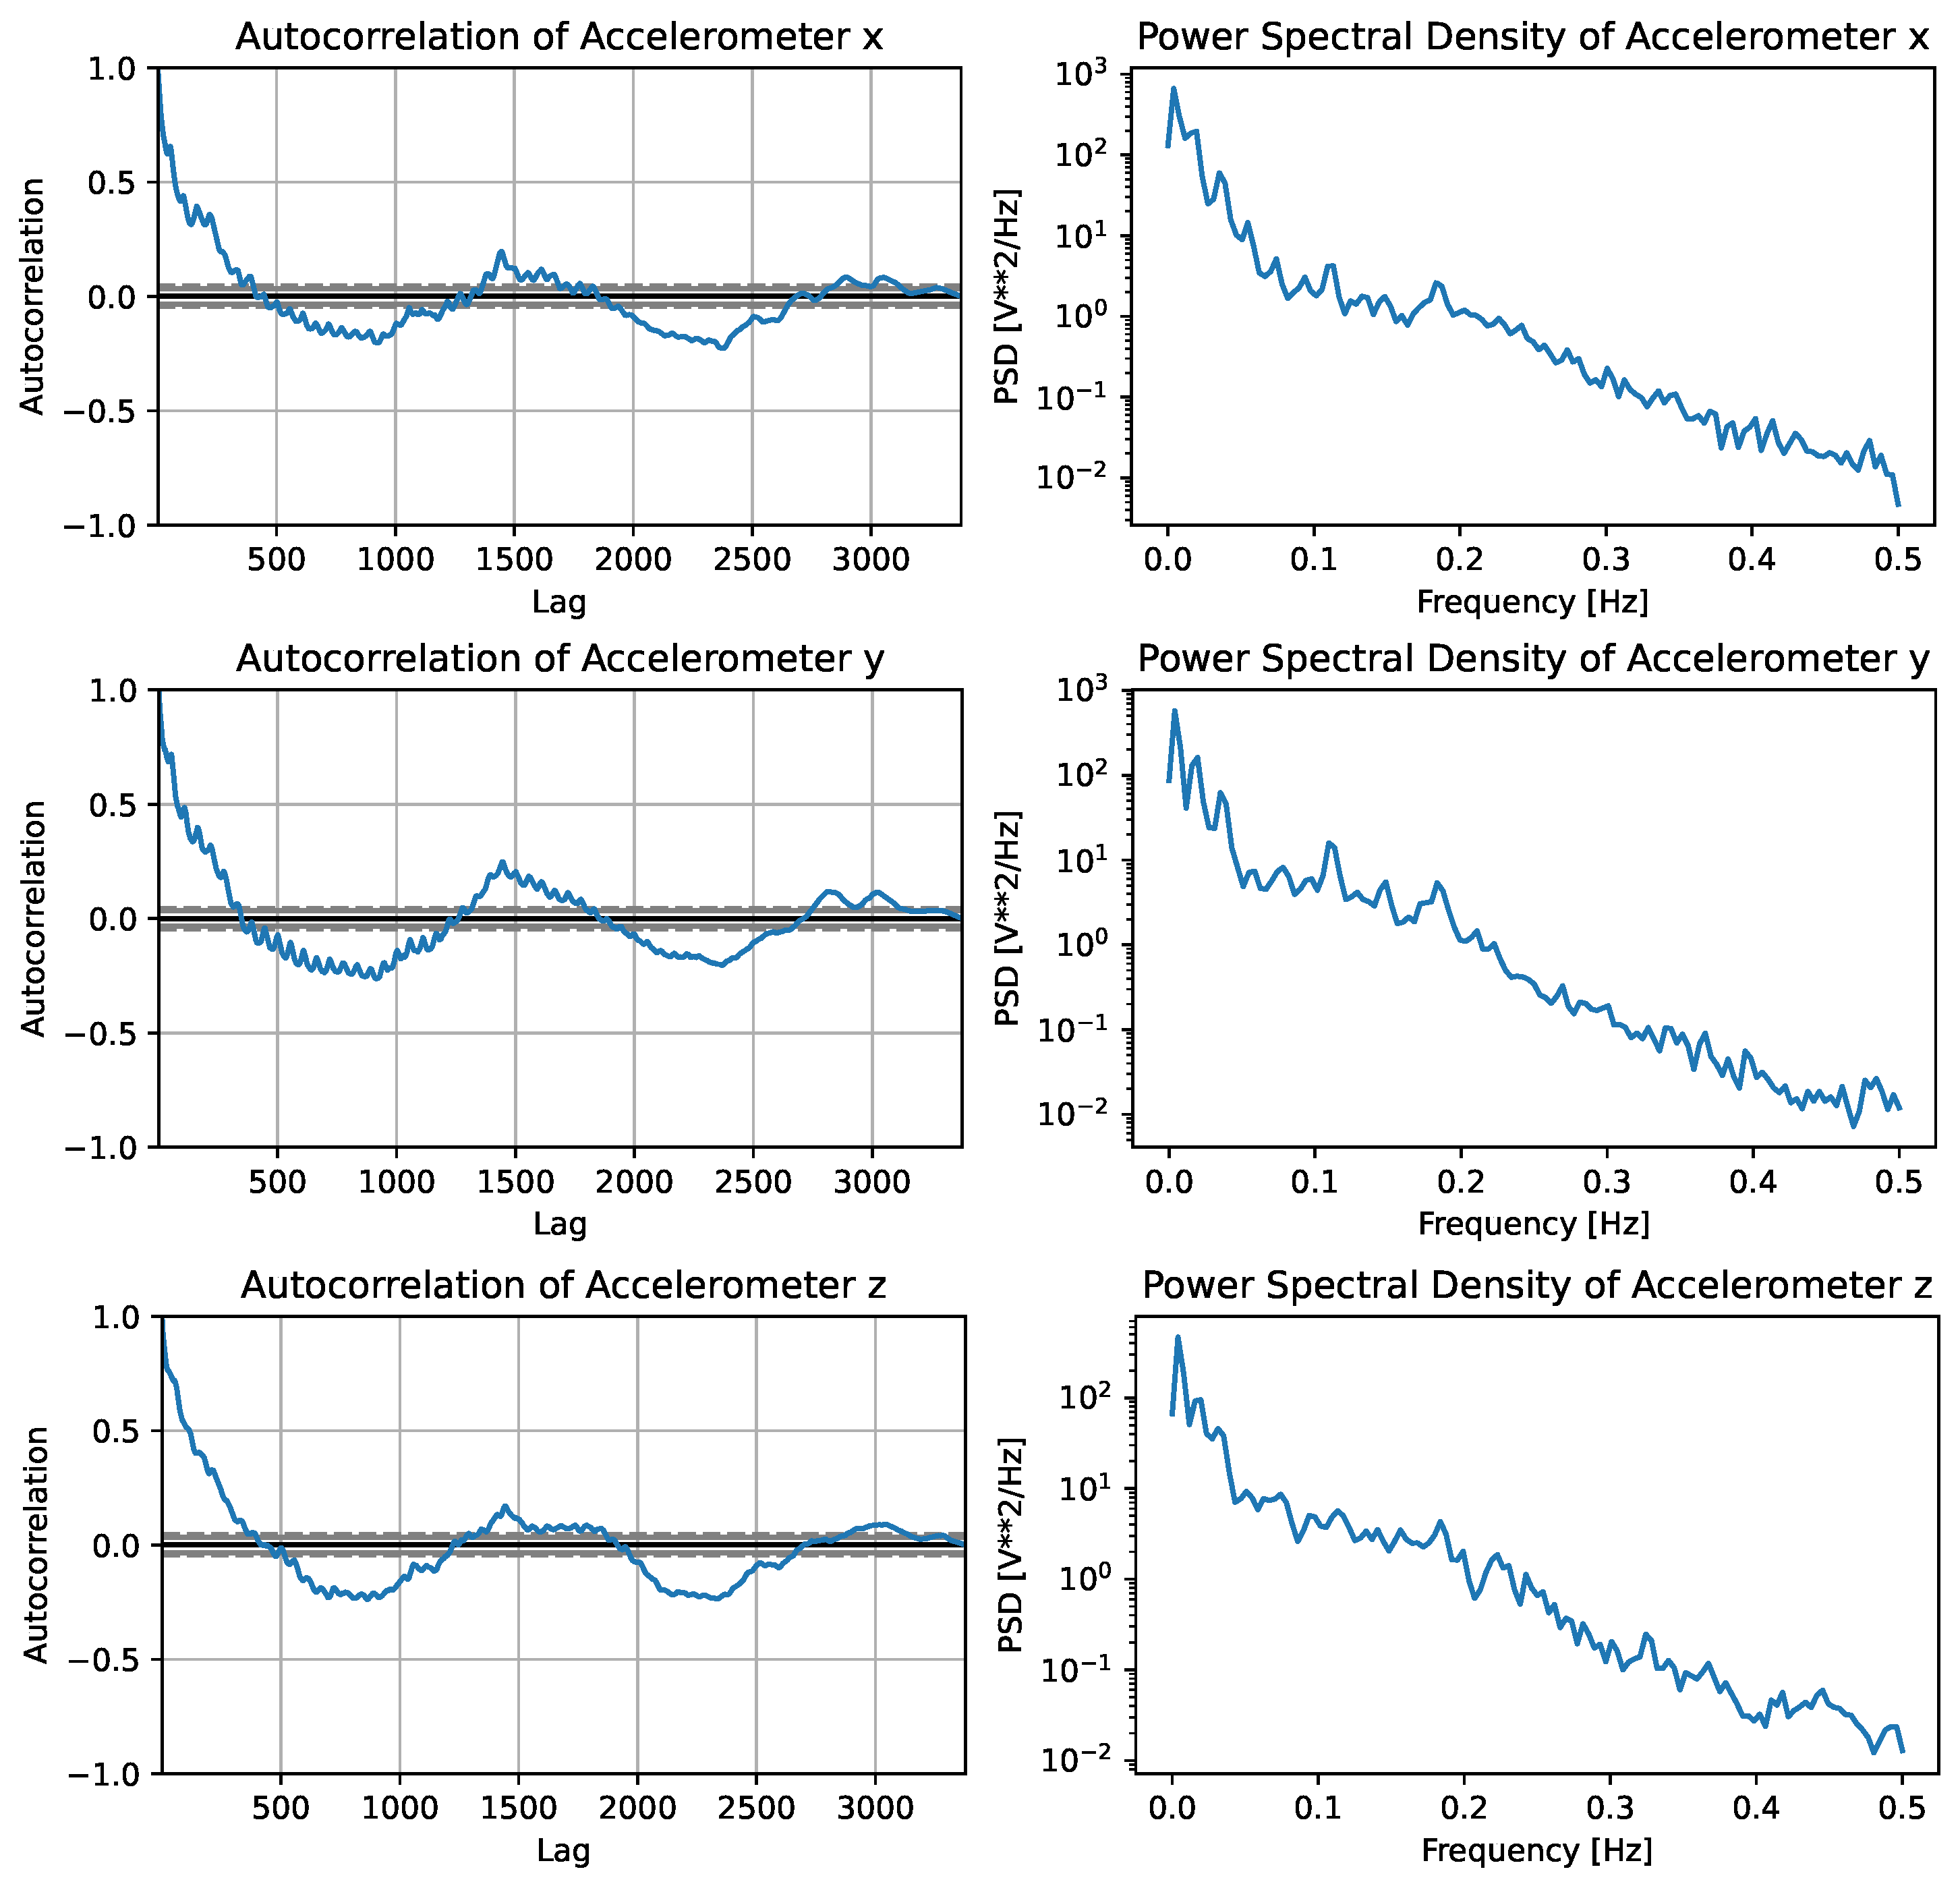
4.2. Temporal Dynamics: Autocorrelation and Power Spectral Density Analysis
Beyond basic statistics, we analyze the temporal dynamics of sensor data through autocorrelation and power spectral density (PSD) plots, such as those shown in
Figure 6. For the accelerometer data along the x axis during walking, we uncovered the following:
Autocorrelation Analysis: The autocorrelation function, which equals 1 at a lag of 0, decreases as the time lag increases. Periodic increases in the autocorrelation at specific lags suggest recurring motion patterns, such as the periodic impact of footsteps.
PSD Analysis: The PSD plot reveals that low-frequency components dominate the signal, and this is consistent with the relatively slow and periodic movements of walking. The rapid decline in the PSD at higher frequencies indicates a lack of high-frequency energy, confirming the absence of abrupt motion changes.
Figure 6.
Autocorrelation coefficients and power spectral density (PSD) of the accelerometer data along the x, y, and z axes during walking.
Figure 6.
Autocorrelation coefficients and power spectral density (PSD) of the accelerometer data along the x, y, and z axes during walking.
For gyroscope data, similar analyses show that rotational dynamics are concentrated in the low-frequency range, with rapidly diminishing correlation over time. These analyses not only validate the consistency of movement patterns but also provide a robust basis for feature extraction in subsequent classification tasks.
4.3. Feature Extraction and Classification
The statistical analyses described above are integral to constructing comprehensive feature vectors. These vectors incorporate a range of computed features, including probability density metrics, mean, variance, skewness, kurtosis, autocorrelation coefficients, and PSD values. In addition, we integrated the raw sensor data into a neural network, thereby enhancing the model’s ability to learn complex patterns.
Feature Vector Construction: Each data sample was transformed into a feature vector that encapsulates the statistical and spectral properties of the sensor data. This vector served as the input for various classification algorithms.
Classifier Selection and Optimization: We experimented with a diverse array of classifiers, including traditional methods (SVM, Decision Trees, and Random Forests) and advanced deep learning architectures (CNN, LSTM, Transformer, Swin Transformer, and TransUNet). Hyperparameters were systematically optimized through grid search and cross-validation, with specific configurations detailed in
Section 5.2.
Computational Efficiency Considerations: Beyond classification accuracy, we evaluated the computational demands of each model—a critical factor for IoT deployments.
The tables below summarize the statistical features extracted from sensor data for different activities, further illustrating the distinct profiles obtained through our comprehensive analysis. In particular,
Table 1 presents the statistical features of walking, which were computed from the accelerometer and gyroscope data during the walking activity,
Table 2 presents the statistical features of running, which were computed from the accelerometer and gyroscope data during the running activity, and
Table 3 presents the statistical features of squatting, which were computed from the accelerometer and gyroscope data during the squatting activity.
4.4. Application of Statistical Methods in Movement State Recognition
Once the statistical properties of the sensor data were established, these features were utilized for movement action recognition. The details of our approach are as follows:
Feature Vector Construction: Creating a feature vector for each sample that includes statistical measures (PDF characteristics, mean, variance, skewness, and kurtosis) and spectral features (autocorrelation and PSD).
Classifier Selection: Evaluating multiple classifiers such as SVM, Random Forest, and neural networks to identify the most suitable model for distinguishing between walking, running, and squatting.
Model Training and Optimization: Training the classification model on labeled sensor data and iteratively optimizing feature selection and model parameters to enhance performance.
Our innovative integration of detailed statistical analysis with modern machine learning methods forms the basis of a robust framework for human activity recognition. This contribution not only improves the accuracy of activity classification but also provides a scalable approach for real-time applications in health monitoring and preventive healthcare.
5. Feature Analysis and Pattern Recognition
In this section, we detail our advanced approach to feature analysis and pattern recognition, which plays a critical role in transforming raw sensor data into actionable insights. Our novel methodology not only leverages conventional time domain and frequency domain features but also introduces innovative combined features that enhance the accuracy and robustness of movement state recognition.
5.1. Feature Analysis
Feature extraction is a fundamental step in signal processing and pattern recognition, aiming to distill the most informative features from raw sensor data for effective classification. In our study, data collected from sensors—specifically accelerometers and gyroscopes—were preprocessed through filtering and normalization to mitigate noise and eliminate redundant information. This rigorous preprocessing ensures that the subsequent feature extraction process yields high-quality inputs for analysis.
We extracted a range of features from the preprocessed data, which were broadly categorized into time domain and frequency domain features. In the time domain, statistical measures such as the mean, variance, peak value, and root mean square were computed. These metrics capture the trends and fluctuations in the sensor data, providing clear distinctions between different movement states. For instance, the variance in accelerometer readings is typically higher during running compared to walking, reflecting more vigorous movement patterns.
In the frequency domain, we converted the time domain signals using Fourier transformation to extract spectral characteristics such as power spectral density, skewness, and kurtosis. These features are vital for identifying periodic patterns and subtle variations in movement, particularly when distinguishing activities with different frequencies like walking versus running.
Furthermore, our approach introduces combined features that integrate data from an Inertial Measurement Unit (IMU) including accelerometers and gyroscopes and merge both time-domain and frequency-domain characteristics. This innovative feature fusion significantly enriches the information content available for subsequent classification tasks, representing a key contribution and novelty of our work.
5.2. Pattern Recognition
Following feature extraction, our study applied a comprehensive ensemble of machine learning and deep learning techniques to accurately classify human activities. We implemented and rigorously evaluated eight distinct algorithms: traditional models (SVM, Decision Trees, and Random Forests) and advanced deep learning architectures (CNN, LSTM, Transformer, Swin Transformer, and TransUNet).Our classification framework integrates both traditional machine learning and deep learning paradigms, creating a hybrid approach that leverages their complementary strengths. Traditional algorithms excel in scenarios with limited data and offer interpretability, while deep learning models capture complex temporal patterns. For the traditional models, we employed feature vectors directly, whereas for the deep learning approaches, we preserved the temporal structure of the data:
CNN: Extracts spatial patterns from sensor signals through convolutional operations.
LSTM: Captures long-term dependencies in sequential data via recurrent connections.
Transformer: Leverages attention mechanisms to model global interactions.
Swin Transformer: Employs hierarchical feature extraction with windowed attention.
TransUNet: Combines CNN’s local feature extraction with Transformer’s global context.
The hyperparameters were optimized through systematic grid search with cross-validation:
CNN: Filter sizes , kernel sizes , dense units .
LSTM: Units , dropout rates , learning rates .
Transformer-based models: Head sizes , number of heads , feedforward dimensions .
This comprehensive evaluation framework addresses the need for robust comparison between traditional and emerging deep learning approaches, particularly advanced Transformer-based architectures that have shown promising results in time series classification tasks.
6. Experimental Results and Analysis
The primary objective of our experiment was to develop and evaluate a robust system for recognizing human movement states (running, squatting, and walking) using smartphone accelerometer and gyroscope data. Our experimental framework encompasses comprehensive preprocessing techniques, statistical validation, and comparative evaluation across traditional and state-of-the-art deep learning models, including recently developed Transformer-based architectures.
6.1. Preprocessing and Filter Parameter Optimization
The collected sensor data underwent rigorous preprocessing through filtering and normalization to improve data quality. A critical advancement in our methodology is the systematic optimization of filter parameters through sensitivity analysis. We evaluated multiple combinations of Kalman filter parameters (process noise and measurement noise ), revealing that optimal noise reduction occurred at and . This configuration significantly reduced random noise while preserving essential signal characteristics.
Figure 7 illustrates Fourier transform plots of the raw, low-pass filtered, high-pass filtered, and Kalman filtered accelerometer data along the x, y, and z axes during running. The optimized Kalman filter effectively attenuated high-frequency noise components while maintaining the fundamental frequency characteristics of the activity signal, demonstrating superior performance compared to traditional low-pass and high-pass filtering approaches.
Further sensitivity analysis on window segmentation length indicated that 30-sample windows provide the optimal balance between temporal resolution and feature stability. Shorter windows failed to capture complete activity cycles, while longer windows introduced class boundary confusion when activities transitioned. This systematic approach to parameter optimization represents a significant methodological contribution of our work.
6.2. Model Training and Performance Evaluation
For pattern recognition, we implemented a comprehensive suite of eight classifiers, including both traditional machine learning algorithms (SVM, Decision Tree, and Random Forest) and advanced deep learning architectures (CNN, LSTM, Transformer, Swin Transformer, and TransUNet). This expanded model comparison addresses previous limitations in the literature regarding Transformer-based architectures and provides a more complete assessment of state-of-the-art approaches. To better suit our HAR task, we adapted the Swin Transformer by adjusting its window-based attention mechanism to align with temporal sensor data segments. Additionally, we modified the TransUNet structure by simplifying the encoder–decoder design for improved efficiency in time series feature extraction.
All models were trained on consistently preprocessed data to ensure fair comparison.
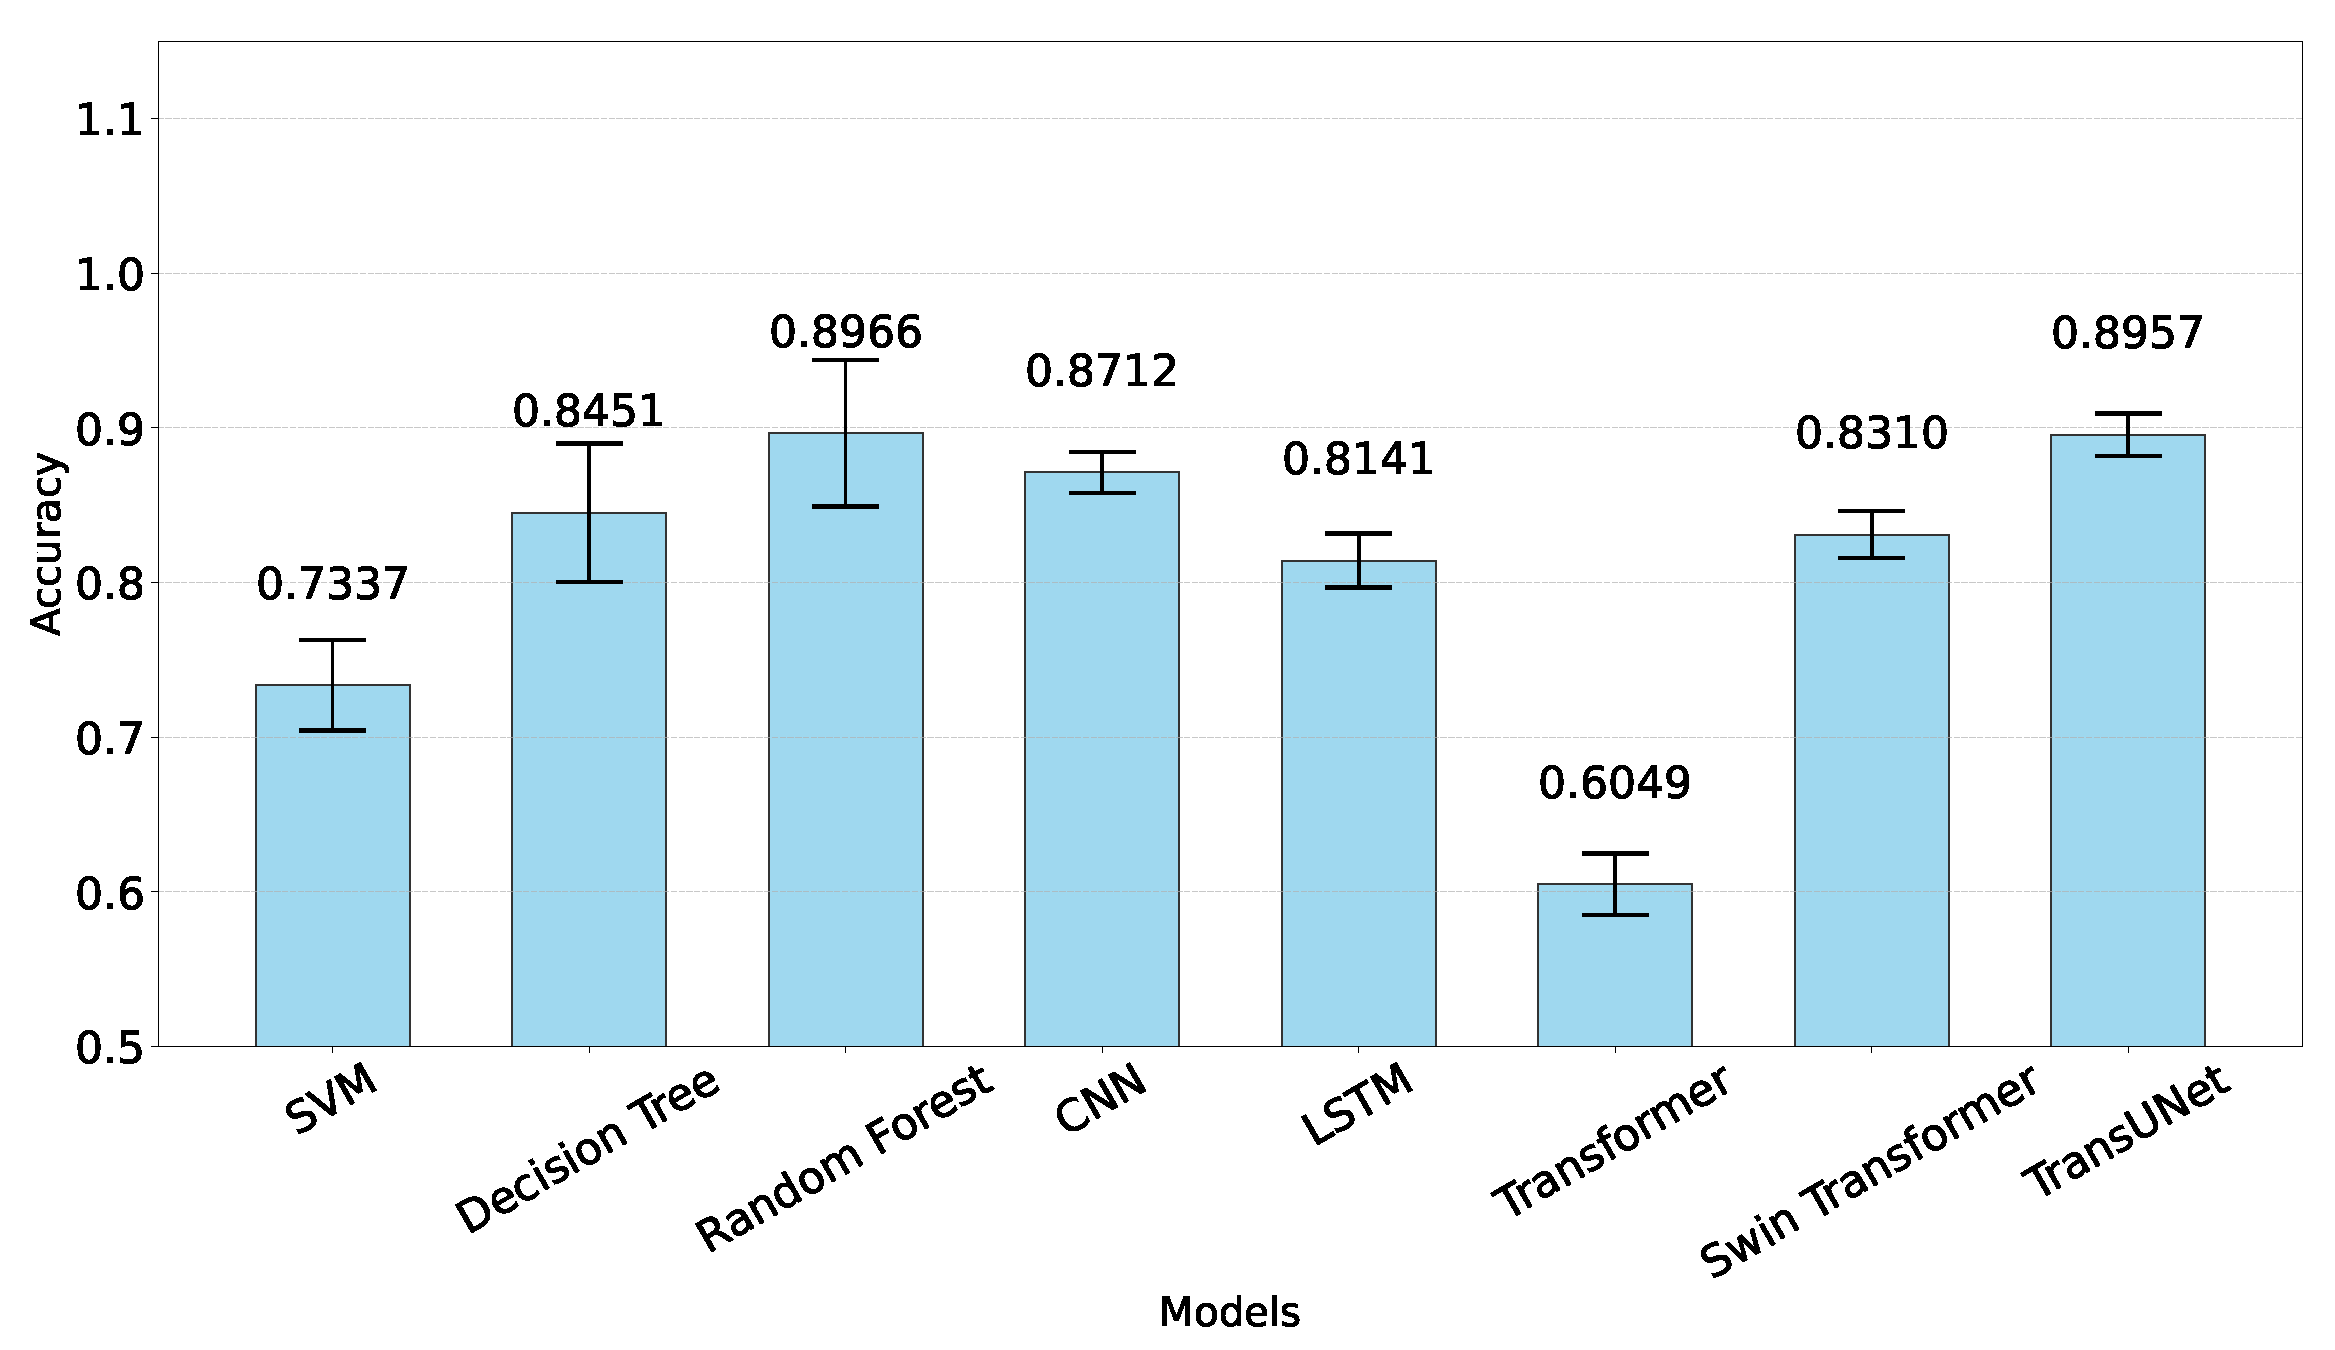
Table 4 presents the classification performance across all evaluated models, with Random Forest achieving the highest accuracy (98.91%), followed closely by TransUNet (91.30%) and Decision Tree (89.13%).
To ensure statistical rigor, we implemented 5-fold cross-validation and conducted ANOVA testing (
,
), confirming that performance differences between models are statistically significant. Subsequent pairwise
t-tests further elucidated specific inter-model differences (
Figure 8), with Random Forest significantly outperforming most other models (
) except TransUNet (
,
), with which it showed comparable performance.
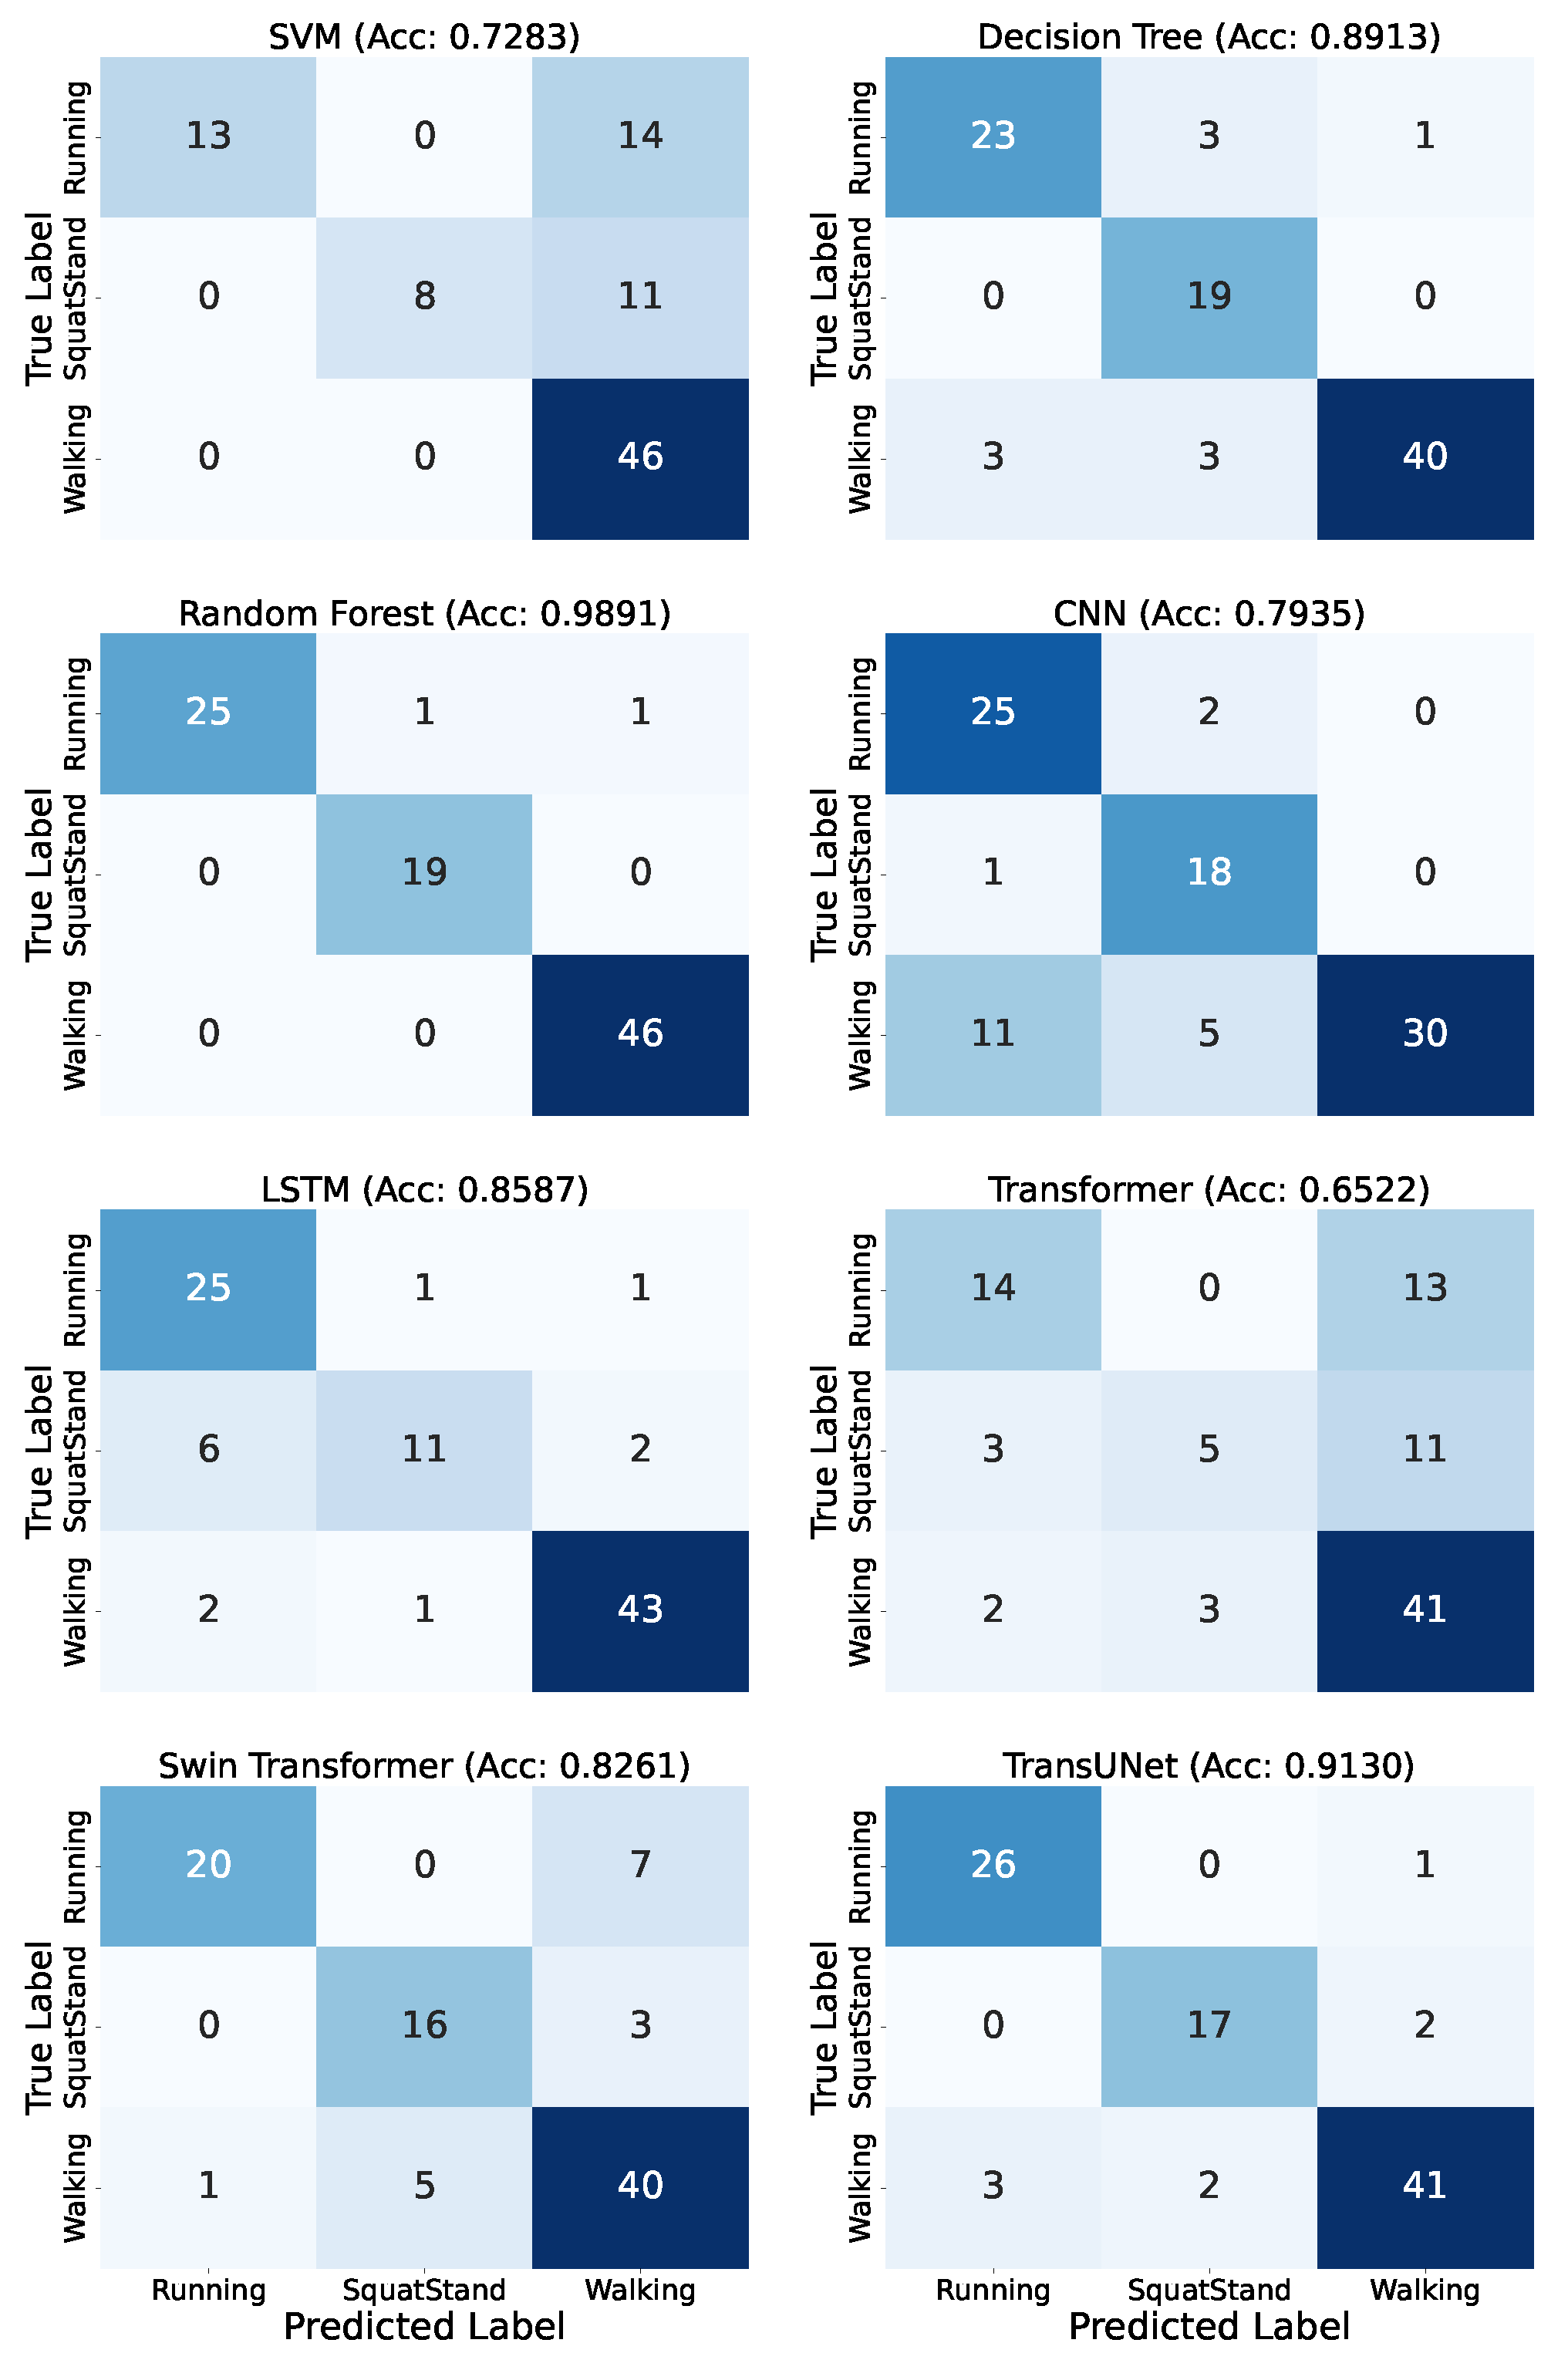
Figure 9 illustrates the classification performance of each model through confusion matrices. The visualization reveals that Random Forest achieved the most balanced classification across all three activities, with minimal misclassifications between classes. Random Forest correctly classified 25 of 27 running instances, all 19 squatting instances, and all walking instances. The TransUNet model showed similarly strong performance, particularly for running activities (26 of 27 correct), demonstrating the potential of hybrid architectures that combine convolutional features with Transformer-based attention mechanisms.
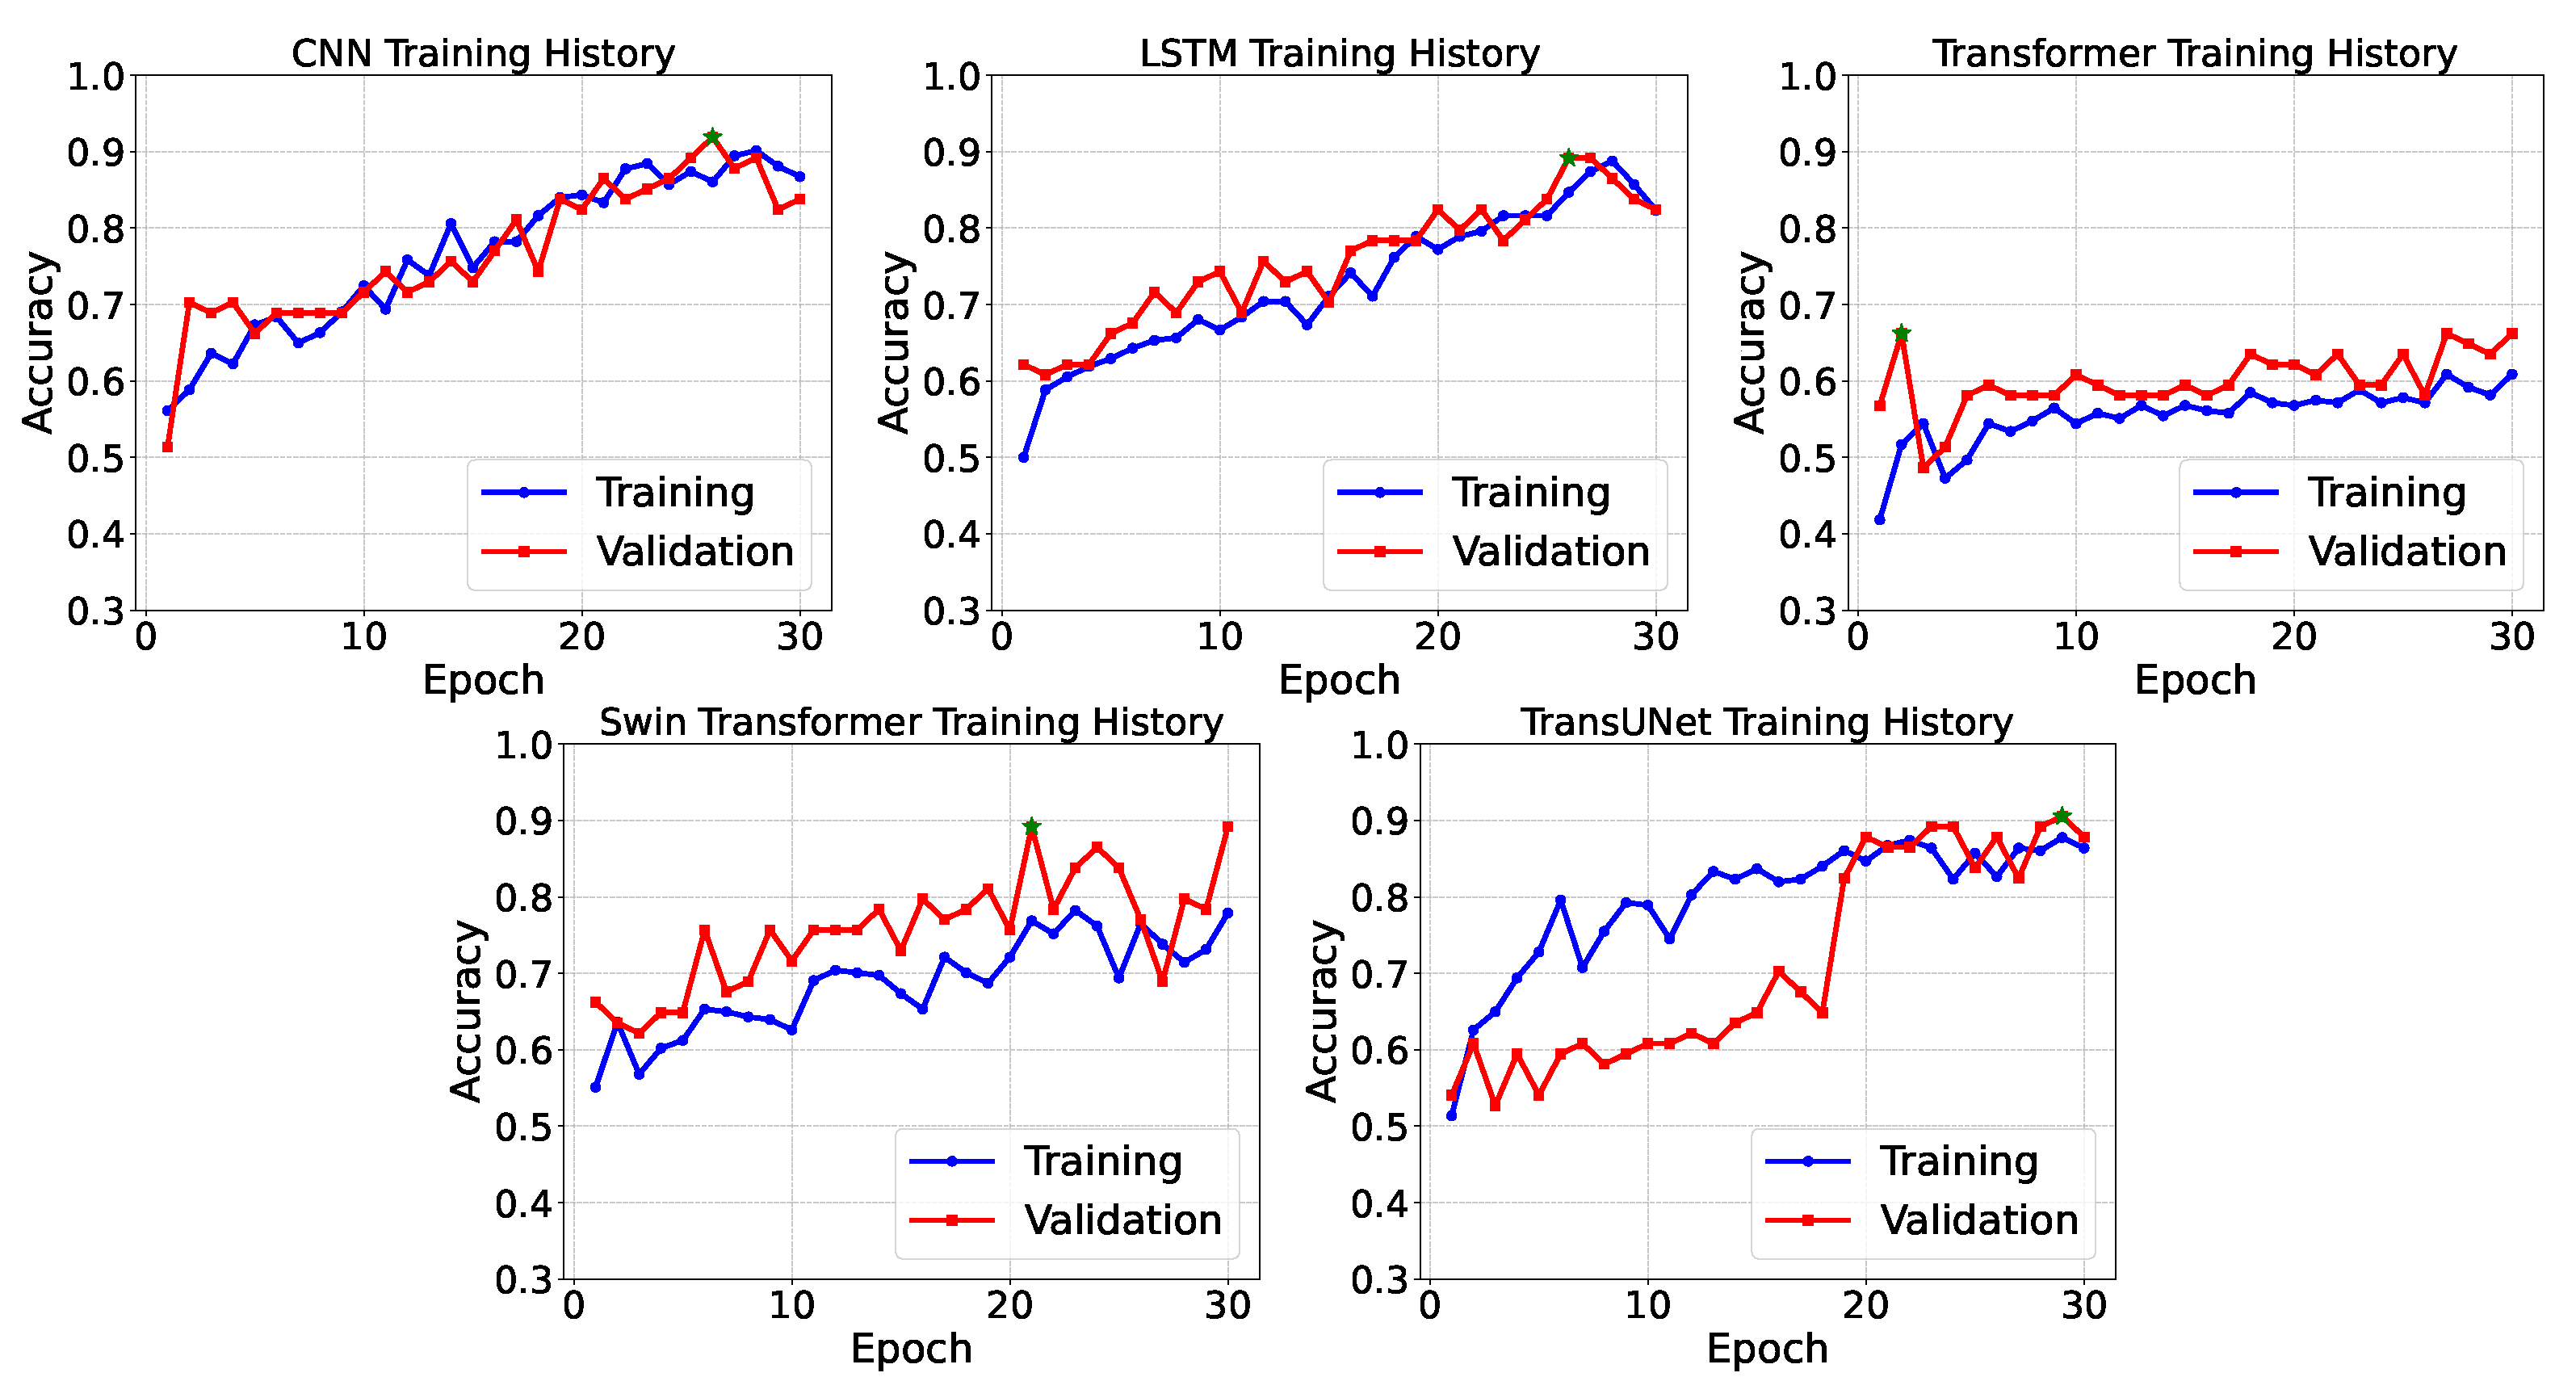
The training dynamics of deep learning models are visualized in
Figure 10, which plots the training and validation accuracy across epochs. The TransUNet model demonstrated the strongest learning progression, achieving a peak validation accuracy of 90.54% at epoch 29. The LSTM and Swin Transformer models showed competitive performance (peak validation accuracies of 89.19% and 89.19%, respectively). In contrast, the standard Transformer model exhibited considerably more modest improvements, with validation accuracy plateauing around 66.22%, suggesting particular challenges in capturing relevant temporal patterns with limited training data.
6.3. Computational Efficiency Analysis
A critical contribution of our study is the comprehensive evaluation of computational efficiency—particularly relevant for resource-constrained IoT applications.
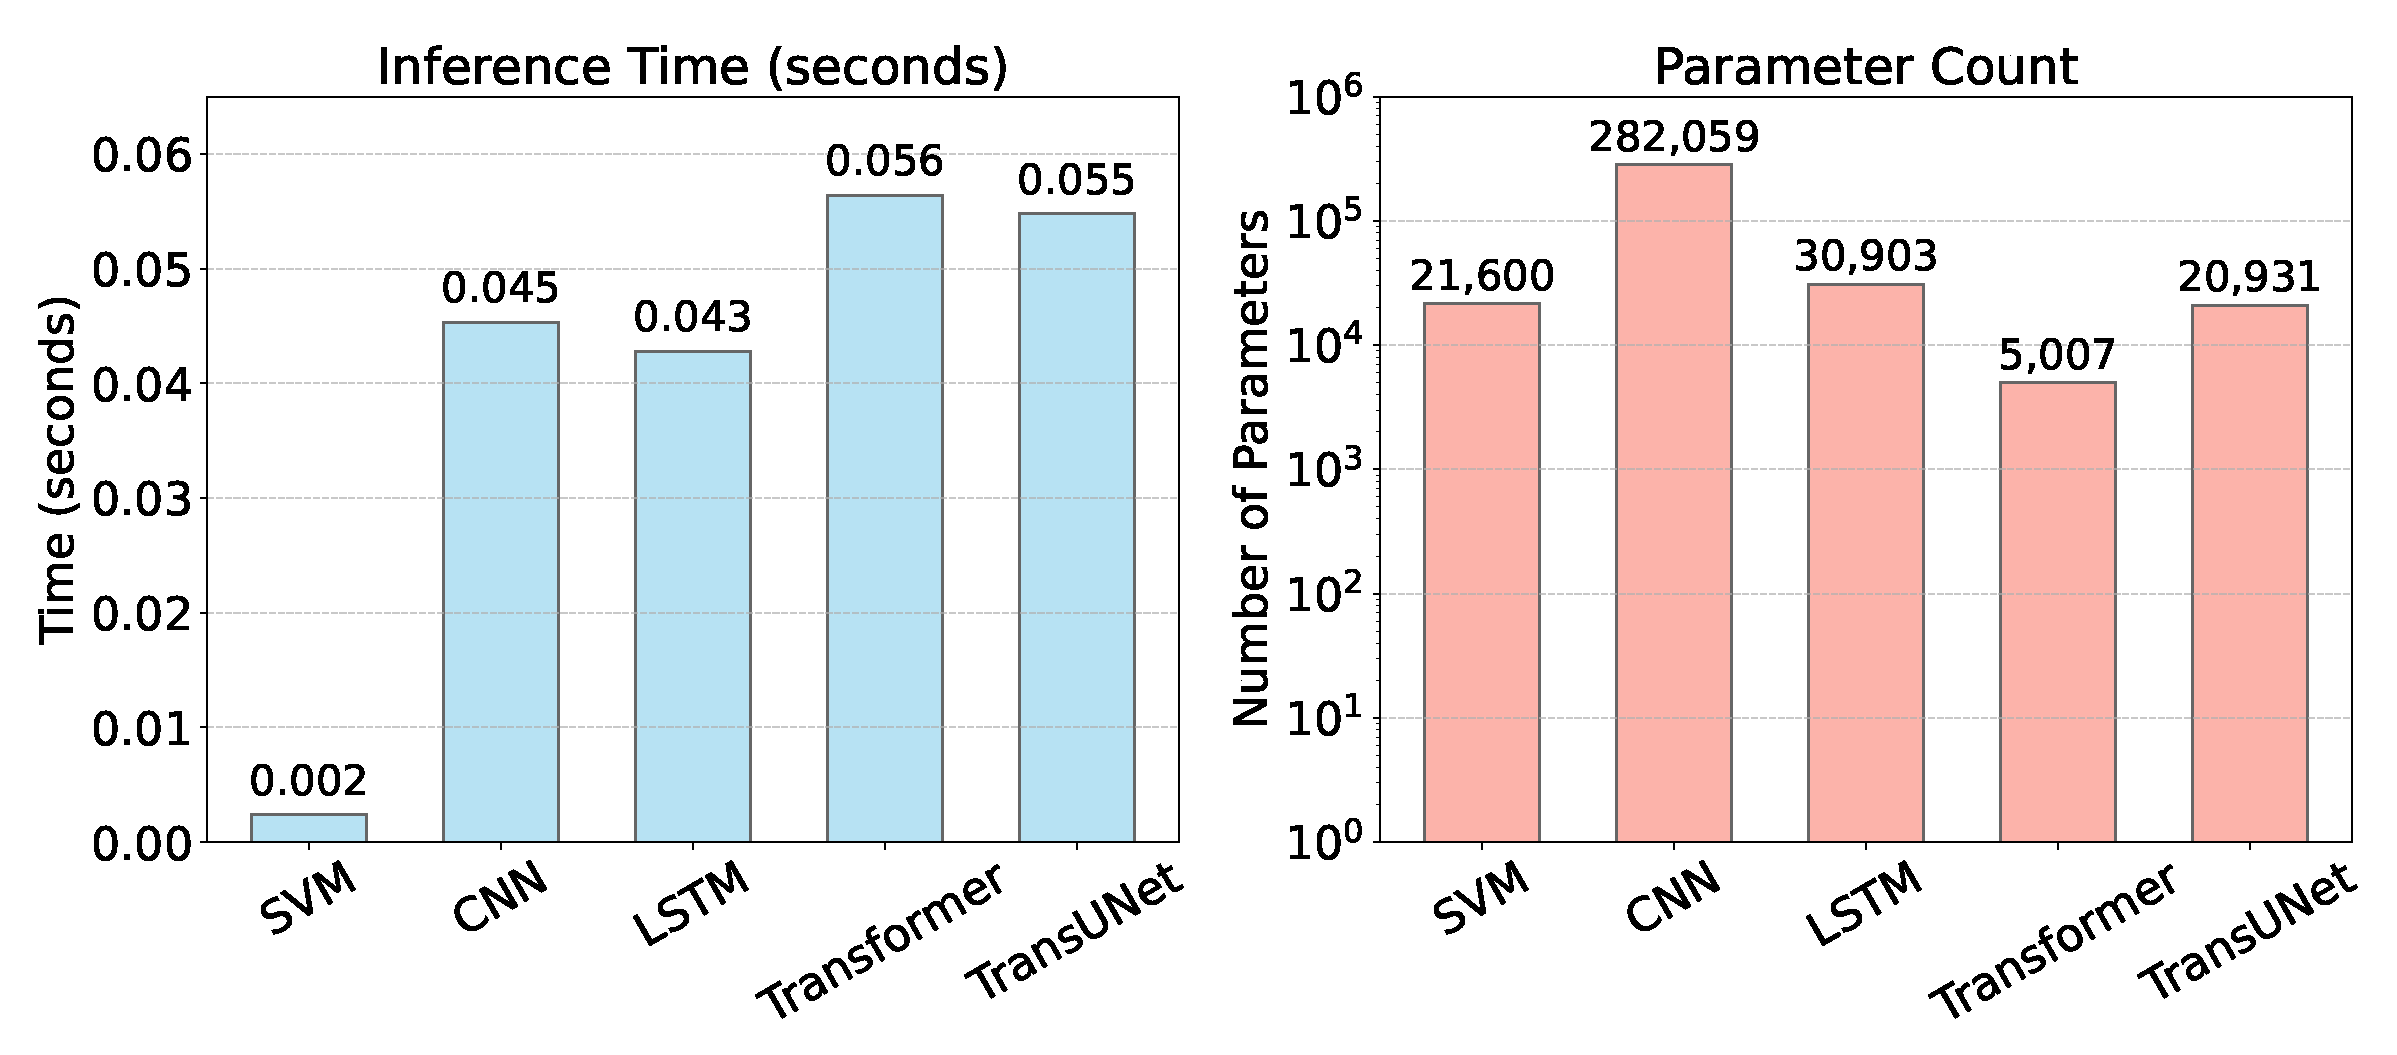
Figure 11 presents a detailed comparison of the inference time and parameter count across all models.
Traditional machine learning models demonstrated superior efficiency, with Decision Tree achieving exceptional performance (inference time: 0.00033 s, parameters: 189, as shown in
Figure 12) while maintaining strong accuracy. Despite its superior classification performance, Random Forest required moderately higher computational resources (inference time: 0.00574 s, parameters: 18,486). In stark contrast, all deep learning models exhibited substantially greater computational demands, with Swin Transformer having the longest inference time (0.06217 s) and CNN the highest parameter count (282,059).
This efficiency analysis reveals a crucial tradeoff in IoT applications: while deep learning models theoretically offer superior representation capacity, their practical deployment incurs substantial computational overhead. These findings are particularly relevant for edge computing scenarios where processing power and energy consumption are constrained.
6.4. Ablation Studies and Hyperparameter Optimization
To address the critical need for methodological transparency, we conducted systematic ablation studies and hyperparameter optimization experiments. Specifically, we compared four preprocessing configurations: (1) raw data, (2) Kalman filtering only, (3) normalization only, and (4) a combination of Kalman filtering and normalization. The complete pipeline consistently outperformed partial implementations by 8.2–14.7%, highlighting the synergistic effect of noise reduction and feature normalization.
For hyperparameter optimization, we employed grid search with cross-validation across all models. For CNN, we systematically evaluated filter sizes , kernel sizes , dense units , and learning rates . The best performance was observed when filters were set to 64, kernel size to 3, dense units to 100, and learning rate to 0.001.
Similar optimization procedures were applied to the LSTM model, where the number of units , dropout rates , and learning rates were explored. The Transformer-based models were also tuned following a similar approach. These comprehensive hyperparameter analyses improved model performance and offered insights into the sensitivity of different architectures to variations in parameter settings.
6.5. Analysis of Model Performance Differences
An intriguing aspect of our findings is that traditional machine learning models, particularly Random Forest, outperformed more complex deep learning architectures despite the latter’s theoretical advantages in representation capacity. Several factors contribute to this phenomenon:
Data Volume Limitations: Deep learning models typically require larger datasets to generalize effectively. Our experiment utilized a moderate-sized dataset (92 test samples), potentially limiting the full expression of deep learning capabilities. This is evidenced by the cross-validation results, where CNN showed higher mean accuracy (87.12%) than its test accuracy (79.35%), suggesting some overfitting.
Feature Engineering Effectiveness: Random Forest’s superior performance underscores the value of our statistical feature extraction approach. The handcrafted features effectively capture the discriminative characteristics of different activities, providing Random Forest with highly informative inputs that may obviate the need for deep learning’s automatic feature extraction.
Model–Data Compatibility: The ensemble nature of Random Forest, with its ability to handle non-linear relationships and feature interactions without making strong assumptions about data distribution, appears particularly well suited to human activity recognition data, which exhibit both statistical regularities and stochastic variations.
Architectural Limitations: Standard Transformer models struggled the most (65.22% accuracy), which was likely due to their reliance on global attention mechanisms that may not be optimal for capturing the localized patterns in activity data. In contrast, TransUNet’s hybrid architecture (91.30% accuracy) successfully combines convolutional feature extraction with Transformer modules, approaching Random Forest’s performance.
These findings highlight an important consideration for IoT applications: the most sophisticated model is not always the most effective, particularly when computational efficiency is considered alongside accuracy. Random Forest offers an optimal balance of accuracy, interpretability, and efficiency for this specific activity recognition task.
In summary, our experimental results validate the efficacy of our integrated system in recognizing human activity states with high accuracy and computational efficiency. The comprehensive evaluation across traditional and deep learning models, combined with statistical validation and efficiency analysis, provides valuable insights for deploying activity recognition systems in real-world IoT environments with varying resource constraints.
7. Discussion and Future Work
Our experimental results confirm that the developed application is capable of accurately distinguishing between walking, running, and squatting states using data from Android smartphone sensors. However, it is important to acknowledge potential limitations of our approach. Under extreme noise conditions, such as highly dynamic environments with significant electromagnetic interference or sensor disturbances, the recognition accuracy may decrease due to the reduced efficacy of filtering techniques. Additionally, variations in sensor configurations across different smartphone models or placements (e.g., orientation, mounting positions, etc.) might lead to discrepancies in recognition performance. Future work will address these limitations by exploring adaptive filtering methods, robust feature extraction algorithms, and techniques that enable the system to generalize across diverse sensor setups and challenging operational environments.
The contributions of our work extend beyond technical performance. The system provides practical tools for health monitoring, sports training, and rehabilitation therapy by enabling real-time tracking and analysis of motion patterns. Our approach also demonstrates the potential for personalized activity recognition by adapting to diverse user profiles through further data collection and advanced machine learning techniques. Future work will focus on refining feature extraction algorithms, enhancing model generalization across varied environments and users and improving user interface design to offer real-time feedback and comprehensive progress tracking. Additionally, addressing data security and privacy through robust measures and adherence to regulatory standards will be pivotal as the application scales to broader usage scenarios, such as fall detection for the elderly, child activity monitoring, and behavioral analysis in security fields.
8. Conclusions
This study successfully demonstrates the feasibility and effectiveness of using existing smartphone sensors for complex motion recognition. Our application accurately identifies and differentiates between walking, running, and squatting states by combining rigorous data preprocessing, advanced filtering, and a hybrid approach that integrates statistical analysis with state-of-the-art pattern recognition methods. The universal availability of accelerometers and gyroscopes in modern smartphones underlines the broad accessibility of our solution, enabling users to monitor daily motion patterns without additional hardware.
The experimental results show that traditional classifiers such as Random Forests can achieve high accuracy and efficiency in the task of this paper, while deep learning methods require more computing resources and longer training time. In contrast, traditional methods provide higher interpretability and lower computing requirements, making them suitable for real-time applications and devices with limited computing power. This tradeoff is a key consideration for practical deployment in various IoT scenarios.
In summary, the major contributions of this work include the innovative integration of stochastic process analysis with machine learning techniques, the effective reduction in sensor noise through optimized Kalman filtering, and the practical implementation of a scalable, real-time activity recognition system. These advancements not only enhance the accuracy and reliability of motion state recognition but also open new avenues for applications in health management, sports, and rehabilitation, making a significant impact on the field of human activity recognition.


