Abstract
The application of intelligent and connected technologies, such as vehicle-to-everything (V2X), profoundly influences car-following behavior and traffic flow characteristics. While empirical studies have demonstrated that the car-following behavior is affected by the vehicles in the adjacent lanes, there is no car-following model that comprehensively incorporates the leading and following neighboring vehicles, including those in the adjacent lanes. Under the conditions of intelligent and connected technologies penetration, the information regarding the aforementioned vehicles can be accessed and applied in the car-following process. However, the absence of the corresponding car-following model limits the understanding of traffic flow characteristics under this condition, particularly concerning critical stability characteristics. To address this research gap, a new car-following model is proposed, which integrates the neighboring leading vehicles in the current and adjacent lances, marked as the surrounding leading vehicle (SLV), and the rear vehicle in the current lane. The linear stability analysis and nonlinear analysis of the proposed model, as well as the numerical simulation of the propagation process of disturbance in the vehicle fleet, are conducted. Based on this, the stability and evolution characteristics of the traffic flow are explored. The results of theoretical and simulation analysis consistently suggest that the integration of the motion state information of the SLV and the rear vehicle can effectively stabilize the traffic flow, which means that traffic congestion can be alleviated and transportation efficiency will be improved. This research can provide references for the research fields including traffic flow theory and is of significant importance for alleviating and mitigating traffic congestion under the condition of intelligent and connected vehicle (CAV) penetration.
1. Introduction
Currently, traffic congestion has become a global issue due to the continuous increase in vehicles. Previous measures, such as the extension of road infrastructure, have been producing less and less effect. On the basis of the limited traffic resources, understanding the generation and evolution properties of traffic congestion through exploring the operation mechanism of traffic flow that is vital for alleviating traffic congestion is the current research emphasis in the research field of traffic flow theory. Car-following models are the vital fundamental theory to achieve this understanding, and they have received increasing attention, and various car-following models have been proposed [1,2,3,4,5,6,7,8,9]. These models describe the interaction between the following vehicle and its preceding vehicle from different perspectives [10,11]. Recently, with the applications of V2X and other intelligent and connected technologies, massive traffic information, including the motion state of multi-preceding vehicles and the rear vehicle, can be accessed by the vehicles and drivers, and their car-following behavior will be adjusted according to this information. The changes in car-following behavior at the micro-level will result in a difference in traffic flow characteristics at the macro-level. Based on the above contents, impact exerted by the respective motion state information (including velocity, acceleration, and position) of individual preceding vehicles in the lane, in which the subject vehicle is driving, on the car-following behavior and the traffic flow were explored in [12,13,14,15,16,17,18,19,20]. Additionally, the influence exerted by overall motion state information (such as average velocity and average headway) of preceding vehicles in the lane, in which the subject vehicle is driving, was studied in [21,22,23,24,25]. On the other hand, according to driving experience and common sense, the car-following behavior is not only affected by the aforementioned preceding vehicles but also the rear vehicle. This phenomenon is defined as the “looking backward effect” [26,27,28,29,30].
The aforementioned studies developed car-following models that incorporate either the individual or overall motion states of the n preceding vehicles in the current lane. Moreover, subsequent studies have demonstrated that car-following behavior is also influenced by the “looking backward effect” and exhibits a diminishing marginal utility with respect to the number of considered preceding vehicles [31,32,33,34,35,36]. Specifically, incorporating the motion of the near vehicle in front achieves substantial performance gains, whereas further integration of more preceding vehicles yields disproportionately limited benefits relative to the associated sensing, communication, and computational costs. Most critically, recent empirical studies [37,38,39] have confirmed that the car-following behavior of the subject vehicle is affected not only by preceding vehicles in its current lane but also by those in adjacent lanes. However, up to now, there is no car-following model comprehensively considering the near vehicles in front both in the current and the adjacent lanes, as well as the “looking back effect”, which hinders the understanding of traffic flow characteristics. To address this research gap, this study proposes a new car-following model that comprehensively considers the SLV and the rear vehicle in the current lane. Moreover, the linear stability and nonlinear evolution characteristics of traffic flow under the corresponding conditions are derived and analyzed based on this model. Numerical simulations are performed to validate the theoretical analysis and derived results. The following highlights distinguish this study from existing ones:
- (1)
- A new car-following model is proposed to comprehensively incorporate the SLV as well as the “looking backward effect”;
- (2)
- Linear stability analysis is conducted, the neutral stability conditions for traffic flow are given, and the impacts of various factors related to the SLV on traffic flow stability are systematically discussed;
- (3)
- Nonlinear analysis is carried out, and the modified Korteweg de Vries (mKdV) equation is derived to explore the propagation characteristics of density waves in traffic flow.
The remainder of this paper is organized as follows. In Section 2, the extended car-following model is constructed. In Section 3, the neutral stability condition is derived through a linear stability analysis. In Section 4, nonlinear analysis is conducted based on the reductive perturbation method. In Section 5, a numerical simulation of disturbance propagation in traffic systems is carried out. Based on these efforts, the impact exerted by the motion state information of the SLV and the rear vehicle on car-following behavior and traffic flow is explored. The research results are discussed in Section 6, and the conclusion is given in Section 7.
2. Literature Review
The existing car-following models primarily focus on the motion state information of the preceding and following vehicles in the current lane that the subject vehicle is driving in. These achievements make a significant contribution to understanding traffic flow characteristics under different conditions.
2.1. Previous Car-Following Models Considering the Preceding Vehicles
Nagatani proposed an extended car-following model that considers the leading vehicle and the second leading vehicle in the current lane, exploring the impact of the second vehicle’s influence on traffic flow stability [12]. Lenz et al. introduced the first car-following model that considers the vehicles ahead in the current lane [13]. Specifically, Lenz et al. input the headways between the vehicles ahead and the subject vehicle into the optimal velocity function to construct an extended optimal velocity (OV) model. Ge et al. presented a similar extended OV model that also considers the positional information of the vehicles ahead [14]. Unlike the model proposed in [13], in the model established in [14], the headways between the vehicles ahead and the subject vehicle are summed with weights and then input into the optimal velocity function. Li et al. focused on the relative velocity of the vehicles ahead in the current lane rather than the headway, developing an extended full velocity difference (FVD) model [15]. Yu et al. constructed an extended FVD model that considers the headway between each pair of vehicles ahead [16]. Based on the aforementioned studies, Xie et al. developed an extended OV model that simultaneously considers the relative velocity and the headway between the vehicles ahead in the current lane [17]. Peng and Sun established an extended FVD model that incorporates the headways and velocity differences between the vehicles ahead [18], analyzing the stability and nonlinear characteristics of traffic flow consisting of vehicles controlled by the proposed model in a dedicated study [19]. Li et al. proposed an extended FVD model that comprehensively considers the headway, relative velocity, and acceleration differences of the vehicles ahead in the current lane [20].
Compared to the aforementioned studies that consider the individual motion state information of the vehicles ahead in the current lane, some researchers argue that car-following behavior places greater emphasis on the overall motion state information of the vehicles ahead. Sun et al. developed an extended FVD model that considers the average velocity of the vehicles ahead in the current lane and subsequently analyzed the stability and nonlinear characteristics of traffic flow under this condition [21]. Kuang et al. similarly constructed an extended FVD model that takes into account the overall motion state of the vehicles ahead [22]. Unlike the model proposed in [21], the model established in [22] integrates the average headway of the vehicles ahead. Guo et al. incorporated the average field velocity of the vehicles ahead into the car-following model [23]. Zhu et al. focused on the average optimized velocity of the vehicles ahead, constructing an extended FVD model and analyzing the stability characteristics of traffic flow under this condition [24]. On the basis of these studies, Kuang et al. further integrated the average driving velocity and average optimal velocity to establish an extended FVD model [25].
In the aforementioned studies, the stability and nonlinear characteristics of traffic flow composed of vehicles controlled by the individual or motion state information of the vehicles ahead were analyzed. The results suggest that as the value of increases, it generally leads to a more positive impact on traffic flow stability. However, in practical traffic systems, an increase in inevitably results in a substantial rise in associated costs related to perception, communication, transmission, computation, and so forth. Motivated by this, studies [31,32,33,34,35,36] explored the performance of traffic flow when is limited to 2. The results demonstrate that can achieve a considerable optimization effect on traffic flow stability. In other words, the positive impact on traffic flow stability resulting from an increase in the value of exhibits a characteristic “marginal effect”.
2.2. Previous Car-Following Models Considering the “Looking Back Effect”
Nakayama et al. developed the first car-following model that considers the vehicle behind the subject vehicle in the current lane, demonstrating the influence of the rear vehicle on the subject vehicle’s car-following behavior on the basis of the constructed extended OV model [26]. Moreover, the impacts of the rear vehicle on the car-following behavior of the subject vehicle are defined as the “looking back effect”. Based on the model proposed in [26], Hasede et al. further incorporated the headway of the vehicles ahead and the vehicles behind in the current lane, constructing an extended OV model [27]. Unlike the approach in [27], Yu et al. embedded the relative velocities between the vehicles ahead and vehicles behind into the FVD model, creating an extended model to analyze traffic flow characteristics [28]. Considering that the influence of the nearest following vehicle is the greatest, Sun et al. incorporated the “looking back effect” into an extended OV model that considers the headway and velocity difference information of the vehicles ahead, thus constructing a new model to analyze traffic flow stability [29]. Subsequently, Sun et al. integrated the “looking back effect” into the FVD model, proposing a black-looking velocity difference (BLVD) model [30].
2.3. Summary
In refs. [12,13,14,15,16,17,18,19,20,21,22,23,24,25], a series of car-following models integrated with the individual or overall motion state information of the vehicles ahead in the current lane has been proposed, with corresponding stability analyses conducted. This is of significant importance for understanding the stability and nonlinear evolution characteristics of traffic flow under different conditions. Recently, empirical studies have confirmed that not only the preceding vehicles in the current lane but also those in adjacent lanes influence the car-following behavior of the subject vehicle [37,38,39]. Furthermore, the aforementioned studies [26,27,28,29,30] demonstrated that the “looking back effect” also impacts car-following behavior and integrated this effect into various extended car-following models that only consider the vehicles ahead in the current lane. However, up to now, there is no car-following model that comprehensively incorporates multiple vehicles ahead, including those in adjacent lanes, as well as the “looking back effect”. Additionally, there is no further consideration of a car-following model that encompasses the marginal effect of the benefits of integrating many more vehicles ahead in the current lane [31,32,33,34,35,36], which hinders the understanding of the characteristics of traffic flow under the penetration of technologies, such as intelligent transportation systems (ITSs), V2X, and CAV, as well as the advancement of traffic flow theory.
3. Car-Following Model
3.1. Hypothesis
- (1)
- The drivers and vehicles are homogeneous;
- (2)
- The road traffic environment adheres to strict lane discipline;
- (3)
- The impact of road and weather conditions is low to none.
3.2. Modeling
According to [40], a general form of the car-following model is given as
where is the acceleration of the subject vehicle and is the stimulus function. It is described in Equation (1) that the car-following behavior of the subject vehicle is the result of multiple factors, including velocity , headway , and relative velocity , which depend on the specific integrated factors when modeling the car-following behavior.
Under the conditions of V2X technologies and CAV penetration, it is necessary to propose an extended form of Equation (1) to encompass abundant information in order to adapt to the new environment. In our previous research [10], an extended form was proposed, which is as follows:
where is a function of the position information for the vehicle in the lane within the system, representing the specific consideration of the corresponding car-following model regarding position information; is similar to ; encompasses the acceleration information of vehicles in the system, as considered by the specific car-following model; and signifies other information considered in the V2X environment, such as driver types.
Compared with Equation (1), the extended form in Equation (2) presents that vehicles are able to access additional information and apply this information to car-following behaviors in the V2X environment. Utilizing this general form, a new car-following model can be established by integrating the new factors and conducting several steps of derivation. To achieve this, an analysis of the characteristics of car-following behavior under the conditions involved in this study is given as follows.
A good agreement between the previous research and the driving experience confirms that drivers will not only focus on the vehicle ahead but also pay attention to multiple leading vehicles and the rear vehicle when they are in a car-following state. The impacts of the vehicles in the adjacent lanes on the subject vehicle’s car-following behavior have been confirmed in [37,38,39]. More importantly, with the application of CAV technologies, represented by V2X, vehicles and drivers can obtain motion state information of the arbitrary number of vehicles ahead and behind and adjust their car-following behavior according to the information. Compared with the arbitrary number of vehicles, drivers will pay more attention to the vehicles surrounding them, such as the front vehicle, the non-neighboring front vehicle, the rear vehicle, and the left/right front vehicle [10,11,41], which is because the influence of these vehicles on car-following behavior is more significant. Among the vehicles mentioned above, the primary concern of the driver is with various motion state information, such as the headway between it and its nearest leading vehicle within the same lane to avoid collision, which is determined by the characteristic that the primary interest of any driver is safety. Based on that, the driver will also pay attention to other vehicles of the aforementioned vehicle group to optimize their car-following behavior. Motivated by these, the SLV is employed to represent the front vehicles, including the front vehicle, the non-neighboring front vehicle, and the left/right front vehicle, of the group, average velocity is used to express their overall motion state, and the headway between the subject vehicle and its rear vehicle as well as the optimal velocity is employed to represent the motion state of the rear vehicle.
Based on the above analysis, an extended car-following model named the surrounding leading vehicle and the rear vehicle (SLVRV) model can be established on the basis of Equation (2).
According to [4,42], the first-order differential form of Equation (3) is
Linearize Equation (4) and perform the first-order and second-order Taylor expansion to the linearized form, and the proposed model can be formulated as
where , , , , and are the sensitivity of the driver, which, respectively, denote the intensity of the driver adjusting his car-following behavior according to the corresponding information. In the SLVRV model, the drivers are assumed to be identical and take the same reaction corresponding to the same information, which is expressed by constant sensitivity. and are the forward and backward optimal velocity functions, respectively. is the average velocity of the SLV and , where , , , and are the velocities of the front vehicle, non-neighboring front vehicle, and left and right front vehicles in adjacent lanes. According to references [27,29], the optimal velocity function employed in the SLVRV model is as follows:
where , , , and are constant parameters.
4. Linear Stability Analysis
To explore the impact of motion state information of the SLV and the rear vehicle on traffic flow, the neutral stability condition of the SLVRV model is derived based on linear stability analysis.
For the vehicle fleet that is at an equilibrium state (i.e., all vehicles in the fleet with the same velocity and headway) in the system, a disturbance emerges when one of the vehicles alters its motion state and then propagates into the system. The investigation of propagation characteristics of the disturbance in the system is the core of the traffic flow stability study.
Assuming that all vehicles in the system are in the same stable state (i.e., all vehicles with the same headway and the same velocity ) at the initial moment, the position of the vehicle can be expressed as follows:
where . is the total length of the road and is the total number of vehicles. is the optimal velocity.
Exert a small disturbance into the stable system to make the system deviate from the initial stable state. Then, the position of the vehicle can be represented as follows:
Via substituting Equations (8) and (9) into Equation (5) and linearizing the result, the SLVRV model’s expression can be rewritten as follows:
where and . When all vehicles in the system are at the same stable state, one can obtain .
By substituting into Equation (10), we obtain
By expanding and inserting the first- and second-order terms and into Equation (11), one can obtain
The uniformly stable state traffic flow will be unstable if , while the uniformly stable state traffic flow can remain stable if . Therefore, the neutral stability condition can be given as follows:
By substituting into Equation (14), one can obtain
Let and , and Equation (15) turns into
Equation (16) is the neutral stability condition of the SLV model, which is consistent with the fact that the SLV model is a special case of the SLVRV model.
On the basis of and , let , and then Equation (16) turns into
Equation (17) is the neutral stability condition of the FVD model [8], which is consistent with the fact that the FVD model is a special case of the SLV or SLVRV model.
Based on the above contents, for small disturbances with long wavelengths, the uniform traffic flow is stable if
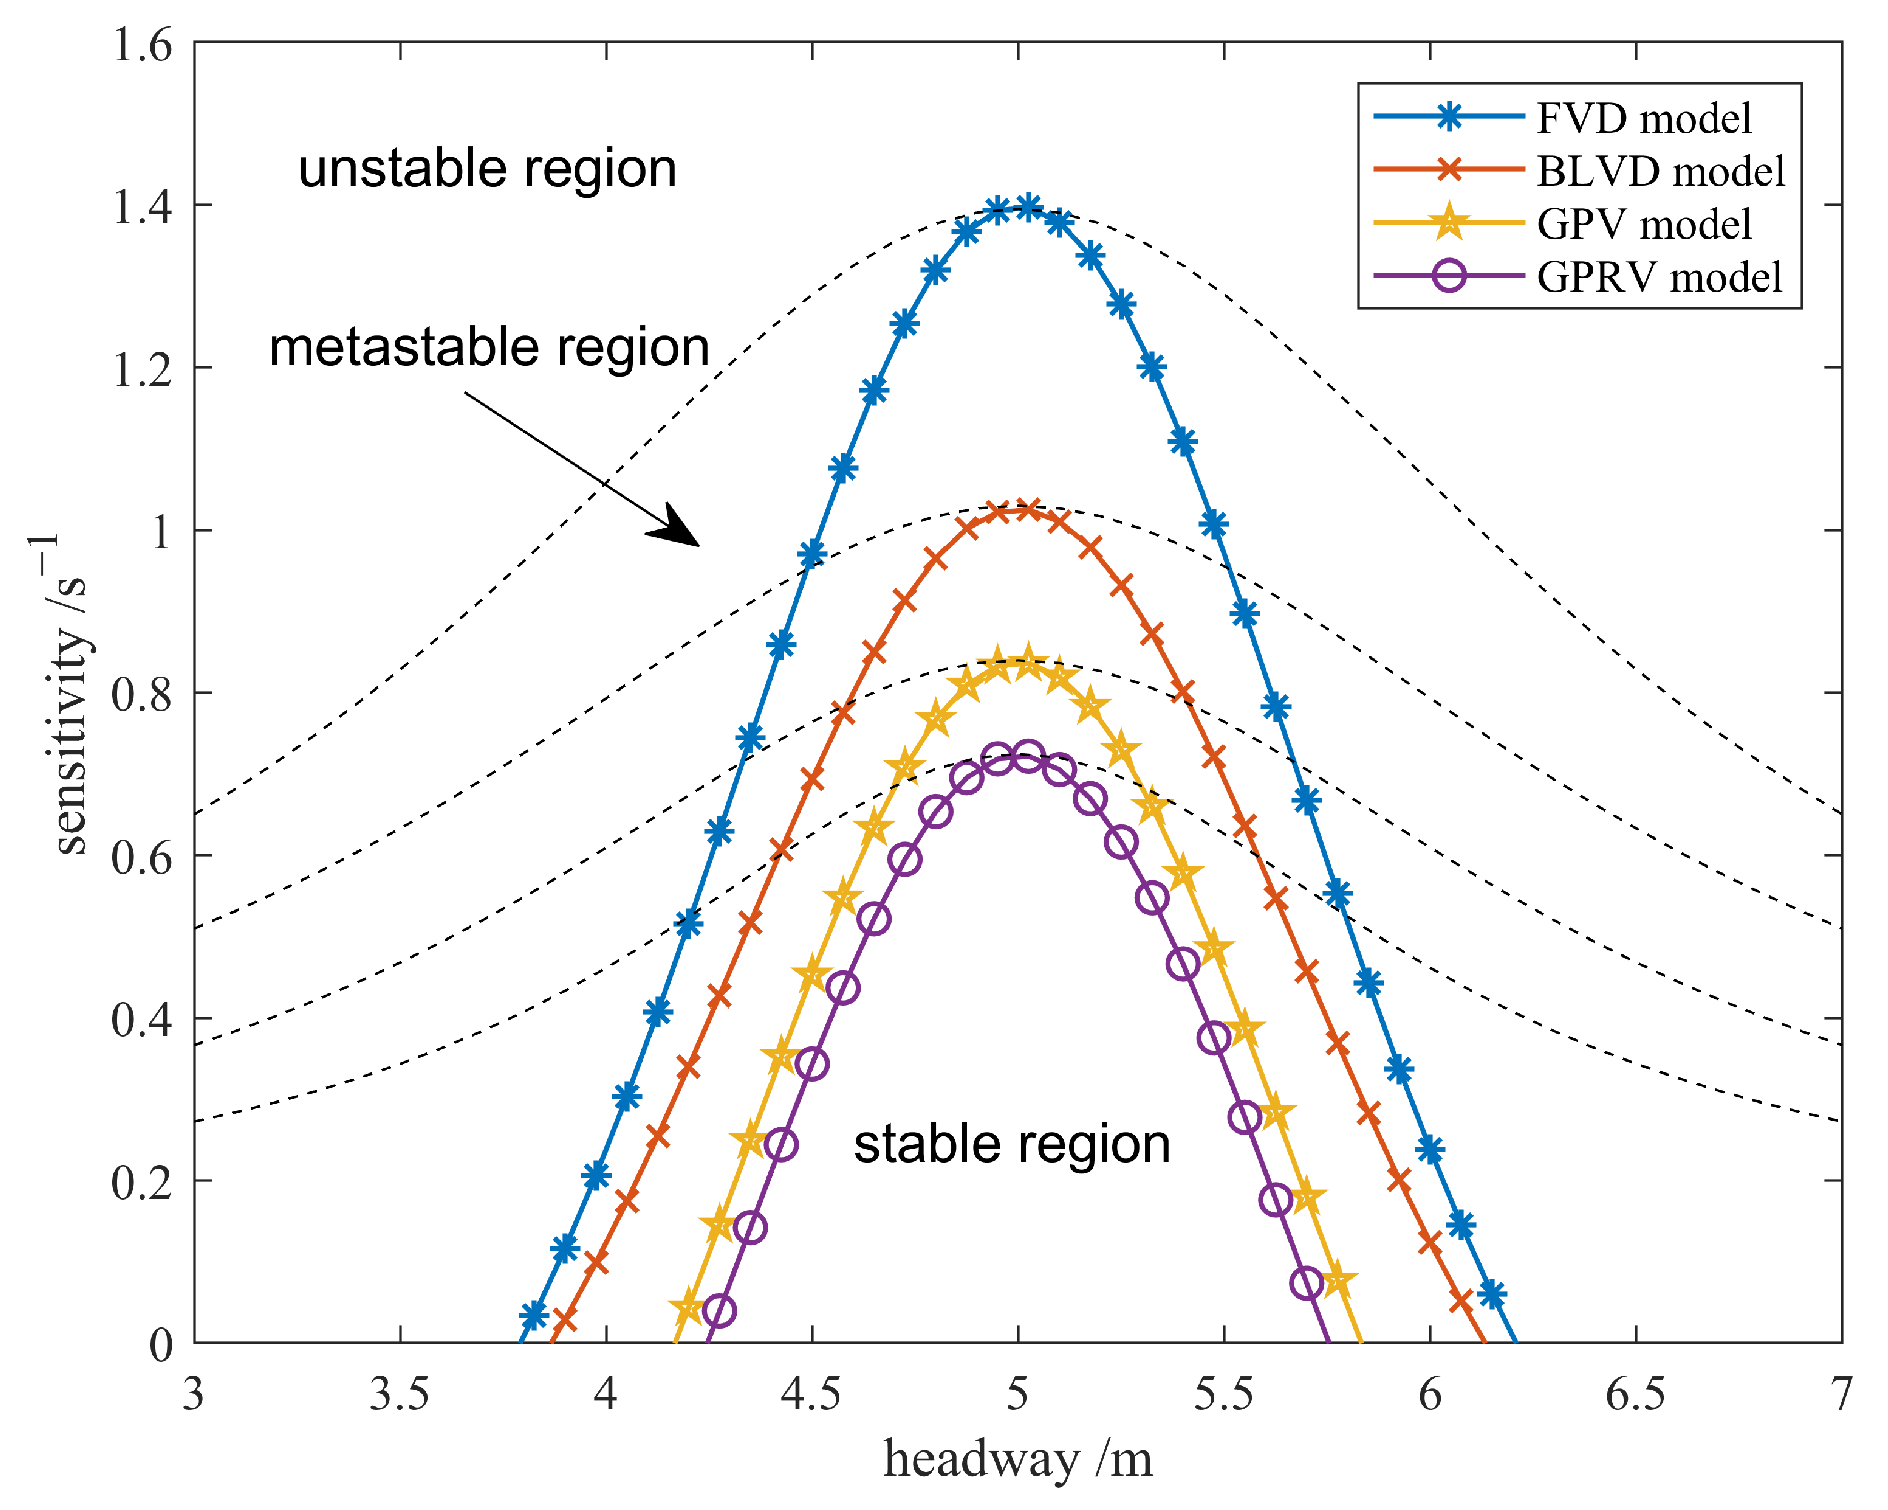
According to Equations (15) and (17), as well as reference [30], the neutral stability curves of the SLVRV and the other three representative models, which are the FVD, BLVD, and SLV models, respectively, in the headway-sensitivity phase space are derived as shown in Figure 1 (the solid curves). To compare our model with previous work, the parameters of the SLVRV and the other three models are set as , , , and .
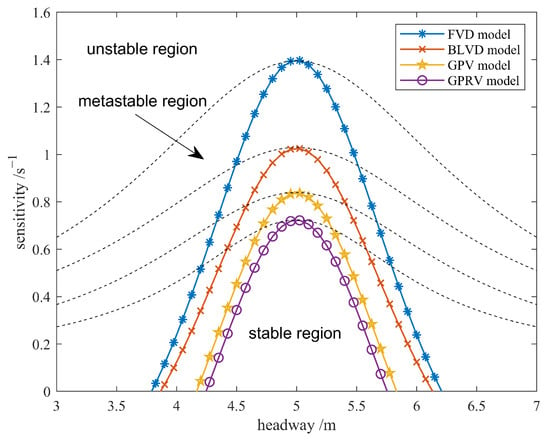
Figure 1.
The neutral stability curves (the solid ones) and coexisting curves (the dotted ones) of the SLVRV, FVD, BLVD, and SLV models.
According to the results demonstrated in Figure 1, there are two areas in the sensitivity-headway phase space that are separated by the critical stability thresholds, which are the neutral stability curves. Among these areas, the upper one is the stable area, in which the traffic flow can resist disturbance. Specifically, the disturbance will be compromised and absorbed during its propagation process, and no congestion will be formed by the disturbance. Conversely, the lower area is the unstable area, in which the traffic flow is qualified to resist disturbances. Under this condition, congestion will be eventually formed by the disturbance during its propagation process, and the density waves will emerge caused by the disturbance.
In Figure 1, we can see that the neutral curve of the SLVRV model is below that of the FVD, BLVD, and SLV models, and the area enclosed by the curve and the X-axis is smaller than that of the other three models. This result suggests that considering the motion state information of the SLV and the rear vehicle can effectively enhance the stability of traffic flow.
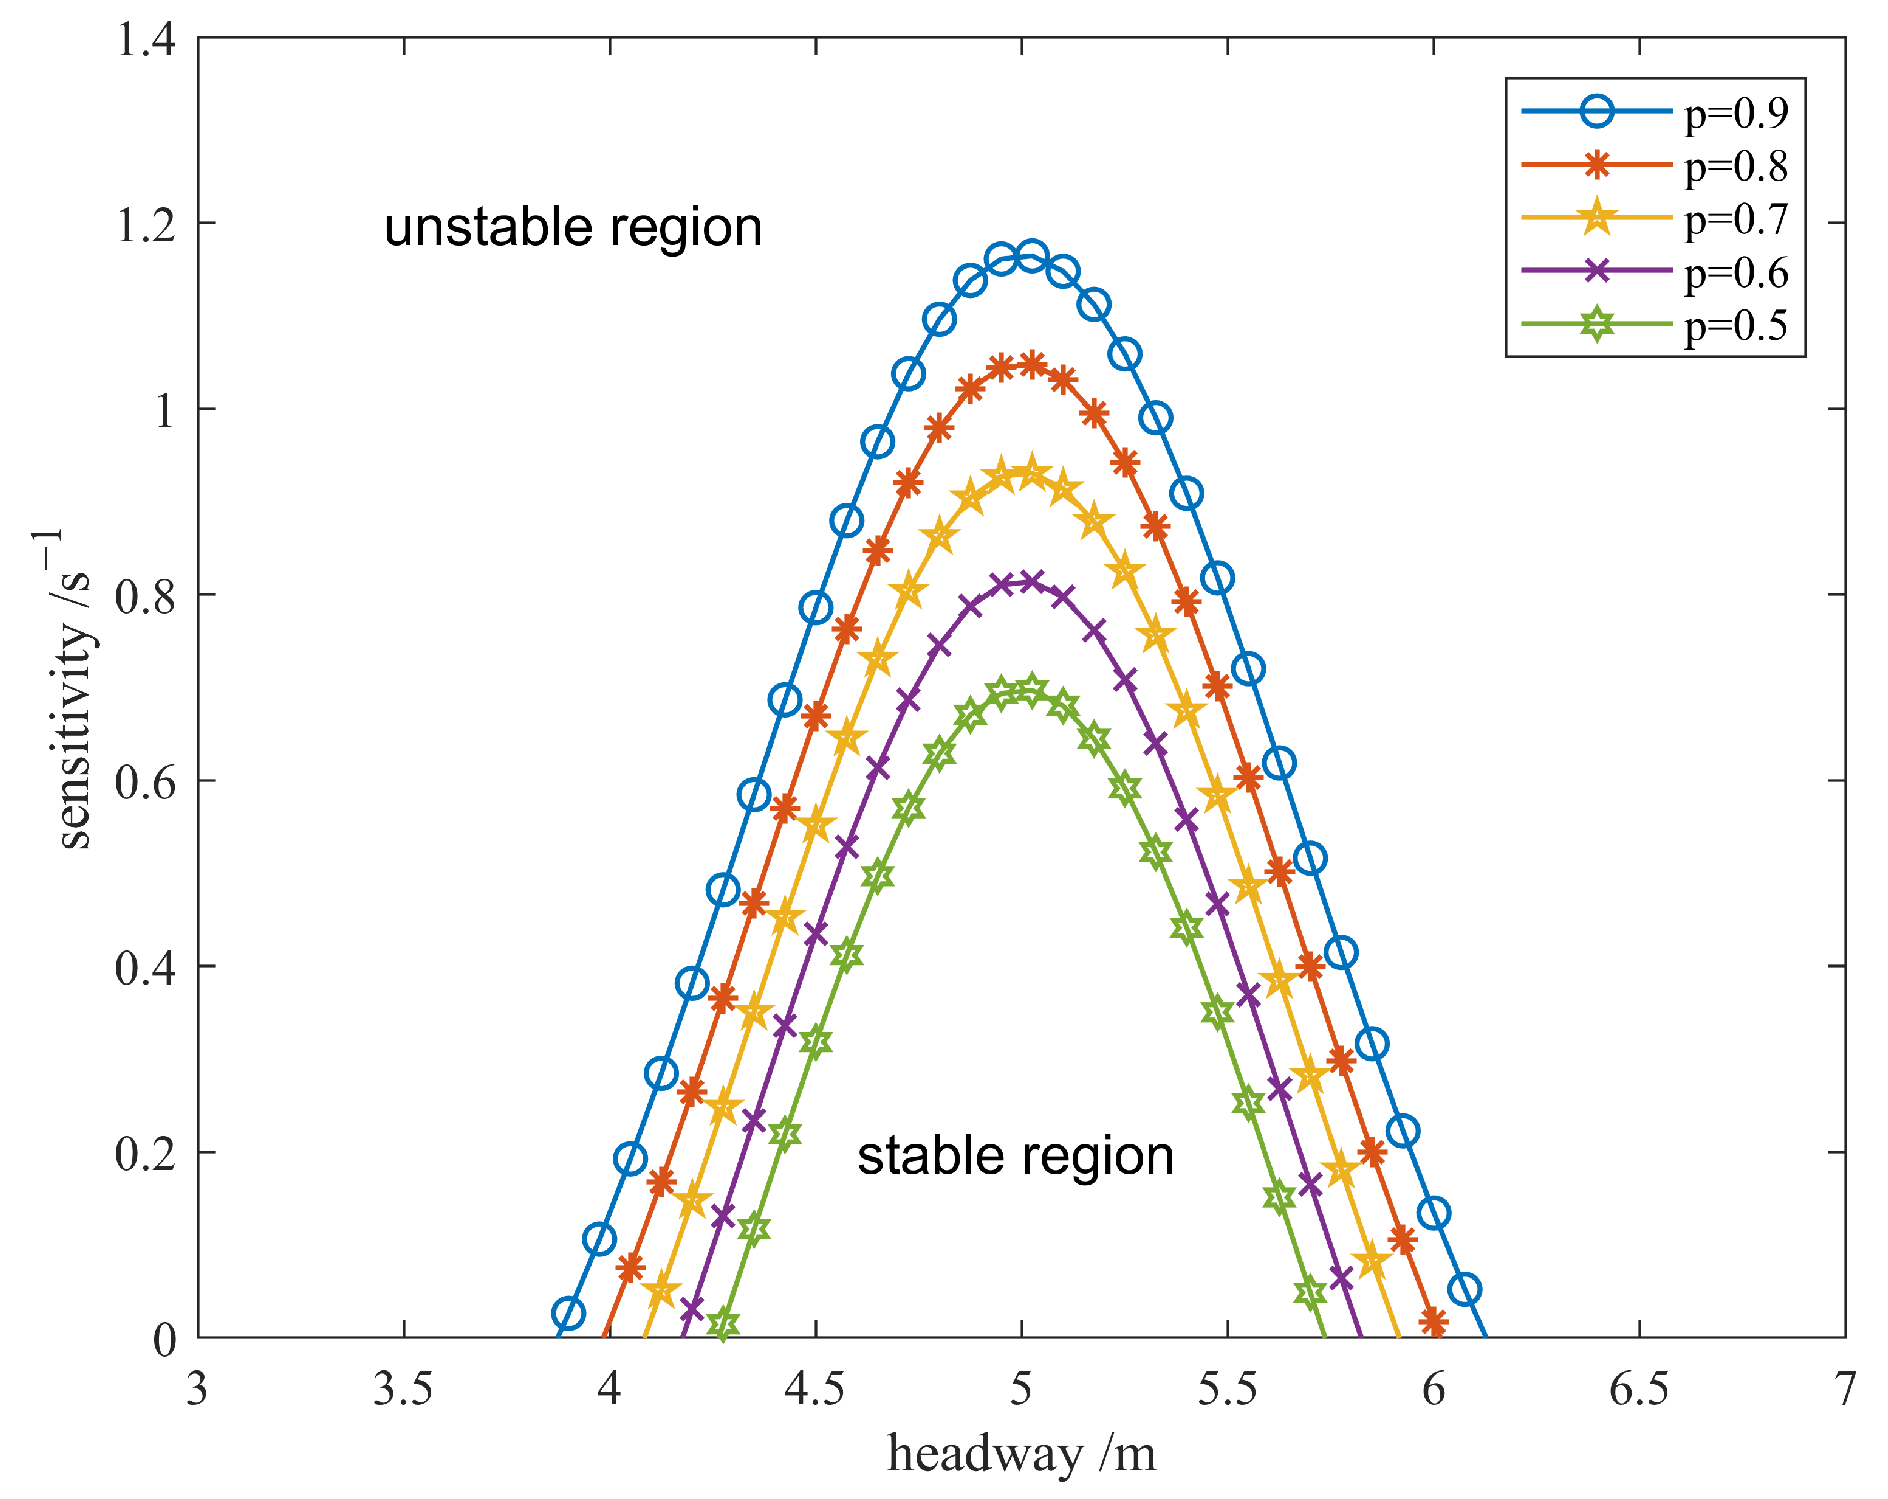
To explore the impact of sensitivity parameter on the stability of traffic flow, i.e., the influence of drivers’ attention to information of the SLV on the stability of traffic flow, the neutral stability curves of the SLVRV model with different , such as , respectively, are obtained, as shown in Figure 2, with , , and .
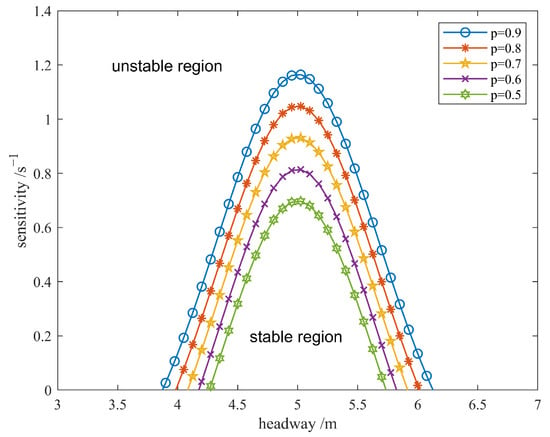
Figure 2.
The neutral stability curves of the SLVRV model with a different value of the sensitivity parameter .
As shown in Figure 2, the neutral curve of the SLVRV model continues to sink as the value of the parameter decreases. This result reveals that as drivers pay more attention to the motion state information of the SLV, the stability of traffic flow continues to be enhanced, which confirms the stabilizing effect of the SLV information on traffic flow.
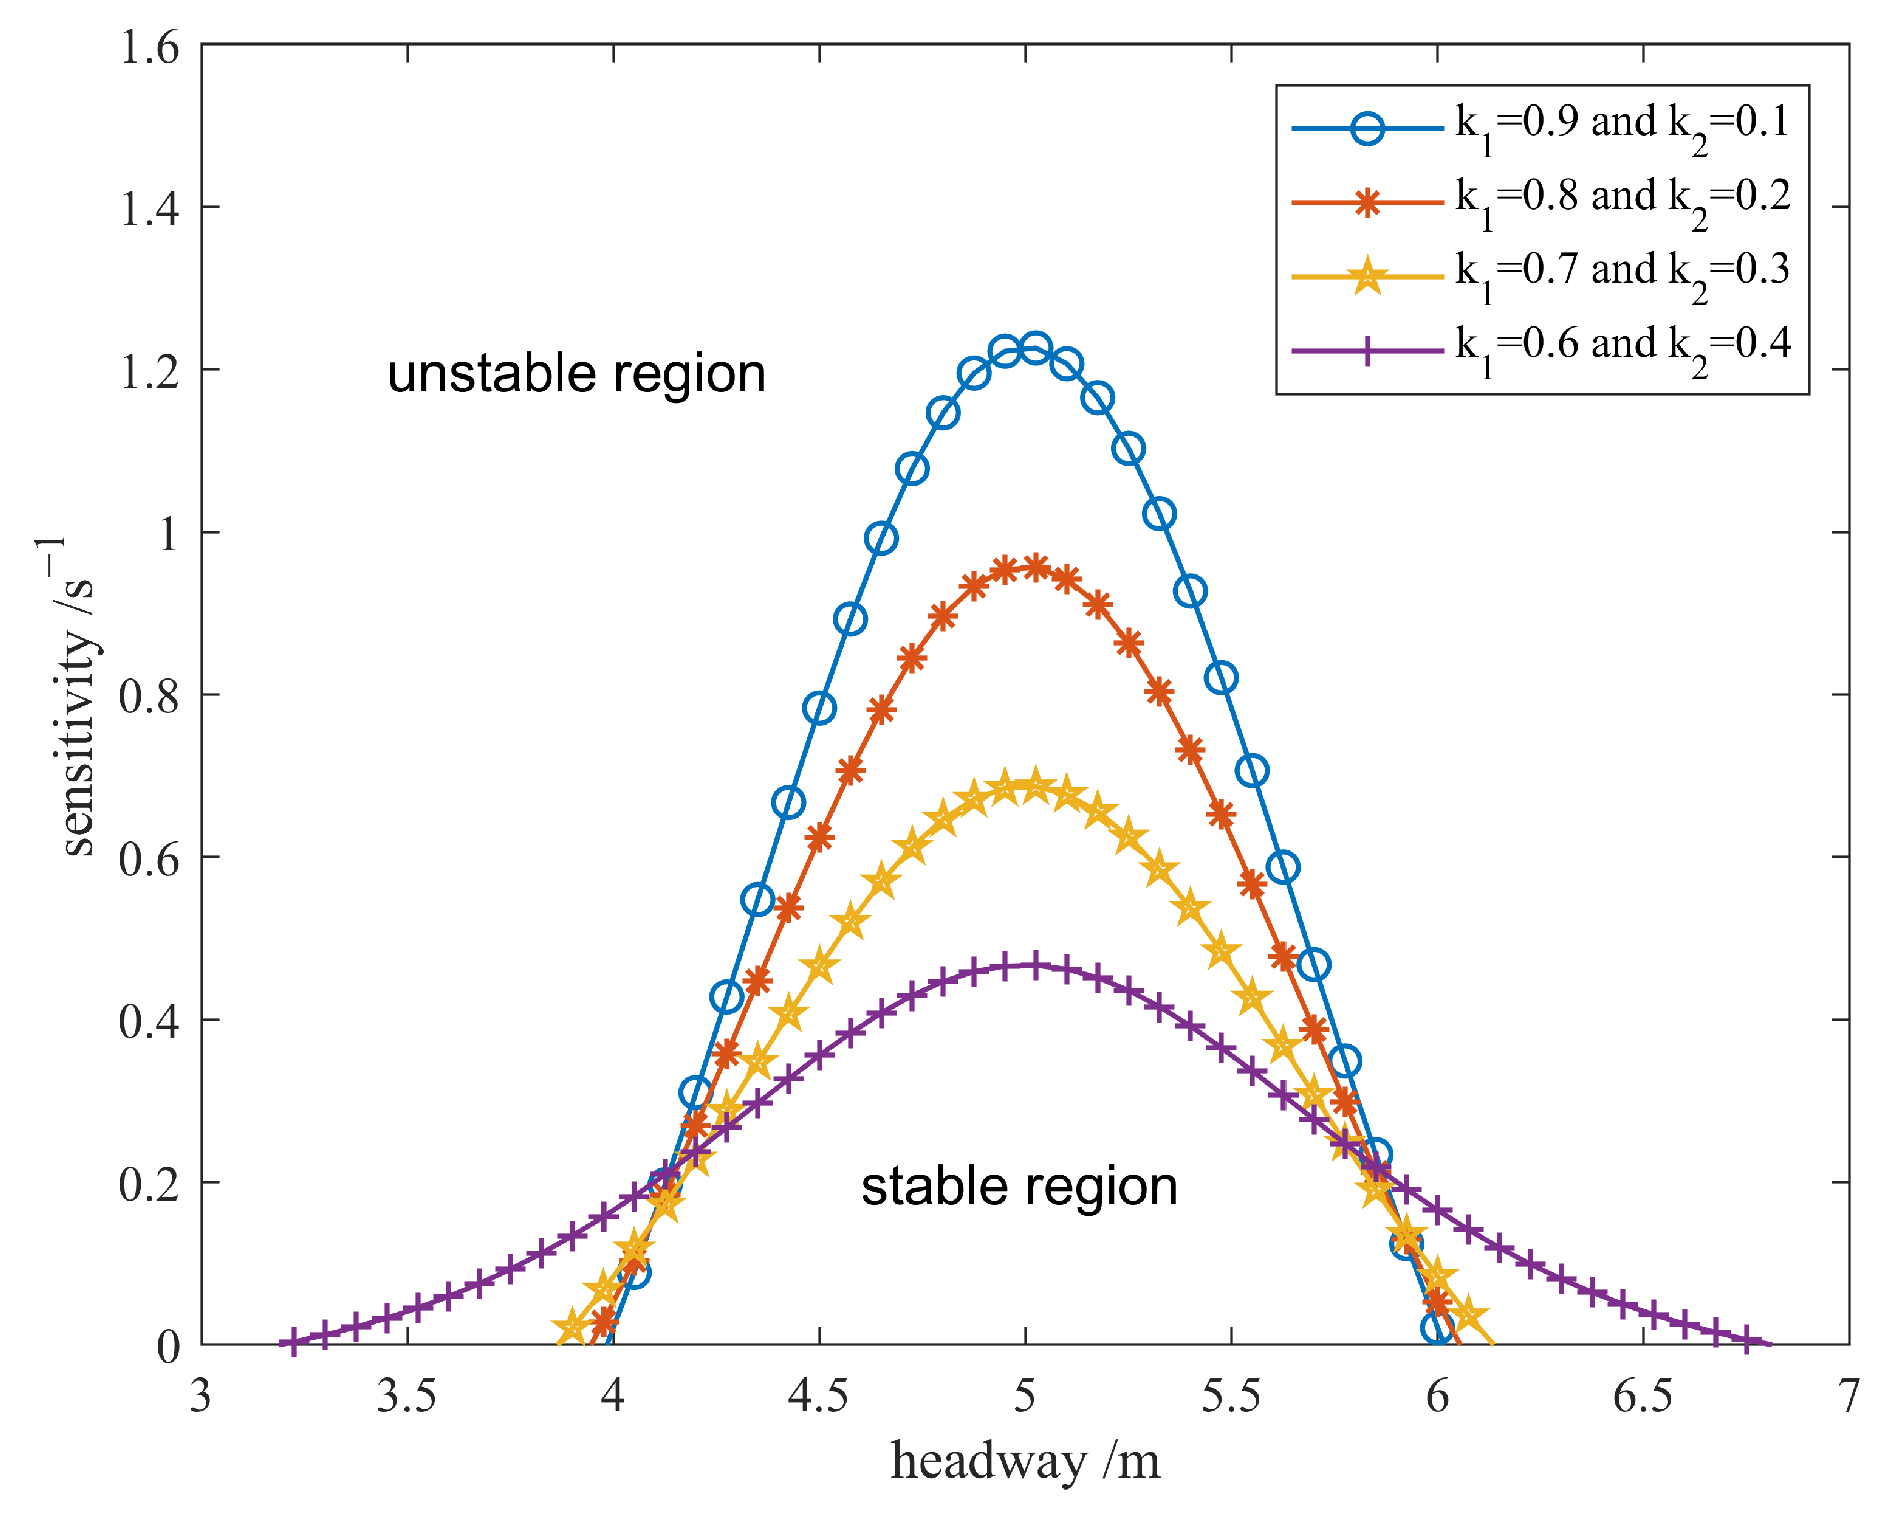
To further study the impact of sensitivity parameters and on the stability of traffic flow, i.e., the influence of drivers’ attention to information of the rear vehicle on the stability of traffic flow, the neutral stability curves of the SLVRV model with different and , such as and , respectively, are obtained, as shown in Figure 3, with and .
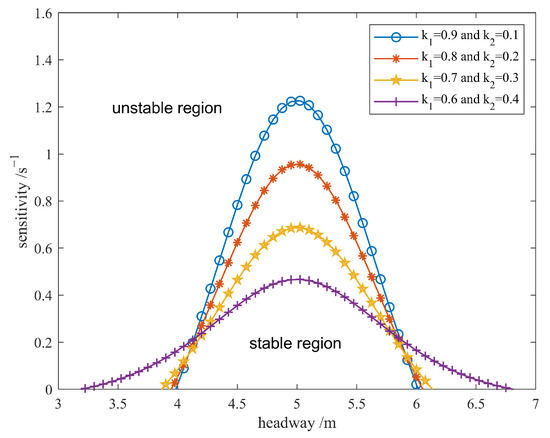
Figure 3.
The neutral stability curves of the SLVRV model with a different value of the sensitivity parameters and .
As shown in Figure 3, the neutral curve of the SLVRV model continues to go down as the value of parameter decreases and increases. This result reveals that as drivers pay more attention to the motion state information of the rear vehicle, the stability of traffic flow continues to be enhanced. It is worth noting that a one-unit increase in the sensitivity, corresponding to the drives’ attention to the rear vehicle, produces less and less positive effects on traffic flow stability as drivers pay more attention to the motion state information of the rear vehicle. This result is consistent with the fact that drivers give consideration to both the SLV and the rear vehicle in the meantime instead of focusing on the rear vehicle.
5. Nonlinear Analysis
In Section 3, the neutral stability condition of the SLVRV model is derived utilizing linear stability analysis. During the derivation progress, the second- and higher-order terms, which produce less effect in linear stability analysis, are ignored. However, these terms play a vital role in nonlinear analysis, especially the operation and evolution characteristics of traffic flow near the critical point. Thus, these terms are employed in the nonlinear analysis of the SLVRV model based on the reductive perturbation method [14,16,43], and the mKdV equation is derived to describe the characteristics of phase transition and the propagation of the kink–antikink wave in traffic flow.
To utilize the reductive perturbation method, Equation (5) is rewritten as
where , , and .
In the unstable region of headway-sensitivity phase space, we construct the slow variables and with space variable and time variable near the critical point , which is as follows:
where and , and is the undetermined coefficient.
Based on Equations (20) and (21), the headway can be defined as
Substituting Equations (20)–(22) into Equation (19) and expanding the result to the fifth order of , one can obtain
where and .
Near the critical point , by eliminating the second- and third-order terms of in Equation (23), the simplified equation can be given as follows:
where and to are as follows:
Transformations on Equation (24) are conducted with Equations (30) and (31), which are as follows:
Then, the mKdV equation with the correction term is given as follows:
where .
Ignore the correction term ; the solution of the kink–antikink wave is obtained as
To derive the selected velocity and must satisfy the solvable condition as follows:
where .
We obtain the selected velocity by integrating Equation (32), and the result is as follows:
Thus, the kink–antikink soliton solution is obtained as
Equation (36) can be rewritten into the form of headway as follows:
Based on the above efforts, the amplitude of the kink–antikink solution can be given as
According to the amplitude given in Equation (36), the coexisting curves in the headway-sensitivity phase space of the SLVRV model can be obtained, as shown in Figure 1 (the dotted lines). In Figure 1, the coexisting and neutral stability curves divide the headway-sensitivity phase space into three regions. Among them, the one enclosed by the coexisting and neutral stability curves is the metastable region, which would occur in the phase transition of traffic flow. The transition process and the propagation and evolution characteristics of density waves in traffic flow can be described by employing Equation (34) to Equation (37).
6. Numerical Simulation
To verify the theoretical analysis results in the above sections and to further investigate the stability characteristics of traffic flow with consideration of the SLV and the rear vehicle, a numerical simulation about disturbance propagation is carried out in this section. The numerical simulation platform used in this study is constructed on the basis of MATLAB software (Ver. R2023b) and operates on a personal computer equipped with an Intel Core i7 12700F processor, 64GB of memory, a 1TB SSD, and an NVIDIA RTX 3060 Ti graphics card. Moreover, the scenario in both numerical simulations 1 and 2 is all set as follows: a total number of identical vehicles with the same length of are evenly distributed on a ring road, with the total length of , and all vehicles are under the stable car-following condition with the same velocity of . At the initial time, a disturbance with the scale of (half of the initial headway) and (a quarter of the initial velocity) is exerted to the system and observe the propagation and evolution process of the disturbance in the system consisting of the vehicle fleet.
The impact of disturbance exerted at the initial time on the system will be externalized as the deviation of vehicles’ velocity and headway from the initial stable state. To compare the SLVRV model with previous models [8,30,41], the parameters in these models are set as follows:
- (1)
- FVD model: and ;
- (2)
- BLVD model: , , , and ;
- (3)
- SLV model: , , and ;
- (4)
- SLVRV model: , , , , and .
where the corresponding parameters in the optimal velocity function are set as , , , and .
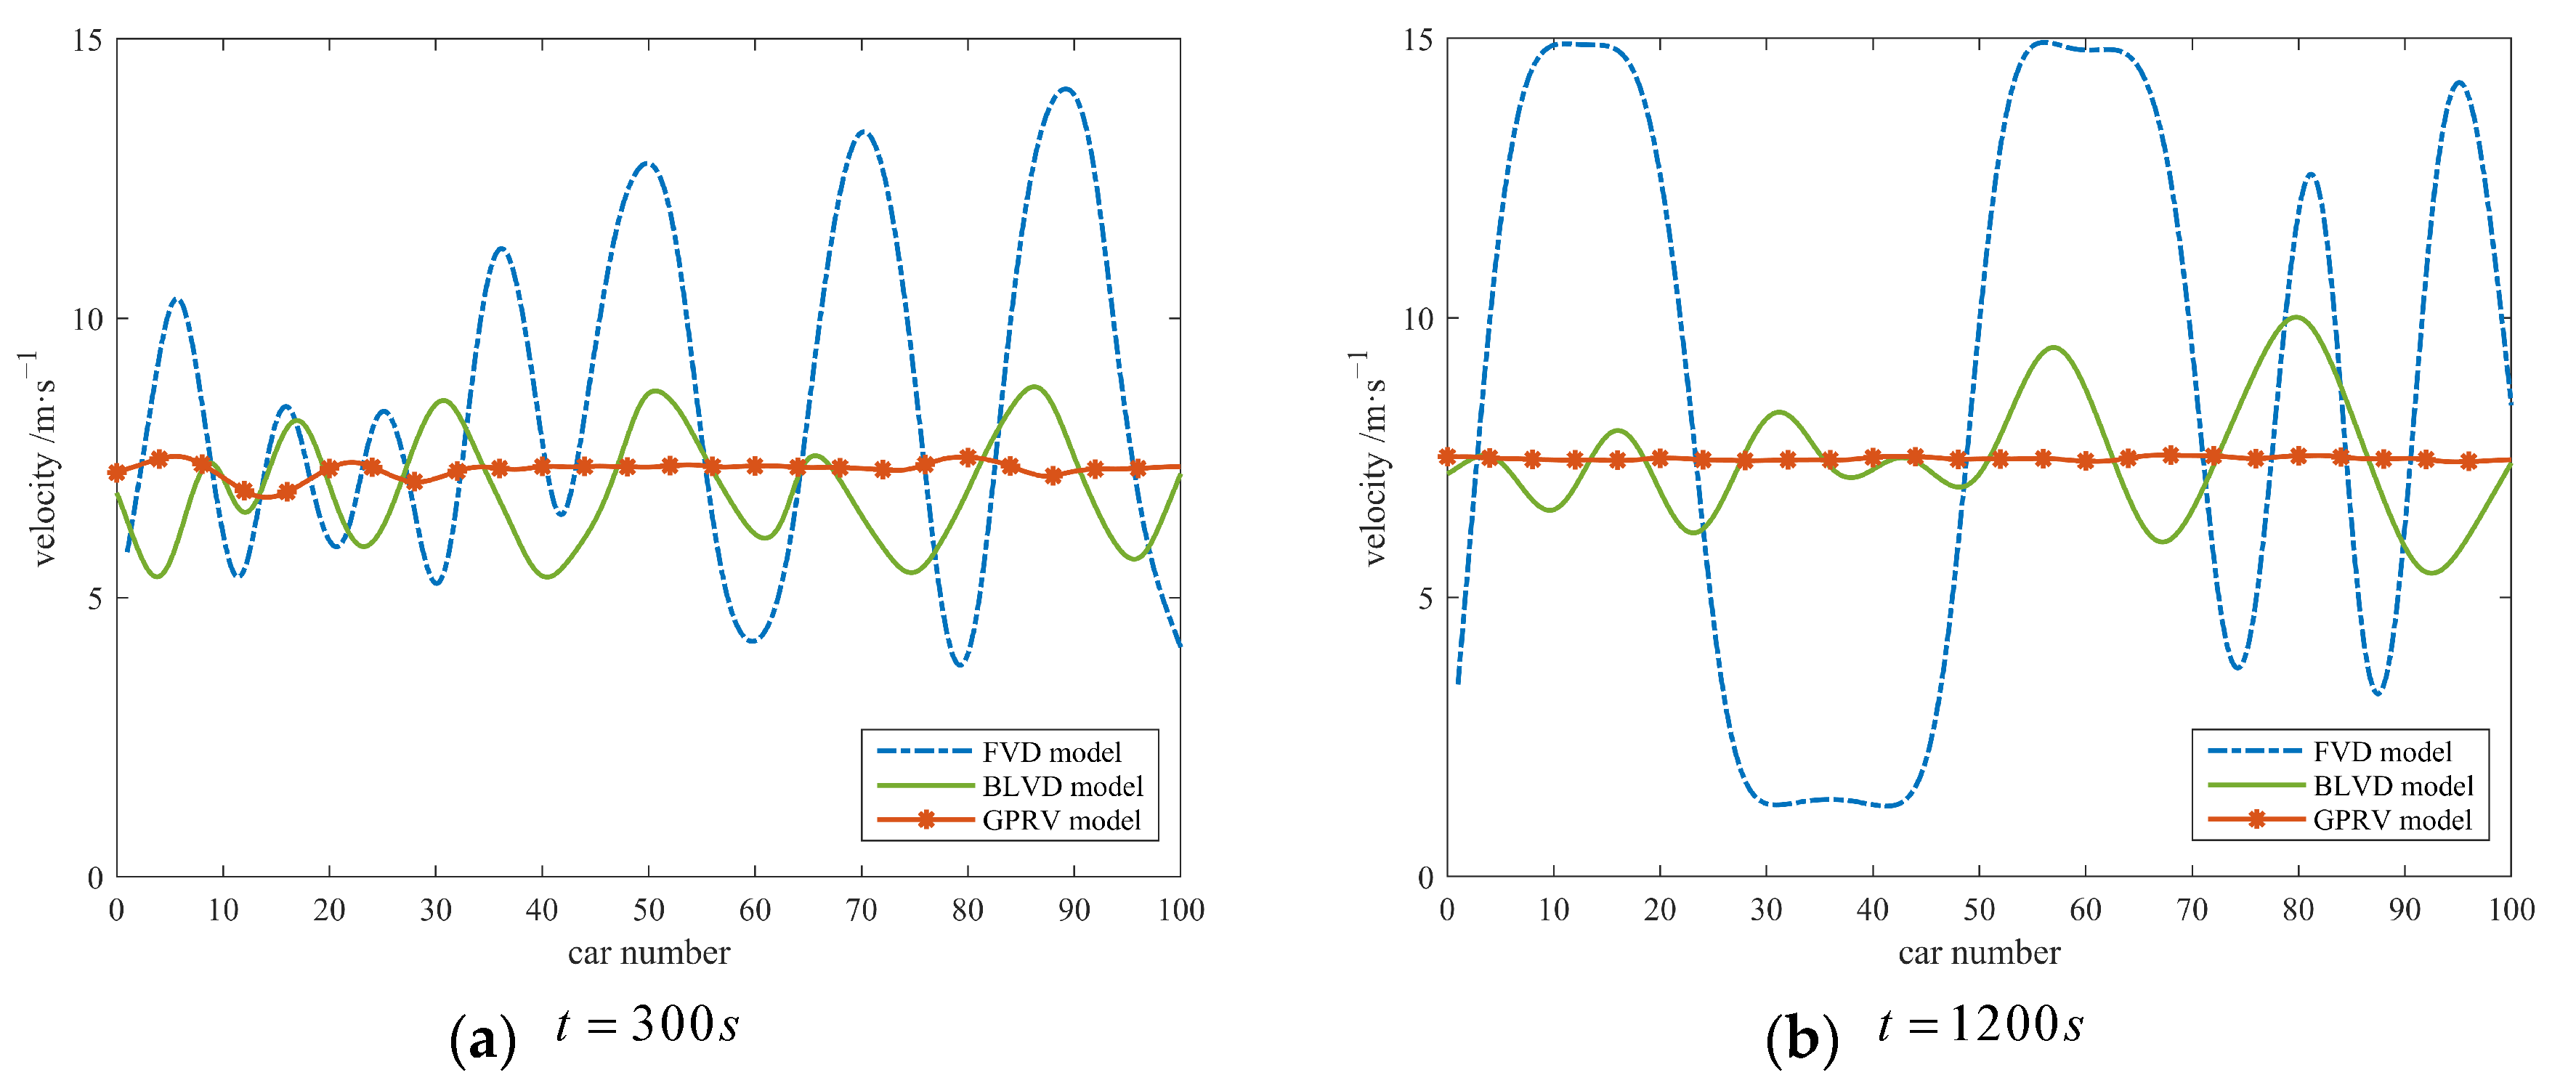
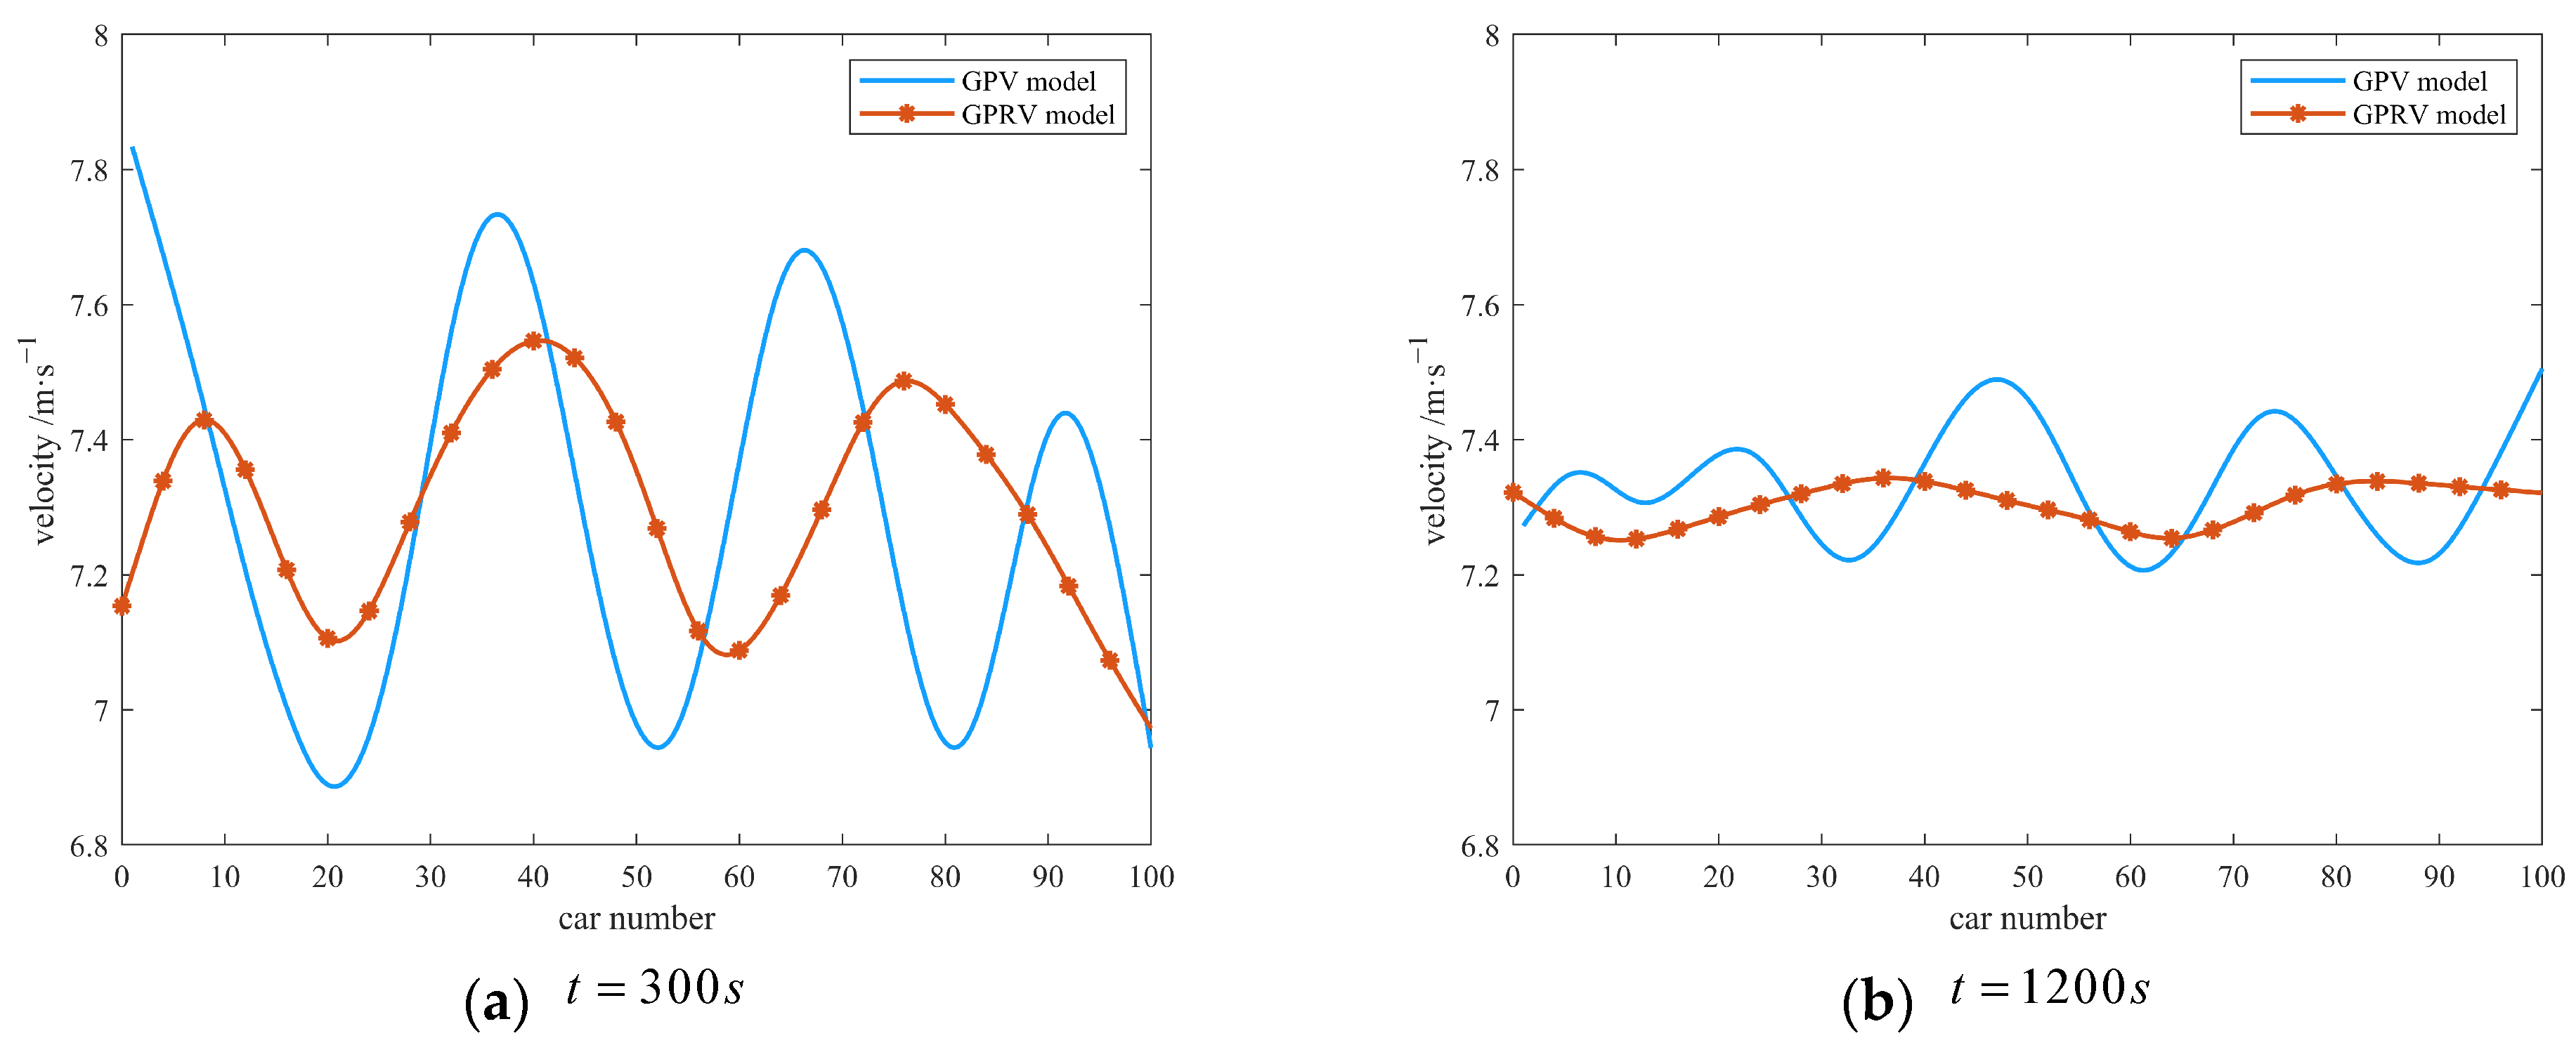
Simulation 1. The propagation and evolution process of disturbance in the system is simulated and analyzed employing velocity as the index, and the velocity distribution in the system at and is shown in Figure 4 and Figure 5.
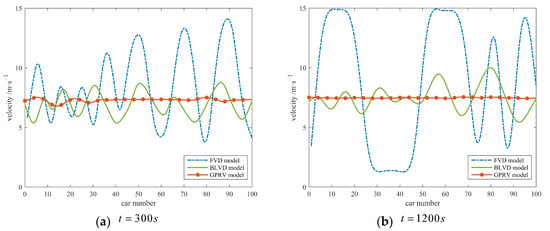
Figure 4.
The distribution of velocity in the system (comparison between the SLVRV model and the FVD model as well as the BLVD model).
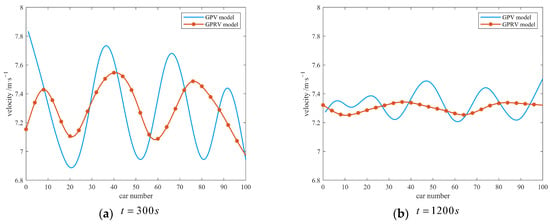
Figure 5.
The distribution of velocity in the system (comparison between the SLVRV model and the SLV model).
Due to the different stability characteristics of the models, the fluctuation range of velocity in different models varies greatly, and it is difficult to analyze in the same coordinate range. Thus, a comparison of velocity distribution between the SLVRV model and the SLV model is conducted separately, as shown in Figure 5.
As shown in Figure 4 and Figure 5, the propagation and evolution characteristics of the disturbance exerted in the system at the initial time are quite different in the above four models. In the FVD model, the disturbance is growing with its propagation in the system, which leads to the vehicles’ velocity fluctuating between zero (approximately) and the maximum (set by the simulation). Thus, the system eventually becomes unstable, and congestion occurs. By contrast, the disturbance of the same scale under the same conditions is suppressed within a certain scale by the system during its propagation process in the BLVD, SLV, and SLVRV models, and the system remains stable. Among them, the system with the SLVRV model can suppress the disturbance on a fairly small scale, and the time for disturbance to be suppressed is obviously shorter than that of the other three models.
Although the BLVD, SLV, and SLVRV models require different times to suppress the disturbance and the suppressed results are different, as shown in Figure 4 and Figure 5, the system can return to the initial stable state or reach a new stable state with these models. In contrast, the disturbance of the same scale cannot be suppressed by the system with the FVD model and leads to an unstable state of the system. As shown in Figure 4a, the disturbance was amplified in the propagation process in the system with the FVD model and resulted in a large range of speed fluctuations when the disturbance was exerted in the system for 300 s. Under the same conditions, disturbances with the same scale are not amplified during their propagation in the other three models. As shown in Figure 4b, the “separation” and “clustering” phenomenon of velocity distribution emerge in the system with the FVD model at . That is, vehicles in the system with the same velocity and headway at the initial time are differentiated and gathered into multiple “vehicle clumps”. In the same clump, the velocity of the vehicles is approximately the same, the headway of the vehicles is small, and the density of vehicles is high. Regarding the distribution of velocity, these “clumps” fluctuate between approaching a stop and approaching the maximum, which is a typical “stop-and-go” phenomenon. This phenomenon does not appear in the other three models. As shown in Figure 5a, the disturbance exerted at the initial time has been suppressed by the system with the SLVRV model to a relatively small scale when . The velocities of the vehicles in the system are evenly distributed around the initial velocity, and there is no “separation” or “clustering” phenomenon. As shown in Figure 5b, the disturbance has been basically absorbed by the system. The velocity of the vehicles in the system basically maintains the initial speed with little deviation, and the system has returned to a relatively stable state. The above results are consistent with the theoretical analysis in Section 3 and Section 4, which is also consistent with the phenomenon when the realistic traffic system becomes unstable.
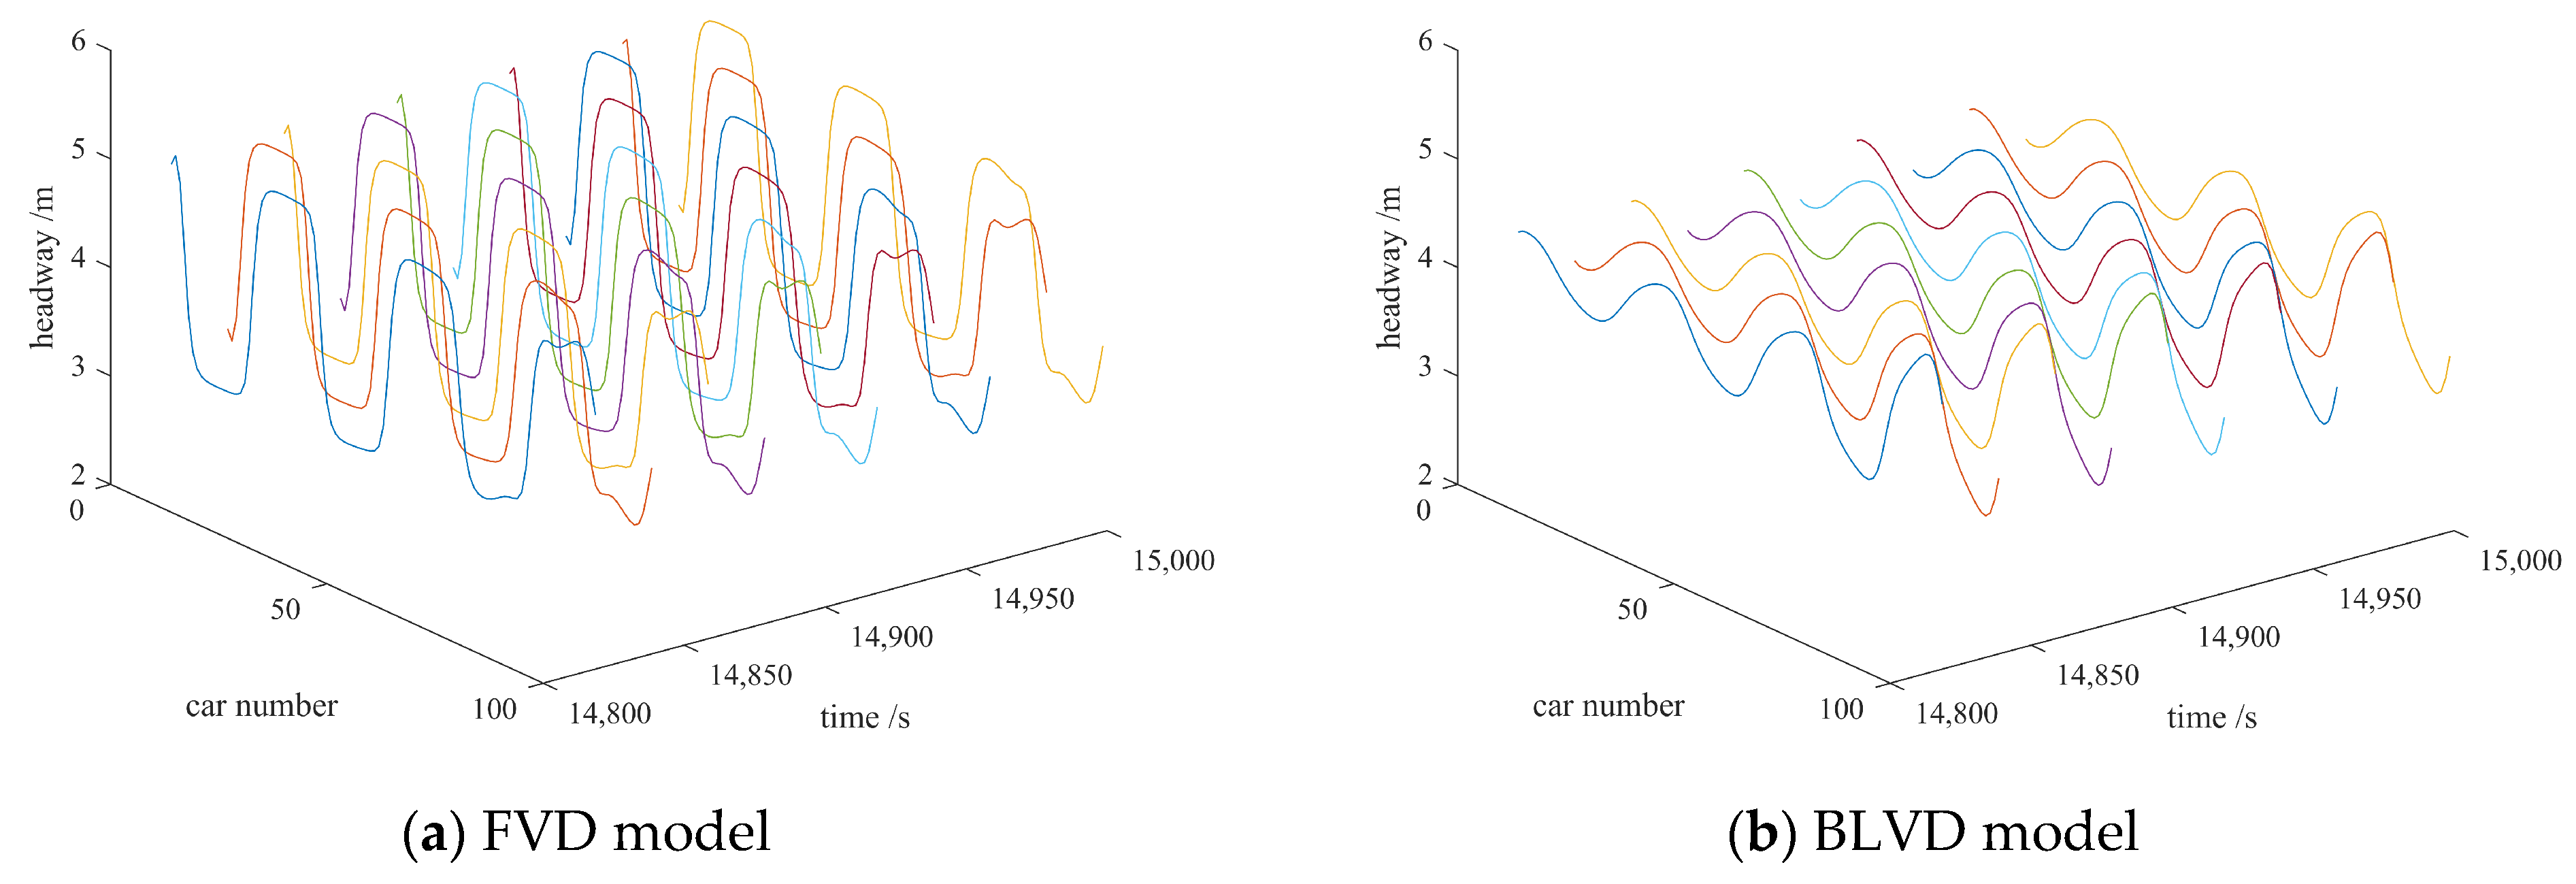
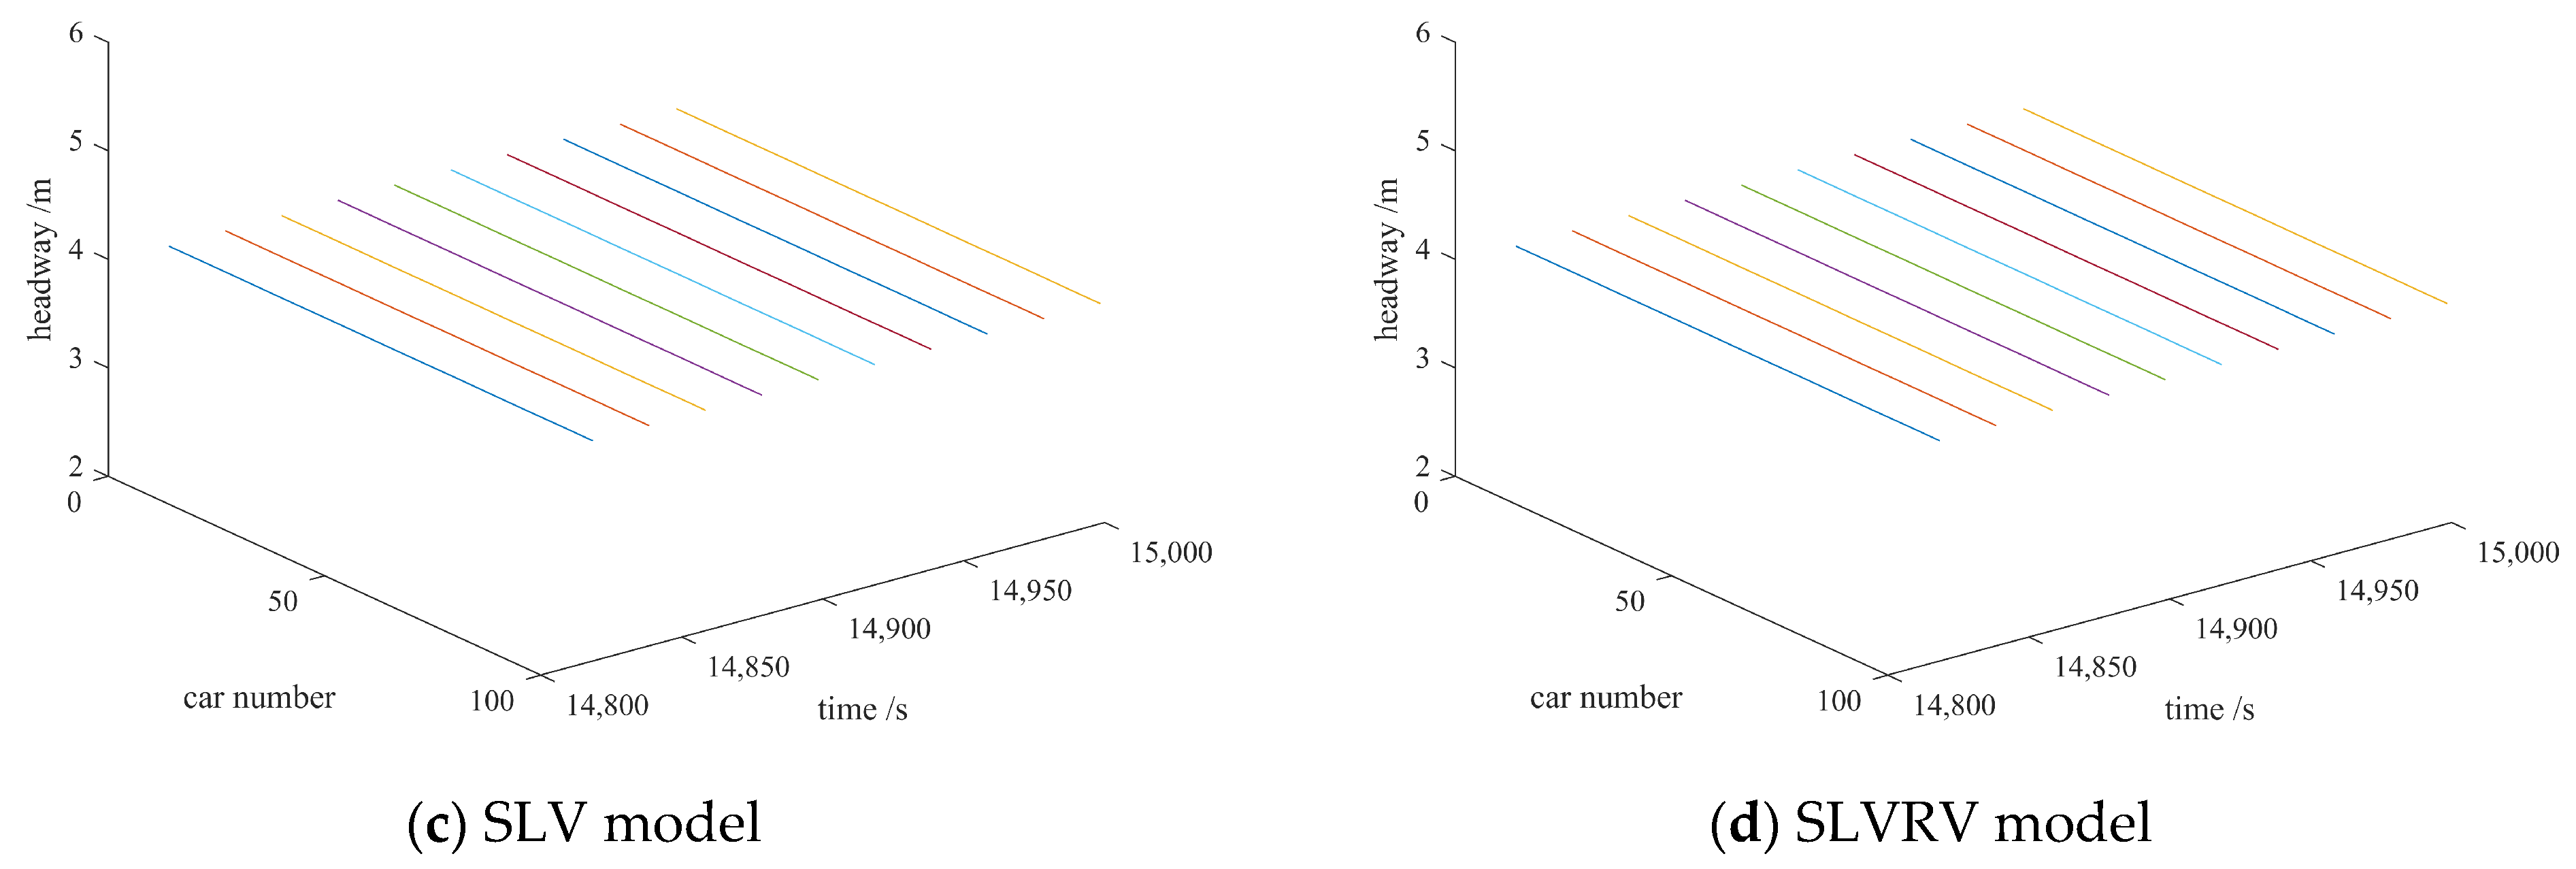
Simulation 2. To investigate the propagation and evolution characteristics of disturbance after a long time span, the propagation process of disturbance in the system is simulated with the same scenario as Simulation 1, as shown in Figure 6. According to the results of Simulation 1, the headway between any two successive vehicles is employed as the index instead of the velocity.
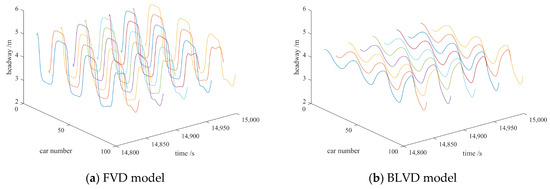
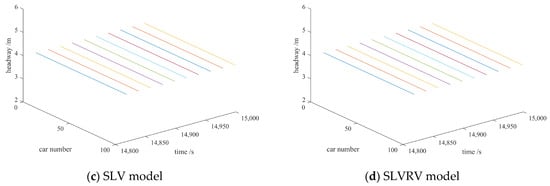
Figure 6.
Space–time evolution of the headway after . (The patterns (a–d) are for the coexisting phases corresponding to the four models).
In Figure 6, we can obtain the system state with the FVD, BLVD, SLV, and SLVRV models, respectively, after . As shown in Figure 6a, the disturbance exerted at the initial time cannot be suppressed by the system with the FVD model and grows with its propagation, which will eventually cause the system to become unstable. As shown in Figure 6b, the disturbance cannot be aborded by the system with the BLVD model, but it can be suppressed by the system within a certain scale. As shown in Figure 6c, the system with the SLV model can suppress and then abord the disturbance and has returned to a stable state. As shown in Figure 6d, the system also can suppress and abord the disturbance and has returned to a stable state. Although the effect of the system with the SLV model and the SLVRV model, respectively, is to suppress the disturbance exerted as the same scale at the initial time when , combined with the results of Simulation 1, one can see that there is a certain difference in the stabilization performance of the SLV model and the SLVRV model. On the one hand, it takes less time for the system with the SLVRV model than the SLV model to suppress and abord the disturbance. On the other hand, the fluctuation of vehicles’ motion state during the process of suppressing disturbance in the system with the SLV model is more intense than that with the SLVRV model.
7. Discussion
Understanding the formatting condition and the evolution mechanism is crucial for alleviating and suppressing traffic congestion, as well as for improving communities’ traffic efficiency. The stability analysis of car-following models is a key means to achieve this understanding. Under the conditions of penetration of CAV technologies, such as V2X, vehicles and drivers can access the motion state information of the SLV along with the rear vehicle within the current lane and apply it to the car-following behavior. However, there is currently no model that comprehensively incorporates the SLV and the “looking backward effect”, which limits the understanding of characteristics of the car-following behavior and traffic flow under the corresponding condition.
Motivated by these, an extended car-following model with consideration of the SLV and the rear vehicle was established in this work to study the linear stability and nonlinear characteristics of traffic flow. In Section 3 and Section 4, the linear stability and nonlinear analysis were carried out, respectively, utilizing the linear stability analysis method and reductive perturbation method, and the neutral stability condition and mKdV equation, as well as its solution, were derived. According to these efforts, the neutral stability curves and the coexisting curves in the headway-sensitivity phase space were conducted, as shown in Figure 1. The impact of sensitivity on stability was also discussed, as shown in Figure 2 and Figure 3. In Figure 1, we can see that the area, which is enclosed by the neutral stability curves and the X-axis, of the SLVRV model is smaller than that of the FVD, BLVD, and SLV models, which reveals that the stability of traffic flow with the SLVRV model is enhanced by considering the motion state information of the SLV and the rear vehicle. As shown in Figure 2 and Figure 3, the stability continued to be enhanced as the drivers paid more attention to the SLV or the rear vehicle. These results suggest that while paying attention to the headway and velocity difference between the vehicle and its front vehicle, paying more attention to the motion state of the SLV and the rear vehicle will assist the driver with a better understanding of the surrounding traffic conditions. Particularly, the motion state of the SLV can help the driver better grasp the traffic condition of the road rather than of the current lane. With a better understanding of the traffic condition, drivers can adjust and optimize their car-following behavior, and thus the stability of traffic flow will be enhanced. Below the stable region, there are metastable regions and the unstable region, as shown in Figure 1. The traffic flow is about to become unstable in the metastable region and has become unstable, which will lead to traffic jams, in the unstable region. Traffic congestion, which is essentially an extreme case in the propagation of density waves, is one of the most common and important complexes and nonlinear phenomena in traffic flow. When the traffic flow becomes unstable, the density wave propagates in the form of a kink–antikink wave. The propagation characteristics, which express the operation characteristics of traffic flow when it becomes unstable, including the selected velocity and the amplitude of the wave, can be described with the corresponding equations in Section 4. To verify the aforementioned results of the theoretical analysis and further investigate the operation and evolution characteristics of traffic flow with consideration of the motion state information of the SLV and the rear vehicle under the conditions of the penetration of CAV technologies, such as V2X, a scenario about the disturbance propagation was constructed, and then numerical simulation on the disturbance propagation in the vehicles system was conducted. Based on the simulation, the propagation and evolution process of disturbance in the system was explored, and the results of the simulation can be seen in Figure 4, Figure 5 and Figure 6. The results in Figure 4 and Figure 5 demonstrate the performance advantages of the proposed model compared to the FVD model, BLVD model, and SLV model. The comparison between pairs reveals the contribution of different information incorporated in these models to the traffic flow stability. Specifically, at t = 300 s and t = 1200 s after disturbance is applied, it can be observed that the traffic flow composed of vehicles under the control of the established model has a stronger capability to resist disturbance, suppressing the same disturbance within a smaller scale. On the other hand, the simulation results in Figure 6 employing the headway as the indicator reveal the same conclusion; that is, compared to the FVD model, BLVD model, and SLV model, the traffic flow controlled by the model established in this paper has stronger stability. A good agreement between the theoretical analysis and the numerical simulation suggests that the stability of traffic flow can be significantly enhanced by considering the motion state of the SLV and the rear vehicle, which also confirms the necessity of considering these items in the research of car-following behavior and traffic flow. The results of linear stability and nonlinear analysis collectively suggest that they demonstrate remarkable congestion mitigation efficacy while effectively enhancing traffic flow capacity in the urban expressway and highway environments by reinforcing traffic flow stability and improving its capability to resist, suppress, and absorb disturbance.
The results of this work could provide a reference or basis for further investigation into car-following behavior and traffic flow under the conditions of the penetration of CAV technologies, such as V2X. Nevertheless, there are limitations in this work, such as not considering the impact exerted by the difference between the type of vehicle and its driver (the information on these factors is available for drivers under the conditions of penetration of CAV technologies, such as V2X), which we look forward to exploring in future work.
8. Conclusions
Stability analysis of car-following models is an important research approach for understanding the stability characteristics of traffic flow and the propagation process of density waves, which is crucial for comprehending the generation condition and the propagation mechanism of traffic congestion. In this paper, an extended car-following model was proposed with consideration of the motion state information of the SLV and the rear vehicle. Based on the proposed model, the linear stability analysis and the nonlinear analysis of traffic flow were conducted, and the numerical simulation experiments were carried out to validate the theoretical derivation and analytical results. The theoretical analysis is consistent with the simulation results, which suggests that considering the motion state information of the SLV and the rear vehicle can effectively enhance traffic flow stability. The research results will contribute to enhancing traffic flow stability, alleviating traffic congestion, and improving transportation efficiency. Additionally, the findings provide a theoretical basis for the design of autonomous driving systems for CAVs as well as the management, control, and optimization of intelligent transportation systems. Nevertheless, there are limitations in this study. A unified benchmark and a general framework were employed to analyze, evaluate, and verify the proposed model. However, the values of the parameters still need to be calibrated through the utilization of field-measured data. For future research needs, dedicated efforts are recommended to assess the performance of different models under various road environments and disturbance specifications. While the unified benchmark facilitates the comparison and understanding of various models, a comprehensive investigation of models across diverse real-world traffic environments remains an open area for future research, which potentially requires a series of systematic studies to achieve this assessment.
Author Contributions
Methodology, J.H.; software, C.S.; validation, C.S.; data curation, T.C.; visualization, T.C.; writing—original draft preparation, J.H.; writing—review and editing, X.W. and J.H.; supervision, J.W.; project administration, X.W.; funding acquisition, X.W. and J.W. All authors have read and agreed to the published version of the manuscript.
Funding
This study was supported by the Natural Science Foundation of Shandong Province (Grant No. ZR2020MF082), the New Generation Information Technology Innovation Project of the Industrial–University–Research Innovation Fund for Higher Education Institutions of the Ministry of Education of China (Grant No. 2022IT191 and No. 2023IT209), the Intelligent Driving and Smart Cockpit Education Project of the Industrial–University–Research Innovation Fund for Higher Education Institutions of the Ministry of Education of China (Grant No. 2024HT024), and the Qingdao University of Science and Technology Graduate Student Independent Innovation Project (Grant No. 2023KY005).
Institutional Review Board Statement
Not applicable.
Informed Consent Statement
Not applicable.
Data Availability Statement
The data presented in this study are available upon request from the corresponding author.
Conflicts of Interest
The authors declare no conflicts of interest.
References
- Chandler, R.E.; Herman, R.; Montroll, E.W. Traffic Dynamics: Studies in Car Following. Oper. Res. 1958, 6, 165–184. [Google Scholar] [CrossRef]
- Herman, R.; Montroll, E.W.; Potts, R.B.; Rothery, R.W. Traffic Dynamics: Analysis of Stability in Car Following. Oper. Res. 1959, 7, 86–106. [Google Scholar] [CrossRef]
- Gazis, D.C.; Herman, R.; Potts, R.B. Car-Following Theory of Steady-State Traffic Flow. Oper. Res. 1959, 7, 499–505. [Google Scholar] [CrossRef]
- Newell, G.F. Nonlinear Effects in the Dynamics of Car Following. Oper. Res. 1961, 9, 209–229. [Google Scholar] [CrossRef]
- Gipps, P.G. A behavioural car-following model for computer simulation. Transp. Res. Part B Methodol. 1981, 15, 105–111. [Google Scholar] [CrossRef]
- Bando, M.; Hasebe, K.; Nakayama, A.; Shibata, A.; Sugiyama, Y. Dynamical model of traffic congestion and numerical simulation. Phys. Rev. E 1995, 51, 1035–1042. [Google Scholar] [CrossRef] [PubMed]
- Helbing, D.; Tilch, B. Generalized force model of traffic dynamics. Phys. Rev. E 1998, 58, 133–138. [Google Scholar] [CrossRef]
- Jiang, R.; Wu, Q.; Zhu, Z. Full velocity difference model for a car-following theory. Phys. Rev. E 2001, 64, 017101. [Google Scholar] [CrossRef]
- Treiber, M.; Helbing, D. Memory effects in microscopic traffic models and wide scattering in flow-density data. Phys. Rev. E 2003, 68, 046119. [Google Scholar] [CrossRef]
- Han, J.; Shi, H.; Chen, L.; Li, H.; Wang, X. The Car-Following Model and Its Applications in the V2X Environment: A Historical Review. Future Internet 2022, 14, 14. [Google Scholar] [CrossRef]
- Han, J.; Wang, X.; Wang, G. Modeling the Car-Following Behavior with Consideration of Driver, Vehicle, and Environment Factors: A Historical Review. Sustainability 2022, 14, 8179. [Google Scholar] [CrossRef]
- Nagatani, T. Stabilization and enhancement of traffic flow by the next-nearest-neighbor interaction. Phys. Rev. E 1999, 60, 6395–6401. [Google Scholar] [CrossRef] [PubMed]
- Lenz, H.; Wagner, C.; Sollacher, R. Multi-anticipative car-following model. Eur. Phys. J. B 1999, 7, 331–335. [Google Scholar] [CrossRef]
- Ge, H.X.; Dai, S.Q.; Dong, L.Y.; Xue, Y. Stabilization effect of traffic flow in an extended car-following model based on an intelligent transportation system application. Phys. Rev. E 2004, 70, 066134. [Google Scholar] [CrossRef]
- Li, Z.-P.; Liu, Y.-C. Analysis of stability and density waves of traffic flow model in an ITS environment. Eur. Phys. J. B 2006, 53, 367–374. [Google Scholar] [CrossRef]
- Yu, L.; Shi, Z.; Zhou, B. Kink–Antikink Density Wave of an Extended Car-Following Model in a Cooperative Driving System. Commun. Nonlinear Sci. Numer. Simul. 2008, 13, 2167–2176. [Google Scholar] [CrossRef]
- Xie, D.F.; Gao, Z.Y.; Zhao, X.M. Stabilization of Traffic Flow Based on the Multiple Information of Preceding Cars. Commun. Comput. Phys. 2008, 3, 899–912. [Google Scholar]
- Peng, G.; Sun, D. A dynamical model of car-following with the consideration of the multiple information of preceding cars. Phys. Lett. A 2010, 374, 1694–1698. [Google Scholar] [CrossRef]
- Peng, G. Stabilisation Analysis of Multiple Car-Following Model in Traffic Flow. Chin. Phys. B 2010, 19, 056401. [Google Scholar] [CrossRef]
- Li, Y.; Sun, D.; Liu, W.; Zhang, M.; Zhao, M.; Liao, X.; Tang, L. Modeling and Simulation for Microscopic Traffic Flow Based on Multiple Headway, Velocity and Acceleration Difference. Nonlinear Dyn. 2011, 66, 15–28. [Google Scholar] [CrossRef]
- Sun, D.; Kang, Y.; Yang, S. A novel car following model considering average speed of preceding vehicles group. Phys. A Stat. Mech. Appl. 2015, 436, 103–109. [Google Scholar] [CrossRef]
- Kuang, H.; Xu, Z.-P.; Li, X.-L.; Lo, S.-M. An extended car-following model accounting for the average headway effect in intelligent transportation system. Phys. A Stat. Mech. Appl. 2017, 471, 778–787. [Google Scholar] [CrossRef]
- Guo, Y.; Xue, Y.; Shi, Y.; Wei, F.-P.; Lü, L.-Z.; He, H.-D. Mean-field velocity difference model considering the average effect of multi-vehicle interaction. Commun. Nonlinear Sci. Numer. Simul. 2018, 59, 553–564. [Google Scholar] [CrossRef]
- Zhu, W.-X.; Zhang, L.-D. A new car-following model for autonomous vehicles flow with mean expected velocity field. Phys. A Stat. Mech. Appl. 2018, 492, 2154–2165. [Google Scholar] [CrossRef]
- Kuang, H.; Wang, M.-T.; Lu, F.-H.; Bai, K.-Z.; Li, X.-L. An extended car-following model considering multi-anticipative average velocity effect under V2V environment. Phys. A Stat. Mech. Appl. 2019, 527, 121268. [Google Scholar] [CrossRef]
- Nakayama, A.; Sugiyama, Y.; Hasebe, K. Effect of looking at the car that follows in an optimal velocity model of traffic flow. Phys. Rev. E 2001, 65, 016112. [Google Scholar] [CrossRef]
- Hasebe, K.; Nakayama, A.; Sugiyama, Y. Dynamical model of a cooperative driving system for freeway traffic. Phys. Rev. E 2003, 68, 026102. [Google Scholar] [CrossRef]
- Yu, L.; Shi, Z. Nonlinear Analysis of an Extended Traffic Flow Model in ITS Environment. Chaos Solitons Fractals 2008, 36, 550–558. [Google Scholar] [CrossRef]
- Sun, D.-H.; Liao, X.-Y.; Peng, G.-H. Effect of looking backward on traffic flow in an extended multiple car-following model. Phys. A Stat. Mech. Appl. 2011, 390, 631–635. [Google Scholar] [CrossRef]
- Sun, D.-H.; Zhang, J.; Zhao, M.; Tian, C. Effect of backward looking and velocity difference in an extended car following model. J. Sichuan Univ. (Nat. Sci. Ed.) 2012, 49, 115–120. [Google Scholar]
- Sawada, S. Nonlinear Analysis of a Differential-Difference Equation with next-Nearest-Neighbour Interaction for Traffic Flow. J. Phys. Math. Gen. 2001, 34, 11253. [Google Scholar] [CrossRef]
- Jin, Y.; Xu, M.; Gao, Z. KdV and Kink-Antikink Solitons in an Extended Car-Following Model. J. Comput. Nonlinear Dyn. 2011, 6, 011018. [Google Scholar] [CrossRef]
- Yu, S.-W.; Shi, Z.-K. An Improved Car-Following Model with Two Preceding Cars’ Average Speed. Int. J. Mod. Phys. C 2015, 26, 1550094. [Google Scholar] [CrossRef]
- Sun, Y.; Ge, H.; Cheng, R. An Extended Car-Following Model under V2V Communication Environment and Its Delayed-Feedback Control. Phys. Stat. Mech. Its Appl. 2018, 508, 349–358. [Google Scholar] [CrossRef]
- Zhu, W.-X.; Zhang, H.M. Analysis of Mixed Traffic Flow with Human-Driving and Autonomous Cars Based on Car-Following Model. Phys. Stat. Mech. Its Appl. 2018, 496, 274–285. [Google Scholar] [CrossRef]
- Cheng, R.; Li, S.; Ge, H. An Extended Car-Following Model Accounting for Two Preceding Vehicles with Mixed Maximum Velocity. Mod. Phys. Lett. B 2021, 35, 2150238. [Google Scholar] [CrossRef]
- Ponnu, B.; Coifman, B. Speed-spacing dependency on relative speed from the adjacent lane: New insights for car following models. Transp. Res. Part B Methodol. 2015, 82, 74–90. [Google Scholar] [CrossRef]
- Ponnu, B.; Coifman, B. When adjacent lane dependencies dominate the uncongested regime of the fundamental relationship. Transp. Res. Part B Methodol. 2017, 104, 602–615. [Google Scholar] [CrossRef]
- Coifman, B.; Ponnu, B. Adjacent lane dependencies modulating wave velocity on congested freeways-An empirical study. Transp. Res. Part B Methodol. 2020, 142, 84–99. [Google Scholar] [CrossRef]
- Chowdhury, D. Statistical physics of vehicular traffic and some related systems. Phys. Rep. 2000, 329, 199–329. [Google Scholar] [CrossRef]
- Han, J.; Zhang, J.; Wang, X.; Liu, Y.; Wang, Q.; Zhong, F. An Extended Car-Following Model Considering Generalized Preceding Vehicles in V2X Environment. Future Internet 2020, 12, 216. [Google Scholar] [CrossRef]
- Whitham, G.B. Exact solutions for a discrete system arising in traffic flow. Proc. R. Soc. Lond. Ser. A Math. Phys. Sci. 1990, 428, 49–69. [Google Scholar] [CrossRef]
- Ge, H.X.; Cheng, R.J.; Dai, S.Q. KdV and kink–antikink solitons in car-following models. Phys. A Stat. Mech. Appl. 2005, 357, 466–476. [Google Scholar] [CrossRef]
Disclaimer/Publisher’s Note: The statements, opinions and data contained in all publications are solely those of the individual author(s) and contributor(s) and not of MDPI and/or the editor(s). MDPI and/or the editor(s) disclaim responsibility for any injury to people or property resulting from any ideas, methods, instructions or products referred to in the content. |
© 2025 by the authors. Licensee MDPI, Basel, Switzerland. This article is an open access article distributed under the terms and conditions of the Creative Commons Attribution (CC BY) license (https://creativecommons.org/licenses/by/4.0/).

