Article

A Contribution to the Temperature Particles Method—Implementation of a Large-Eddy Simulation (LES) Model for the Temperature Field

by
Tiago Raimundo Chiaradia
1,
Gabriel Ferraz Marcondes de Carvalho
1,
Alex Mendonça Bimbato
2 and
Luiz Antonio Alcântara Pereira
1,*
1
Mechanical Engineering Institute, Federal University of Itajubá (UNIFEI), Itajubá 37500-903, Brazil
2
School of Engineering and Sciences, São Paulo State University (UNESP), Guaratinguetá 12516-410, Brazil
*
Author to whom correspondence should be addressed.
Appl. Sci. 2025, 15(8), 4122; https://doi.org/10.3390/app15084122
Submission received: 9 March 2025 / Revised: 3 April 2025 / Accepted: 7 April 2025 / Published: 9 April 2025

Abstract

:
This paper introduces a numerical methodology for the investigation of two-dimensional, incompressible and unsteady flows. The analyses involve Fluid–Structure Interaction (FSI) over solid boundaries of known shape with effects of mixed convection heat transfer. The main contribution is the implementation of a Large-Eddy Simulation (LES) model for the energy equation. LES is a mathematical model for simulating turbulent flows. The Boussinesq approximation links the vorticity transport equation with the energy equation to include buoyancy forces. The methodology consists of discretizing the vorticity field and heat by using particles (computational points), which characterizes a purely Lagrangian description. The vorticity field is discretized by using Lamb discrete vortices (vortex blobs) and the heat by using temperature particles. The velocity field is computed over each particle as the vortex cloud contribution requires high computational cost. The buoyancy forces computation is necessary over each vortex blob because of the temperature particles and also requires high computational cost. Thus, all those computations involving particles interactions demand the use of parallel computing in OpenMP-Fortran. The turbulence calculation makes use of the second-order velocity structure function model; that computation is necessary over each computational point during every time increment of a typical numerical simulation. As examples of application, two problems are chosen: nominally, the flow around a single circular cylinder and the interaction of airplane wake vortices with a ground plane. The numerical results are compared with experimental data, exhibiting very good agreement with the expected physics for each investigated problem.

1. Introduction

Fluid–Structure Interaction (FSI) is a common problem in fluid mechanics and heat transfer; it occurs when a fluid flow interacts with a solid structure and exerts pressure and/or thermal loads onto the structure. This kind of viscous flow is nonlinear multi-physics with a variety of applications in different engineering areas. In this application field, flows of air or water around solid boundaries appear in the case of buildings, cables, chimneys, heat exchangers, landing gears, marine risers, power lines, struts, airplane wingtip vortices, etc.
The constant evolution of the computational mechanics area has allowed researchers around the world to provide more refined numerical solutions aiming to solve FSI problems. The numerical methods using Lagrangian description are an interesting alternative to the traditional Eulerian methods [1,2,3,4,5,6]. The first version of the Discrete Vortex Method (DVM) using Lagrangian description, and that incorporated viscous effects, was developed by Chorin [7]. The Temperature Particles Method (TPM) was a natural extension of the DVM, where two different kinds of particles are required [8,9,10,11]. In the TPM, in addition to the vorticity field, the heat is also discretized and represented by temperature particles. In this extension, the vorticity field can be modified by the presence of heat; the latter introduces buoyancy forces on vortical structures [10,11].
Mimeau and Mortazavi [12] presented a detailed review of the vortex methods, discussing the mathematical framework, the strengths and limits. The authors also pointed out that future vortex computations will undoubtedly need to be continually strengthened with novel high-performance computing parallelism techniques and powerful algorithms, since it is necessary to achieve more complex flow approximations. Narsipur et al. [13] developed a DVM related to perching and hovering maneuvers, which are two bio-inspired flight maneuvers with applicability in engineering, especially for small-scale uncrewed air vehicles. Zou et al. [14] applied the DVM to develop an accurate and efficient dynamic model for robotic fish. Kumar et al. [15] performed numerical simulations of the flapping motion of a rectangular wing using the DVM. The paper investigated the parametric dependence of kinematic parameters, such as the asymmetric ratio, aspect ratio and reduced frequency on the aerodynamic performance. Wang et al. [16] numerically simulated the VIV of a deepwater drilling riser in the time domain based on the DVM. The study has significance for guiding the optimal design and engineering control of deepwater drilling risers. However, these authors did not clarify the mechanism of heat transfer with turbulence resolving methods, which also motivated the present paper to contribute to the literature. In this research line, our research group has contributed to the development of a (Lagrangian) TPM in the last two decades [11,17]. Moraes et al. [11] introduced buoyancy forces into the methodology; however, turbulence modeling was not incorporated. Carvalho et al. [17] considered turbulence modeling and a surface roughness model with no heat transfer.
In the Lagrangian manner: (a) a cloud of free particles (computational points) is used to discretize some property of interest (e.g., vorticity or heat), which can be generated from the surface of a body and develops into the boundary layer and viscous wake; (b) the absence of a mesh eliminates problems of numerical stability and need of mesh refinement related to Eulerian schemes applied for higher Reynolds number flows; (c) it is not necessary to explicitly treat advective derivatives; (d) all the calculations are restricted to the rotational flow regions and no explicit choice of the outer boundaries is needed a priori; (e) no boundary conditions are required far from the solid boundaries; and (f) the use of two-dimensional LES-based turbulence modeling is suitable to stabilize the numerical solution and provides a basis for the development of a surface roughness model. The advantage of combining the LES model and TPM is that the concept of velocity fluctuations (differences in velocity) is used instead of the rate of deformation (derivatives). In other words, the local turbulence effect is computed during simulation of the diffusion of vorticity and heat. The calculations of the local eddy viscosity coefficient and turbulent thermal diffusivity coefficient are performed on every vortex blob and on every temperature particle, respectively. These computations include the effect of the small scales through the concept of differences of velocity among vortex blobs and differences of velocity between temperature particles and vortex blobs. The support to the turbulence modeling success is that every particle needs to move with the local fluid velocity to simulate the advection processes, and the velocity induced at every particle is preliminarily computed in the same time increment of the numerical simulation.
This paper presents a numerical technique based on Lagrangian TPM for Fluid–Structure Interaction analysis considering incompressible flows with mixed convection heat transfer and turbulence modeling using a Large-Eddy Simulation (LES) type. In LES, a scale separation operator subdivides the scales into filtered field scales and unresolved scales. The main characteristic of LES for simulating turbulent flows is that large eddies of the flow depend on the geometry, while smaller ones are more universal [18]. Alcântara Pereira et al. [19] motivated by this characteristic, presented an adaptation of the computation of the second-order velocity structure function model for the DVM in two dimensions. In this strategy, for each vortex blob, during each time increment, the turbulent viscosity coefficient must be computed, which depends on the second-order velocity structure function model. In other words, that approach explicitly solves the large eddies in a calculation using the viscous splitting algorithm [7] and implicitly accounts for the small eddies by using the sub-grid-scale model (SGS model) through the computation of the turbulent viscosity coefficient over every vortex blob.
As a natural extension of the work of our research group, this study examines the performance of an in-house code based on a TPM applied for flows over a heated circular cylinder and trajectories of airplane wingtip vortices in the vicinity of a heated ground plane. The main contribution of this paper is the implementation of the SGS model for the energy equation; however, a surface roughness model is not yet employed. Two examples of solid boundary representation are presented; i.e., the circular cylinder surface is discretized and represented by flat panels with sources distribution of constant density and the ground plane is represented by the method of images [20]. This strategy guarantees the impermeability condition on the pivotal point of each flat panel and on all points of the runway ground surface; additionally, the mass conservation is ensured. The generation of Lamb discrete vortices [21] near each pivotal point of a solid boundary is necessary to ensure the no-slip condition and the global circulation conservation. The generation of temperature particles [9] near each pivotal point of a solid boundary is made through a direct interpretation of Fourier’s Law [11,22]. The buoyancy forces are computed considering the temperature induced by temperature particles on each vortex blob; this approach can be interpreted with a new term of momentum generation into the fluid domain [10]. The buoyancy forces inclusion links the vorticity transport equation with the energy equation via Boussinesq approximation. The solution of the advection of vorticity and heat is exemplified through the first-order Euler time marching scheme (cylinder case) and the second-order Adams–Bashforth time marching scheme (airplane wingtip vortices case) [23]. The solution of the diffusion of vorticity and heat is exemplified through the random-walk method [7], both including LES theory. The pressure field on a cylinder surface is obtained using an integral formulation derived from an equation of Poisson for the pressure [24].
The results obtained with the development of this numerical approach will allow advances in the physical analysis of the related mechanisms, even in two-dimensional space. The flow past a circular cylinder, for instance, provokes boundary layer development, separation and alternatively shedding vortices on both sides of the body, which induces periodically fluctuating in-line and cross-flow forces [25,26]. These mechanisms are complex, which can cause the structure to vibrate if it is elastically mounted [2,27,28,29]. In practice, when the vortex shedding frequency locks with the natural frequency of the cylindrical structure, the lock-in phenomenon can occur with large vibration amplitude, causing fatigue damage to the structure. In accordance with Rashidi et al. [30], the control of vortex shedding by thermal effects is classified as an active control method, in which external energy is necessary to affect the fluid flow. The present paper also contributes with the inclusion of buoyancy forces linked with turbulence modeling when discussing the bluff body aerodynamics.
The study of the decay of aircraft vortex wakes near a ground plane is of great interest in aviation problems to determine the hazard potential and wake lifetime [31,32,33,34,35,36]. The present paper contributes to the referred study, including turbulence modeling for both the vorticity transport equation and energy equation linked with buoyancy force and crosswind interference. Undoubtedly, the combination of crosswind with buoyancy forces will disrupt the flight of a following aircraft entering the wake of a leading aircraft, which will be a potential safety hazard. The software employed in aviation must include the combined effects of the ground plane, crosswind and buoyancy forces to simulate dissipation of the aircraft wake vortices. In general, CFD data are useful to help the development of wake models associated with systems such as “Wake Turbulence Re-Categorization or Wake Recat”.

2. Mathematical Formulation

Figure 1 illustrates a typical situation of a Fluid-Structure Interaction (FSI) problem. It can be identified by the presence of an incident flow U with constant temperature T , a solid boundary heated surface with constant temperature T w > T , defined as S w , counter-rotating vortical structures simulated by superposition of computational points (in blue), and a far-away boundary defined by S . Thus, the fluid domain Ω is delimited by boundary S = S w S . Furthermore, the presence of a thermal gradient T w T will transfer heat from the surface S w to the fluid very close to it; this phenomenon will result in heat generation and, in consequence, a modification in the dynamics of the counter-rotating vortical structures. The essence of the Temperature Particles Method (TPM) is to discretize the vortical structures using particles (computational points) known as Lamb discrete vortices, and the heat by using temperature particles [1,9,11].
The flow is assumed to be two-dimensional, incompressible and unsteady, and the fluid to be Newtonian with moderate variation in the fluid density. The latter assumption is associated with the Boussinesq approximation [11]. Taking the curl of the Navier–Stokes equations supported by the continuity equation, the vorticity transport equation for the filtered velocity field u ¯ can be obtained [19,37] as follows:
D ω ¯ D t = ω ¯ t + u ¯ j ω ¯ x j = 1 R e + ν T 2 ω ¯ x j x j + R i θ ¯ x j ,
where D / D t is related to the Lagrangian derivative, × u ¯ = ω ¯ , ν T is the turbulent viscosity coefficient. Furthermore, the Reynolds number, Richardson number and dimensionless temperature are defined, respectively, in the following manner:
R e = U D ν = Γ ν ,
where D is the cylinder diameter and Γ is the circulation strength [11,35].
R i = G r R e 2 ,   being   G r = β g ( T W T b 3 ) ν 2
the Grashof number [11],
θ ¯ = T ¯ T T W T .
The energy equation is defined as
D θ ¯ D t = θ ¯ t + u ¯ j θ ¯ x j = x j 1 R e P r + ν T R e P r T θ ¯ x j ,
where D/Dt is also related to the Lagrangian derivative, α T is the turbulent thermal diffusivity coefficient, and the Prandtl number and the turbulent Prandtl number are defined, respectively, as follows:
P r = ν α ,
P r T = ν T ( t ) α T ( t ) ,
where ν is the kinematics viscosity, α is the thermal diffusivity coefficient and 0.7 < P r T < 0.95 [18,38].
The turbulent viscosity coefficient is defined in the following manner [18,19]:
ν T ( x , , t ) = 0.105 C k 3 / 2 F ¯ 2 ( x , , t ) ,
where C k = 1.4 is the Kolmogorov constant [39] and the second-order velocity structure function is established as folllows [18,19]:
F ¯ 2 ( x , , t ) = u ¯ ( x , t ) u ¯ ( x + r , t ) ¯ r = 2 .
In Equation (9), the vorticity field induces velocity over every Lamb discrete vortex to compute the turbulent viscosity coefficient. The vorticity field also induces velocity over every temperature particle to compute the turbulent thermal diffusivity coefficient, via definition of the turbulent Prandtl number, Equation (7).
The boundary conditions necessary to solve Equation (1) are the impermeability condition and the no-slip condition over S W ; one assumes that, faraway, the perturbation caused by the body fades at S , as shown in Figure 1.
The boundary conditions required to solve Equation (5) are the temperature condition at S W and S via Equation (4), being θ = 1 on the solid surface S W and θ = 0 far from the solid surface in Figure 1.
Each Lamb discrete vortex moves with the local fluid velocity in Lagrangian description. Therefore, the filtered velocity field computation due to vortex–vortex interactions is calculated from the vorticity using the Biot–Savart Law [1,21]
u ¯ ( x , t ) = ( × G ) ( x x ) ω ( x , t ) d x = ( K ω ¯ ) ( x , t ) ,
where K = × G defines the Biot–Savart kernel, G represents the Green’s function associated to the Poisson equation, and ∗ indicates the convolution operation.

3. Numerical Solution: The Temperature Particles Method (TPM)

3.1. Particles Generation

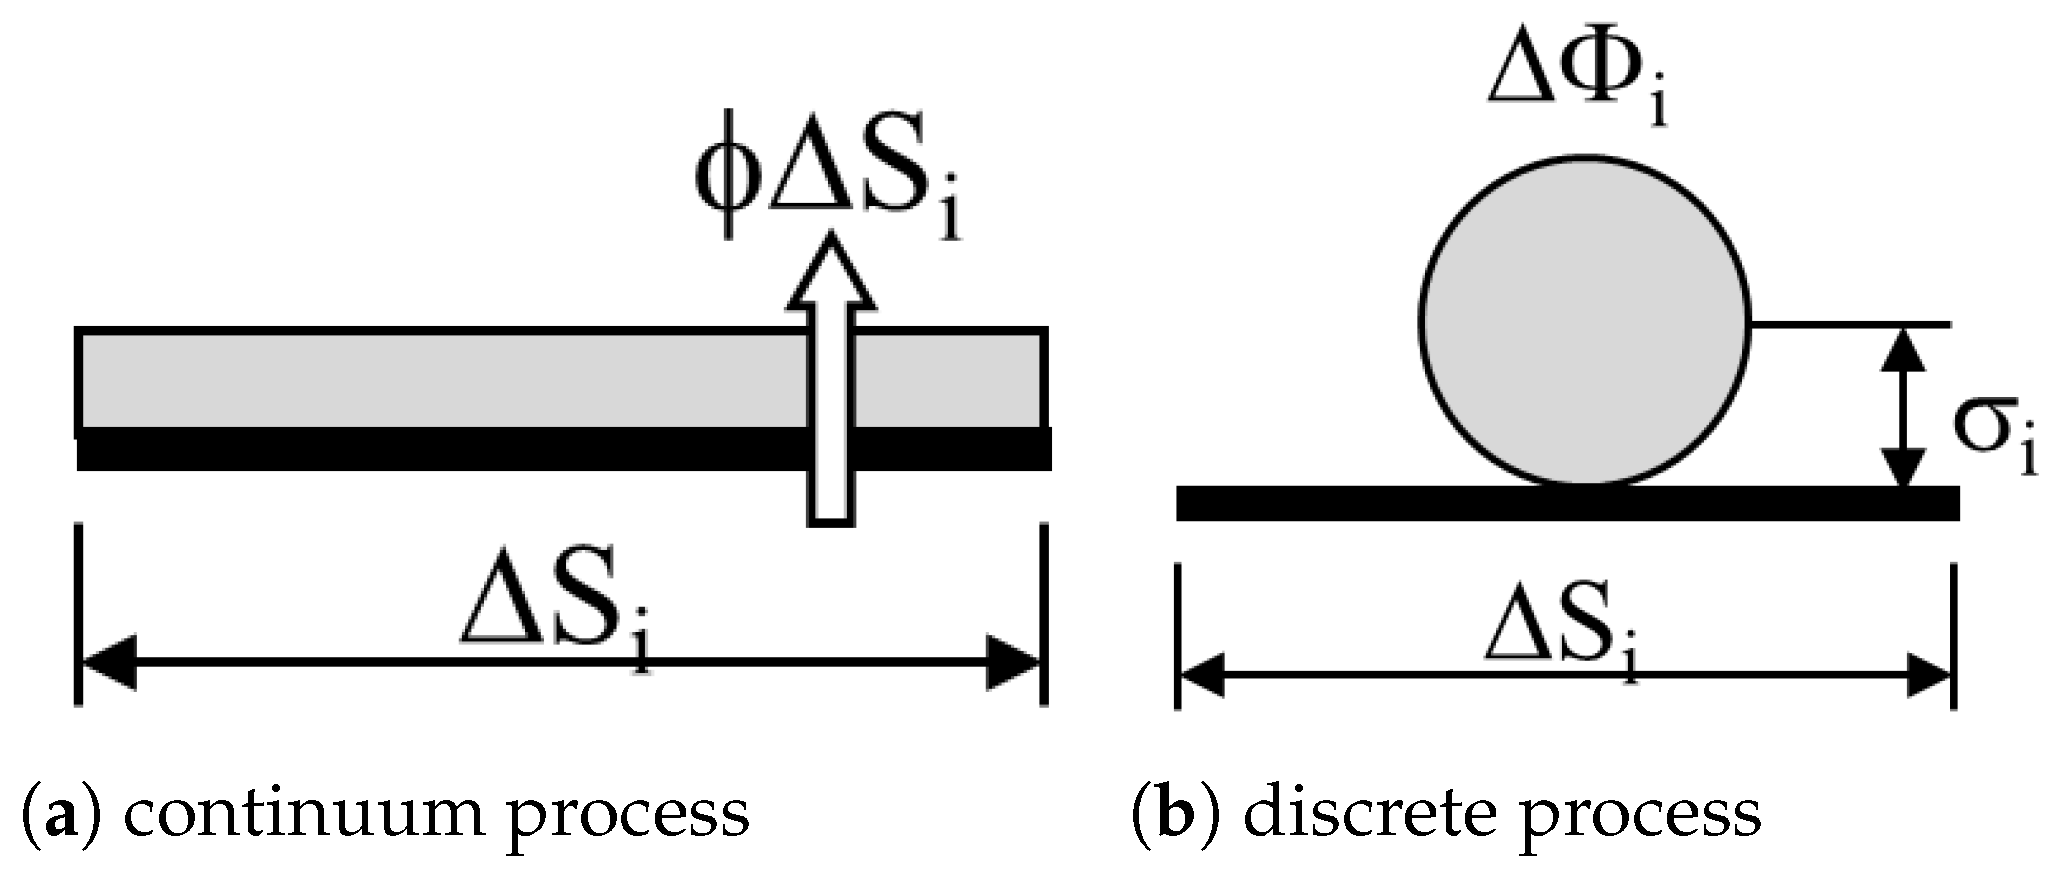
Figure 2 illustrates the idea of particles generation during every time step Δ t . A solid surface is broken into a finite number M of linear elements (or flat panels) of length Δ S i . On the center of every flat panel is placed the pivotal point; thus, M pivotal points over the solid surface are necessary to impose the problem boundary conditions.
The imposition of the no-slip condition implies the solution of a linear system of algebraic equations to generate M Lamb discrete vortices of strength Δ ϕ = Δ Γ and vortex core σ i = σ V . The global circulation condition is additionally satisfied. A cloud of Z Lamb discrete vortices induces vorticity on point j located in the fluid domain with a Gaussian basis function given by [40]:
ω j = i = 1 Z Δ Γ π σ V , i 2 exp r j i 2 σ V , i 2 .
A direct interpretation of the Fourier Law [11,22] allows to generate M temperature particles, one for every flat panel, of intensity Δ ϕ = Δ Q and temperature core σ i = σ T as follows [11]:
Δ Q i = 1 R e P r T W T i T W T Δ S i Δ t σ T , i .
A cloud of Z temperature particles similarly induces temperature on point j located in the fluid domain in the following manner [1,9]:
T j = i = 1 Z Δ Q i π σ T , i 2 exp r j i 2 σ T , i 2 .

3.2. Solid Surface Representation

The representation of a solid surface can be performed using the Panel Methods and the Method of Images [20]. The cylinder surface is represented using the Panel Methods; in this numerical approach, the imposition of the impermeability condition at every pivotal point implies the solution of another linear system of algebraic equations to generate M source singularities with constant density ϕ = σ i . The mass conservation is additionally satisfied. It is important to note that the impermeability condition and the mass conservation are simultaneously solved with the no-slip condition and the global circulation conservation, which results in two linear systems of algebraic equations to be iteratively solved via the method of least squares. The ground plane surface is represented using the mirror-image Lamb discrete vortices and mirror-image temperature particles.

3.3. Viscous Splitting Algorithm

The Temperature Particles Method relies on the discretization of the vorticity field by a linear combination of Lamb discrete vortices, and the heat by temperature particles. All particles move with the local flow velocity [7,9,41]. The motion of these particles is governed by the vorticity transport equation, Equation (1), and the energy equation, Equation (5).
The viscous term in Equation (1) can be split according to the viscous splitting algorithm proposed by Chorin [7]. Thus, the advection and the diffusion of the vorticity can be separately solved. The velocity vector of the filtered field u ¯ associated to Equation (2) is computed over the Lamb discrete vortex i due to contributions of the incident flow, source panels and vortex cloud (the Biot–Savart Law) when the circular cylinder is used. When the ground plane is used, the source panels are replaced by mirror image Lamb discrete vortices. The discrete vortices are treated as fluid material particle and the vorticity advection solution is obtained by integrating the vortex particle trajectory in the following manner [23]:
r i ( t + Δ t ) = r i ( t ) + [ α u ¯ i ( t ) β u ¯ i ( t Δ t ) ] Δ t ,
where r i is the particle position vector, u ¯ i is the velocity vector of the filtered field, α = 1 and β = 0 when using the first-order Euler scheme, and α = 1.5 and β = 0.5 when using the second-order Addams–Bashforth scheme.
On the other hand, the velocity vector computed over temperature particle i is due to contributions of the incident flow, source panels and vortex cloud for cylinder configuration. When the ground plane is used, the source panels are similarly replaced by mirror-image Lamb discrete vortices. Equation (14) is also used to calculate heat advection through a similar interpretation of the viscous splitting algorithm applied to Equation (5).
The evaluation of the velocity component u ¯ i for a cloud of Z discrete vortices using direct calculation based on Equation (10) requires Z 2 operations. Since this computational cost is very expensive, the present TPM uses parallel processing (OpenMP) in Fortran to calculate the induced velocities (vortex–vortex interaction). The induced velocity over temperature particles due to discrete vortices (vortex–temperature interaction) also uses parallel computing.
If particles migrate to the interior of a solid surface, then they are reflected from their paths.

3.4. Turbulence Modeling

The diffusive transport of the vorticity makes use of the Random-Walk Method (RWM) developed by Chorin [7] and adapted by Alcântara Pereira et al. [19] to include turbulence modeling in two dimensions. The RWM calculates the vorticity diffusion process through a displacement of each vortex particle in the following form:
ξ i V ( t ) = 4 Δ t 1 R e + ν T i ln 1 P [ cos ( 2 π Q ) x + sin ( 2 π Q ) y ] ,
where P and Q are random numbers between 0 and 1, and ν T i is the turbulent viscosity coefficient evaluated over the vortex blob i; in which Equation (8) assumes the following form for the discrete vortex i:
ν T i ( t ) = 0.105 C k 3 / 2 σ v i F ¯ 2 i ( t ) .
The second-order velocity structure function is evaluated for the discrete vortex i as follows [19,42]:
F ¯ 2 i = 1 N j = 1 N u ¯ t i ( x i ) u ¯ t j ( x i + r j ) 2 σ V i r j 2 / 3 ,
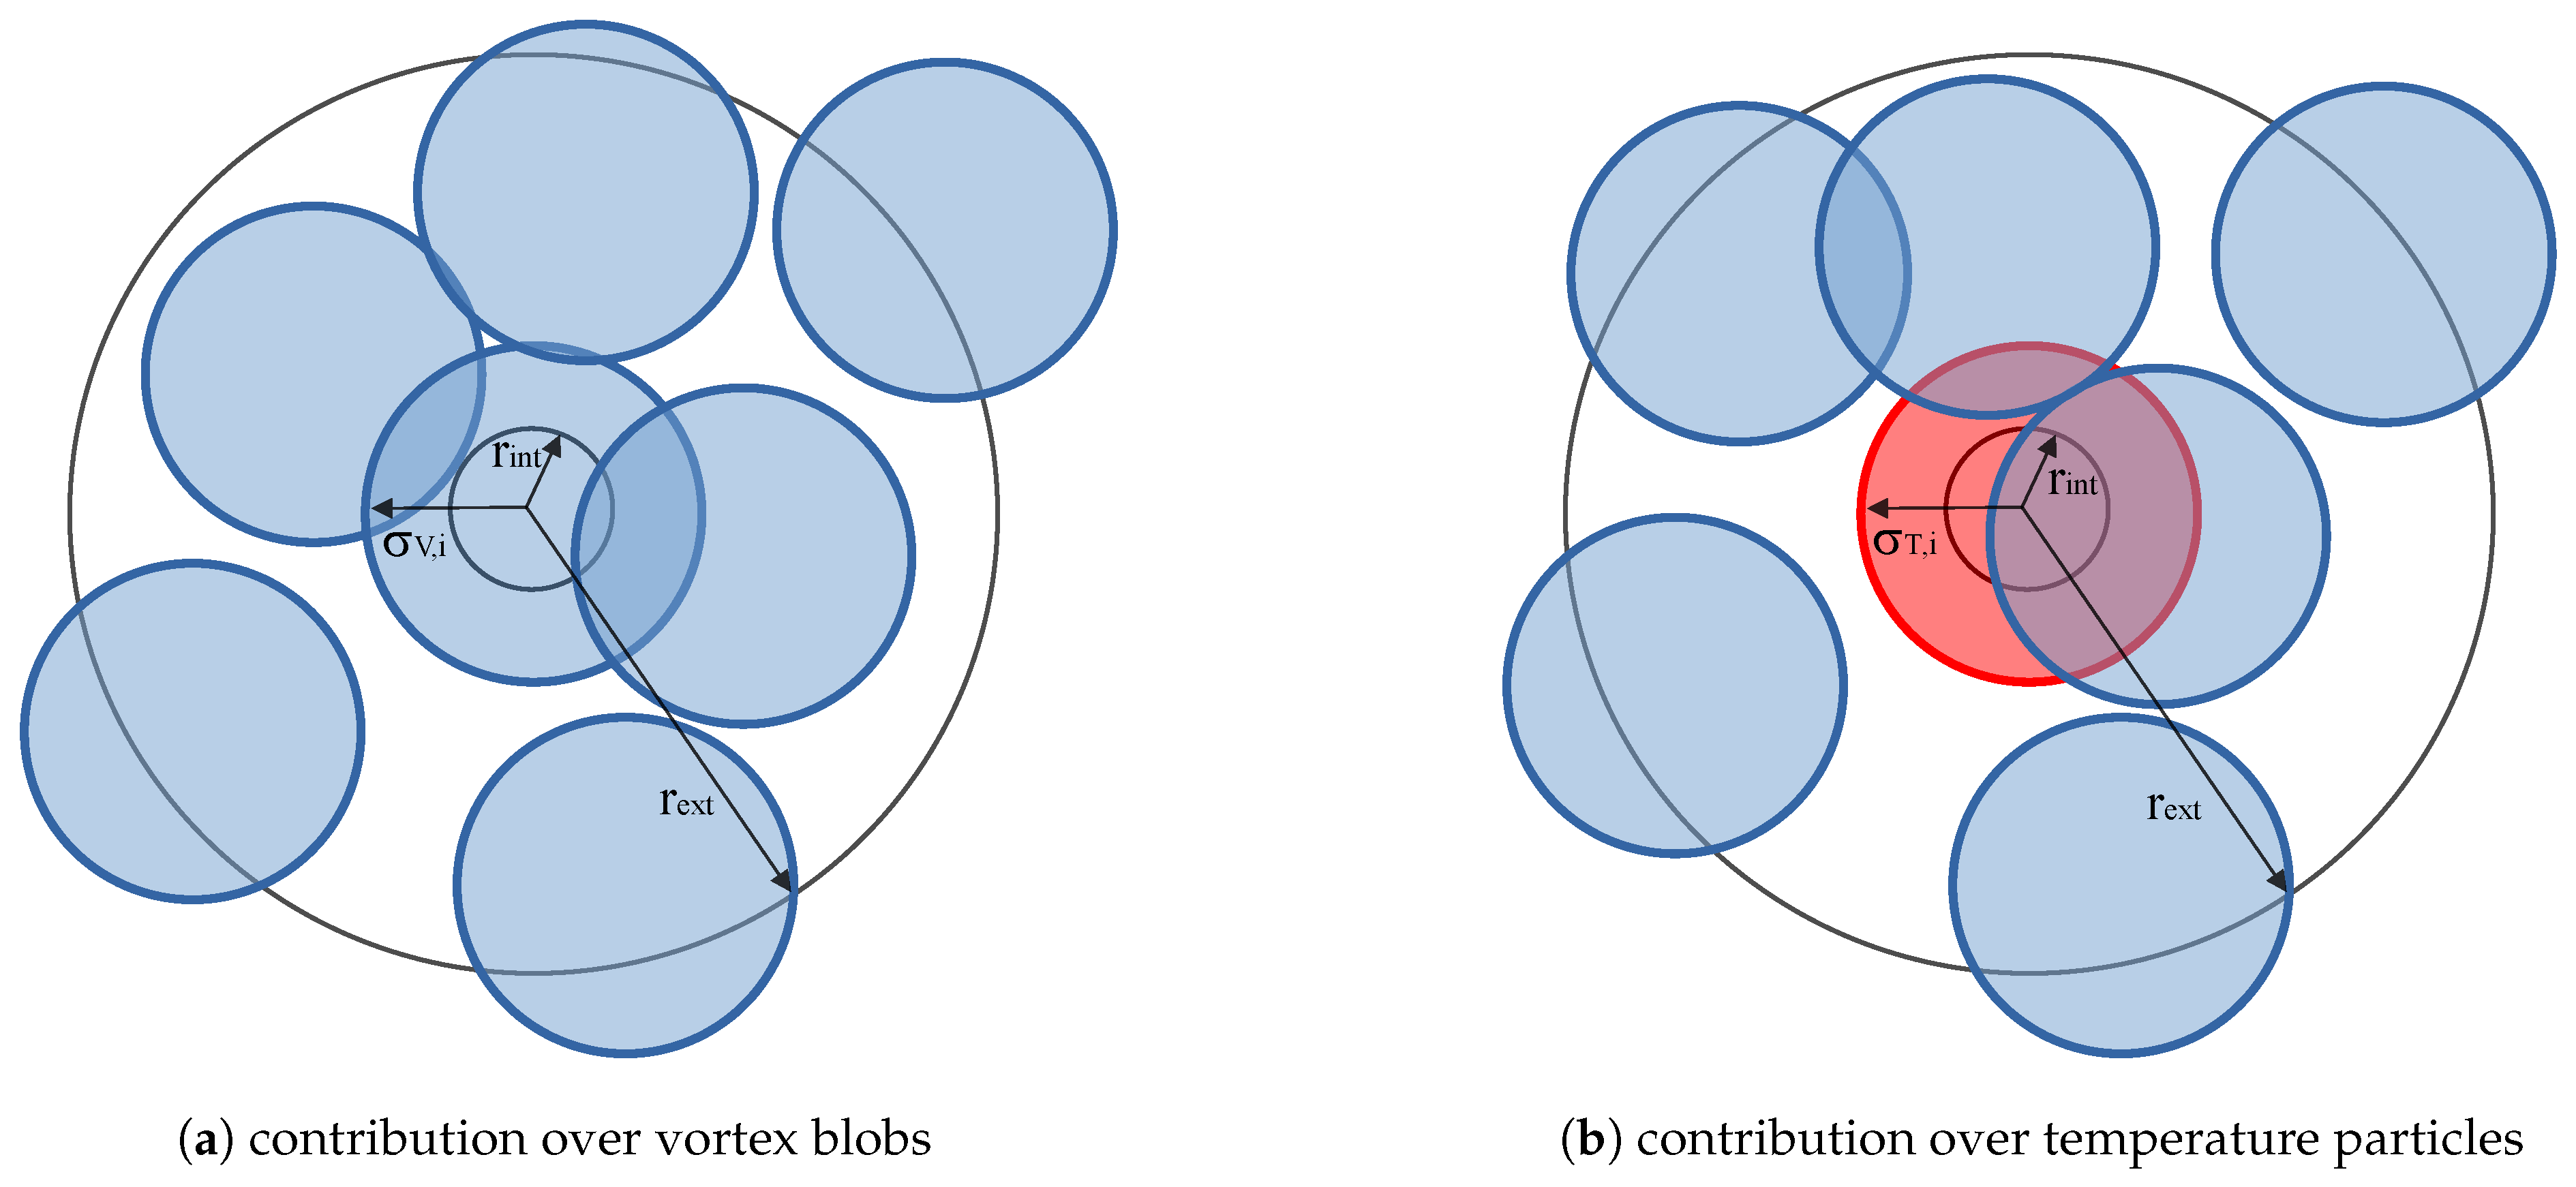
where the index i in u ¯ t refers to the discrete vortex under analysis and the index j refers to the inducing vortex; N is the number of discrete vortices inside a circular crown defined around the discrete vortex i; r j defines the distance between the j-th discrete vortex and the i-th discrete vortex belonging that group of N discrete vortices. In other words, N establishes the group of discrete vortices placed inside an annulus, centered at the i-th discrete vortex under analysis; the annulus is defined by r i n t = 0.1 σ V i and r e x t = 4.0 σ V i , r i n t and r e x t being the internal and external radius of the circular crown, respectively (see Figure 3a). For more details about the numerical implementation, please see Bimbato et al. [42]. The term ( σ V i / r j ) 2 / 3 is necessary in Equation (17) because every vortex blob existing in a circular crown is not equidistant from the vortex blob under analysis. In Lagrangian fashion, the eddy viscosity coefficient related to a vortex blob is calculated with each increment of time.
This paper contributes to the literature including turbulence modeling to evaluate the heat diffusion process via RWM in the following manner:
ξ i T ( t ) = 4 Δ t R e 1 P r + α T i P r ln 1 P [ cos ( 2 π Q ) x + sin ( 2 π Q ) y ] ,
where P and Q are new random numbers between 0 and 1; α T i is the turbulent thermal diffusivity coefficient evaluated over every temperature particle due to the vortex cloud; and the turbulent Prandtl number adopted as 0.95, Equation (7).
Figure 3b schematizes the idea of the vorticity field effect over temperature particles, which contributes to increasing the CPU time too. In this context, the second-order velocity structure function is evaluated in terms of the velocities difference between a determined particle temperature i under analysis and the vortex blobs that are present inside its circular crown according to Equation (17), which must be adapted for the cluster of temperature particles. This calculation is repeated throughout the computational points where the turbulent activity is more intense, that is, where each temperature particle is placed.
A boxes structure is also created, aiming to divide the fluid domain in a manner such that the neighborhood of each particle (vortex blob or temperature particle) under analysis can be taken into account directly in Equation (17) (see Figure 4). This strategy considerably reduces the CPU time, since the identification of which particle will be inside each circular crown is more efficient, rather than looking for the set of vortex blobs in the entire fluid domain. In Figure 4, for every time stepping, 4 l boxes are constructed to delimit the fluid domain containing the vorticity and heat, l being the box levels definition. In all test cases, l = 8 was adopted for the box levels. As a result of adopting l = 8 , the fluid domain was divided into 16 boxes in the x-direction and 16 boxes in the y-direction, generating a total of 65,536 boxes. For the level 0, L x and L y define the lengths of each side; in consequence, the length of each box for a given level is defined by Δ x = L x / 2 l and Δ y = L y / 2 l . It is important to note that for the level zero (i = 1 and j = 1), it is required to sweep all vortex blobs to compute the eddy viscosity coefficient and the turbulent thermal diffusivity coefficient, which implies a higher computational cost. The present numerical strategy becomes efficient when searching the set of vortex blobs occupying a circular crown just in the neighboring boxes of a particle under analysis. As a criterion, the neighboring boxes are distanced approximately r e x t from the particle under analysis. For example, consider the computation of the local turbulent thermal diffusivity coefficient for a group of temperature particles instantaneously placed at box 2-3 when the level 2 is chosen (see also the region marked in grey in Figure 4). It is remarkable that the intended computation is efficiently accelerated, since only the contribution of vortex blobs placed in the region marked with grey is considered. This computation also depends on the solution of Equation (17) adapted for every temperature particle.
The localization of the k-th particle from the origin, ( x 0 , y 0 ) = ( 0 , 0 ) , is related to the corresponding box in accordance with the following equations:
i = y k y 0 Δ y + 1
j = x k x 0 Δ x + 1

3.5. Buoyancy Forces

The temperature differences in the fluid domain can provoke moderate density variation, and as a consequence, the flow is set up by the buoyancy effect. Using an analogous interpretation for the viscous splitting algorithm [7], Equation (1) can be split as follows [10,11]:
ω ¯ t = R i θ ¯ x 1 ,
and the vortex particle intensity must be increased by the amount Δ Γ + due to the direct interpretation from Equation (1).
In the present TPM, the circulation definition Γ = A ω · n d A associated with the discretization of Equation (21) yields
Δ Γ + = R i θ x Δ t Δ A ,
where Δ A defines the area occupied by the vortex particle i and is defined by a core radius of σ V for every time step Δ t . The solution for the derivative in Equation (22) is given by the central difference method as follows:
d θ d x i = θ i + 1 θ i 1 2 Δ x Δ x 2 6 d 3 θ d x 3 i Δ x 4 120 d 5 θ d x 5 i ,
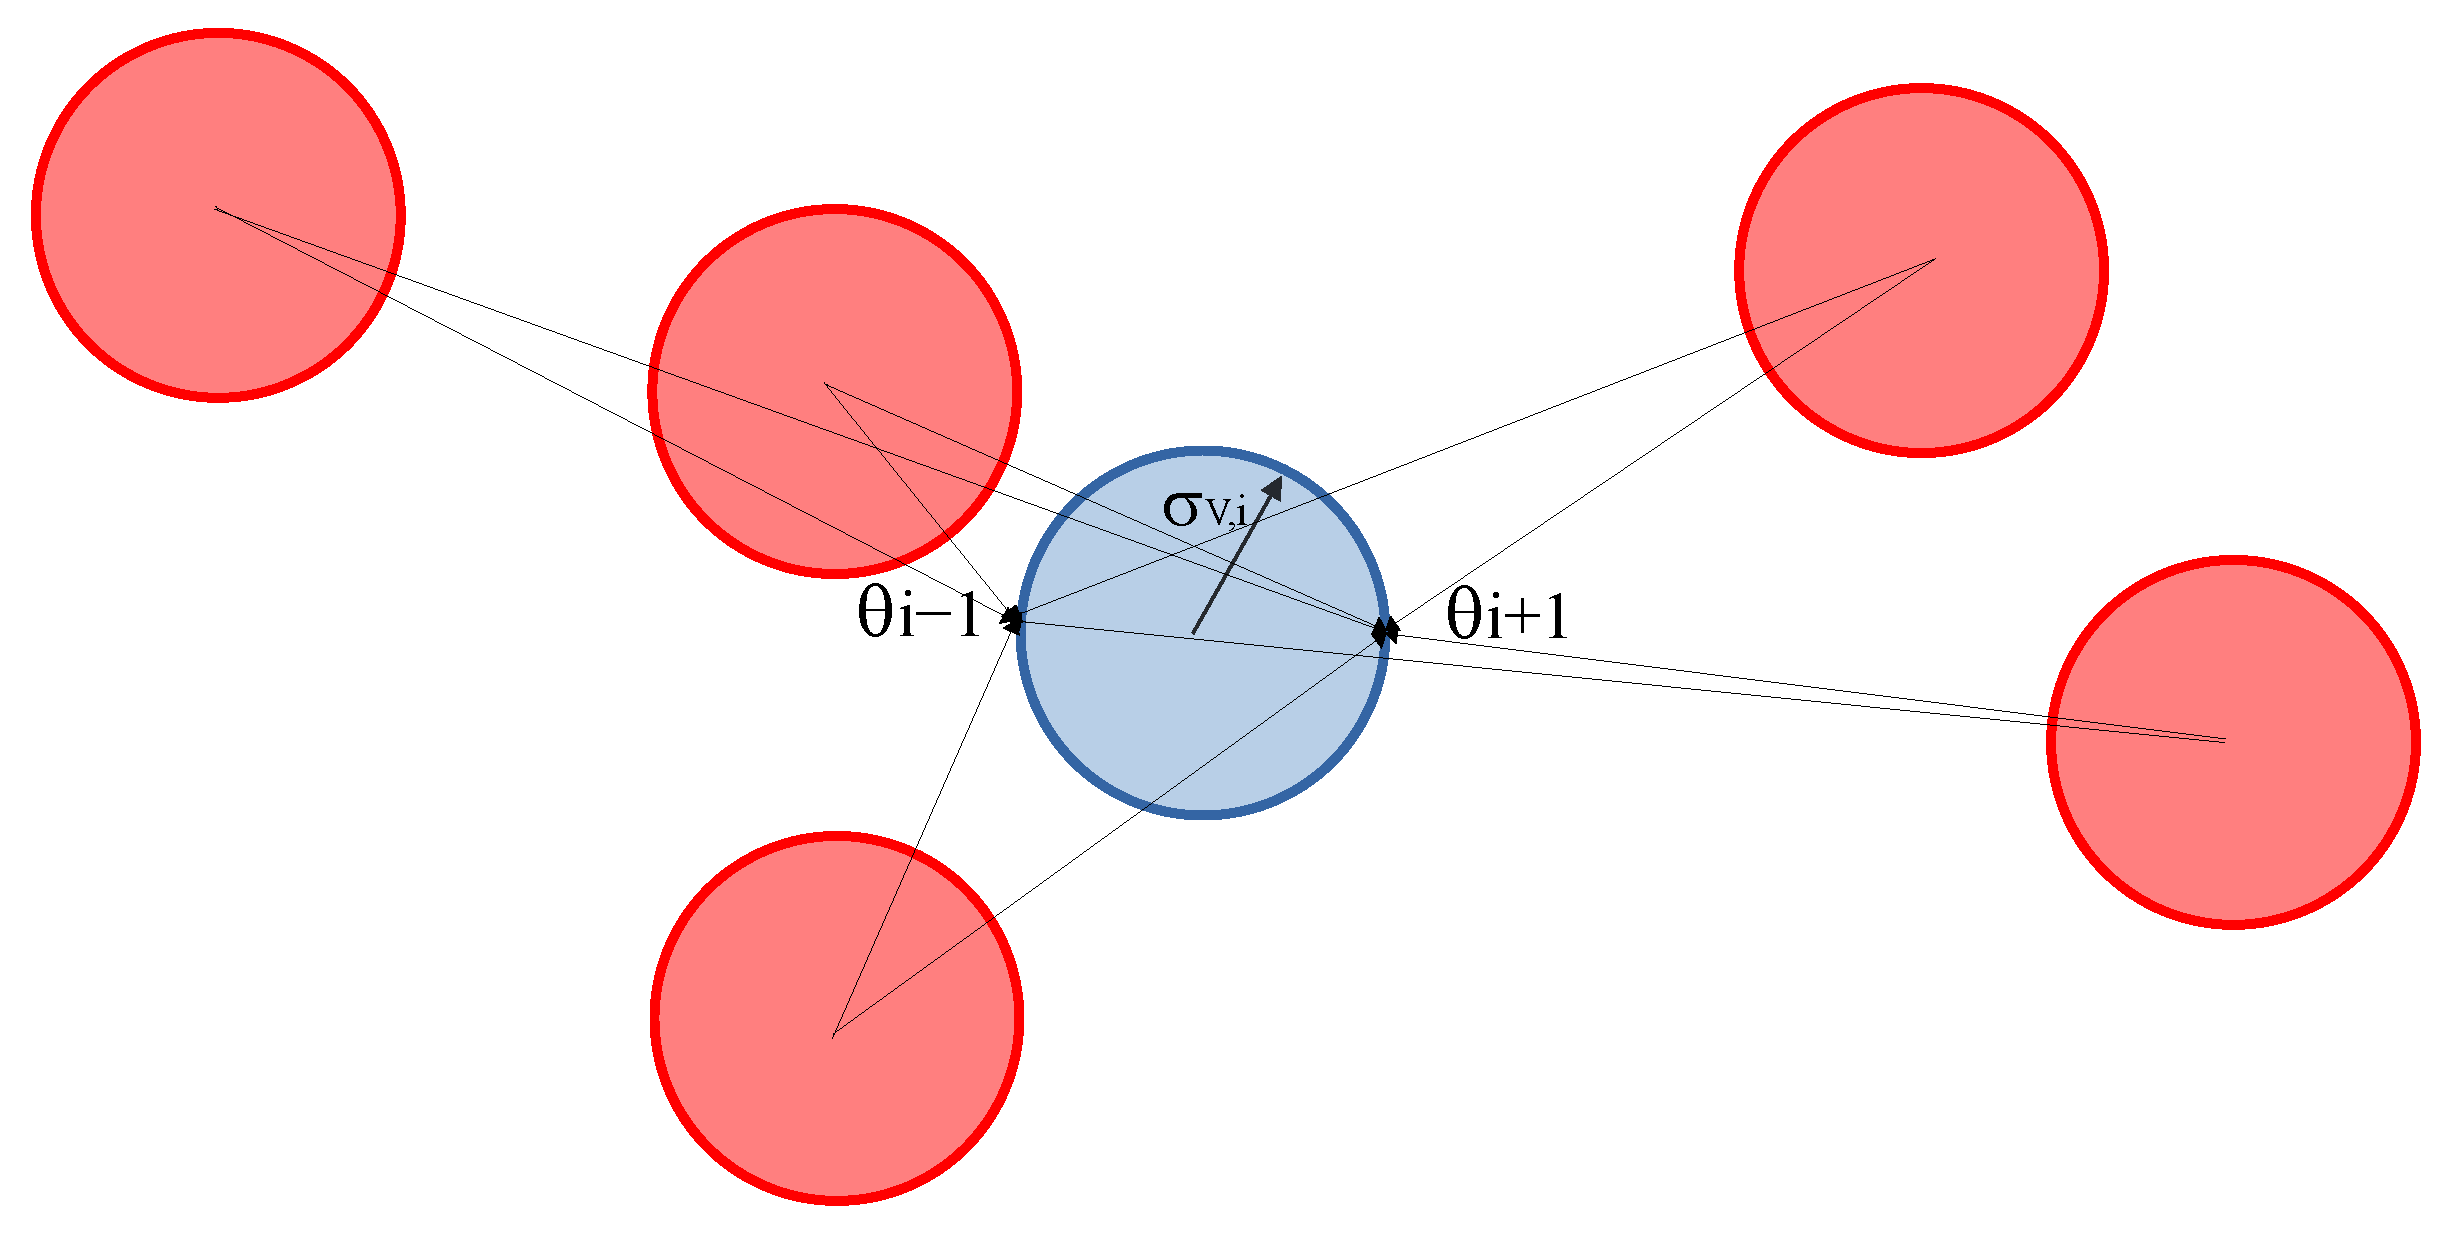
where only the first term is considered with Δ x representing the core radius of the vortex blob i. In this numerical strategy, the clustering of temperature particles into the fluid domain is necessary to compute the dimensionless temperatures θ i + 1 and θ i 1 in the neighborhood of the vortex blob i under analysis (see Figure 5). This computation is interpreted as a new source term of momentum for the TPM, in which moderate temperature gradients change the intensity of the vortex blobs numerically simulating large vortical structures of the flow. The interaction between all the particles in the fluid domain also results in a high computational cost, which requires the use of parallel processing (OpenMP) in Fortran.

3.6. Pressure Field and Aerodynamic Forces

When the curl operator is applied over the Navier–Stokes equations, it is clear that the pressure term is absent from the vorticity transport equation, Equation (1). The filtered pressure field can be recuperated by taking the divergence operator to the Navier–Stokes equations, resulting in a pressure Poisson equation with its solution given by the following integral formulation [24]:
H Y ¯ P S W Y ¯ Ξ p · e n d S = Ω Ξ p · ( u ¯ × ω ¯ ) d Ω 1 R e S W ( Ξ P × ω ¯ ) · e n d S ,
p being the point placed in the fluid domain Ω where the pressure can be calculated (H = 1 in the fluid domain and H = 0.5 on a solid surface, as S W in Figure 1); Ξ represents the fundamental solution of the Laplace equation, and e n defines the unit vector normal to the solid surface. In Equation (24), the stagnation pressure is defined as follows:
Y ¯ = p ¯ ρ + u ¯ 2 2 ,
where p ¯ is the static pressure, ρ is the fluid density and u ¯ is the velocity vector of the filtered field.
Finally, the drag and lift coefficients can be computed, respectively, as follows [42]:
C D = p = 1 M 2 ( p ¯ p p ) Δ S p sin ( β p ) = p = 1 M C P p Δ S p sin ( β p )
C L = p = 1 M 2 ( p ¯ p p ) Δ S p cos ( β p ) = p = 1 M C P p Δ S p cos ( β p )
where M is the number of flat panels, p refers to the reference pressure far from the solid surface S W , Δ S p is the length of the p-th flat panel and β p is the angle of the same flat panel.

4. Results and Discussion

In the following subsections, the numerical results will be discussed in detail. First, the results of the flow around a single circular cylinder without and with heat transfer are shown in Section 4.1. A key factor in the formation of the classical von Kármán vortex street is the mutual interaction between two separating shear layers, as described by Gerrard [25] and reproduced here. In Section 4.2, the problem of counter-rotating vortices from wingtips in the vicinity of a ground plane without and with heat transfer is investigated.

4.1. Single Circular Cylinder

The values of the cylinder diameter, inlet flow velocity, Reynolds number, Prandtl number and Richardson number are presented in Table 1.
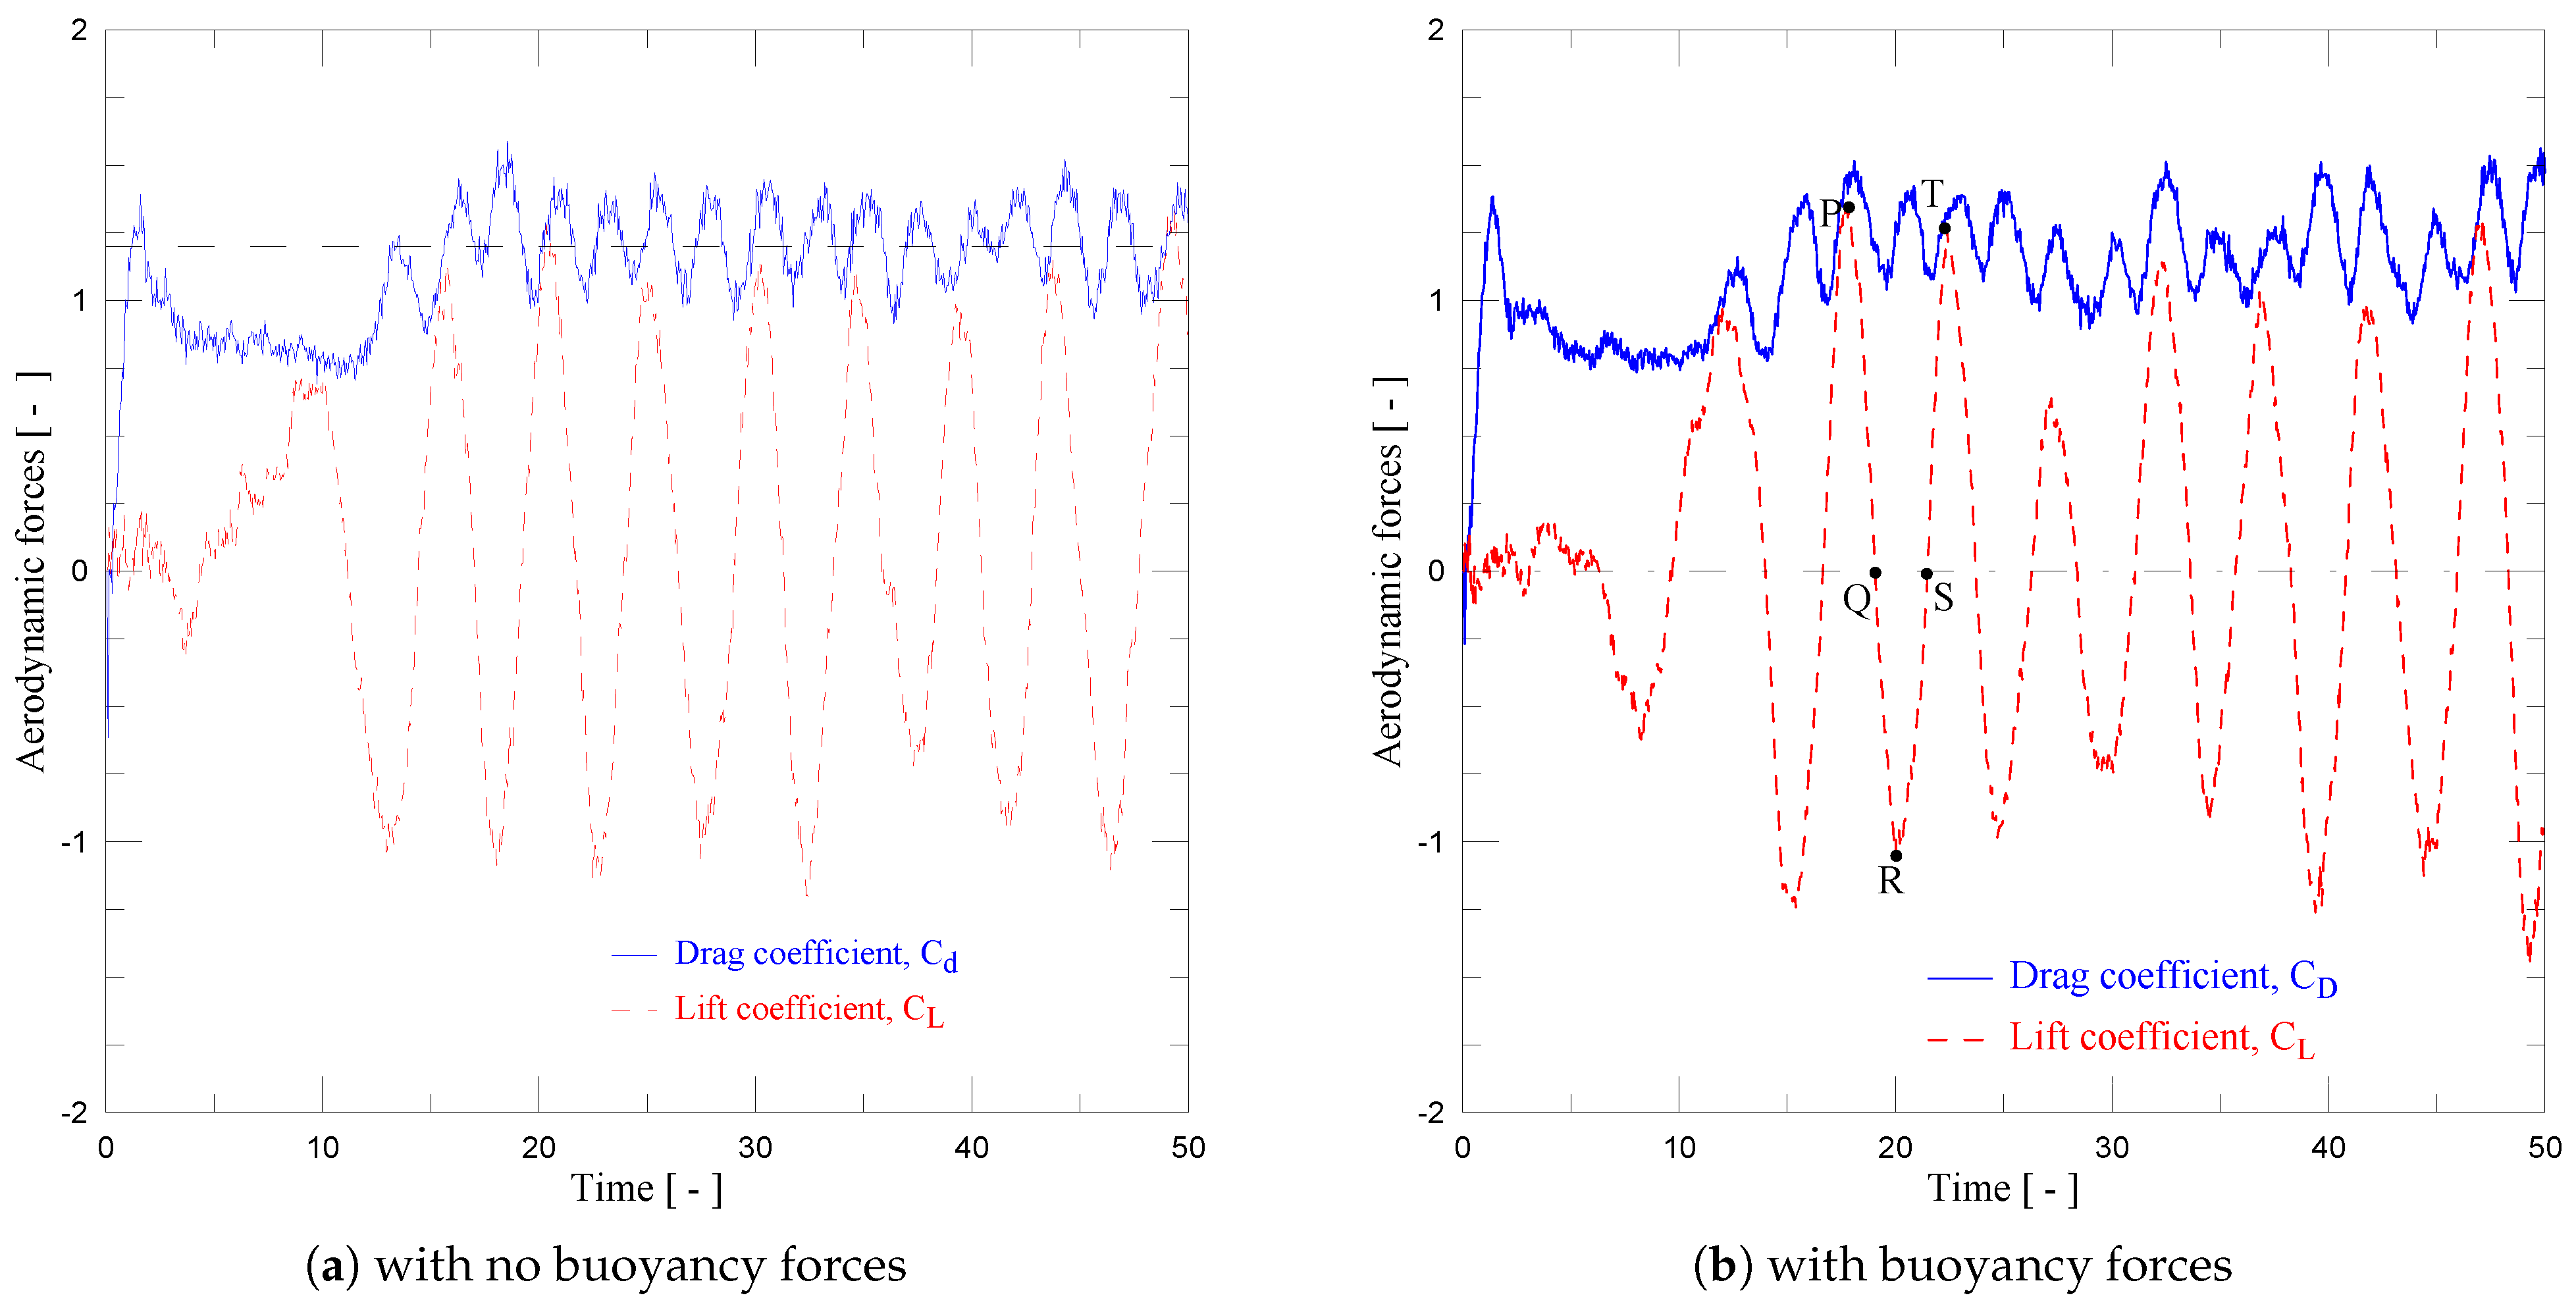
Previous investigations by our group have also validated the following simulation data: core radius of σ V = σ T = 0.001 and M = 300 flat panels. The simulated cases for Ri = 0 and 0.168 (with buoyancy forces) were performed with 1000 time steps of magnitude Δ t = 0.05 . Both simulations used LES turbulence modeling and the time history of the drag and lift coefficients are shown in Figure 6. The vortex shedding mechanism can be clearly identified in the oscillations of the drag and lift coefficients. Figure 6a,b show that a numerical transient is over and the periodic steady state regime is reached (from t = 10 on, approximately); in consequence, the lift coefficient starts to present a variation between −1.25 and 1.25, approximately, with a dimensionless frequency (Strouhal number, St) about twice the frequency of the drag coefficient, in accordance to the expected physics for the problem, i.e., the fluctuation of the drag coefficient has twice the frequency of the lift coefficient, since the drag curve fluctuates once for each of the upper and lower sheddings of the vortical structures in the cylinder surface. The lift curve oscillates for each pair of counter-rotating vortical structures from the cylinder surface.
The mean results for the drag and lift coefficients and the Strouhal number are shown in Table 2. The simulation indicated that when the buoyancy effects were taken into account, the drag coefficient reduced, followed by a slight reduction in the Strouhal number. These results also show good agreement with experimental data obtained by Blevins [43], which are C d = 1 . 20 ± 10 % and St = 0 . 19 ± 10 % for R e = 100 , 000 .
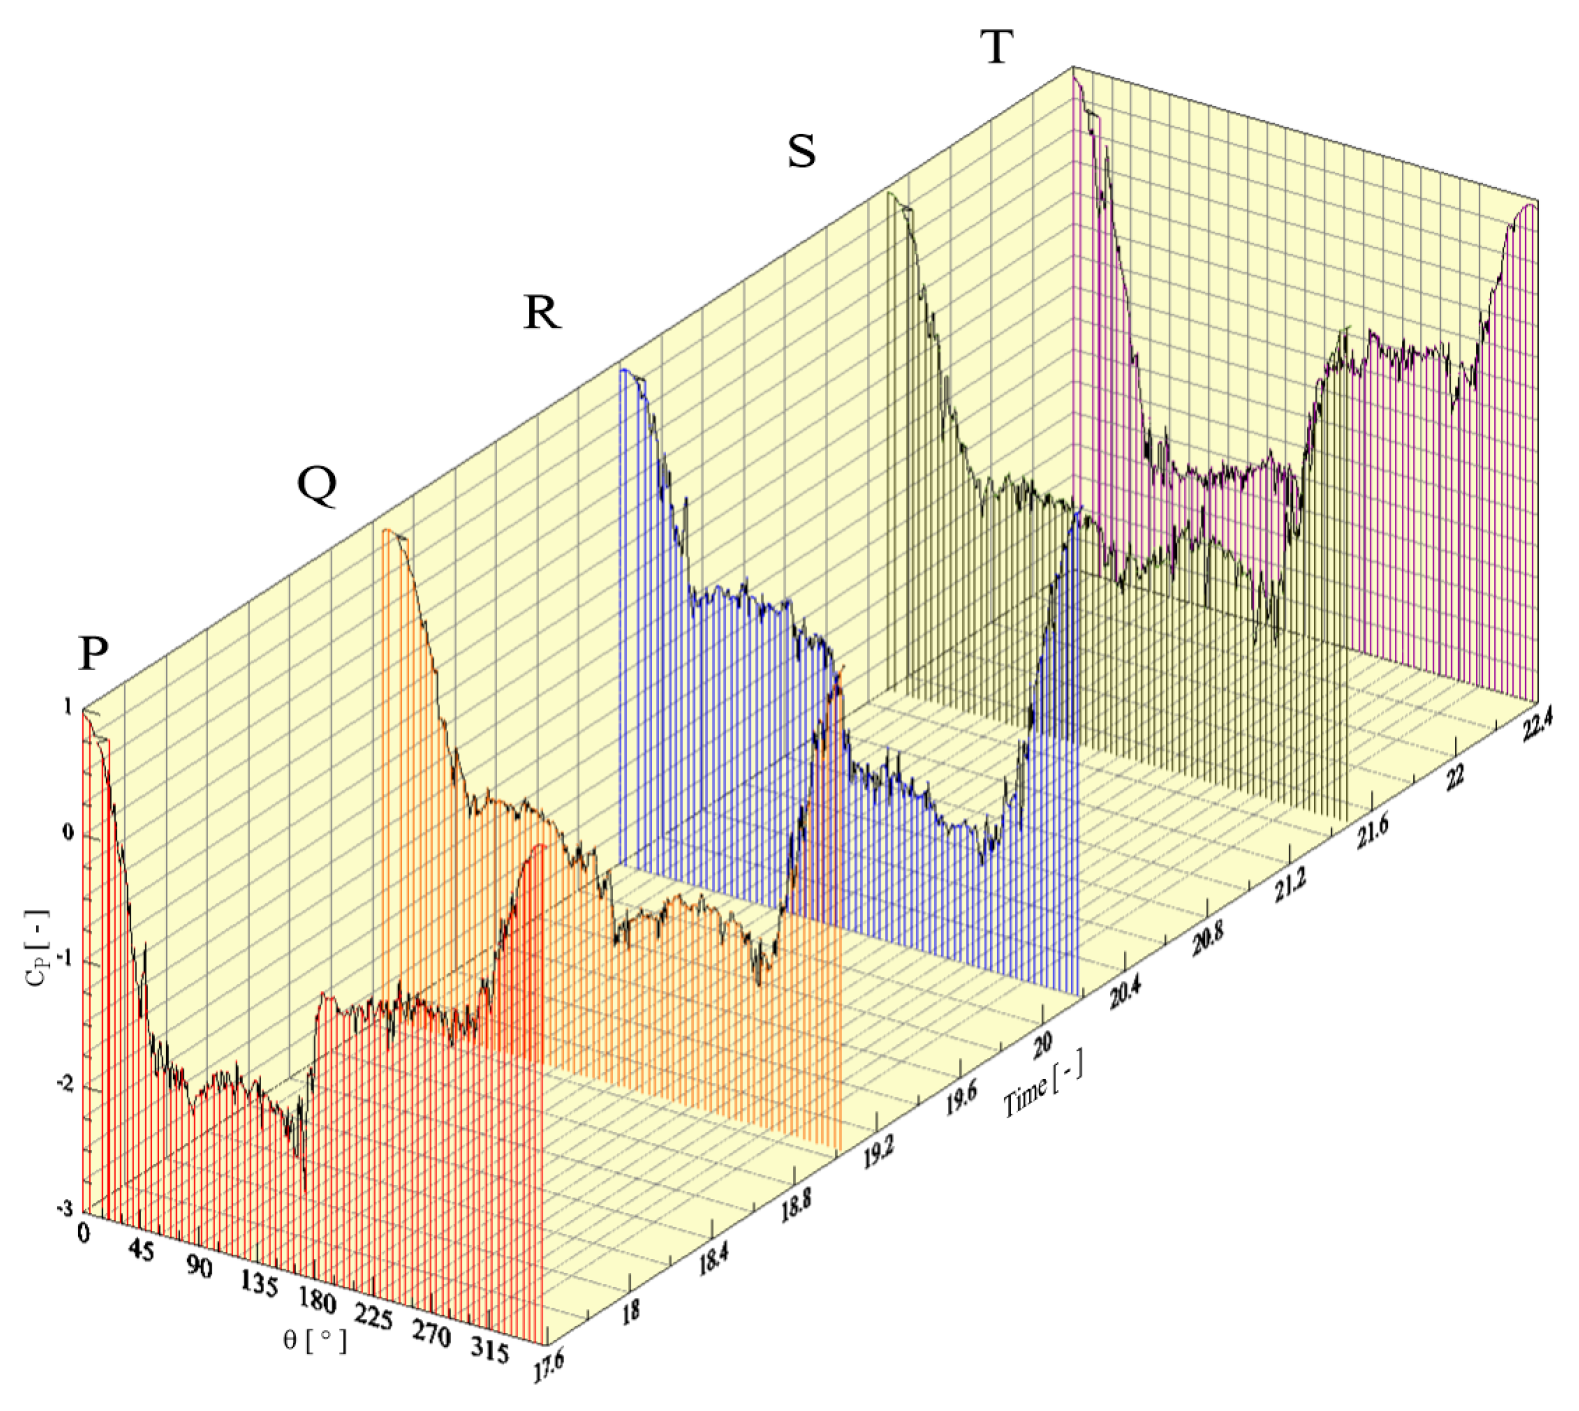
Figure 6b also includes five points of interest, strategically marked as points P–T. These points are associated with time instants related to the vortex shedding mechanism and consequent pressure coefficient distribution over the cylinder surface (Figure 7).
These points relate to the vortex shedding mechanism described by Gerrard [25] too. As properly interpreted by Bimbato et al. [42] and reproduced here, Point P refers to the time instant of the initial development stage of a clockwise vortical structure shedding on the upper side of the cylinder. Point Q indicates that the upper clockwise vortex structure continues growing and starts to attract the opposite shear layer placed on the lower side of the cylinder surface. Point R indicates that a counter-clockwise vortical structure is on its initial development stage on the lower side of the cylinder. As the next physical event, it also starts to grow, attracting the upper shear layer which is feeding the clockwise vortical structure. This event causes the detachment of the clockwise vortex structure. Point S has an analogous interpretation to that of Point Q. And, finally, Point T repeats the same event already described for Point P. The discussed mechanism supported by Points P–T repeats periodically and alternately on the upper and lower side of the cylinder surface causing the well-known von Kármán vortex street.
It can be concluded that the turbulence modeling applied to the energy equation did not result in an expressive change in the aerodynamic coefficients and Strouhal number. These observations are coherent with results reported by Bimbato et al. [42] for the DVM, in which the turbulence modeling did not expressively change the aerodynamic forces behavior in two-dimensions. On the other hand, the present methodology will be more sensitive under roughness effects. The effects of roughness will be investigated in a following paper.
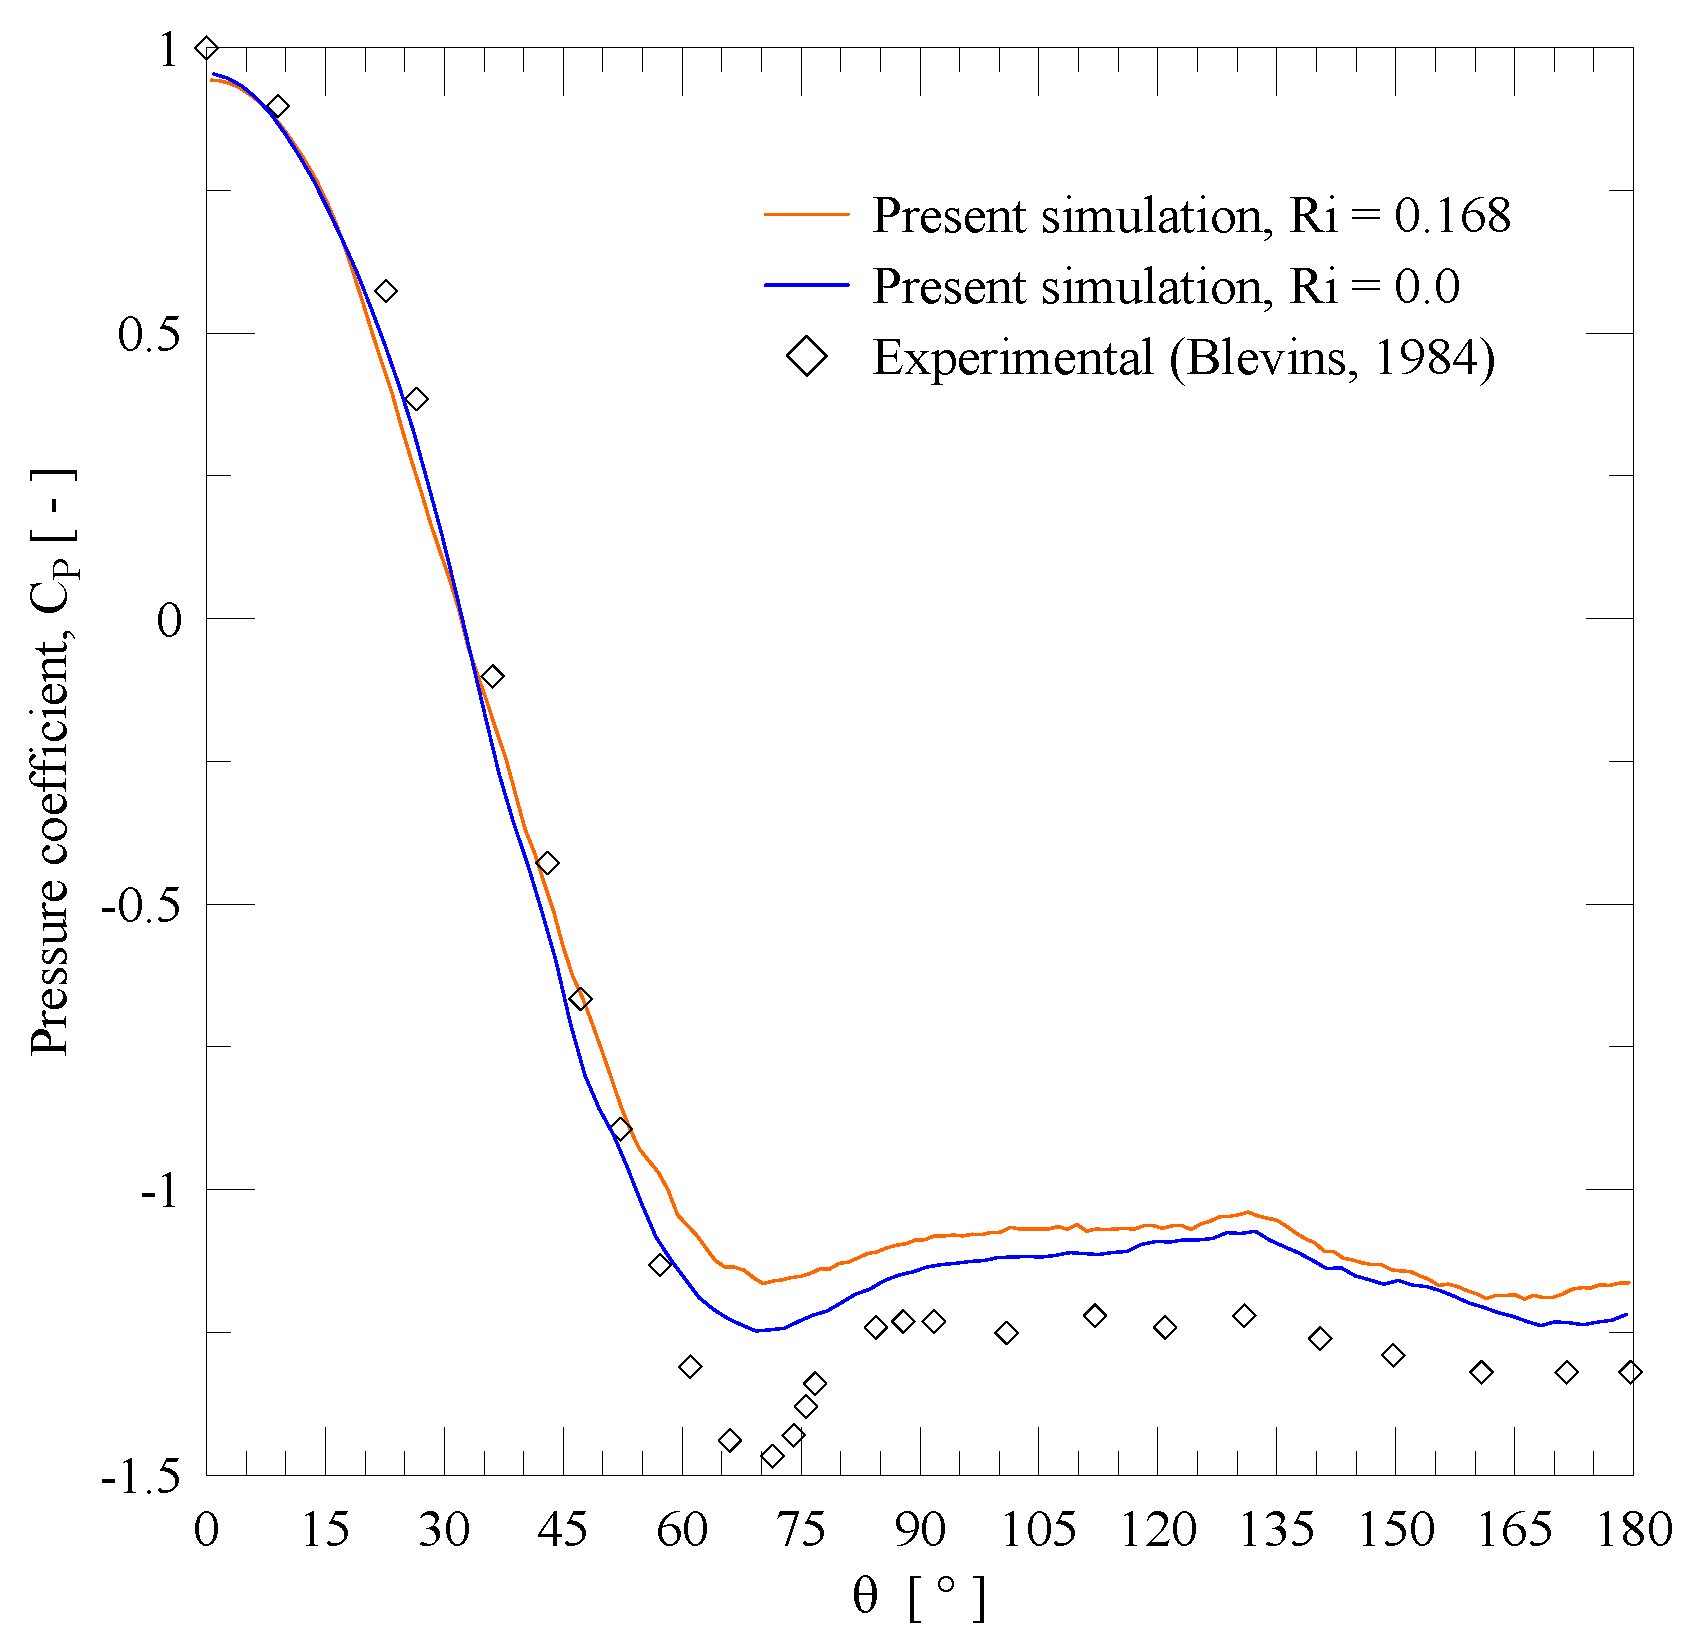
A distribution for the time-averaged pressure coefficient was calculated and compared with experimental data given by Blevins [43] (see Figure 8). The present methodology was able to reproduce the pressure distribution showing a good agreement also. Both simulations show a local minimum close to 70 and the inflection points of the curves after this point are an estimation of the separation point. The test case considering buoyancy effects showed a smaller pressure coefficient and a slight delay in the separation of the boundary layer ( 81 , against 80 from test case (A)). The experimental result from Son and Hanratty [44] predicts the separation angle for the hydrodynamic boundary layer to be about 78°. The numerical result with buoyancy forces clearly shows an increase in the base pressure. This behavior is physically consistent with the drag reduction (Table 2). The numerical behavior for Ri = 0.168 tends to reflect the expected physics for the problem, i.e., a delay in the boundary layer separation.
Figure 9a,b, respectively, show the position of the wake vortices and wake temperature particles for test case (B) at the intermediary step of the computation (t = 22.5). The formation and shedding of large eddies in the wakes can be clearly identified. This process occurs alternately on the upper and lower surfaces of the circular cylinder. The vortex and heat pairing processes can also be identified, where the vortical structures and the heat rotate in opposite directions and are connected to each other by the vortex sheet and heat sheet, respectively. The rightmost part of the wakes corresponds to the numerical transient that occurs before a periodic steady state regime is reached (from t = 10 on, approximately).

4.2. Airplane Wingtip Vortices

The problem of dissipation of aircraft wake vortices with crosswind is the second configuration investigated in this paper. These vortices are the result of the lift being generated by the wings. In order to perform the simulations, it is necessary to estimate some numerical parameters as presented in Table 3 [11,17].
As shown in Table 3, at the initial instant of each simulation, N = 50 vortex blobs are used to represent each of the wingtip counter-rotating vortical structures or primary vortical structures. Therefore, a pair of counter-rotating vortical structures are shed from the position (L/2 ± b/2, h) with the circulation Γ = ± 1 . The dimensionless parameters chosen for the simulations were defined based on operational aspects of the landing and takeoff processes at airports, in order to enable comparison with the experimental data of Liu and Srnsky [32] for Re = 7650, which considered the absence of crosswind and buoyancy forces. Based on this, the relation h/b = 2.0 is typical for problems of landing or takeoff operations between parallel runways when an aircraft develops velocity of approximately 240 km/h. Therefore, the adopted values for half the aircraft wingspan and the initial release altitude are b/2 = 0.5 and h = 2.0, respectively. The length of the airport runway, sufficient to establish the interaction between the runway boundary layer and the primary vortical structures shedding from the aircraft, is defined by L = 8b. All values were previously validated by Moraes et al. [11] and Carvalho et al. [17].
The focus of the present numerical simulations is to analyze the buoyancy effects with crosswind on the trajectory of the primary vortical structures. Three values of crosswind were adopted, i.e., 0.0, 0.02 and 0.04. For each value of crosswind, simulations were performed without and with the inclusion of buoyancy forces, the latter represented by Richardson numbers of 0.0 and 1.018, respectively. In simulations involving mixed convection heat transfer, the fluid temperature far from the ground plane is fixed at T = 20 °C and the airport runway temperature is T W = 40 °C, resulting in the corresponding Richardson number of Ri = 1.018. Table 4 shows the simulated test cases for a fixed Reynolds number of Re = 7650 and a fixed Prandtl number of Pr = 0.71.
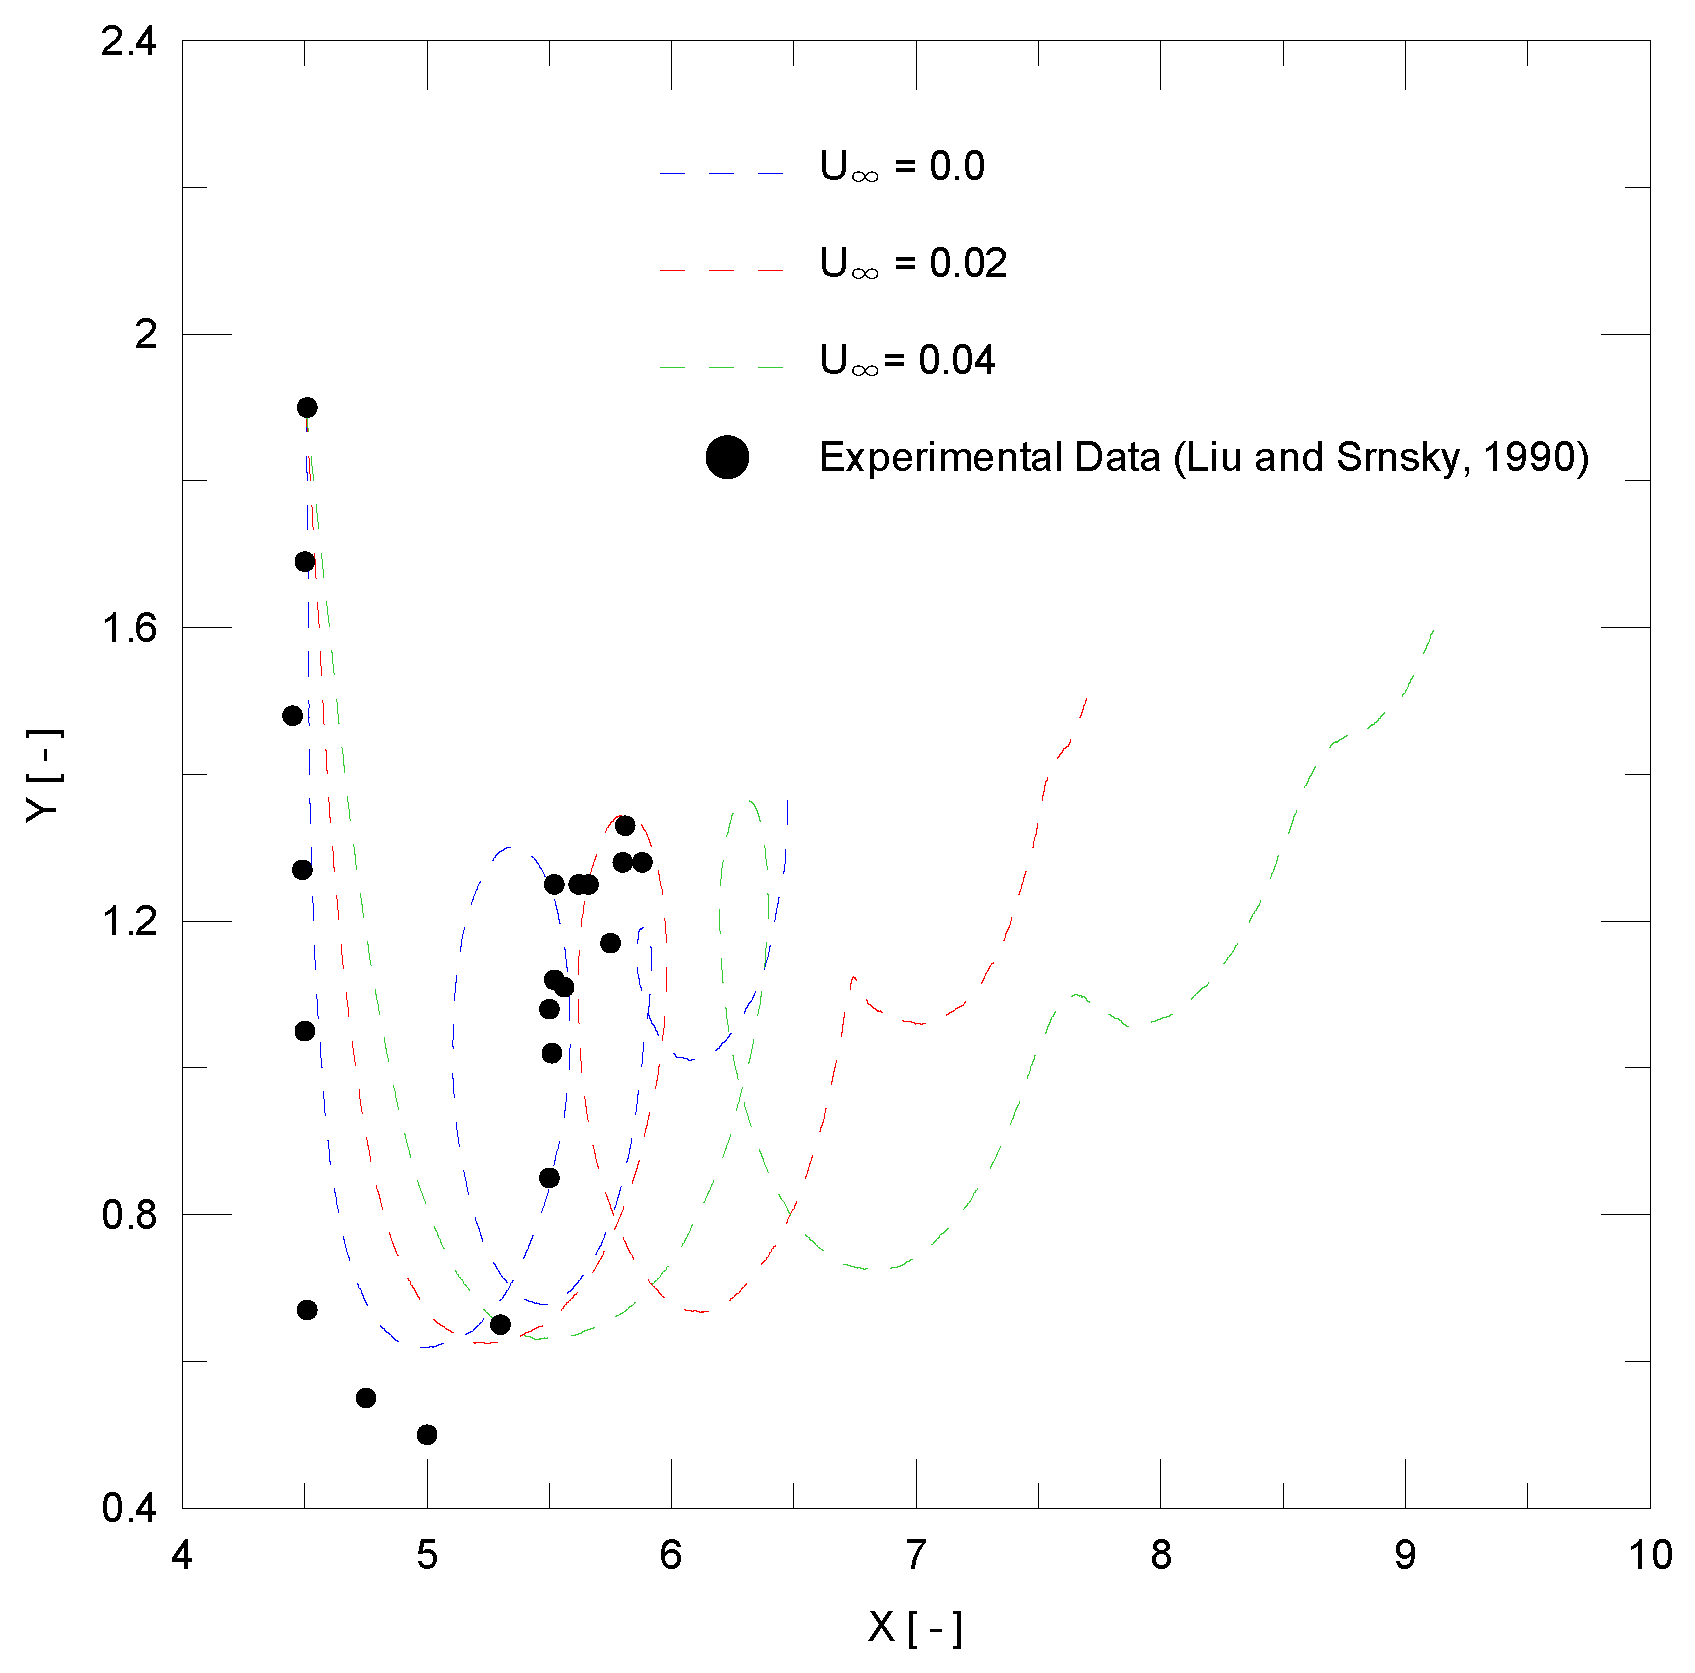
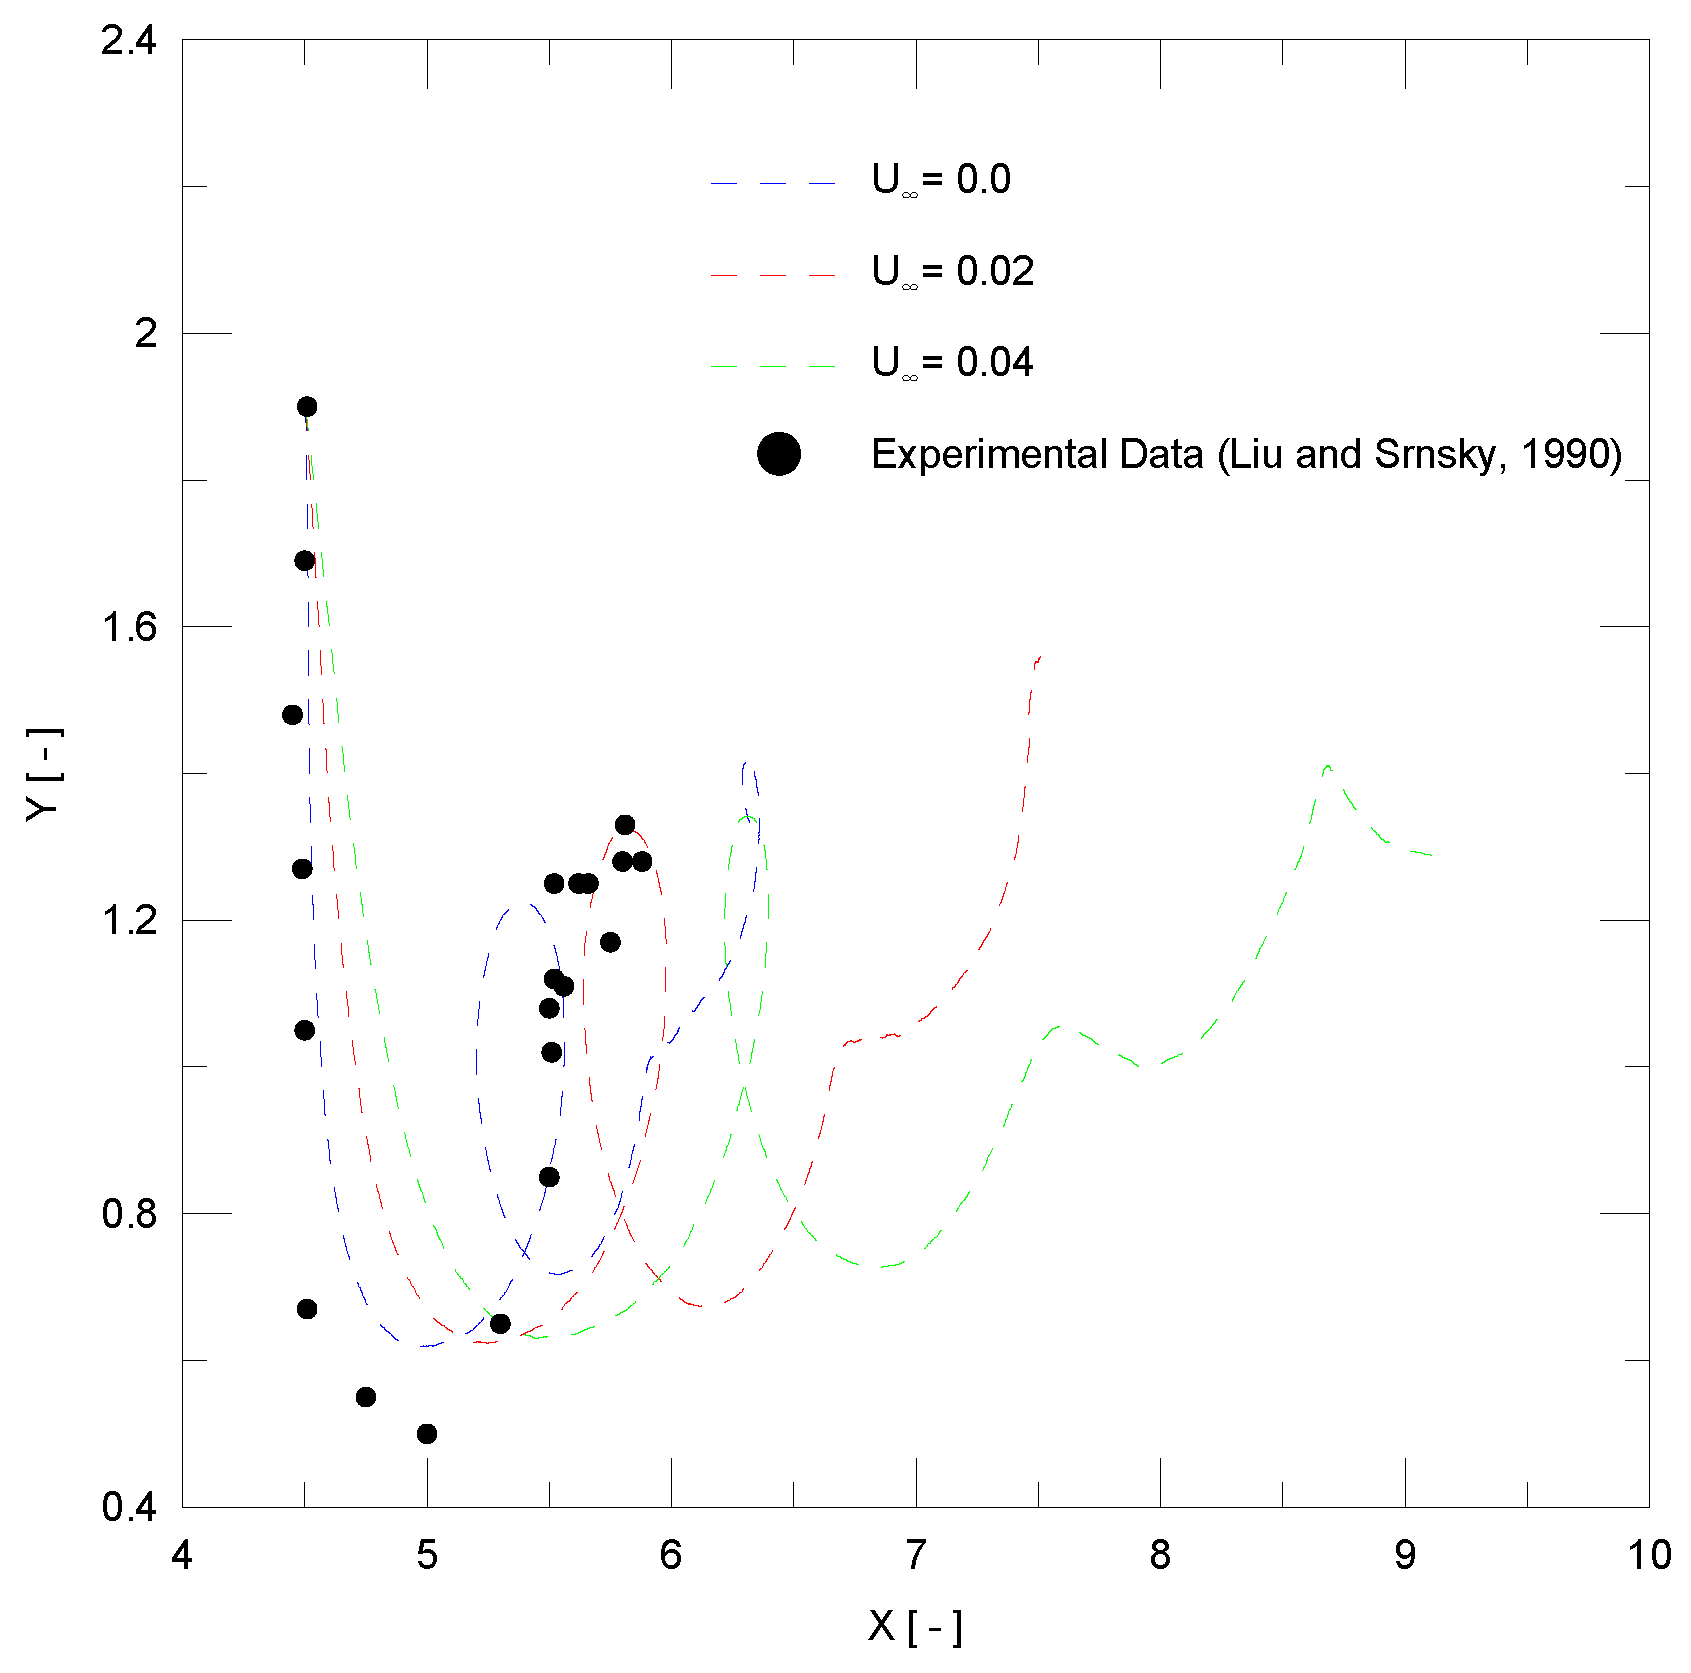
Figure 10 presents comparisons of three numerical trajectories of the primary vortical structures (test cases (1), (2) and (3) in Table 4) with experimental data from Liu and Srnsky [32]. The numerical trajectories are different from each other, as each case corresponds to a crosswind velocity. Figure 11 presents a comparison among three numerical trajectories (test cases (4), (5) and (6)) and the same experimental data.
An important analysis for Figure 10 and Figure 11 is the position of the first loop of the primary vortical structures trajectory and last instant of the simulation (t = 75). It can be observed that crosswind of magnitude 0.04 produces the greater height for the trajectory, as expected. When analyzing only the height of the first loop, the Richardon number interference is not so significant. Nonetheless, for the last instant of the trajectory, the effect of the buoyancy forces is captured. For cases with Ri = 1.018, the trajectory of the primary vortical structure centroid from the right already exhibits the effect of the airport runway deviation. In contrast, for the simulation with Ri = 0.0, the centroid trajectory remains in an upward movement.
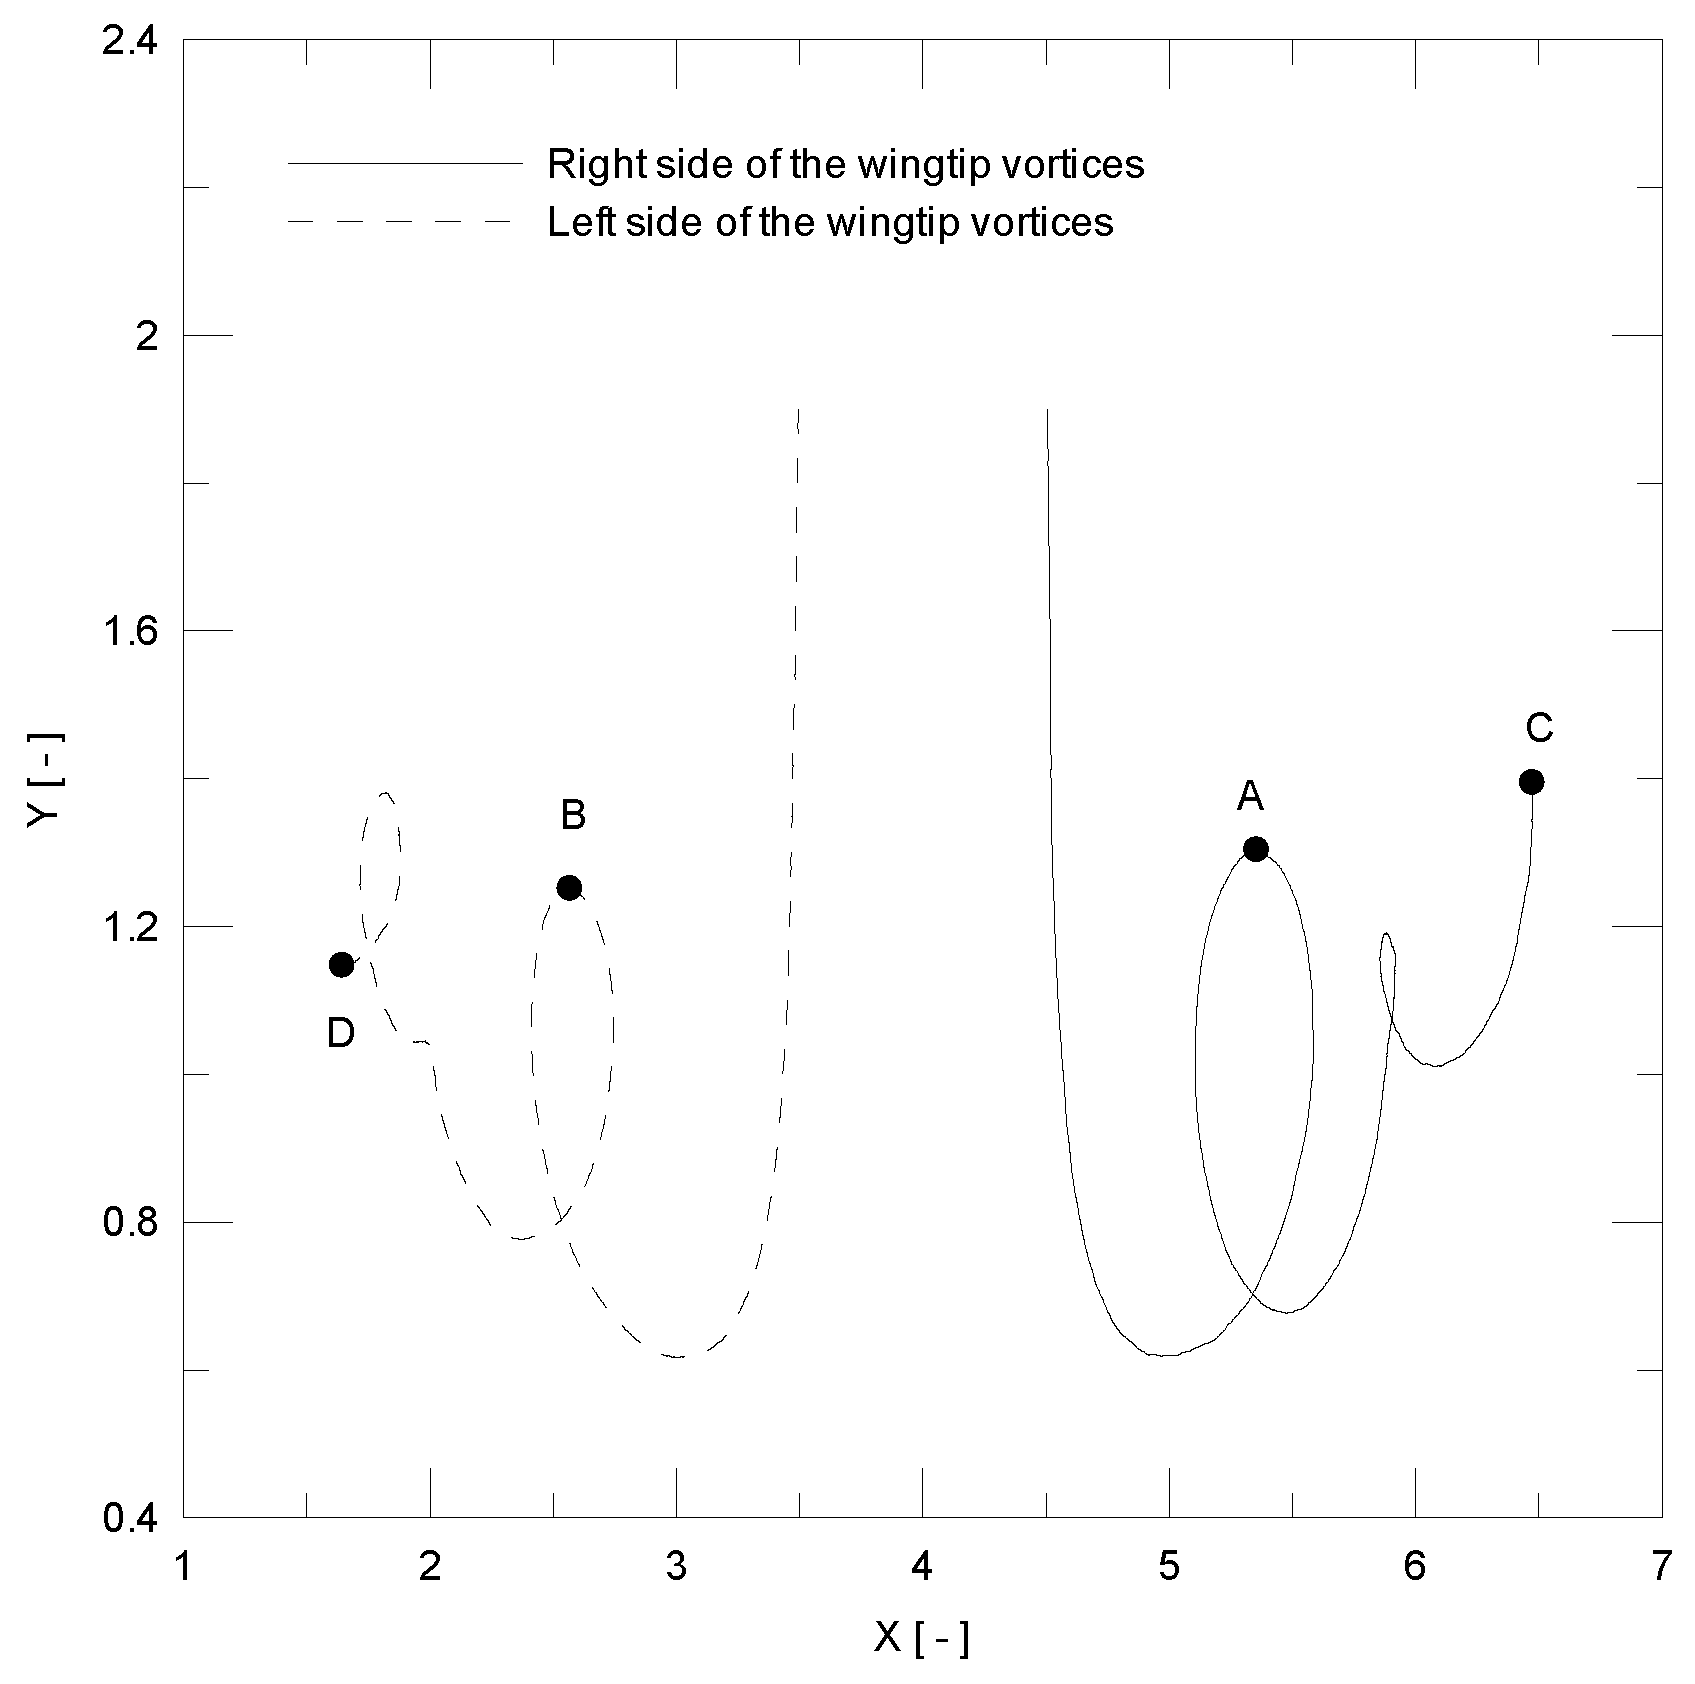
In Figure 12, the longitudinal distance between the centroid of the left and right primary vortical structures is investigated.
It can be observed that the longitudinal distance between points A and B, as well as C and D, decreases with the Richardson number interference. The observed asymmetry between the trajectories of the two structures is attributed to the diffusion scheme that employs a statistical approach through the Random-Walk Method. The use of pseudo-random numbers causes the initial symmetry of the problem to be lost over time increments. Table 5 shows the separation between these points for the cases without natural convection (cases 1, 2 and 3 for Ri = 0.0) and with natural convection (cases 4, 5 and 6 for Ri = 1.018).
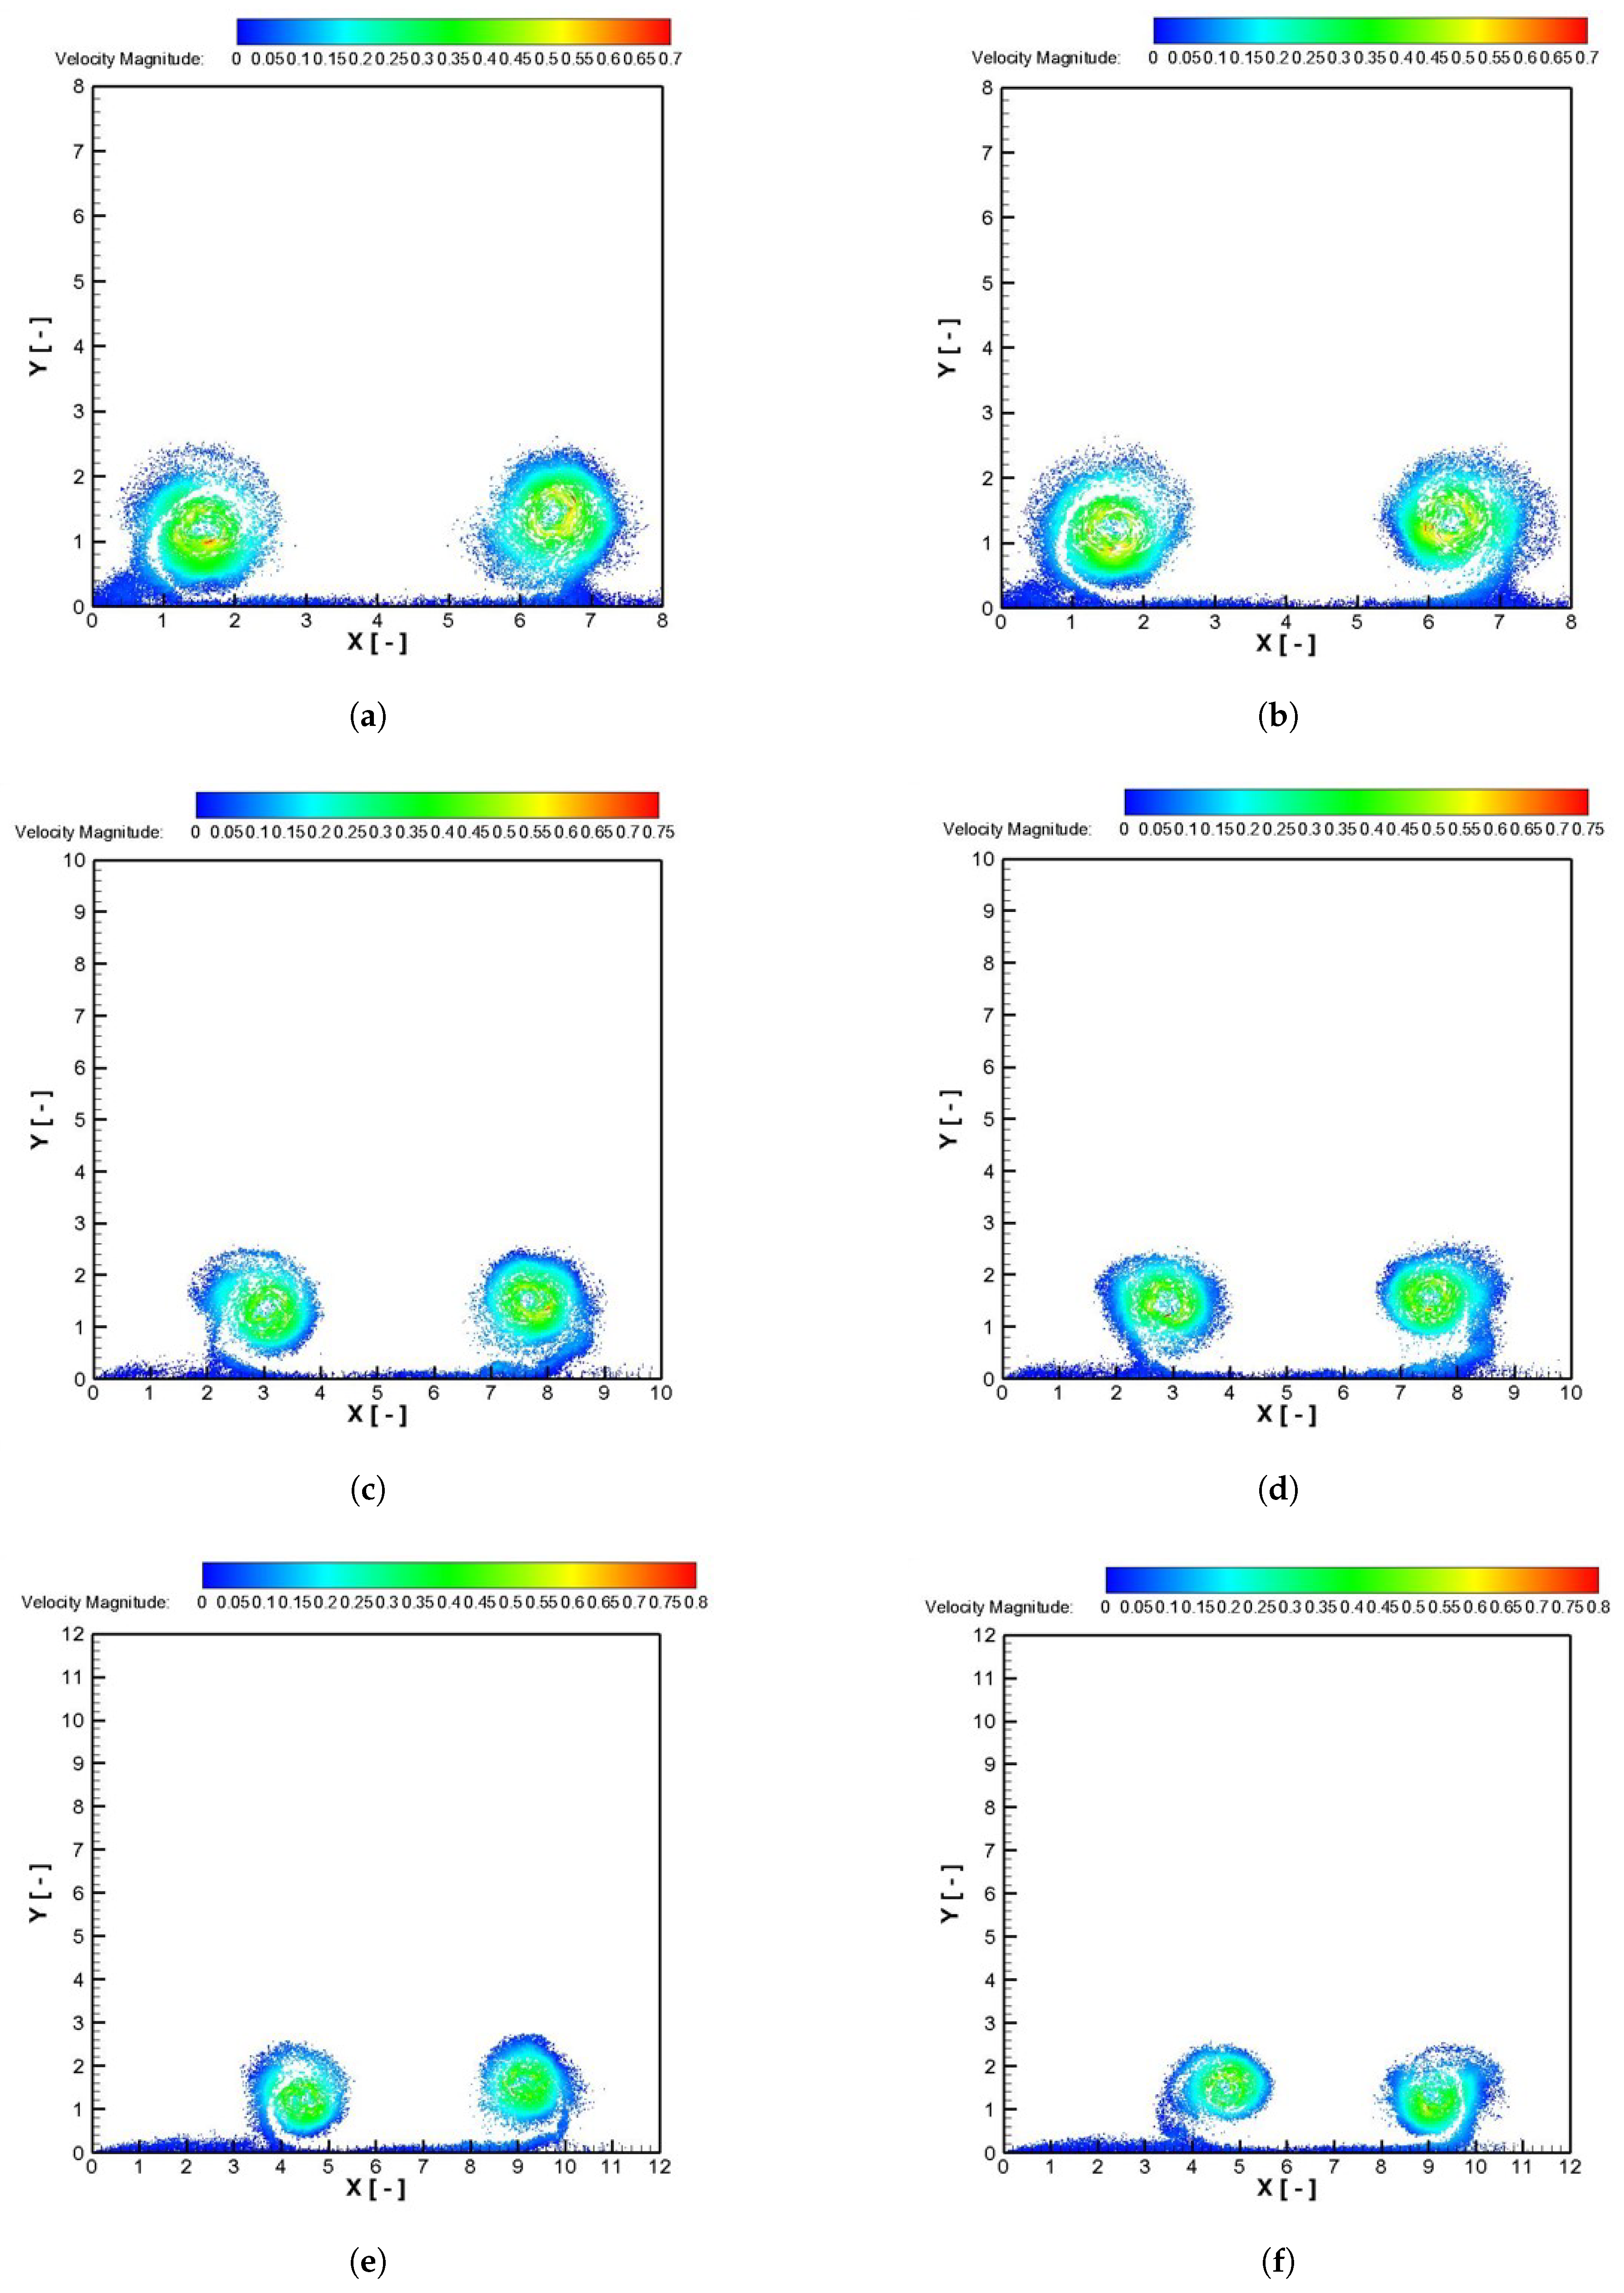
The spacing reduction effect occurs because the simulation with buoyancy forces introduces additional momentum into the vortical structures, resulting in higher velocities compared to the case for Ri = 0.0. When analyzing the interaction between the buoyancy forces and crosswind, it can be concluded that the longitudinal distance between points C and D also decreases. Figure 13 illustrates the velocity field behavior for the final time step of the numerical simulation for all cases. In general, the cases with Ri = 1.018 demonstrate that primary vortical structures are more compact, meaning that their centroids are closer to each other. This phenomenon facilitates the interaction and approximation of vortical structures on both the right and left sides.
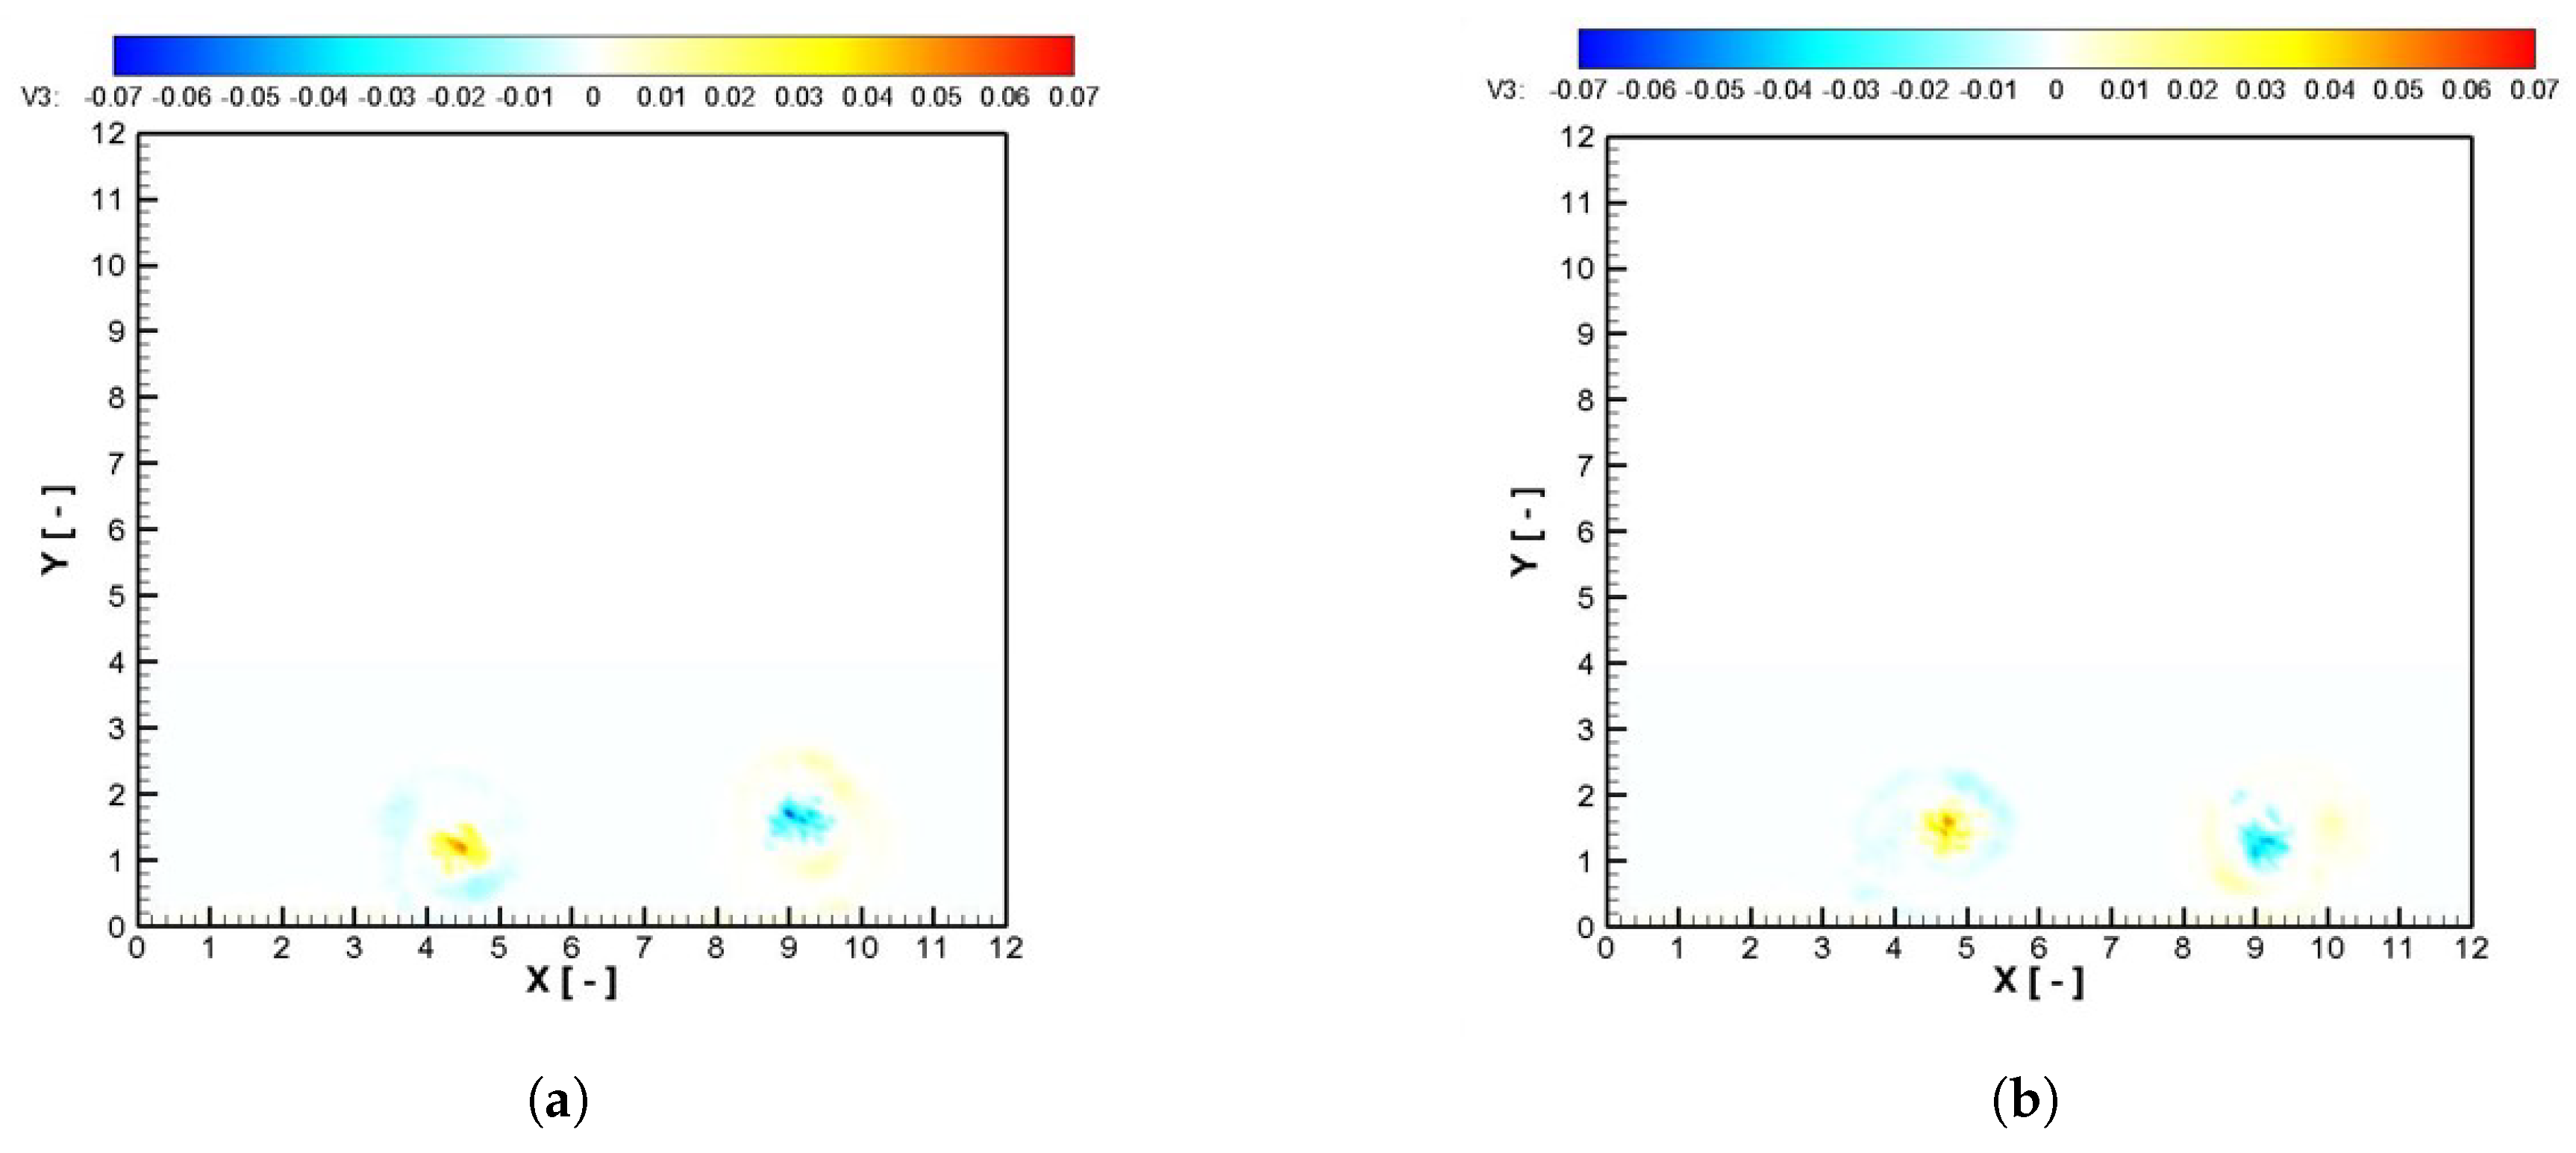
Based on Figure 13, the most significant comparison is for Figure 13e,f. Therefore, an important analysis is to observe the vorticity distribution for these cases. Figure 14 represents the instantaneous vorticity distribution.
The contour of the vorticity distribution is not so different when comparing Figure 14a,b. However, the width of the vortical structures in Figure 14a is greater than that in Figure 14b. This behavior is important, since it corroborates the interpretation given in Figure 13, in which the longitudinal distance between the centroids of the primary vortical structures is closer for cases with buoyancy forces. The present method, therefore, is able to provide good estimates for the trajectory of primary vortical structures and their interaction with a heated ground plane, and is able to predict the flow correctly in a physical sense.
The main purpose of the present analysis is to investigate the primary vortical structures pair in the heated ground effect. The present results efficiently capture the rebounding of the vortices pair as it approaches the ground for isothermal cases. It can be concluded that the proximity of the primary vortical structures to the ground plane results in boundary layer separation and secondary vorticity, explaining the upward migration of the vortex pair. This behavior is coherent with the expected physics for the problem. The new computer code was implemented to include heat transfer from the ground plane in an effort to simulate the buoyancy forces over the primary vortical structures. As can be seen, the rebounding phenomenon with the combined effects of mixed convection heat transfer and crosswind provoke a greater attraction between the counter-rotating primary vortices pair; this effect implies that the maximum high attained by the right primary vortex is less than the same height attained in the isothermal condition. Another important consequence is that the same vortical structure delays the departure from the ground plane. Compare Figure 10 and Figure 11 for the test case using a crosswind velocity of 0.04.
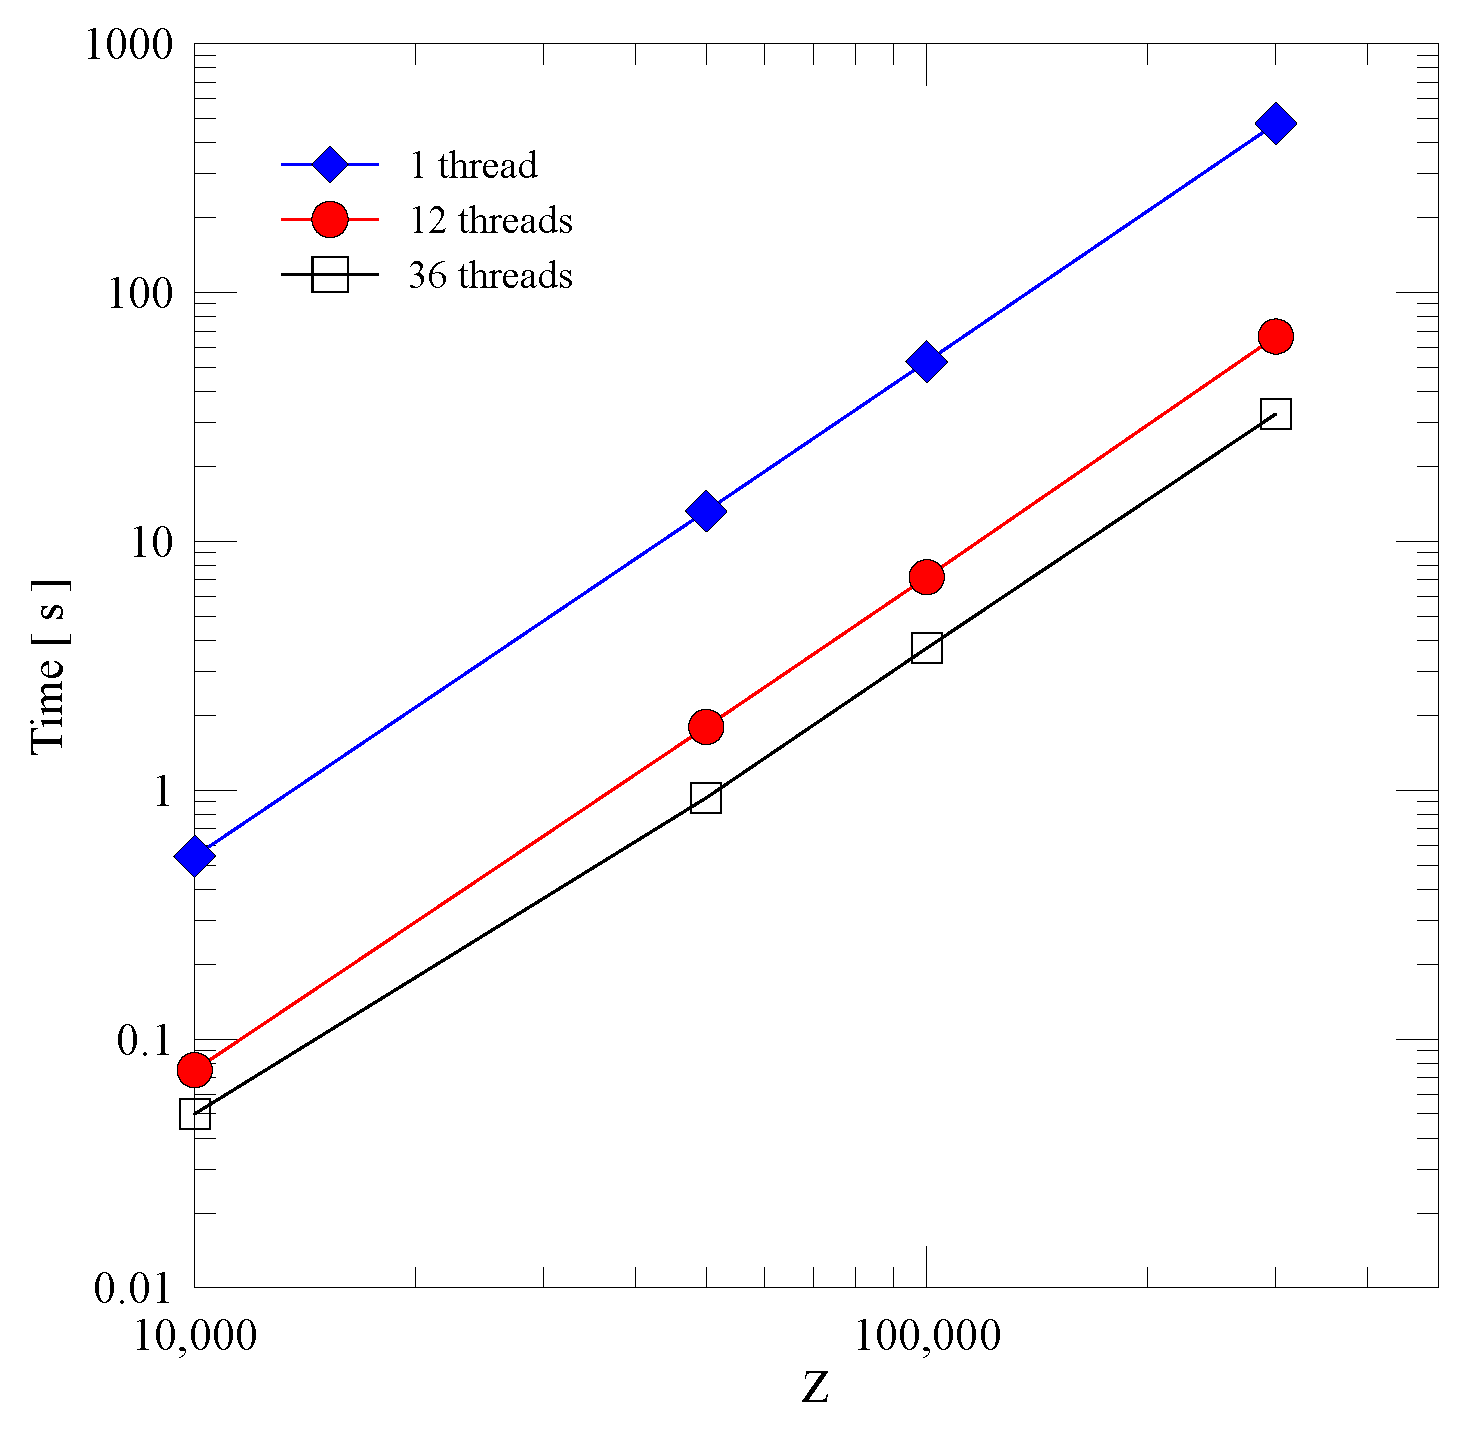
Figure 15 illustrates the performance of parallel computing (OpenMP), which was measured by its speed, efficiency, and speedup. The example considered two clusters (vortex blobs and temperature particles), each one with Z particles. For different values of Z, the computations involved sequentially, vortex–vortex interactions, vortex–temperature interactions and temperature–vortex interactions. The vortex–vortex interactions refer to the contribution of the cluster of vortex blobs to compute the velocity over every vortex blob. Similarly, the vortex–temperature interactions refer to the contribution of the cluster of vortex blobs to compute the velocity over every temperature particle. The buoyancy forces are computed over every vortex blob due to the contribution of the cluster of temperature particles. The time was measured for three situations of particles interactions, i.e., 1 thread (serial computing), 12 threads and 36 threads. It can be concluded that parallel computing is faster than serial computing because it uses multiple processors to solve problems simultaneously and efficiently. Obviously, the use of 12 threads is less efficient than 36 threads, but the speedup from 12 to 36 threads is less than the speedup from 12 threads compared to the serial implementation, according to Amdahl’s Law. The specification of the computer used to run the simulations is the following: CPU Intel Core i9-13900KF 3.00 GHz with 32 threads, and L2 cache of 32 MB. The cylinder cases without and with buoyancy forces needed 144 and 240 h of wall clock time to complete, respectively. The cases of airplane wing tip vortices without and with buoyancy forces required 6 and 9 h, respectively.

5. Conclusions

The vortex–temperature interactions are the main characteristic of the Temperature Particles Method (TPM), a natural extension of the Discrete Vortex Method (DVM) in the Lagrangian manner. In the TPM, two clouds particles are used in order to represent the vorticity and heat, which are generated on the solid surface and develop into the boundary layer and the viscous wake. Every vortex blob and every temperature particle are followed during the numerical simulation in a typical Lagrangian scheme. Important features of the (Lagrangian) TPM are as follows: (i) it is a numerical technique suitable for the solution of advective/diffusion type equations like the Navier–Stokes equations and the energy equation; (ii) it is a mesh-free technique, where the vorticity field and the heat are respectively represented by a cloud of vortex blobs and by another cloud of temperature particles, both moving with the fluid velocity; (iii) the vortex blobs generated at the body surface are treated as material particles carrying vorticity; (iv) the temperature particles generated at the body surface are treated as material particles carrying heat; (v) it is a suitable technique for direct simulation and large-eddy simulation; and (vi) the turbulence modeling employs the computation of the second-order velocity structure function of the velocity filtered field; this computation is advantageous in the Lagrangian manner, since it utilizes the concept of velocity fluctuations (differences of velocity) instead of the rate of deformation (derivatives). Another advantage of working with the vorticity transport equation and the energy equation in Lagrangian fashion is that the pressure term is eliminated, which requires special treatment in most numerical methods.
In this paper, the computation of the second-order velocity structure function model has been successively extended for the energy equation, aiming to include turbulence modeling. This calculation was initially adapted for construction of the two-dimensional vorticity field via DVM [19]. The key idea of the present methodology is to compute the turbulent viscosity coefficient over each temperature particle and relate it to the turbulent thermal diffusivity coefficient via definition of the turbulent Prandtl number, as defined in Equation (7).
Two examples of flow configuration have been utilized to show the effectiveness of the new TPM. Firstly, the inclusion of buoyancy forces linked with turbulence modeling has somehow interfered with the aerodynamics of the circular cylinder. The present numerical results for Reynolds number of 100,000 and Richardson number of 0.168 indicated a drag coefficient of 1.21, Strouhal number of 0.199 and separation angle of 81°. For the isothermal condition, the experimental results from Blevins [43], for a Reynolds number of 100,000, predict a drag coefficient of 1 . 20 ± 10 % and a Strouhal number of 0 . 19 ± 10 % . The experimental result from Son and Hanratty [44] predicts the separation angle for the hydrodynamic boundary layer to be about 78°. This behavior tends to reflect the expected physics for the problem. In other words, the inclusion of buoyancy forces, as a result of the heating of the body, indicates the creation of a contraposition with the viscous forces around it, and, consequently, there is a delay in the boundary layer separation angle. As suggested by Bimbato et al. [42], the effects of surface roughness are more sensitive for capturing the mentioned delay in two dimensions.
Secondly, the combined effects of turbulence modeling, buoyancy forces and crosswind for the problem of wingtip vortices produced by a wing near a heated ground plane modified the expected trajectory for the pair of counter-rotating primary vortical structures. These vortical structures became closer during the numerical simulation in comparison with the isothermal experimental results from Liu and Srnsky [32].
The present methodology can be extended to incorporate the effects of surface roughness [17,42]. As a second suggestion for future research, the computations of the present algorithm should be accelerated (especially those involving particle interactions) via Fast Multipole Methods (FMMs) and CUDA technology [45,46,47]. Direct computation of the vortex–vortex interactions and the vortex–temperature interactions takes O ( Z 2 ) calculations, which becomes quite costly when Z is large. The Fast Multipole Methods efficiently compute an approximate solution with tunable accuracy in only O ( Z log κ Z ) operations for κ = 0.1 . In CUDA (Compute Unified Device Architecture), the concept consists of a software implementation that gives direct access to the GPU’s virtual instruction set and parallel computational elements for execution of the compute kernels.

Author Contributions

Conceptualization, T.R.C., G.F.M.d.C. and L.A.A.P.; data curation, T.R.C., G.F.M.d.C. and A.M.B.; formal analysis, T.R.C., G.F.M.d.C. and L.A.A.P.; funding acquisition, L.A.A.P. and A.M.B.; investigation, T.R.C., G.F.M.d.C. and A.M.B.; methodology, A.M.B. and L.A.A.P.; project administration, T.R.C. and L.A.A.P.; resources, T.R.C., G.F.M.d.C. and L.A.A.P.; software using Fortran, T.R.C. and G.F.M.d.C.; validation, T.R.C., G.F.M.d.C. and A.M.B.; visualization, T.R.C., G.F.M.d.C. and L.A.A.P.; supervision, L.A.A.P.; writing—original draft, T.R.C. and L.A.A.P.; writing—review and editing, T.R.C., G.F.M.d.C. and L.A.A.P. All authors have read and agreed to the published version of the manuscript.

Funding

The authors would like to thank FAPEMIG (a research-supporting foundation of Minas Gerais), project no. APQ-01246-23, the National Council for Scientific and Technological Development (CNPq), grant 404539/2023-8, and the São Paulo Research Foundation (FAPESP), grant no. 2022/03630-4, for their financial support.

Institutional Review Board Statement

Not applicable.

Informed Consent Statement

Not applicable.

Data Availability Statement

The raw data supporting the conclusions of this article will be made available by the authors on request.

Acknowledgments

The authors gratefully acknowledge the three anonymous reviewers for their valuable comments and suggestions.

Conflicts of Interest

The authors declare no conflicts of interest.

Abbreviations

The following abbreviations are used in this manuscript:
CUDACompute Unified Device Architecture
DVMDiscrete Vortex Method
FMMFast Multipoles Method
FSIFluid–Structure Interaction
LESLarge-Eddy Simulation
RWMRandom-Walk Method
SGSSub-Grid-Scale
TPMTemperature Particles Method
VIVVortex-Induced Vibrations

References

  1. Kamemoto, K. On contribution of advanced vortex element methods toward virtual reality of unsteady vortical flows in the new generation of CFD. J. Braz. Soc. Mech. Sci. Eng. 2004, 26. [Google Scholar] [CrossRef]
  2. Hirata, M.; Alcântara Pereira, L.; Recicar, J.; Moura, W. High Reynolds number oscillations of a circular cylinder. J. Braz. Soc. Mech. Sci. Eng. 2008, 30. [Google Scholar] [CrossRef]
  3. Yokota, R.; Narumi, T.; Sakamaki, R.; Kameoka, S.; Obi, S.; Yasuoka, K. Fast Multipole Methods on a Cluster of GPUs for the Meshless Simulation of Turbulence. Comput. Phys. Commun. 2009, 180, 2066–2078. [Google Scholar] [CrossRef]
  4. Salloum, S.; Lakkis, I. An Adaptive Error-Controlled Hybrid Fast Solver for Regularized Vortex Methods. J. Comput. Phys. 2022, 468, 111504. [Google Scholar] [CrossRef]
  5. Marchevsky, I.; Ryatina, E.; Kolganova, A. Fast Barnes-Hut-Based Algorithm in 2D Vortex Method of Computational Hydrodynamics. Comput. Fluids. 2023, 366, 106018. [Google Scholar] [CrossRef]
  6. Xiong, S.; He, X.; Tong, Y.; Deng, Y.; Zhu, B. Neural Vortex Method: From Finite Lagrangian Particles to Infinite Dimensional Eulerian Dynamics. Comput. Fluids 2023, 258, 105811. [Google Scholar] [CrossRef]
  7. Chorin, A. Numerical Study of Slightly Viscous Flow. J. Fluid Mech. 1973, 57, 785–796. [Google Scholar] [CrossRef]
  8. Ghoniem, A.F.; Sherman, F.S. Grid-free simulation of diffusion using random walk methods. J. Comput. Phys. 1985, 61, 1–37. [Google Scholar] [CrossRef]
  9. Kamemoto, K.; Miyasaka, T. Development of a Vortex and Heat Elements Method and its Application to Analysis of Unsteady Heat Transfer around a Circular Cylinder in a Uniform Flow. In Proceedings of the First International Conference on Vortex Method, Kobe, Japan, 4–5 November 1999. [Google Scholar]
  10. Ogami, Y. Simulation of heat-fluid motion by the vortex method. JSME Int. J. 2001, 44, 513–519. [Google Scholar] [CrossRef]
  11. Moraes, P.G.d.; Oliveira, M.A.d.; Bimbato, A.M.; Alcântara Pereira, L.A. A Lagrangian Description of Buoyancy Effects on Aircraft Wake Vortices from Wing Tips near a Heated Ground Plane. Energies 2022, 15, 6995. [Google Scholar] [CrossRef]
  12. Mimeau, C.; Mortazavi, I. A Review of Vortex Methods and Their Applications: From Creation to Recent Advances. Fluids 2021, 6, 68. [Google Scholar] [CrossRef]
  13. Narsipur, S.; Ramesh, K.; Gopalarathnam, A.; Edwards, J.R. Discrete vortex modeling of perching and hovering maneuvers. Theor. Comput. Fluid Dyn. 2023, 37, 445–464. [Google Scholar] [CrossRef]
  14. Zou, Q.; Zhou, C.; Zhu, C.; Zhang, Z.; Fan, J. Discrete Vortex Method-Based Fish-Like Locomotion Modeling. IEEE J. Ocean. Eng. 2024, 49, 390–402. [Google Scholar] [CrossRef]
  15. Kumar, R.; Padhee, S.S.; Samanta, D. Aerodynamic performance and flow mechanism of 3D flapping wing using discrete vortex method. J. Fluids Struct. 2024, 127, 104128. [Google Scholar] [CrossRef]
  16. Wang, Y.B.; Zhao, H.C.; Gao, D.L.; Li, R. Numerical simulation of vortex-induced vibration of deepwater drilling riser based on discrete vortex method. Pet. Sci. 2025, in press. [Google Scholar] [CrossRef]
  17. Carvalho, G.F.M.d.; Vidille, M.F.; Bimbato, A.M.; Alcântara Pereira, L.A. Lagrangian Vortices Interactions Using Large-Eddy Simulation (LES) and Surface Roughness Model—Application for Aircraft Wake Vortices with Crosswind. Appl. Sci. 2023, 13, 12336. [Google Scholar] [CrossRef]
  18. Métais, O.; Lesieur, M. Spectral large-eddy simulation of isotropic and stably stratified turbulence. J. Fluid Mech. 1992, 239, 157–194. [Google Scholar] [CrossRef]
  19. Alcântara Pereira, L.; Hirata, M.; Silveira Neto, A. Vortex Method with Turbulence Sub-Grid Scale Modelling. J. Braz. Soc. Mech. Sci. Eng. 2003, 25. [Google Scholar] [CrossRef]
  20. Katz, J.; Plotkin, A. Low Speed Aerodynamics: From Wing Theory to Panel Methods; McGraw Hill: New York, NY, USA, 1991. [Google Scholar]
  21. Kundu, P.K. Fluid Mechanics; Academic Press: Cambridge, MA, USA, 1990. [Google Scholar]
  22. Fourier, J.B. Theorie Analytique de la Chaleur (1822); Freeman, A., Translator; Dover Publications Inc.: New York, NY, USA, 1955. [Google Scholar]
  23. Ferziger, J.H. Numerical Methods for Engineering Application; John Wiley & Sons, Inc.: Hoboken, NJ, USA, 1981. [Google Scholar]
  24. Shintani, M.; Akamatsu, T. Investigation of Two Dimensional Discrete Vortex Method with Viscous Diffusion Model. Comput. Fluid Dyn. J. 1994, 3, 237–254. [Google Scholar] [CrossRef]
  25. Gerrard, J.H. The mechanics of the formation region of vortices behind bluff bodies. J. Fluid Mech. 1966, 25, 401–413. [Google Scholar] [CrossRef]
  26. Sumer, B.; Fredsøe, J. Hidrodynamics around Cylindrical Structures. Adv. Ser. Ocean. Eng. 2006. [Google Scholar] [CrossRef]
  27. Karimi-Zindashti, G.; Kurç, O. Flow past rotating cylinders using deterministic vortex method. Ocean. Eng. 2024, 291, 116342. [Google Scholar] [CrossRef]
  28. Duranay, A.; Demirhan, A.; Dobrucali, E.; Kinaci, K.O. A review on vortex-induced vibrations in confined flows. Ocean. Eng. 2023, 285, 115309. [Google Scholar] [CrossRef]
  29. Parameshwaran, R.; Dhulipalla, S.; Yendluri, D. Fluid-structure Interactions and Flow Induced Vibrations: A Review. Procedia Eng. 2016, 144, 1286–1293. [Google Scholar] [CrossRef]
  30. Rashidi, S.; Hayatdavoodi, M.; Esfahani, J.A. Vortex shedding suppression and wake control: A review. Ocean. Eng. 2016, 126, 57–80. [Google Scholar] [CrossRef]
  31. Lamb, H. Hydrodynamics; Dover Publication: Mineola, NY, USA, 1932. [Google Scholar]
  32. Liu, H.T.; Srnsky, R.A. Laboratory Investigation of Atmospheric Effects on Vortex Wakes; Technical Report 497; Flow Research Inc.: Belleville, ON, Canada, 1990. [Google Scholar]
  33. Hallock, J.; Holzäpfel, F. A Review of Recent Wake Vortex Research for Increasing Airport Capacity. Prog. Aerosp. Sci. 2018, 98, 27–36. [Google Scholar] [CrossRef]
  34. Holzäpfel, F.; Strauss, L.; Schwarz, C. Assessment of Dynamic Pairwise Wake Vortex Separations for Approach and Landing at Vienna Airport. Aerosp. Sci. Technol. 2021, 112, 106618. [Google Scholar] [CrossRef]
  35. Carvalho, G.; Vidille, M.; Bimbato, A.; Alcântara Pereira, L. Lagrangian Vortices with Corrected Core-Spreading Method and Large Eddy Simulation (LES). In Proceedings of the 27th ABCM International Congress of Mechanical Engineering, Florianópolis, SC, Brazil, 4–8 December 2023. [Google Scholar]
  36. Chan, J.; Hesse, H.; Wang, P. LES validation on near-field wingtip vortex evolution with wind tunnel characterization at low Reynolds number. Aerosp. Sci. Technol. 2025, 157, 109789. [Google Scholar] [CrossRef]
  37. Lesieur, M.; Metais, O. New Trends in Large-Eddy Simulations of Turbulence. Annu. Rev. Fluid Mech. 1996, 28, 45–82. [Google Scholar] [CrossRef]
  38. Chollet, J.P.; Lesieur, M. Parameterization of Small Scales of Three Dimensional Isotropic Turbulence Utilizing Spectral Closures. J. Atmos. Sci. 1981, 38, 2747–2757. [Google Scholar] [CrossRef]
  39. Ogami, Y. General Circulation Experiments with the Primitive Equations 1. The basic experiment. Mon. Weather Rev. 1963, 91, 99–164. [Google Scholar]
  40. Batchelor, G.K. An Introduction to Fluid Dynamics; Cambridge University Press: Cambridge, UK, 1967. [Google Scholar]
  41. Leonard, A. Vortex methods for flow simulation. J. Comput. Phys. 1980, 37, 289–335. [Google Scholar] [CrossRef]
  42. Bimbato, A.; Alcântara Pereira, L.; Hirata, M. Development of a new Lagrangian vortex method for evaluating effects of surfaces roughness. Eur. J. Mech. B/Fluids 2019, 74, 291–301. [Google Scholar] [CrossRef]
  43. Blevins, R.D. Applied Fluid Dynamics Handbook; Van Nostrand Reinhold Co.: New York, NY, USA, 1984. [Google Scholar]
  44. Son, J.S.; Hanratty, T.J. Velocity gradients at the wall for flow around a cylinder at Reynolds numbers from 5 × 10³ to 105. J. Fluid Mech. 1969, 35, 353–368. [Google Scholar] [CrossRef]
  45. Greengard, L.; Rokhlin, V. A fast algorithm for particle simulations. J. Comput. Phys. 1987, 73, 325–348. [Google Scholar] [CrossRef]
  46. Ricciardi, T.R.; Wolf, W.R.; Bimbato, A.M. Fast multipole method applied to Lagrangian simulations of vortical flows. Commun. Nonlinear Sci. Numer. Simul. 2017, 51, 180–197. [Google Scholar] [CrossRef]
  47. Nascimento, E.; Magalhaes, E.; Azevedo, A.; dos Santos Paes, L.E.; Oliveira, A. An Implementation of LASER Beam Welding Simulation on Graphics Processing Unit Using CUDA. Computation 2024, 12, 83. [Google Scholar] [CrossRef]
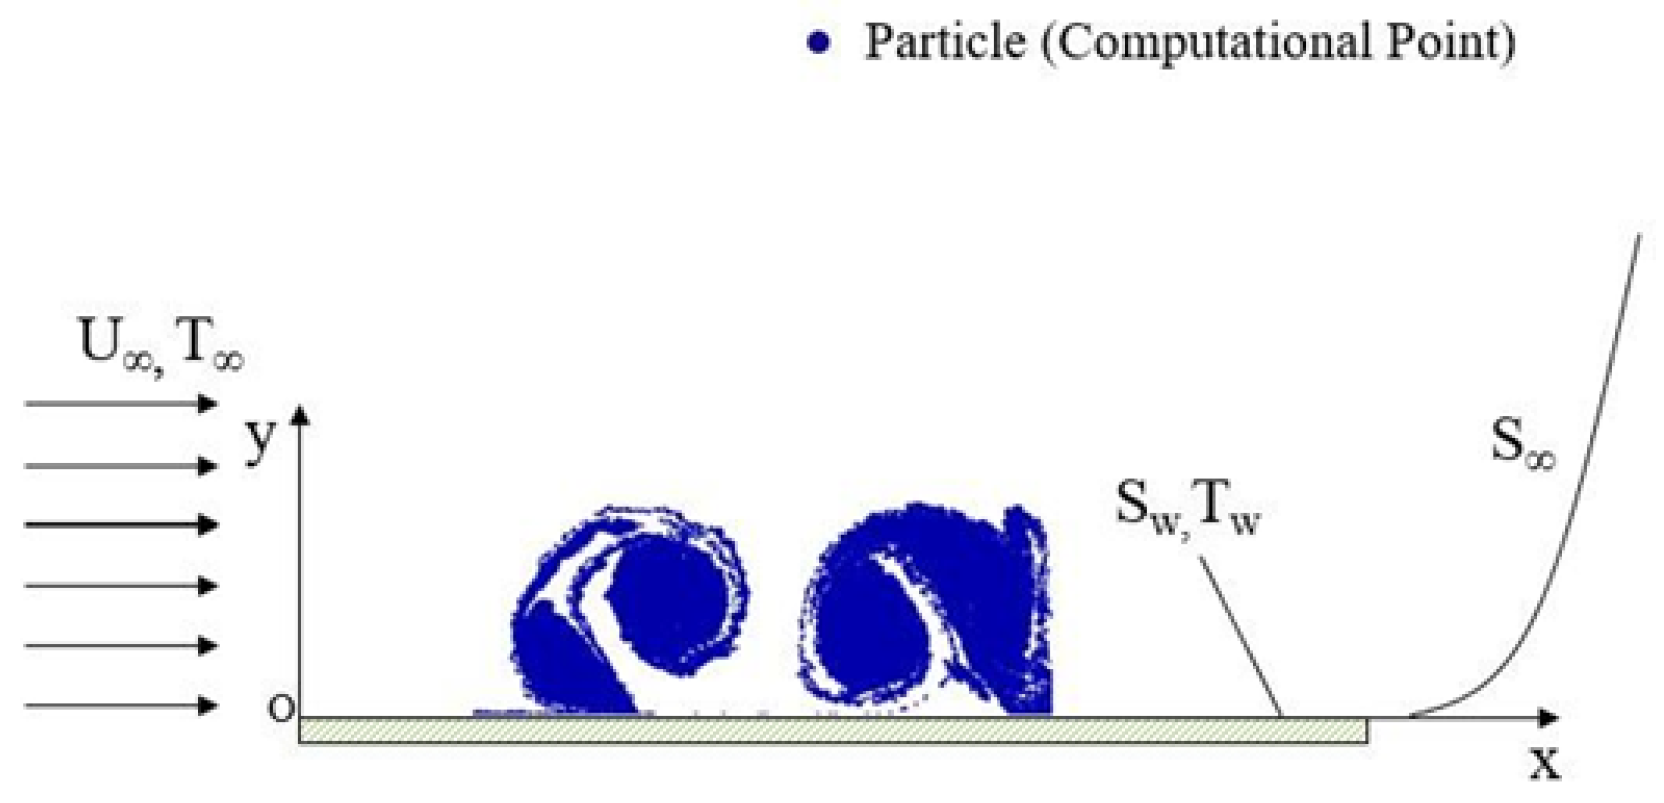
Figure 1. Example of problem geometry and important definitions.
Applsci 15 04122 g001
Figure 2. Shedding of a nascent particle during time step Δ t .
Applsci 15 04122 g002
Figure 3. Schematic of the spatial average velocity calculation model for the TPM (vortex blobs are in blue and temperature particles are in red).
Applsci 15 04122 g003
Figure 4. Examples of the boxes structure construction to calculate the local eddy viscosity coefficient and the turbulent thermal diffusivity coefficient.
Applsci 15 04122 g004
Figure 5. Contribution of the cluster of temperature particles (in red) to compute the buoyancy forces over every vortex blob (in blue).
Applsci 15 04122 g005
Figure 6. Temporal history of integrated aerodynamic loads: (a) Ri = 0 and (b) Ri = 0.168.
Applsci 15 04122 g006
Figure 7. Pressure coefficient on the cylinder surface related to points P–T.
Applsci 15 04122 g007
Figure 8. Time-averaged pressure coefficient distribution around the cylinder [43].
Applsci 15 04122 g008
Figure 9. Position of the wake particles at t = 22.5 for case B: (a) wake vortices and (b) heat wake.
Applsci 15 04122 g009
Figure 10. Crosswind interferences on the predicted trajectories of the vortical structures from wing tips (Ri = 0.0 and Re = 7650) [32].
Applsci 15 04122 g010
Figure 11. Crosswind interferences on the predicted trajectories of the vortical structures from wing tips (Ri = 1.018 and Re = 7650) [32].
Applsci 15 04122 g011
Figure 12. Trajectory of the centroid of the left and right wingtip vortices for test case (1).
Applsci 15 04122 g012
Figure 13. Instantaneous velocity field at t = 75: (a) U = 0.0 and R i = 0.0 . (b) U = 0.0 and R i = 1.018 . (c) U = 0.02 and R i = 0.0 . (d) U = 0.02 and R i = 1.018 . (e) U = 0.04 and R i = 0.0 . (f) U = 0.04 and R i = 1.018 .
Applsci 15 04122 g013
Figure 14. Instantaneous vorticity distribution at t = 75: (a) U = 0.04 and R i = 0.0 . (b) U = 0.04 and R i = 1.018 .
Applsci 15 04122 g014
Figure 15. Details of parallel computing (OpenMP) acceleration for the TPM.
Applsci 15 04122 g015
Table 1. Dimensionless input data necessary to simulate the single circular cylinder problem.
DescriptionValue
Diameter (D)1.0
Inlet flow velocity ( U )1.0
Reynolds number (Re)100,000
Prandtl number (Pr)0.71
Richardson number (Ri)0 and 0.168
Table 2. Present numerical results for mean values of the drag, lift and Strouhal number.
Test CaseRi C d C l St
(A)0.01.23−0.0270.200
(B)0.1681.21−0.050.199
Table 3. Dimensionless input data necessary to simulate the airplane wingtip vortices problem [11,17].
ParameterValue
Runway length (L)8.0
Release height of the primary vortical structures (h)2.0
Center-to-center spacing of the vortical structure pair (b)1.0
Core radius of each primary vortical structure (r)0.1
Number of flat panels (M)40
Number of Lamb vortex elements of each primary vortical structure (N)50
Time stepping ( Δ t )0.05
Number of time steps (NSteps)1500
Core radius of each Lamb vortex ( σ V )0.001
Core radius of each temperature particle ( σ T )0.006
Preheating time ( τ )1.5
Table 4. Physical parameters adopted in the simulations for Re = 7650 and Pr = 0.71.
Test Case U Ri
(1)0.00.0
(2)0.020.0
(3)0.040.0
(4)0.01.018
(5)0.021.018
(6)0.041.018
Table 5. Dimensionless longitudinal distance between the centroid of the primary vortical structures.
Test CasePoints A–BPoints C–D
(1)2.78494.8974
(2)2.77894.6310
(3)2.84294.5377
(4)2.75414.7548
(5)2.73614.6138
(6)2.82744.3671
Disclaimer/Publisher’s Note: The statements, opinions and data contained in all publications are solely those of the individual author(s) and contributor(s) and not of MDPI and/or the editor(s). MDPI and/or the editor(s) disclaim responsibility for any injury to people or property resulting from any ideas, methods, instructions or products referred to in the content.