

Drying Characteristics of Chicken Manure Under a Variable Temperature Process

 ,
,
Abstract
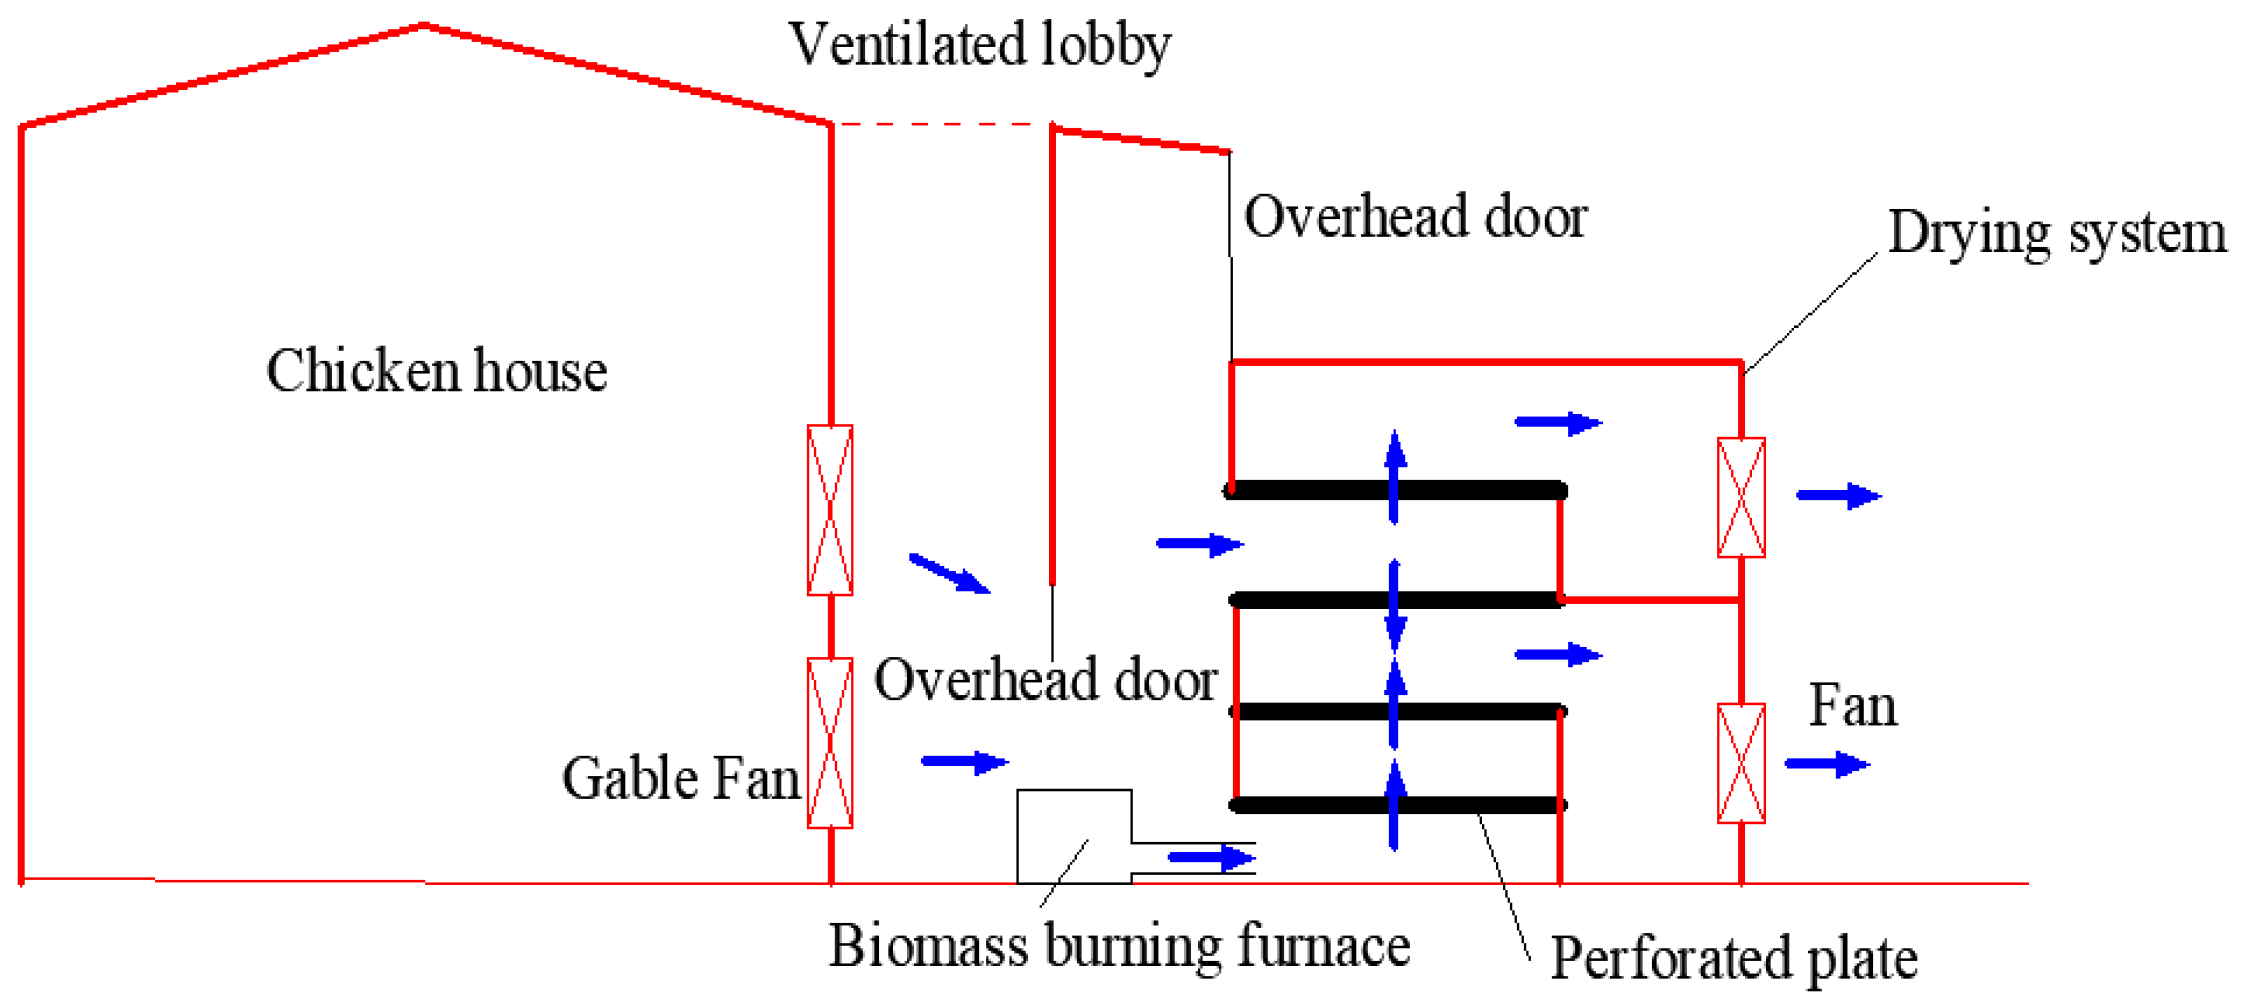
1. Introduction
2. Materials and Methods
2.1. Experimental Material
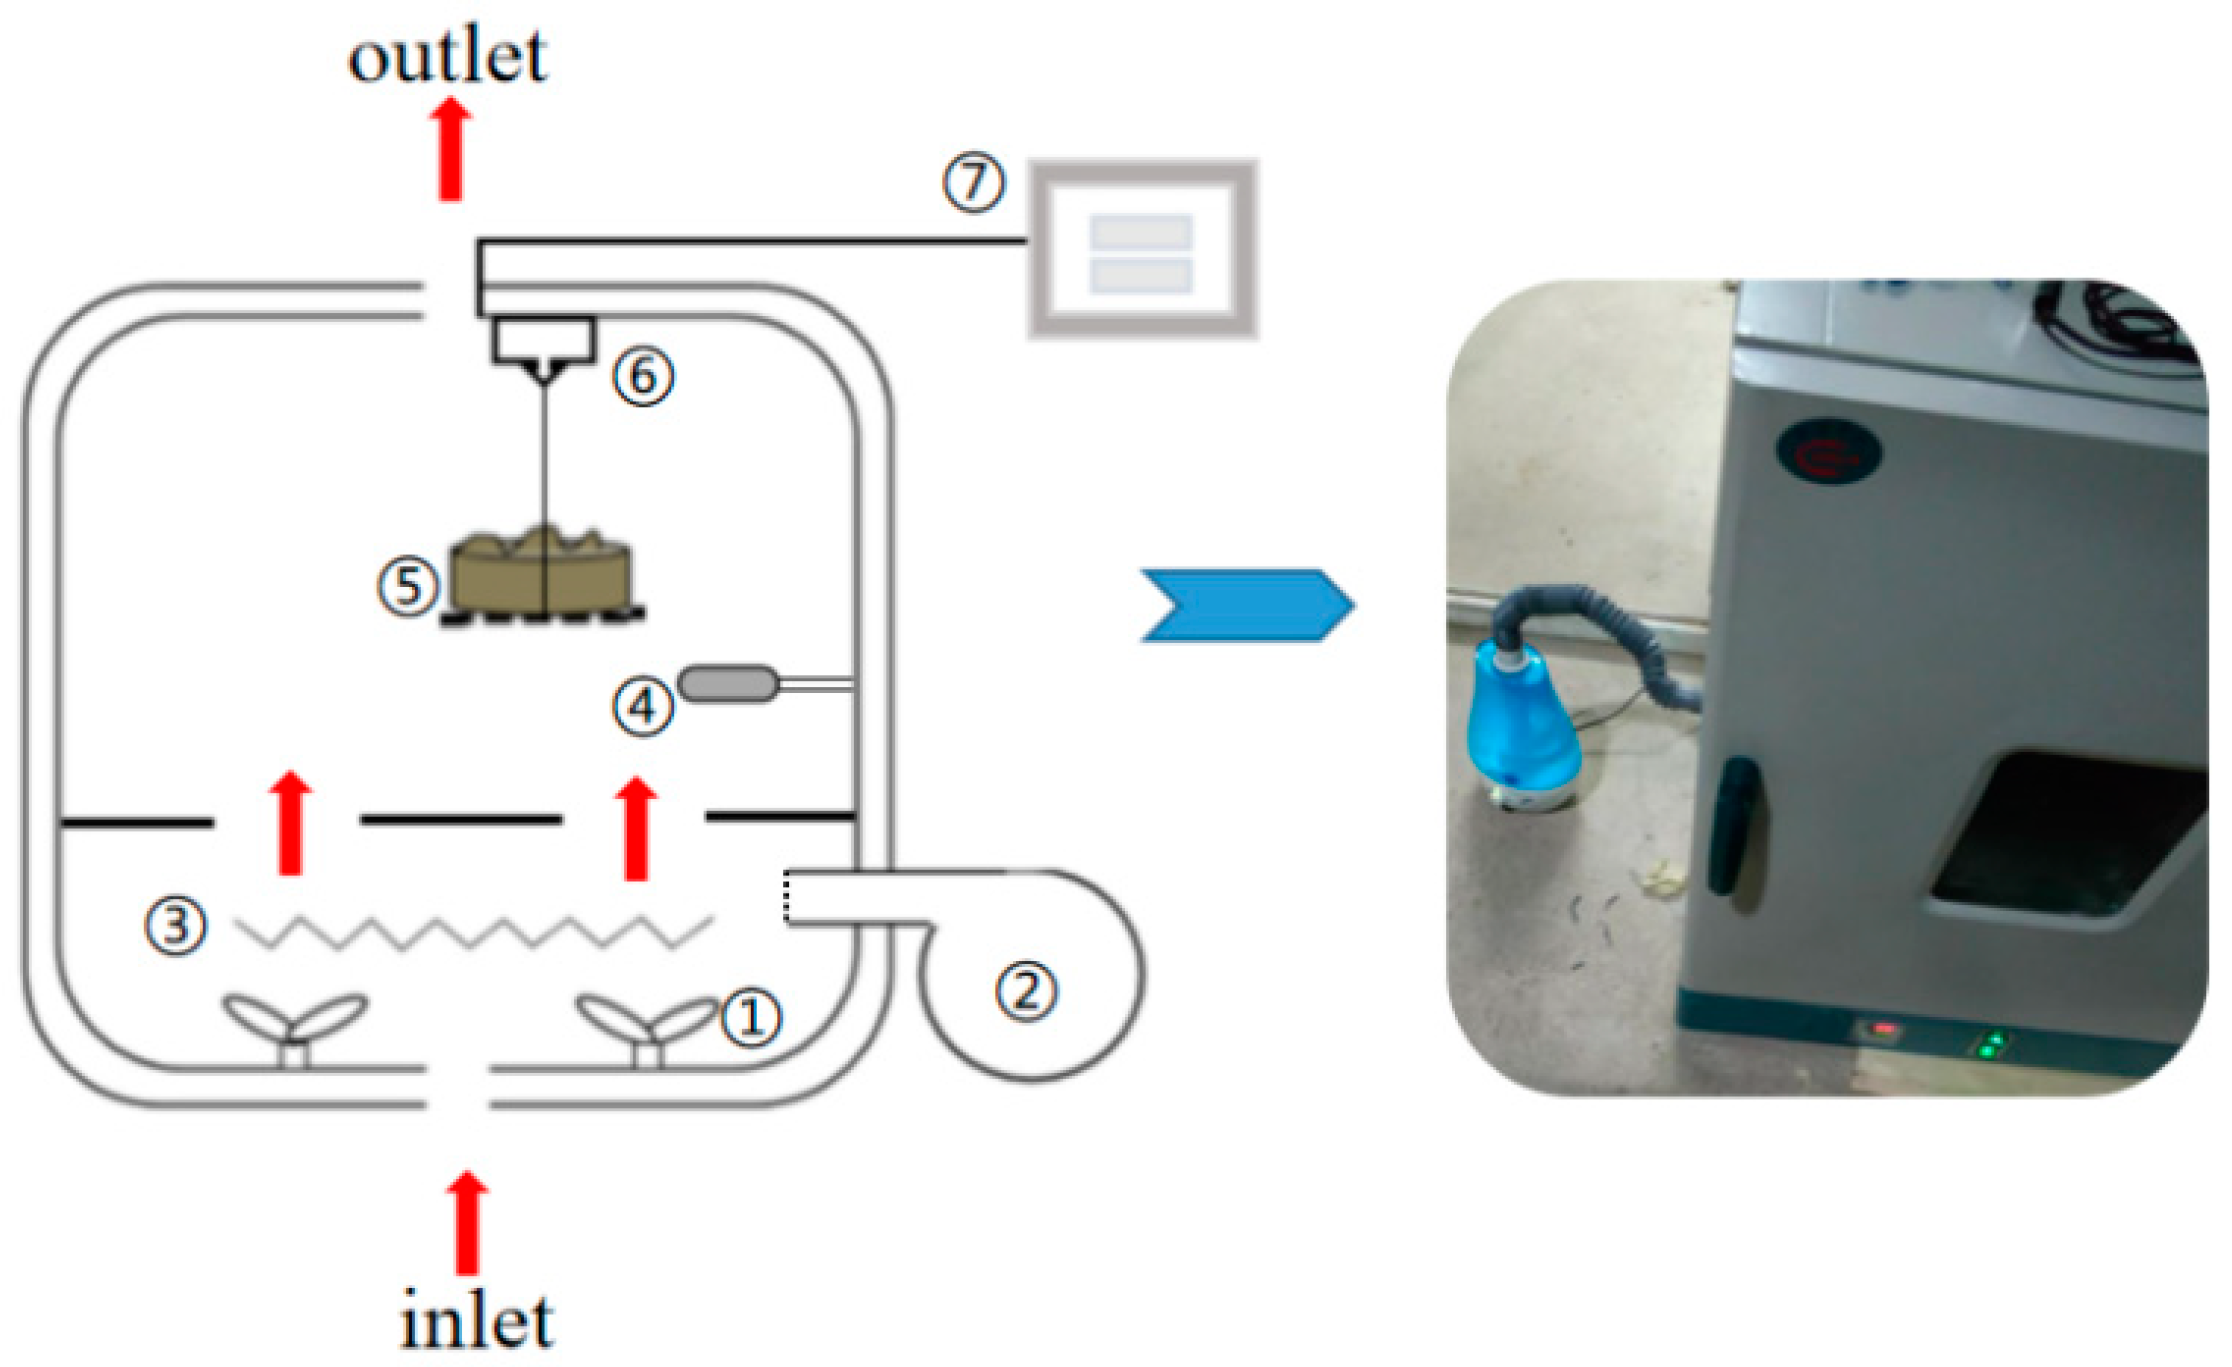
2.2. Experimental Apparatus
2.3. Experimental Uncertainty
2.4. Experimental Procedure
2.5. Calculation of Drying Parameters
3. Results and Discussion
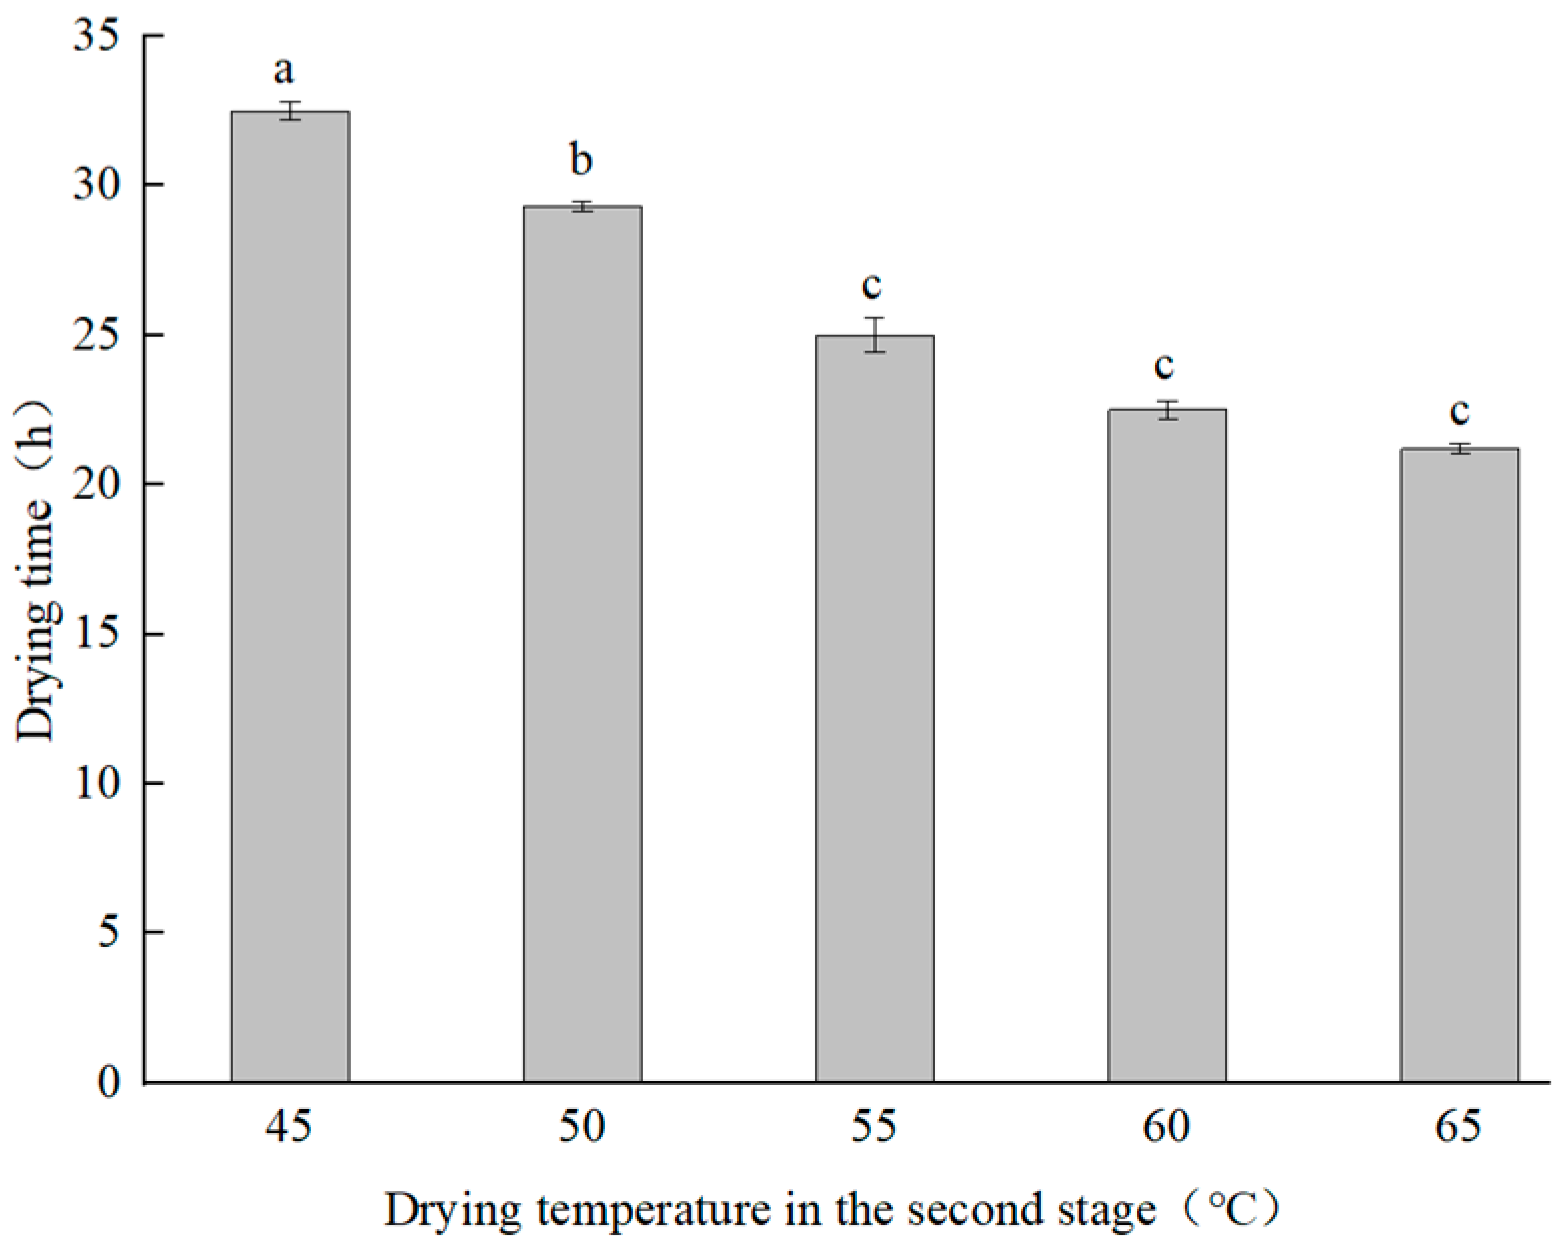
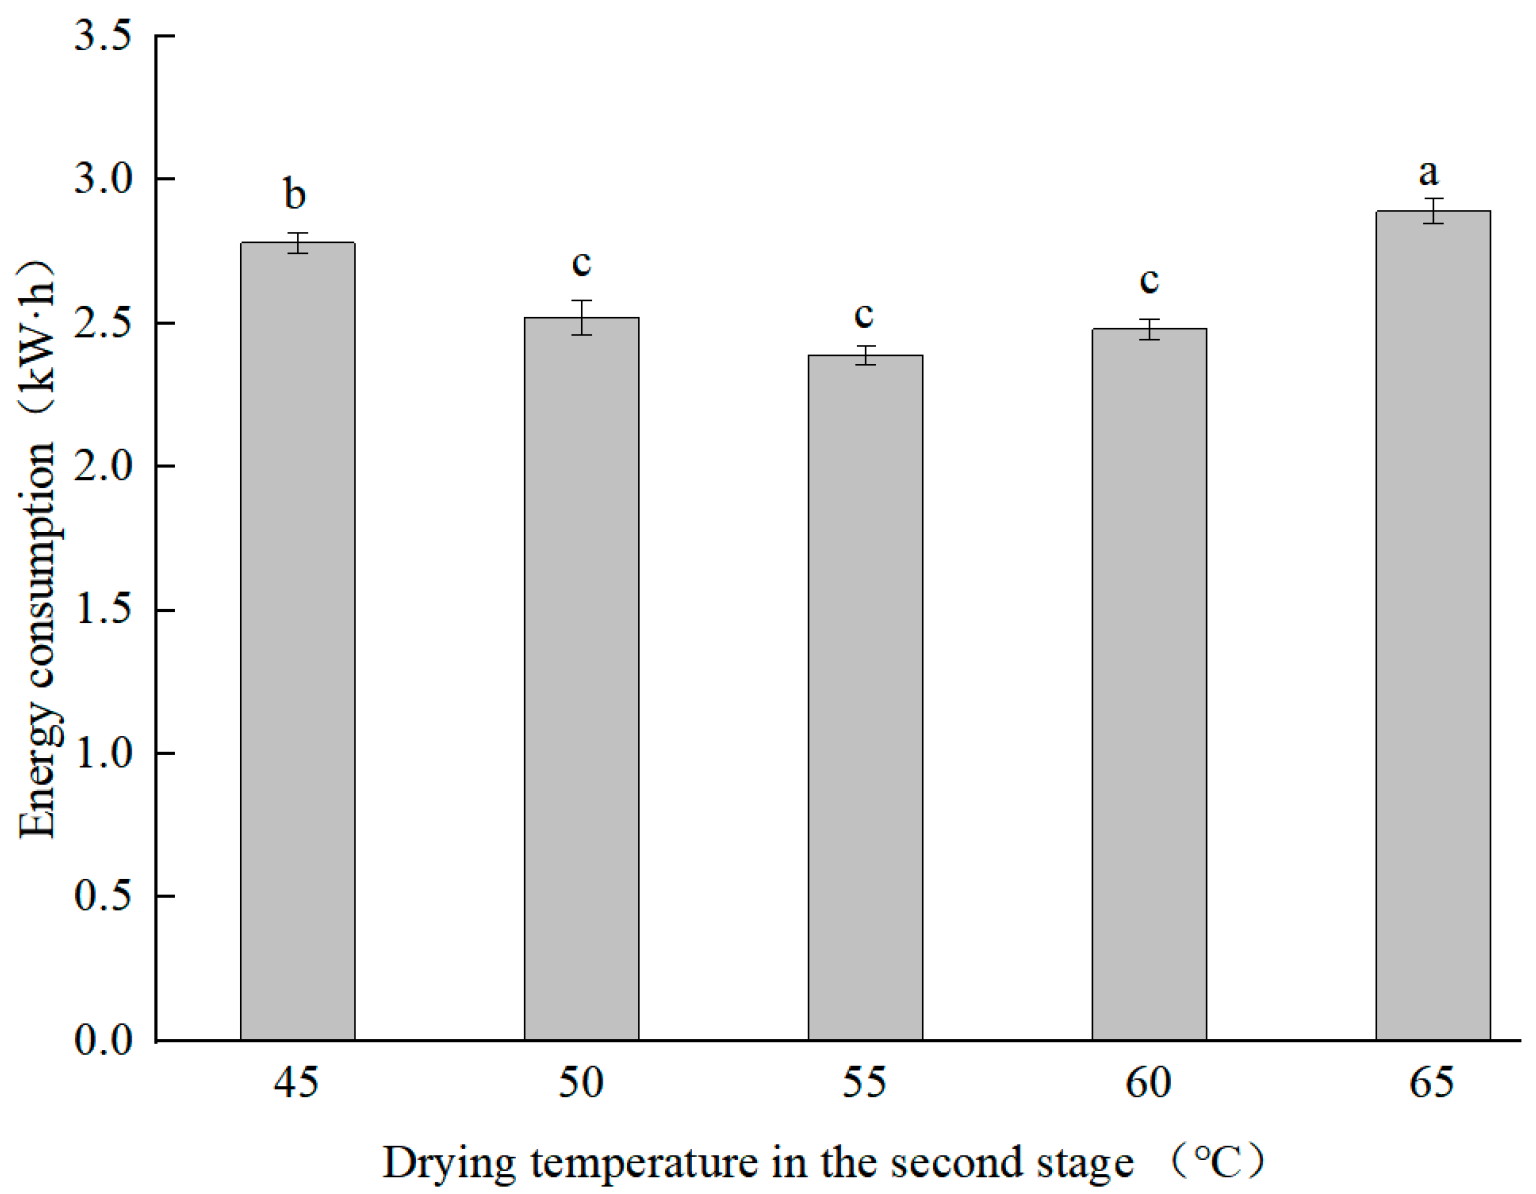
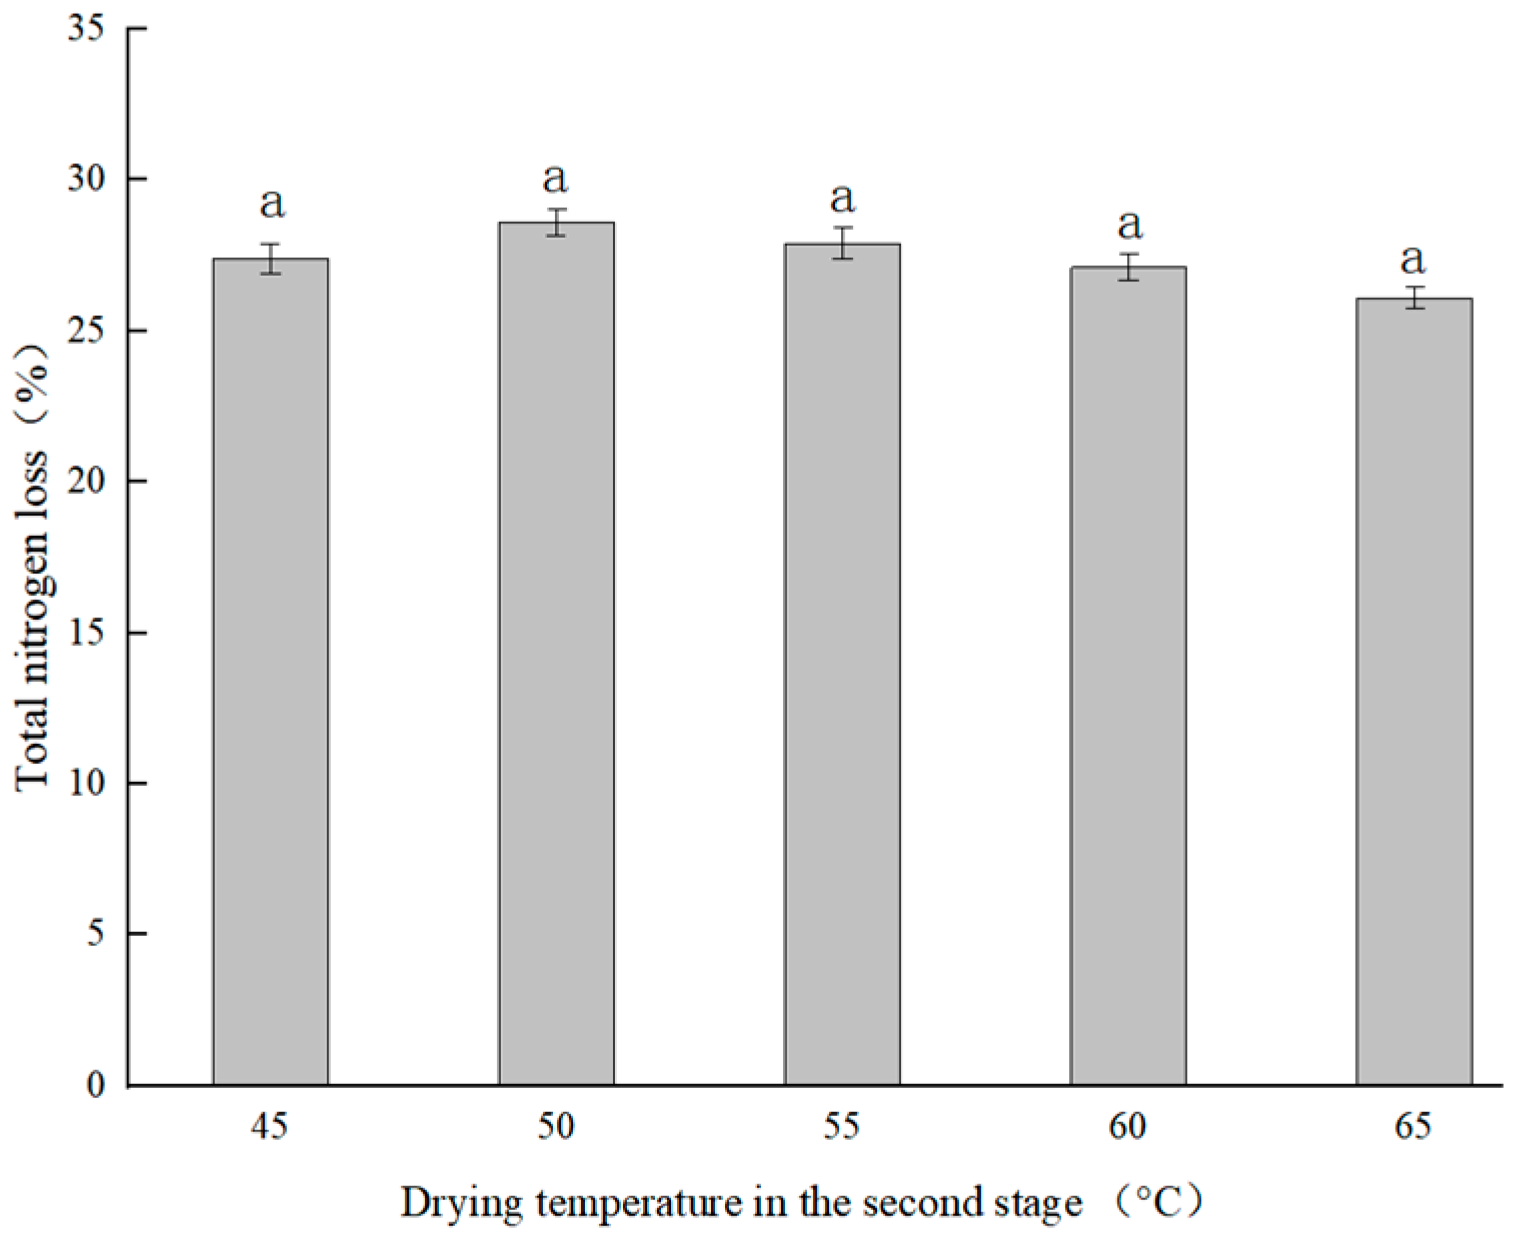
3.1. Drying Characteristics at Different Drying Temperatures
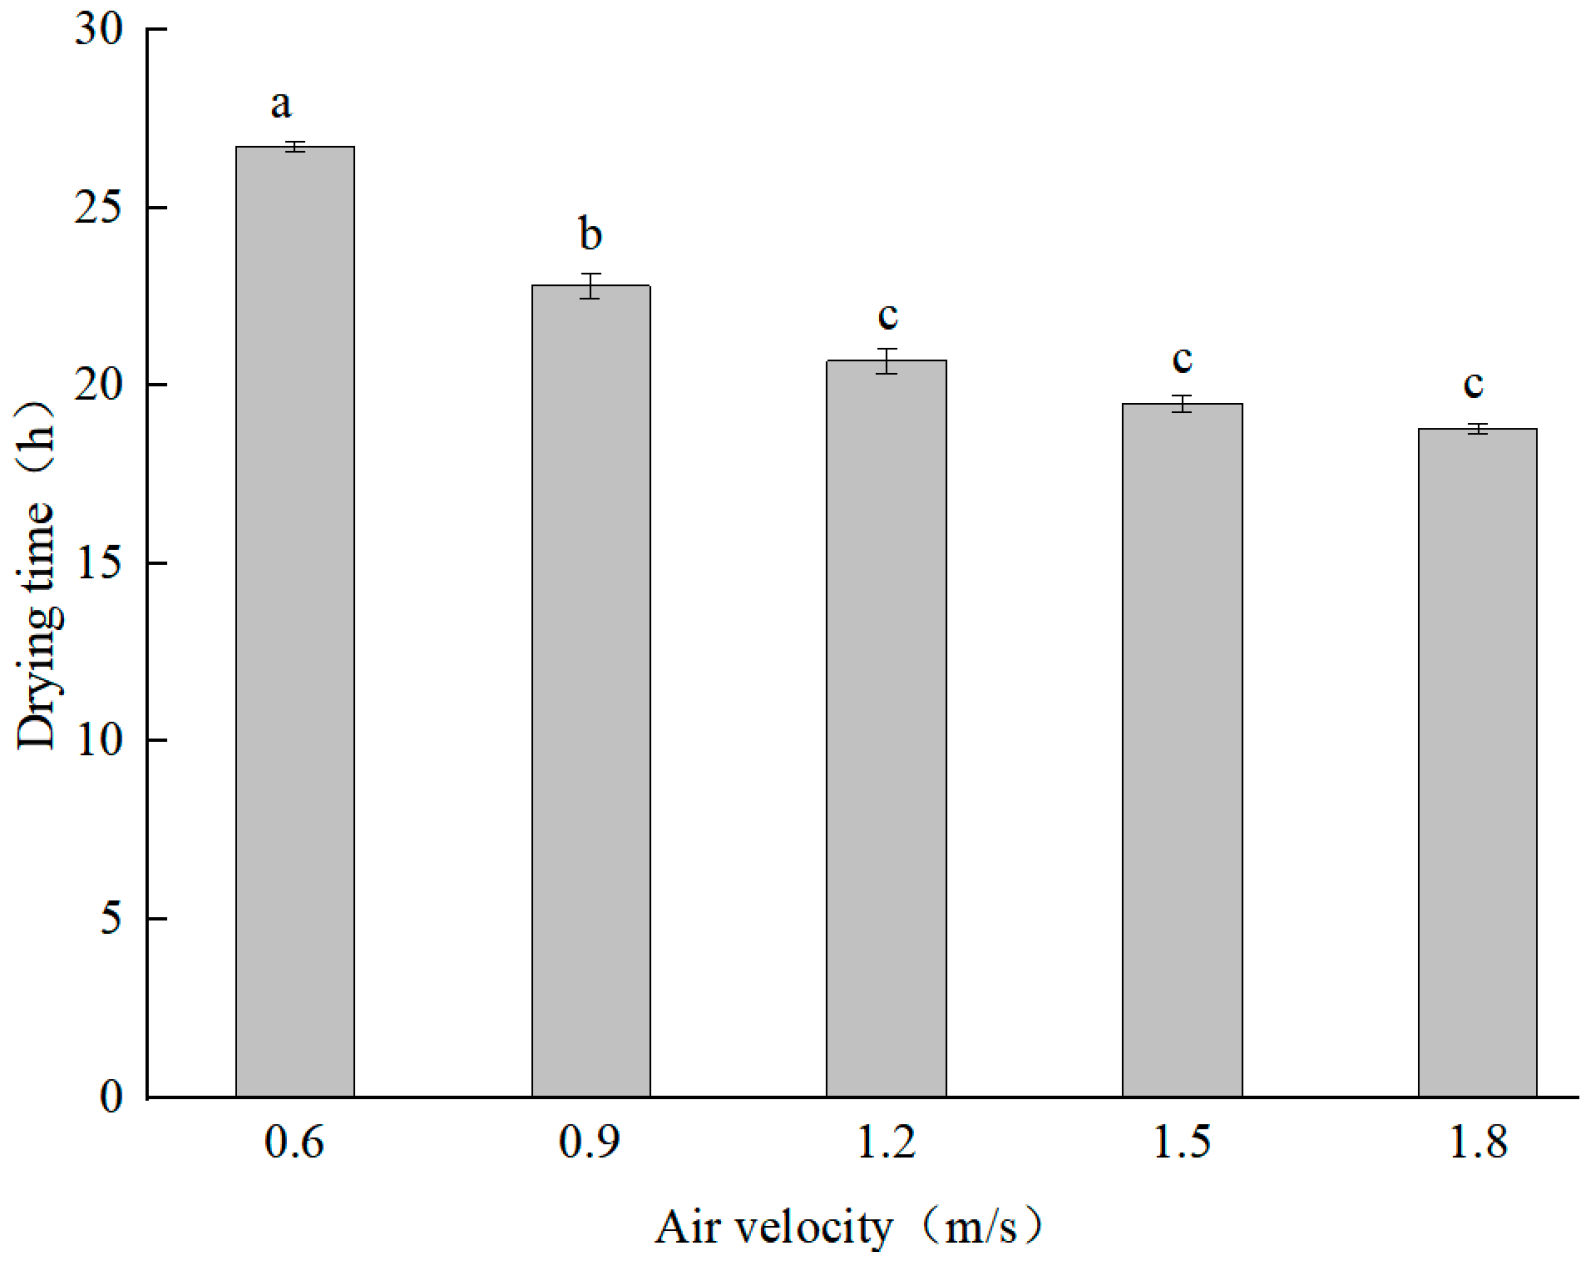
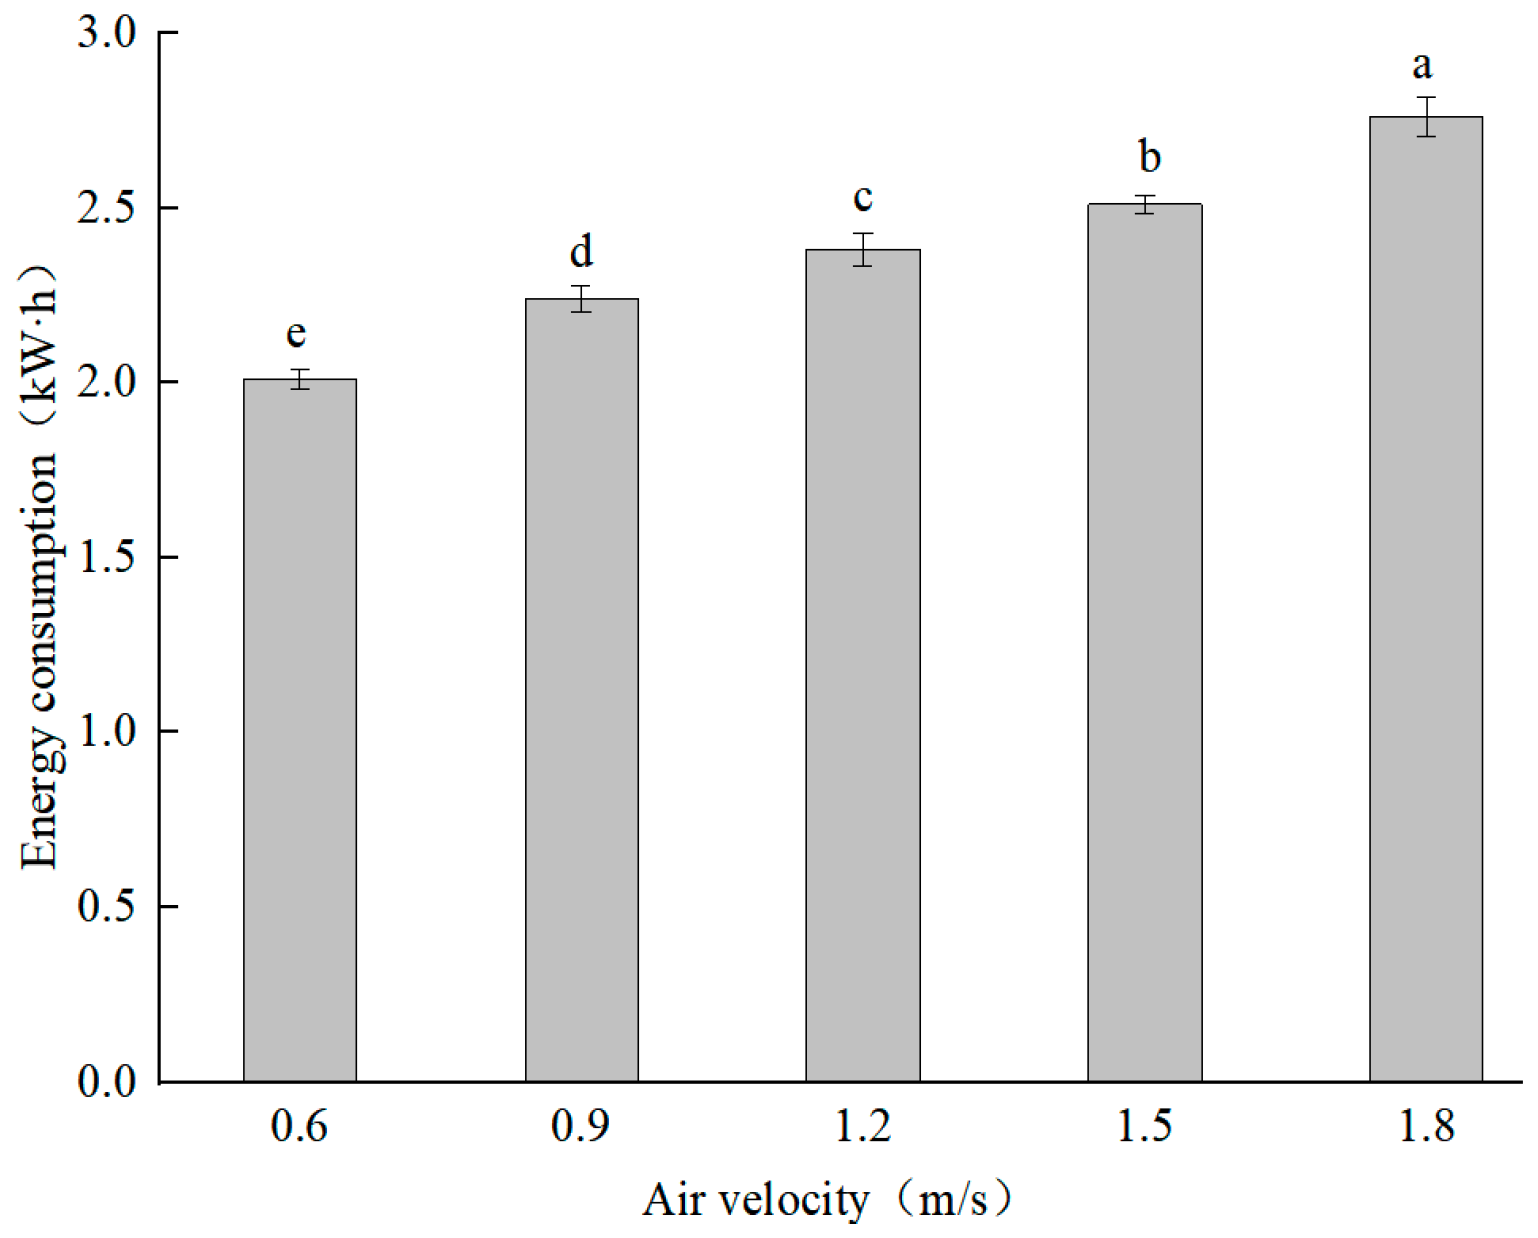
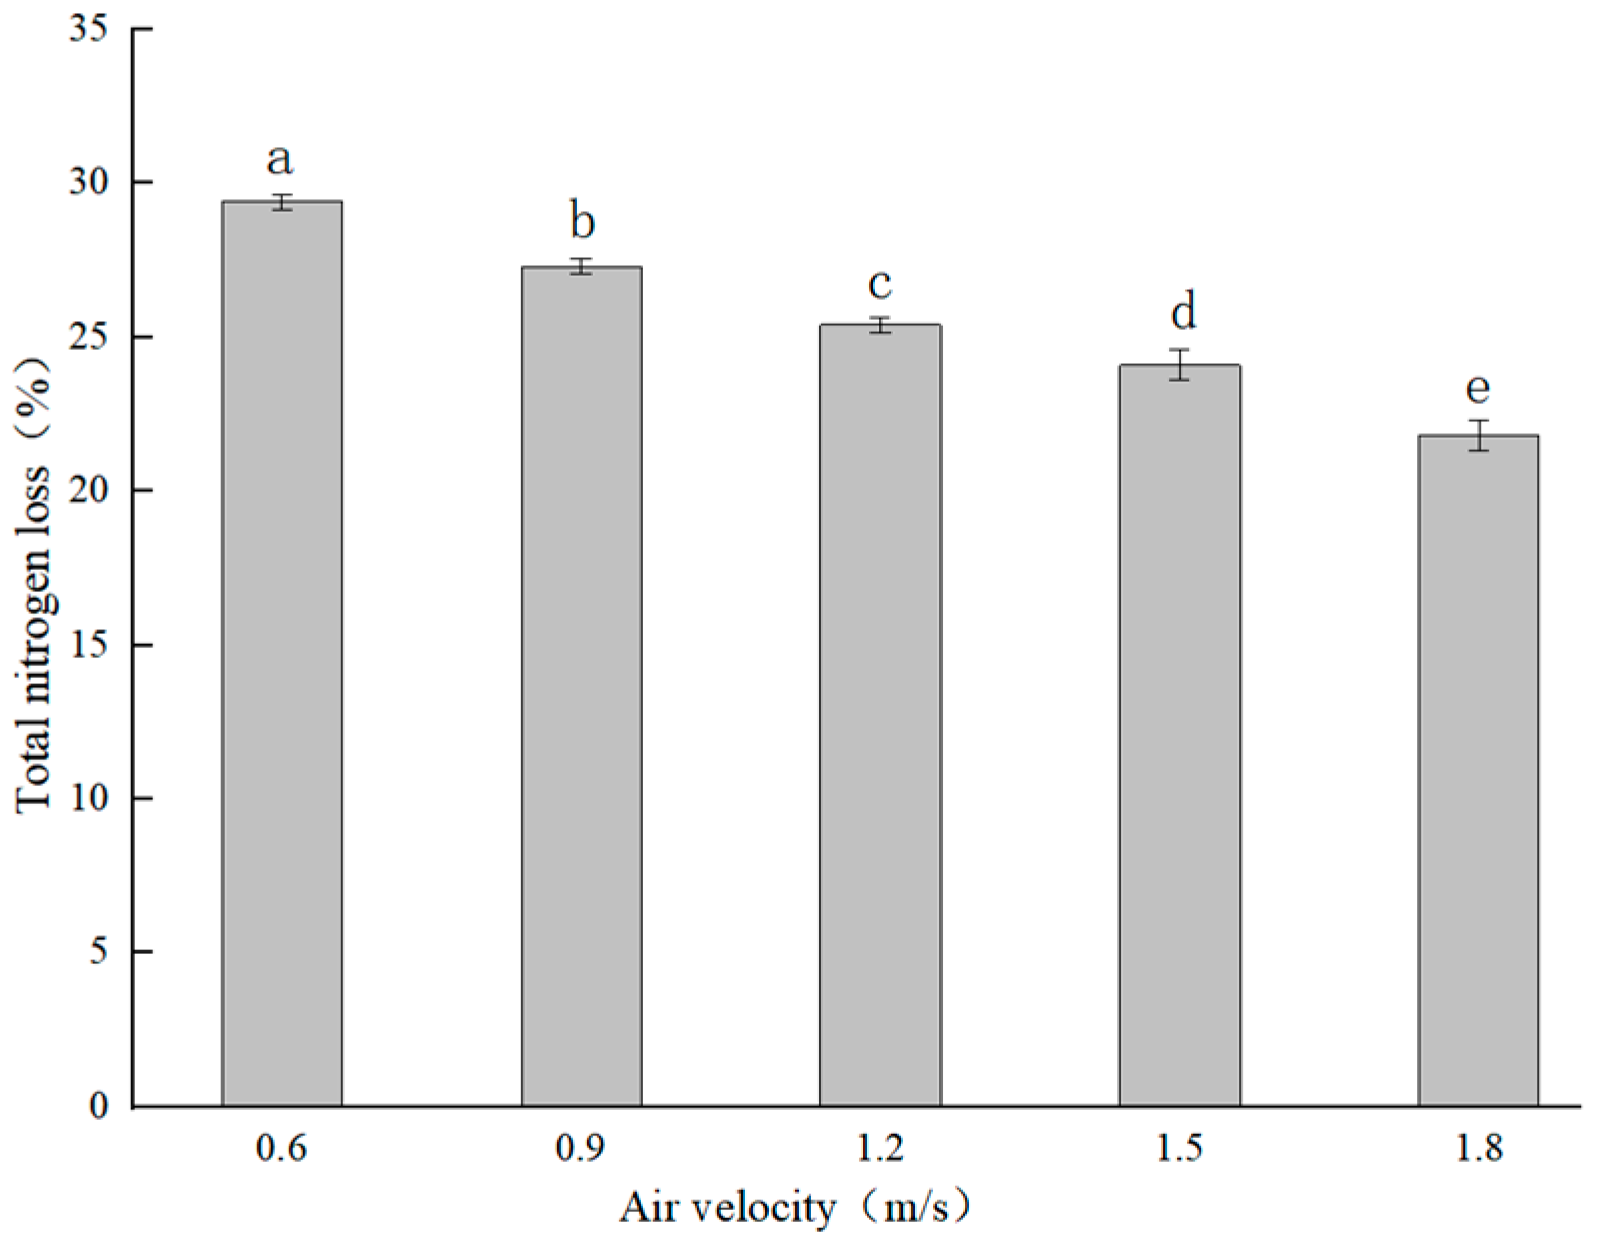
3.2. Drying Characteristics at Different Air Velocities
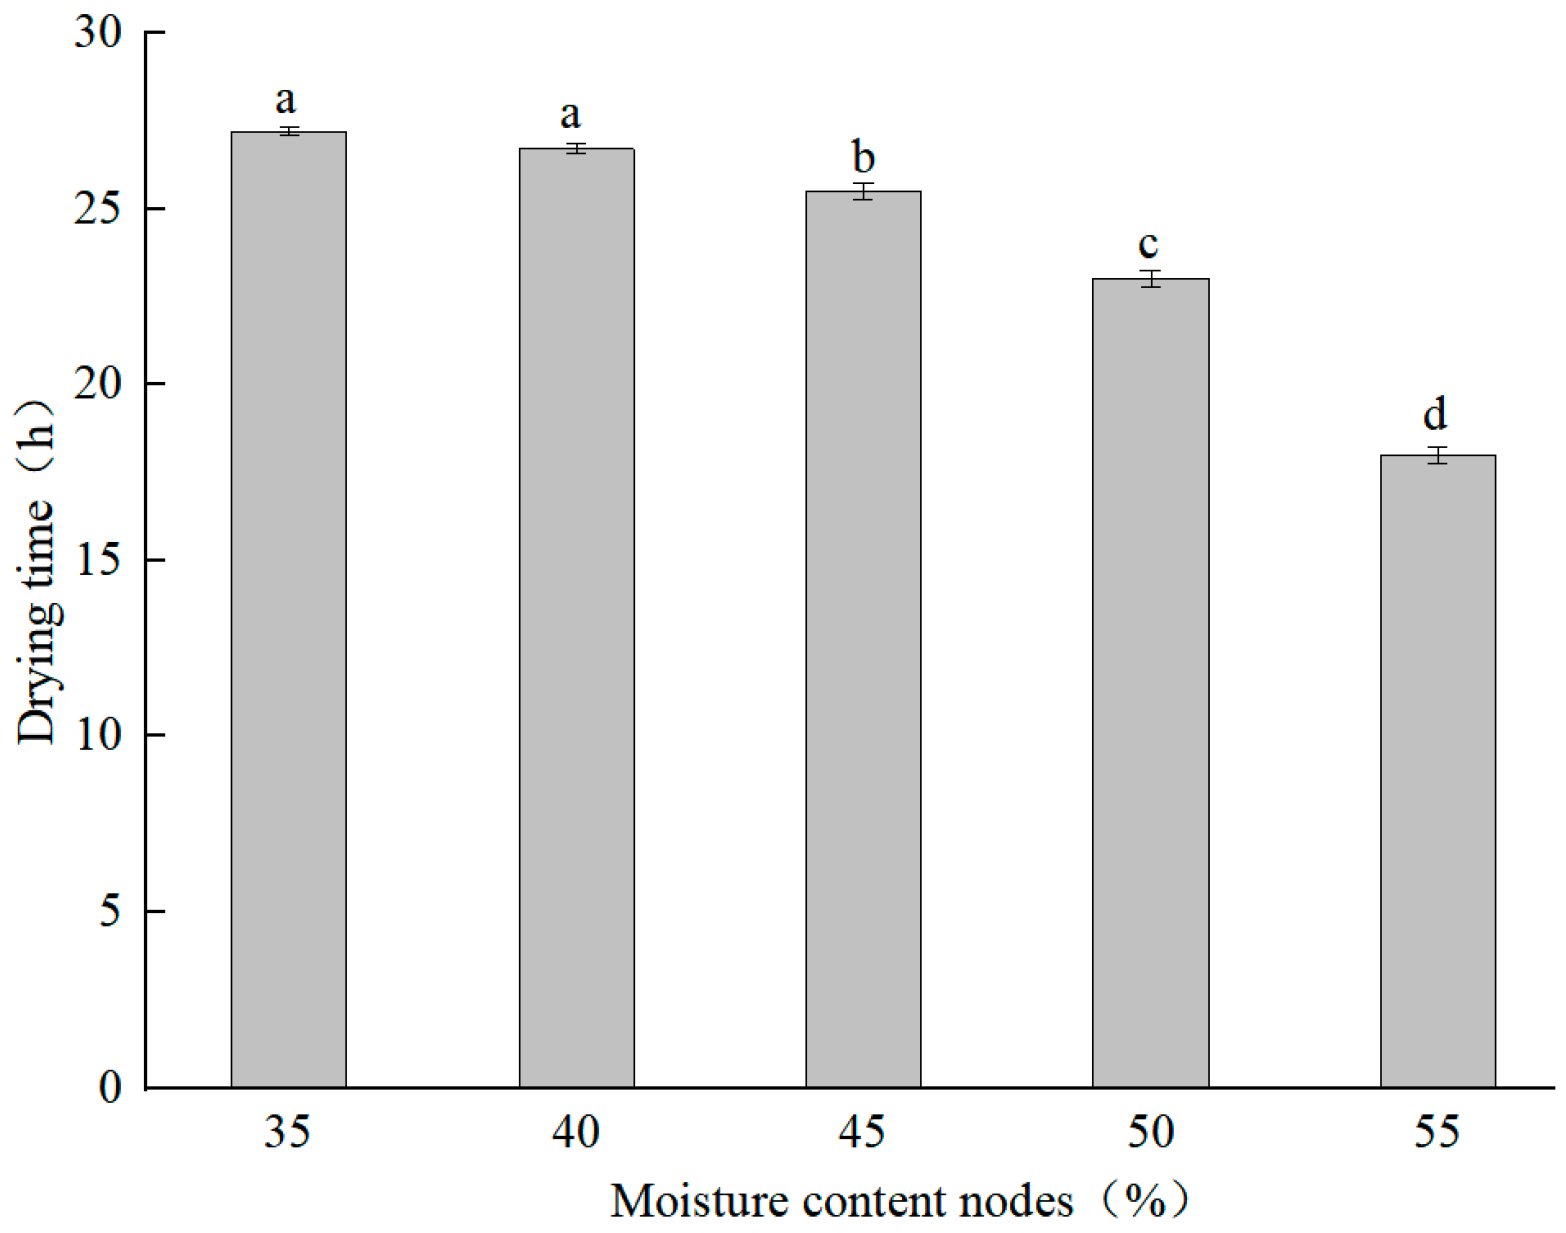
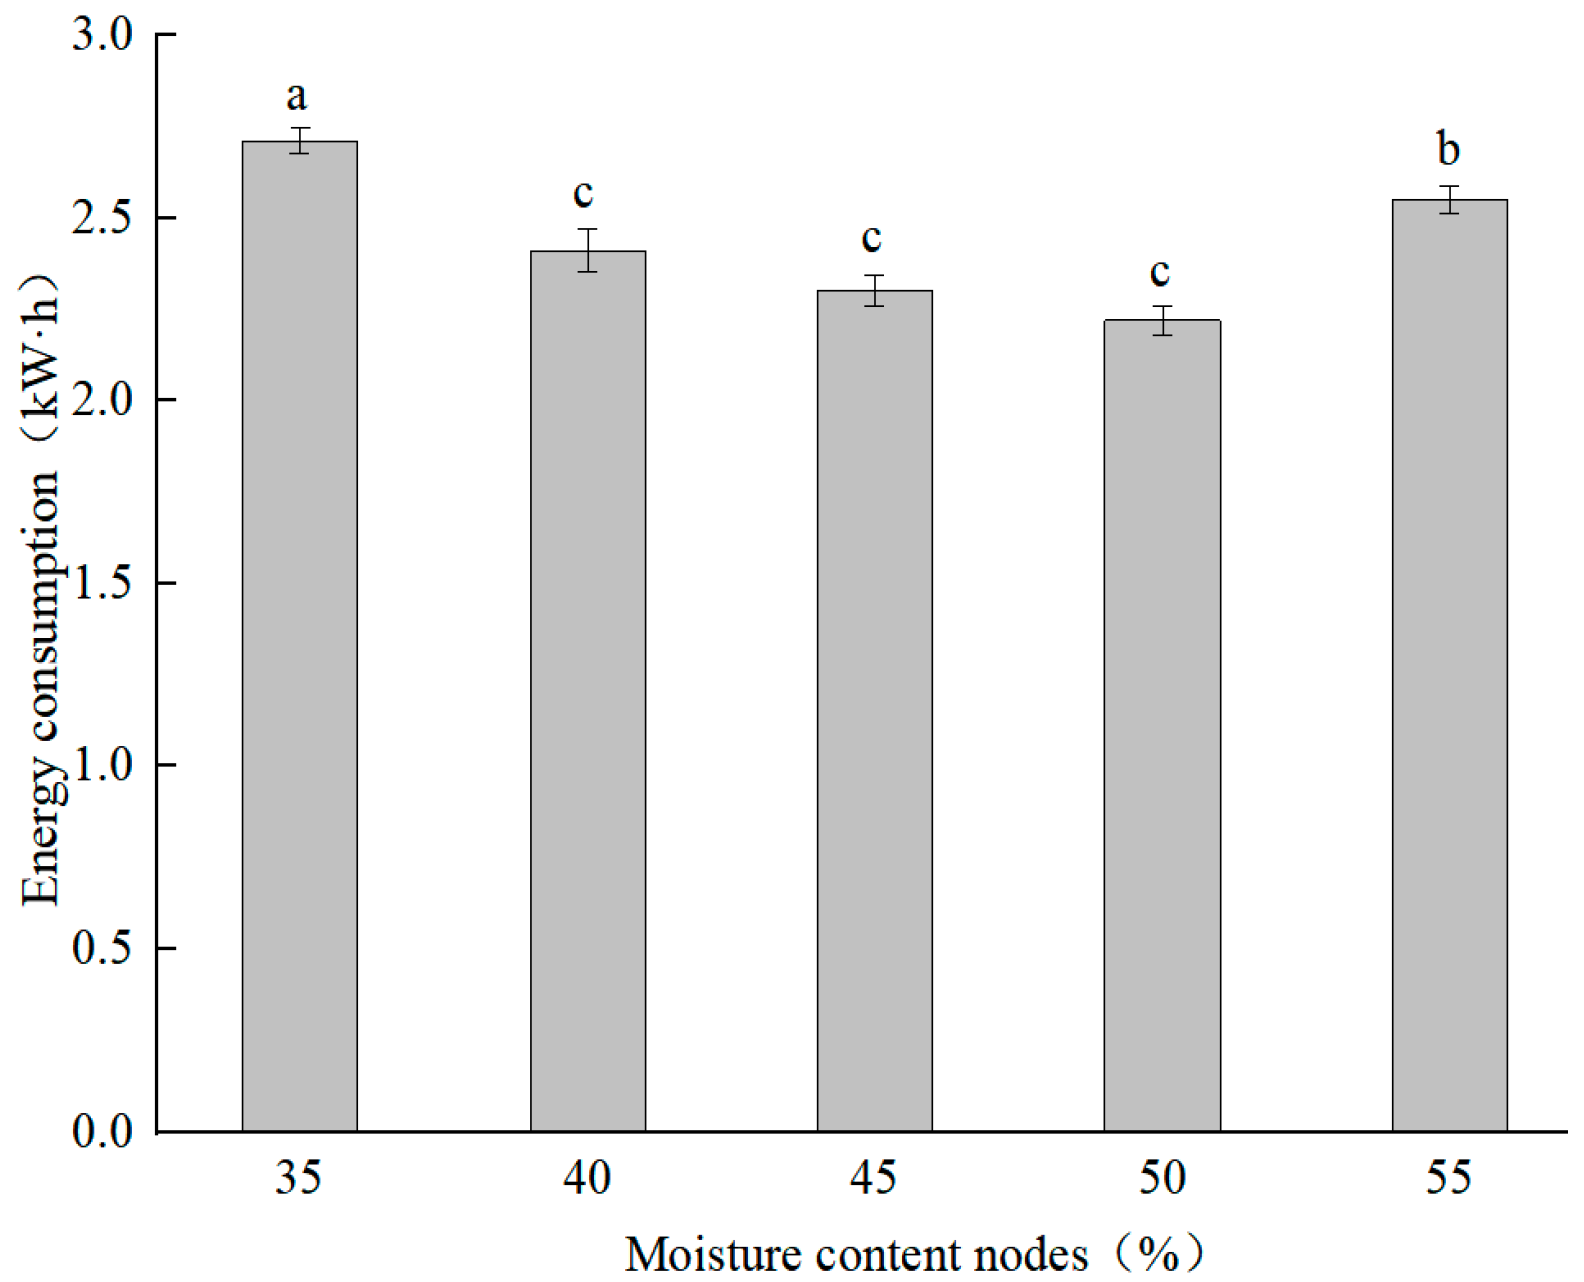
3.3. Drying Characteristics at Different Moisture Content Nodes
3.4. Orthogonal Experiment
4. Conclusions
- (1)
- In this research, single-factor experiments were employed to explore the impacts of drying temperature, air velocity, and moisture content nodes on drying time, energy consumption, and total nitrogen loss, and an orthogonal experiment was performed to analyze the comprehensive impact of different influencing factors. Additionally, the drying parameters were optimized through a combination of orthogonal and single-factor experiments.
- (2)
- By analyzing the influence of drying temperature of the second stage, air velocity, and water content nodes on drying time, energy consumption, and total nitrogen loss, we found that the optimal value of the drying temperature of the second stage was around 55 °C, the optimal value range of air velocity was 1.2–1.5 m/s, and the best value range of the water content node was 45–50%.
- (3)
- In the range of experimental parameters, the drying temperature in the second stage had no significant effect on total nitrogen loss during the chicken manure drying process (p > 0.05). In contrast, air velocity and moisture content nodes exerted significant effects on total nitrogen loss (p < 0.05), and the air velocity had significant effects on energy consumption (p < 0.05).
- (4)
- From the results of the orthogonal experiment and variance analysis, the drying temperature in the second stage exhibited a significant effect on the drying performance of chicken manure under variable temperature conditions (p < 0.05). However, the moisture content nodes and air velocity showed no significant effects on drying performance (p > 0.05). Thus, the air velocity and moisture content nodes can be set more flexibly within the experimental temperature range. In actual production, the following optimal parameters are recommended—drying temperature in the second stage: 57.5 °C, air velocity: 1.2–1.5 m/s, and moisture content nodes: 45–50%.
- (5)
- The findings of this study provide a theoretical foundation for utilizing residual air exchange heat and auxiliary heat sources in chicken manure drying systems. Additionally, these results provide a basis for setting the parameters for the optimal usage phase of the auxiliary heat source.
Author Contributions
Funding
Institutional Review Board Statement
Informed Consent Statement
Data Availability Statement
Conflicts of Interest
References
- Zheng, W.; Xiong, Y.; Gates, R. Air temperature, carbon dioxide, and ammonia assessment inside a commercial cage layer barn with manure-drying tunnels. Poult. Sci. 2020, 99, 3885–3896. [Google Scholar] [CrossRef] [PubMed]
- Winkel, A.; Mosquera, J.; Aarnink, A.J.A.; Koerkamp, P.W.G.G.; Ogink, N.W.M. Evaluation of manure drying tunnels to serve as dust filters in the exhaust of laying hen houses: Emissions of particulate matter, ammonia, and odour. Biosyst. Eng. 2017, 162, 81–98. [Google Scholar] [CrossRef]
- Li, X. Characteristics of Dehydration and Nitrogen Loss During Air Drying of Chicken Manure and Experimental Study on Exhaust Air Drying System in Chicken Coop. Master’s Thesis, China Agricultural University, Beijing, China, 2020. [Google Scholar]
- Lin, X.; Zhang, R.; Jiang, S.; Mashad, H.; Xin, H. Emissions of ammonia, carbon dioxide and particulate matter from cage-free layer houses in California. Atmos. Environ. 2017, 152, 246–255. [Google Scholar] [CrossRef]
- Winkel, A.; Losada, J.M.; Ellen, H.H. Dust filtering properties and ammonia emission of on-farm drying systems for poultry manure. Q. J. Med. 2012, 25, 527–539. [Google Scholar]
- Rosa, E.; Arriaga, H.; Merino, P. Ammonia emission from a manure-belt laying hen facility equipped with an external manure drying tunnel. J. Clean. Prod. 2019, 251, 119591. [Google Scholar] [CrossRef]
- Li, X.; Li, B.; Zheng, W.; Wang, Q.; Tong, Q. Drying performance of manure drying system with waste heat of poultry house in summer. Trans. Chin. Soc. Agric. Eng. 2019, 35, 188–194. [Google Scholar] [CrossRef]
- Li, Y.; Wang, X. A case study on resource utilization of livestock and poultry manure-Chicken manure drying project of Tongle Ecological Agriculture Co., Ltd. China Anim. Husb. 2020, 23, 46–47. [Google Scholar] [CrossRef]
- Liska, R.; Kic, P. Characteristics of drying process of poultry manure at various temperatures. Sci. Agric. Bohem. 2011, 42, 79–86. [Google Scholar]
- Ghaly, A.; Alhattab, M. Drying poultry manure for pollution potential reduction and production of organic fertilizer. Am. J. Environ. Sci. 2013, 9, 88–102. [Google Scholar] [CrossRef]
- Cui, Z.; Liu, Y.; Luo, L. Research progress on utilization technology of chicken manure resources. China Poult. 2012, 44, 83–89. [Google Scholar] [CrossRef]
- Manogaran, M.D.; Shamsuddin, R.; Yusoff, M.H. A Review on Treatment Processes of Chicken Manure. Clean. Circ. Bioecon. 2022, 2, 100013. [Google Scholar] [CrossRef]
- Krissada, N.; Phitsanupong, P.; Witaya, P. Thermal analysis of hot air drying of chicken manure pellets in a modified portable horizontal rotary dryer. Heat Mass Transf. 2022, 58, 1997–2007. [Google Scholar] [CrossRef]
- Nicholas, L.; Mabbett, I. Drying dairy manure using a passive solar still: A case study. Energy Nexus 2023, 10, 100183. [Google Scholar] [CrossRef]
- Akpinar, E.; Bicer, Y.; Midilli, A. Modelling and experimental study on drying of apple slices in a convective cyclone dryer. Food Process Eng. 2003, 26, 515–541. [Google Scholar] [CrossRef]
- Zheng, L.; Wu, J.; Zhou, X. Kinetic characteristics of sludge drying under low temperature and low humidity conditions. J. Saf. Environ. 2016, 16, 275–279. [Google Scholar] [CrossRef]
- Fei, H. Water Characteristics and Biological Dehydration Pathways of Livestock Manure. Master’s Thesis, Nanjing Agricultural University, Nanjing, China, 2007. [Google Scholar]
- Liska, R.; Kic, P. Drying process of poultry manure at various temperatures. In Proceedings of the 4th International Conference TAE, Prague, Czech Republic, 7–10 September 2010. [Google Scholar]
- Mondini, C.; Chiumenti, R.; Borso, F.; Leital, L.; Nobili, M. Changes during processing in the organic matter of composted and air-dried poultry manure. Bioresour. Technol. 1996, 55, 243–249. [Google Scholar] [CrossRef]
- Zeng, Q. Analysis of Drying Characteristics and Energy Consumption of Sludge at Room Temperature. Master’s Thesis, South China University of Technology, Guangzhou, China, 2017. [Google Scholar]
- Nahm, K.H. Evaluation of the nitrogen content in poultry manure. World’s Poult. Sci. J. 2003, 59, 77–88. [Google Scholar] [CrossRef]
- Estela, P.; Raquel, B.; Xavier, F.; Antoni, S. Ammonia emissions from the composting of different organic wastes. Dependency on process temperature. Chemosphere 2006, 62, 1534–1542. [Google Scholar] [CrossRef]
- Li, X.; Li, B.; Tong, Q. The effect of drying temperature on nitrogen loss and pathogen removal in laying hen manure. Sustainability 2020, 12, 403. [Google Scholar] [CrossRef]
- Aboltins, A.; Kic, P. Forced convection in drying of poultry manure. Agron. Res. 2015, 13, 215–222. [Google Scholar]
- Wu, Y.; Liu, Y.; Han, J.; Wang, W. Study on convective drying characteristics of dredged sludge from Dian Lake. Sep. Sci. Technol. 2015, 50, 1731–1739. [Google Scholar] [CrossRef]
- Chepete, J.H.; Hongwei, X.; Hong, L. Ammonia Emissions of Laying-Hen Manure as Affected by Accumulation Time. J. Poult. Sci. 2011, 48, 133–138. [Google Scholar] [CrossRef]
- Keiichi, M.; Masayuki, H.; Takuya, K. Increased total nitrogen content of poultry manure by decreasing water content through composting processes. Soil Sci. Plant Nutr. 2011, 57, 705–709. [Google Scholar] [CrossRef]
- Wang, Z.; Xu, L.; Liu, D. Effects of Air Temperature and Humidity on the Kinetics of Sludge Drying at Low Temperatures. Energies 2021, 14, 7722. [Google Scholar] [CrossRef]


| Samples | Moisture (%) | Ash (%) | pH (%) | TKN (g/kg) |
|---|---|---|---|---|
| Chicken manure | 78.5 ± 2.0 | 26.4 ± 1.5 | 6.5 ± 0.1 | 55.42 ± 1.98 |
| Parameter | Uncertainty |
|---|---|
| Temperature of temperature sensor | ±0.1 (°C) |
| Total nitrogen concentration | ±0.2 (g/kg) |
| Air velocity | ±0.1 (m/s) |
| Manure weight | ±0.1 (g) |
| Energy consumption | ±0.1 (kWh) |
| Group | Drying Temperature in the Second Stage (°C) | Air Velocity (m/s) | Moisture Content Nodes (%) |
|---|---|---|---|
| 1 | 45 | 1.2 | 45 |
| 2 | 50 | 1.2 | 45 |
| 3 | 55 | 1.2 | 45 |
| 4 | 60 | 1.2 | 45 |
| 5 | 65 | 1.2 | 45 |
| 6 | 55 | 0.6 | 45 |
| 7 | 55 | 0.9 | 45 |
| 8 | 55 | 1.5 | 45 |
| 9 | 55 | 1.8 | 45 |
| 10 | 55 | 1.2 | 35 |
| 11 | 55 | 1.2 | 40 |
| 12 | 55 | 1.2 | 50 |
| 13 | 55 | 1.2 | 55 |
| Factor | |||
|---|---|---|---|
| Drying Temperature in the Second Stage (°C) | Air Velocity (m·s−1) | Moisture Content Nodes (%) | |
| 1 | 52.5 | 1.2 | 45 |
| 2 | 55 | 1.35 | 47.5 |
| 3 | 57.5 | 1.5 | 50 |
| Number | Drying Temperature in the Second Stage (°C) | Air Velocity (m·s−1) | Moisture Content Nodes (%) | Drying Time (h) | Energy Consumption (kWh) | Total Nitrogen Loss (%) | Evaluation Score |
|---|---|---|---|---|---|---|---|
| 1 | 1 (52.5) | 1 (1.2) | 1 (45) | 27.9 ± 0.44 | 2.36 ± 0.08 | 29.7 ± 0.6 | 79.71 |
| 2 | 1 (52.5) | 2 (1.35) | 2 (47.5) | 27.0 ± 0.17 | 2.23 ± 0.12 | 28.1 ± 0.2 | 83.79 |
| 3 | 1 (52.5) | 3 (1.5) | 3 (50) | 25.5 ± 0.29 | 2.57 ± 0.09 | 25.4 ± 0.8 | 83.31 |
| 4 | 2 (55) | 1 (1.2) | 2 (47.5) | 24.8 ± 0.17 | 2.48 ± 0.05 | 27.3 ± 0.4 | 82.99 |
| 5 | 2 (55) | 2 (1.35) | 3 (50) | 23.2 ± 0.17 | 2.58 ± 0.08 | 24.4 ± 0.4 | 86.71 |
| 6 | 2 (55) | 3 (1.5) | 1 (45) | 24.2 ± 0.17 | 2.64 ± 0.12 | 25.0 ± 0.8 | 84.23 |
| 7 | 3 (57.5) | 1 (1.2) | 3 (50) | 19.8 ± 0.17 | 2.67 ± 0.08 | 21.6 ± 0.6 | 94.08 |
| 8 | 3 (57.5) | 2 (1.35) | 1 (45) | 21.0 ± 0.29 | 2.49 ± 0.06 | 22.8 ± 0.8 | 92.65 |
| 9 | 3 (57.5) | 3 (1.5) | 2 (47.5) | 19.7 ± 0.44 | 2.82 ± 0.05 | 23.9 ± 0.5 | 89.31 |
| K1 | 246.81 | 256.78 | 256.59 | Primary and secondary factors: the drying temperature in the second stage > water content nodes > air velocity. | |||
| K2 | 253.93 | 264.58 | 256.09 | ||||
| K3 | 276.04 | 256.85 | 264.10 | ||||
| Range | 29.23 | 7.80 | 8.01 | ||||
| Source | Sum of Squares | df | Mean Square | F-Value | p-Value |
|---|---|---|---|---|---|
| A | 154.88 | 2 | 77.44 | 67.05 | * |
| B | 13.40 | 2 | 6.70 | 5.80 | |
| C | 13.42 | 2 | 6.71 | 5.81 | |
| Pure error | 2.31 | 2 | 1.16 |
Disclaimer/Publisher’s Note: The statements, opinions and data contained in all publications are solely those of the individual author(s) and contributor(s) and not of MDPI and/or the editor(s). MDPI and/or the editor(s) disclaim responsibility for any injury to people or property resulting from any ideas, methods, instructions or products referred to in the content. |
© 2025 by the authors. Licensee MDPI, Basel, Switzerland. This article is an open access article distributed under the terms and conditions of the Creative Commons Attribution (CC BY) license (https://creativecommons.org/licenses/by/4.0/).
Share and Cite
Li, X.; Kang, X.; Xi, L.; Dou, Q.; Shi, Z.; Liu, T.; Wang, L. Drying Characteristics of Chicken Manure Under a Variable Temperature Process. Appl. Sci. 2025, 15, 4093. https://doi.org/10.3390/app15084093
Li X, Kang X, Xi L, Dou Q, Shi Z, Liu T, Wang L. Drying Characteristics of Chicken Manure Under a Variable Temperature Process. Applied Sciences. 2025; 15(8):4093. https://doi.org/10.3390/app15084093
Chicago/Turabian StyleLi, Xuanyang, Xiangtao Kang, Lei Xi, Qi Dou, Zhifang Shi, Tongshuai Liu, and Limin Wang. 2025. "Drying Characteristics of Chicken Manure Under a Variable Temperature Process" Applied Sciences 15, no. 8: 4093. https://doi.org/10.3390/app15084093
APA StyleLi, X., Kang, X., Xi, L., Dou, Q., Shi, Z., Liu, T., & Wang, L. (2025). Drying Characteristics of Chicken Manure Under a Variable Temperature Process. Applied Sciences, 15(8), 4093. https://doi.org/10.3390/app15084093