

Automatic Segmentation of Gas Metal Arc Welding for Cleaner Productions

 ,
, 
 and
and 
Abstract
Featured Application
Abstract
1. Introduction
- A publicly available real-world GMAW welding dataset for quality assessment
- Human segmentation and human knowledge labeling of the welding images in the dataset, including some of the most common errors.
- Evaluation of automatic segmentation by traditional and deep neural network-based models
2. Related Works
- Safety: Defective welds can lead to severe structural failures in products or infrastructure, posing a significant risk to human safety. Detecting these defects early can prevent accidents and human loss.
- Efficiency: Inspecting welds manually is a process that can be slow, expensive, and prone to human error. Automatic systems can speed up inspection and allow more quality tests to be performed in less time, improving productivity and reducing manufacturing costs.
- Quality and Consistency: Weld quality can vary depending on factors such as welder technique, environmental conditions, and material quality. Automatic detection methods can provide a more accurate and consistent weld quality assessment compared to traditional visual inspections.
- Cost Reduction: Automatic detection can reduce costs associated with repairing defective welds and labor costs for inspection. It also improves traceability and quality management throughout the manufacturing process.
- Defect Complexity: Welds can have very complex defects that are not always visible to the naked eye, and their exact location can be challenging to determine. Detecting them using automatic technologies, such as ultrasound, X-ray, or computer vision, requires advanced approaches to ensure that potential flaws are not overlooked.
3. Materials and Methods
3.1. Dataset of Images
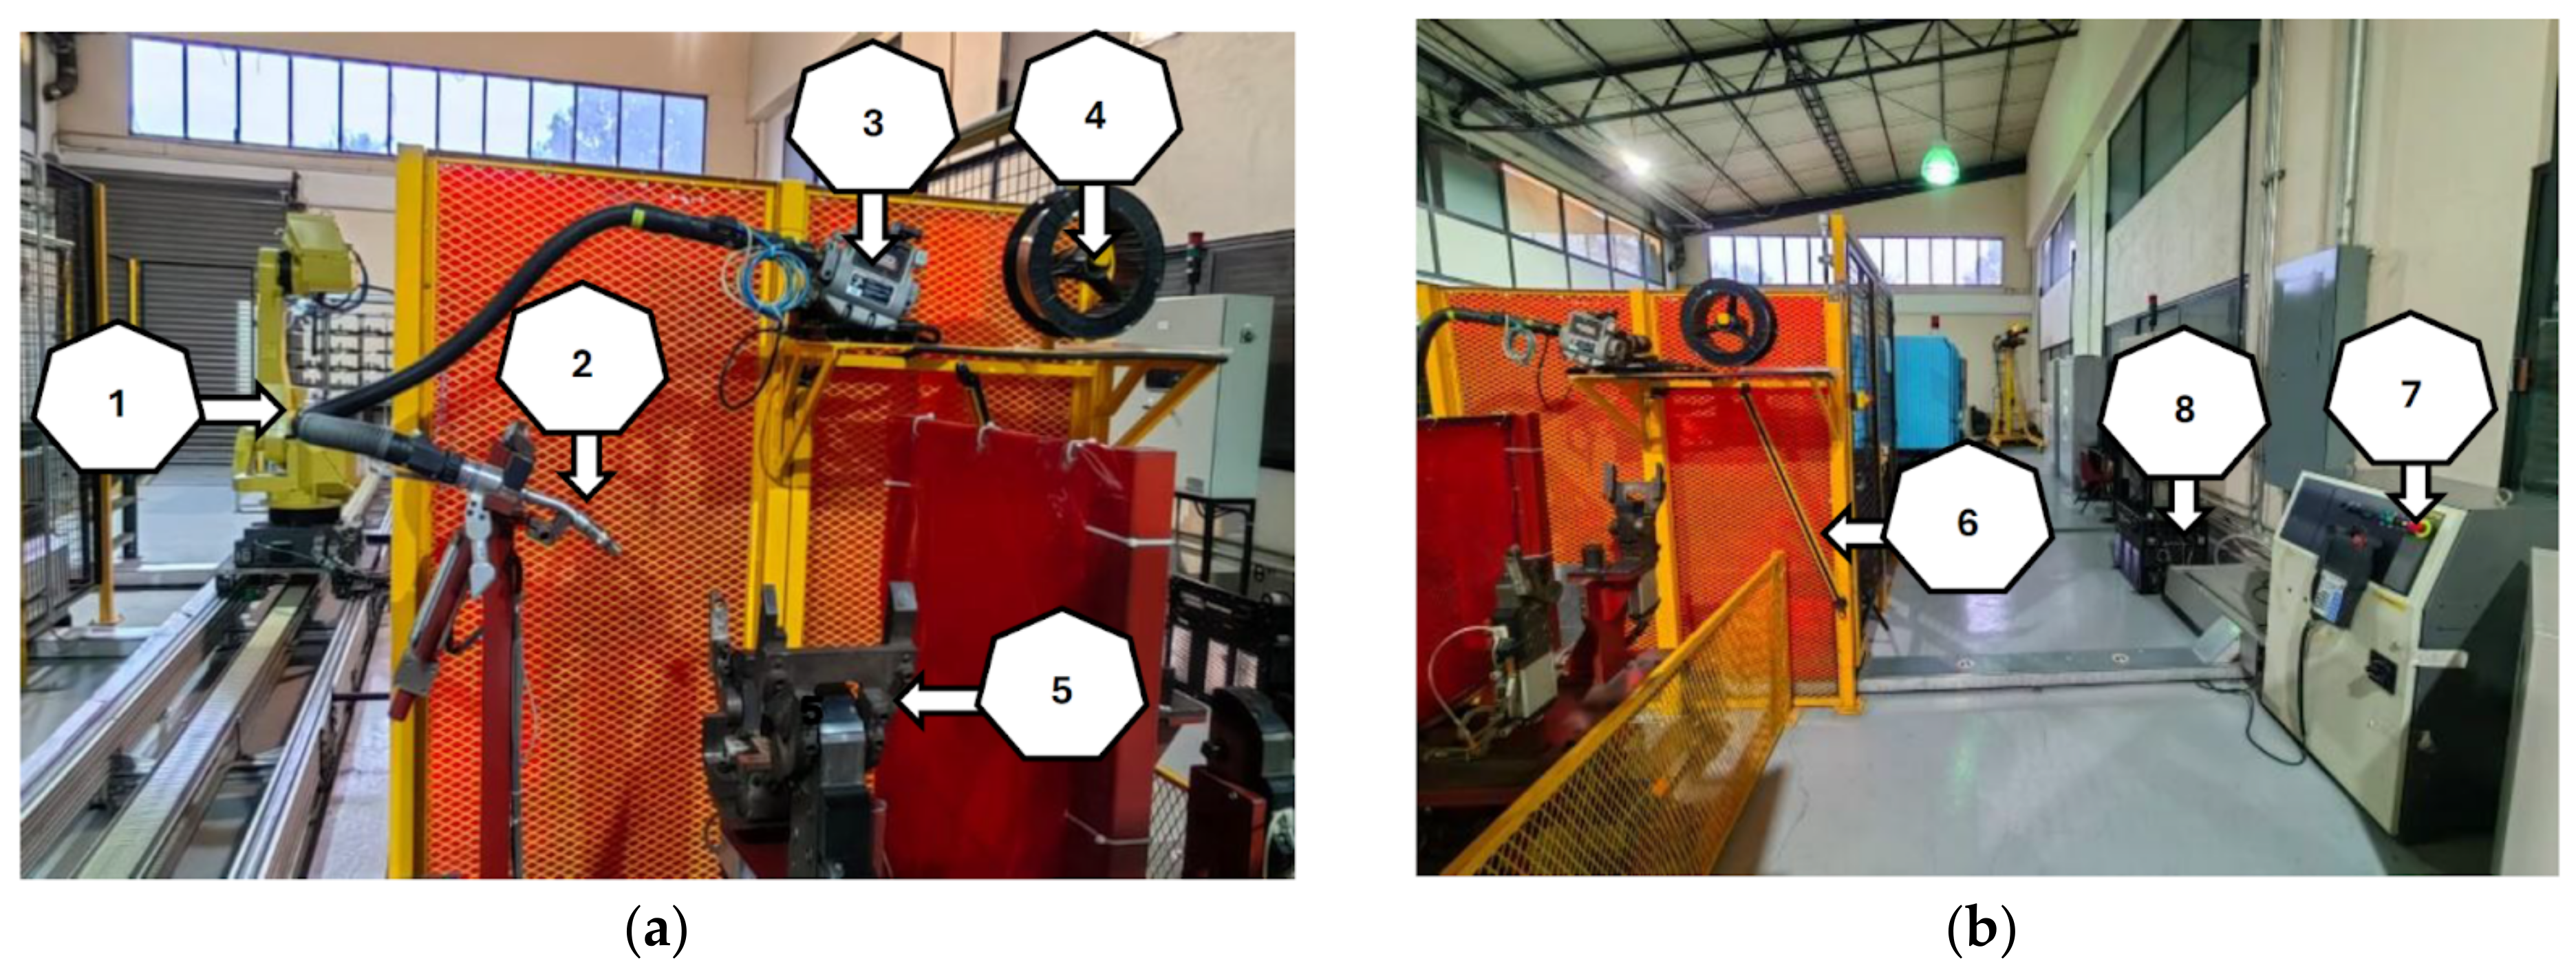
3.2. Hardware and Software Used
- Fanuc Robot M710iC/50.
- Lincoln Electric Welding Gun
- Wire feeder, AutoDrive 4R90 Lincoln Electric
- Weld Wire.
- Clamps
- Security device
- Fanuc Robot Controller, R30iA
- Power control, Power Wave i400 Lincoln Electric.
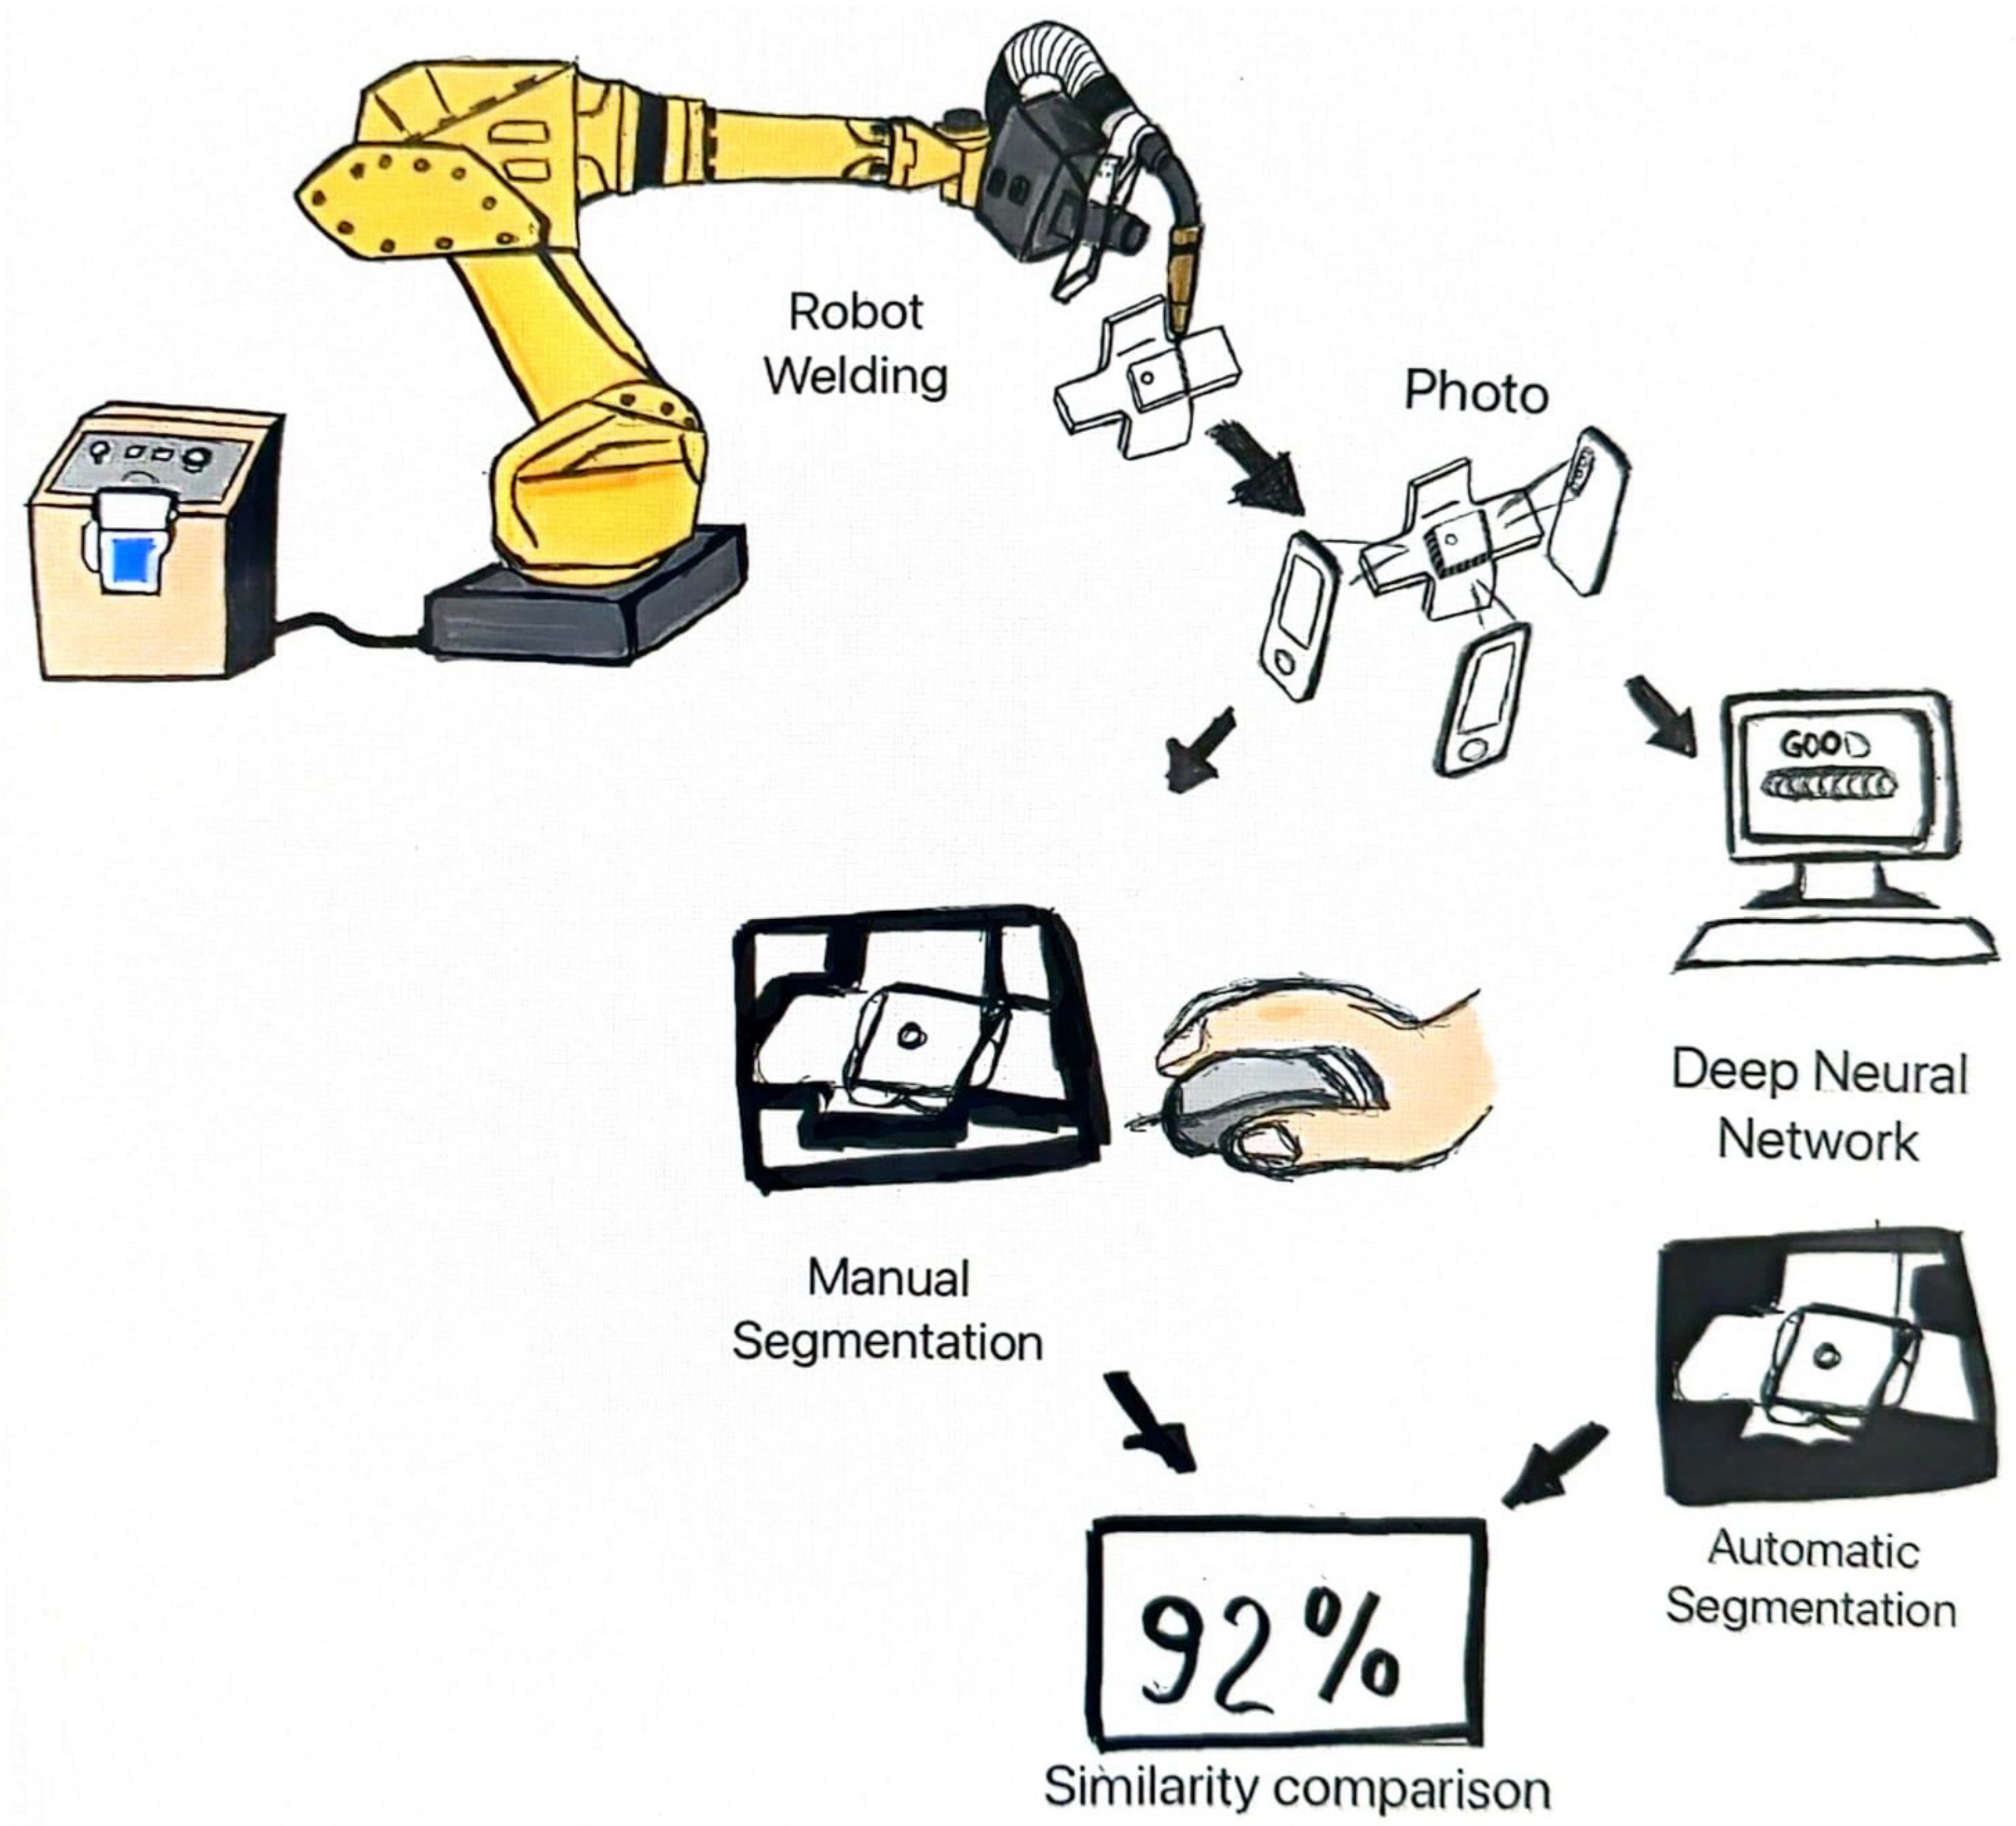
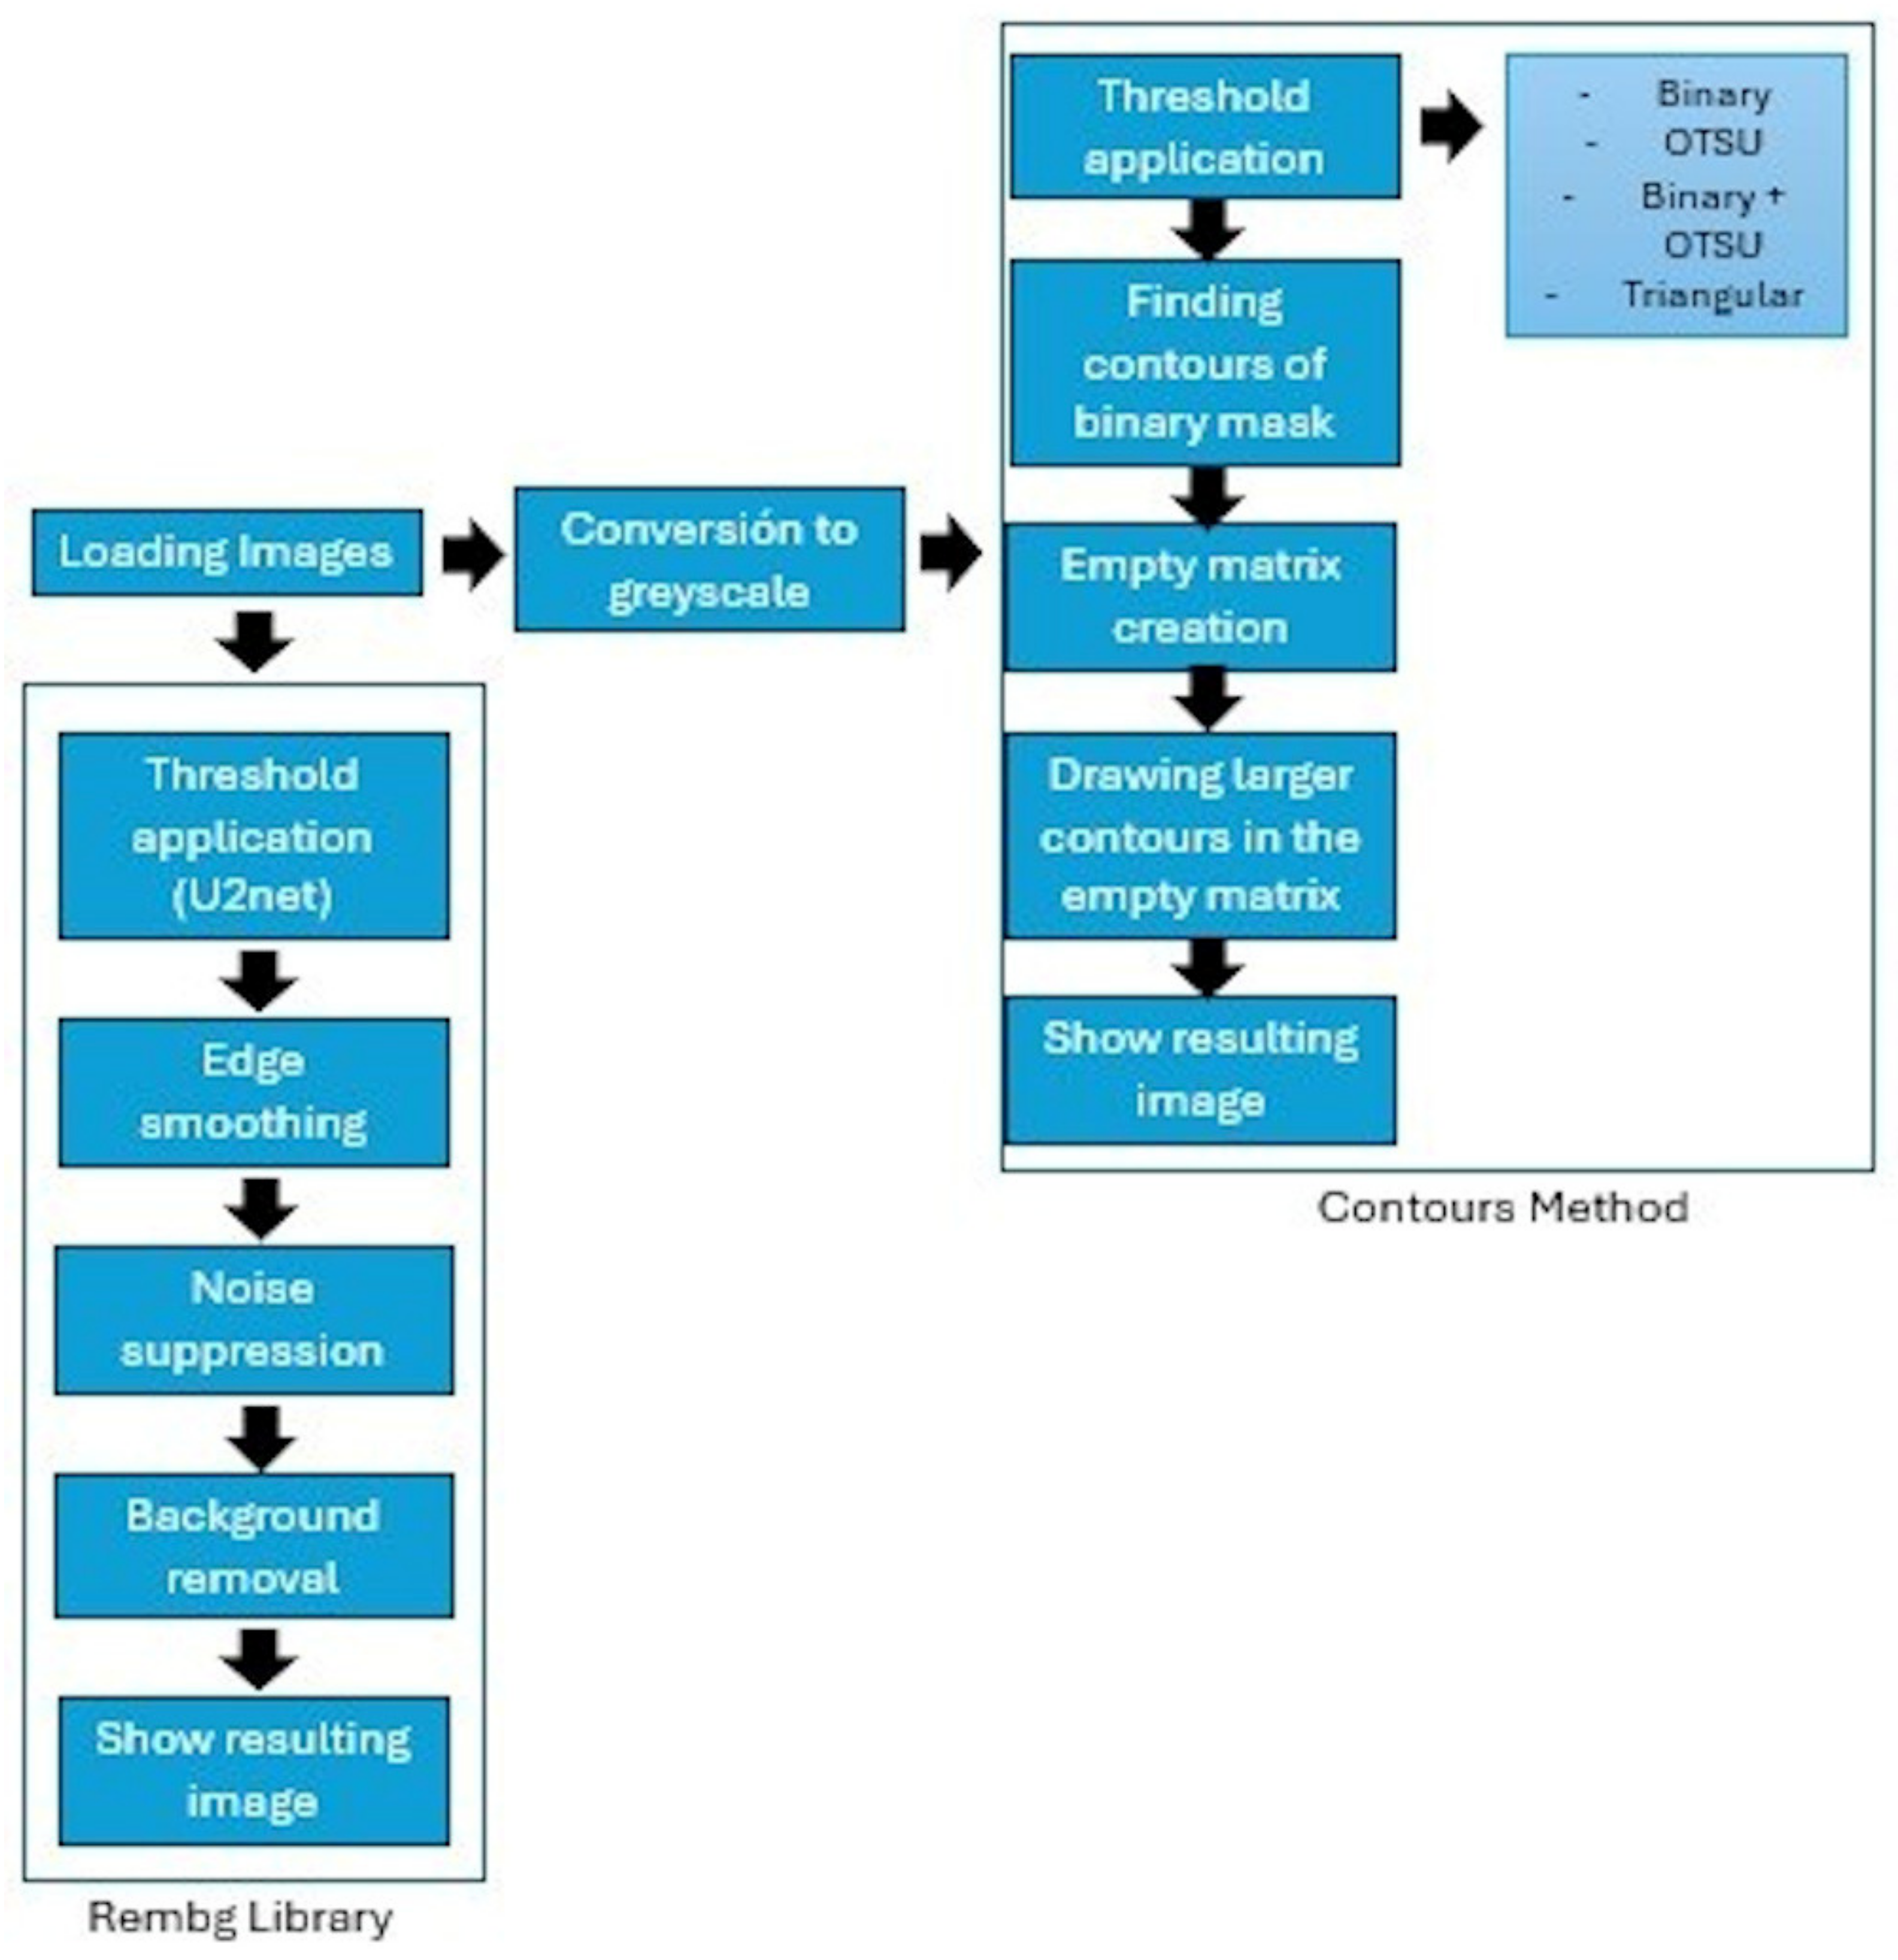
3.3. Automatic Segmentation Methodology
4. Results and Discussion
4.1. Comparison with Manual Segmentation
4.2. Assessment of Segmentation Methods
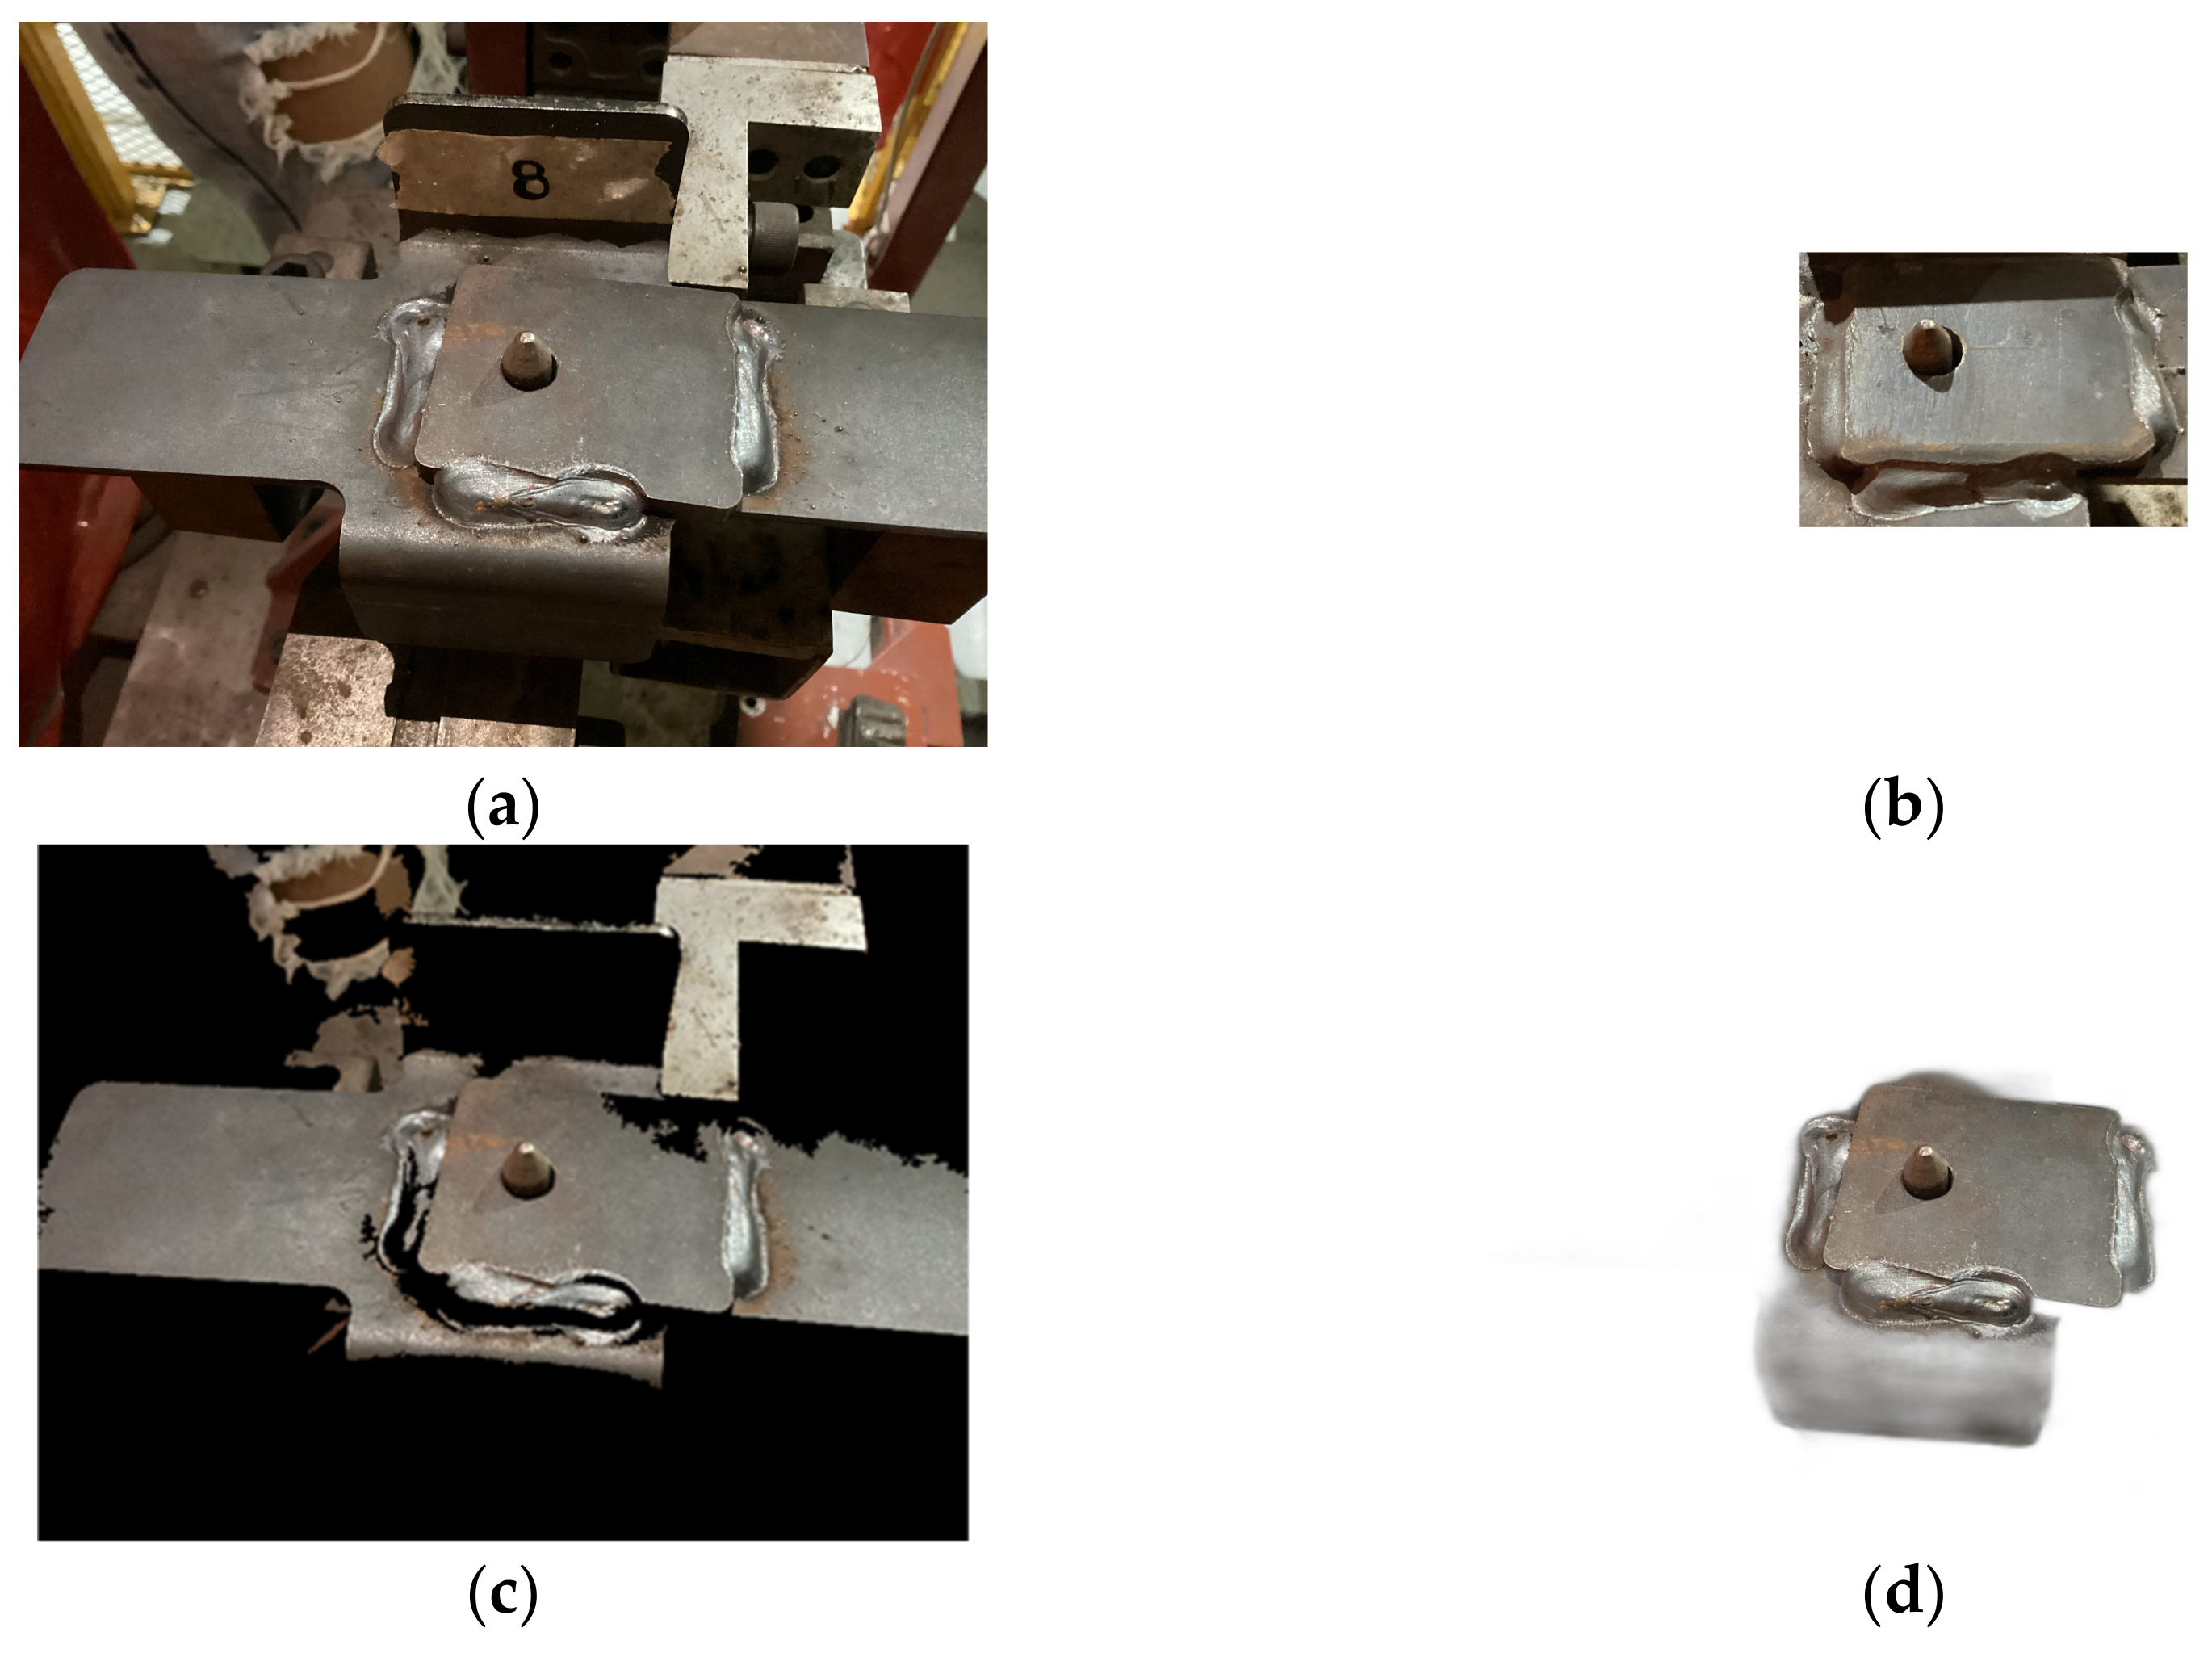
4.2.1. Visual Comparison
4.2.2. Quantitative Comparison
5. Conclusions
Author Contributions
Funding
Institutional Review Board Statement
Informed Consent Statement
Data Availability Statement
Acknowledgments
Conflicts of Interest
References
- Moinuddin, S.Q.; Saheb, S.H.; Dewangan, A.K.; Cheepu, M.M.; Balamurugan, S. Automation in the Welding Industry: Incorporating Artificial Intelligence, Machine Learning and Other Technologies; John Wiley & Sons: Hoboken, NJ, USA, 2024. [Google Scholar]
- Diaz-Cano, I.; Morgado-Estevez, A.; Rodríguez Corral, J.M.; Medina-Coello, P.; Salvador-Dominguez, B.; Alvarez-Alcon, M. Automated fillet weld inspection based on deep learning from 2D images. Appl. Sci. 2025, 15, 899. [Google Scholar] [CrossRef]
- Li, H.; Ma, Y.; Duan, M.; Wang, X.; Che, T. Defects detection of GMAW process based on convolutional neural network algorithm. Sci. Rep. 2023, 13, 21219. [Google Scholar] [CrossRef] [PubMed]
- Pico, L.E.A.; Marroquín, O.J.A.; Lozano, P.A.D. Application of Deep Learning for the Identification of Surface Defects Used in Manufacturing Quality Control and Industrial Production: A Literature Review. Ingeniería 2023, 28, 1–20. [Google Scholar]
- Reddy, J.; Dutta, A.; Mukherjee, A.; Pal, S.K. A low-cost vision-based weld-line detection and measurement technique for robotic welding. Int. J. Comput. Integr. Manuf. 2024, 37, 1538–1558. [Google Scholar] [CrossRef]
- Kim, D.-Y.; Lee, H.W.; Yu, J.; Park, J.-K. Application of Convolutional Neural Networks for Classifying Penetration Conditions in GMAW Processes Using STFT of Welding Data. Appl. Sci. 2024, 14, 4883. [Google Scholar] [CrossRef]
- Kralj, V. Biocybernetic Investigations of Hand Movements of Human Operator in Hand Welding; International Institute of Welding: Genoa, Italy, 1968. [Google Scholar]
- Kim, D.-Y.; Yu, J. Evaluation of Continuous GMA Welding Characteristics Based on the Copper-Plating Method of Solid Wire Surfaces. Metals 2024, 14, 1300. [Google Scholar] [CrossRef]
- Tomizuka, M.; Dornfeld, D.; Purcell, M. Application of microcomputers to automatic weld quality control. J. Dyn. Syst. Meas. Control 1980, 102, 62–68. [Google Scholar] [CrossRef]
- Penttilä, S.; Kah, P.; Ratava, J.; Eskelinen, H. Artificial neural network controlled GMAW system: Penetration and quality assurance in a multi-pass butt weld application. Int. J. Adv. Manuf. Technol. 2019, 105, 3369–3385. [Google Scholar] [CrossRef]
- Penttilä, S.; Lund, H.; Skriko, T. Possibilities of artificial intelligence-enabled feedback control system in robotized gas metal arc welding. J. Manuf. Mater. Process. 2023, 7, 102. [Google Scholar] [CrossRef]
- Reisgen, U.; Mann, S.; Oster, L.; Gött, G.; Sharma, R.; Uhrlandt, D. Study on identifying GMAW process deviations by means of optical and electrical process data using ANN. In Proceedings of the IEEE 16th International Conference on Automation Science and Engineering (CASE), Hong Kong, China, 20–21 August 2020; pp. 1596–1601. [Google Scholar]
- Njock Bayock, F.; Nlend, R.; Mbou Tiaya, E.; Appiah Kesse, M.; Kamdem, B.; Kah, P. Development of an Artificial Intelligence-Based Algorithm for Predicting the Mechanical Properties of Weld Joints of Dissimilar S700MC-S960QC Steel Structures. Civ. Eng. Infrastruct. J. 2025, in press. [Google Scholar] [CrossRef]
- Nomura, K.; Fukushima, K.; Matsumura, T.; Asai, S. Burn-through prediction and weld depth estimation by deep learning model monitoring the molten pool in gas metal arc welding with gap fluctuation. J. Manuf. Process. 2021, 61, 590–600. [Google Scholar] [CrossRef]
- Yu, R.; Kershaw, J.; Wang, P.; Zhang, Y. Real-time recognition of arc weld pool using image segmentation network. J. Manuf. Process. 2021, 72, 159–167. [Google Scholar] [CrossRef]
- Enriquez, M.L.; Concepcion, R.; Relano, R.-J.; Francisco, K.; Mayol, A.P.; Española, J.; Vicerra, R.R.; Bandala, A.; Co, H.; Dadios, E. Prediction of Weld Current Using Deep Transfer Image Networks Based on Weld Signatures for Quality Control. In Proceedings of the 2021 IEEE 13th International Conference on Humanoid, Nanotechnology, Information Technology, Communication and Control, Environment, and Management (HNICEM), Manila, Philippines, 28–30 November 2021; pp. 1–6. [Google Scholar]
- Redmon, J.; Farhadi, A. Yolov3: An incremental improvement. arXiv 2018, arXiv:1804.02767. [Google Scholar]
- Huang, G.; Liu, Z.; Pleiss, G.; Van Der Maaten, L.; Weinberger, K.Q. Convolutional networks with dense connectivity. IEEE Trans. Pattern Anal. Mach. Intell. 2019, 44, 8704–8716. [Google Scholar] [CrossRef]
- Tan, M.; Le, Q. Efficientnet: Rethinking model scaling for convolutional neural networks. In Proceedings of the International Conference on Machine Learning, Long Beach, CA, USA, 9–15 June 2019; pp. 6105–6114. [Google Scholar]
- Szegedy, C.; Liu, W.; Jia, Y.; Sermanet, P.; Reed, S.; Anguelov, D.; Erhan, D.; Vanhoucke, V.; Rabinovich, A. Going deeper with convolutions. In Proceedings of the IEEE Conference on Computer Vision and Pattern Recognition, Boston, MA, USA, 7–12 June 2015; pp. 1–9. [Google Scholar]
- Sandler, M.; Howard, A.; Zhu, M.; Zhmoginov, A.; Chen, L.-C. Mobilenetv2: Inverted residuals and linear bottlenecks. In Proceedings of the IEEE Conference on Computer Vision and Pattern Recognition, Salt Lake City, UT, USA, 18–23 June 2018; pp. 4510–4520. [Google Scholar]
- Zoph, B.; Vasudevan, V.; Shlens, J.; Le, Q.V. Learning transferable architectures for scalable image recognition. In Proceedings of the IEEE Conference on Computer Vision and Pattern Recognition, Salt Lake City, UT, USA, 18–23 June 2018; pp. 8697–8710. [Google Scholar]
- He, K.; Zhang, X.; Ren, S.; Sun, J. Deep residual learning for image recognition. In Proceedings of the IEEE Conference on Computer Vision and Pattern Recognition, Las Vegas, NV, USA, 27–30 June 2016; pp. 770–778. [Google Scholar]
- Chollet, F. Xception: Deep learning with depthwise separable convolutions. In Proceedings of the IEEE Conference on Computer Vision and Pattern Recognition, Honolulu, HI, USA, 21–26 July 2017; pp. 1251–1258. [Google Scholar]
- Yang, J.; Zou, Y. Enhanced automatic weld seam tracking: Bayesian optimization and information-based pruning of compact denoising and object detection models. Expert Syst. Appl. 2025, 266, 126132. [Google Scholar] [CrossRef]
- Jocher, G. Ultralytics YOLOv5, Version 7.0. 2020. Available online: https://docs.ultralytics.com/models/yolov5/#citations-and-acknowledgements (accessed on 19 February 2025).
- Li, T.; Cao, Y.; Ye, Q.; Zhang, Y. Generative adversarial networks (GAN) model for dynamically adjusted weld pool image toward human-based model predictive control (MPC). J. Manuf. Process. 2025, 141, 210–221. [Google Scholar] [CrossRef]
- Wu, C.; Polte, T.; Rehfeldt, D. A fuzzy logic system for process monitoring and quality evaluation in GMAW. Weld. J. 2001, 80, 33. [Google Scholar]
- Cavazos Hernández, E.A.; Chiñas Sánchez, P.; Navarro González, J.L.; López Juárez, I. Geometries and quality assesment of weld beads in 5052-H32 aluminum alloys joined by semiautomated GMAW through a double fuzzy system. Int. J. Adv. Manuf. Technol. 2023, 129, 2011–2030. [Google Scholar] [CrossRef]
- Wordofa, T.N.; Perumalla, J.R.; Sharma, A. An artificial intelligence system for quality level–based prediction of welding parameters for robotic gas metal arc welding. Int. J. Adv. Manuf. Technol. 2024, 132, 3193–3212. [Google Scholar] [CrossRef]
- Chen, T.; Xue, S.; Wang, B.; Zhai, P.; Long, W. Study on short-circuiting GMAW pool behavior and microstructure of the weld with different waveform control methods. Metals 2019, 9, 1326. [Google Scholar] [CrossRef]
- Wang, H.; Klaric, S.; Havrlišan, S. Preliminary Study of Bead-On-Plate Welding Bead Geometry for 316L Stainless Steel Using GMAW. FME Trans. 2024, 52, 563–572. [Google Scholar] [CrossRef]
- Ayoade, A.; Steele, J. Heterogeneous Measurement System for Data Mining Robotic GMAW Weld Quality. Weld. J. 2022, 101, 96–110. [Google Scholar] [CrossRef]
- Cullen, M.; Ji, J. Online defect detection and penetration estimation system for gas metal arc welding. Int. J. Adv. Manuf. Technol. 2025, 136, 2143–2164. [Google Scholar] [CrossRef]
- Jolly, W. Acoustic emission exposes cracks during welding (Acoustic emission from welds in stainless steel plates used for detecting defects in single and multiple pass machine welds). Weld. J. 1969, 48, 21–27. [Google Scholar]
- Biber, A.; Sharma, R.; Reisgen, U. Robotic welding system for adaptive process control in gas metal arc welding. Weld. World 2024, 68, 2311–2320. [Google Scholar] [CrossRef]
- Kim, G.-G.; Kim, Y.-M.; Kim, D.-Y.; Park, J.-K.; Park, J.; Yu, J. Vision-Based Online Molten Pool Image Acquisition and Assessment for Quality Monitoring in Gas-Metal Arc Welding. Appl. Sci. 2024, 14, 5998. [Google Scholar] [CrossRef]
- Mobaraki, M.; Ahani, S.; Gonzalez, R.; Yi, K.M.; Van Heusden, K.; Dumont, G.A. Vision-based seam tracking for GMAW fillet welding based on keypoint detection deep learning model. J. Manuf. Process. 2024, 117, 315–328. [Google Scholar] [CrossRef]
- Bakurov, I.; Buzzelli, M.; Schettini, R.; Castelli, M.; Vanneschi, L. Structural similarity index (SSIM) revisited: A data-driven approach. Expert Syst. Appl. 2022, 189, 116087. [Google Scholar] [CrossRef]


| C | Mn | P | S | Cu | Ni | Cr | Mo | V | Cb | |
|---|---|---|---|---|---|---|---|---|---|---|
| CS Type A | 0.100 | 0.600 | 0.030 | 0.035 | 0.200 | 0.200 | 0.150 | 0.060 | 0.008 | 0.008 |
| Yield Strength ksi | Elongation in 2 in [50 mm]% | |
|---|---|---|
| CS Type A | 30 to 50 | ≥25 |
| Parameter | Value |
|---|---|
| Wire feed | 145.000 |
| Trim | 1.050 |
| Voltage | 29.000 |
| Travel speed | 36.000 |
| Pulse | 0.045 |
| Air mix | Ar + CO2 |
| Feedback Current | 199.400 |
| Category | Example of Weld Seam | Criteria |
|---|---|---|
| Good | 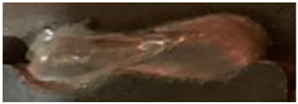 | Homogeneous welding, without any porosity or black shadow that warns of a perforation or splash when welding |
| Robot | 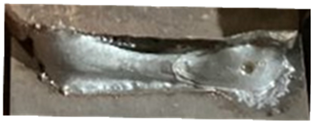 | The weld appears homogeneous but shows spatter in small spheres around the weld bead. Part of the side of the unwelded piece can be seen, so the robot can pass through it again, correcting the path. |
| Human |  | The weld bead is not homogeneous. It can be thin in some parts, bulge in the middle, and have a lot of spatter. However, the color is clear, meaning it was not overheated. Therefore, the weld can be removed by a person with a chisel and hammer so that the weld bead can be made again. |
| Scrap | 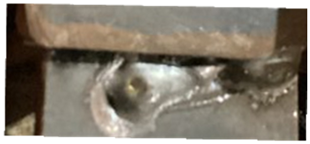 | Round shadows appear on the weld bead, so there is a risk of overheating and possible perforation of the part, which would not support a second application of welding. |
| Segmentation Method | Thresholding | ROI |
|---|---|---|
| Binary Segmentation |  | 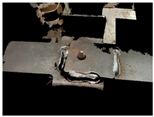 |
| Binary Segmentation + OTSU Method |  | 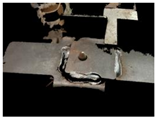 |
| OTSU Method | 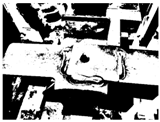 |  |
| Triangular segmentation | 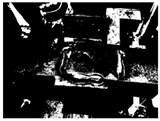 |  |
| Rembg | - | 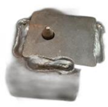 |
| Category | Binary + Contours | Rembg |
|---|---|---|
| Good | 24.86% | 85.89% |
| Human | 26.03% | 85.77% |
| Robot | 25.23% | 85.59% |
| Scrap | 24.08% | 87.71% |
Disclaimer/Publisher’s Note: The statements, opinions and data contained in all publications are solely those of the individual author(s) and contributor(s) and not of MDPI and/or the editor(s). MDPI and/or the editor(s) disclaim responsibility for any injury to people or property resulting from any ideas, methods, instructions or products referred to in the content. |
© 2025 by the authors. Licensee MDPI, Basel, Switzerland. This article is an open access article distributed under the terms and conditions of the Creative Commons Attribution (CC BY) license (https://creativecommons.org/licenses/by/4.0/).
Share and Cite
Davila-Iniesta, E.M.; López-Islas, J.A.; Villuendas-Rey, Y.; Camacho-Nieto, O. Automatic Segmentation of Gas Metal Arc Welding for Cleaner Productions. Appl. Sci. 2025, 15, 3280. https://doi.org/10.3390/app15063280
Davila-Iniesta EM, López-Islas JA, Villuendas-Rey Y, Camacho-Nieto O. Automatic Segmentation of Gas Metal Arc Welding for Cleaner Productions. Applied Sciences. 2025; 15(6):3280. https://doi.org/10.3390/app15063280
Chicago/Turabian StyleDavila-Iniesta, Erwin M., José A. López-Islas, Yenny Villuendas-Rey, and Oscar Camacho-Nieto. 2025. "Automatic Segmentation of Gas Metal Arc Welding for Cleaner Productions" Applied Sciences 15, no. 6: 3280. https://doi.org/10.3390/app15063280
APA StyleDavila-Iniesta, E. M., López-Islas, J. A., Villuendas-Rey, Y., & Camacho-Nieto, O. (2025). Automatic Segmentation of Gas Metal Arc Welding for Cleaner Productions. Applied Sciences, 15(6), 3280. https://doi.org/10.3390/app15063280