Abstract
Unconformity stratigraphic traps are widely developed in the Mahu Sag, on the northwestern margin of the Junggar Basin. It is of great significance for subsequent oil and gas exploration to explore the role of conglomerate accumulation mode and unconformity inner structure in the formation of oil and gas reservoirs. Therefore, this study uses oil and gas geophysical technology combined with geological theory to identify the P/T unconformity structure in the study area, determine the development characteristics and accumulation control of the unconformity structure, and explore the accumulation mode of stratigraphic oil and gas reservoirs. The results show the following: (1) Based on the different logging response characteristics of the upper, middle, and lower layers of the unconformity structure, five types of unconformity structure are divided according to different lithologic combinations. (2) Through experimental and numerical simulation analysis, it was verified that fracture pressure and thickness are important indicators for evaluating the sealing property of unconformity structure. P/T unconformity structure provides good floor conditions for the Baikouquan Formation reservoir, further confirming its key role in the process of oil and gas accumulation and storage. (3) Based on the analysis of actual cases, the accumulation model of stratigraphic oil and gas reservoirs under the control of unconformity structure is summarized as cross-layer accumulation above the source, fault communication source reservoir, unconformity lateral transmission and distribution, and mudstone lateral docking. The research results provide technical support and important reference values for the exploration and development of unconformity-related oil and gas reservoirs in the Junggar Basin.
1. Introduction
Unconformity is closely associated with hydrocarbon accumulation, as hydrocarbon migration and accumulation are significantly influenced by the unconformity structure [1,2,3,4,5]. Zhang Keyin [6] was the first to classify the spatial structure of unconformity, proposing that it consists of three layers: the residual layer, the seepage layer, and the subsurface flow layer. Wu Kongyou [7], in his study of the Junggar Basin, proposed that the unconformity structure in the region is divided, from top to bottom, into unconformity surface rock, weathered clay layer, and semi-weathered rock. Wang Yanzhong [8] summarized three types of unconformity structures based on the different control effects of the upper, middle, and lower layers on oil and gas migration: dual migration channels (both the upper and lower layers allow oil and gas migration, with the middle layer sealing oil and gas), single migration channels (only the upper or lower layer transports oil and gas, with the middle layer and the other layer sealing oil and gas), and sealing type (the three-layer structure collectively acts to seal oil and gas). As research on unconformity structures has deepened, the weathered clay layer has gradually garnered more attention from scholars. Zou Caineng [9] argued that weathered clay rock provides better capping conditions than typical mudstone, particularly in terms of recognizing and controlling reservoirs within the weathered crust. Tang Yong [10] emphasized that, in addition to the spatial structure, lithologic configuration also plays a key role in reservoir formation. The contact relationship between the upper mudstone and lower sandstone favors the formation of stratigraphic unconformity trap reservoirs, while the contact between the upper sandstone and the lower mudstone promotes the formation of overlap unconformity trap reservoirs. If the middle layer of the structure offers favorable caprock conditions for the underlying reservoirs and provides advantageous lateral shielding along the slope, stratigraphic trap reservoirs can be formed. In other countries, Adewunmi O. Adelu et al. used logging data and three-dimensional seismic data to characterize reservoirs in unconformity structures and combined attribute analysis with system structure and rock physics interpretation to generate 3D structures and rock physics models in order to reduce uncertainty. S. M. Talha Qadri et al., focusing on the clay composition in the rock layer, reduced the influence of the clay layer on the drilling by optimizing the drilling fluid method [11,12,13,14]. This shows that the study of unconformable structures and weathered clay layers has been paid more and more attention to by geologists.
Therefore, the sealing property of the weathered clay layer in unconformity structures has become a key factor in oil and gas accumulation. This sealing property is typically analyzed from both macro and micro perspectives. On the macro level, a greater thickness indicates a more stable structure, which is less likely to be disrupted by small faults. Large faults are more likely to create lateral sealing, blocking the vertical migration of oil and gas. On the micro level, the petrophysics of the caprock primarily depends on factors such as porosity, permeability, specific surface area, and breakthrough pressure [15]. The maximum pressure on the rock is the most direct indicator of its sealing ability. However, current methods for identifying unconformity structures, such as the use of logging curves combined with seismic reflection phase identification [16], fuzzy comprehensive evaluation methods [17], and convolutional neural network-based identification models [18], tend to focus on a limited set of parameters. As a result, the research still primarily centers on the reservoirs above and below the unconformity surface. There are few studies on weathered clay layers, which cannot explain how oil and gas enter the reservoir and are completely preserved and do not understand the accumulation mode of unconformity reservoirs, resulting in omissions in predicting the location of oil and gas.
A significant number of unconformities are developed in the Permian, Triassic, and Carboniferous strata of the Junggar Basin. Among these, numerous oil and gas reservoirs beneath unconformity structures have been confirmed in the central part of the basin. Han Bao [19] identified eight types of reservoir control for glutenite reservoirs on the upper and lower surfaces of unconformities. With ongoing exploration and development, many geological experts have suggested shifting the focus of exploration from fault zones to slope areas. Due to the insufficient characterization of the internal structure of unconformities and the unclear relationship between unconformities and the reservoir and caprock of oil and gas reservoirs, a misconception has arisen that “gravel in the depression zone is difficult to form a reservoir”. However, this is not the case, as the oil and gas reserves in the Mahu Depression are extremely abundant. Therefore, this study focuses on the Baikouquan Formation oil and gas reservoirs in the slope area of the Mahu Depression, located on the northwestern margin of the Junggar Basin. By utilizing relevant geological data, combining previous research findings, and using well logging response characteristics to distinguish the upper, middle, and lower structural layers of the unconformity, this study identifies the layers involved. Through fracture pressure experiments, the actual bearing capacity of the weathered clay layer core is determined. Using large-scale formation pressure calculations in the study area with the relevant formulas, the roof and floor of the single-well reservoir are identified based on the differences in formation pressure. This allows for the construction of the reservoir well profile, the analysis of the integrity of the oil and gas trap, and the evaluation of the sealing properties of the unconformity structure. This study also summarizes the control effect of the unconformity structure on oil and gas migration and accumulation, providing crucial technical support for the exploration of unconformity-related reservoirs in the Mahu Sag.
2. Geological Overview
The Mahu Depression is located in the northwest margin of the Junggar Basin. During the late Early Permian to Middle-Late Permian, under the influence of compressional thrusting from the peripheral fold mountain ranges towards the Junggar Basin, deep-seated fault depressions began to uplift, primarily distributed in the Mahu Depression and West Sag of Well Pen 1. From the Late Permian to Middle Triassic, the Junggar Basin began to enter a composite foreland basin tectonic development stage, characterized by reverse thrusting from the surrounding mountain ranges into the basin. This resulted in low-amplitude flexural subsidence of the lithosphere at the basin’s foreland. Additionally, due to the control and influence of the basin’s internal basement structure, multiple subsidence centers developed simultaneously within the basin. However, due to the dynamic source coming from the southwest, the southern side of the Junggar Basin experienced strong compressional reverse thrusting, while the northeastern, northwestern, and western sides passively responded with weak compressional reverse thrusting. This was reflected in the basin’s subsidence pattern, where a deeper basin formed on the southern side, while shallower basins developed on the northwestern and northeastern sides [10]. Therefore, several large unconformities developed in the study area, including a regional unconformity between the Carboniferous and Permian systems (C/P), a large unconformity between the Upper Permian and Middle Permian series (P2/P3), a large unconformity between the Triassic and Permian systems (P/T), and a large unconformity between Jurassic and Cretaceous (J/K) [20]. The Ma 131 well area is located between Manas Lake and Wuerhe District in the northwest margin of the Junggar Basin, being tectonically located at the junction of the Mahu Depression in the central depression of the Junggar Basin and the Wuxia fault zone in the western uplift, with a low-amplitude anticlinal or nasal structural belt. The strata in this area are well developed, including Permian, Triassic, Jurassic, and Cretaceous formations from bottom to top, and all strata are regional unconformity (Figure 1). There is a large unconformity between the Baikouquan Formation of the Triassic and the Lower Wuerhe Formation of the Permian [21,22].
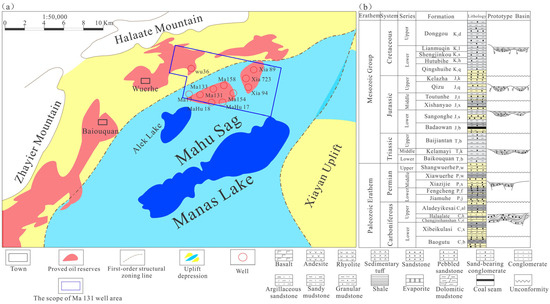
Figure 1.
The geographical location map of Mahu Sag and Ma131 well area (a) and the division map of tectonic units (b) in the Junggar Basin.
3. Method and Experiment
3.1. Material Selection
In order to measure the actual fracture pressure of the weathered clay layer, it is necessary to accurately divide the unconformity three-layer structure, find the location of the weathered clay layer, and collect the core. The unconformable structure is generally divided into rocks on the unconformable surface (upper layer: mainly bottom conglomerate or sandstone, which is formed by deposition after transportation from different places under the action of running water), weathered clay layer (middle layer: located in the upper part of the ancient weathering crust, the lower part of the rock after the formation of sedimentary uplift, the product of leaching deposition), and semi-weathered rock (lower layer: weathering leaching zone) (Figure 2a). According to the causes of unconformity, the unconformity structure has great differences in radioactivity, electricity, and elasticity. Compared with normal deposition, GR and SP logging curves should show an increasing trend because of the increase in clay composition and radioactivity. Because of fluid loss and weak conductivity, the R logging curve shows a decreasing trend; the leaching effect of the weathering crust reduces the elastic wave velocity of the rock, and the AC curve shows an increasing trend [7,10]. Therefore, the upper, middle, and lower layers of the unconformity structure show different logging response characteristics. The upper layer: the GR and SP logging curves exhibit an equal-amplitude cross type, the AC and DEN logging curves are of the zigzag box type, the R logging curves show a wide range of regular increases and decreases, CNL shows more regular increases and decreases; the middle layer: compared with the upper SP curve, the GR and AC curves increase markedly, the DEN logging curve decreases significantly, the R logging curve changes significantly and tends to stabilize, CNL increases and decreases slightly in the lower layer: the SP curve increases gradually, the GR curve changes significantly, the AC and DEN logging curves tend to coincide, the R logging curve increases and decreases in a zigzag shape, and CNL increases and decreases more than the middle layer (Figure 2b).
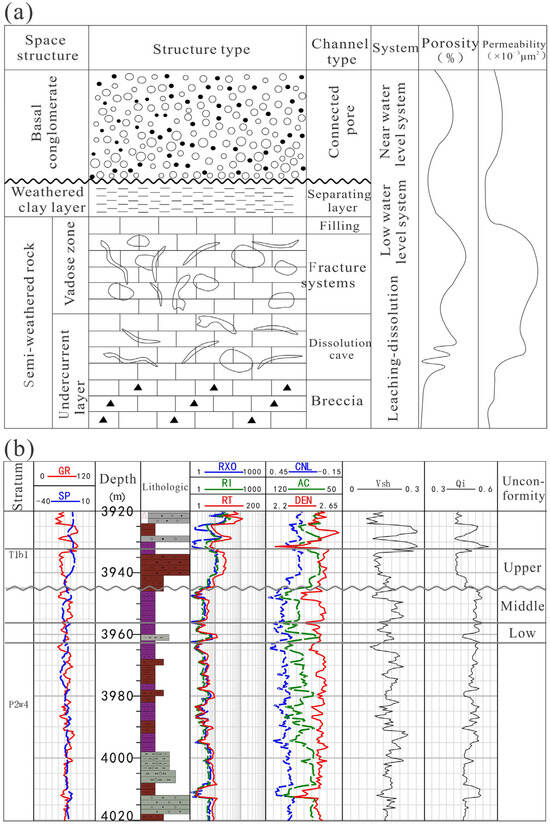
Figure 2.
Types of micromigration channels of unconformity structures (a) and logging response characteristics (b).
In order to accurately divide the three-layer structure of unconformity, five basic curves of , , , , and are selected based on the response characteristics of different logging curves. Due to the different dimensions of each curve, it is normalized to avoid too large numerical differences and affect the accuracy of the results. Using the Max–Min normalization method, the and curves increase in the weathered clay layer, with the minimum value of the curve selected as the reference. Conversely, the , , and curves decrease in the weathered clay layer, with the maximum value of the curve chosen as the reference, as shown in Equation (1).
In the formula, , , , , are the results after the normalization process of five curves of acoustic wave time difference, density, , resistivity, and natural gamma, respectively.
After the normalization of each curve is completed, considering multiple factors, in order to reduce the influence of individual differences, the five curve values are combined together. One value is used to represent the unconformity structure, and a new logging curve–unconformity structure identification factor is proposed. The principle is that different weights are given to the normalization results of each curve, multiplied by the corresponding values, and finally added together. The result is the unconformity identification factor , as shown in Equation (2):
In order to reduce the interference of human factors, the choice of weight is calculated using a formula. Firstly, the amplitude difference of the change rate of each parameter curve is calculated as shown in Equation (3):
In the formula, is the logging curve value (, , , , ), is the depth of a certain point, while and are the logging values of the depth points adjacent to in the curve.
Because the numerical range of each curve is different, the difference between the partial amplitude difference results is too large. The calculated change rate curve is normalized, and the processed result, , is obtained from Equation (4):
The results of the five curves are accumulated, and the proportion of each curve in the sum is the weight of the curve in the logging response characteristics. The higher the weight, the more obvious the logging curve changes in the process of unconformity from the upper layer to the middle layer and from the middle layer to the lower layer, as shown in Equation (5).
After calculation, the weight of each curve is obtained by averaging a in the whole well area: = 0.25, = 0.15, = 0.15, = 0.2, = 0.25. Therefore, the calculation formula of the unconformity structure identification factor in the study area is Equation (6):
3.2. Experimental Test and Calculation Method
3.2.1. Experimental Test
After collecting the core of the corresponding depth of the weathered clay layer, the actual fracture pressure is obtained using the experimental method. The 25 mm (D) × 100 mm (L) core was prepared according to the basic requirements of the experimental equipment and put into the fracturing dynamic and static pressure evaluation device (Figure 3). The collapse pump injection pressure was supplied by the fluid pump, simulating the injection effect of the field wellhead pump, and the intermediate container was used to simulate different fluids in the field. The experiment used water displacement. During the experiment, the overburden pressure of 55 MPa and the ambient temperature of 130 °C were simulated by the confining pressure valve and the heating box, and the back pressure valve was used to simulate the back pressure of the formation’s own fluid of 0.5 MPa. Finally, the liquid outflow from the experiment was collected through the outlet liquid collection bottle, and the injection pressure data were recorded.
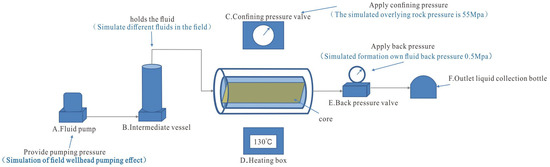
Figure 3.
Fracturing dynamic and static evaluation process.
3.2.2. Calculation Method
There are two main methods to calculate the fracture pressure [23,24,25,26,27,28,29]: direct and indirect. The direct method is mainly obtained through the above experiments. The data obtained by this method are accurate, but the method can only measure the pressure of a single depth, and cannot obtain the fracture pressure of the continuous caprock. The cost of the experiment is high, and the cost performance is low when applied to large thickness rock formations. The indirect method is based on empirical formula or mathematical modeling. This method can obtain the continuous fracture pressure curve, and the error is small compared to the experimental data, so it is widely used. At present, the main formulas used are the Eaton method, the Willis method, the Holbrook method, and the Huang Rongzun method [30]. In practical application, the Willis method is less effective for different regions. The Holbrook method is mainly aimed at sandstone strata, which are different from the lithology of the target layer. The Huang Rongzun method needs to consider the horizontal principal stress, the parameter requirements are too high, and the cost is too high. The Eaton method is suitable for continuous sedimentary basins with relatively new strata and less tectonic movement, which is in line with the actual situation of more stratigraphic and lithologic traps in Junggar. Therefore, this study selected the Eaton formula to calculate the fracture pressure [31], as shown in Equation (7):
In the formula, is fracture pressure, ; is Poisson’s ratio of strata, dimensionless; is the overburden pressure, ; is the formation pore pressure, ; is the normal pore pressure, ; is the acoustic time difference under normal compaction; is the Eaton index, using a value of 2.8 [32]; is the depth of the overlying strata, ; is the average density of the overlying sediment, ; is the acceleration of gravity, ; refers to p-wave velocities; refers to s-wave velocities, .
3.3. Numerical Simulation
By recording the change curve of rock cracks during the experiment, the numerical simulation method is used to predict the development limit of fracture length and fracture height in the underground large-thickness rock layer. The aim is to determine whether it will completely destroy the rock layer and affect the sealing effect of the weathered clay layer (Figure 4).
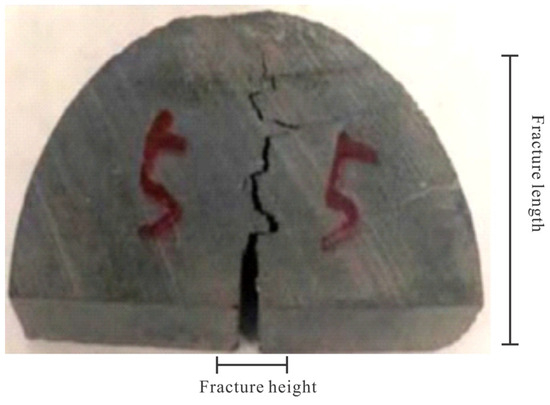
Figure 4.
Fracture length and fracture width judgment diagram.
4. Results
4.1. Development Characteristics of Unconformity Structure in the Mahu Sag
The above unconformity structure identification model (Equations (1)–(6)) is used to identify the unconformity inner structure of a single well in the Mahu Sag. Combined with the core data of the single well and the test results, the differences in thickness, lithology, and identification factor values of the upper, middle, and lower layers of a typical single-well unconformity structure are summarized (Figure 5). The thickness of the upper layer is relatively large, with an average distribution of 10~20 m. The lithology is mostly glutenite, with good physical properties, and the average value is 0.4~0.5. The thickness of the middle layer is usually less than 10 m, and the distribution is uneven. After weathering and erosion, the rock layer is mostly mudstone, with high shale content and the largest value, with an average of 0.6~0.7. The lower layer is affected by the upper weathered clay layer. When the thickness of the clay layer is large, the lower erosion degree is small, and the thickness is small. On the contrary, when the clay layer is small, the lower rock of the unconformity is greatly affected by leaching, resulting in a large number of cracks and holes. Sedimentation forms a thicker rock layer. The lithology is still dominated by glutenite, a few are volcanic rocks, but the shale content increases, the value is slightly larger than the upper layer, less than the lower layer, with an average of 0.5~0.6.
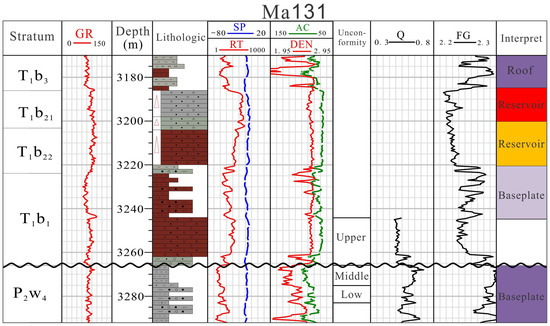
Figure 5.
Unconformity structure identification and sealing evaluation of a single well from the Ma 131 well area.
Based on the above identification results, the weathering crust types in the study area are divided into two categories according to the different lithologic combinations of the upper, middle, and lower layers: one category represents the sand–mud–sand type and sand–mud–mud type unconformable structures, in which the weathered clay layer is completely preserved during the development process (Figure 6A,B). In the sand–mud–sand type, oil and gas can be stored above and below the unconformity surface. In contrast, in the sand–mud–mud type, oil and gas can only be stored in the sandstone layer above the unconformity surface, and the middle mudstone mainly acts as the cap layer to seal oil and gas. The weathered clay bed unconformity is mainly distributed in the Xiazijie, Fengcheng, Aihu, Wuerhe, and Mabei oilfields. The other scenario involves the denudation of the weathered clay layer during the development process, resulting in direct contact between the upper and lower layers. These contacts can be roughly divided into sand–sandstone, sand–mudstone, and a few sand–volcanic rock types (Figure 6C–E). This type of unconformity can only play a role in transporting oil and gas, and whether it can be formed depends on the sealing ability of the upper mudstone. It is mainly distributed in the western upper layer of the Baikouquan and Karamay oilfields.
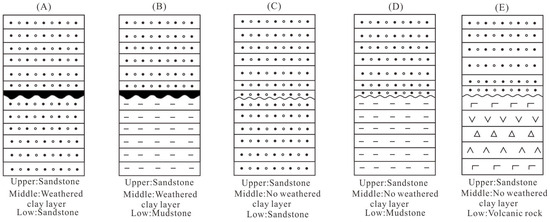
Figure 6.
Five types of unconformity structure maps of the Mahu Sag: (A) sand-mud-sand type; (B) sand-mud-mud type; (C) sand - sand type; (D) sand-mud type; (E) sand-volcanic type.
4.2. Unconformity Sealing Evaluation
4.2.1. Unconformity Closure Evaluation Parameters
According to the results of the unconformity identification, the weathered clay core of key wells in the Ma 131 well area was selected. Two of the samples were selected as examples: sample a is from the 4272.45 m depth mudstone of the Baikouquan Formation of Well Mahu 17 (Figure 7a), and sample b is from the 4666.53 m depth mudstone of the Baikouquan Formation of Well Mahu 18 (Figure 7b). The stress–strain curve was recorded by the above experiment.
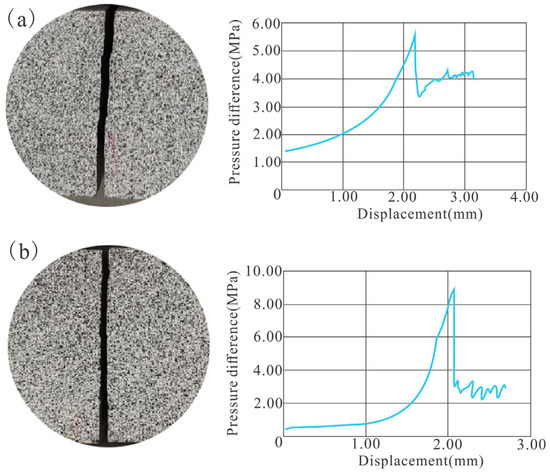
Figure 7.
Core experimental results and stress–strain curve. ((a) Mahu17 Well sample; (b) Mahu 18 Well sample).
From the stress–strain curve, it is evident that, due to the re-compaction of the rock’s micropores, the rock fractures initially undergo a closure and compaction stage. During this phase, the stress–strain curve exhibits a “concave” shape, after which it transitions into the elastic deformation phase, following Hooke’s law. In this phase, the slope of the stress–strain curve remains constant, without changing as the stress increases. Once the rock sample reaches its yield stress limit, it enters the plastic deformation stage. At this point, microcracks begin to develop within the rock, and the stress–strain curve deviates from linearity. The crack pressure differential reaches its maximum value during this phase. As the rock sample fractures completely, the number of microcracks increases and intersects with the original pores, forming macroscopic fractures, which results in a rapid decline in the rock’s load-bearing capacity. Despite the fractures, the rock retains some bearing capacity, and the final stress–strain curve stabilizes at a dynamic equilibrium “platform value” (Figure 7). The fracture pressure difference is the difference between the core pressure and the confining pressure (which simulates the pressure of underground fluid migration on the caprock). Based on the specific conditions of the rock samples in this experiment, the maximum fracture pressure difference for rock sample A is 5.55 MPa (Figure 7a), while for rock sample B, it is 8.96 MPa (Figure 7b). The cracks are cut longitudinally along the circular surface at one end of the columnar core, with relatively flat sections.
The development of fracture height and fracture length in rock was simulated under varying fracture pressure differences of 1 MPa, 3 MPa, 6 MPa, and 10 MPa. The goal was to infer the extent of internal fracture development in underground rock strata with significant thickness. The results revealed that both fracture length and height increased with the rise in fracture pressure difference. When the bedding surface strength was 1 MPa or 3 MPa, the hydraulic fracture propagation morphology remained essentially the same. However, when the strength was adjusted to a medium level, hydraulic fracturing extended through the bedding plane and eventually propagated into the overlying strata.
Based on the simulation curve, it was observed that with a bedding plane strength of 10 MPa, the fracture height eventually reached approximately 70 m (Figure 8a). If the thickness of the weathered clay layer is less than 70 m, the fracture will pass through the entire layer, allowing oil and gas to escape, which compromises the sealing effect. On the other hand, when the weathered clay layer exceeds 70 m in thickness, increasing the pressure further will not lead to additional height increase in the fracture, regardless of pressure conditions.
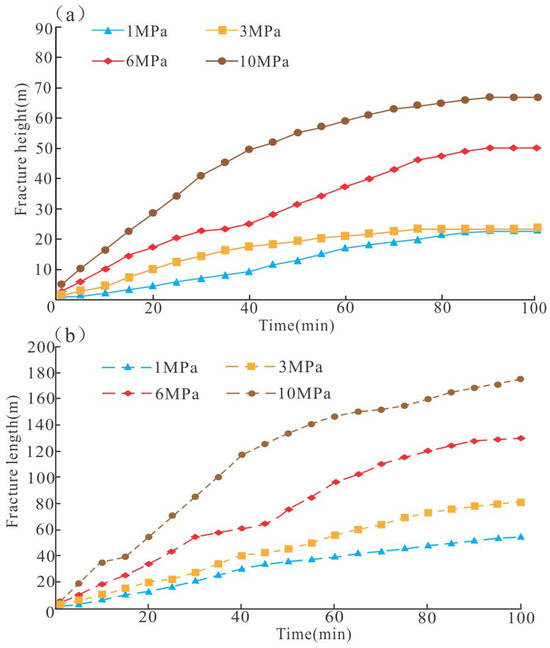
Figure 8.
The variation characteristics of (a) fracture height and (b) fracture length under different strengths are numerically simulated.
Thus, the maximum fracture height development is influenced by the fracture pressure difference. The greater the thickness of the weathered clay layer, the more effectively it inhibits crack extension. Consequently, the thickness of the weathered clay layer should be considered a critical factor in evaluating the sealing efficiency of caprock.
4.2.2. Unconformity Sealing Evaluation—Taking Ma 131 Well Area as an Example
According to the experimental results above, when evaluating the closure of the unconformity structure, the thickness of weathered clay layer is selected from a macro perspective, and the fracture pressure is selected as the main influencing parameter from a micro perspective. The formation fracture pressure is defined as the bottom hole fluid pressure when the formation produces hydraulic fractures or opens the original fractures. In addition to the application of fracture pressure in drilling design, it can also be used to calculate the sealing height of caprock and the ancient pressure coefficient around the target layer [24], so as to evaluate the stability of the weathered clay layer structure. The larger the fracture pressure is, the more it can suppress the development of fractures and the stronger the sealing ability of the weathered clay layer is.
The core of the measured fracture pressure in the study area and its corresponding porosity were sorted out, and it was found that the fracture pressure was negatively correlated with the porosity and permeability (Figure 9). The larger the fracture pressure is, the smaller the porosity and permeability are; therefore, the oil and gas could not pass through the interval, which indirectly proved that the fracture pressure could be used as a parameter to judge the unconformity sealing.
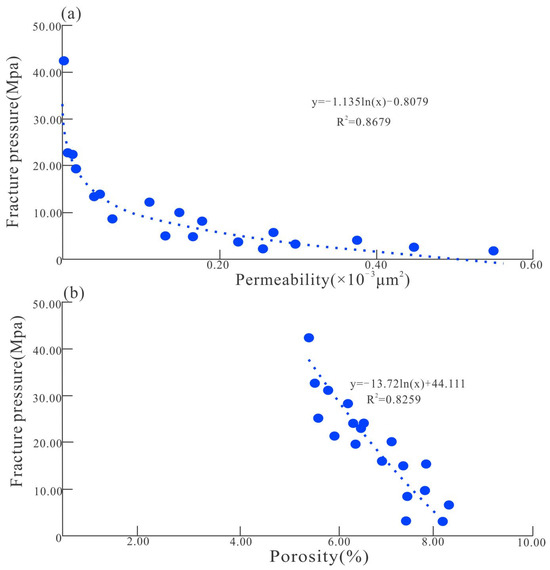
Figure 9.
Diagram of the intersection of rupture (a) pressure and (b) porosity seepage.
Taking the Ma 131 well area as an example, Equation (7) is applied to the calculation of fracture pressure of a typical single well in the study area, and favorable application results are obtained. Based on the calculation results of fracture pressure, the single-well reservoir, along with the roof and floor, is divided and interpreted in detail (Figure 5). In order to verify the accuracy of the fracture pressure calculated by the model, the ground breaking test results are collected for verification. Taking Well Wu 36 in the study area as an example, the maximum fracture pressure difference measured by the rock sample of 203 m depth is 1.8 MPa, and the fracture pressure difference calculated by the formula is 1.84 MPa, at the same depth (Figure 10). The error is small, which proves that the formula can be applied in the study area.
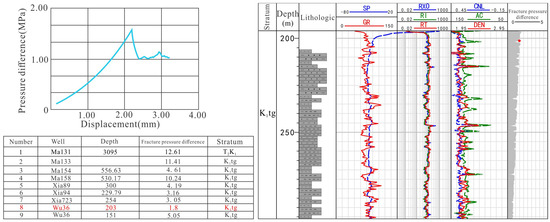
Figure 10.
The calculated values of the model are compared with the experimental values of ground breakage (take the sample from Well Wu 36 as an example).
According to the above summary of the closure evaluation index, the rupture pressure (Equation (7)) (MPa) and thickness (H), two important indicators of the sealing ability of a single well, were summarized. In order to avoid the excessive difference of the rupture pressure values between different wells affecting the evaluation, the ratio of rupture pressure to normal pore pressure, referred to as the rupture pressure gradient (FG), was proposed.
According to the FG curve, it can be clearly seen that the FG values between the reservoir and the caprock are significantly different (Figure 5). The average FG value of the caprock is 2.3–2.0, and the average FG value of the reservoir is 2.0–1.8. The key wells in the Ma131 well area are connected, and an even well profile of the Ma131 well area (Figure 11) is drawn to horizontally compare the FG and the thickness of each well. It was found that the oil pool in the Ma 131 well area contains three caprocks: the mudstone in the upper part of the third member of the hundred, the thin layer of mudstone in the first member of the hundred, and the weathered clay layer under the unconformity surface of the Wuerhe Formation (Figure 11).
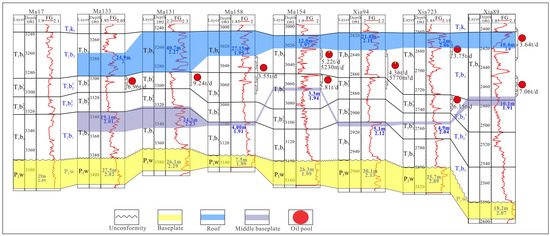
Figure 11.
Even well profile of the Ma131 well area.
The well connection profile of the Ma 131 well area (Figure 11) shows that thicker mudstone is developed in the Wuerhe Formation in the lower part of the Baikouquan Formation, and the fracture pressure gradient is large, which provides a good floor condition for trap in the study area. At the top of the reservoir (the top of the Baisan Member), a thick mudstone layer is also developed, and the corresponding fracture pressure gradient is also large, which can effectively prevent oil and gas from escaping upward, exhibiting good roof conditions. Thin mudstone interlayers are developed in the first and second members of the Baikouquan Formation in the Ma 131 well area. The overall thickness is small, and the rupture pressure coefficient is high, so the layer can serve as the direct floor of the upper reservoir. However, at the two wells of Ma 154 and Ma 158, the FG value can reach the condition of sealing, but due to the thin cap layer, the sealing effect is poor, resulting in low proven oil production (Table 1). From the numerical product of FG and H, it is obvious that reservoirs with a larger product have more oil production. It can be seen that the thickness of the cap and the fracture pressure gradient in the process of oil and gas accumulation compensate each other, providing a good roof and floor for the reservoir in the study area on the whole.

Table 1.
Statistical table of fracture pressure and thickness in the roof and floor of the Ma 131 reservoir.
5. Discussion
5.1. Unconformity and Reservoir Roof and Floor
According to the profile of the even well (Figure 11), the reservoir profile of the Ma131 well area is drawn (Figure 12). The reservoir is located at the top of the Baikouquan Formation, in which the reservoir has good connectivity. P/T overlap unconformity is developed at the bottom of the reservoir (Baikouquan Formation), which belongs to sand–mud–mud type. The bottom plate of the reservoir corresponds to the weathered clay layer and the weathered leaching zone within the unconformity structure. The unconformity structure has a large thickness and a high fracture pressure gradient, contributing to its sealing role in the lower part of the reservoir in the Ma 131 well area. Combined with the good sealing property of mudstone in the upper part of the Baisan Member (Figure 11), it provides good roof and floor conditions for the formation and preservation of oil and gas in the Ma 131 well area. The Ma132 well north fault, Ma3 well north fault, and Xia 13 well fault are developed in the updip direction. These faults, together with the glutenite above the unconformity surface, provide a good migration channel for the upward migration of oil and gas. Because the study area is a stratigraphic oil and gas reservoir, the underground structure is relatively simple. After the formation of oil and gas, the fault activity makes the tight rock layer move up and directly contact with the oil and gas reservoir, blocking the lateral migration of oil and gas, and providing a good blocking effect for the lateral direction of the oil and gas, so that the oil and gas pool forms a complete, enclosed space. Adversely, due to the small fracture pressure of the roof and poor sealing conditions, the annex of Ma 17 well cannot effectively preserve oil and gas, so no reservoir has been formed.
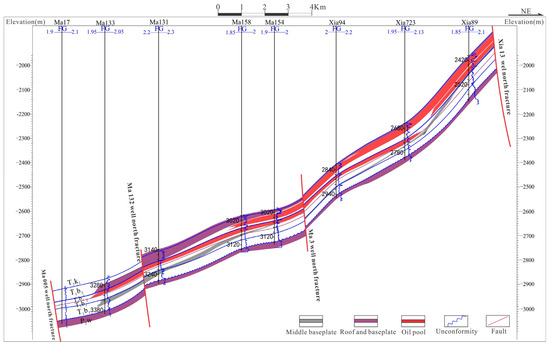
Figure 12.
Reservoir profile of the Ma 131 well area.
5.2. Unconformity and Oil and Gas Reservoir Formation
Combined with the above research results, the typical unconformity hydrocarbon accumulation models of the Baikouquan Formation in the Mahu Depression are summarized as “sourcing-cross layer accumulation, fault communication source and reservoir, unconformity lateral transport and distribution, mudstone lateral docking”. The cross-layer accumulation model on the source is an important feature of the formation of the Mahu large oil region. According to the contact relationship between faults and source rocks, it is divided into source-through faults and non-source-through faults. The source-through faults refer to the faults that connect the source rocks and reservoirs and open during the accumulation period, which are the main channels for the vertical migration of oil and gas. The main source rocks in the Mahu Sag are distributed in the Permian Fengcheng Formation. At the end of the Permian Hercynian–Indosinian period, the strata were greatly subsided by tectonic movement, forming a number of east–west compression-torsion faults, disconnecting the Baikouquan Formation reservoir and directly communicating with the lower source rocks. After reaching the hydrocarbon generation threshold, the oil and gas moved upwards and transported laterally along the unconformity surface. When the fault was encountered, it migrated upwards along the fault to the reservoir (Figure 13). The development of weathered clay layer provides good sealing conditions for oil and gas reservoirs, so the weathered clay layer unconformity can usually effectively store oil and gas. Because the oil and gas in the Mahu Sag are mainly in the oblique section zone and the sag area, the study area is controlled by the shallow water, large coarse-grained fan delta deposition. From the edge to the center of the sag, alluvial fan, fan delta plain subfacies and fan delta front subfacies are developed in turn. The high-yield oil and gas layers are mainly concentrated in the fan delta front subfacies, and the oil and gas layers in the plain subfacies have low production and are mostly composed of oil and water layers [33]. During the deposition period of the first member of the Baikouquan Formation, the multi-stage fan delta front subfacies were widely superimposed and distributed in the center of the sag and the slope area. After deposition, most of them were tight glutenite, which makes it difficult to store oil and gas, so the oil and gas were mainly distributed in the second member of the Baikouquan Formation. The glutenite at the bottom of the first member of the Baikouquan Formation and the P/T unconformity surface jointly facilitated the migration of oil and gas. At the same time, due to the fracture effect, the mudstone layer was disconnected, placing the reservoir in lateral contact with the mudstone of larger thickness [34,35,36,37,38]. As a result, the conglomerate reservoir of the Baikouquan Formation exhibits good lateral sealing and preservation conditions.
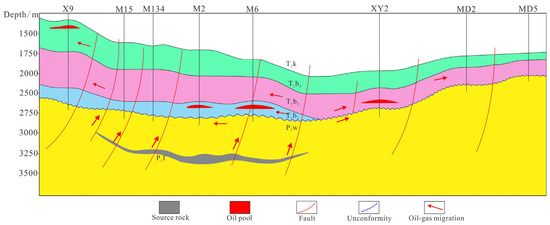
Figure 13.
Diagram of the unconformity oil and gas reservoir accumulation pattern.
6. Conclusions
- (1)
- Unconformity has a three-layer structure, including a residual layer, a weathered clay layer, and a weathered leaching zone. According to the difference between multiple logging curves, the identification factor Qi of the unconformity structure is summarized. The Qi value of the upper layer of unconformity is 0.4~0.5, the middle layer is 0.5~0.6, and the lower layer is 0.6~0.7, so as to distinguish the three-layer structure vertically. According to whether the weathered clay layer is developed and based on different lithologic configurations, the internal unconformity structure of Mahu Sag is divided into five types: sandstone–clay–sandstone, sandstone–clay–mudstone, sandstone–sandstone, sandstone–mudstone, and sandstone–volcanic rock. Most of the study area is characterized by a clay-bearing layer type, and a few areas lacking the weathered clay layer types are concentrated in the south of the Mahu Sag.
- (2)
- The weathered clay layer is the key to the formation of unconformity oil and gas reservoirs. The physical simulation experiment is used to select the fracture pressure gradient and thickness as the most critical factors affecting its sealing. Taking the Ma 131 well area as an example, the fracture pressure coefficient of the roof and floor is distributed in a range of 2.0~2.3, and the fracture pressure coefficient of the reservoir is distributed in a range of 1.8~2.0. The logging curves are obviously different, and the average thickness of the roof and floor is 21 m, providing a good sealing effect. Under the action of the upper transport of the P/T overlapping unconformity structure and the joint sealing of the middle and lower layers and the upper mudstone, the oil and gas are completely preserved in the trap.
- (3)
- The control exerted by the unconformity on oil and gas accumulation is reflected in several aspects: the effect of glutenite on oil and gas migration and accumulation in the structure; the sealing ability of mudstone and volcanic rock with dense structures; and the control effect of the combination of fracture and unconformity on oil and gas in different tectonic environments. After the oil and gas are generated from the source rock in the Mahu Sag, they migrate upward along the fault. The rocks above the unconformity and the tight sandstone developed under the sedimentary environment jointly serve as oil and gas transportation channels. The weathered clay layer under the unconformity surface has a stable structure and an excellent sealing effect, providing roof, floor, and lateral sealing conditions for oil and gas reservoirs.
Author Contributions
Conceptualization, Z.W., M.Z. and X.W.; methodology, Z.W., M.Z., X.W. and Q.X.; software, Z.W.; validation, Z.W., Y.B. and Y.C.; formal analysis, Z.W.; investigation, Z.W. and Y.C.; resources, M.Z., X.W., Z.A. and Q.X.; data curation, M.Z. and Z.A.; writing—original draft preparation, Z.W.; writing—review and editing, Z.W.; visualization, M.Z.; supervision, M.Z.; project administration, M.Z. and Z.A.; funding acquisition, M.Z., X.W. and Z.W. All authors have read and agreed to the published version of the manuscript.
Funding
This research was funded by THE China National Petroleum Company Limited Forward-Looking Basic Research Major Project, grant number “2021DJ0405”, and the National Natural Science Foundation (41702135).
Institutional Review Board Statement
Not applicable.
Informed Consent Statement
Not applicable.
Data Availability Statement
All data and materials are available on request from the corresponding author. The data are not publicly available due to ongoing researches using a part of the data.
Conflicts of Interest
Menglin Zheng and Zhiyuan An were employed by the PetroChina Xinjiang Oilfield Branch, Kelamayi 834000, China. The remaining authors declare that the research was conducted in the absence of any commercial or financial relationships that could be construed as a potential conflict of interest.
References
- Zhang, S.A.; Wu, Y.J.; She, X.Y.; Feng, C.S. Condition and trend for formation of unconformity reservoir in Tarim Basin. Xinjiang Pet. Geol. 1999, 20, 15–17+72. (In Chinese) [Google Scholar]
- Wu, K.Y.; Li, L.L.; Zha, M. Vertical structures of unconformity and its simulation experiment of hydrocarbon accumulation mechanism. Pet. Geol. Exp. 2009, 31, 537–541. (In Chinese) [Google Scholar]
- He, D.F. Basic types and geologic significances of “truncation and onlap” unconformities. Pet. Explor. Dev. 2018, 45, 995–1006. (In Chinese) [Google Scholar]
- Zhang, J.T.; Zhang, Y.Y.; Gu, N.; Jin, X.H.; Zhang, T.; Liu, S.H.; Jia, H.C.; Yang, J.Q.; Liu, L.; Gao, X.P. Unconformity characteristics of Huaiyuan movement in the northeast of Wushenqi paleo-uplift in Ordos Basin and its implications for karst reservoir generation. Oil Gas Geol. 2023, 44, 101–109. (In Chinese) [Google Scholar]
- Tang, Y.; Wei, X.; Yan, D.; Zheng, M.; Zhang, L.; Yu, Z. The Effect of Pre–Triassic Unconformity on a Hydrocarbon Reservoir: A Case Study from the Eastern Mahu Area, Northwestern Junggar Basin, China. Minerals 2024, 14, 1277. [Google Scholar] [CrossRef]
- Zhang, K.Y.; Ai, H.G.; Wu, Y.J. Characteristics and oil-congtrolling significance of unconformity structure layer on top of carbonate rock. Pet. Explor. Dev. 1996, 23, 16–19+82. (In Chinese) [Google Scholar]
- Wu, K.Y.; Cha, M.; Liu, G.D. The Unconformity Surface in the permian of Jungga-R Basin and the characters of oil-gas migration and accumulation. Pet. Explor. Dev. 2002, 2, 53–57. (In Chinese) [Google Scholar]
- Wang, Y.Z.; Cao, Y.C.; Wang, S.P.; Song, Y.B. Advances in research of spatial structures of unconformity. Geotechtonica Metallog. 2006, 30, 326–330. (In Chinese) [Google Scholar]
- Zou, C.N.; Hou, L.H.; Yang, F.; Yang, C.; Tao, S.; Yuan, X.; Zhu, R. Structure of weathered clastic crust and its petroleum potential. Sci. China Earth Sci. 2014, 57, 3015–3026. [Google Scholar] [CrossRef]
- Tang, Y.; Ji, J.; Guo, W.J.; Cheng, H.; Li, Y.Y.; Dong, F. Characteristics and reservoir-control effect of Upper/Middle Permian unconformity structures in the east of Fukang Sag, Junggar Basin. Oil Geophys. Prospect. 2022, 57, 1138–1147+1005. (In Chinese) [Google Scholar]
- Qadri, S.M.T.; Ahmed, W.; Haque, A.K.M.E.; Radwan, A.E.; Hakimi, M.H.; Abdel Aal, A.K. Murree Clay Problems and Water-Based Drilling Mud Optimization: A Case Study from the Kohat Basin in Northwestern Pakistan. Energies 2022, 15, 3424. [Google Scholar] [CrossRef]
- Osinowo, O.O.; Ayorinde, J.O.; Nwankwo, C.P.; Ekeng, O.M.; Taiwo, O.B. Reservoir description and characterization of Eni field Offshore Niger Delta, southern Nigeria. J. Petrol. Explor. Prod. Technol. 2018, 8, 381–397. [Google Scholar] [CrossRef]
- Qadri, S.T.; Islam, M.A.; Shalaby, M.R.; Ali, S.H. Integration of 1D and 3D modeling schemes to establish the Farewell Formation as a self-sourced reservoir in Kupe Field, Taranaki Basin, New Zealand. Front. Earth Sci. 2021, 15, 631–648. [Google Scholar] [CrossRef]
- Adelu, A.O.; Aderemi, A.A.; Akanji, A.O.; Sanuade, O.A.; Kaka, S.I.; Afolabi, O.; Olugbemiga, S.; Oke, R. Application of 3D static modeling for optimal reservoir characterization. J. Afr. Earth Sci. 2019, 152, 184–196. [Google Scholar] [CrossRef]
- Lin, J.P.; Jia, S.P.; Liu, T.H.; Yan, A.H.; Xi, Z.Q. Comprehensive evaluation of sealing ability of mudstone cap rock for Xing 9 depleted gas reservoir in reconstructing underground gas storage. Chin. J. Rock Mech. Eng. 2015, 34, 4099–4107. (In Chinese) [Google Scholar]
- Sui, F.G.; Wang, X.J.; Zhuo, Q.G. Current ex-ploration situation and research trend of stratigraphic reservoirs in continental fault basin—Taking Jiyang Depressionas an example. Pet. Geol. Recovery Effic. 2007, 14, 1–6. (In Chinese) [Google Scholar]
- Liu, X.J.; Jiang, Y.L.; Song, G.Q.; Chen, T. Determination of Unconformity Structure Types with Fuzzy Comprehensive Evaluation Method. J. Oil Gas Technol. 2009, 31, 170–173+435. (In Chinese) [Google Scholar]
- Chen, G.H.; Liang, S.S.; Wang, J.; Sui, S. Application of convolutional neural network in lithology identification. Well Logging Technol. 2019, 43, 129–134. (In Chinese) [Google Scholar]
- Han, B.; Wang, C.W.; Sheng, S.F.; Pang, Y.Q. Controls of the permian unconformity on Reservoir Formation in Zhongguai-District 5 Area of Juggar Basin. Nat. Gas Geosci. 2017, 28, 1821–1828. (In Chinese) [Google Scholar]
- Zhou, P.X.; Wu, K.Y.; Dong, F.; Li, Y.Y. Denudation thickness and distribution rule in the fault-depression transition period of Junggar Basin. Geol. Resour. 2023, 32, 575–583. (In Chinese) [Google Scholar]
- Gao, C.H.; Peng, P.; Li, B.Q. Unconfor-Mity types and their constraints on hydrocarbon behaviort. Lithol. Reserv. 2013, 25, 1–7. (In Chinese) [Google Scholar]
- Cheng, Z.G.; Hu, T.T.; Qu, J.H.; He, L.P. High-quality and thin reservoir of tight conglomerate prediction in Maxi area of Junggar Basin. Geophys. Geochem. Explor. 2015, 39, 891–896. (In Chinese) [Google Scholar]
- Anderson, R.A.; Ingram, D.S.; Zanier, A.M. Determining fracture pressure gradient from well log. J. Pet. Technol. 1973, 25, 1259–1268. [Google Scholar] [CrossRef]
- Allais, M. Évaluation des Perspectives Économiques de la Recherche Minière sur de Grands Espaces—Application au Sahara Algérien; Revue de l’Industrie Minérale: Paris, France, 1956. [Google Scholar]
- Haimson, B.; Fairhurst, C. Initiation and extension of hydraulic fractures in rocks. Soc. Pet. Eng. J. 1967, 7, 310–318. [Google Scholar] [CrossRef]
- Hubbert, M.K.; Willis, D.G. Mechanics of hydraulic fracturing. Pet. Trans. 1957, 210, 153–168. [Google Scholar] [CrossRef]
- Schowalter, T.T. Mechanics of secondary hydrocarbon migration and entrapment. AAPG Bull. 1979, 63, 723–760. [Google Scholar]
- Stephen, R.D. Prediction of fracture pressures for wildcat wells. J. Pet. Technol. 1982, 34, 863–872. [Google Scholar]
- Tourinho, O. The Valuation of Reserves of Natural Resources: An Option Pricing Approach. Ph.D. Thesis, University of California, Berkeley, CA, USA, 1979. [Google Scholar]
- He, Y.B.; Zheng, J.Y.; Zhang, M. Calculation method and application of formation fracture pressure in Baiyun deepwater area. Mar. Geol. Front. 2022, 38, 41–50. (In Chinese) [Google Scholar]
- Eaton, B.A. Fracture gradient prediction and its application in oilfield operations. J. Pet. Technol. 1969, 21, 1353–1360. [Google Scholar] [CrossRef]
- Wang, Z.A. Study on Prediction Method and Distribution Law of Formation Pressure of Baikouquan Formation in Mahu Sag. Master’s Thesis, China University of Petroleum, Beijing, China, 2020. [Google Scholar] [CrossRef]
- Liu, H.L.; Lu, Z.Y.; Li, S.; Li, W.F. Sedimentary microfacies and favorable reservoir prediction of lower wuerhe formation of permian in MH1 Well Area. Sci. Technol. Eng. 2023, 23, 7650–7660. (In Chinese) [Google Scholar]
- Zecchin, M.; Catuneanu, O.; Caffau, M. High-resolution sequence stratigrap of clastic shelves VIII: Full-cycle subaerial unconformities. Mar. Pet. Geol. 2022, 135, 105425. [Google Scholar] [CrossRef]
- Green, A.; Meltzer, L.; Cooper, A.; Labuschagne, H.; Heeralal, T. Anatomy and stratigraphic evolution of a shelf bypass valley system: Lessons from the Namibian continental shelf. Geomorphology 2025, 476, 109680. [Google Scholar] [CrossRef]
- Bouat, L.; Strzerzynski, P.; Gardien, V.; Barré, G.; Branquet, Y.; Melleton, J.; Mourgues, R. Unconformity-related mineralization and fluid transfers in the northern Aquitaine Basin (France) revealed by fluid inclusions and S-Sr isotopes studies. J. Geochem. Explor. 2025, 272, 107713. [Google Scholar] [CrossRef]
- Bachari, M.; Negra, M.H.; Neumann, F.H.; Bergh, E.W.; Soltani, A.; Grosheny, D. Tectonic control of the Late Cretaceous sedimentation in north-central Tunisia: Insights from unconformities and early basin inversion. Mediterr. Geosci. Rev. 2025, 7, 29–50. [Google Scholar] [CrossRef]
- Baby, P.; Prudhomme, A.; Brusset, S.; Robert, A.; Roddaz, M.; Calderon, Y.; Eude, A.; Gil, W.; Hermoza, W.; Hurtado, C.; et al. The Northern Central Andes and Andean tectonic evolution revisited: An integrated stratigraphic and structural model of three superimposed orogens. Earth-Sci. Rev. 2025, 260, 104998. [Google Scholar] [CrossRef]
Disclaimer/Publisher’s Note: The statements, opinions and data contained in all publications are solely those of the individual author(s) and contributor(s) and not of MDPI and/or the editor(s). MDPI and/or the editor(s) disclaim responsibility for any injury to people or property resulting from any ideas, methods, instructions or products referred to in the content. |
© 2025 by the authors. Licensee MDPI, Basel, Switzerland. This article is an open access article distributed under the terms and conditions of the Creative Commons Attribution (CC BY) license (https://creativecommons.org/licenses/by/4.0/).