


Biomechanical Fuzzy Model for Analysing the Ergonomic Risk Level Associated with Upper Limb Movements


Abstract
1. Introduction
- The design of a fuzzy logic model to define and quantify workers’ anthropometric characteristics to determine the biomechanic risk level using only four general rules.
- The fuzzification of ergonomic risk using standardised data relating to biomechanics, anthropometrics, and productivity.
- A proposed DSS fuzzy model for implementing multiple assessments that establishes a record for measuring and monitoring the risk level at work using biomechanics and anthropometric characteristics.
2. Materials and Methods
2.1. Problem Description
2.2. Case Study
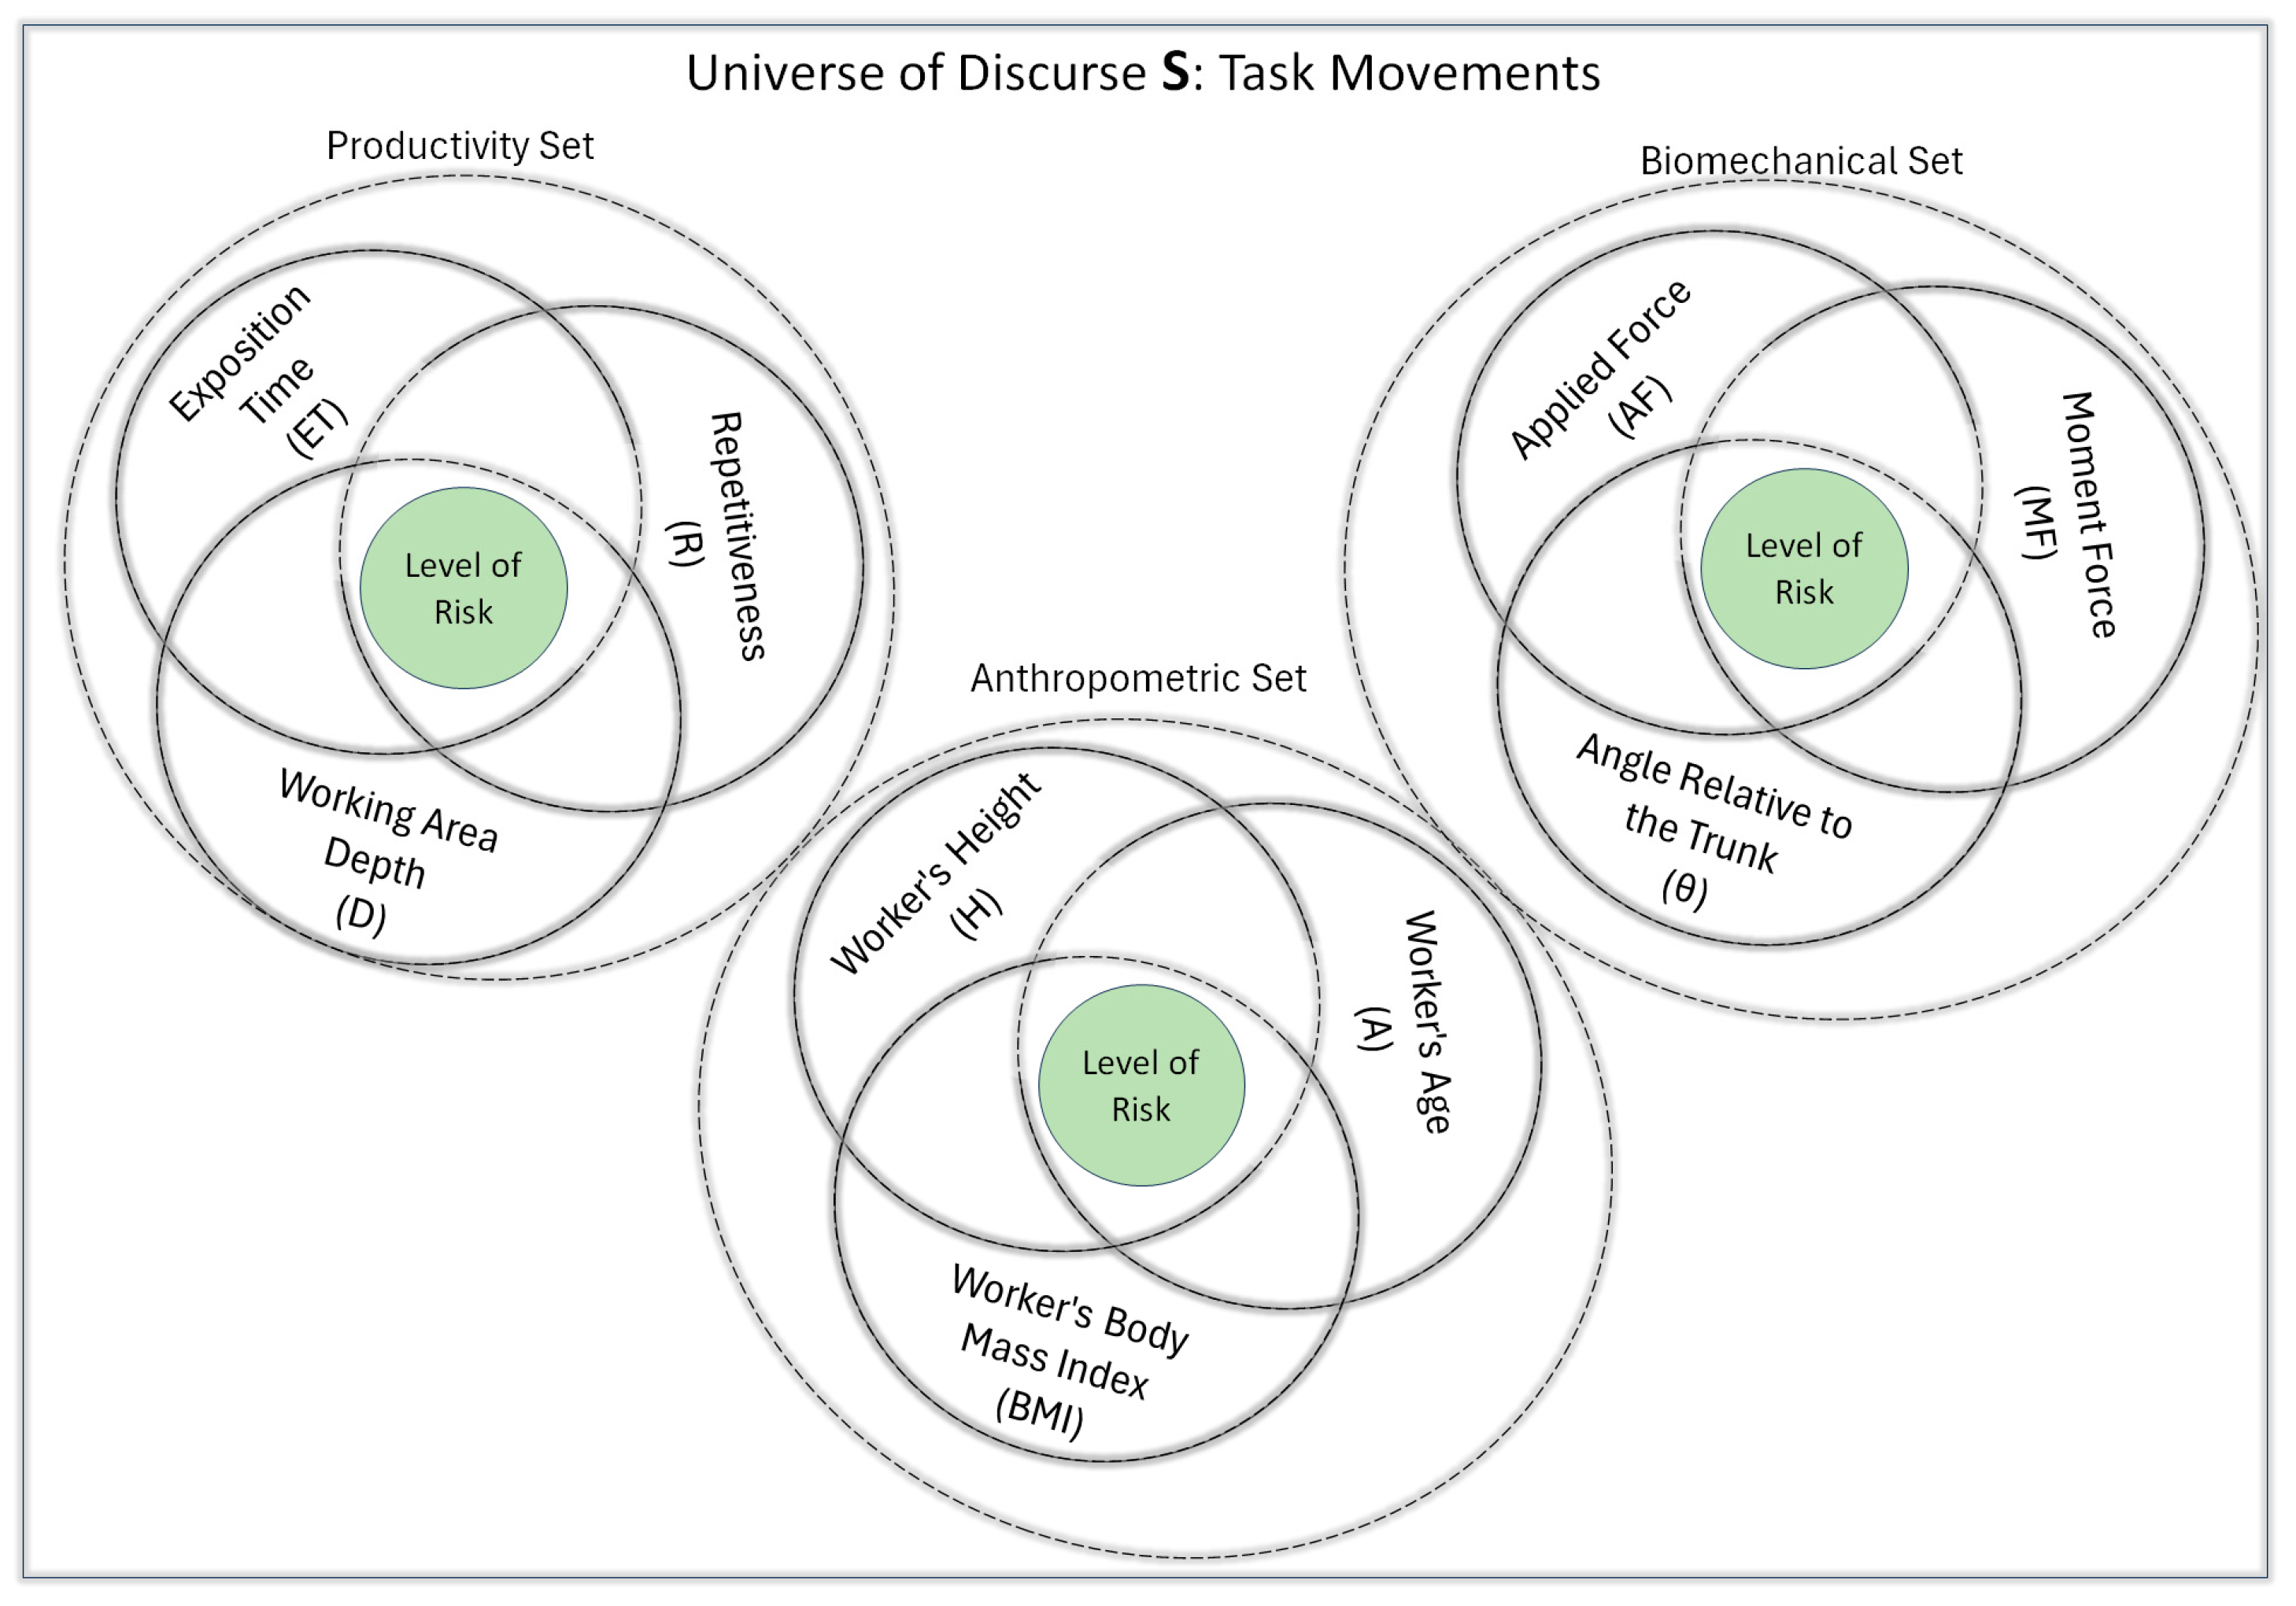
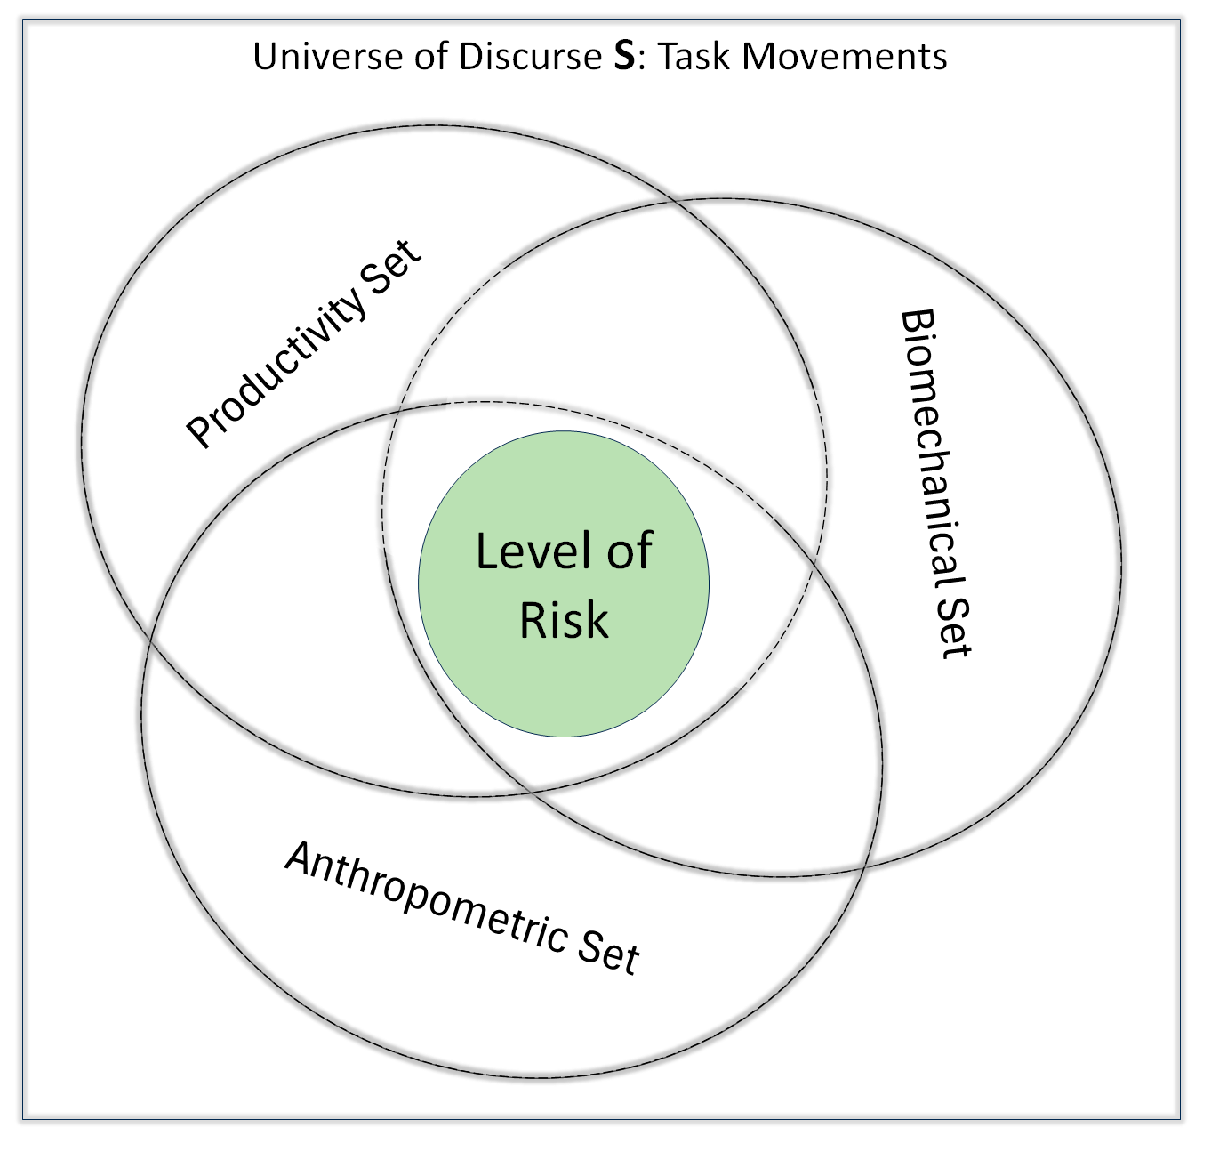
2.3. Biomechanic Fuzzy Logic Model
- Fuzzification.
- Decision Support System (DSS).
- Defuzzification.
2.3.1. Fuzzification
2.3.2. Decision Support System (DSS)
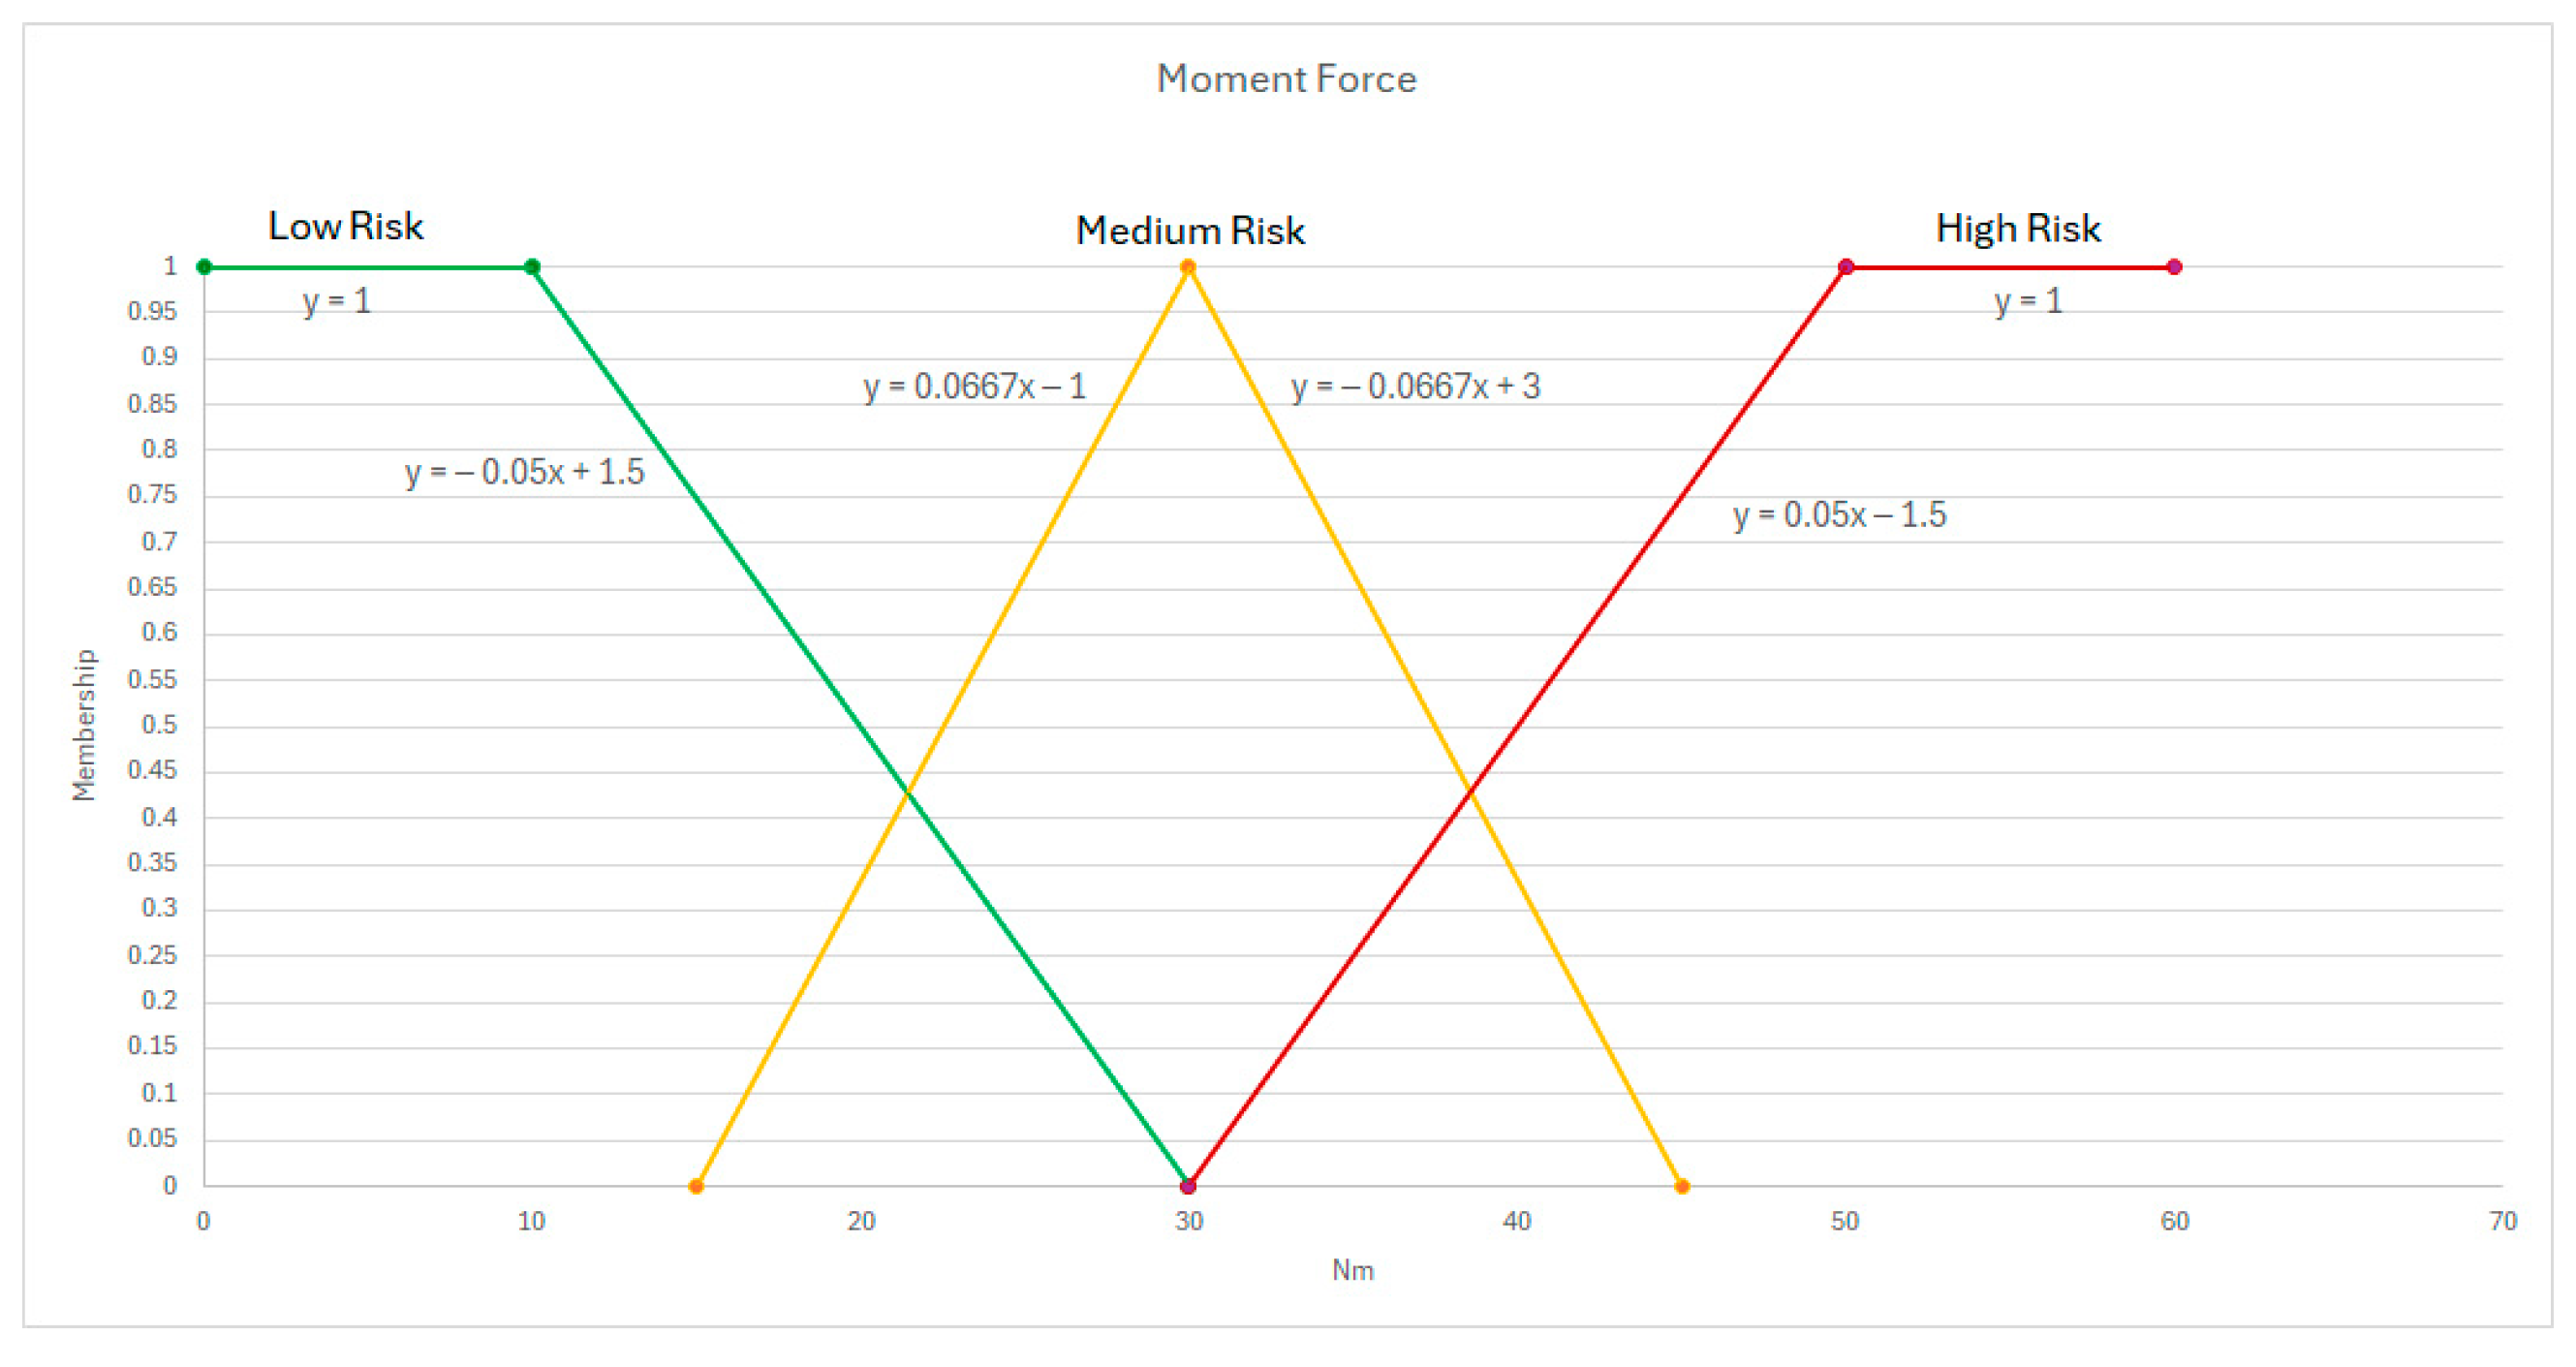
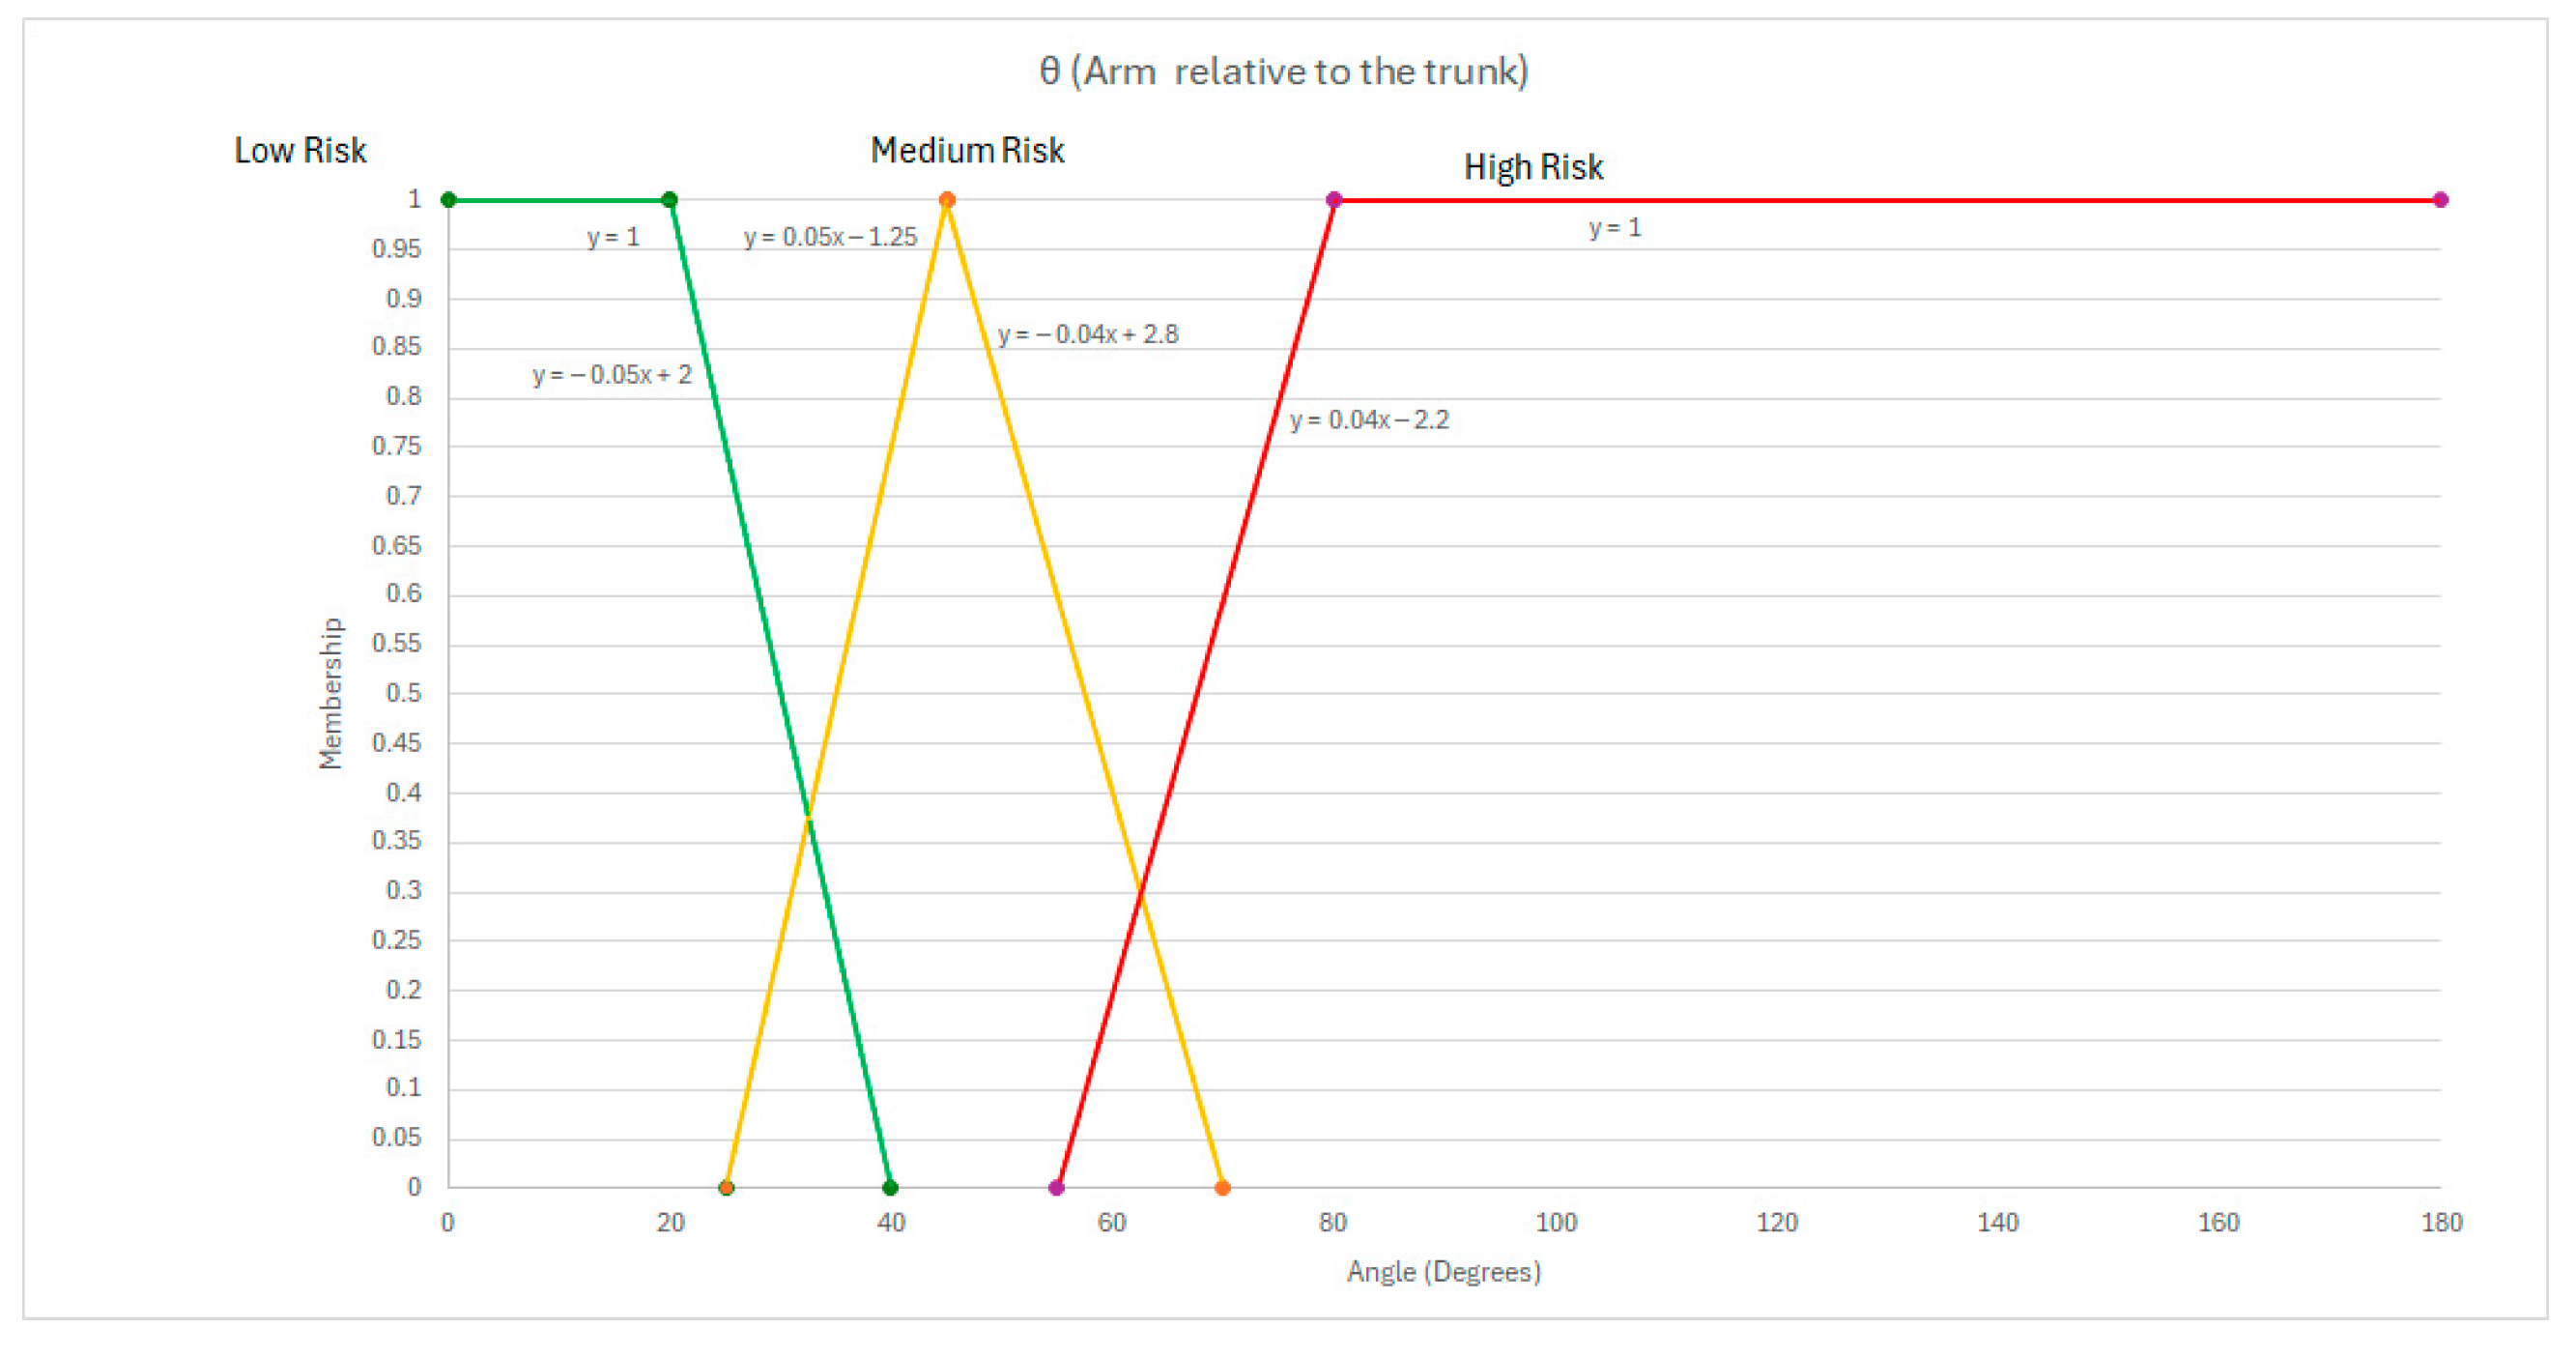
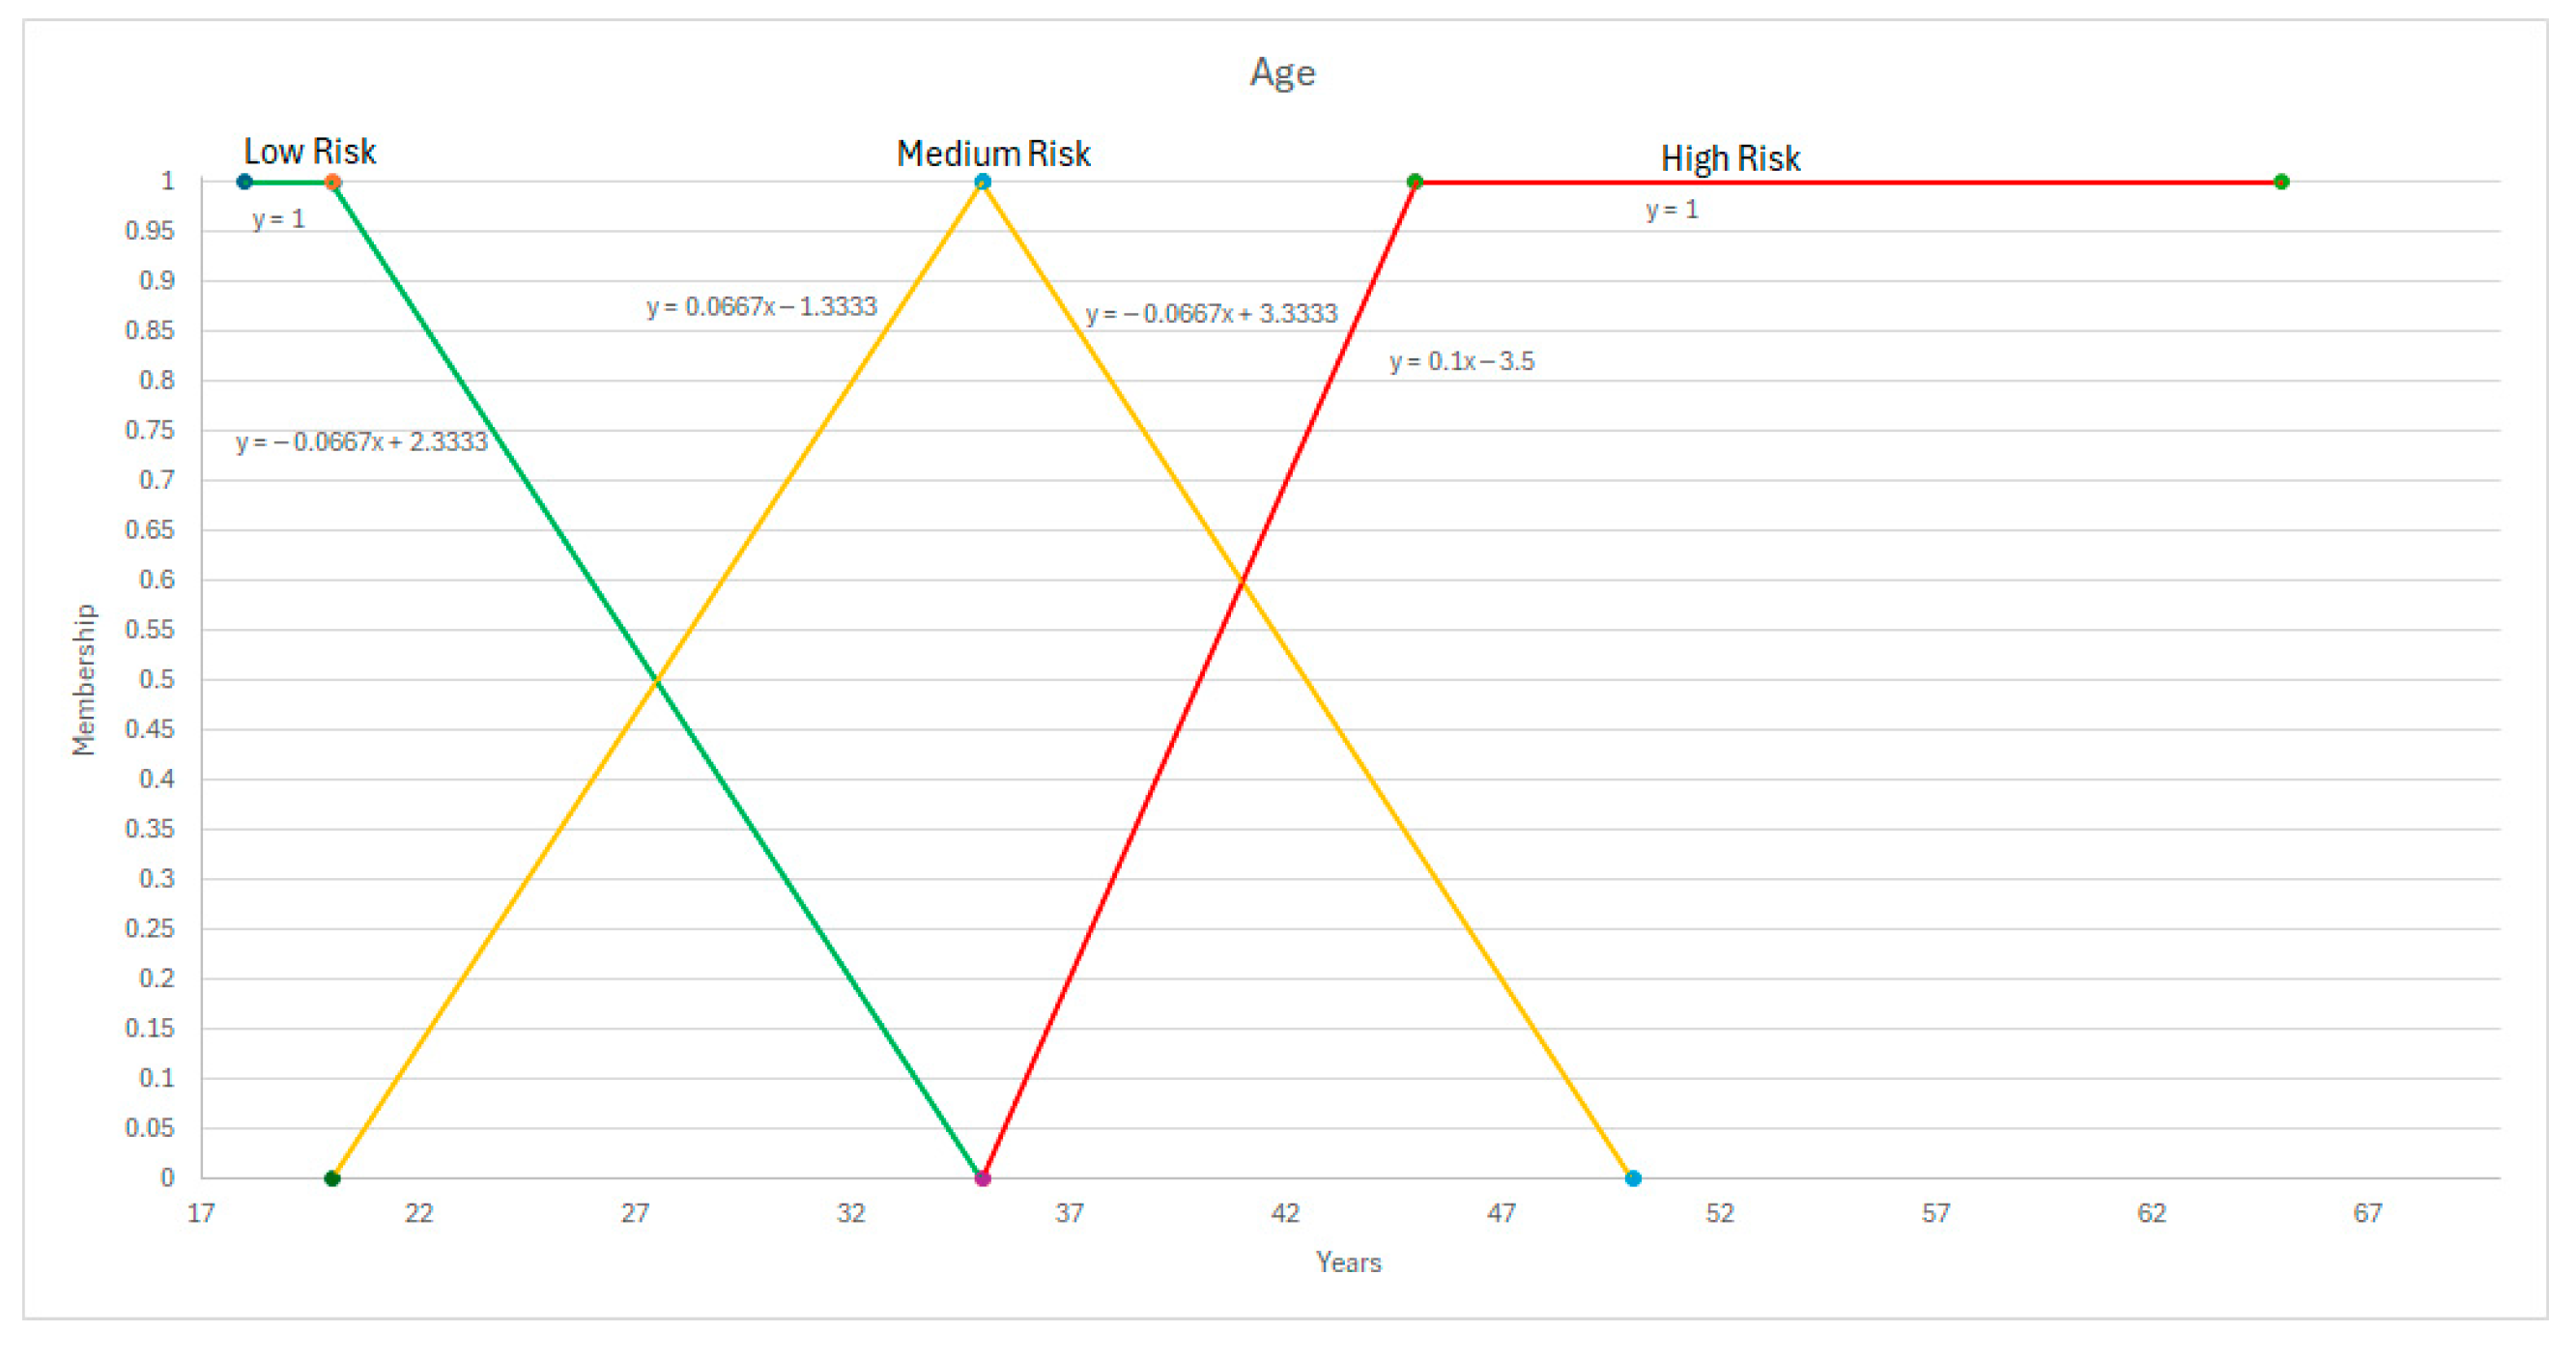
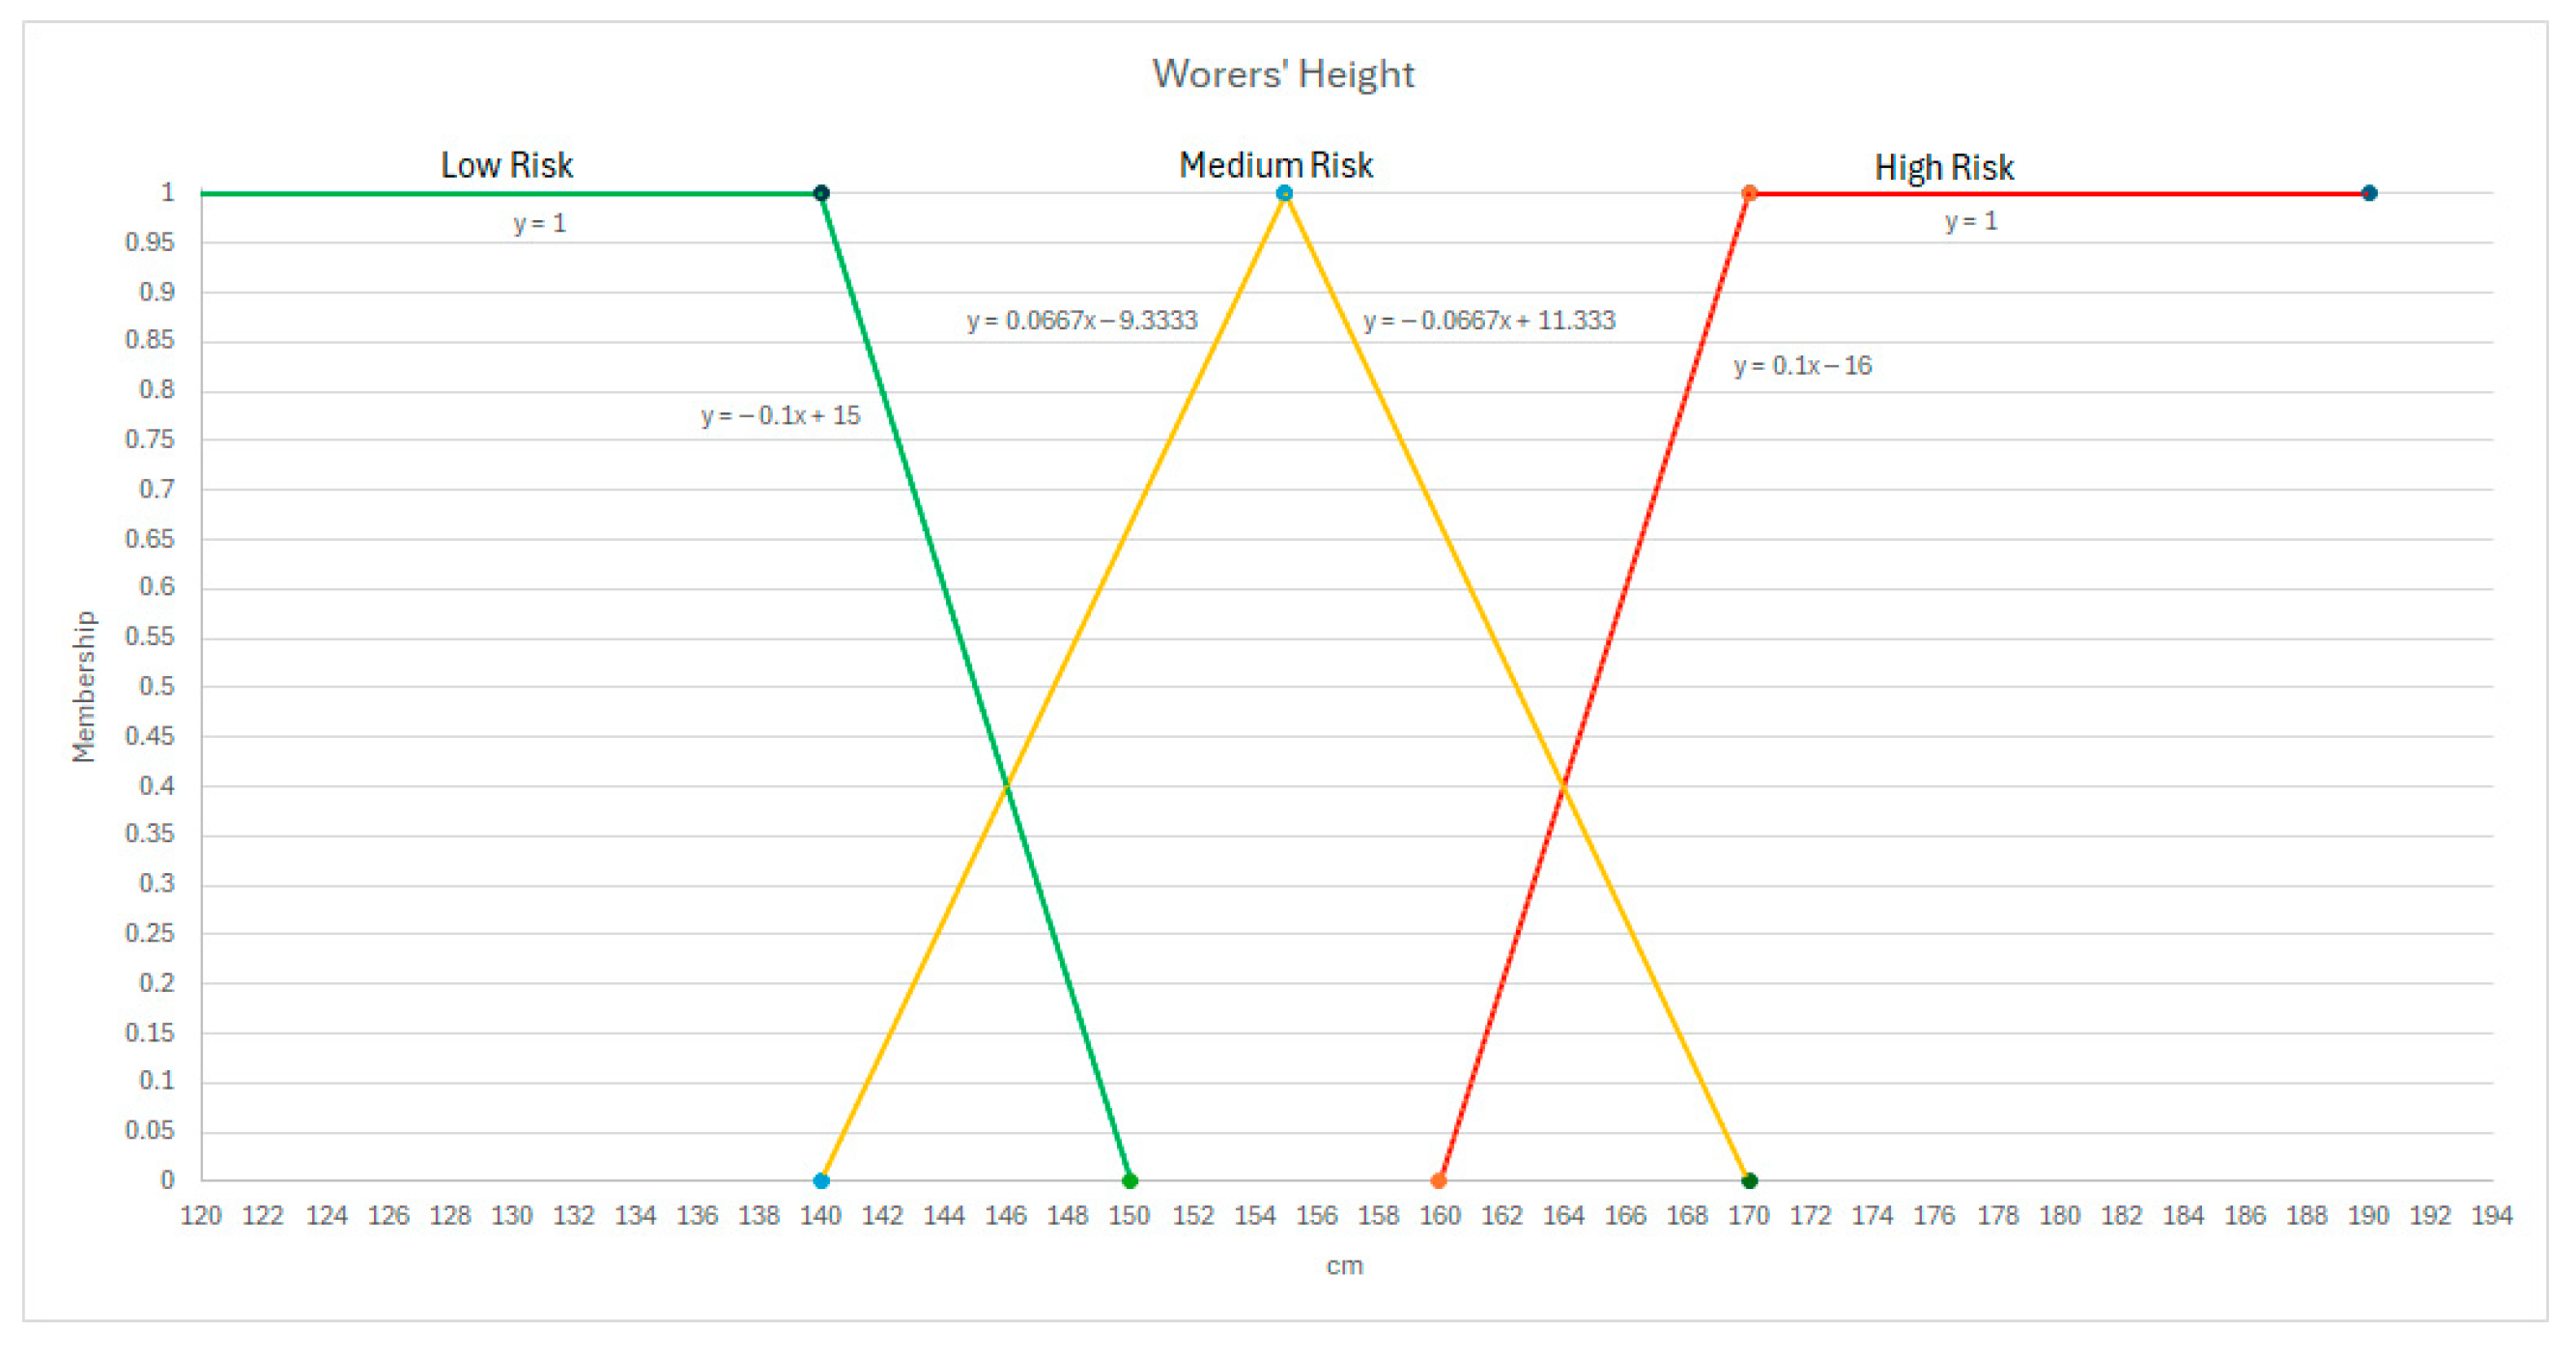
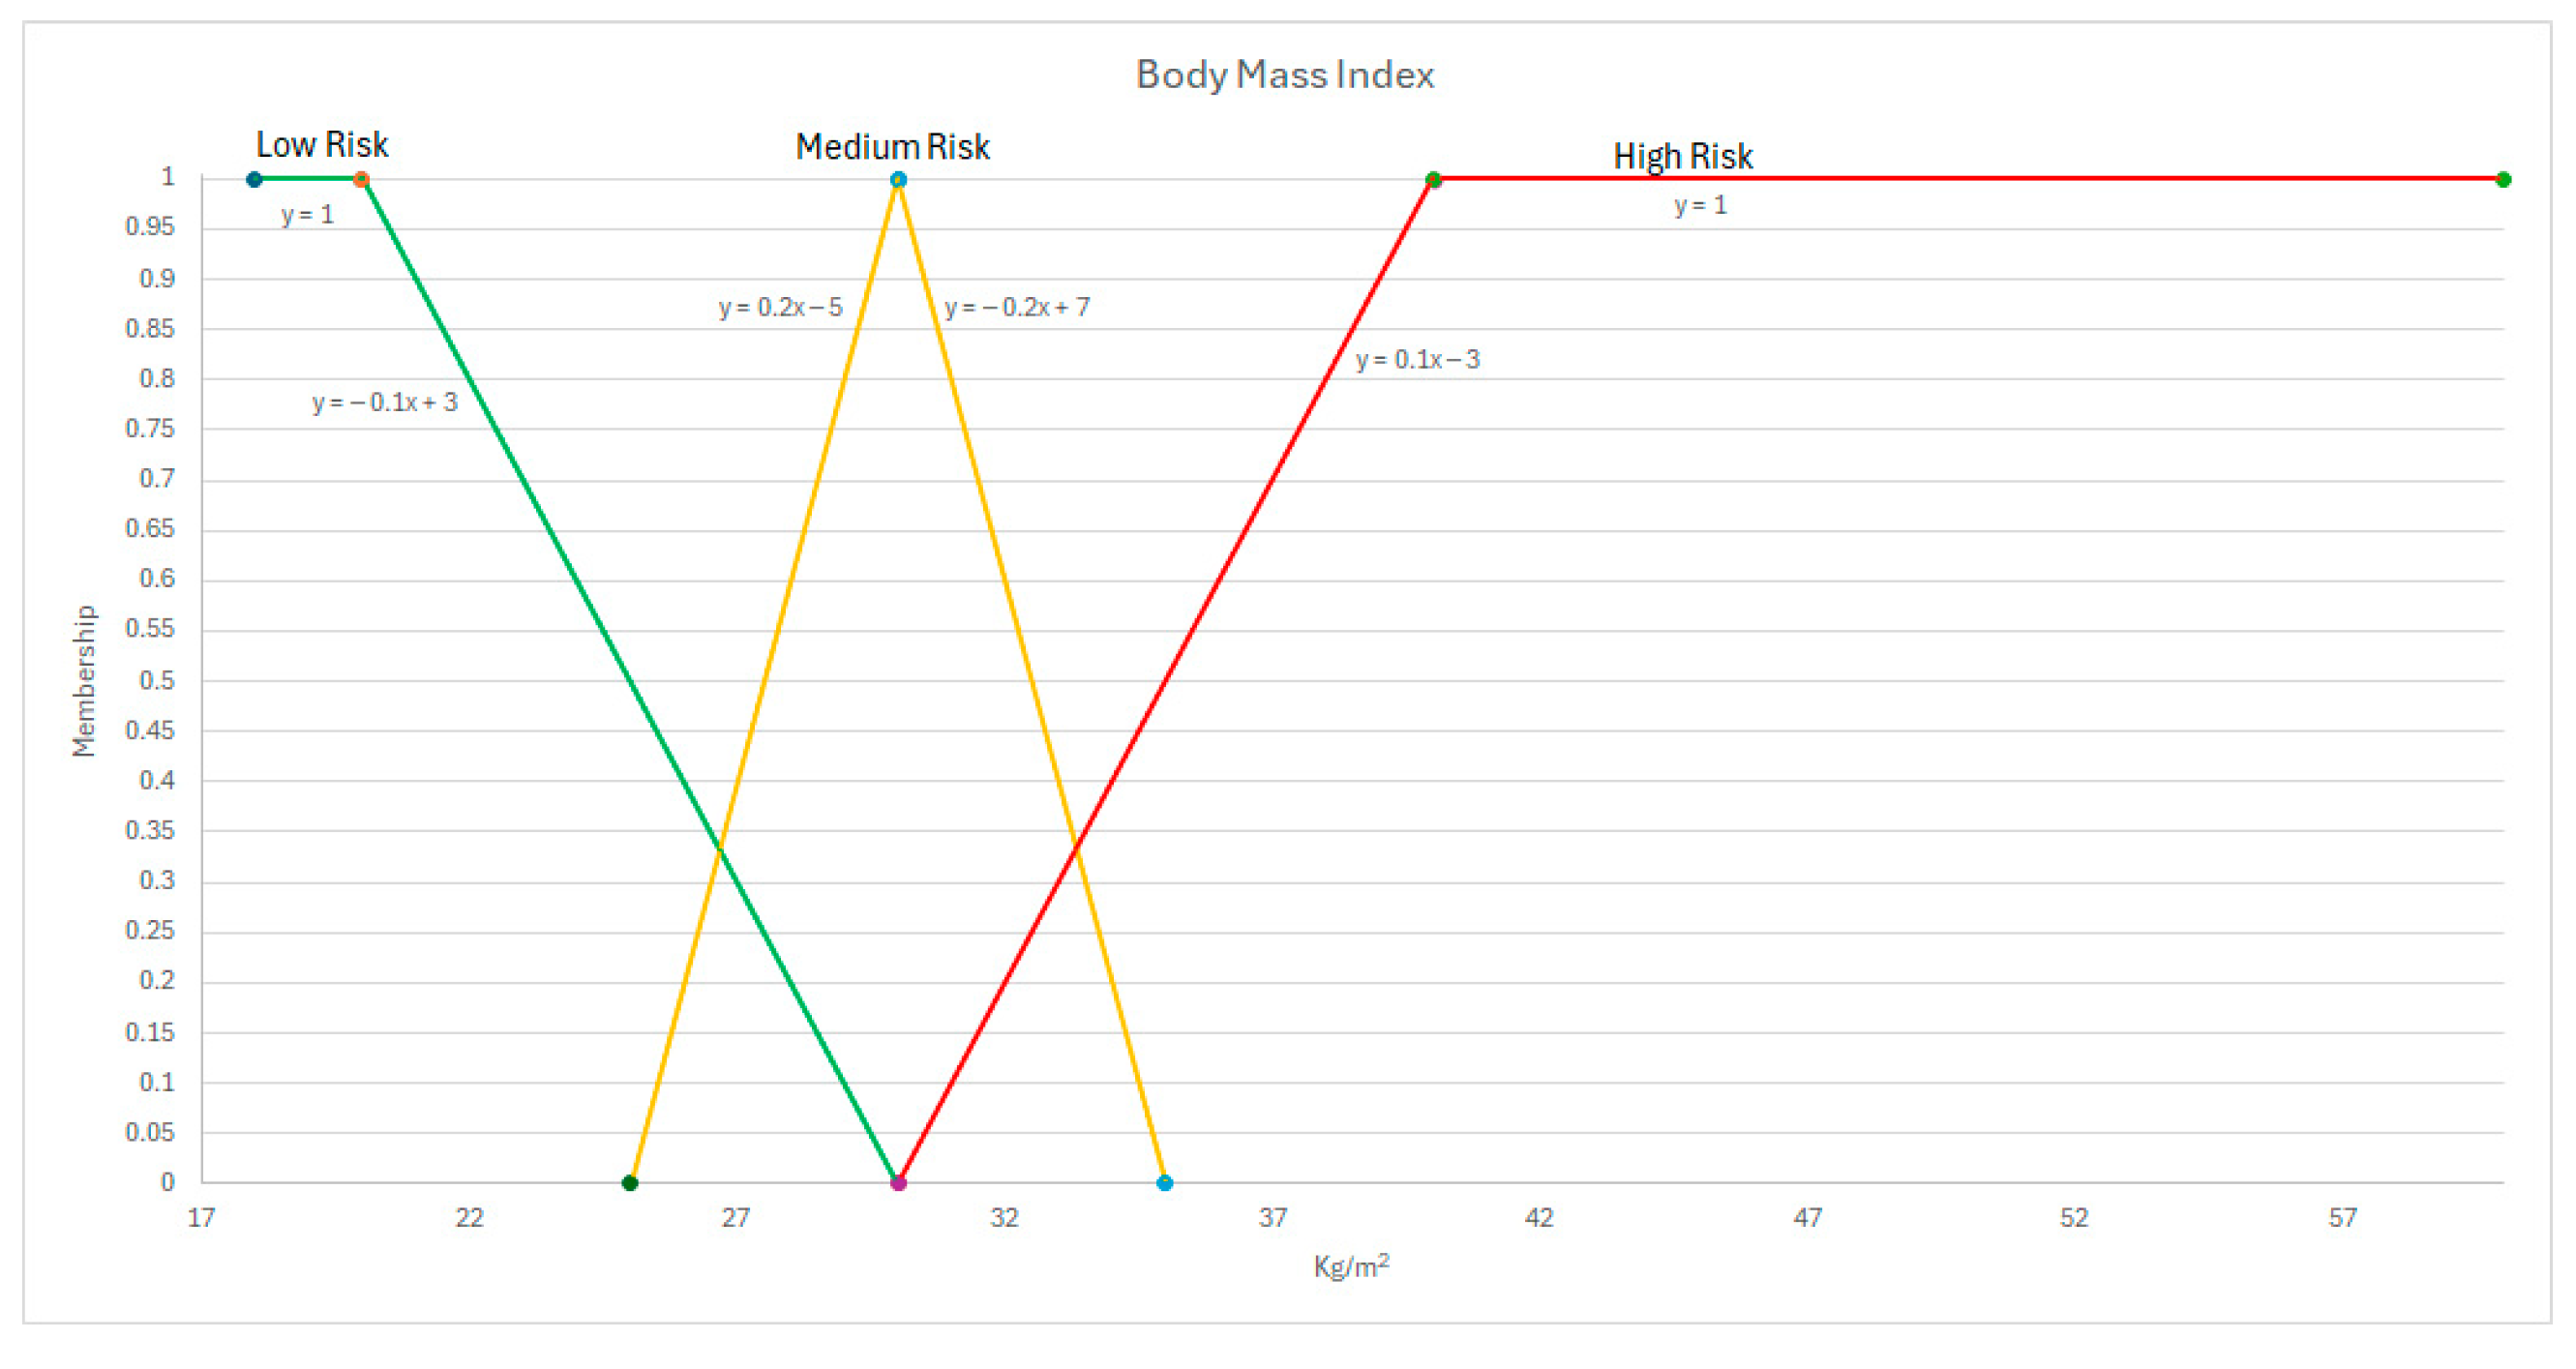
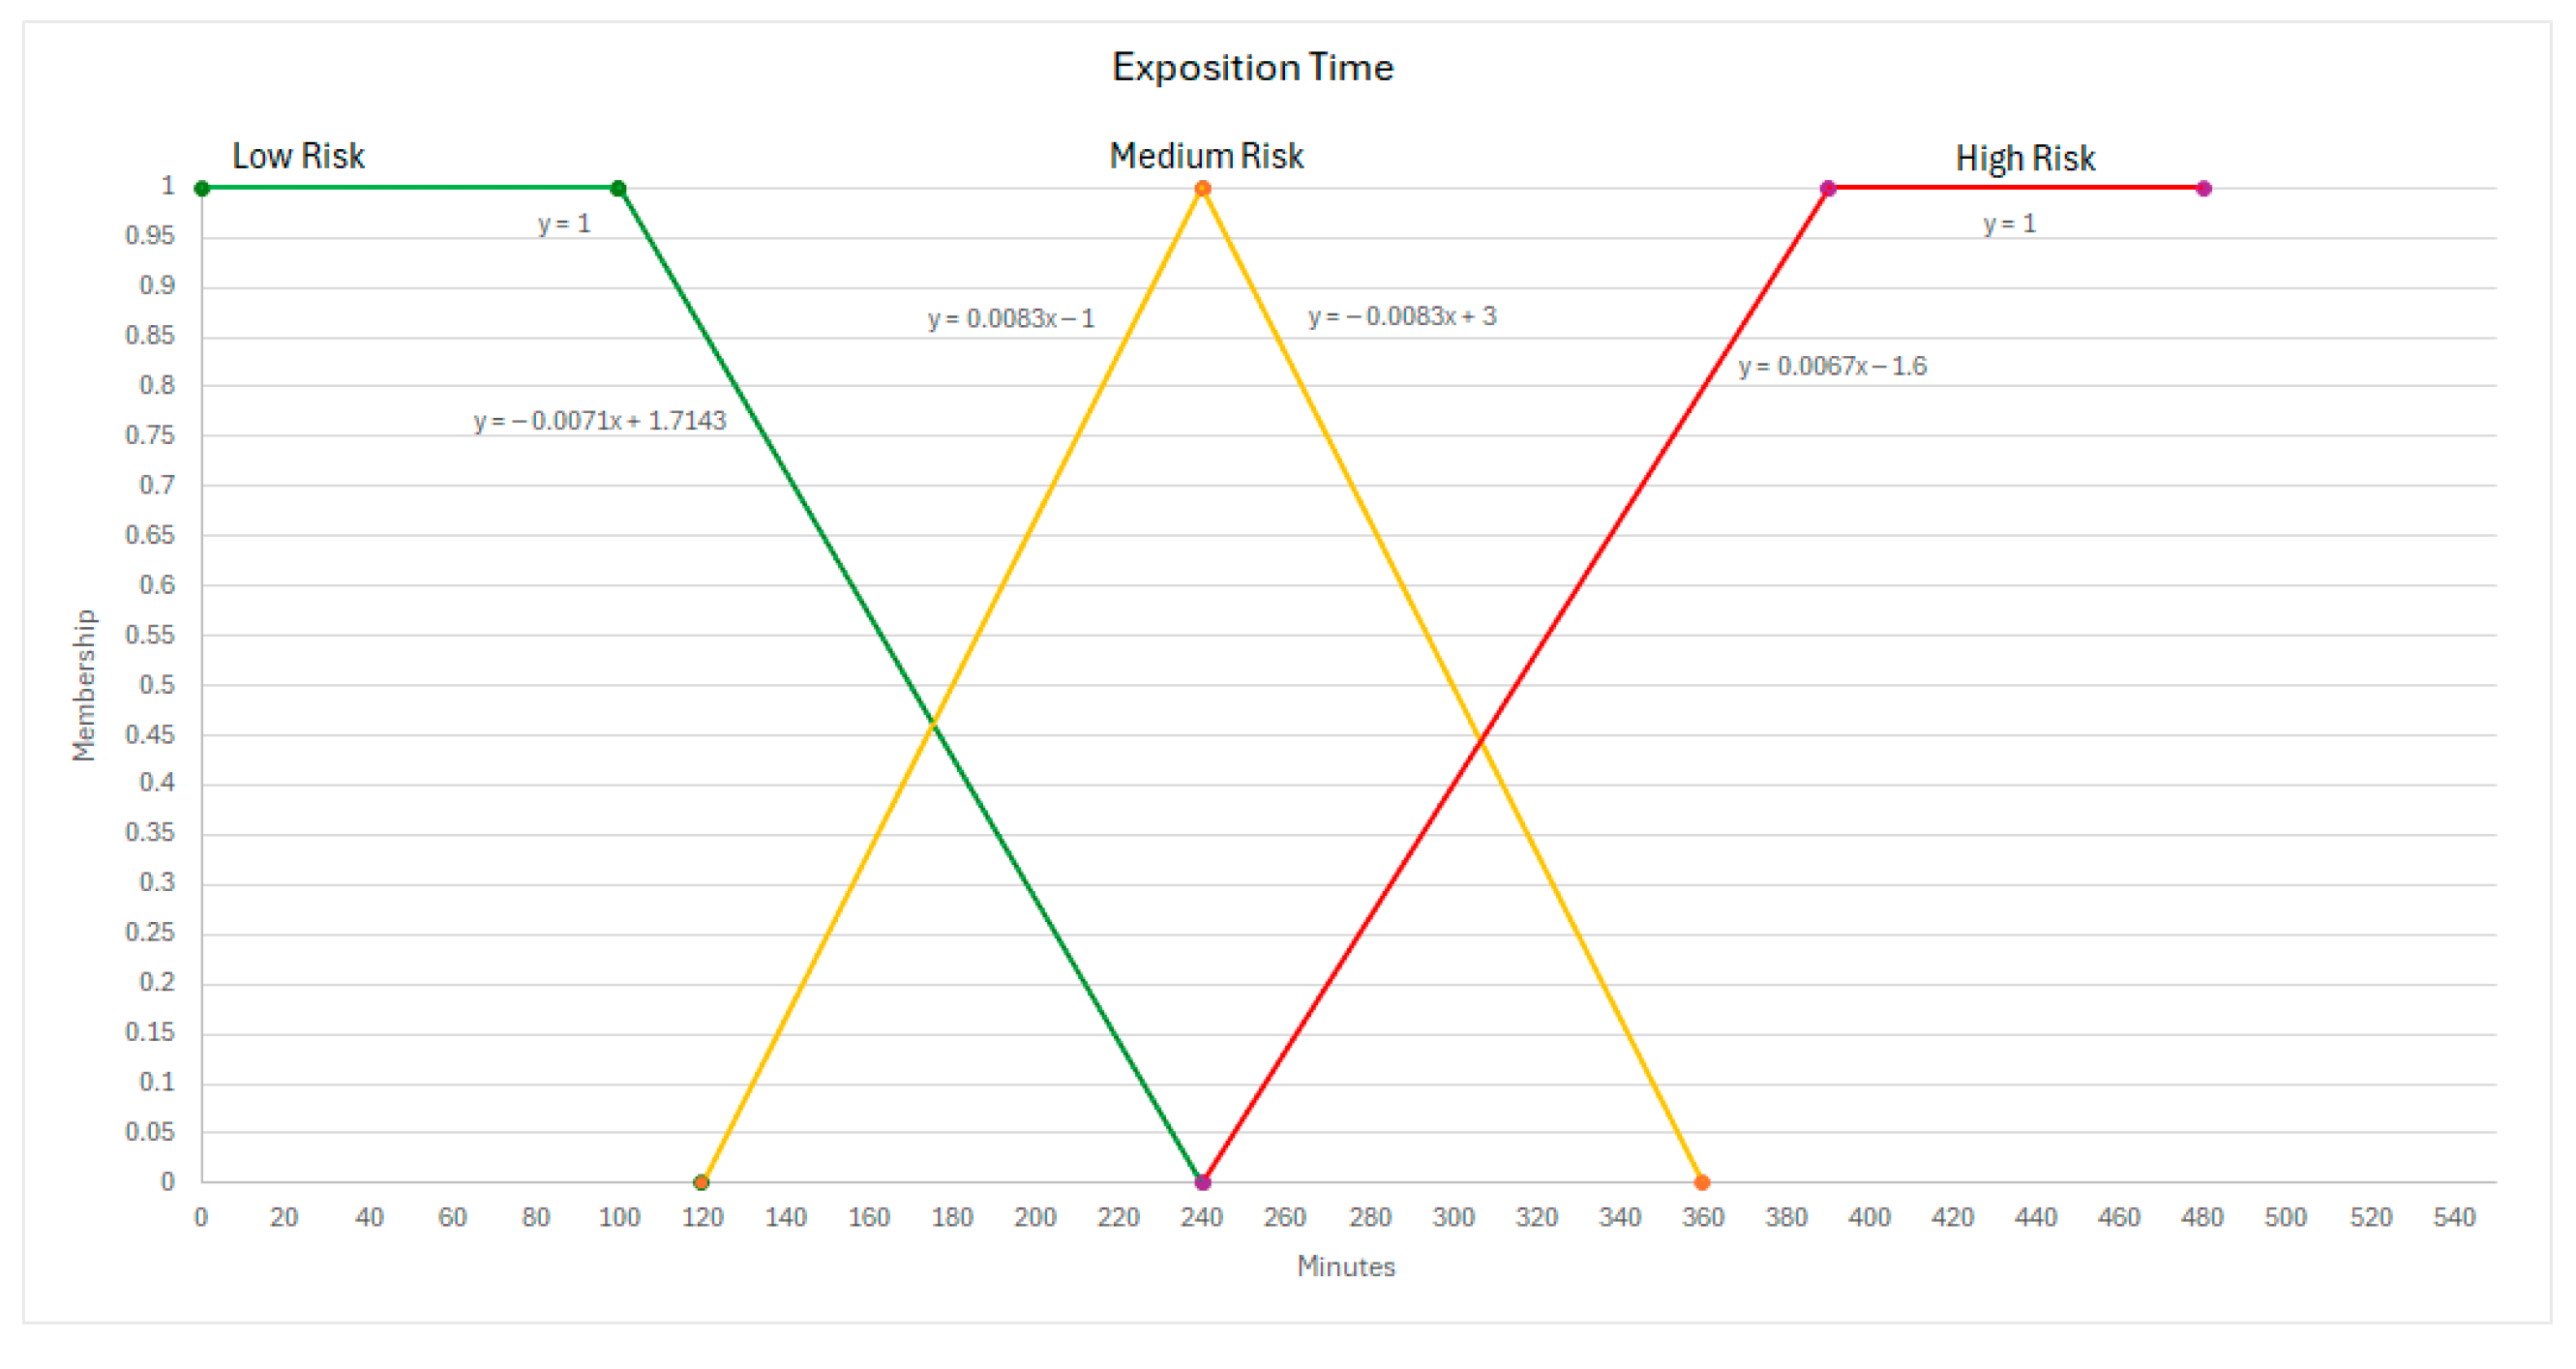
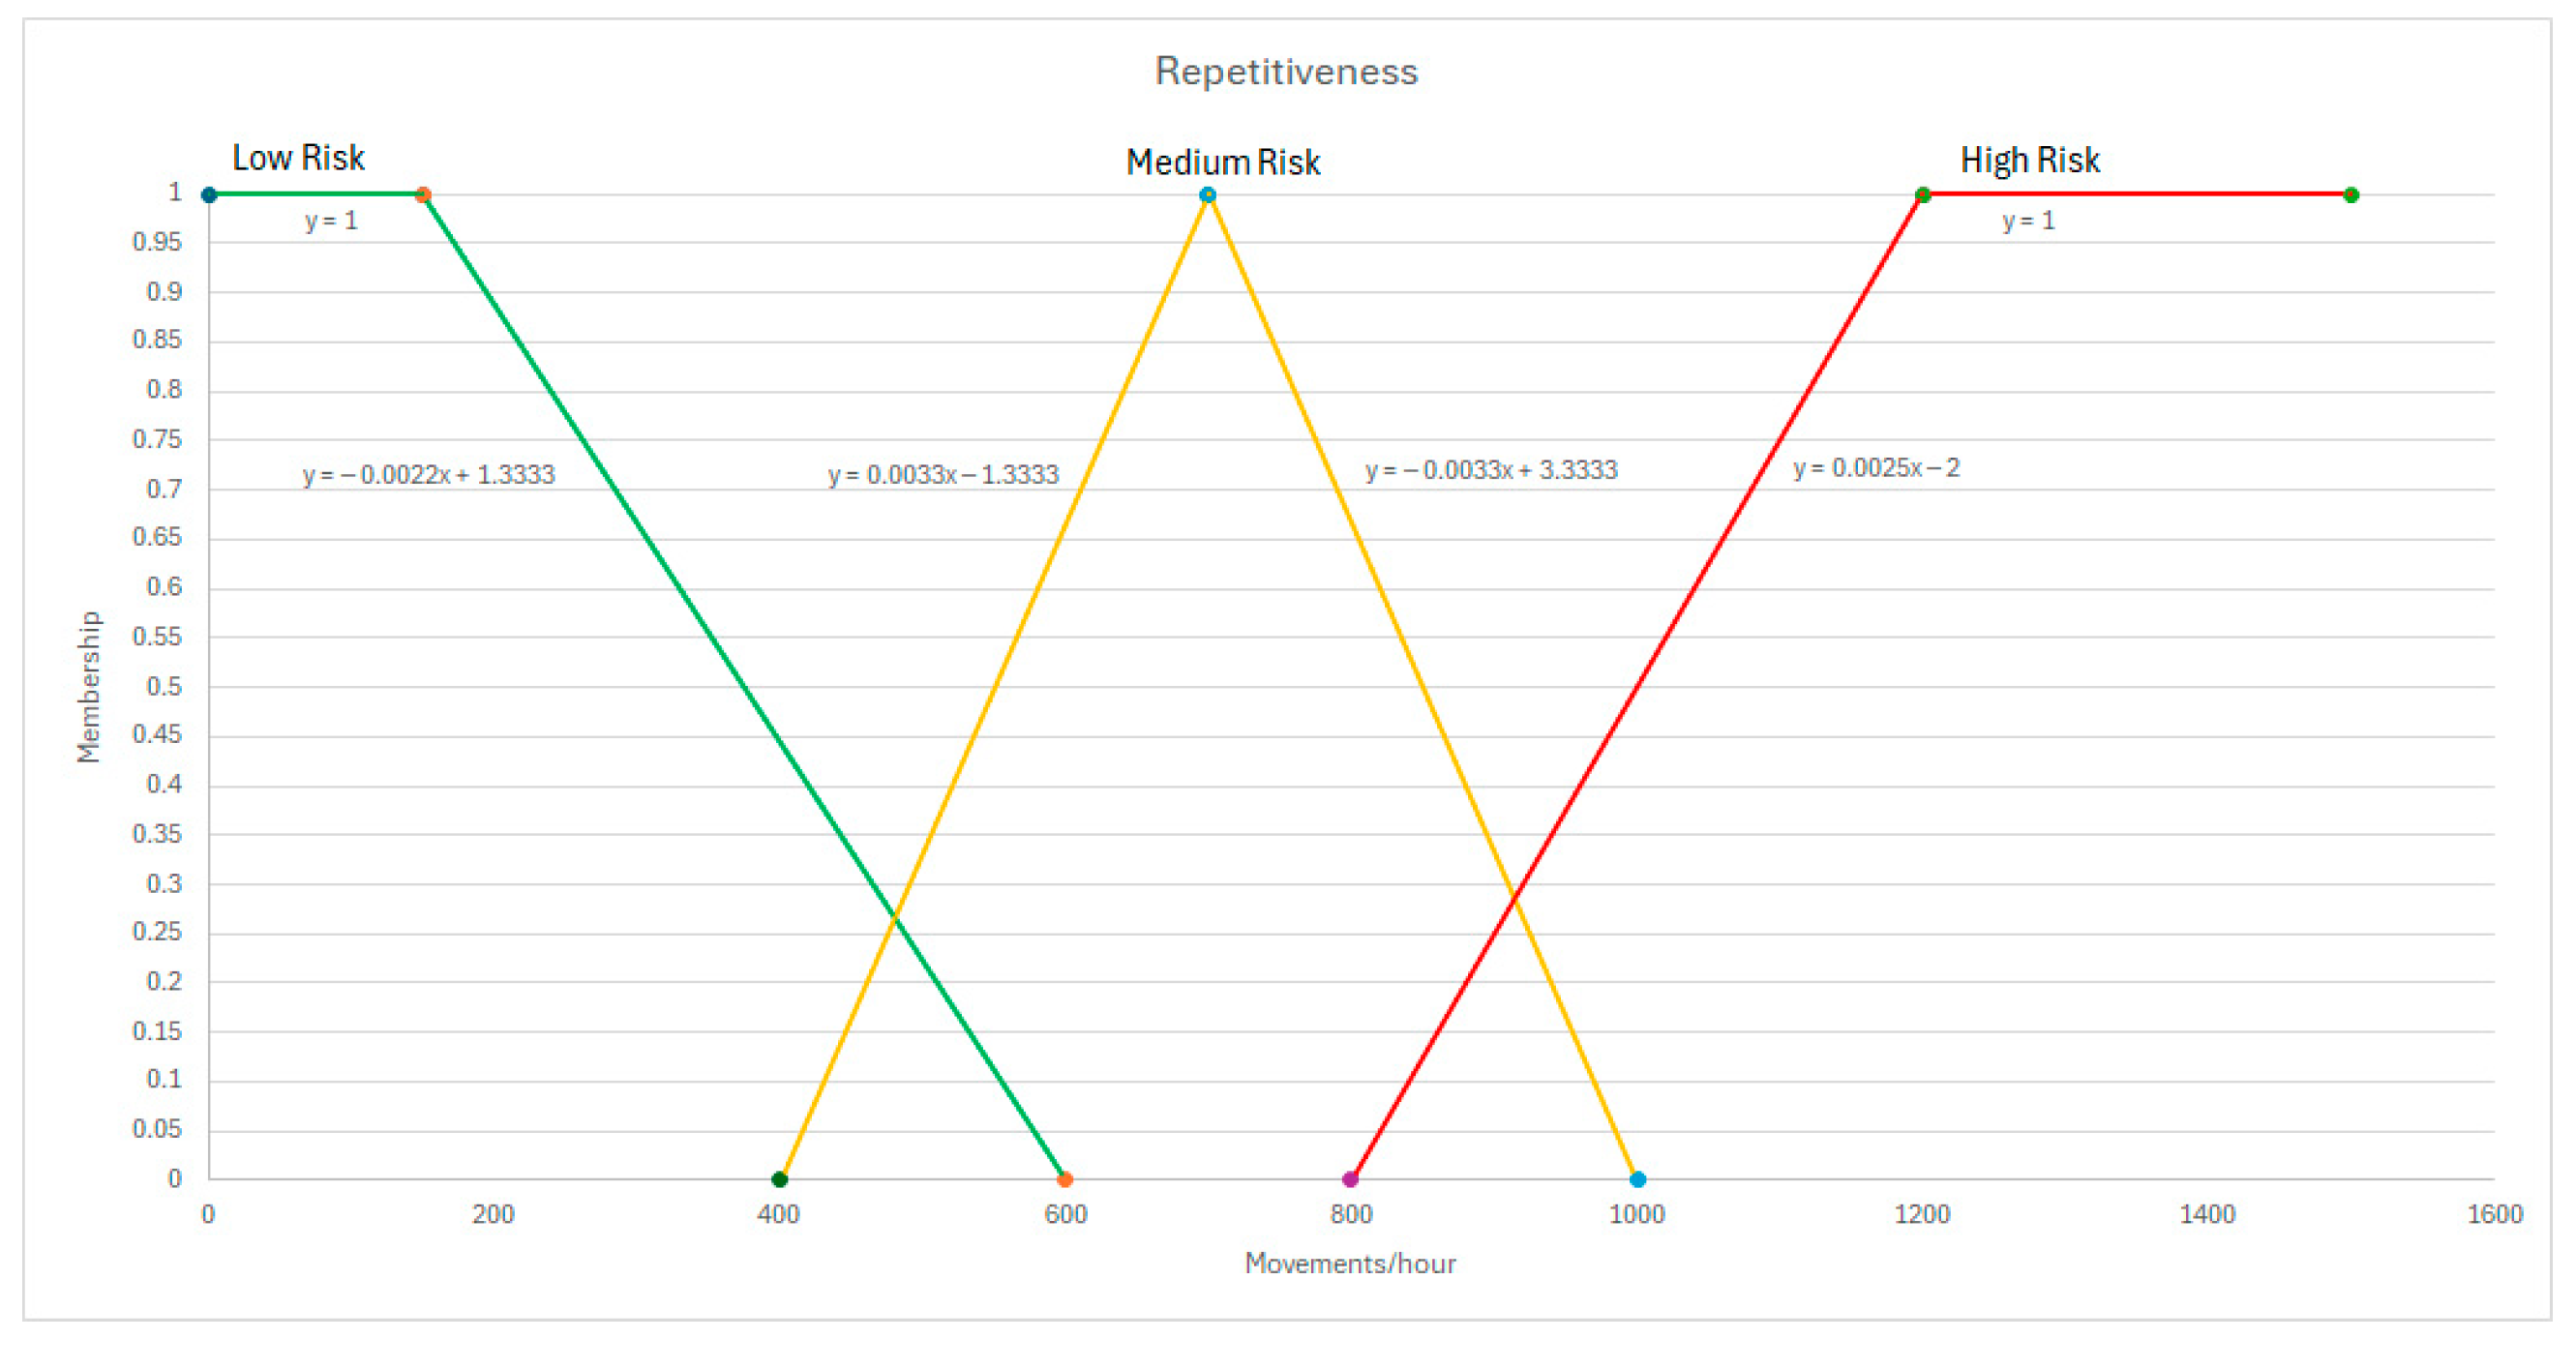
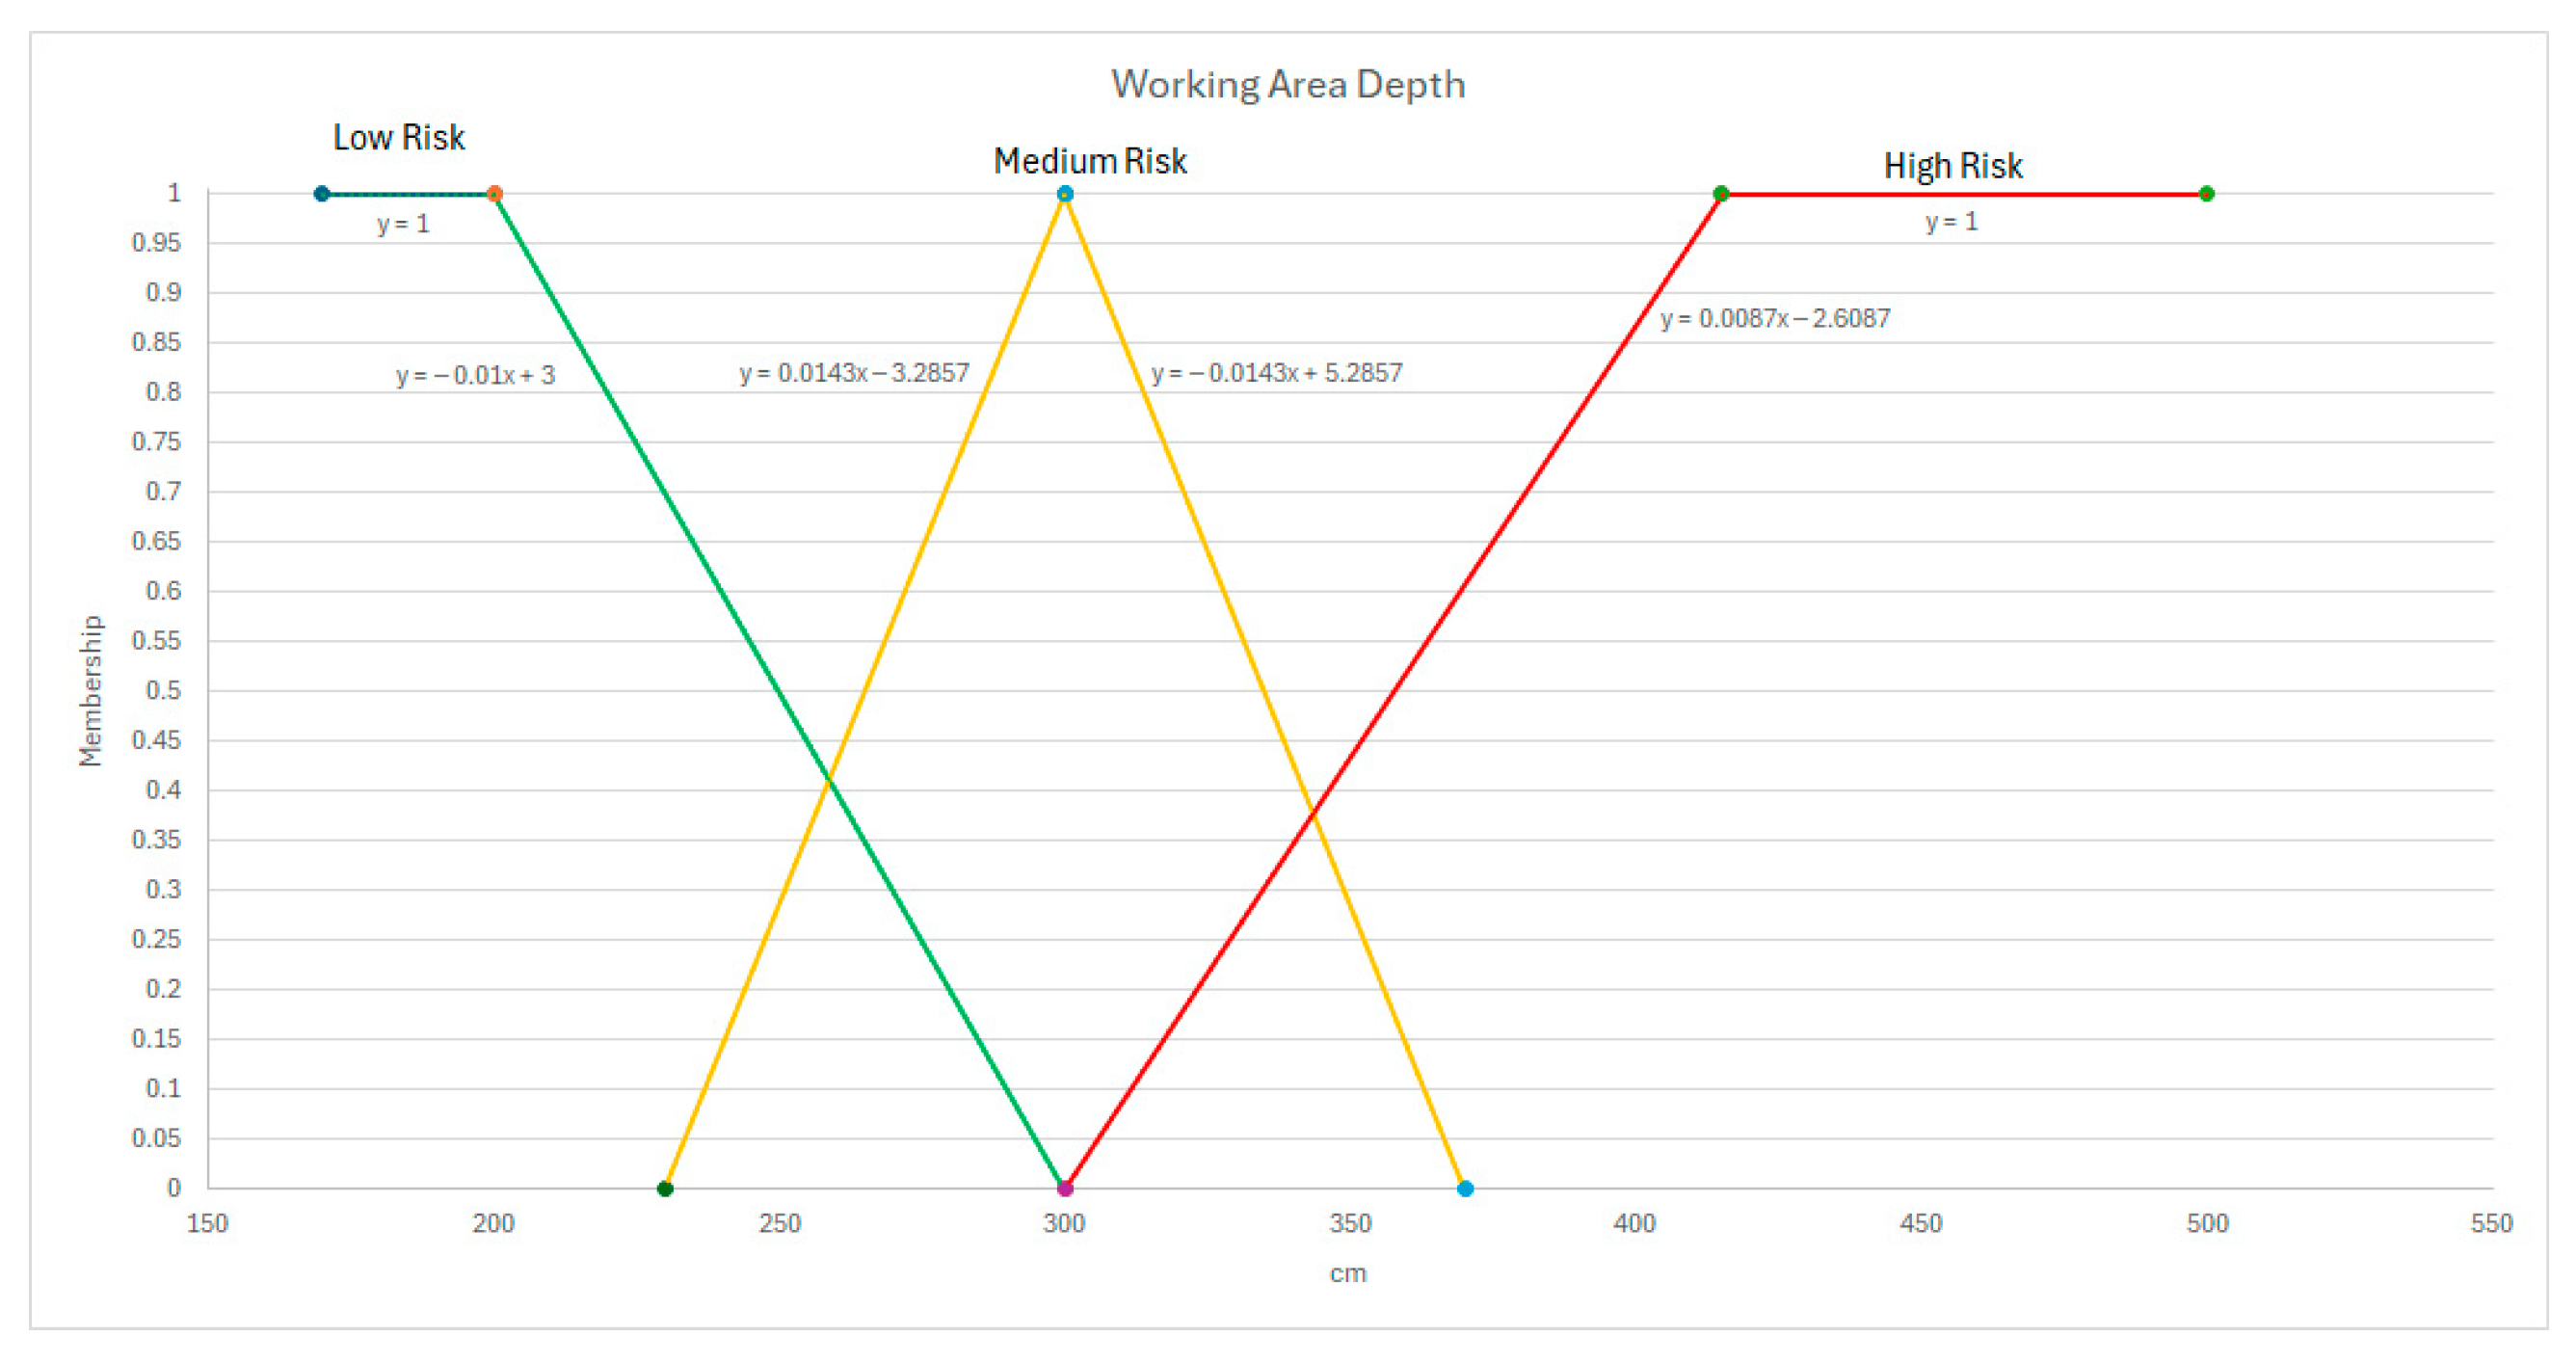
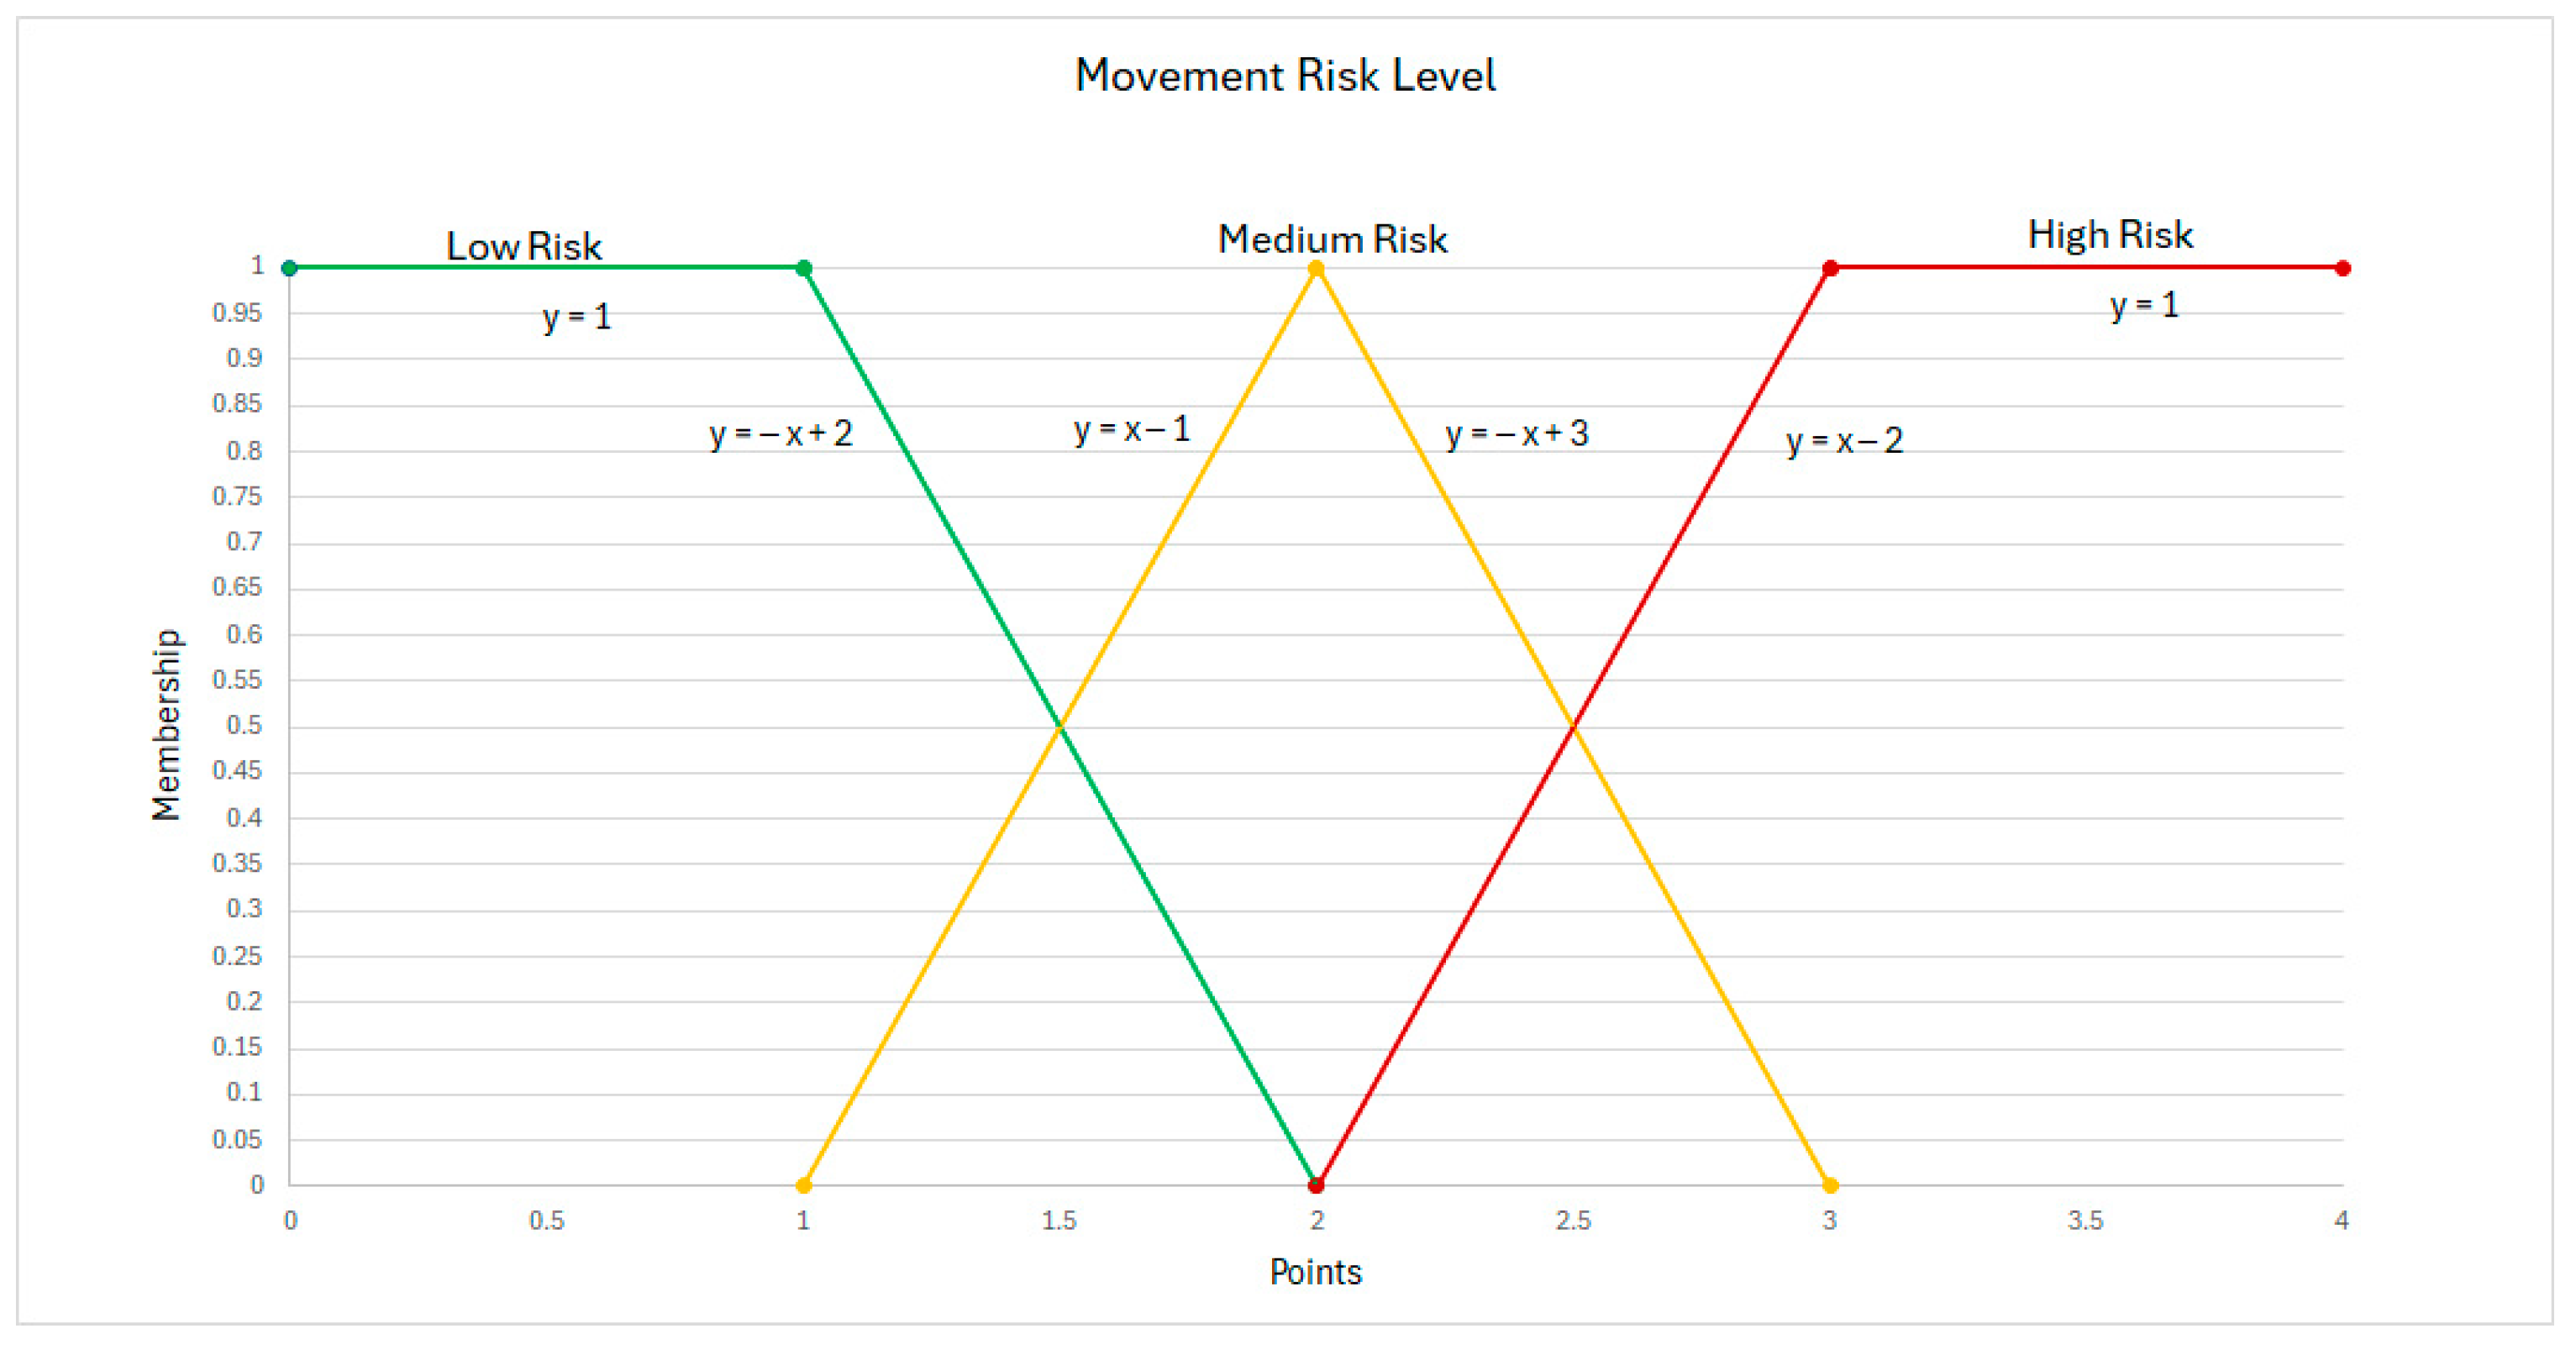
Membership Functions and Graphics
Fuzzy Operations
- The subset θ is part of two fuzzy subsets; it is contained in MF and AF. The results of moment and force depend on θ. As a result, the subsets MF and AF have a conditional relationship with θ defined as follows:
- Considering the phrases maximising productivity and minimising risk level, from a fuzzy logic perspective, one needs to emphasise the members of the subset ET, R, and D and de-emphasise MF and AF to do these two definitions are presented:
- The intersection of the three fuzzy subsets, for example, MF, AF and θ, is a new subset containing all the risk levels that are members of three sets, and the interpretation is the same for the other intersections expressed as
2.3.3. Rules Definition
2.3.4. Defuzzification
3. Results
- The global reference frame was defined in a two-dimensional plane (2D), specifically regarding the horizontal plane (x-axis) of flexion motion and the frontal plane when the hand reaches for an object (see Appendix D).
- The anthropometric data were collected using information from 123 female workers (see Table A2 in Appendix C). The segment fractions as a percentage of H and BMI were taken from [42,43], as shown in Table A1.
- The DSS result represents the risk level from the intersection between the productivity, biomechanic, and anthropometric sets, as defined in Equation (21). It considers the concentration operation (Equations (10)–(12)) of the elements in the productivity set and the dilution operation (Equations (13) and (14)) of the biomechanical set.
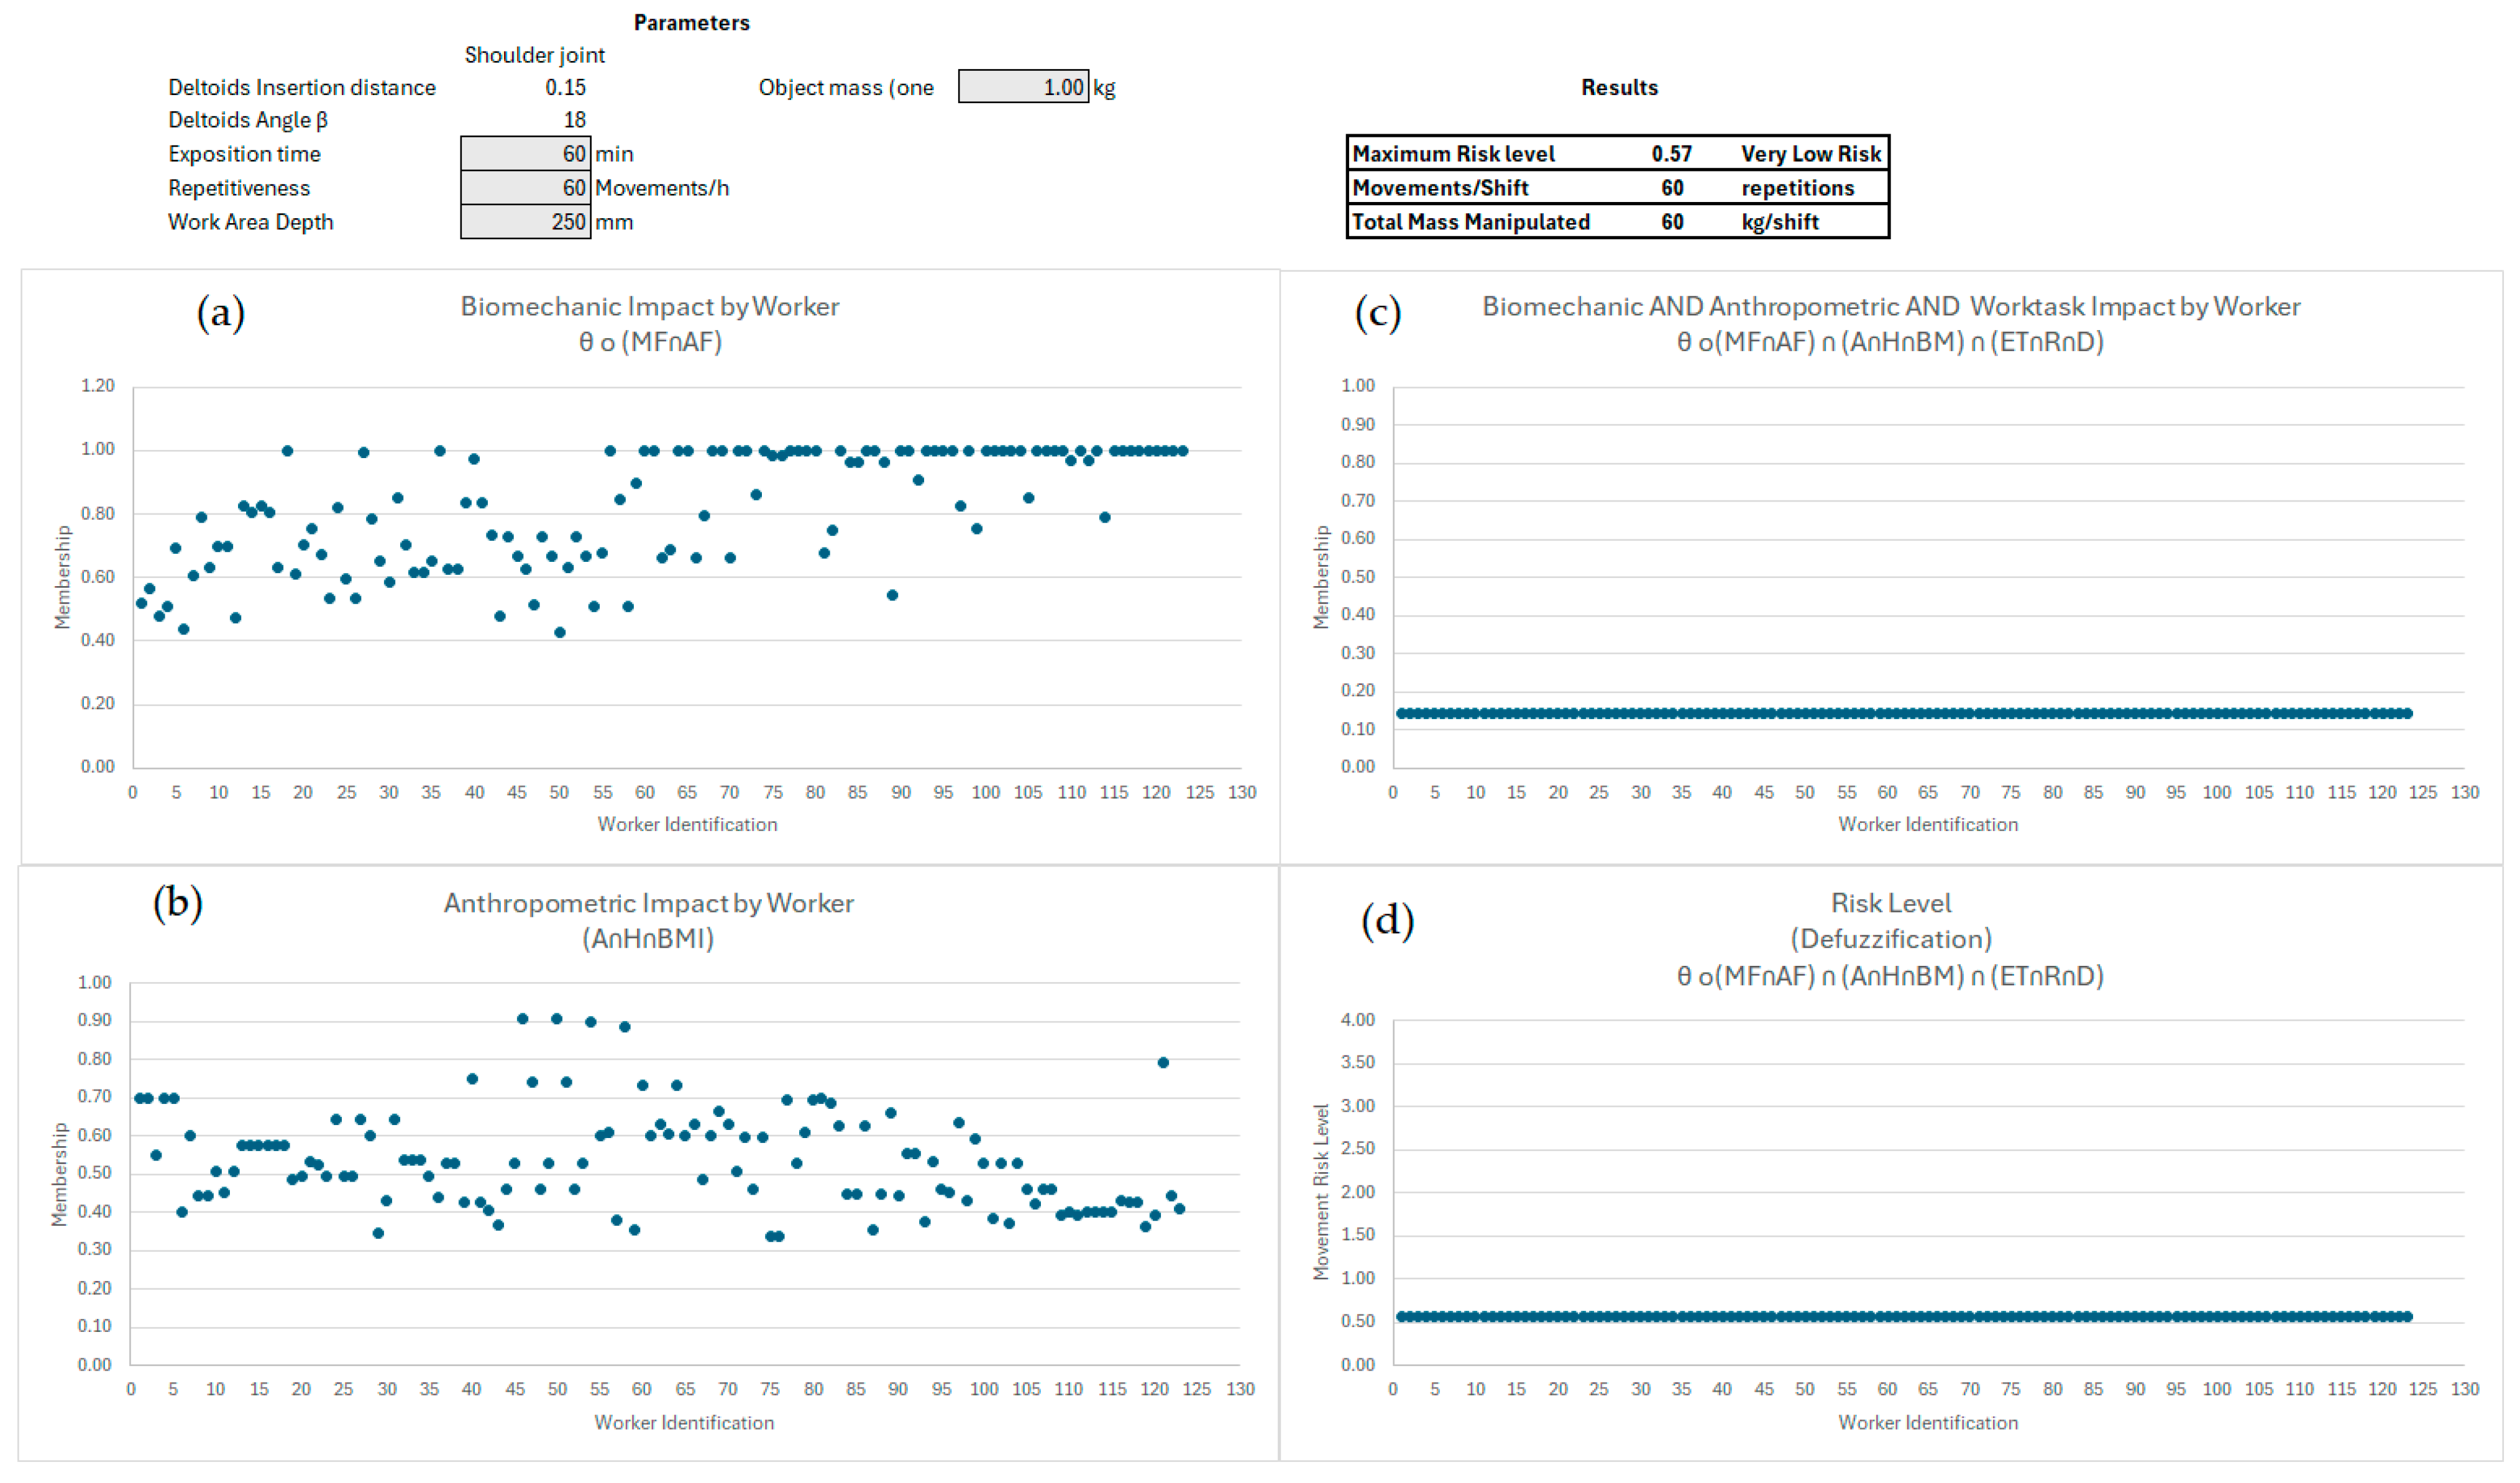
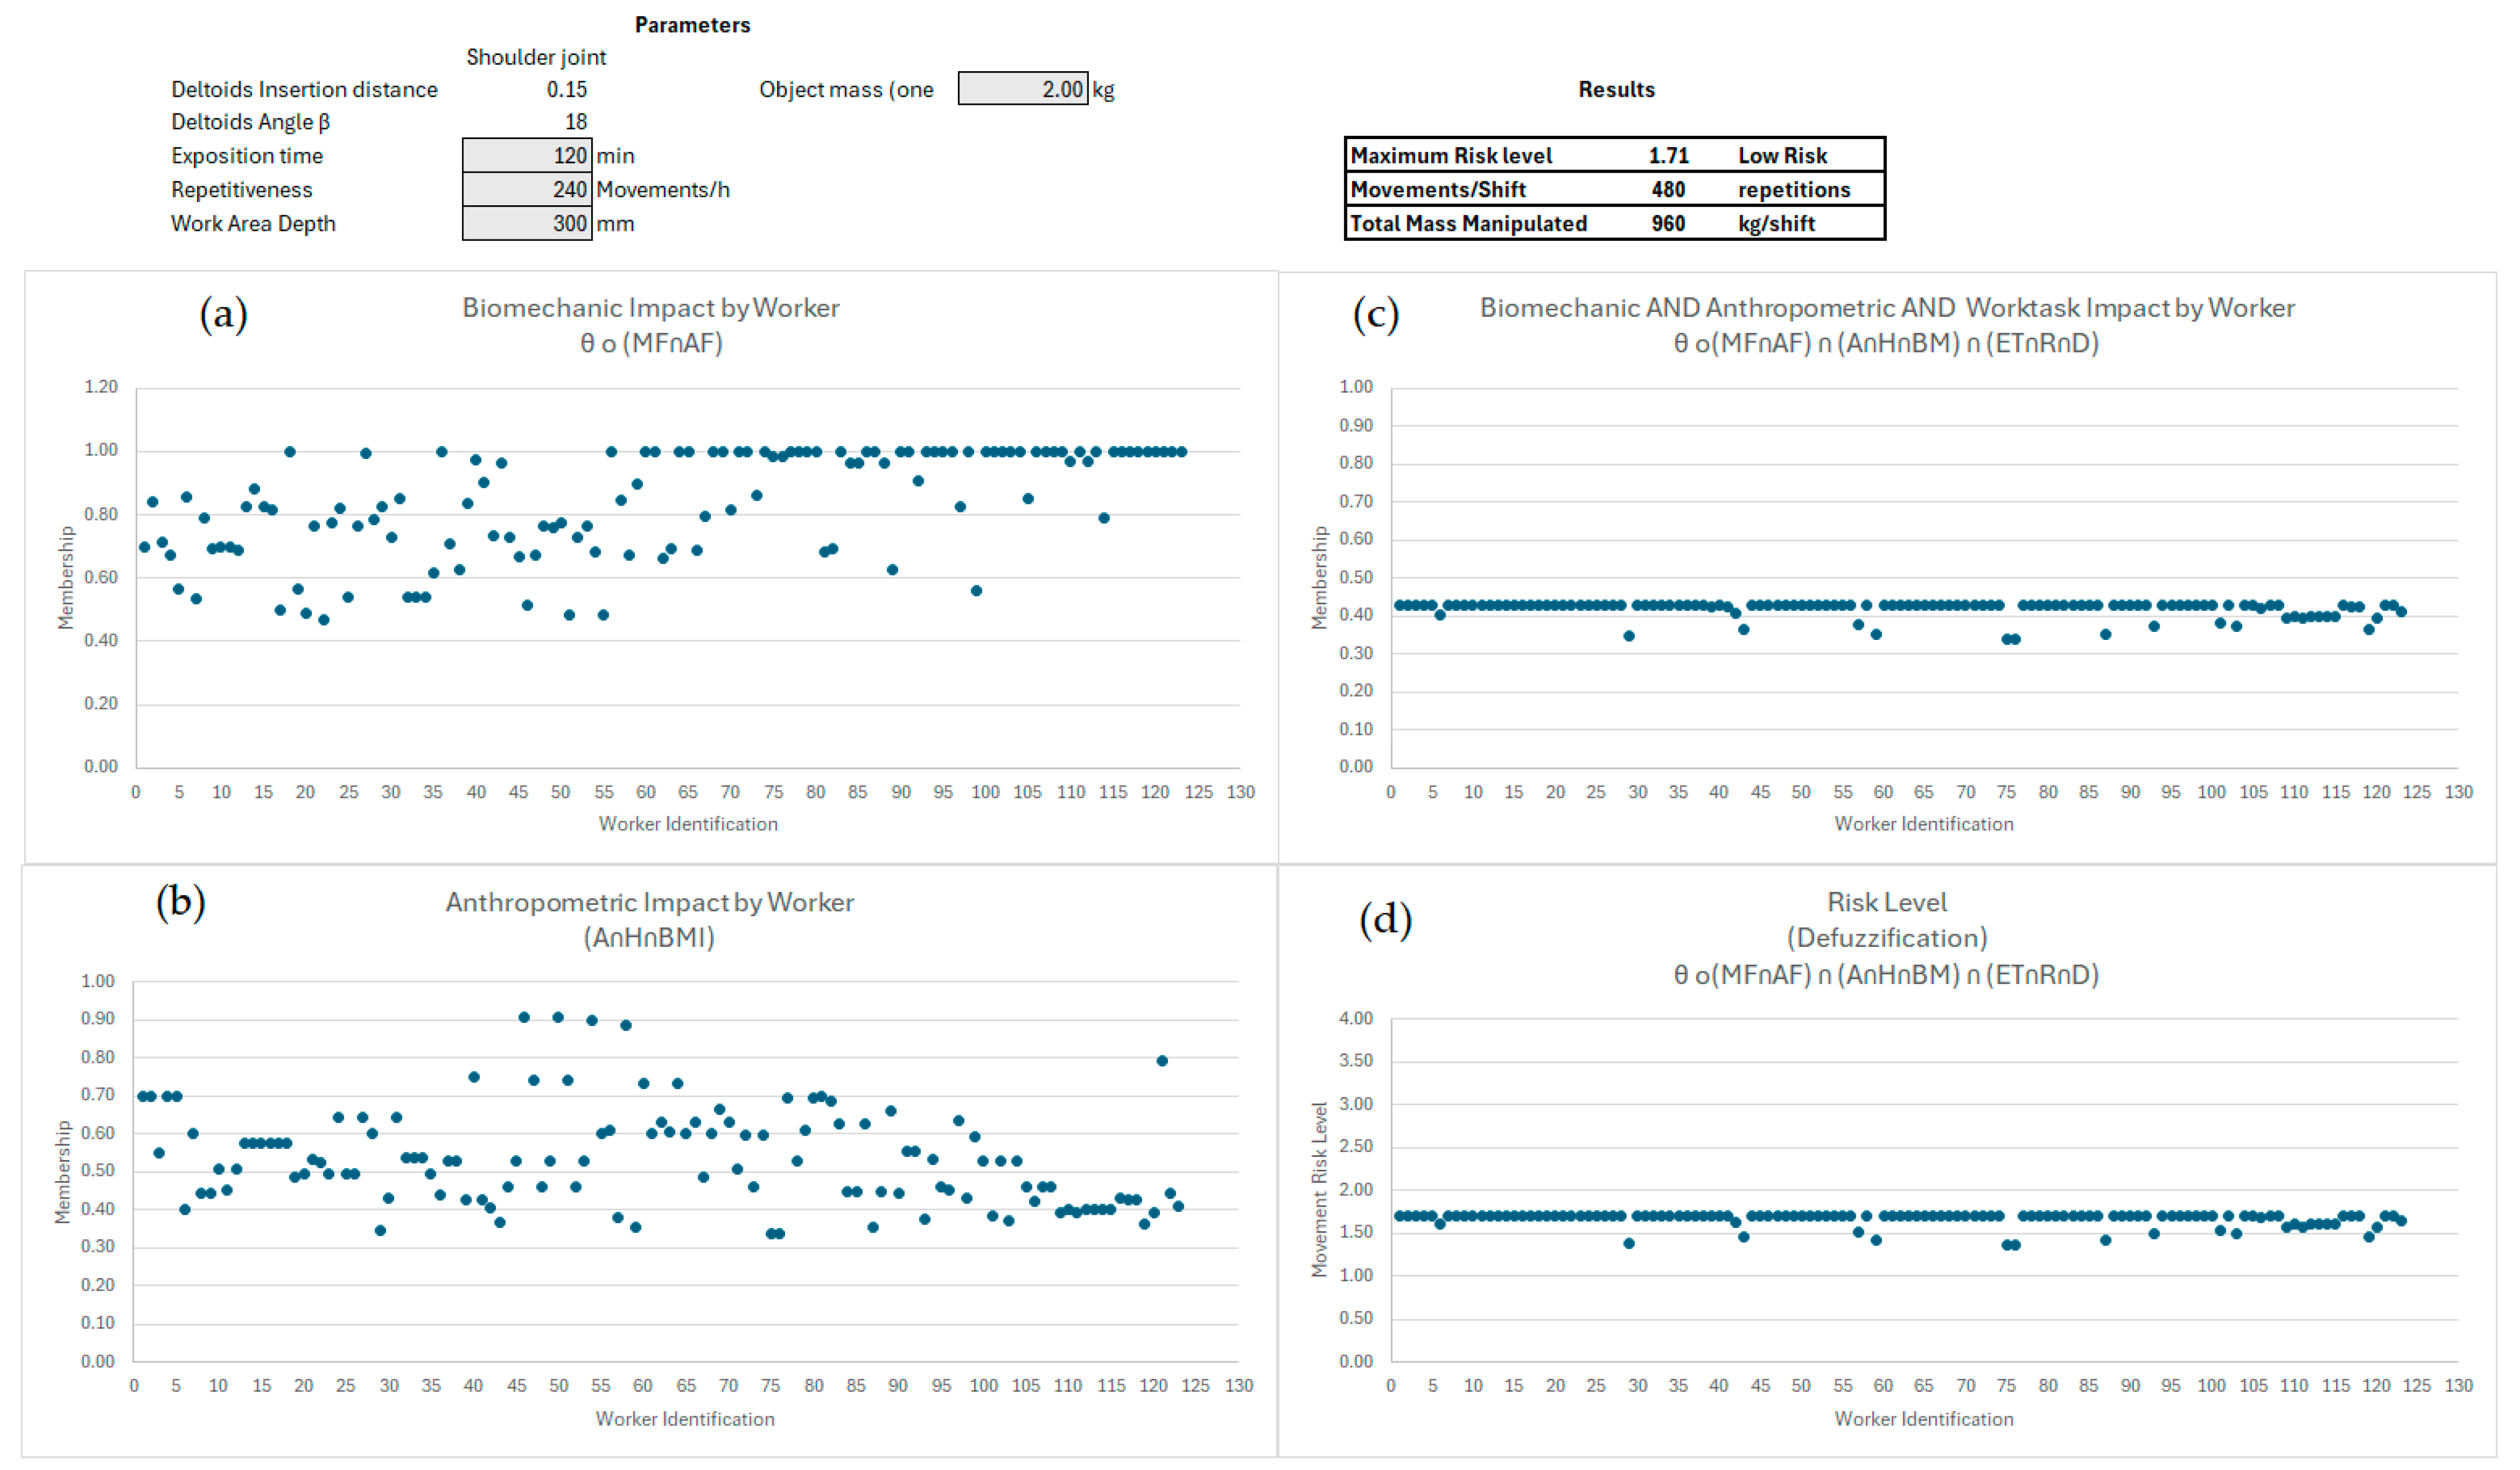
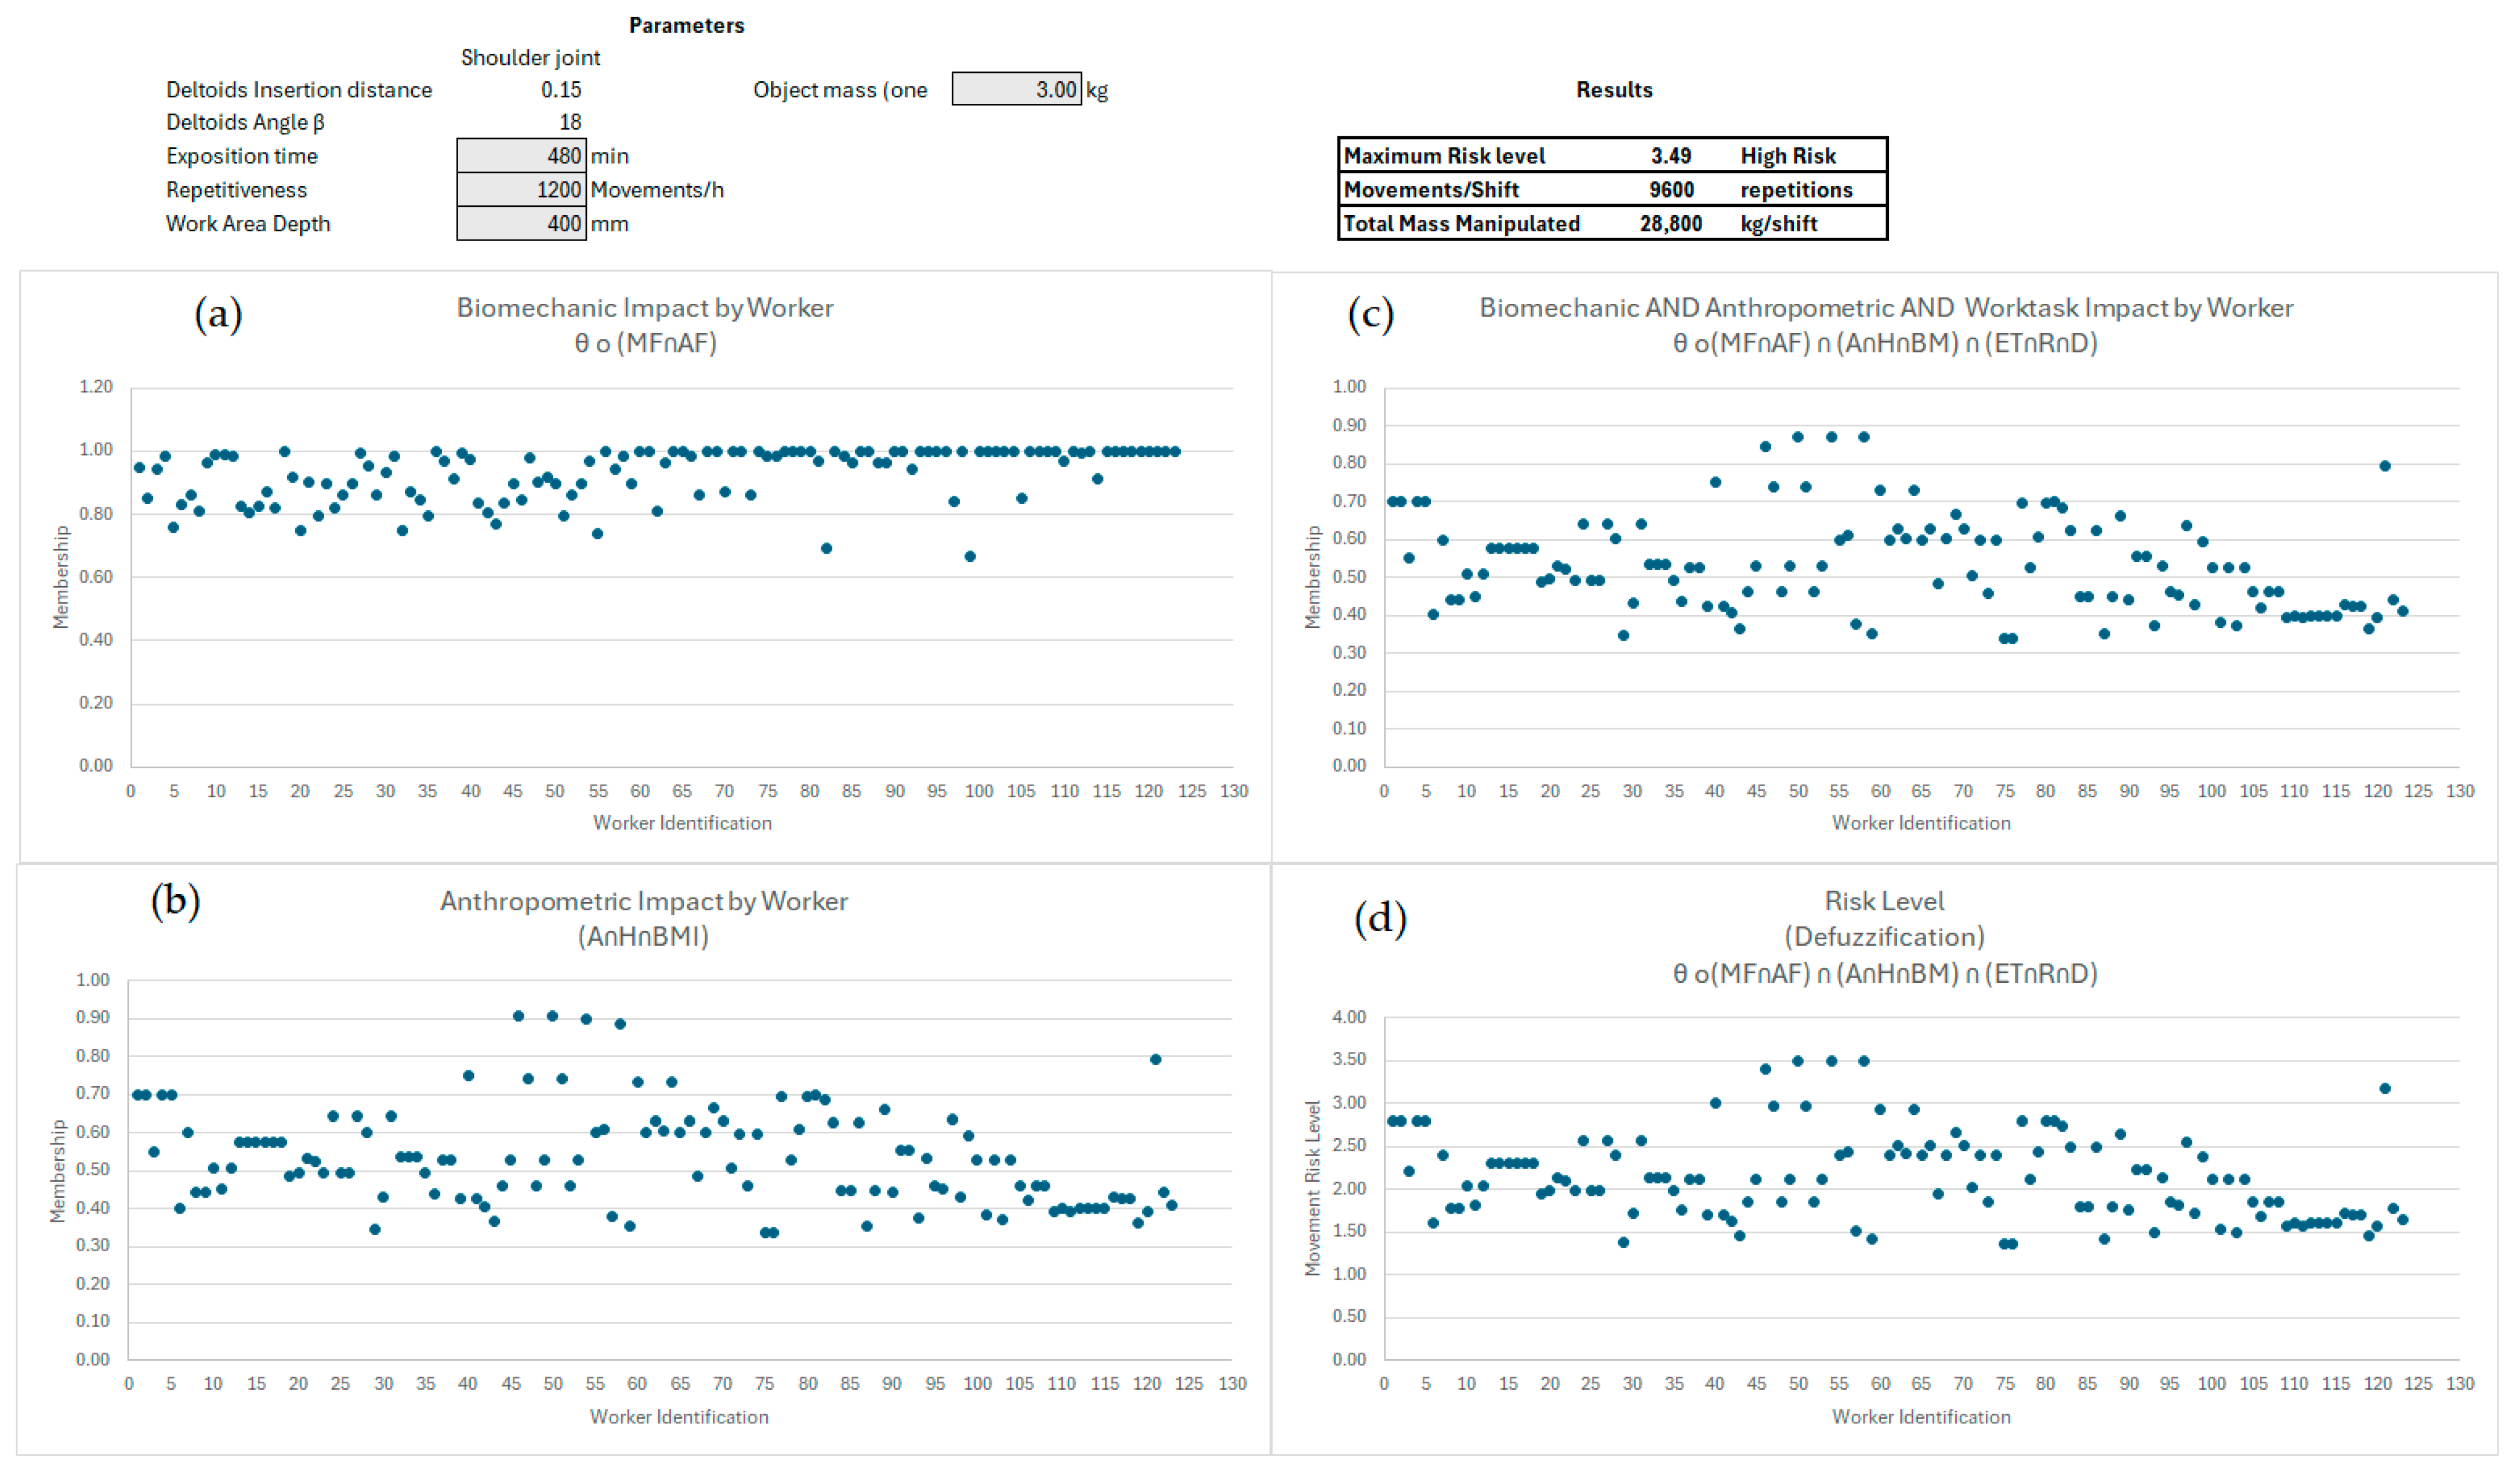
- The work task is limited to handling low loads at high frequency with a maximum mass manipulated of 3 kg.
- Anthropometrics
- Age: between 18 to 20 years old, low risk, 6.5%; between 21 to 45 years old, medium risk, 69%; and between 46 to 65 years old, high risk, 24.5%.
- Height: between 1.40 m to 1.50 m, high risk, 25%, and between 1.41 m to 1.70 m, medium risk, 75%.
- BMI: between 18 kg/m2 to 25 kg/m2, low risk, 48%; between 26 kg/m2 to 35 kg/m2, medium risk, 51%; and 36 kg/m2 to 60 kg/m2, high risk, 1%.
- Biomechanics
- Age: between 18 to 20 years old, low risk, 6.5%; between 21 to 45 years old, medium risk, 69%; and between 46 to 65 years old, high risk, 24.5%.
- Height: between 1.40 m to 1.50 m, high risk, 25%, and between 1.41 m to 1.70 m, medium risk, 75%.
- Productivity: Thirty-three tests were conducted (see Table 5) on 123 workers, combining the characteristics of nine linguistic variables to simulate various working conditions, resulting in a total of 4059 combinations, with the following results:
- Very low risk: 369 results representing 9%.
- Low risk: 1599 results representing 39.4%.
- Medium risk: 1230 results representing 30.4%.
- High risk: 861 results representing 21.2%.
4. Discussion
- Improving work tasks enables the establishment of minimum, average, and maximum parameters within which these tasks can be performed without risking musculoskeletal disorders.
- Taking anthropometric and biomechanic risks into account allows for the redesign of work areas based on the characteristics of the users.
- From a social responsibility standpoint, understanding body mass index (BMI) can help generate internal policies that promote healthy eating among employees.
5. Conclusions
Funding
Institutional Review Board Statement
Informed Consent Statement
Data Availability Statement
Acknowledgments
Conflicts of Interest
Abbreviations
| A | Age |
| AF | Applied force |
| BMI | Body Mass Index |
| DSS | Decision Support System |
| D | Working area depth |
| ET | Exposition time |
| H | Workers’ height |
| HRL | High-risk level |
| LRL | Low-risk level |
| MF | Moment force |
| MRL | Medium risk level |
| MV | Arm movement |
| R | Movement repetitiveness |
| RL | Risk level |
| θ | Angle relative to the trunk |
| ∩ | Intersection of sets |
| Composition | |
| Containment |
Appendix A. Linguistic Variables by Subset
Appendix B. Membership Equations

Appendix C. Anthropometrics
- Age (A).
- Gender (G).
- Height (H).
- Shoulder height (SH).
- Total body mass (TBM).
- Segment Length (SL).
- Upper arm length (UAL).
- Forearm length (FAL).
- Hand length (HnL).

| Description | Upper Arm Glenohumeral Axis/Elbow Axis | Forearm -Elbow Axis/Ulnar Styloid | Hand Wrist Axis/Knuckle II Middle Finger |
|---|---|---|---|
| Segment Mass (SM)/Total Body Mass (TBM) | 0.028 | 0.016 | 0.006 |
| Centre of Mass (CoM)—Segment Length-Proximal | 0.436 | 0.43 | 0.506 |
| No | H (m) | SH (m) | TBM (kg) | UAL (m) | FAL (m) | HdL (m) | No | H (m) | SH (m) | TBM (kg) | UAL (m) | FAL (m) | HdL (m) |
|---|---|---|---|---|---|---|---|---|---|---|---|---|---|
| 1 | 1.60 | 1.31 | 53.2 | 0.298 | 0.234 | 0.173 | 62 | 1.59 | 1.30 | 71.1 | 0.296 | 0.232 | 0.172 |
| 2 | 1.43 | 1.17 | 58.3 | 0.266 | 0.209 | 0.154 | 63 | 1.54 | 1.26 | 58.6 | 0.286 | 0.225 | 0.166 |
| 3 | 1.53 | 1.25 | 57.9 | 0.285 | 0.223 | 0.165 | 64 | 1.49 | 1.22 | 64.9 | 0.277 | 0.218 | 0.161 |
| 4 | 1.54 | 1.26 | 60.2 | 0.286 | 0.225 | 0.166 | 65 | 1.64 | 1.34 | 62.6 | 0.305 | 0.239 | 0.177 |
| 5 | 1.64 | 1.34 | 70.1 | 0.305 | 0.239 | 0.177 | 66 | 1.49 | 1.22 | 64.4 | 0.277 | 0.218 | 0.161 |
| 6 | 1.44 | 1.18 | 56.0 | 0.268 | 0.210 | 0.156 | 67 | 1.59 | 1.30 | 66.9 | 0.296 | 0.232 | 0.172 |
| 7 | 1.57 | 1.28 | 69.0 | 0.292 | 0.229 | 0.170 | 68 | 1.54 | 1.26 | 46.8 | 0.286 | 0.225 | 0.166 |
| 8 | 1.59 | 1.30 | 71.1 | 0.296 | 0.232 | 0.172 | 69 | 1.62 | 1.33 | 78.7 | 0.301 | 0.237 | 0.175 |
| 9 | 1.54 | 1.26 | 58.6 | 0.286 | 0.225 | 0.166 | 70 | 1.43 | 1.17 | 60.1 | 0.266 | 0.209 | 0.154 |
| 10 | 1.49 | 1.22 | 64.9 | 0.277 | 0.218 | 0.161 | 71 | 1.58 | 1.29 | 71.1 | 0.294 | 0.231 | 0.171 |
| 11 | 1.64 | 1.34 | 62.6 | 0.305 | 0.239 | 0.177 | 72 | 1.59 | 1.30 | 64.5 | 0.296 | 0.232 | 0.172 |
| 12 | 1.49 | 1.22 | 64.4 | 0.277 | 0.218 | 0.161 | 73 | 1.68 | 1.37 | 62.3 | 0.312 | 0.245 | 0.181 |
| 13 | 1.65 | 1.35 | 70.8 | 0.307 | 0.241 | 0.178 | 74 | 1.49 | 1.22 | 52.3 | 0.277 | 0.218 | 0.161 |
| 14 | 1.54 | 1.26 | 46.8 | 0.286 | 0.225 | 0.166 | 75 | 1.51 | 1.24 | 56.2 | 0.281 | 0.220 | 0.163 |
| 15 | 1.62 | 1.33 | 78.7 | 0.301 | 0.237 | 0.175 | 76 | 1.56 | 1.28 | 61.2 | 0.290 | 0.228 | 0.168 |
| 16 | 1.43 | 1.17 | 60.1 | 0.266 | 0.209 | 0.154 | 77 | 1.5 | 1.23 | 56.4 | 0.279 | 0.219 | 0.162 |
| 17 | 1.58 | 1.29 | 71.1 | 0.294 | 0.231 | 0.171 | 78 | 1.56 | 1.28 | 75.5 | 0.290 | 0.228 | 0.168 |
| 18 | 1.59 | 1.30 | 64.5 | 0.296 | 0.232 | 0.172 | 79 | 1.56 | 1.28 | 69.6 | 0.290 | 0.228 | 0.168 |
| 19 | 1.63 | 1.33 | 60.0 | 0.303 | 0.238 | 0.176 | 80 | 1.54 | 1.26 | 53.6 | 0.286 | 0.225 | 0.166 |
| 20 | 1.65 | 1.35 | 70.0 | 0.307 | 0.241 | 0.178 | 81 | 1.56 | 1.28 | 57.7 | 0.290 | 0.228 | 0.168 |
| 21 | 1.51 | 1.24 | 56.2 | 0.281 | 0.220 | 0.163 | 82 | 1.68 | 1.37 | 72.2 | 0.312 | 0.245 | 0.181 |
| 22 | 1.63 | 1.33 | 68.5 | 0.303 | 0.238 | 0.176 | 83 | 1.49 | 1.22 | 80.7 | 0.277 | 0.218 | 0.161 |
| 23 | 1.5 | 1.23 | 56.4 | 0.279 | 0.219 | 0.162 | 84 | 1.53 | 1.25 | 63.5 | 0.285 | 0.223 | 0.165 |
| 24 | 1.56 | 1.28 | 75.5 | 0.290 | 0.228 | 0.168 | 85 | 1.66 | 1.36 | 73.9 | 0.309 | 0.242 | 0.179 |
| 25 | 1.56 | 1.28 | 69.6 | 0.290 | 0.228 | 0.168 | 86 | 1.53 | 1.25 | 67.3 | 0.285 | 0.223 | 0.165 |
| 26 | 1.54 | 1.26 | 53.6 | 0.286 | 0.225 | 0.166 | 87 | 1.55 | 1.27 | 67.4 | 0.288 | 0.226 | 0.167 |
| 27 | 1.56 | 1.28 | 57.7 | 0.290 | 0.228 | 0.168 | 88 | 1.6 | 1.31 | 65.0 | 0.298 | 0.234 | 0.173 |
| 28 | 1.61 | 1.32 | 53.2 | 0.299 | 0.235 | 0.174 | 89 | 1.55 | 1.27 | 63.0 | 0.288 | 0.226 | 0.167 |
| 29 | 1.44 | 1.18 | 58.3 | 0.268 | 0.210 | 0.156 | 90 | 1.57 | 1.28 | 65.8 | 0.292 | 0.229 | 0.170 |
| 30 | 1.52 | 1.24 | 57.9 | 0.283 | 0.222 | 0.164 | 91 | 1.5 | 1.23 | 69.2 | 0.279 | 0.219 | 0.162 |
| 31 | 1.54 | 1.26 | 60.2 | 0.286 | 0.225 | 0.166 | 92 | 1.48 | 1.21 | 61.8 | 0.275 | 0.216 | 0.160 |
| 32 | 1.65 | 1.35 | 70.1 | 0.307 | 0.241 | 0.178 | 93 | 1.48 | 1.21 | 59.7 | 0.275 | 0.216 | 0.160 |
| 33 | 1.6 | 1.31 | 65.5 | 0.298 | 0.234 | 0.173 | 94 | 1.56 | 1.28 | 67.0 | 0.290 | 0.228 | 0.168 |
| 34 | 1.58 | 1.29 | 69.0 | 0.294 | 0.231 | 0.171 | 95 | 1.49 | 1.22 | 60.9 | 0.277 | 0.218 | 0.161 |
| 35 | 1.6 | 1.31 | 71.1 | 0.298 | 0.234 | 0.173 | 96 | 1.5 | 1.23 | 63.4 | 0.279 | 0.219 | 0.162 |
| 36 | 1.54 | 1.26 | 58.6 | 0.286 | 0.225 | 0.166 | 97 | 1.52 | 1.24 | 75.8 | 0.283 | 0.222 | 0.164 |
| 37 | 1.47 | 1.20 | 64.9 | 0.273 | 0.215 | 0.159 | 98 | 1.53 | 1.25 | 63.5 | 0.285 | 0.223 | 0.165 |
| 38 | 1.6 | 1.31 | 62.6 | 0.298 | 0.234 | 0.173 | 99 | 1.67 | 1.37 | 75.2 | 0.311 | 0.244 | 0.180 |
| 39 | 1.5 | 1.23 | 64.4 | 0.279 | 0.219 | 0.162 | 100 | 1.53 | 1.25 | 60.7 | 0.285 | 0.223 | 0.165 |
| 40 | 1.57 | 1.28 | 62.6 | 0.292 | 0.229 | 0.170 | 101 | 1.6 | 1.31 | 65.2 | 0.298 | 0.234 | 0.173 |
| 41 | 1.54 | 1.26 | 45.7 | 0.286 | 0.225 | 0.166 | 102 | 1.6 | 1.31 | 60.5 | 0.298 | 0.234 | 0.173 |
| 42 | 1.62 | 1.33 | 68.7 | 0.301 | 0.237 | 0.175 | 103 | 1.58 | 1.29 | 57.4 | 0.294 | 0.231 | 0.171 |
| 43 | 1.43 | 1.17 | 50.1 | 0.266 | 0.209 | 0.154 | 104 | 1.57 | 1.28 | 65.8 | 0.292 | 0.229 | 0.170 |
| 44 | 1.58 | 1.29 | 70.0 | 0.294 | 0.231 | 0.171 | 105 | 1.65 | 1.35 | 70.1 | 0.307 | 0.241 | 0.178 |
| 45 | 1.59 | 1.30 | 64.5 | 0.296 | 0.232 | 0.172 | 106 | 1.48 | 1.21 | 50.9 | 0.275 | 0.216 | 0.160 |
| 46 | 1.6 | 1.31 | 67.2 | 0.298 | 0.234 | 0.173 | 107 | 1.5 | 1.23 | 59.7 | 0.279 | 0.219 | 0.162 |
| 47 | 1.56 | 1.28 | 58.3 | 0.290 | 0.228 | 0.168 | 108 | 1.62 | 1.33 | 70.5 | 0.301 | 0.237 | 0.175 |
| 48 | 1.51 | 1.24 | 56.2 | 0.281 | 0.220 | 0.163 | 109 | 1.49 | 1.22 | 55.6 | 0.277 | 0.218 | 0.161 |
| 49 | 1.47 | 1.20 | 60.3 | 0.273 | 0.215 | 0.159 | 110 | 1.68 | 1.37 | 73.1 | 0.312 | 0.245 | 0.181 |
| 50 | 1.5 | 1.23 | 56.4 | 0.279 | 0.219 | 0.162 | 111 | 1.55 | 1.27 | 50.8 | 0.288 | 0.226 | 0.167 |
| 51 | 1.56 | 1.28 | 75.5 | 0.290 | 0.228 | 0.168 | 112 | 1.53 | 1.25 | 62.8 | 0.285 | 0.223 | 0.165 |
| 52 | 1.56 | 1.28 | 69.6 | 0.290 | 0.228 | 0.168 | 113 | 1.62 | 1.33 | 74.1 | 0.301 | 0.237 | 0.175 |
| 53 | 1.54 | 1.26 | 53.6 | 0.286 | 0.225 | 0.166 | 114 | 1.5 | 1.23 | 57.8 | 0.279 | 0.219 | 0.162 |
| 54 | 1.56 | 1.28 | 57.7 | 0.290 | 0.228 | 0.168 | 115 | 1.49 | 1.22 | 62.9 | 0.277 | 0.218 | 0.161 |
| 55 | 1.6 | 1.31 | 53.2 | 0.298 | 0.234 | 0.173 | 116 | 1.55 | 1.27 | 64.3 | 0.288 | 0.226 | 0.167 |
| 56 | 1.43 | 1.17 | 58.3 | 0.266 | 0.209 | 0.154 | 117 | 1.58 | 1.29 | 57.8 | 0.294 | 0.231 | 0.171 |
| 57 | 1.53 | 1.25 | 57.9 | 0.285 | 0.223 | 0.165 | 118 | 1.64 | 1.34 | 78.8 | 0.305 | 0.239 | 0.177 |
| 58 | 1.54 | 1.26 | 60.2 | 0.286 | 0.225 | 0.166 | 119 | 1.5 | 1.23 | 65.3 | 0.279 | 0.219 | 0.162 |
| 59 | 1.64 | 1.34 | 70.1 | 0.305 | 0.239 | 0.177 | 120 | 1.63 | 1.33 | 65.7 | 0.303 | 0.238 | 0.176 |
| 60 | 1.63 | 1.33 | 78.4 | 0.303 | 0.238 | 0.176 | 121 | 1.64 | 1.34 | 58.1 | 0.305 | 0.239 | 0.177 |
| 61 | 1.57 | 1.28 | 69.0 | 0.292 | 0.229 | 0.170 | 122 | 1.49 | 1.22 | 55.0 | 0.277 | 0.218 | 0.161 |
Appendix D. Biomechanics
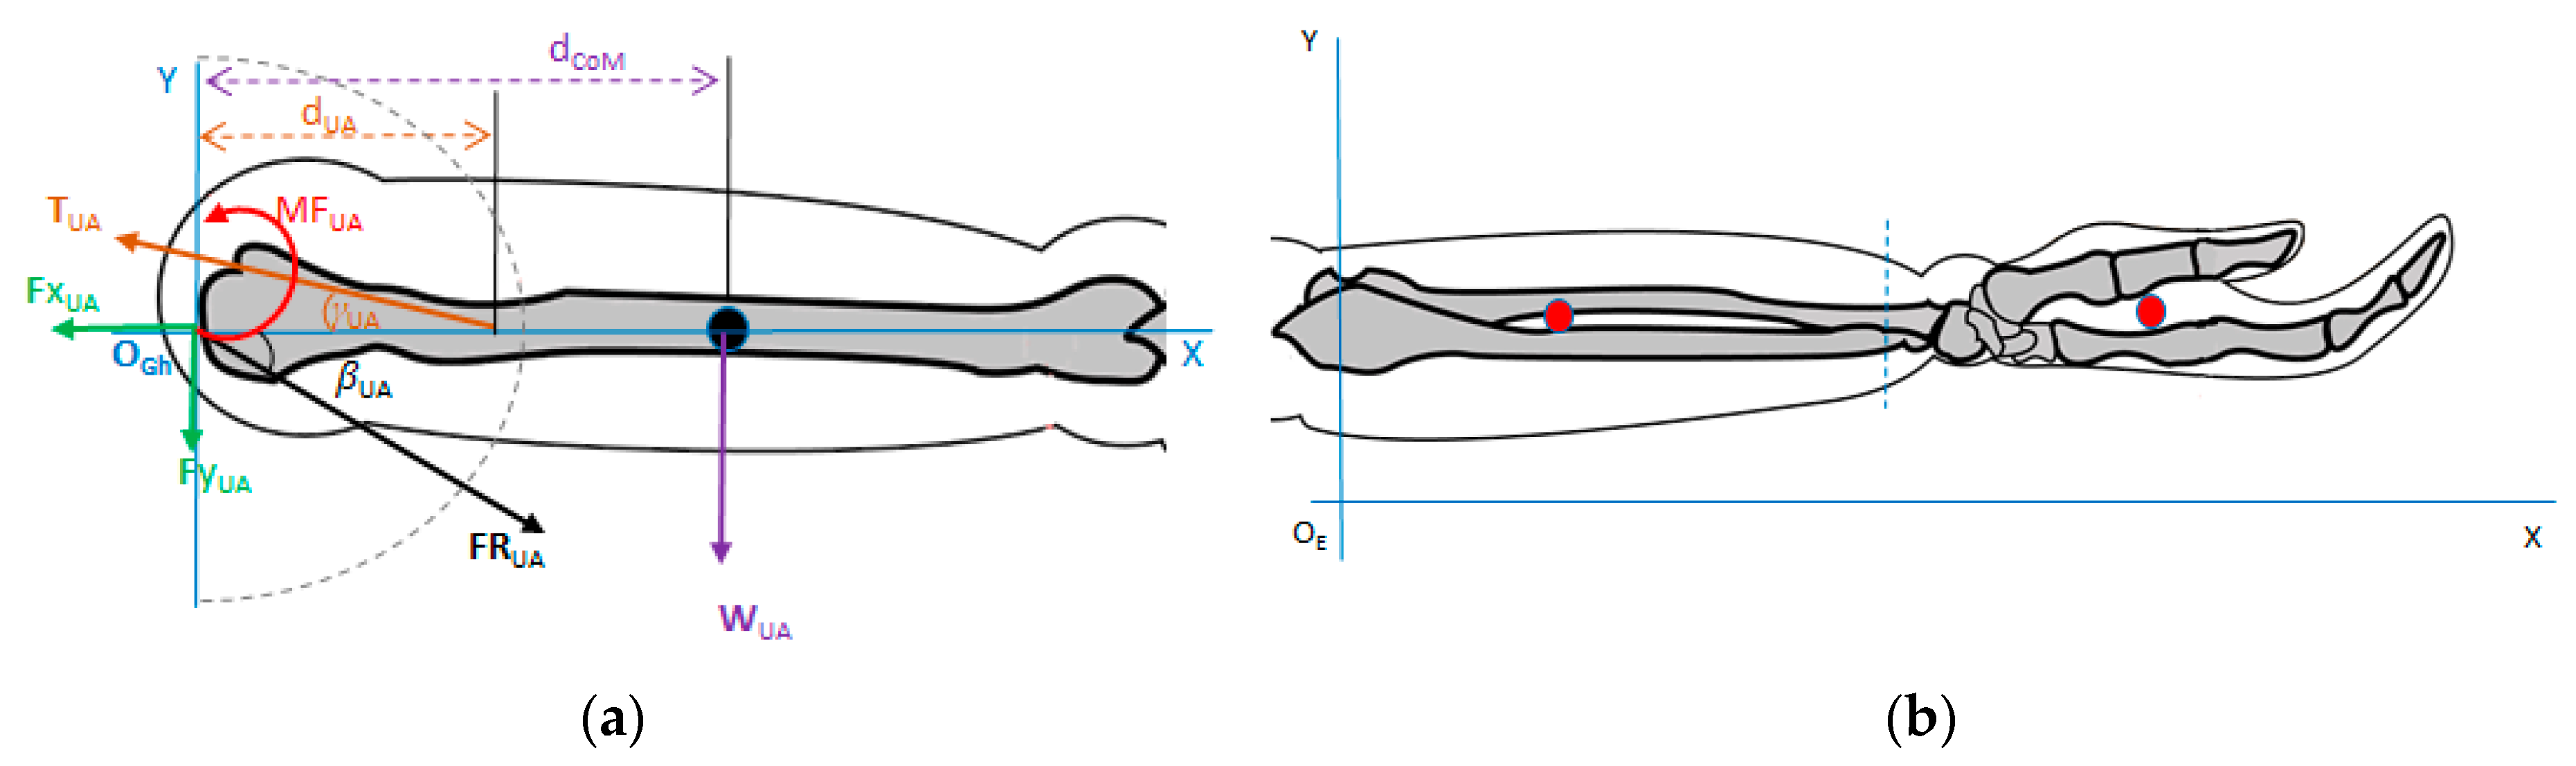
Biomechanic Upper Limb Forces and Moments Analysis
Appendix E. Results from Membership Functions
| Worker | MF | MFLOW | MFMED | MFHIGH | AF | AFLOW | AFMED | AFHIGH | θ | θLOW | θMED | θHIGH | θoMF∩AF |
|---|---|---|---|---|---|---|---|---|---|---|---|---|---|
| W1 | 40.06 | 0.00 | 0.32 | 0.50 | 49.22 | 0.00 | 0.00 | 0.95 | 32.53 | 0.37 | 0.38 | 0.00 | 0.57 |
| W2 | 41.30 | 0.00 | 0.23 | 0.57 | 50.74 | 0.00 | 0.00 | 1.00 | 35.52 | 0.22 | 0.53 | 0.00 | 0.81 |
| W3 | 34.43 | 0.00 | 0.69 | 0.22 | 42.30 | 0.00 | 0.18 | 0.49 | 33.71 | 0.31 | 0.44 | 0.00 | 0.53 |
| W4 | 40.06 | 0.00 | 0.32 | 0.50 | 49.22 | 0.00 | 0.00 | 0.95 | 33.54 | 0.32 | 0.43 | 0.00 | 1.00 |
| W5 | 41.30 | 0.00 | 0.23 | 0.57 | 50.74 | 0.00 | 0.00 | 1.00 | 31.90 | 0.41 | 0.34 | 0.00 | 0.66 |
| W6 | 38.75 | 0.00 | 0.40 | 0.44 | 47.50 | 0.00 | 0.00 | 0.84 | 35.33 | 0.23 | 0.52 | 0.00 | 0.52 |
| W7 | 40.34 | 0.00 | 0.30 | 0.52 | 49.45 | 0.00 | 0.00 | 0.97 | 33.03 | 0.35 | 0.40 | 0.00 | 0.65 |
| W8 | 45.85 | 0.00 | 0.00 | 0.79 | 55.82 | 0.00 | 0.00 | 1.00 | 32.70 | 0.37 | 0.38 | 0.00 | 0.63 |
| W9 | 42.60 | 0.00 | 0.15 | 0.63 | 51.86 | 0.00 | 0.00 | 1.00 | 33.54 | 0.32 | 0.43 | 0.00 | 0.67 |
| W10 | 43.95 | 0.00 | 0.06 | 0.70 | 53.39 | 0.00 | 0.00 | 1.00 | 34.41 | 0.28 | 0.47 | 0.00 | 0.91 |
| W11 | 42.46 | 0.00 | 0.16 | 0.62 | 51.58 | 0.00 | 0.00 | 1.00 | 31.90 | 0.41 | 0.34 | 0.00 | 1.00 |
| W12 | 36.20 | 0.00 | 0.57 | 0.31 | 43.98 | 0.00 | 0.07 | 0.60 | 34.41 | 0.28 | 0.47 | 0.00 | 1.00 |
| W13 | 46.47 | 0.00 | 0.00 | 0.82 | 56.33 | 0.00 | 0.00 | 1.00 | 31.74 | 0.41 | 0.34 | 0.00 | 0.70 |
| W14 | 46.11 | 0.00 | 0.00 | 0.81 | 55.89 | 0.00 | 0.00 | 1.00 | 33.54 | 0.32 | 0.43 | 0.00 | 0.47 |
| W15 | 46.47 | 0.00 | 0.00 | 0.82 | 56.33 | 0.00 | 0.00 | 1.00 | 32.21 | 0.39 | 0.36 | 0.00 | 1.00 |
| W16 | 46.11 | 0.00 | 0.00 | 0.81 | 55.89 | 0.00 | 0.00 | 1.00 | 35.52 | 0.22 | 0.53 | 0.00 | 0.66 |
| W17 | 37.45 | 0.00 | 0.49 | 0.37 | 45.39 | 0.00 | 0.00 | 0.69 | 32.86 | 0.36 | 0.39 | 0.00 | 1.00 |
| W18 | 57.78 | 0.00 | 0.00 | 1.00 | 70.04 | 0.00 | 0.00 | 1.00 | 32.70 | 0.37 | 0.38 | 0.00 | 0.47 |
| W19 | 43.61 | 0.00 | 0.08 | 0.68 | 52.86 | 0.00 | 0.00 | 1.00 | 32.05 | 0.40 | 0.35 | 0.00 | 0.48 |
| W20 | 39.81 | 0.00 | 0.33 | 0.49 | 48.26 | 0.00 | 0.00 | 0.89 | 31.74 | 0.41 | 0.34 | 0.00 | 1.00 |
| W21 | 45.04 | 0.00 | 0.00 | 0.75 | 54.59 | 0.00 | 0.00 | 1.00 | 34.06 | 0.30 | 0.45 | 0.00 | 0.47 |
| W22 | 39.38 | 0.00 | 0.36 | 0.47 | 47.74 | 0.00 | 0.00 | 0.85 | 32.05 | 0.40 | 0.35 | 0.00 | 0.47 |
| W23 | 40.66 | 0.00 | 0.28 | 0.53 | 49.18 | 0.00 | 0.00 | 0.95 | 34.23 | 0.29 | 0.46 | 0.00 | 0.46 |
| W24 | 46.42 | 0.00 | 0.00 | 0.82 | 56.15 | 0.00 | 0.00 | 1.00 | 33.20 | 0.34 | 0.41 | 0.00 | 0.49 |
| W25 | 40.66 | 0.00 | 0.28 | 0.53 | 49.18 | 0.00 | 0.00 | 0.95 | 33.20 | 0.34 | 0.41 | 0.00 | 0.46 |
| W26 | 40.66 | 0.00 | 0.28 | 0.53 | 49.18 | 0.00 | 0.00 | 0.95 | 33.54 | 0.32 | 0.43 | 0.00 | 1.00 |
| W27 | 49.88 | 0.00 | 0.00 | 0.99 | 60.34 | 0.00 | 0.00 | 1.00 | 33.20 | 0.34 | 0.41 | 0.00 | 0.46 |
| W28 | 45.70 | 0.00 | 0.00 | 0.79 | 55.28 | 0.00 | 0.00 | 1.00 | 32.37 | 0.38 | 0.37 | 0.00 | 1.00 |
| W29 | 43.03 | 0.00 | 0.12 | 0.65 | 52.05 | 0.00 | 0.00 | 1.00 | 35.33 | 0.23 | 0.52 | 0.00 | 0.46 |
| W30 | 41.67 | 0.00 | 0.21 | 0.58 | 50.40 | 0.00 | 0.00 | 1.00 | 33.88 | 0.31 | 0.44 | 0.00 | 0.79 |
| W31 | 47.07 | 0.00 | 0.00 | 0.85 | 56.94 | 0.00 | 0.00 | 1.00 | 33.54 | 0.32 | 0.43 | 0.00 | 0.46 |
| W32 | 40.78 | 0.00 | 0.27 | 0.54 | 49.22 | 0.00 | 0.00 | 0.95 | 31.74 | 0.41 | 0.34 | 0.00 | 0.75 |
| W33 | 40.78 | 0.00 | 0.27 | 0.54 | 49.22 | 0.00 | 0.00 | 0.95 | 32.53 | 0.37 | 0.38 | 0.00 | 0.73 |
| W34 | 40.78 | 0.00 | 0.27 | 0.54 | 49.22 | 0.00 | 0.00 | 0.95 | 32.86 | 0.36 | 0.39 | 0.00 | 0.45 |
| W35 | 42.29 | 0.00 | 0.17 | 0.61 | 50.94 | 0.00 | 0.00 | 1.00 | 32.53 | 0.37 | 0.38 | 0.00 | 0.58 |
| W36 | 55.37 | 0.00 | 0.00 | 1.00 | 66.69 | 0.00 | 0.00 | 1.00 | 33.54 | 0.32 | 0.43 | 0.00 | 0.83 |
| W37 | 42.57 | 0.00 | 0.15 | 0.63 | 51.18 | 0.00 | 0.00 | 1.00 | 34.77 | 0.26 | 0.49 | 0.00 | 0.44 |
| W38 | 42.57 | 0.00 | 0.15 | 0.63 | 51.18 | 0.00 | 0.00 | 1.00 | 32.53 | 0.37 | 0.38 | 0.00 | 0.85 |
| W39 | 46.69 | 0.00 | 0.00 | 0.83 | 56.13 | 0.00 | 0.00 | 1.00 | 34.23 | 0.29 | 0.46 | 0.00 | 0.96 |
| W40 | 49.48 | 0.00 | 0.00 | 0.97 | 59.48 | 0.00 | 0.00 | 1.00 | 33.03 | 0.35 | 0.40 | 0.00 | 1.00 |
| W41 | 46.69 | 0.00 | 0.00 | 0.83 | 56.13 | 0.00 | 0.00 | 1.00 | 33.54 | 0.32 | 0.43 | 0.00 | 1.00 |
| W42 | 44.63 | 0.00 | 0.01 | 0.73 | 53.65 | 0.00 | 0.00 | 1.00 | 32.21 | 0.39 | 0.36 | 0.00 | 1.00 |
| W43 | 46.17 | 0.00 | 0.00 | 0.81 | 55.51 | 0.00 | 0.00 | 1.00 | 35.52 | 0.22 | 0.53 | 0.00 | 0.97 |
| W44 | 44.55 | 0.00 | 0.01 | 0.73 | 53.45 | 0.00 | 0.00 | 1.00 | 32.86 | 0.36 | 0.39 | 0.00 | 0.50 |
| W45 | 43.37 | 0.00 | 0.09 | 0.67 | 52.03 | 0.00 | 0.00 | 1.00 | 32.70 | 0.37 | 0.38 | 0.00 | 0.63 |
| W46 | 34.64 | 0.00 | 0.68 | 0.23 | 41.55 | 0.00 | 0.23 | 0.44 | 32.53 | 0.37 | 0.38 | 0.00 | 0.81 |
| W47 | 39.67 | 0.00 | 0.34 | 0.48 | 47.59 | 0.00 | 0.00 | 0.84 | 33.20 | 0.34 | 0.41 | 0.00 | 0.53 |
| W48 | 44.55 | 0.00 | 0.01 | 0.73 | 53.45 | 0.00 | 0.00 | 1.00 | 34.06 | 0.30 | 0.45 | 0.00 | 0.52 |
| W49 | 43.37 | 0.00 | 0.09 | 0.67 | 52.03 | 0.00 | 0.00 | 1.00 | 34.77 | 0.26 | 0.49 | 0.00 | 1.00 |
| W50 | 33.82 | 0.00 | 0.73 | 0.19 | 40.58 | 0.00 | 0.29 | 0.37 | 34.23 | 0.29 | 0.46 | 0.00 | 0.83 |
| W51 | 39.67 | 0.00 | 0.34 | 0.48 | 47.59 | 0.00 | 0.00 | 0.84 | 33.20 | 0.34 | 0.41 | 0.00 | 0.67 |
| W52 | 44.55 | 0.00 | 0.01 | 0.73 | 53.45 | 0.00 | 0.00 | 1.00 | 33.20 | 0.34 | 0.41 | 0.00 | 0.43 |
| W53 | 43.37 | 0.00 | 0.09 | 0.67 | 52.03 | 0.00 | 0.00 | 1.00 | 33.54 | 0.32 | 0.43 | 0.00 | 0.43 |
| W54 | 34.64 | 0.00 | 0.68 | 0.23 | 41.55 | 0.00 | 0.23 | 0.44 | 33.20 | 0.34 | 0.41 | 0.00 | 1.00 |
| W55 | 39.67 | 0.00 | 0.34 | 0.48 | 47.59 | 0.00 | 0.00 | 0.84 | 32.53 | 0.37 | 0.38 | 0.00 | 1.00 |
| W56 | 50.20 | 0.00 | 0.00 | 1.00 | 60.11 | 0.00 | 0.00 | 1.00 | 35.52 | 0.22 | 0.53 | 0.00 | 0.42 |
| W57 | 46.93 | 0.00 | 0.00 | 0.85 | 56.19 | 0.00 | 0.00 | 1.00 | 33.71 | 0.31 | 0.44 | 0.00 | 0.55 |
| W58 | 37.84 | 0.00 | 0.46 | 0.39 | 45.31 | 0.00 | 0.00 | 0.69 | 33.54 | 0.32 | 0.43 | 0.00 | 0.47 |
| W59 | 47.90 | 0.00 | 0.00 | 0.89 | 57.35 | 0.00 | 0.00 | 1.00 | 31.90 | 0.41 | 0.34 | 0.00 | 1.00 |
| W60 | 56.60 | 0.00 | 0.00 | 1.00 | 67.64 | 0.00 | 0.00 | 1.00 | 32.05 | 0.40 | 0.35 | 0.00 | 0.82 |
| W61 | 52.18 | 0.00 | 0.00 | 1.00 | 62.35 | 0.00 | 0.00 | 1.00 | 33.03 | 0.35 | 0.40 | 0.00 | 0.53 |
| W62 | 43.26 | 0.00 | 0.10 | 0.66 | 51.69 | 0.00 | 0.00 | 1.00 | 32.70 | 0.37 | 0.38 | 0.00 | 0.41 |
| W63 | 43.71 | 0.00 | 0.07 | 0.69 | 52.23 | 0.00 | 0.00 | 1.00 | 33.54 | 0.32 | 0.43 | 0.00 | 0.41 |
| W64 | 56.60 | 0.00 | 0.00 | 1.00 | 67.64 | 0.00 | 0.00 | 1.00 | 34.41 | 0.28 | 0.47 | 0.00 | 0.49 |
| W65 | 52.18 | 0.00 | 0.00 | 1.00 | 62.35 | 0.00 | 0.00 | 1.00 | 31.90 | 0.41 | 0.34 | 0.00 | 0.73 |
| W66 | 43.26 | 0.00 | 0.10 | 0.66 | 51.69 | 0.00 | 0.00 | 1.00 | 34.41 | 0.28 | 0.47 | 0.00 | 0.41 |
| W67 | 45.88 | 0.00 | 0.00 | 0.79 | 54.83 | 0.00 | 0.00 | 1.00 | 32.70 | 0.37 | 0.38 | 0.00 | 0.98 |
| W68 | 56.60 | 0.00 | 0.00 | 1.00 | 67.64 | 0.00 | 0.00 | 1.00 | 33.54 | 0.32 | 0.43 | 0.00 | 1.00 |
| W69 | 52.18 | 0.00 | 0.00 | 1.00 | 62.35 | 0.00 | 0.00 | 1.00 | 32.21 | 0.39 | 0.36 | 0.00 | 0.46 |
| W70 | 43.26 | 0.00 | 0.10 | 0.66 | 51.69 | 0.00 | 0.00 | 1.00 | 35.52 | 0.22 | 0.53 | 0.00 | 0.68 |
| W71 | 50.23 | 0.00 | 0.00 | 1.00 | 60.02 | 0.00 | 0.00 | 1.00 | 32.86 | 0.36 | 0.39 | 0.00 | 1.00 |
| W72 | 52.06 | 0.00 | 0.00 | 1.00 | 62.09 | 0.00 | 0.00 | 1.00 | 32.70 | 0.37 | 0.38 | 0.00 | 0.40 |
| W73 | 47.23 | 0.00 | 0.00 | 0.86 | 56.33 | 0.00 | 0.00 | 1.00 | 31.28 | 0.44 | 0.31 | 0.00 | 0.97 |
| W74 | 52.06 | 0.00 | 0.00 | 1.00 | 62.09 | 0.00 | 0.00 | 1.00 | 34.41 | 0.28 | 0.47 | 0.00 | 1.00 |
| W75 | 49.65 | 0.00 | 0.00 | 0.98 | 59.21 | 0.00 | 0.00 | 1.00 | 34.06 | 0.30 | 0.45 | 0.00 | 1.00 |
| W76 | 49.65 | 0.00 | 0.00 | 0.98 | 59.21 | 0.00 | 0.00 | 1.00 | 33.20 | 0.34 | 0.41 | 0.00 | 1.00 |
| W77 | 53.99 | 0.00 | 0.00 | 1.00 | 64.27 | 0.00 | 0.00 | 1.00 | 34.23 | 0.29 | 0.46 | 0.00 | 0.39 |
| W78 | 52.39 | 0.00 | 0.00 | 1.00 | 62.37 | 0.00 | 0.00 | 1.00 | 33.20 | 0.34 | 0.41 | 0.00 | 0.54 |
| W79 | 53.15 | 0.00 | 0.00 | 1.00 | 63.28 | 0.00 | 0.00 | 1.00 | 33.20 | 0.34 | 0.41 | 0.00 | 0.73 |
| W80 | 53.99 | 0.00 | 0.00 | 1.00 | 64.27 | 0.00 | 0.00 | 1.00 | 33.54 | 0.32 | 0.43 | 0.00 | 0.39 |
| W81 | 43.58 | 0.00 | 0.08 | 0.68 | 51.89 | 0.00 | 0.00 | 1.00 | 33.20 | 0.34 | 0.41 | 0.00 | 0.39 |
| W82 | 43.89 | 0.00 | 0.06 | 0.69 | 52.25 | 0.00 | 0.00 | 1.00 | 31.28 | 0.44 | 0.31 | 0.00 | 1.00 |
| W83 | 54.33 | 0.00 | 0.00 | 1.00 | 64.56 | 0.00 | 0.00 | 1.00 | 34.41 | 0.28 | 0.47 | 0.00 | 0.79 |
| W84 | 49.28 | 0.00 | 0.00 | 0.96 | 58.57 | 0.00 | 0.00 | 1.00 | 33.71 | 0.31 | 0.44 | 0.00 | 1.00 |
| W85 | 49.28 | 0.00 | 0.00 | 0.96 | 58.57 | 0.00 | 0.00 | 1.00 | 31.59 | 0.42 | 0.33 | 0.00 | 0.67 |
| W86 | 54.33 | 0.00 | 0.00 | 1.00 | 64.56 | 0.00 | 0.00 | 1.00 | 33.71 | 0.31 | 0.44 | 0.00 | 0.66 |
| W87 | 51.12 | 0.00 | 0.00 | 1.00 | 60.74 | 0.00 | 0.00 | 1.00 | 33.36 | 0.33 | 0.42 | 0.00 | 0.38 |
| W88 | 49.28 | 0.00 | 0.00 | 0.96 | 58.57 | 0.00 | 0.00 | 1.00 | 32.53 | 0.37 | 0.38 | 0.00 | 1.00 |
| W89 | 40.91 | 0.00 | 0.26 | 0.55 | 48.52 | 0.00 | 0.00 | 0.90 | 33.36 | 0.33 | 0.42 | 0.00 | 0.50 |
| W90 | 50.36 | 0.00 | 0.00 | 1.00 | 59.74 | 0.00 | 0.00 | 1.00 | 33.03 | 0.35 | 0.40 | 0.00 | 0.54 |
| W91 | 54.67 | 0.00 | 0.00 | 1.00 | 64.85 | 0.00 | 0.00 | 1.00 | 34.23 | 0.29 | 0.46 | 0.00 | 0.38 |
| W92 | 48.13 | 0.00 | 0.00 | 0.91 | 57.09 | 0.00 | 0.00 | 1.00 | 34.59 | 0.27 | 0.48 | 0.00 | 0.63 |
| W93 | 51.67 | 0.00 | 0.00 | 1.00 | 61.29 | 0.00 | 0.00 | 1.00 | 34.59 | 0.27 | 0.48 | 0.00 | 0.38 |
| W94 | 58.28 | 0.00 | 0.00 | 1.00 | 69.13 | 0.00 | 0.00 | 1.00 | 33.20 | 0.34 | 0.41 | 0.00 | 0.43 |
| W95 | 49.98 | 0.00 | 0.00 | 1.00 | 59.28 | 0.00 | 0.00 | 1.00 | 34.41 | 0.28 | 0.47 | 0.00 | 0.96 |
| W96 | 50.13 | 0.00 | 0.00 | 1.00 | 59.46 | 0.00 | 0.00 | 1.00 | 34.23 | 0.29 | 0.46 | 0.00 | 1.00 |
| W97 | 46.52 | 0.00 | 0.00 | 0.83 | 55.18 | 0.00 | 0.00 | 1.00 | 33.88 | 0.31 | 0.44 | 0.00 | 1.00 |
| W98 | 53.44 | 0.00 | 0.00 | 1.00 | 63.39 | 0.00 | 0.00 | 1.00 | 33.71 | 0.31 | 0.44 | 0.00 | 1.00 |
| W99 | 41.16 | 0.00 | 0.24 | 0.56 | 48.74 | 0.00 | 0.00 | 0.92 | 31.43 | 0.43 | 0.32 | 0.00 | 0.79 |
| W100 | 61.27 | 0.00 | 0.00 | 1.00 | 72.42 | 0.00 | 0.00 | 1.00 | 33.71 | 0.31 | 0.44 | 0.00 | 0.39 |
| W101 | 53.48 | 0.00 | 0.00 | 1.00 | 63.21 | 0.00 | 0.00 | 1.00 | 32.53 | 0.37 | 0.38 | 0.00 | 0.73 |
| W102 | 61.27 | 0.00 | 0.00 | 1.00 | 72.42 | 0.00 | 0.00 | 1.00 | 32.53 | 0.37 | 0.38 | 0.00 | 1.00 |
| W103 | 54.89 | 0.00 | 0.00 | 1.00 | 64.87 | 0.00 | 0.00 | 1.00 | 32.86 | 0.36 | 0.39 | 0.00 | 1.00 |
| W104 | 57.69 | 0.00 | 0.00 | 1.00 | 68.18 | 0.00 | 0.00 | 1.00 | 33.03 | 0.35 | 0.40 | 0.00 | 1.00 |
| W105 | 47.00 | 0.00 | 0.00 | 0.85 | 55.45 | 0.00 | 0.00 | 1.00 | 31.74 | 0.41 | 0.34 | 0.00 | 0.40 |
| W106 | 53.66 | 0.00 | 0.00 | 1.00 | 63.31 | 0.00 | 0.00 | 1.00 | 34.59 | 0.27 | 0.48 | 0.00 | 0.47 |
| W107 | 61.41 | 0.00 | 0.00 | 1.00 | 72.46 | 0.00 | 0.00 | 1.00 | 34.23 | 0.29 | 0.46 | 0.00 | 1.00 |
| W108 | 51.46 | 0.00 | 0.00 | 1.00 | 60.72 | 0.00 | 0.00 | 1.00 | 32.21 | 0.39 | 0.36 | 0.00 | 1.00 |
| W109 | 55.25 | 0.00 | 0.00 | 1.00 | 65.07 | 0.00 | 0.00 | 1.00 | 34.41 | 0.28 | 0.47 | 0.00 | 0.57 |
| W110 | 49.34 | 0.00 | 0.00 | 0.97 | 58.11 | 0.00 | 0.00 | 1.00 | 31.28 | 0.44 | 0.31 | 0.00 | 0.47 |
| W111 | 55.25 | 0.00 | 0.00 | 1.00 | 65.07 | 0.00 | 0.00 | 1.00 | 33.36 | 0.33 | 0.42 | 0.00 | 0.44 |
| W112 | 49.34 | 0.00 | 0.00 | 0.97 | 58.11 | 0.00 | 0.00 | 1.00 | 33.71 | 0.31 | 0.44 | 0.00 | 1.00 |
| W113 | 62.10 | 0.00 | 0.00 | 1.00 | 73.15 | 0.00 | 0.00 | 1.00 | 32.21 | 0.39 | 0.36 | 0.00 | 1.00 |
| W114 | 45.79 | 0.00 | 0.00 | 0.79 | 53.93 | 0.00 | 0.00 | 1.00 | 34.23 | 0.29 | 0.46 | 0.00 | 1.00 |
| W115 | 56.14 | 0.00 | 0.00 | 1.00 | 66.01 | 0.00 | 0.00 | 1.00 | 34.41 | 0.28 | 0.47 | 0.00 | 0.82 |
| W116 | 55.51 | 0.00 | 0.00 | 1.00 | 65.27 | 0.00 | 0.00 | 1.00 | 33.36 | 0.33 | 0.42 | 0.00 | 0.49 |
| W117 | 55.58 | 0.00 | 0.00 | 1.00 | 65.36 | 0.00 | 0.00 | 1.00 | 32.86 | 0.36 | 0.39 | 0.00 | 0.54 |
| W118 | 55.58 | 0.00 | 0.00 | 1.00 | 65.36 | 0.00 | 0.00 | 1.00 | 31.90 | 0.41 | 0.34 | 0.00 | 0.85 |
| W119 | 58.95 | 0.00 | 0.00 | 1.00 | 69.21 | 0.00 | 0.00 | 1.00 | 34.23 | 0.29 | 0.46 | 0.00 | 0.96 |
| W120 | 60.35 | 0.00 | 0.00 | 1.00 | 70.73 | 0.00 | 0.00 | 1.00 | 32.05 | 0.40 | 0.35 | 0.00 | 0.44 |
| W121 | 50.30 | 0.00 | 0.00 | 1.00 | 58.85 | 0.00 | 0.00 | 1.00 | 31.90 | 0.41 | 0.34 | 0.00 | 0.86 |
| W122 | 58.29 | 0.00 | 0.00 | 1.00 | 68.21 | 0.00 | 0.00 | 1.00 | 32.53 | 0.37 | 0.38 | 0.00 | 0.69 |
| W123 | 59.02 | 0.00 | 0.00 | 1.00 | 69.06 | 0.00 | 0.00 | 1.00 | 34.41 | 0.28 | 0.47 | 0.00 | 0.97 |
| Worker | Age | ALOW | AMED | AHIGH | Height | HHIGH | HMED | HLOW | BMI | BMILOW | BMIMED | BMIHIGH | A∩H∩BMI |
|---|---|---|---|---|---|---|---|---|---|---|---|---|---|
| W1 | 21 | 0.93 | 0.07 | 0.00 | 143 | 0.70 | 0.20 | 0.00 | 28.51 | 0.00 | 0.70 | 0.00 | 0.70 |
| W2 | 48 | 0.00 | 0.13 | 1.00 | 143 | 0.70 | 0.20 | 0.00 | 29.39 | 0.00 | 0.88 | 0.00 | 0.70 |
| W3 | 48 | 0.00 | 0.13 | 1.00 | 143 | 0.70 | 0.20 | 0.00 | 24.50 | 0.55 | 0.00 | 0.00 | 0.55 |
| W4 | 21 | 0.93 | 0.07 | 0.00 | 143 | 0.70 | 0.20 | 0.00 | 28.51 | 0.00 | 0.70 | 0.00 | 0.70 |
| W5 | 55 | 0.00 | 0.00 | 1.00 | 143 | 0.70 | 0.20 | 0.00 | 29.39 | 0.00 | 0.88 | 0.00 | 0.70 |
| W6 | 37 | 0.00 | 0.87 | 0.20 | 144 | 0.60 | 0.27 | 0.00 | 27.01 | 0.00 | 0.40 | 0.00 | 0.40 |
| W7 | 26 | 0.60 | 0.40 | 0.00 | 144 | 0.60 | 0.27 | 0.00 | 28.12 | 0.00 | 0.62 | 0.00 | 0.60 |
| W8 | 47 | 0.00 | 0.20 | 1.00 | 147 | 0.30 | 0.47 | 0.00 | 30.03 | 0.00 | 0.99 | 0.00 | 0.47 |
| W9 | 21 | 0.93 | 0.07 | 0.00 | 147 | 0.30 | 0.47 | 0.00 | 27.91 | 0.00 | 0.58 | 0.00 | 0.47 |
| W10 | 42 | 0.00 | 0.53 | 0.70 | 148 | 0.20 | 0.54 | 0.00 | 28.21 | 0.00 | 0.64 | 0.00 | 0.54 |
| W11 | 40 | 0.00 | 0.67 | 0.50 | 148 | 0.20 | 0.54 | 0.00 | 27.26 | 0.00 | 0.45 | 0.00 | 0.45 |
| W12 | 28 | 0.47 | 0.53 | 0.00 | 148 | 0.20 | 0.54 | 0.00 | 23.24 | 0.68 | 0.00 | 0.00 | 0.53 |
| W13 | 47 | 0.00 | 0.20 | 1.00 | 149 | 0.10 | 0.61 | 0.00 | 29.23 | 0.00 | 0.85 | 0.00 | 0.61 |
| W14 | 50 | 0.00 | 0.00 | 1.00 | 149 | 0.10 | 0.61 | 0.00 | 29.01 | 0.00 | 0.80 | 0.00 | 0.61 |
| W15 | 37 | 0.00 | 0.87 | 0.20 | 149 | 0.10 | 0.61 | 0.00 | 29.23 | 0.00 | 0.85 | 0.00 | 0.61 |
| W16 | 40 | 0.00 | 0.67 | 0.50 | 149 | 0.10 | 0.61 | 0.00 | 29.01 | 0.00 | 0.80 | 0.00 | 0.61 |
| W17 | 32 | 0.20 | 0.80 | 0.00 | 149 | 0.10 | 0.61 | 0.00 | 23.56 | 0.64 | 0.00 | 0.00 | 0.61 |
| W18 | 53 | 0.00 | 0.00 | 1.00 | 149 | 0.10 | 0.61 | 0.00 | 36.35 | 0.00 | 0.00 | 0.63 | 0.61 |
| W19 | 34 | 0.07 | 0.93 | 0.00 | 149 | 0.10 | 0.61 | 0.00 | 27.43 | 0.00 | 0.49 | 0.00 | 0.49 |
| W20 | 38 | 0.00 | 0.80 | 0.30 | 149 | 0.10 | 0.61 | 0.00 | 25.04 | 0.00 | 0.01 | 0.00 | 0.01 |
| W21 | 27 | 0.53 | 0.47 | 0.00 | 149 | 0.10 | 0.61 | 0.00 | 28.33 | 0.00 | 0.67 | 0.00 | 0.53 |
| W22 | 33 | 0.13 | 0.87 | 0.00 | 149 | 0.10 | 0.61 | 0.00 | 24.77 | 0.52 | 0.00 | 0.00 | 0.52 |
| W23 | 51 | 0.00 | 0.00 | 1.00 | 150 | 0.00 | 0.67 | 0.00 | 25.07 | 0.00 | 0.01 | 0.00 | 0.01 |
| W24 | 50 | 0.00 | 0.00 | 1.00 | 150 | 0.00 | 0.67 | 0.00 | 28.62 | 0.00 | 0.72 | 0.00 | 0.67 |
| W25 | 51 | 0.00 | 0.00 | 1.00 | 150 | 0.00 | 0.67 | 0.00 | 25.07 | 0.00 | 0.01 | 0.00 | 0.01 |
| W26 | 43 | 0.00 | 0.47 | 0.80 | 150 | 0.00 | 0.67 | 0.00 | 25.07 | 0.00 | 0.01 | 0.00 | 0.01 |
| W27 | 39 | 0.00 | 0.73 | 0.40 | 150 | 0.00 | 0.67 | 0.00 | 30.76 | 0.00 | 0.85 | 0.00 | 0.67 |
| W28 | 29 | 0.40 | 0.60 | 0.00 | 150 | 0.00 | 0.67 | 0.00 | 28.18 | 0.00 | 0.64 | 0.00 | 0.60 |
| W29 | 30 | 0.33 | 0.67 | 0.00 | 150 | 0.00 | 0.67 | 0.00 | 26.53 | 0.00 | 0.31 | 0.00 | 0.31 |
| W30 | 34 | 0.07 | 0.93 | 0.00 | 150 | 0.00 | 0.67 | 0.00 | 25.69 | 0.00 | 0.14 | 0.00 | 0.14 |
| W31 | 40 | 0.00 | 0.67 | 0.50 | 150 | 0.00 | 0.67 | 0.00 | 29.02 | 0.00 | 0.80 | 0.00 | 0.67 |
| W32 | 29 | 0.40 | 0.60 | 0.00 | 151 | 0.00 | 0.74 | 0.00 | 24.65 | 0.54 | 0.00 | 0.00 | 0.54 |
| W33 | 29 | 0.40 | 0.60 | 0.00 | 151 | 0.00 | 0.74 | 0.00 | 24.65 | 0.54 | 0.00 | 0.00 | 0.54 |
| W34 | 36 | 0.00 | 0.93 | 0.10 | 151 | 0.00 | 0.74 | 0.00 | 24.65 | 0.54 | 0.00 | 0.00 | 0.54 |
| W35 | 33 | 0.13 | 0.87 | 0.00 | 152 | 0.00 | 0.81 | 0.00 | 25.06 | 0.00 | 0.01 | 0.00 | 0.01 |
| W36 | 53 | 0.00 | 0.00 | 1.00 | 152 | 0.00 | 0.81 | 0.00 | 32.81 | 0.00 | 0.44 | 0.00 | 0.44 |
| W37 | 48 | 0.00 | 0.13 | 1.00 | 153 | 0.00 | 0.87 | 0.00 | 24.73 | 0.53 | 0.00 | 0.00 | 0.53 |
| W38 | 28 | 0.47 | 0.53 | 0.00 | 153 | 0.00 | 0.87 | 0.00 | 24.73 | 0.53 | 0.00 | 0.00 | 0.53 |
| W39 | 50 | 0.00 | 0.00 | 1.00 | 153 | 0.00 | 0.87 | 0.00 | 27.13 | 0.00 | 0.43 | 0.00 | 0.43 |
| W40 | 44 | 0.00 | 0.40 | 0.90 | 153 | 0.00 | 0.87 | 0.00 | 28.75 | 0.00 | 0.75 | 0.00 | 0.75 |
| W41 | 35 | 0.00 | 1.00 | 0.00 | 153 | 0.00 | 0.87 | 0.00 | 27.13 | 0.00 | 0.43 | 0.00 | 0.43 |
| W42 | 46 | 0.00 | 0.27 | 1.00 | 153 | 0.00 | 0.87 | 0.00 | 25.93 | 0.00 | 0.19 | 0.00 | 0.19 |
| W43 | 53 | 0.00 | 0.00 | 1.00 | 153 | 0.00 | 0.87 | 0.00 | 26.83 | 0.00 | 0.37 | 0.00 | 0.37 |
| W44 | 35 | 0.00 | 1.00 | 0.00 | 154 | 0.00 | 0.94 | 0.00 | 25.38 | 0.00 | 0.08 | 0.00 | 0.08 |
| W45 | 23 | 0.80 | 0.20 | 0.00 | 154 | 0.00 | 0.94 | 0.00 | 24.71 | 0.53 | 0.00 | 0.00 | 0.53 |
| W46 | 34 | 0.07 | 0.93 | 0.00 | 154 | 0.00 | 0.94 | 0.00 | 19.73 | 1.03 | 0.00 | 0.00 | 0.93 |
| W47 | 23 | 0.80 | 0.20 | 0.00 | 154 | 0.00 | 0.94 | 0.00 | 22.60 | 0.74 | 0.00 | 0.00 | 0.74 |
| W48 | 35 | 0.00 | 1.00 | 0.00 | 154 | 0.00 | 0.94 | 0.00 | 25.38 | 0.00 | 0.08 | 0.00 | 0.08 |
| W49 | 23 | 0.80 | 0.20 | 0.00 | 154 | 0.00 | 0.94 | 0.00 | 24.71 | 0.53 | 0.00 | 0.00 | 0.53 |
| W50 | 34 | 0.07 | 0.93 | 0.00 | 154 | 0.00 | 0.94 | 0.00 | 19.27 | 1.07 | 0.00 | 0.00 | 0.93 |
| W51 | 23 | 0.80 | 0.20 | 0.00 | 154 | 0.00 | 0.94 | 0.00 | 22.60 | 0.74 | 0.00 | 0.00 | 0.74 |
| W52 | 26 | 0.60 | 0.40 | 0.00 | 154 | 0.00 | 0.94 | 0.00 | 25.38 | 0.00 | 0.08 | 0.00 | 0.08 |
| W53 | 23 | 0.80 | 0.20 | 0.00 | 154 | 0.00 | 0.94 | 0.00 | 24.71 | 0.53 | 0.00 | 0.00 | 0.53 |
| W54 | 44 | 0.00 | 0.40 | 0.90 | 154 | 0.00 | 0.94 | 0.00 | 19.73 | 1.03 | 0.00 | 0.00 | 0.90 |
| W55 | 26 | 0.60 | 0.40 | 0.00 | 154 | 0.00 | 0.94 | 0.00 | 22.60 | 0.74 | 0.00 | 0.00 | 0.60 |
| W56 | 42 | 0.00 | 0.53 | 0.70 | 155 | 0.00 | 1.01 | 0.00 | 28.05 | 0.00 | 0.61 | 0.00 | 0.61 |
| W57 | 54 | 0.00 | 0.00 | 1.00 | 155 | 0.00 | 1.01 | 0.00 | 26.22 | 0.00 | 0.24 | 0.00 | 0.24 |
| W58 | 49 | 0.00 | 0.06 | 1.00 | 155 | 0.00 | 1.01 | 0.00 | 21.14 | 0.89 | 0.00 | 0.00 | 0.89 |
| W59 | 55 | 0.00 | 0.00 | 1.00 | 155 | 0.00 | 1.01 | 0.00 | 26.76 | 0.00 | 0.35 | 0.00 | 0.35 |
| W60 | 39 | 0.00 | 0.73 | 0.40 | 156 | 0.00 | 0.93 | 0.00 | 31.02 | 0.00 | 0.80 | 0.00 | 0.73 |
| W61 | 41 | 0.00 | 0.60 | 0.60 | 156 | 0.00 | 0.93 | 0.00 | 28.60 | 0.00 | 0.72 | 0.00 | 0.60 |
| W62 | 25 | 0.67 | 0.33 | 0.00 | 156 | 0.00 | 0.93 | 0.00 | 23.71 | 0.63 | 0.00 | 0.00 | 0.63 |
| W63 | 19 | 1.00 | 0.00 | 0.00 | 156 | 0.00 | 0.93 | 0.00 | 23.96 | 0.60 | 0.00 | 0.00 | 0.60 |
| W64 | 39 | 0.00 | 0.73 | 0.40 | 156 | 0.00 | 0.93 | 0.00 | 31.02 | 0.00 | 0.80 | 0.00 | 0.73 |
| W65 | 41 | 0.00 | 0.60 | 0.60 | 156 | 0.00 | 0.93 | 0.00 | 28.60 | 0.00 | 0.72 | 0.00 | 0.60 |
| W66 | 25 | 0.67 | 0.33 | 0.00 | 156 | 0.00 | 0.93 | 0.00 | 23.71 | 0.63 | 0.00 | 0.00 | 0.63 |
| W67 | 30 | 0.33 | 0.67 | 0.00 | 156 | 0.00 | 0.93 | 0.00 | 25.15 | 0.00 | 0.03 | 0.00 | 0.03 |
| W68 | 29 | 0.40 | 0.60 | 0.00 | 156 | 0.00 | 0.93 | 0.00 | 31.02 | 0.00 | 0.80 | 0.00 | 0.60 |
| W69 | 40 | 0.00 | 0.67 | 0.50 | 156 | 0.00 | 0.93 | 0.00 | 28.60 | 0.00 | 0.72 | 0.00 | 0.67 |
| W70 | 25 | 0.67 | 0.33 | 0.00 | 156 | 0.00 | 0.93 | 0.00 | 23.71 | 0.63 | 0.00 | 0.00 | 0.63 |
| W71 | 57 | 0.00 | 0.00 | 1.00 | 156 | 0.00 | 0.93 | 0.00 | 27.53 | 0.00 | 0.51 | 0.00 | 0.51 |
| W72 | 38 | 0.00 | 0.80 | 0.30 | 157 | 0.00 | 0.86 | 0.00 | 27.99 | 0.00 | 0.60 | 0.00 | 0.60 |
| W73 | 27 | 0.53 | 0.47 | 0.00 | 157 | 0.00 | 0.86 | 0.00 | 25.40 | 0.00 | 0.08 | 0.00 | 0.08 |
| W74 | 38 | 0.00 | 0.80 | 0.30 | 157 | 0.00 | 0.86 | 0.00 | 27.99 | 0.00 | 0.60 | 0.00 | 0.60 |
| W75 | 36 | 0.00 | 0.93 | 0.10 | 157 | 0.00 | 0.86 | 0.00 | 26.69 | 0.00 | 0.34 | 0.00 | 0.34 |
| W76 | 26 | 0.60 | 0.40 | 0.00 | 157 | 0.00 | 0.86 | 0.00 | 26.69 | 0.00 | 0.34 | 0.00 | 0.34 |
| W77 | 44 | 0.00 | 0.40 | 0.90 | 158 | 0.00 | 0.79 | 0.00 | 28.48 | 0.00 | 0.70 | 0.00 | 0.70 |
| W78 | 38 | 0.00 | 0.80 | 0.30 | 158 | 0.00 | 0.79 | 0.00 | 27.64 | 0.00 | 0.53 | 0.00 | 0.53 |
| W79 | 44 | 0.00 | 0.40 | 0.90 | 158 | 0.00 | 0.79 | 0.00 | 28.04 | 0.00 | 0.61 | 0.00 | 0.61 |
| W80 | 50 | 0.00 | 0.00 | 1.00 | 158 | 0.00 | 0.79 | 0.00 | 28.48 | 0.00 | 0.70 | 0.00 | 0.70 |
| W81 | 54 | 0.00 | 0.00 | 1.00 | 158 | 0.00 | 0.79 | 0.00 | 22.99 | 0.70 | 0.00 | 0.00 | 0.70 |
| W82 | 54 | 0.00 | 0.00 | 1.00 | 158 | 0.00 | 0.79 | 0.00 | 23.15 | 0.68 | 0.00 | 0.00 | 0.68 |
| W83 | 50 | 0.00 | 0.00 | 1.00 | 159 | 0.00 | 0.73 | 0.00 | 28.12 | 0.00 | 0.62 | 0.00 | 0.62 |
| W84 | 24 | 0.73 | 0.27 | 0.00 | 159 | 0.00 | 0.73 | 0.00 | 25.51 | 0.00 | 0.10 | 0.00 | 0.10 |
| W85 | 24 | 0.73 | 0.27 | 0.00 | 159 | 0.00 | 0.73 | 0.00 | 25.51 | 0.00 | 0.10 | 0.00 | 0.10 |
| W86 | 40 | 0.00 | 0.67 | 0.50 | 159 | 0.00 | 0.73 | 0.00 | 28.12 | 0.00 | 0.62 | 0.00 | 0.62 |
| W87 | 37 | 0.00 | 0.87 | 0.20 | 159 | 0.00 | 0.73 | 0.00 | 26.46 | 0.00 | 0.29 | 0.00 | 0.29 |
| W88 | 34 | 0.07 | 0.93 | 0.00 | 159 | 0.00 | 0.73 | 0.00 | 25.51 | 0.00 | 0.10 | 0.00 | 0.10 |
| W89 | 35 | 0.00 | 1.00 | 0.00 | 160 | 0.00 | 0.66 | 0.00 | 20.78 | 0.92 | 0.00 | 0.00 | 0.66 |
| W90 | 37 | 0.00 | 0.87 | 0.20 | 160 | 0.00 | 0.66 | 0.00 | 25.59 | 0.00 | 0.12 | 0.00 | 0.12 |
| W91 | 50 | 0.00 | 0.00 | 1.00 | 160 | 0.00 | 0.66 | 0.00 | 27.77 | 0.00 | 0.55 | 0.00 | 0.55 |
| W92 | 55 | 0.00 | 0.00 | 1.00 | 160 | 0.00 | 0.66 | 0.00 | 24.45 | 0.55 | 0.00 | 0.00 | 0.55 |
| W93 | 20 | 1.00 | 0.00 | 0.00 | 160 | 0.00 | 0.66 | 0.00 | 26.25 | 0.00 | 0.25 | 0.00 | 0.25 |
| W94 | 27 | 0.53 | 0.47 | 0.00 | 160 | 0.00 | 0.66 | 0.00 | 29.61 | 0.00 | 0.92 | 0.00 | 0.53 |
| W95 | 47 | 0.00 | 0.20 | 1.00 | 160 | 0.00 | 0.66 | 0.00 | 25.39 | 0.00 | 0.08 | 0.00 | 0.08 |
| W96 | 40 | 0.00 | 0.67 | 0.50 | 160 | 0.00 | 0.66 | 0.00 | 25.47 | 0.00 | 0.09 | 0.00 | 0.09 |
| W97 | 55 | 0.00 | 0.00 | 1.00 | 160 | 0.00 | 0.66 | 0.00 | 23.63 | 0.64 | 0.00 | 0.00 | 0.64 |
| W98 | 51 | 0.00 | 0.00 | 1.00 | 160 | 0.00 | 0.66 | 0.00 | 27.15 | 0.00 | 0.43 | 0.00 | 0.43 |
| W99 | 24 | 0.73 | 0.27 | 0.00 | 161 | 0.00 | 0.59 | 0.00 | 20.52 | 0.95 | 0.00 | 0.00 | 0.59 |
| W100 | 31 | 0.27 | 0.73 | 0.00 | 162 | 0.00 | 0.53 | 0.00 | 29.99 | 0.00 | 1.00 | 0.00 | 0.53 |
| W101 | 31 | 0.27 | 0.73 | 0.00 | 162 | 0.00 | 0.53 | 0.00 | 26.18 | 0.00 | 0.24 | 0.00 | 0.24 |
| W102 | 41 | 0.00 | 0.60 | 0.60 | 162 | 0.00 | 0.53 | 0.00 | 29.99 | 0.00 | 1.00 | 0.00 | 0.53 |
| W103 | 45 | 0.00 | 0.33 | 1.00 | 162 | 0.00 | 0.53 | 0.00 | 26.86 | 0.00 | 0.37 | 0.00 | 0.37 |
| W104 | 29 | 0.40 | 0.60 | 0.00 | 162 | 0.00 | 0.53 | 0.00 | 28.24 | 0.00 | 0.65 | 0.00 | 0.53 |
| W105 | 20 | 1.00 | 0.00 | 0.00 | 163 | 0.00 | 0.46 | 0.00 | 22.58 | 0.74 | 0.00 | 0.00 | 0.46 |
| W106 | 21 | 0.93 | 0.07 | 0.00 | 163 | 0.00 | 0.46 | 0.00 | 25.78 | 0.00 | 0.16 | 0.00 | 0.16 |
| W107 | 37 | 0.00 | 0.87 | 0.20 | 163 | 0.00 | 0.46 | 0.00 | 29.51 | 0.00 | 0.90 | 0.00 | 0.46 |
| W108 | 32 | 0.20 | 0.80 | 0.00 | 163 | 0.00 | 0.46 | 0.00 | 24.73 | 0.53 | 0.00 | 0.00 | 0.46 |
| W109 | 20 | 1.00 | 0.00 | 0.00 | 164 | 0.00 | 0.39 | 0.00 | 26.06 | 0.00 | 0.21 | 0.00 | 0.21 |
| W110 | 55 | 0.00 | 0.00 | 1.00 | 164 | 0.00 | 0.39 | 0.00 | 23.27 | 0.67 | 0.00 | 0.00 | 0.39 |
| W111 | 20 | 1.00 | 0.00 | 0.00 | 164 | 0.00 | 0.39 | 0.00 | 26.06 | 0.00 | 0.21 | 0.00 | 0.21 |
| W112 | 45 | 0.00 | 0.33 | 1.00 | 164 | 0.00 | 0.39 | 0.00 | 23.27 | 0.67 | 0.00 | 0.00 | 0.39 |
| W113 | 26 | 0.60 | 0.40 | 0.00 | 164 | 0.00 | 0.39 | 0.00 | 29.30 | 0.00 | 0.86 | 0.00 | 0.39 |
| W114 | 40 | 0.00 | 0.67 | 0.50 | 164 | 0.00 | 0.39 | 0.00 | 21.60 | 0.84 | 0.00 | 0.00 | 0.39 |
| W115 | 27 | 0.53 | 0.47 | 0.00 | 165 | 0.00 | 0.33 | 0.00 | 26.01 | 0.00 | 0.20 | 0.00 | 0.20 |
| W116 | 19 | 1.00 | 0.00 | 0.00 | 165 | 0.00 | 0.33 | 0.00 | 25.71 | 0.00 | 0.14 | 0.00 | 0.14 |
| W117 | 40 | 0.00 | 0.67 | 0.50 | 165 | 0.00 | 0.33 | 0.00 | 25.75 | 0.00 | 0.15 | 0.00 | 0.15 |
| W118 | 19 | 1.00 | 0.00 | 0.00 | 165 | 0.00 | 0.33 | 0.00 | 25.75 | 0.00 | 0.15 | 0.00 | 0.15 |
| W119 | 24 | 0.73 | 0.27 | 0.00 | 166 | 0.00 | 0.26 | 0.00 | 26.82 | 0.00 | 0.36 | 0.00 | 0.26 |
| W120 | 22 | 0.87 | 0.13 | 0.00 | 167 | 0.00 | 0.19 | 0.00 | 26.96 | 0.00 | 0.39 | 0.00 | 0.19 |
| W121 | 50 | 0.00 | 0.00 | 1.00 | 168 | 0.00 | 0.13 | 0.00 | 22.07 | 0.79 | 0.00 | 0.00 | 0.13 |
| W122 | 29 | 0.40 | 0.60 | 0.00 | 168 | 0.00 | 0.13 | 0.00 | 25.58 | 0.00 | 0.12 | 0.00 | 0.12 |
| W123 | 20 | 1.00 | 0.00 | 0.00 | 168 | 0.00 | 0.13 | 0.00 | 25.90 | 0.00 | 0.18 | 0.00 | 0.13 |
References
- Huston, R.L. Fundamentals of Biomechanics; CRC Press: Boca Raton, FL, USA; Taylor and Francis: Abingdon, UK, 2013. [Google Scholar]
- Arvidsson, I.; Åkesson, I.; Hansson, G.-Å. Wrist Movements among Females in a Repetitive, Non-Forceful Work. Appl. Ergon. 2003, 34, 309–316. [Google Scholar] [CrossRef] [PubMed]
- Arman, S.E. Are Ergonomic Interventions Effective for Prevention of Upper Extremity Work-Related Musculoskeletal Disorders among Office Workers? A Cochrane Review Summary with Commentary. Musculoskelet. Sci. Pract. 2020, 45, 102062. [Google Scholar] [CrossRef]
- Pheasant, S. Bodyspace. Anthropometry, Ergonomics and Design of Work, 2nd ed.; Taylor & Francis: Philadelphia, PA, USA, 2003. [Google Scholar]
- Komsiyah, S.; Ayuliana; Balqis, D.A. Analysis of Decision Support System for Determining Industrial Sub-District Using DEMATEL-MABAC Methods. Procedia Comput. Sci. 2023, 216, 499–509. [Google Scholar] [CrossRef]
- Serrano-Jiménez, A.; Díaz-López, C.; Ramírez-Juidias, E.; Barrios-Padura, Á. Multi-Criteria Assessment Model on Environmental Ergonomics for Decision-Making in Schoolyards Based on Remote-Sensing and GIS Resources. Sustain. Cities Soc. 2023, 92, 104481. [Google Scholar] [CrossRef]
- Boboșatu, F.; Boboșatu, C.M.; Vișan, M. The Data Quality in a Complex Web Based Decision Support System. Procedia Comput. Sci. 2023, 221, 232–236. [Google Scholar] [CrossRef]
- Ramaswamy Govindan, A.; Li, X. Fuzzy Logic-Based Decision Support System for Automating Ergonomics Risk Assessments. Int. J. Ind. Ergon. 2023, 96, 103459. [Google Scholar] [CrossRef]
- ISO 45001:2018; Occupational Health and Safety Management Systems—A Practical Guide for Small Organizations. ISO: Geneva, Switzerland, 2018.
- ISO 31000:2018; Risk Management—Guidelines. International Standard Organization (ISO): Geneva, Switzerland, 2018.
- Peckol, J.K. Introduction to Fuzzy Logic, 1st ed.; John Wiley & Sons Ltd.: Bellingham, WA, USA, 2021. [Google Scholar]
- Maimaiti, N.; Wang, J.; Jin, X.; Wang, S.; Qin, D.; He, L.; Wang, F.; Zhang, Z.; Forsman, M.; Yang, L.; et al. Cervical Musculoskeletal Disorders and Their Relationships with Personal and Work-Related Factors among Electronic Assembly Workers. J. Saf. Res. 2019, 71, 79–85. [Google Scholar] [CrossRef]
- Lee, W.; Lin, J.-H.; Howard, N.; Bao, S. Methods for Measuring Physical Workload among Commercial Cleaners: A Scoping Review. Int. J. Ind. Ergon. 2022, 90, 103319. [Google Scholar] [CrossRef]
- Center for Disease Control and Prevention (CDC) Work-Related Musculoskeletal Disorders & Ergonomics. Available online: https://www.cdc.gov/niosh/ergonomics/about/index.html (accessed on 2 April 2025).
- Saatchi, R. Fuzzy Logic Concepts, Developments and Implementation. Information 2024, 15, 656. [Google Scholar] [CrossRef]
- Klir, G.J.; Yuan, B. Fuzzy Sets and Fuzzy Logic. Theory and Applications, 1st ed.; Prentice Hall PTR: Hoboken, NJ, USA, 1995. [Google Scholar]
- Ammar, S.; Wright, R. Applying Fuzzy-Set Theory to Performance Evaluation. Socio-Econ. Plan. Sci. 2000, 34, 285–302. [Google Scholar] [CrossRef]
- Özkaya, N.; Leger, D.; Goldsheyer, D.; Nordin, M. Fundamentals of Biomechanics. Equilibrium, Motion and Deformation, 4th ed.; Leger, D., Ed.; Springer: New York, NY, USA, 2017. [Google Scholar]
- Akbari, A.; Margolis, D. A Biomechanical Model of a Vehicle Passenger in the Sagittal Plane. Heliyon 2024, 10, e26375. [Google Scholar] [CrossRef] [PubMed]
- Abdullah, N.A.; Mohamad Shaberi, M.N.; Nordin, M.N.A.; Mohd Ripin, Z.; Razali, M.F.; Wan Mamat Ali, W.M.A.; Awang, B.; Ridzwan, M.I.Z. Field Measurement of Hand Forces of Palm Oil Harvesters and Evaluating the Risk of Work-Related Musculoskeletal Disorders (WMSDs) through Biomechanical Analysis. Int. J. Ind. Ergon. 2023, 96, 103468. [Google Scholar] [CrossRef]
- Chaffin, D.B.; Andersson, G.B.J.; Martin, B.J. Occupational Biomechanics, 4th ed.; John Wiley & Sons: Hoboken, NJ, USA, 2006; ISBN 978-0-471-72343-1. [Google Scholar]
- ISO/TR 7250-2:2024; Basic Human Body Measurements for Technological Design—Part 2: Statistical Summaries of Body Measurements from National Populations. International Organization for Standardization: Geneva, Switzerland, 2024.
- ISO 14738:2002; Safety of Machinery—Anthropometric Requirements for the Design of Workstations at Machinery. International Organization for Standardization: Geneva, Switzerland, 2002.
- Pinder, A.D.J.; Fothergill, D.M.; Grieve, D.W. System for the Triaxial Measurement of Manual Force Exertions. Clin. Biomech. 1993, 8, 120–126. [Google Scholar] [CrossRef]
- MassirisFernández, M.; Fernández, J.Á.; Bajo, J.M.; Delrieux, C.A. Ergonomic Risk Assessment Based on Computer Vision and Machine Learning. Comput. Ind. Eng. 2020, 149, 106816. [Google Scholar] [CrossRef]
- Gambatese, J.; Jin, Z. Identification and Assessment of Musculoskeletal Disorders (MSDs) Risk for Concrete Formwork Systems; CPWR: Silver Spring, MD, USA, 2021. [Google Scholar]
- Aiello, G.; Certa, A.; Abusohyon, I.; Longo, F.; Padovano, A. Machine Learning Approach towards Real Time Assessment of Hand-Arm Vibration Risk. IFAC-PapersOnLine 2021, 54, 1187–1192. [Google Scholar] [CrossRef]
- Incekara, C.O. Post-COVID-19 Ergonomic School Furniture Design under Fuzzy Logic. Work 2021, 69, 1197–1208. [Google Scholar] [CrossRef]
- Falahati, M.; Dehghani, F.; Malakoutikhah, M.; Karimi, A.; Zare, A. Using Fuzzy Logic Approach to Predict Work-Related Musculoskeletal Disorders among Automotive Assembly Workers. Med. J. Islam. Repub. Iran 2019, 33, 136. [Google Scholar] [CrossRef]
- Ani, M.F.; Fukumi, M.; RahayuKamat, S.; Minhat, M.; Husain, K. Development of Driving Fatigue Strain Index Using Fuzzy Logic to Analyze Risk Levels of Driving Activity. IEEJ Trans. Electr. Electron. Eng. 2019, 14, 1764–1771. [Google Scholar] [CrossRef]
- Contreras-Valenzuela, M.R.; Seuret-Jiménez, D.; Hdz-Jasso, A.M.; León Hernández, V.A.; Abundes-Recilla, A.N.; Trutié-Carrero, E. Design of a Fuzzy Logic Evaluation to Determine the Ergonomic Risk Level of Manual Material Handling Tasks. Int. J. Environ. Res. Public Health 2022, 19, 6511. [Google Scholar] [CrossRef]
- Karwowski, W.; Gaweda, A.; Marras, W.S.; Davis, K.; Zurada, J.M.; Rodrick, D. A Fuzzy Relational Rule Network Modeling of Electromyographical Activity of Trunk Muscles in Manual Lifting Based on Trunk Angels, Moments, Pelvic Tilt and Rotation Angles. Int. J. Ind. Ergon. 2006, 36, 847–859. [Google Scholar] [CrossRef]
- Albzeirat, M.K.; Alkhawaldeh, O.M.; Suffer, K.H. ENHANCING EFFICIENCY OF THE RULA BY INTERFERING WITH FUZZY LOGIC. J. Theor. Appl. Inf. Technol. 2022, 100, 5193–5201. [Google Scholar]
- Golabchi, A.; Han, S.; Fayek, A.R. A Fuzzy Logic Approach to Posture-Based Ergonomic Analysis for Field Observation and Assessment of Construction Manual Operations. Can. J. Civ. Eng. 2016, 43, 294–303. [Google Scholar] [CrossRef]
- Kamala, V.; Robert, T.P. FUZZY-LOGIC-BASED ERGONOMIC ASSESSMENT IN AN AUTOMOTIVE INDUSTRY. S. Afr. J. Ind. Eng. 2022, 33. [Google Scholar] [CrossRef]
- Patel, H.; Patel, H.K.; Dinner, I. Fuzzy Logic Based Elbow Strength Prediction for Lateral Epicondylitis. Int. J. Health Sci. 2022, 4307–4313. [Google Scholar] [CrossRef]
- Liu, Y.; Hu, W.; Kasal, A.; Erdil, Y.Z. The State of the Art of Biomechanics Applied in Ergonomic Furniture Design. Appl. Sci. 2023, 13, 12120. [Google Scholar] [CrossRef]
- Chaffin, D.B.; Erig, M. Three-Dimensional Biomechanical Static Strength Prediction Model Sensiticity to Postural and Anthropometric Inaccuracies. IEE Trans. 1991, 23, 215–227. [Google Scholar]
- ISO 11228-3 (E); Ergonomics Manual 68 Handling Part 3: Handling of Low Loads at High Frequency. International Standard Organization: Geneva, Switzerland, 2007.
- NOM-036-1-STPS-2018; Factores de Riesgo Ergonómico En El Trabajo-Identificación, Análisis, Prevención y Control. Parte 1: Manejo Manual de Cargas. Secretaría del Trabajo y Previsión Social NORMA Oficial Mexicana (STPS): Delegación Tlalpan, Mexico, 2018.
- National Institute of Health (Ed.) National Institute of Health Practical Guide to the Identification, Evaluation, and Treatment of Overweight and Obesity in Adults, 1st ed.; NIH: Columbia, DC, USA, 2000. [Google Scholar]
- Plagenhoef, S.; Evans, F.G.; Abdelnour, T. Anatomical Data for Analyzing Human Motion. Res. Q. 1983, 54, 169–178. [Google Scholar]
- Neumann, D.A. Kinesiology of the Musculoskeletal System. Fundations for Rehabilitation, 3rd ed.; Elsevier: North York, ON, Canada, 2017. [Google Scholar]
- Winter, D.A. Biomechanics and Motor Control of Human Movement, 4th ed.; John Wiley &Sons, Inc.: Toronto, ON, Canada, 2009. [Google Scholar]
| Authors | Accessible Software | Includes Biomechanic Model | Includes Anthropometric Workers’ Characteristics | Includes Productivity Work Characteristics | Reduced Fuzzy Rules | Multiple Assessment |
|---|---|---|---|---|---|---|
| Ramaswamy and Li [8] | ✓ | |||||
| Incekara [28] | ✓ | |||||
| Falahati et al. [29] | ✓ | |||||
| Ani et al. [30] | ✓ | |||||
| Contreras et al. [31] | ✓ | |||||
| Karwowski et al. [32] | ✓ | ✓ | ||||
| Saatchi [15] | ✓ | ✓ | ||||
| Albzeirat et al. [37] | ✓ | ✓ | ✓ | |||
| Golabchi [34] | ✓ | |||||
| Kamala and Robert [35] | ✓ | ✓ | ||||
| Patel et al. [36] | ✓ | ✓ | ||||
| Liu et al. [37] | ✓ | ✓ | ||||
| Biomechanical fuzzy model proposed in this paper | ✓ | ✓ | ✓ | ✓ | ✓ | ✓ |
| Membership Function | Theoretical Basis | Parameters | ||
|---|---|---|---|---|
| Low Risk | Medium Risk | High Risk | ||
| Moment force (MF) | Chaffin et al. [21,38] | 0 to 30 Nm | 15 to 45 Nm | 30 to 60 Nm |
| Applied force (AF) | ISO 11228-3 [39] | 0 to 25 N | 15 to 45 N | 35 to 80 N |
| Angle (θ) from vertical torso | Chaffin et al. [21] | 0 to 40 degrees | 25 to 70 degrees | 55 to 180 degrees |
| Age (A) | NOM 036-1 STPS [40] | 18 to 35 years old | 20 to 50 years old | 35 to 65 years old |
| Height (H) | ISO 14738 [23] | 190 to 160 cm | 170 to 150 cm | 1500 to 140 cm |
| Body mass index (BMI) | NIH [41] | 18 to 30 kg/m2 | 25 to 35 kg/m2 | 30 to 60 kg/m2 |
| Exposition time | ISO 11228-3 [39] | 0 to 240 min | 30 to 420 min | 240 to 480 min |
| Working area depth | ISO 14738 [23] | 170 to 300 cm | 230 to 370 cm | 300 to 500 cm |
| Repetitiveness | ISO 11228-3 [39] | 0 to 700 repetitions | 200 to 1200 repetitions | 700 to 1500 repetitions |
| Worker | MF | MFLOW | MFMED | MFHIGH | AF | AFLOW | AFMED | AFHIGH | θ | θLOW | θMED | θHIGH | θoMF∩AF |
|---|---|---|---|---|---|---|---|---|---|---|---|---|---|
| W1 | 40.06 | 0.00 | 0.32 | 0.50 | 49.22 | 0.00 | 0.00 | 0.95 | 32.53 | 0.37 | 0.38 | 0.00 | 0.57 |
| W2 | 41.30 | 0.00 | 0.23 | 0.57 | 50.74 | 0.00 | 0.00 | 1.00 | 35.52 | 0.22 | 0.53 | 0.00 | 0.81 |
| W3 | 34.43 | 0.00 | 0.69 | 0.22 | 42.30 | 0.00 | 0.18 | 0.49 | 33.71 | 0.31 | 0.44 | 0.00 | 0.53 |
| W4 | 40.06 | 0.00 | 0.32 | 0.50 | 49.22 | 0.00 | 0.00 | 0.95 | 33.54 | 0.32 | 0.43 | 0.00 | 1.00 |
| W5 | 41.30 | 0.00 | 0.23 | 0.57 | 50.74 | 0.00 | 0.00 | 1.00 | 31.90 | 0.41 | 0.34 | 0.00 | 0.66 |
| W6 | 38.75 | 0.00 | 0.40 | 0.44 | 47.50 | 0.00 | 0.00 | 0.84 | 35.33 | 0.23 | 0.52 | 0.00 | 0.52 |
| W7 | 40.34 | 0.00 | 0.30 | 0.52 | 49.45 | 0.00 | 0.00 | 0.97 | 33.03 | 0.35 | 0.40 | 0.00 | 0.65 |
| W8 | 45.85 | 0.00 | 0.00 | 0.79 | 55.82 | 0.00 | 0.00 | 1.00 | 32.70 | 0.37 | 0.38 | 0.00 | 0.63 |
| W9 | 42.60 | 0.00 | 0.15 | 0.63 | 51.86 | 0.00 | 0.00 | 1.00 | 33.54 | 0.32 | 0.43 | 0.00 | 0.67 |
| W10 | 43.95 | 0.00 | 0.06 | 0.70 | 53.39 | 0.00 | 0.00 | 1.00 | 34.41 | 0.28 | 0.47 | 0.00 | 0.91 |
| Worker | Age | ALOW | AMED | AHIGH | Height | HHIGH | HMED | HLOW | BMI | BMILOW | BMIMED | BMIHIGH | A∩H∩BMI |
|---|---|---|---|---|---|---|---|---|---|---|---|---|---|
| W1 | 21 | 0.93 | 0.07 | 0.00 | 143 | 0.70 | 0.20 | 0.00 | 28.51 | 0.00 | 0.70 | 0.00 | 0.70 |
| W2 | 48 | 0.00 | 0.13 | 1.00 | 143 | 0.70 | 0.20 | 0.00 | 29.39 | 0.00 | 0.88 | 0.00 | 0.70 |
| W3 | 48 | 0.00 | 0.13 | 1.00 | 143 | 0.70 | 0.20 | 0.00 | 24.50 | 0.55 | 0.00 | 0.00 | 0.55 |
| W4 | 21 | 0.93 | 0.07 | 0.00 | 143 | 0.70 | 0.20 | 0.00 | 28.51 | 0.00 | 0.70 | 0.00 | 0.70 |
| W5 | 55 | 0.00 | 0.00 | 1.00 | 143 | 0.70 | 0.20 | 0.00 | 29.39 | 0.00 | 0.88 | 0.00 | 0.70 |
| W6 | 37 | 0.00 | 0.87 | 0.20 | 144 | 0.60 | 0.27 | 0.00 | 27.01 | 0.00 | 0.40 | 0.00 | 0.40 |
| W7 | 26 | 0.60 | 0.40 | 0.00 | 144 | 0.60 | 0.27 | 0.00 | 28.12 | 0.00 | 0.62 | 0.00 | 0.60 |
| W8 | 47 | 0.00 | 0.20 | 1.00 | 147 | 0.30 | 0.47 | 0.00 | 30.03 | 0.00 | 0.99 | 0.00 | 0.47 |
| W9 | 21 | 0.93 | 0.07 | 0.00 | 147 | 0.30 | 0.47 | 0.00 | 27.91 | 0.00 | 0.58 | 0.00 | 0.47 |
| W10 | 42 | 0.00 | 0.53 | 0.70 | 148 | 0.20 | 0.54 | 0.00 | 28.21 | 0.00 | 0.64 | 0.00 | 0.54 |
| Test | ET (s) | R (Mov) | D (mm) | MASS (kg) | Biomechanic Membership θ o (MF∩AF) | AND | Anthropometrics Membership θ o(MF∩AF) ∩ (A∩H∩BM) | AND | Productivity Membership θ o(MF∩AF) ∩ (A∩H∩BM) ∩ (ET∩R∩D) | Maximum Risk Level | Risk Level Average |
|---|---|---|---|---|---|---|---|---|---|---|---|
| 1 | 60 | 60 | 200 | 1 | 0.43 to 1.00 | 0.34 to 0.91 | 0.14 | 0.57 | Very Low | ||
| 2 | 60 | 60 | 200 | 2 | 0.47 to 1.00 | 0.34 to 0.91 | 0.14 | 0.57 | Very Low | ||
| 3 | 60 | 60 | 200 | 3 | 0.67 to 1.00 | 0.34 to 0.91 | 0.14 | 0.57 | Very Low | ||
| 4 | 120 | 120 | 300 | 1 | 0.44 to 1.00 | 0.34 to 0.91 | 0.34 to 0.43 | 1.71 | Low | ||
| 5 | 120 | 120 | 300 | 2 | 0.47 to 1.00 | 0.34 to 0.91 | 0.34 to 0.43 | 1.71 | Low | ||
| 6 | 120 | 120 | 300 | 3 | 0.67 to 1.00 | 0.34 to 0.91 | 0.34 to 0.43 | 1.71 | Low | ||
| 7 | 180 | 180 | 200 | 1 | 0.43 to 1.00 | 0.34 to 0.75 | 0.028 | 1.12 | Low | ||
| 8 | 180 | 180 | 200 | 2 | 0.47 to 1.00 | 0.34 to 0.91 | 0.028 | 1.12 | Low | ||
| 9 | 180 | 180 | 200 | 3 | 0.67 to 1.00 | 0.34 to 0.91 | 0.028 | 1.12 | Low | ||
| 10 | 240 | 240 | 300 | 1 | 0.43 to 1.00 | 0.34 to 0.91 | 0.35 to 0.68 | 2.70 | Medium | ||
| 11 | 240 | 240 | 300 | 2 | 0.47 to 1.00 | 0.34 to 0.91 | 0.35 to 0.68 | 2.70 | Medium | ||
| 12 | 240 | 240 | 300 | 3 | 0.67 to 1.00 | 0.34 to 0.91 | 0.35 to 0.68 | 2.70 | Medium | ||
| 13 | 300 | 300 | 200 | 1 | 0.43 to 1.00 | 0.34 to 0.91 | 0.35 to 0.41 | 1.64 | Low | ||
| 14 | 300 | 300 | 200 | 2 | 0.47 to 1.00 | 0.34 to 0.91 | 0.35 to 0.41 | 1.64 | Low | ||
| 15 | 300 | 300 | 200 | 3 | 0.67 to 1.00 | 0.34 to 0.91 | 0.35 to 0.41 | 1.64 | Low | ||
| 16 | 360 | 360 | 300 | 1 | 0.43 to 1.00 | 0.34 to 0.91 | 0.32 | 1.27 | Low | ||
| 17 | 360 | 360 | 300 | 2 | 0.47 to 1.00 | 0.34 to 0.91 | 0.32 | 1.27 | Low | ||
| 18 | 360 | 360 | 300 | 3 | 0.67 to 1.00 | 0.34 to 0.91 | 0.32 | 1.27 | Low | ||
| 19 | 420 | 420 | 200 | 1 | 0.43 to 1.00 | 0.34 to 0.91 | 0.35 to 0.50 | 2.00 | Medium | ||
| 20 | 420 | 420 | 200 | 2 | 0.47 to 1.00 | 0.34 to 0.91 | 0.35 to 0.50 | 2.00 | Medium | ||
| 21 | 420 | 420 | 200 | 3 | 0.67 to 1.00 | 0.34 to 0.91 | 0.35 to 0.50 | 2.00 | Medium | ||
| 22 | 480 | 480 | 300 | 1 | 0.43 to 1.00 | 0.34 to 0.91 | 0.35 to 0.68 | 2.70 | Medium | ||
| 23 | 480 | 480 | 300 | 2 | 0.47 to 1.00 | 0.34 to 0.91 | 0.35 to 0.68 | 2.70 | Medium | ||
| 24 | 480 | 480 | 300 | 3 | 0.67 to 1.00 | 0.34 to 0.91 | 0.35 to 0.68 | 2.70 | Medium | ||
| 25 | 540 | 540 | 200 | 1 | 0.43 to 1.00 | 0.34 to 0.91 | 0.35 to 0.75 | 3.06 | High | ||
| 26 | 540 | 540 | 200 | 2 | 0.47 to 1.00 | 0.34 to 0.91 | 0.35 to 0.75 | 3.06 | High | ||
| 27 | 540 | 540 | 200 | 3 | 0.67 to 1.00 | 0.34 to 0.91 | 0.35 to 0.75 | 3.06 | High | ||
| 28 | 600 | 600 | 300 | 1 | 0.43 to 1.00 | 0.34 to 0.91 | 0.35 to 0.75 | 3.17 | High | ||
| 29 | 600 | 600 | 300 | 2 | 0.47 to 1.00 | 0.34 to 0.91 | 0.35 to 0.75 | 3.17 | High | ||
| 30 | 600 | 600 | 300 | 3 | 0.67 to 1.00 | 0.34 to 0.91 | 0.35 to 0.75 | 3.17 | High |
Disclaimer/Publisher’s Note: The statements, opinions and data contained in all publications are solely those of the individual author(s) and contributor(s) and not of MDPI and/or the editor(s). MDPI and/or the editor(s) disclaim responsibility for any injury to people or property resulting from any ideas, methods, instructions or products referred to in the content. |
© 2025 by the author. Licensee MDPI, Basel, Switzerland. This article is an open access article distributed under the terms and conditions of the Creative Commons Attribution (CC BY) license (https://creativecommons.org/licenses/by/4.0/).
Share and Cite
Contreras-Valenzuela, M.R. Biomechanical Fuzzy Model for Analysing the Ergonomic Risk Level Associated with Upper Limb Movements. Appl. Sci. 2025, 15, 4012. https://doi.org/10.3390/app15074012
Contreras-Valenzuela MR. Biomechanical Fuzzy Model for Analysing the Ergonomic Risk Level Associated with Upper Limb Movements. Applied Sciences. 2025; 15(7):4012. https://doi.org/10.3390/app15074012
Chicago/Turabian StyleContreras-Valenzuela, Martha Roselia. 2025. "Biomechanical Fuzzy Model for Analysing the Ergonomic Risk Level Associated with Upper Limb Movements" Applied Sciences 15, no. 7: 4012. https://doi.org/10.3390/app15074012
APA StyleContreras-Valenzuela, M. R. (2025). Biomechanical Fuzzy Model for Analysing the Ergonomic Risk Level Associated with Upper Limb Movements. Applied Sciences, 15(7), 4012. https://doi.org/10.3390/app15074012