Article

Big Data-Driven 3D Visualization Analysis System for Promoting Regional-Scale Digital Geological Exploration

1
School of Computer Science, China University of Geosciences, Wuhan 430074, China
2
Hubei Provincial Engineering Research Center of Intelligent Geological Resources Environment Technology, Wuhan 430074, China
3
Engineering Technology Innovation Center of Mineral Resources Explorations in Bedrock Zones, Ministry of Natural Resources, Guiyang 550081, China
4
State Key Laboratory of Biogeology and Environmental Geology, Wuhan 430074, China
5
Hubei Key Laboratory of Intelligent Geo-Information Processing, Wuhan 430078, China
6
Key Laboratory of Urban Land Resources Monitoring and Simulation, Ministry of Natural Resources, Shenzhen 518000, China
7
Guizhou Key Laboratory for Strategic Mineral Intelligent Exploration, Guiyang 550081, China
*
Author to whom correspondence should be addressed.
Appl. Sci. 2025, 15(7), 4003; https://doi.org/10.3390/app15074003
Submission received: 27 February 2025 / Revised: 29 March 2025 / Accepted: 31 March 2025 / Published: 4 April 2025
(This article belongs to the Special Issue Technologies and Methods for Exploitation of Geological Resources)

Abstract

:
As geological exploration technology advances, geoscience relies on digitization and intelligence to address challenges such as data fragmentation, multi-source heterogeneity, and visual analysis. This study develops a big data-driven 3D visual analysis system for regional-scale applications. The system integrates three core technological components: (1) a heterogeneous cloud resource scheduling method employing an optimized CMMN algorithm with unified cloud API standardization to enhance task distribution efficiency; (2) a block model-based dynamic data aggregation approach utilizing semantic unification and attribute mapping for multi-source geological data integration; (3) a GPU-accelerated rendering framework implementing occlusion culling and batch processing to optimize 3D visualization performance. Experimental validation shows the improved CMMN algorithm reduces cloud task completion time by 2.37% while increasing resource utilization by 0.652% compared with conventional methods. The dynamic data model integrates 12 geological data types across eight categories through semantic mapping. Rendering optimizations achieve a 93.7% memory reduction and 60.6% faster visualization compared with baseline approaches. This system provides robust decision support and reliable tools for the digital transformation of geoscience work.

1. Introduction

Mineral resources are a critical material foundation for social development, and the exploration and development of these resources directly impact the national economy, people’s livelihoods, and national security [1]. In the digital exploration process, Guizhou Province has accumulated multi-source, multi-type, and heterogeneous geological data and has established multiple database types [2,3]. However, data fragmentation, multi-source heterogeneity, and complex integration remain prominent, making it difficult to integrate and visualize geological information effectively [4]. These challenges have become a key bottleneck in the advancement of digital exploration.
In recent years, with the rapid development of geological exploration technology, digital and intelligent methods have gradually become essential driving forces for transforming and upgrading the geoscience industry [5,6,7]. Geological big data technology provides new approaches to address the issues of data fragmentation and complex integration [8]. Integrating and visualizing multi-source data have significantly improved geological information expression and utilization efficiency, offering more accurate decision support for resource evaluation, mining planning, and environmental protection [9]. For example, Maljers et al. (2015) [10] compared three voxel models from the Netherlands Geological Survey. They found that the finest GeoTOP model better delineates geological features such as river channels and accurately predicts extractability. Their findings emphasize the importance of matching model scale with practical application needs. Yang et al. (2025) [11] developed a Geographic Data Modeling and Management System (GEM2S) that features interactive query functions, introduces new criteria for data evaluation, and integrates geophysical data to enhance the quality of geological models. However, regional-scale geological data are vast, high-dimensional, and complexly interrelated. Existing systems often focus on single data types or localized analysis, making it challenging to handle multiscale spatial analysis, data aggregation, and multi-theme attribute expression and are unable to provide a unified, comprehensive, integrated data view [12,13]. This system faces three challenges in practical application: (1) Various units have established independent data and migrated data to the available managed geological big data. However, differences in storage, formats, and interfaces among cloud platform architectures have led to a lack of effective interoperability and sharing mechanisms, failing to resolve the issue of information silos [14]. This severely limits cross-departmental and cross-domain collaboration and hinders the efficient utilization and sharing of data resources [15]. (2) Geological data lack unified standards in format, semantics, and spatial coordinate systems, requiring tedious conversion and reconstruction for data from different sources [13]. This increases the complexity of data fusion and analysis, impacting the efficiency and accuracy of data processing. (3) Regional-scale geological data are vast and densely distributed. Traditional rendering techniques in 3D environments often result in unnecessary rendering, leading to wasted computational resources and delayed interactive responses, severely affecting the efficiency of visual analysis and user experience [16].
To address the above challenges, a big data-driven 3D visual analysis system for promoting regional-scale digital geological exploration is proposed. First, to tackle the issues of resource isolation and task scheduling complexity in heterogeneous cloud environments during regional-scale digital exploration, a strategy for the unified management and adaptive scheduling of heterogeneous clouds is introduced. This strategy eliminates isolation among cloud platforms by constructing a unified standard cloud API and user management, resource management, and monitoring modules. It optimizes task distribution and resource utilization by using an improved Cloud Min–Max Standard Scheduling (CMMN) algorithm. Next, a dynamic aggregation method for geological data based on block models is proposed to address heterogeneous geological data’s multi-source and fusion difficulties. This method integrates structured and semi-structured data through a unified semantic library, attribute mapping, and place-name space mapping library and links unstructured data to the block model based on spatial relevance and priority principles. Finally, to solve the issue of low network transmission and rendering efficiency caused by large volumes of 3D geological data, a rendering optimization method for 3D visual analysis is employed. This method includes an occlusion culling strategy, which reduces unnecessary rendering objects in a two-stage process, and a batch rendering strategy, which balances the CPU and GPU workload by optimizing the number of Draw Calls to achieve efficient rendering. By integrating multi-source heterogeneous data management, optimizing resource scheduling and task distribution, and implementing efficient rendering strategies, the system effectively addresses challenges in data integration, resource sharing, and visualization efficiency in digital exploration. The construction of this system provides powerful tools for the digital transformation of geological exploration and will be validated for its efficiency and feasibility through practical application cases.

2. Related Works

2.1. Resource Integration and Task Scheduling in Heterogeneous Clouds

The unified management and adaptive scheduling of heterogeneous clouds are essential research directions in cloud computing, focusing primarily on resource integration, scheduling efficiency, and optimization strategies in multi-cloud environments. The CYCLONE project proposed by Slawik et al. (2015) [17] simplifies the management and deployment of multi-cloud platforms through open standards and APIs, enhancing the security of cloud environments. CloudLightning Ontology (CL-Ontology), proposed by Castane et al. (2018) [18], effectively supports the interoperability of heterogeneous resources, demonstrating significant advantages in high-performance computing and cloud resource management. Yang et al. (2019) [19] developed a heterogeneous cloud storage platform that integrates multiple solutions by using Software-Defined Storage (SDS) technology, optimizing data distribution and storage efficiency. In the field of task scheduling for heterogeneous clouds, Panda et al. (2015) [20] proposed three scheduling algorithms: MCC, MEMAX, and CMMN; optimized from the perspectives of load balancing, task completion time, and resource utilization efficiency, the CMMN algorithm demonstrating strong adaptability in load balancing and task scheduling efficiency. The MSLBL algorithm proposed by Chen et al. (2017) [21] considers economic constraints, optimizing task execution time within budget limits and making it suitable for cost-sensitive scheduling scenarios. Furthermore, the ETSA algorithm balances task completion time and energy consumption, reducing energy usage while achieving the efficient scheduling of cloud resources [22]. The GWO-GA algorithm proposed by Behera et al. (2024) [23] integrates completion time, energy consumption, and computational costs from a global optimization perspective, successfully balancing multiple objectives.
Despite advancements in heterogeneous cloud resource management and task scheduling, most studies primarily focus on single-dimensional resource allocation or specific task optimization. Provincial-scale digital exploration systems face significant challenges in integrating multi-source heterogeneous data and achieving platform interoperability, as they lack effective solutions for handling complex, multi-source, and large-scale geological datasets. Existing load-balancing algorithms, such as the GWO-GA global optimization method, fail to adequately account for the spatiotemporal correlation characteristics of geological data and real-time processing requirements when coordinating cross-regional, multimodal data scheduling.

2.2. Progress in Heterogeneous Geological Data Integration

In the field of geological data fusion, many studies focus on the integration of multi-source data and the quantification of uncertainty. Olierook et al. (2021) [24] integrated various geological data (such as stratigraphy, airborne magnetic surveys, and gravity measurements) into a 3D model, using a Bayesian inference framework and Markov Chain Monte Carlo (MCMC) sampling techniques to quantify model uncertainty. Zhuang et al. (2023) [25] proposed a method for extracting unstructured data from geological reports through a geological dictionary and pattern matching. They constructed a 3D model based on these structured data, enabling the effective fusion of report data. Wu et al. (2023) [26] introduced a point–surface data fusion method (PSDOF) based on optimal transport theory, combining geological survey points with remote sensing data to improve geological remote sensing interpretation (GRSI) accuracy. Research on data view construction primarily focuses on dynamic data presentation and interaction optimization, change detection and trend prediction, and personalized user navigation and display needs. The VAI framework proposed by Sjobergh et al. (2015) [27] combines visualization, analysis, and interaction to use the Storygraph tool to display spatial and temporal data, helping users filter and analyze dynamically. This approach addresses the interactivity issues in multidimensional data display. However, handling real-time updates and changes presents another challenge in data view construction. Stehle et al. (2020) [28] proposed a strategy to address change detection issues by automatically refreshing and using time-series functionality, helping users identify short-term and long-term data trends. Farmanbar et al. (2020) [29] optimized real-time data presentation and user navigation by constructing a multi-level big data view system with role-based design and providing rich interaction methods, emphasizing the adaptability between data presentation and user needs.
Previous studies have demonstrated significant advances in integrating and quantifying uncertainty in multi-source geological data through techniques such as Bayesian inference, pattern matching, and point-surface data fusion based on optimal transport theory. These developments provide fresh insights into dynamic data presentation, change detection, and real-time updates. However, current research often focuses on specific data types or individual domains, failing to fully address the challenge of achieving real-time, interactive aggregation in large-scale heterogeneous data environments. Therefore, integrating data from multiple platforms and formats to achieve dynamic, real-time information aggregation while optimizing data visualization and analysis methods is crucial to supporting digital transformation and enabling reliable decision making in geological exploration.

2.3. Progress in Large-Scale Geological Data Rendering

In the field of 3D geological model rendering optimization, research mainly focuses on improving the loading and display efficiency of large-scale data. To address this issue, several optimization strategies have been proposed. First, the use of a half-edge folding algorithm based on quadratic error metrics (QEMs), combined with a hierarchical Level of Detail (LOD) model and a tiled hierarchical structure tree, optimizes the display performance of 3D models, allowing for the efficient loading of 3D Tiles files on the Cesium platform (Wu et al., 2024) [30]. Second, Xu et al. (2023) [31] effectively alleviated data transmission pressure and improved rendering efficiency through data caching, asynchronous calls, error evaluation functions, visibility culling, and parallel rendering techniques based on data parallelism. Zhang et al. proposed the VDEC-HRT index structure, which, combined with pre-scheduling and culling techniques, optimized data retrieval and object traversal, reducing computational load during rendering (Zhang et al., 2022) [16]. Li et al. (2020) [32] also implemented a viewpoint-based LOD strategy to render multiscale reservoir models quickly while addressing gaps between meshes. Graciano et al. (2018) [33] used GPU-based ray-tracing technology and stack representation to enhance the rendering efficiency of volumetric terrain and geological structures and optimize loading speed by organizing texture data with space-filling curves.
The above discussion shows that by employing techniques such as the half-edge folding algorithm based on quadratic error metrics, hierarchical LOD models, and tiled layered structures, along with data caching, asynchronous calls, error evaluation, visibility culling, and parallel rendering, the loading and display efficiency of large-scale 3D geological models has been dramatically enhanced. These methods have achieved significant progress in data simplification, transmission, rendering acceleration, and the application of GPU technology but still face challenges in data consistency, real-time performance, and dynamic load balancing.

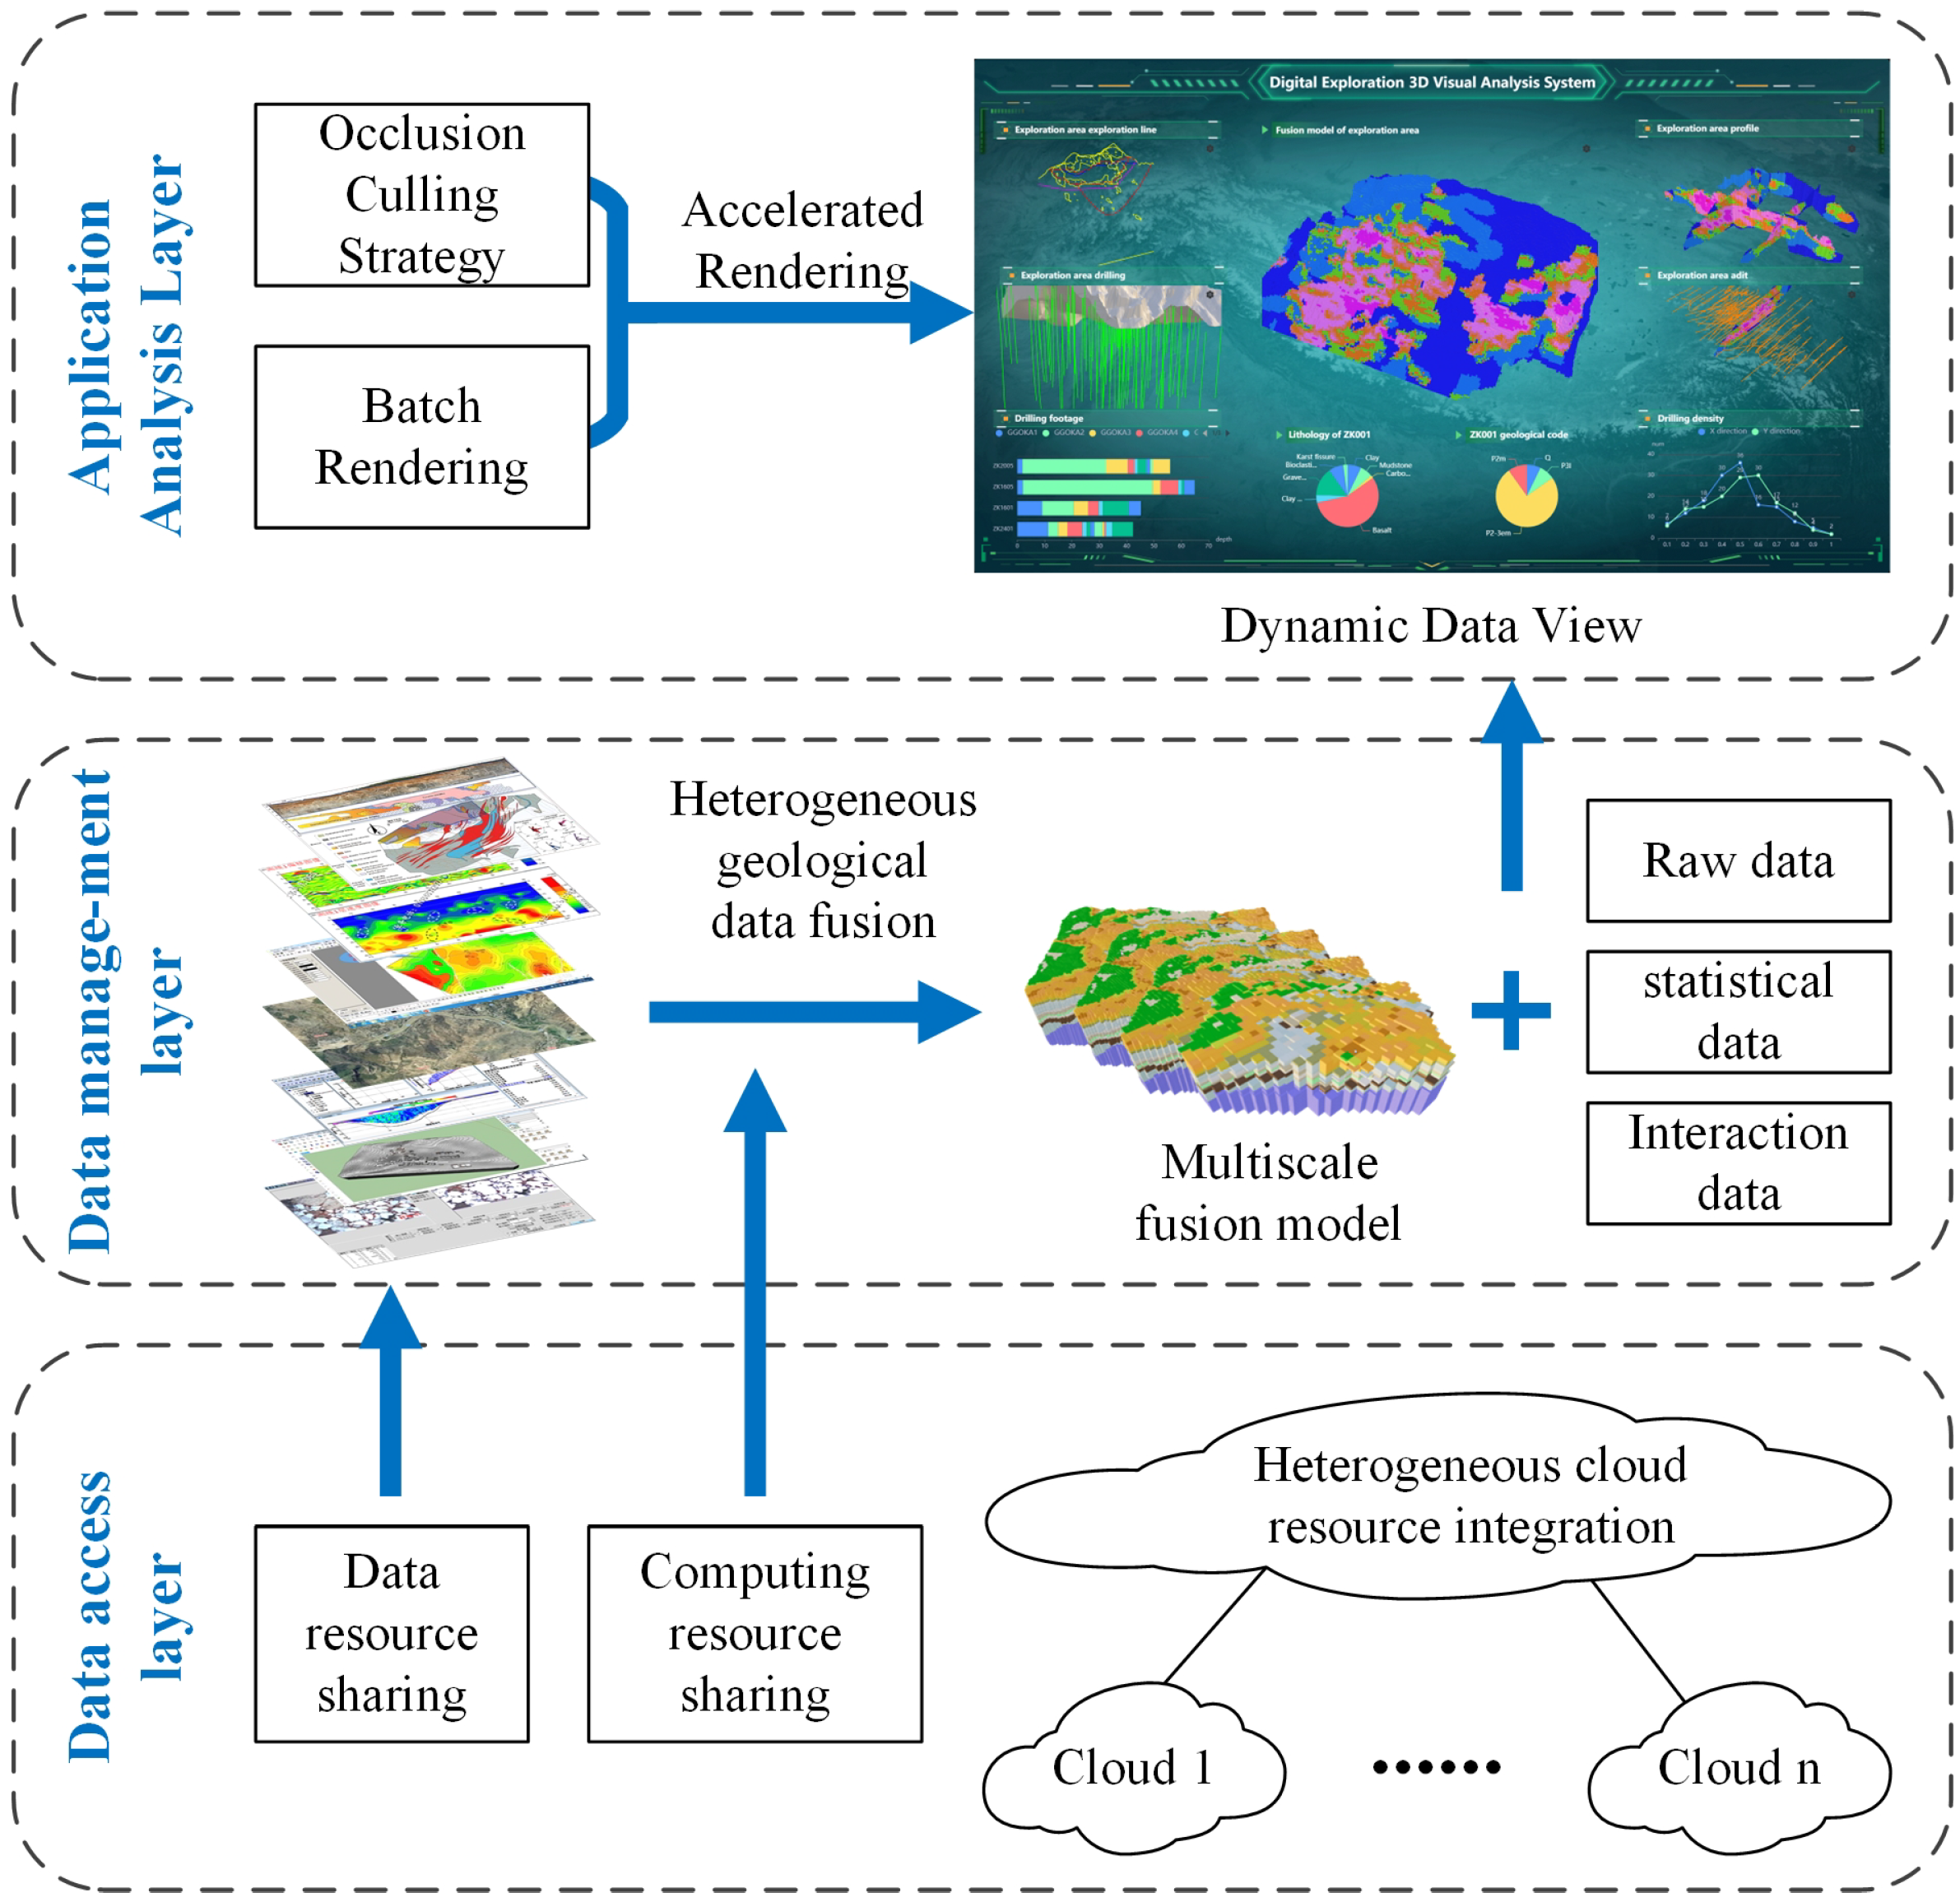
3. System Architecture and Key Technologies

The system architecture is designed around heterogeneous cloud management, dynamic data aggregation, and three-dimensional visual analysis, creating a clear, hierarchical, and highly integrated framework, as shown in Figure 1. The system employs heterogeneous cloud resource management and adaptive scheduling strategies to address the challenges of multi-source data access and the optimization of computational resource allocation. These strategies dynamically allocate computing resources across different cloud environments to achieve efficient data processing and the optimal utilization of computational resources, thereby reducing latency and enhancing processing capabilities. The dynamic aggregation method for heterogeneous geological data integrates and converts data from various sources, enabling seamless coupling and consistent data representation across multiple scales and sources. To meet the demands of three-dimensional visual analysis, the system introduces an optimized rendering strategy to improve the rendering efficiency and interaction performance of large-scale geological data, ensuring that users experience smooth operations and quick response times during the interactive visualization of complex geological data.

3.1. CMMN-Based Heterogeneous Cloud Resource Integration and Scheduling

Heterogeneous cloud resource integration focuses on data integration and resource management across platforms. Data are stored in private clouds, and applications are deployed on various platforms, creating resource fragmentation and information silos. Therefore, a framework for cloud resource integration and communication is established. An optimized CMMN-based adaptive task scheduling strategy is proposed to improve resource allocation efficiency, balance load, and reduce task completion time.

3.1.1. Heterogeneous Cloud Resource Integration Framework

The heterogeneous cloud resource integration framework addresses decentralized management across multiple platforms by creating a unified cloud management engine for resource interoperability and centralized control. It includes a standard cloud API, user and resource management, a monitoring system, and a portal API, ensuring compatibility and facilitating resource exchange among platforms. Figure 2 shows the architecture of the heterogeneous cloud management engine, which consists of five components.
The unified standard cloud API is the core of the heterogeneous cloud management engine, enabling the control of multiple cloud platforms through a single command. This simplifies operations, ensures compatibility, and facilitates future extensions. The unified user management module centralizes user account and permission control, enhancing security and accountability. The unified resource management module integrates resources from different platforms for centralized management and dynamic resource allocation, optimizing efficiency and load balancing. The unified monitoring management module allows for the real-time monitoring of cloud resources and devices, enabling timely alerts and quick responses to ensure stability and security. Finally, the portal API module provides a user-friendly interface for managing heterogeneous cloud resources.

3.1.2. Task Scheduling Optimization Based on CMMN Algorithm

In heterogeneous cloud task scheduling, traditional algorithms like Min–Min, Max–Min, Cloud List Scheduling (CLS), and Cloud Min–Min Scheduling (CMMS) are widely used but have limitations in resource allocation efficiency and flexibility. Min–Min and Max–Min focus on minimizing task completion time but fail to address load imbalance and resource utilization. At the same time, CLS and CMMS lack adaptability to dynamic resource and priority changes. The Cloud Min–Max Normalized (CMMN) strategy proposed by Panda and Jana (2019) [22] improves resource utilization, minimizes completion time, and struggles with exceptional tasks and task dependencies. We enhanced the CMMN algorithm by optimizing task dependencies and adjusting resource allocation to address these gaps. The improved algorithm handles complex scheduling in heterogeneous cloud environments, increasing resource efficiency and task flexibility.
The CMMN algorithm, outlined in Algorithm 1, begins by iterating through the current task set (Line 1) and checking if each task’s prerequisites are met (Line 2). For tasks meeting the requirements, their ready times and execution times across cloud platforms are updated (Lines 3–5) and added to the ready-to-schedule task set (Line 6) while being removed from the original task set (Lines 7–8). If the ready-to-schedule set is not empty (Line 9), the minimum and maximum values are calculated (Lines 10–11), and tasks are normalized based on their maximum values (Line 13). Tasks exceeding a user-defined threshold are classified as large tasks (Lines 14–15) and small tasks (Lines 16–17). Finally, the Min–Min algorithm is applied to schedule the extensive (Line 18) and small task sets (Line 19). The original CMMN algorithm uses extreme values from the ETC matrix for task classification, which can misclassify small tasks into large task batches during the cloud readiness phase, causing load imbalance. Therefore, we replaced extreme values with the median (Lines *10, *11, and *13), ensuring more accurate task classification and optimized load distribution. Additionally, the algorithm lacked consideration of predecessor task scheduling effects on successors. We introduced a correction step (Lines *3–*5) to adjust successor task completion times based on predecessor scheduling. This enhances task dependency handling, improves resource utilization, and reduces completion time.
Algorithm 1: Improved CMMN.
Applsci 15 04003 i001

3.2. Dynamic Integration of Heterogeneous Geological Data via Block Models

The block model-based dynamic integration method for heterogeneous geological data uses a unified data model to integrate structured, semi-structured, and unstructured data, enabling efficient multi-source data fusion and management. It includes two key components: geological data fusion, which optimizes integration through semantic, attribute, and spatial mapping libraries, and dynamic data views built and interacted with in a modular, demand-driven manner to enhance decision support.

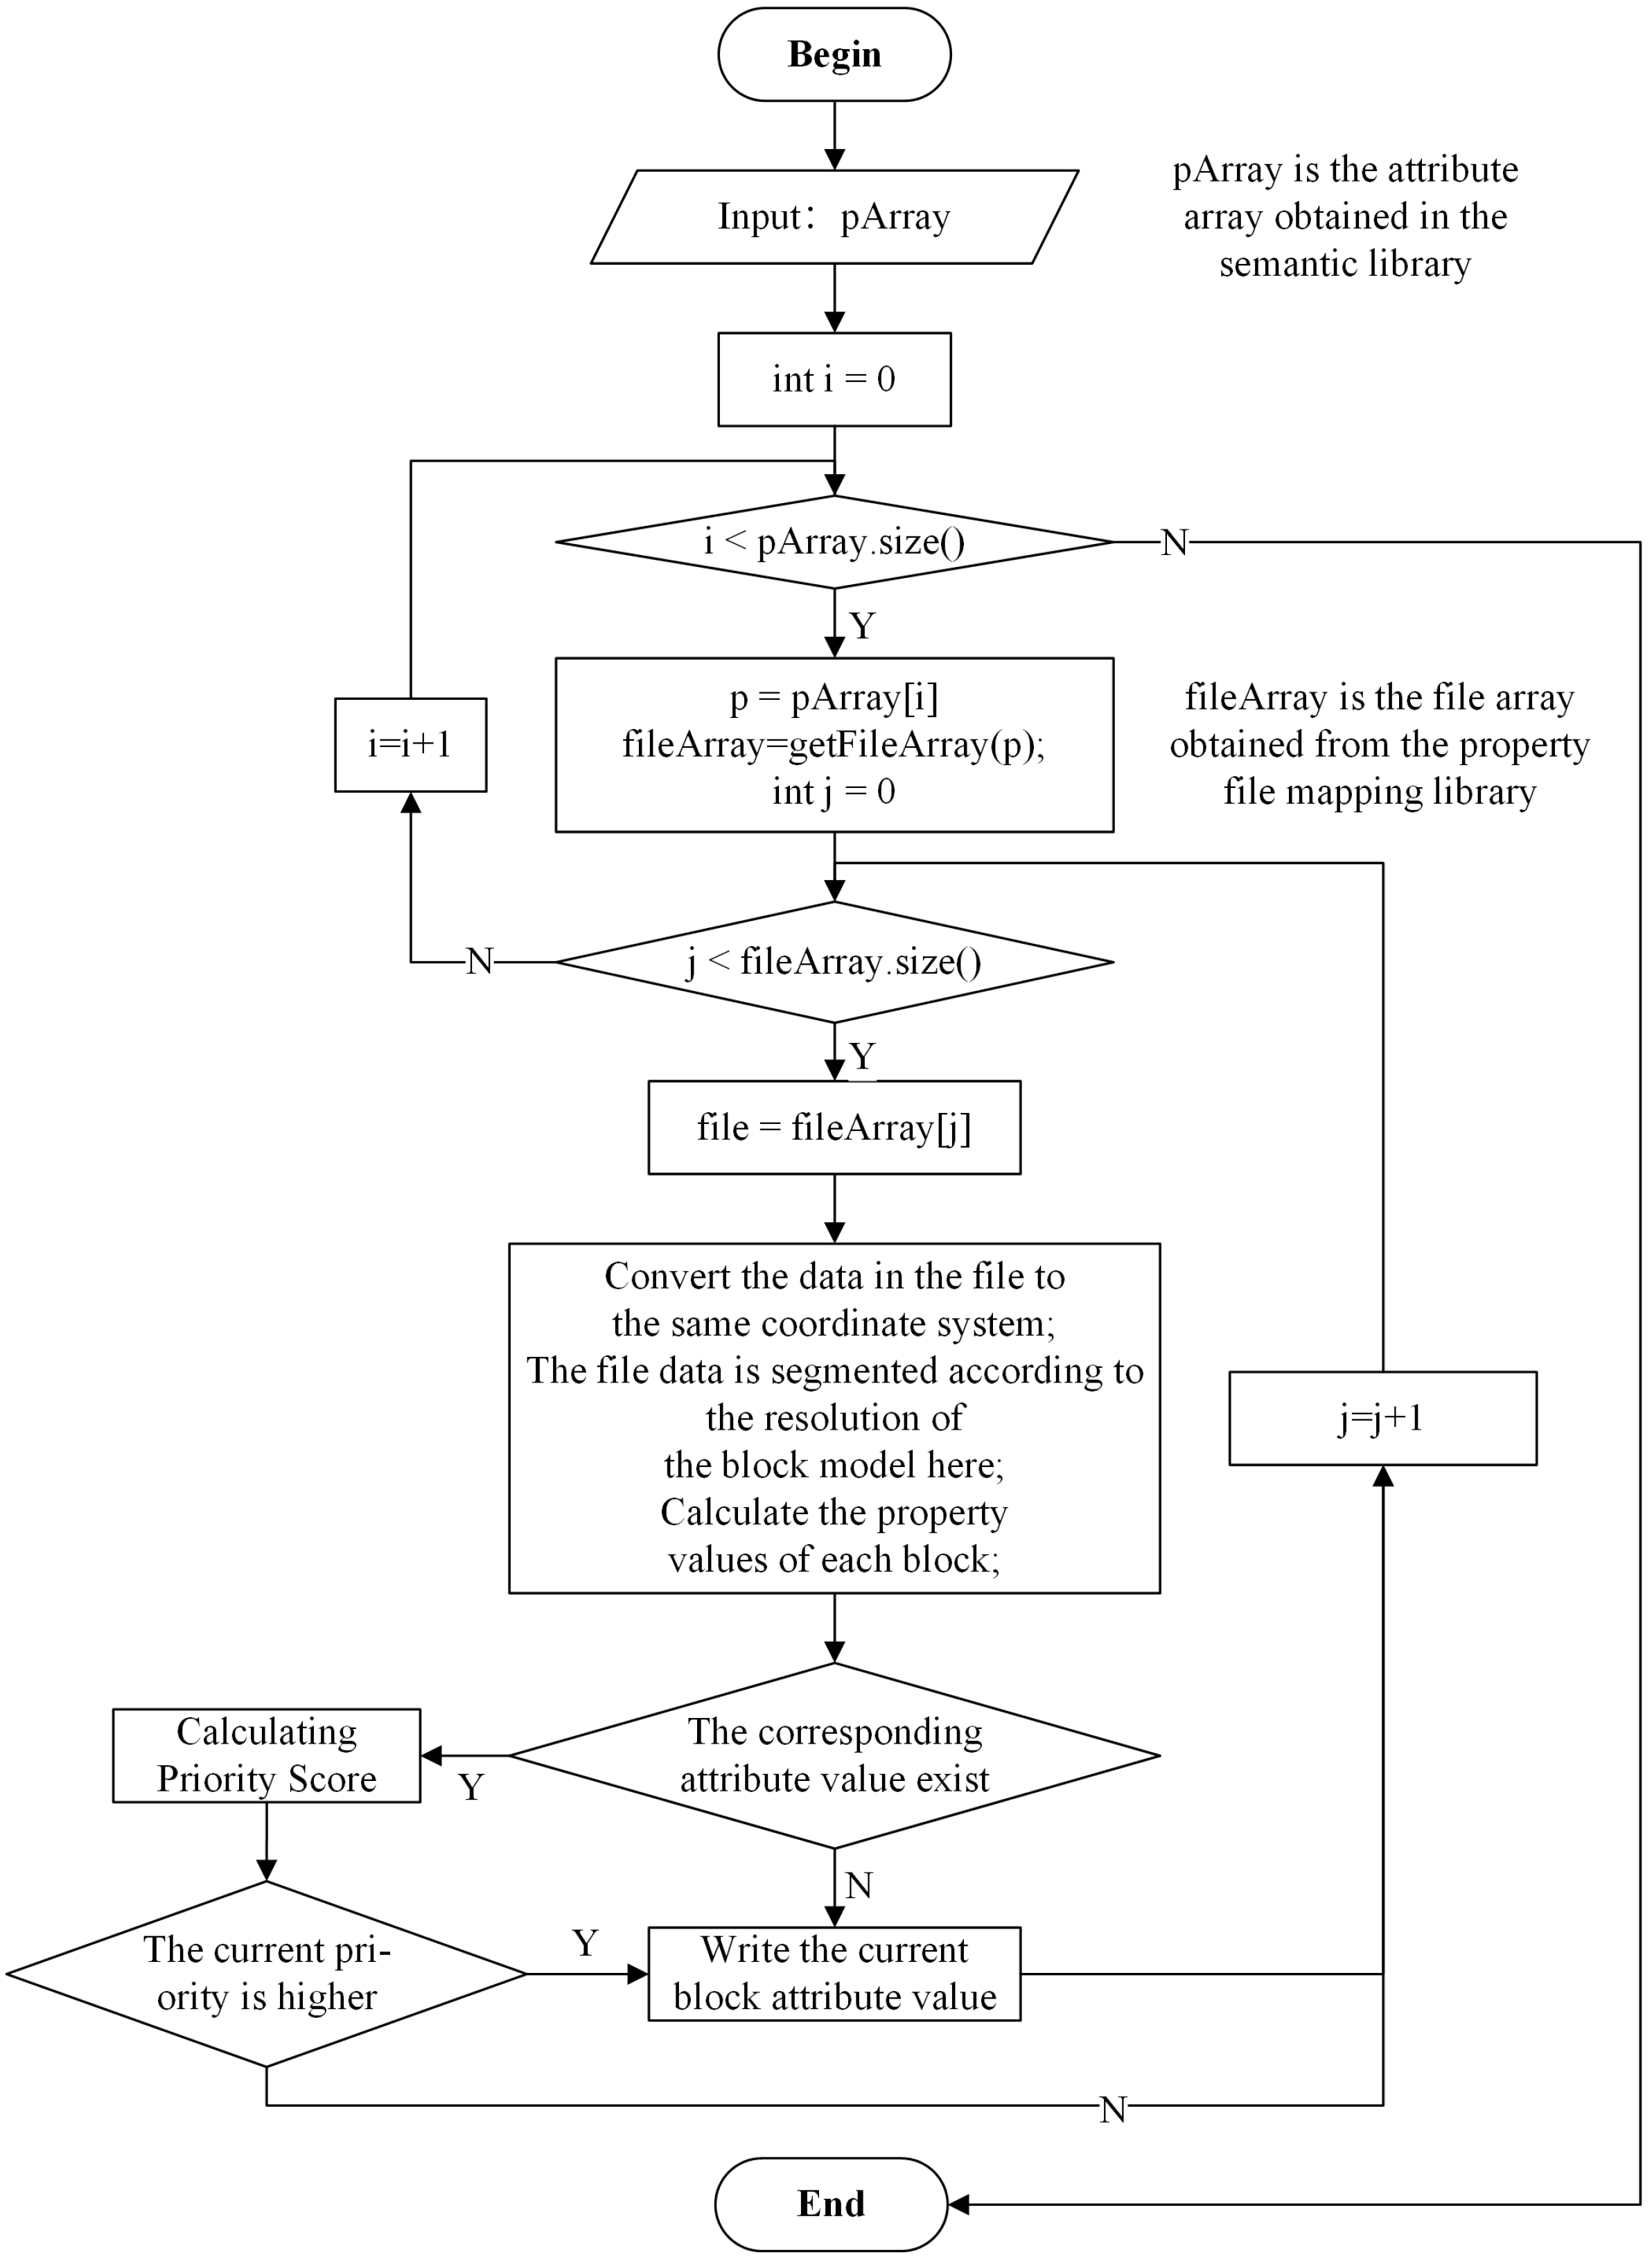
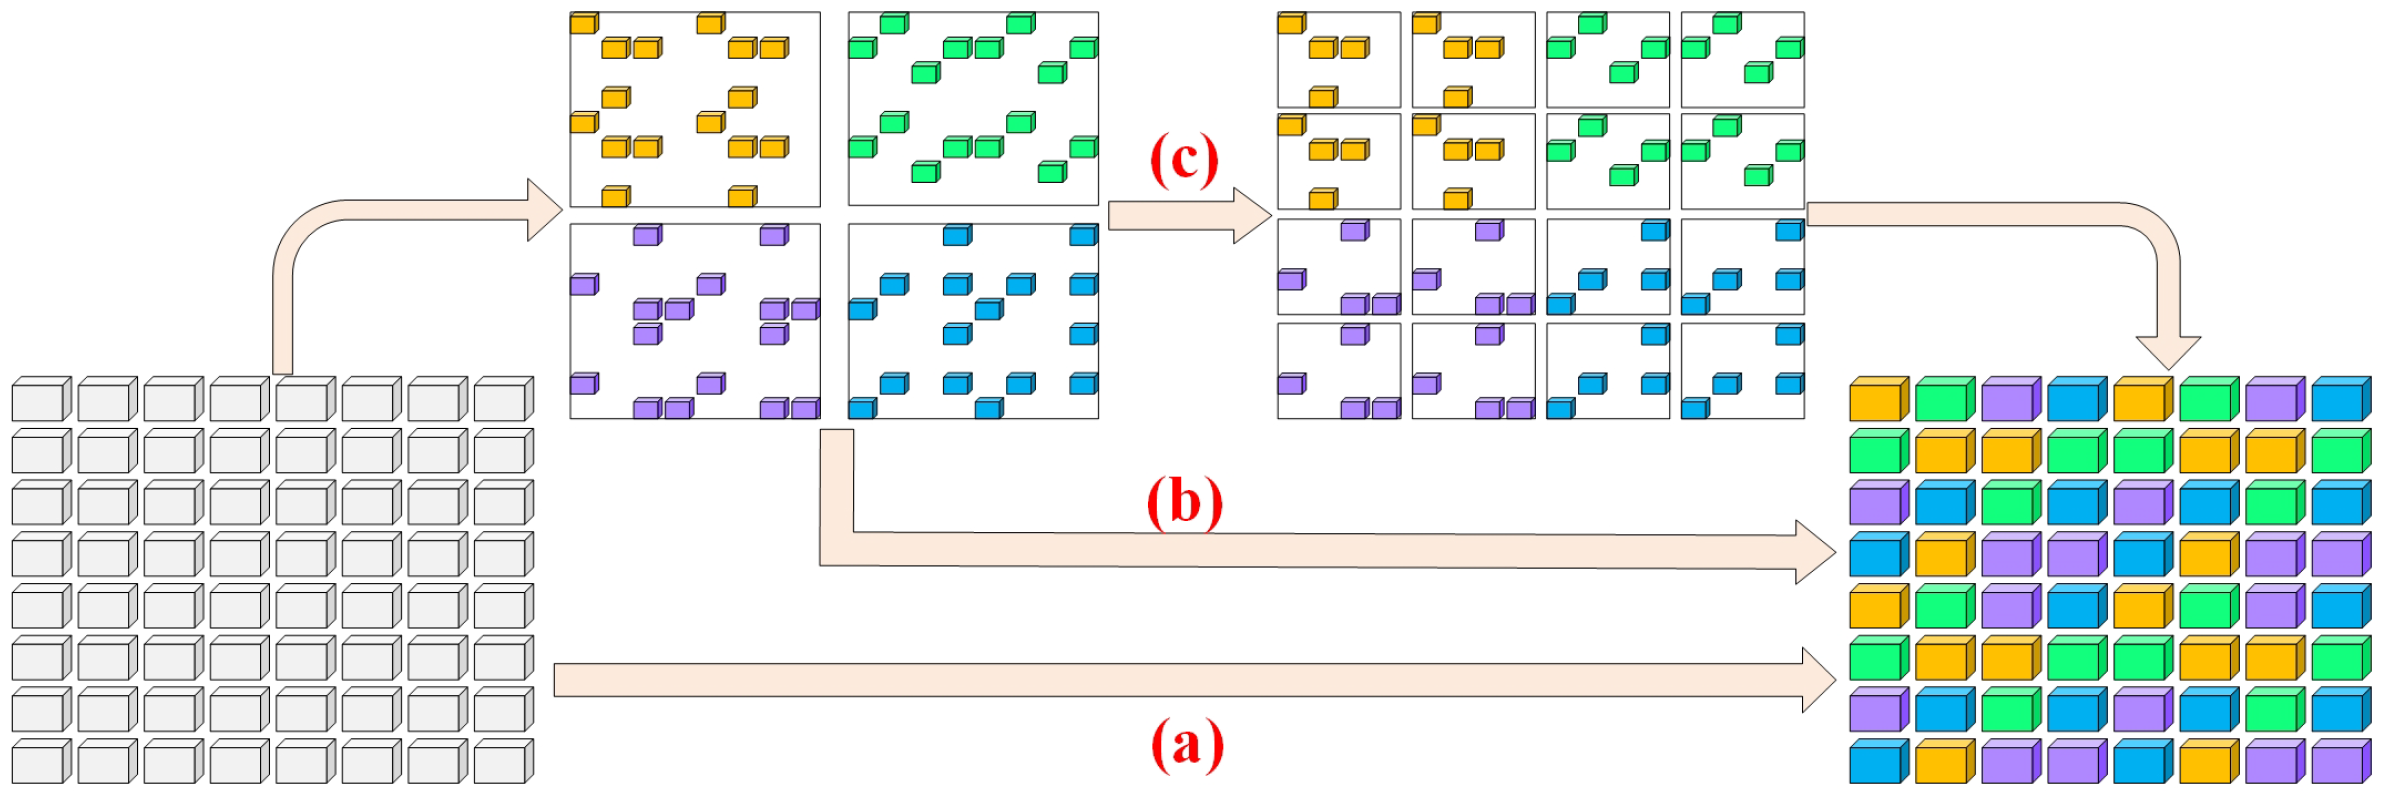
3.2.1. Block Model-Based Heterogeneous Geological Data Fusion

Due to the diversity and heterogeneity of data sources, the first step is to establish a semantic repository to resolve inconsistencies in naming the same attributes across different datasets. For example, “silver content” may be referred to as “silver”, “Ag”, or “P-Ag” in various files. The semantic repository can standardize these terms and map them to a unified concept. Secondly, constructing an attribute-to-file mapping repository establishes the correspondence between attributes and files, avoiding the need to search through massive datasets during the fusion process. Finally, creating a geographic name mapping repository enables the accurate association of place names in unstructured data with their corresponding spatial locations, ensuring that the data can be correctly mapped to the relevant geographical regions.
When handling data conflicts, it is essential to establish data prioritization rules, as disputes may arise from different data sources for the exact spatial location and attribute. To address this, we prioritize different datasets by considering factors such as data source, time, attribute density, and type, ensuring that the most reliable data are prioritized. The priority score p can be calculated by using the following formula:
p = ( S + T + ϕ ) C + A ,
where S represents the data source score, with authoritative sources receiving higher scores; T represents the data timeliness score, with newer data receiving higher scores; ϕ represents the attribute density score, with higher attribute density in a given spatial unit resulting in a higher score; C represents the error coefficient score, with machine-measured error coefficients receiving higher scores than those derived from manual measurements; and A represents additional scores, awarded to specific data for special reasons.
The data fusion process is illustrated in Figure 3. Initially, the attributes in the semantic repository are traversed, and files containing these attribute data are identified in the attribute-to-file mapping repository. Each identified file is processed individually, ensuring that its coordinates are transformed to align with the coordinate system of the fusion model. Next, the file data are segmented based on the block model’s spatial resolution, and each block’s attribute values are calculated. If a block lacks attribute values or the file’s priority is higher than the existing data, the block’s attributes are updated. This process effectively integrates structured and semi-structured data into the block model. The geographic name mapping repository associates it with the block model’s spatial locations for unstructured data, which lack explicit spatial information. This association enables quick access to relevant unstructured data files through the blocks, facilitating the efficient retrieval of files related to specific blocks within the fusion model.

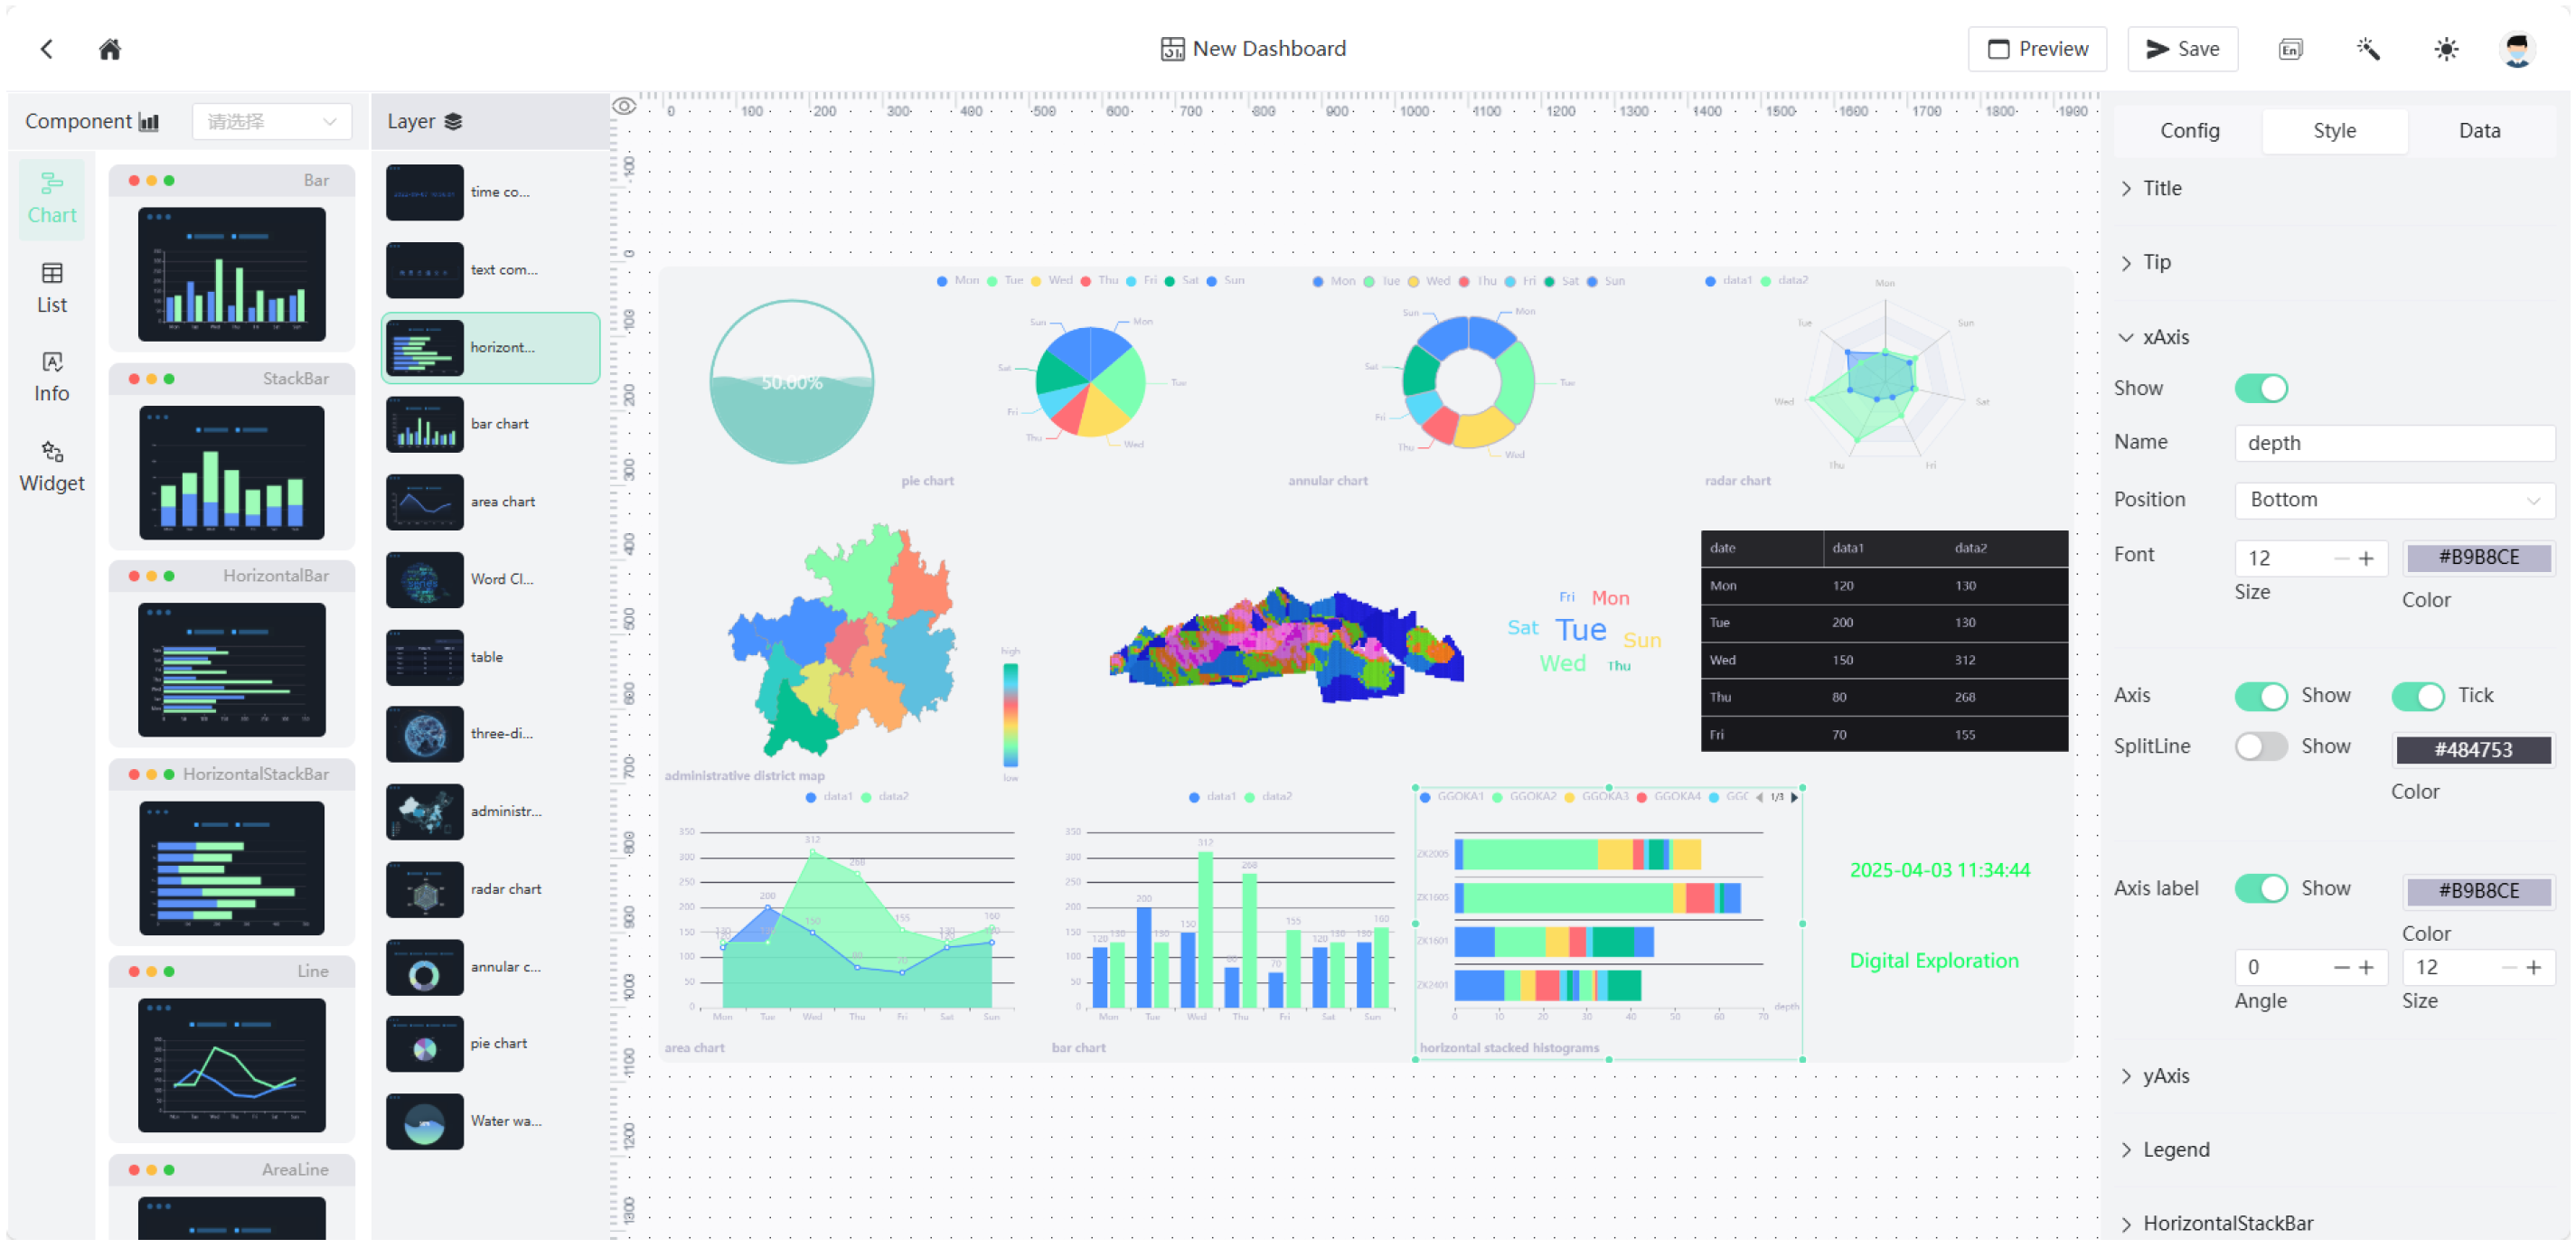
3.2.2. Modular Approach for Dynamic Data View Generation

Data views are crucial to data presentation, decision making, analysis, and collaboration in digital exploration. They help exploration personnel efficiently understand data, identify resources and risks, and make timely decisions. Due to the large volume of geological data and the complexity of exploration tasks, dynamic views are necessary to present information based on work focus and data format, supporting interaction. Figure 4 shows the proposed design method, which separates view components into data, templates, and interactive tools. Data include raw, statistical, fused, and real-time interactive data, reflecting resource distribution, geological correlations, and real-time feedback. Templates display data by using charts, images, videos, and geological-specific formats. Interactive tools enable flexible functions, such as triggering pop-ups or controlling view displays, meeting diverse interactive needs.

3.3. Rendering Optimization Strategy for 3D Visual Analytics

Rendering efficiency and resource consumption are crucial to large-scale data fusion for 3D visual analytics. Effective optimization strategies, such as occlusion culling and batch rendering techniques, must be employed to improve rendering performance and reduce hardware strain.

3.3.1. Occlusion Culling Strategy

In integrated model rendering, many objects are fully occluded, consuming significant computational resources and memory despite not being visible. Therefore, we propose a two-stage occlusion culling strategy (Figure 5) that reduces the number of rendered objects without affecting visualization quality, improving efficiency, and reducing hardware strain. In the preprocessing stage, occlusion culling computations are reduced to enhance rendering efficiency.
The fused model is classified into discrete and continuous attributes, with discrete attributes (e.g., strata) categorized by property values and continuous attributes (e.g., Ag content) by intervals. Initial occlusion culling generates a shell model with only exterior data stored on the cloud for real-time rendering. During rendering, the shell model is used as the data source, filtered by the display range. Secondary occlusion culling is performed (Figure 6) to exclude fully enclosed objects from rendering. Then, the data are submitted for final rendering.

3.3.2. Batch Rendering Strategy

Before rendering, the CPU sets the rendering states and adds operations to a queue, notifying the GPU to execute the rendering process (Draw Call). Both excessive and insufficient Draw Calls can reduce efficiency. To optimize, a batch rendering strategy (Figure 7) is used to group similar objects, merging Draw Calls and reducing memory usage by sharing textures, improving efficiency, and reducing hardware load.
Let us suppose that each object in the fused model is processed with a separate Draw Call, as illustrated in Figure 7a. In that case, it leads to excessive Draw Calls, which in turn consume significant CPU resources and cause the GPU to wait for subsequent render commands, reducing overall efficiency idly. On the other hand, grouping all similar objects into a single Draw Call, as shown in Figure 7b, effectively reduces the number of Draw Calls. However, this approach may not fully exploit the GPU’s parallel processing capabilities, and the low communication frequency between the CPU and GPU can result in suboptimal synchronization, further decreasing rendering performance. A hybrid approach is employed to mitigate these issues, as depicted in Figure 7c. By determining an optimal number of objects to merge per Draw Call based on the size of the fused model, this strategy balances the two previous methods, ultimately optimizing rendering efficiency.

4. Experiments and Results

Several experiments were designed and conducted to evaluate the effectiveness of key technologies and validate the system’s feasibility. Section 4.1 presents a simulation experiment of the CMMN optimization algorithm, where the results before and after optimization demonstrate the effectiveness of the measures in improving task efficiency and optimizing load balancing. Section 4.2 showcases the dynamic data view generation process through examples, validating the feasibility of the modular design-based method for dynamic data view generation. Section 4.3 focuses on experiments with 3D model rendering, verifying the advantages of the proposed strategy in reducing client memory load and improving rendering efficiency. The experimental environment consisted of an Intel (R) Core (TM) i7-9700 CPU @3.00 GHz (eight cores), 32 GB of RAM, and an NVIDIA Quadro P620 GPU running on Windows 10. The code was written in Java, using JDK 1.8 as the development environment, and the browser used was Microsoft Edge version 130.0.2849.52.
The experimental data are derived from raw records accumulated over years of digital exploration in Guizhou, China, including drilling data, geophysical data, geochemical data, remote sensing images, geological map databases, and multiscale 3D geological models. In Section 4.1, task data are randomly generated to simulate a heterogeneous cloud environment with cloud preparation times set between 1 and 10 and task execution times between 5 and 100; moreover, 20% of the tasks have no predecessors, with a maximum of six predecessors. By gradually increasing the number of tasks and cloud nodes (e.g., from “100 × 4” to “1000 × 40”), 100 repeated datasets were generated to evaluate the efficiency and resource utilization of the improved CMMN algorithm. Section 4.2 configures view templates using drilling cores, statistical indicators, and real-time interactive data, and user interaction experiments validate the practicality of the modular design. In Section 4.3, a mining area 3D geological structure model is used to generate block models of different resolutions (D0–D3) through spatial partitioning and interpolation; data volumes see a 7-fold increase from D1 to D3, and tests on memory usage, rendering object count, Draw Calls, and rendering time verify the effectiveness of the occlusion culling and batch rendering strategies. Section 4.4 integrates 189 boreholes (with a cumulative drilling length of 99,000 m) and a 3D block model comprising 271,568 blocks of 12 m³ each, using kriging interpolation to analyze the spatial distribution and resource reserves of the gold–copper deposit, thereby confirming the system’s comprehensive capability in complex geological scenarios.

4.1. Task Scheduling Performance Analysis

The task data are randomly generated to simulate the diversity of tasks in a heterogeneous cloud environment. The cloud ready time simulates the delay in resource availability, and since this delay is relatively short compared with the task execution time in real-world applications, it is set between 1 and 10 in the simulation. Task execution times on different clouds are set between 5 and 10,000 to accommodate both small and large tasks, making the simulation more representative of real-world scenarios. The initial proportion of independent tasks is set to 0.2, meaning 20% of tasks have no predecessor dependencies, which helps balance dependency relationships and parallelism within the task graph. A lower ratio would reduce parallelism, causing some heterogeneous cloud nodes to remain idle at certain times, while a higher ratio would weaken dependency relationships, reducing the effectiveness of complex task scheduling simulations. Additionally, the number of direct predecessor tasks for each task is limited to a maximum of six, applying only to direct predecessors, meaning that a task’s predecessors may still have their own dependencies. This setup preserves the complexity of task dependencies while preventing extreme cases where many tasks rely on the same predecessor in scheduling simulations involving 100 to 1000 tasks. Each dataset is generated 100 times for experimentation, and the average results are calculated. The experimental results are shown in Table 1.
The experimental results focus on cloud completion time and average cloud utilization. Cloud completion time refers to the moment when the last task finishes execution on the cloud, indicating the efficiency of task execution, with smaller values representing higher efficiency. Average cloud utilization is calculated by dividing the average completion time of the last task on each cloud by the cloud completion time, measuring the load balance on the heterogeneous cloud platform. Higher values indicate a more balanced load distribution. From the data in Table 1, the improved CMMN algorithm shows advantages in both metrics across all datasets. Specifically, the cloud completion time was reduced from 22,288.72 to 21,812.85, saving 2.37% of time; the average cloud utilization rate was increased from 91.977% to 92.577%, an increase of 0.652%. These results show that the proposed improvement measures have improved the task execution efficiency and optimized the load balance of cloud resources to a certain extent. However, the overall improvement is not significant.
The reason is that our optimization strategy is mainly based on two key aspects. On the one hand, we focus on optimizing the cloud ready time, but the average value of the cloud ready time is only 5.5, while the average value of the cloud execution time is 5002.5, and the cloud ready time only accounts for about 0.1% of the cloud execution time. Therefore, its effect on improving the overall performance is relatively small. On the other hand, another focus of the optimization strategy is to target special cases in task batch division, but these special cases account for a relatively low proportion of the entire task, which limits the contribution of the strategy to the overall improvement.

4.2. Dynamic Data View Generation

The experiment aims to evaluate the method’s effectiveness in a geological exploration 3D visual analysis system, assessing its practicality through user interaction. The process is divided into three steps: template selection, data configuration, and interaction implementation. In the template selection phase, suitable chart templates are chosen from a predefined library to display various geological data types, as shown in Figure 8. These templates support various chart forms, including line, bar, and advanced relationship diagrams and visualizations for geological features like 3D, boreholes, cross-sections, and tunnel models. Template selection is based on data characteristics and display requirements. In the data configuration phase, users add and link dimension and metric data with template axes through drag-and-drop operations, ensuring accurate data mapping and display.
Users first select and add relevant datasets in the configuration area (Figure 9a), which include multidimensional and multi-metric information. Once added, the system generates and displays dimension and metric data, as shown in Figure 9b,c. Dimension data are presented hierarchically, while metric data provide the numerical basis for analysis. Users then drag dimension data from Figure 9b and metric data from Figure 9c into the axis sections of Figure 9d to create specific data views for analysis. Additional filtering and drill-down features in Figure 9d allow for data subset analysis and multi-level exploration. Interactive functions, such as hover and click events, enhance data exploration.

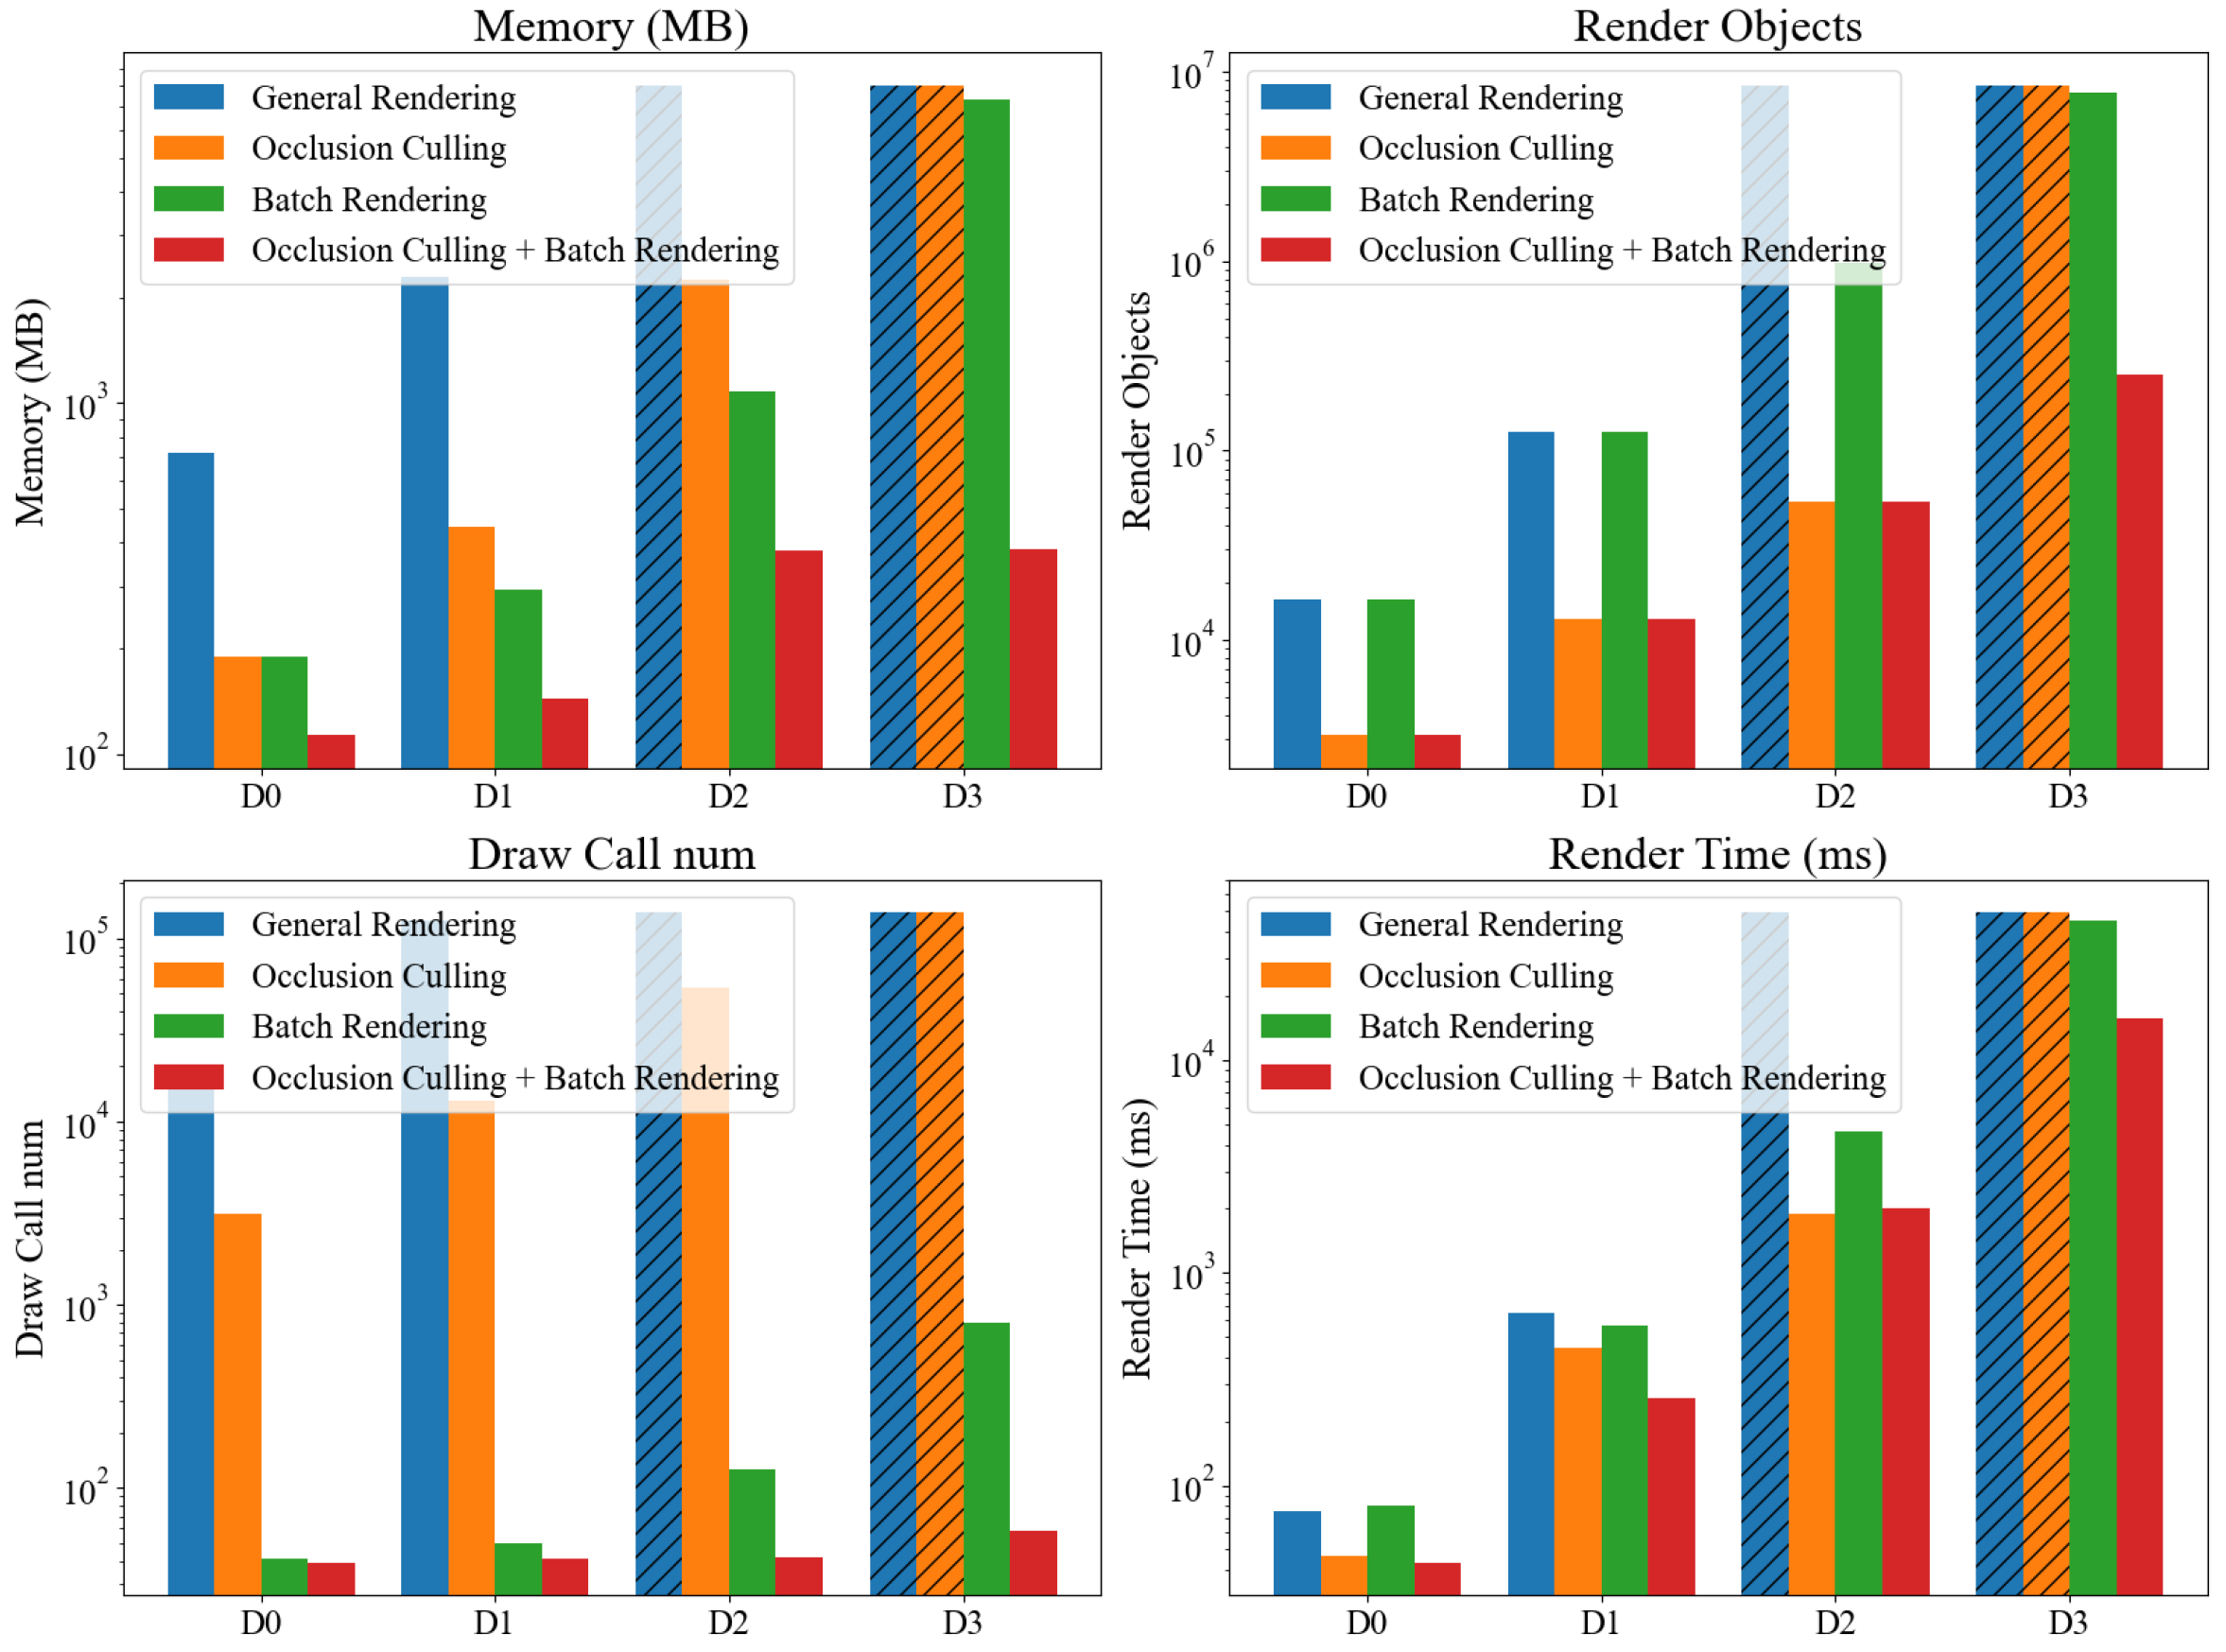
4.3. Rendering Performance Optimization
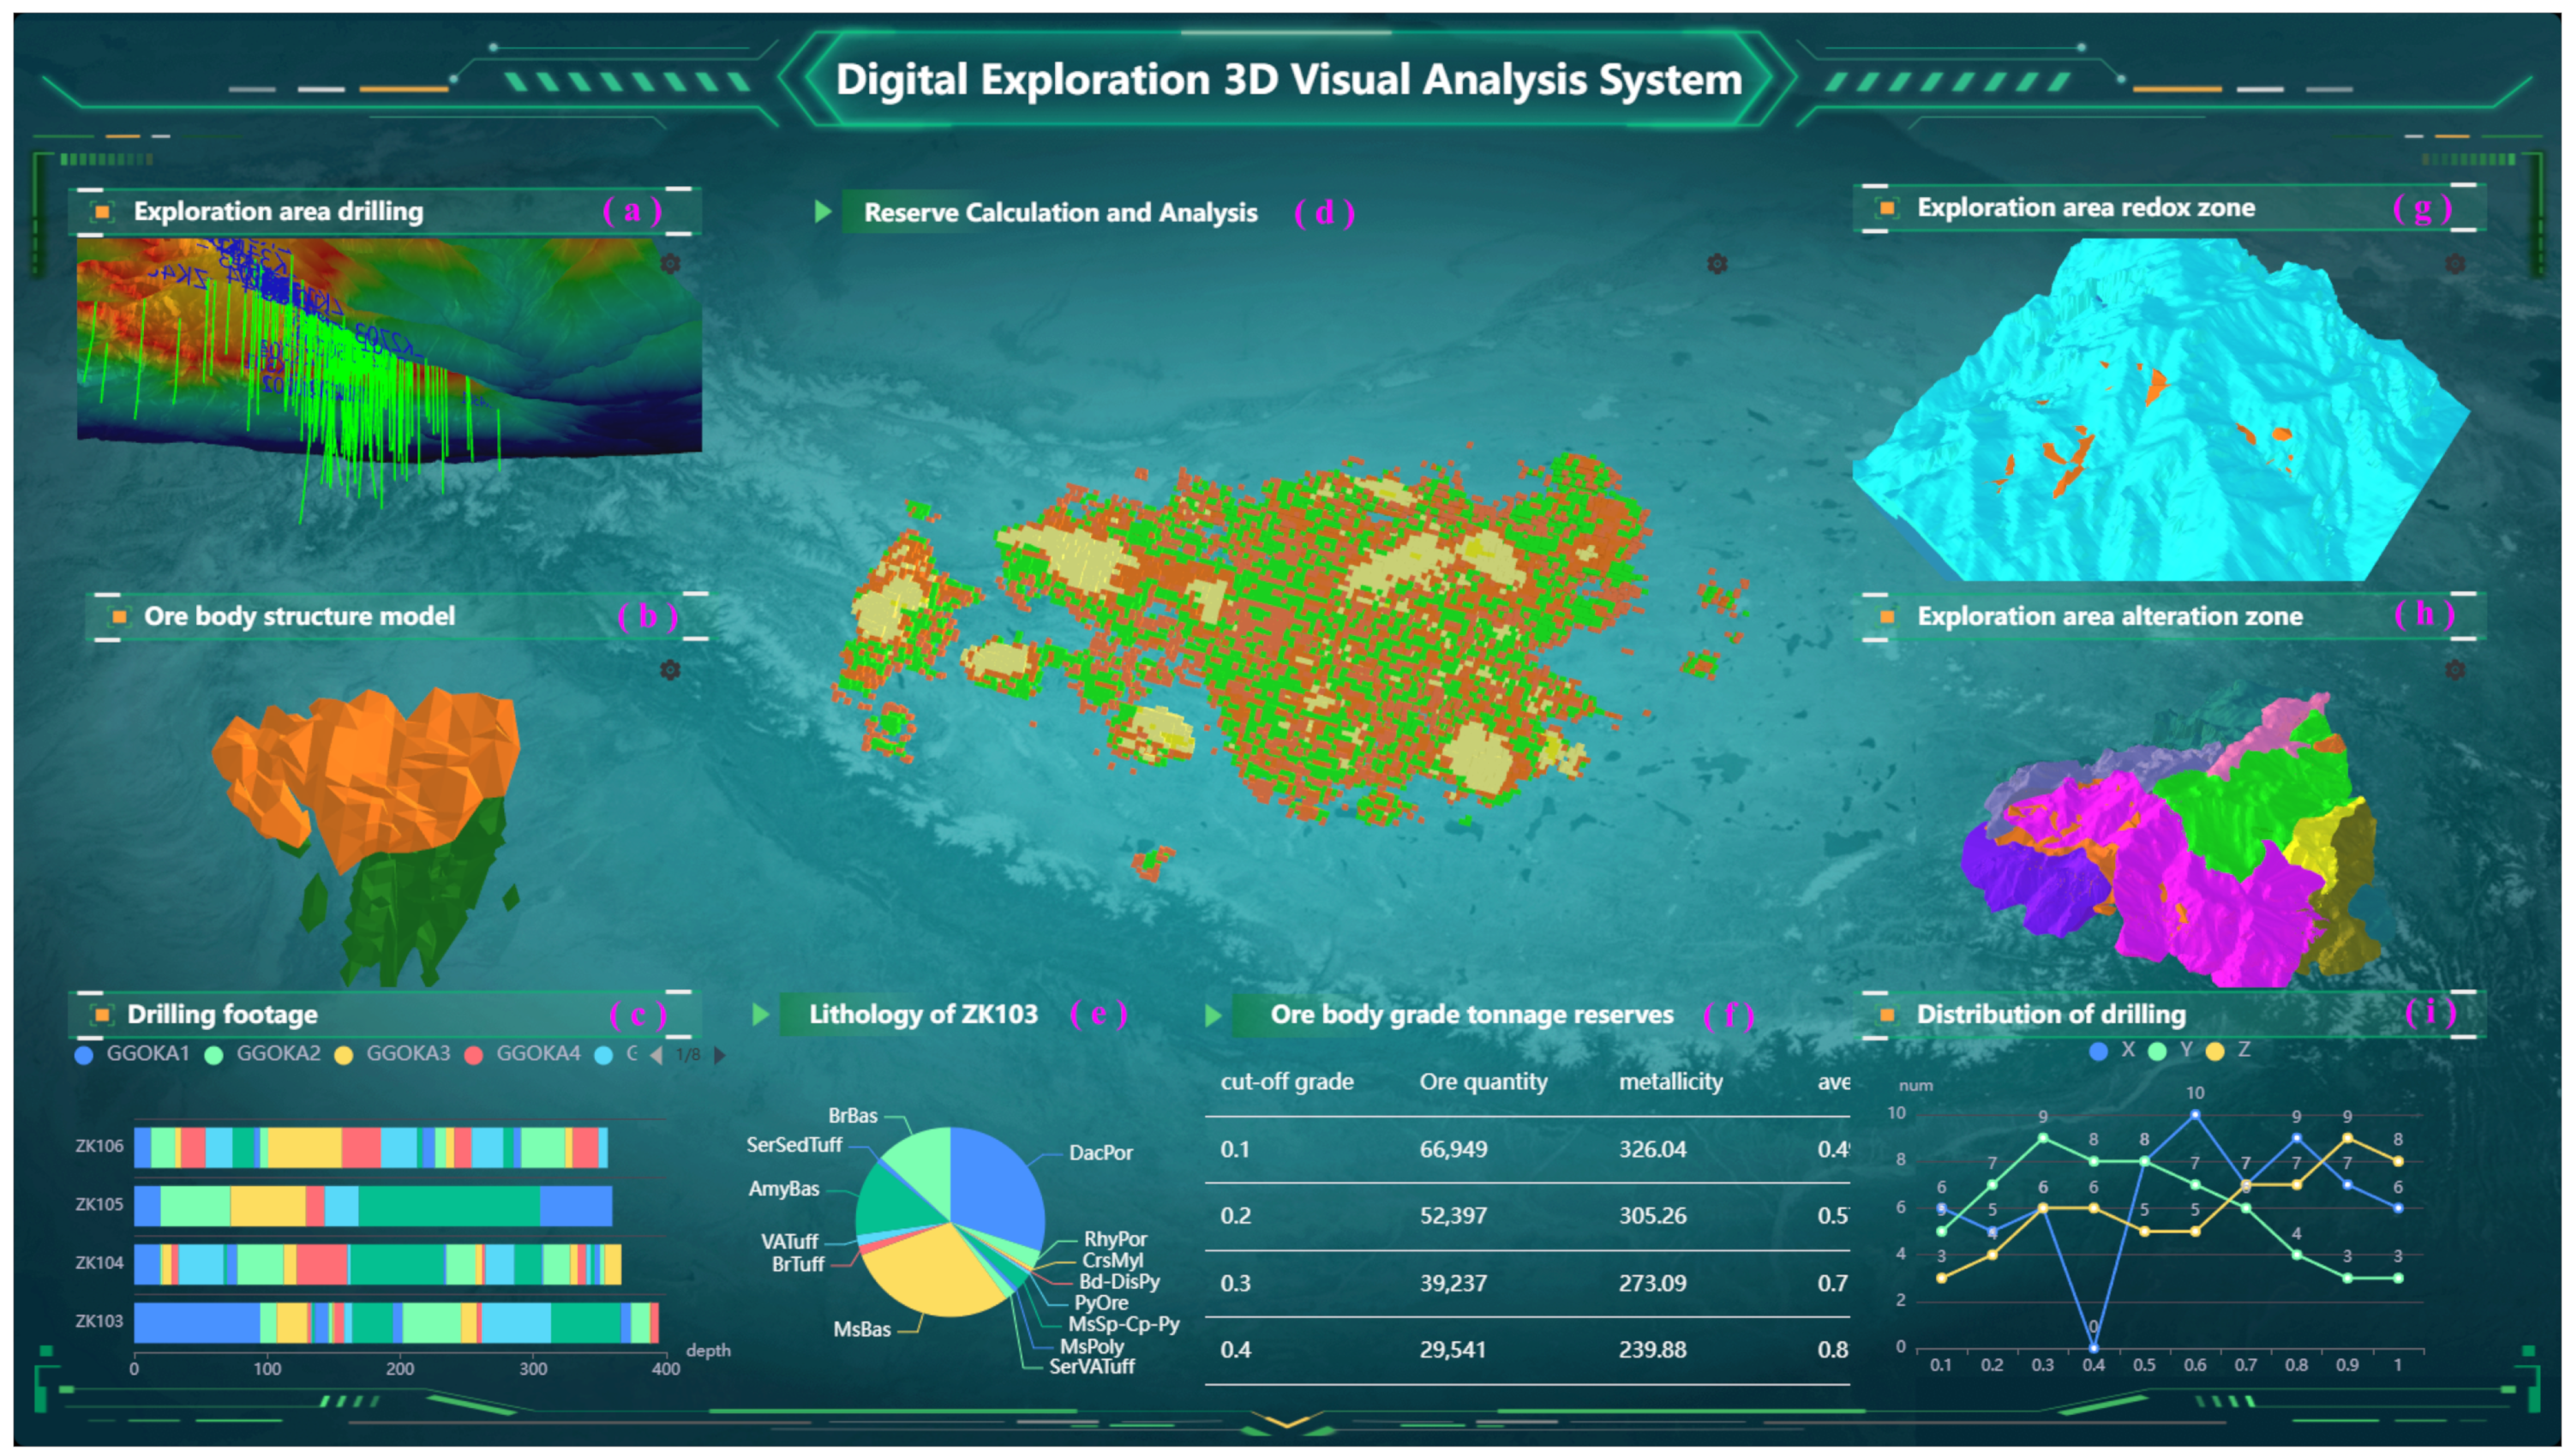
The experiment involves block models at four different resolutions: D0, D1, D2, and D3. Each level increases the data volume by seven. The evaluation metrics include memory usage, the number of rendered objects, Draw Calls, and rendering time. The experimental results are shown in Figure 10, where columns with diagonal stripes represent rendering failures due to memory overflow.
Table 2 presents the memory usage results. As the resolution of the fusion models increases, the data volume rises significantly, leading to failures in conventional rendering on the D2 and D3 datasets due to memory limitations. Similarly, the occlusion culling strategy also fails on the D3 dataset because of memory constraints. For the D1 resolution, conventional rendering uses 2281 MB of memory; with occlusion culling, memory usage drops to 444 MB, a reduction of 80.5%. After implementing batch rendering, memory usage decreases to 295 MB, a reduction of 87%. When both strategies are applied simultaneously, memory usage is reduced to 144 MB, a reduction of 93.7%.
Table 3 presents the results for the number of rendered objects. For the D3 resolution, without occlusion culling, 7.74 million objects were rendered, while with occlusion culling, only 250,000 objects were rendered, resulting in a 96.7% reduction.
Table 4 presents the results for the number of Draw Calls. For the D1 resolution, 120,000 Draw Calls were made without batch processing, while with batch processing, the number was reduced to 50, a 99.9% reduction.
Table 5 shows the rendering time results. At the D1 resolution, conventional rendering required 651.6 milliseconds. When occlusion culling was applied, the time dropped to 411 ms, leading to a 36.9% improvement in performance. Incorporating batch processing reduced the time to 568.8 ms, which is a 12.7% performance boost. Applying both strategies simultaneously reduced rendering time to 256.4 ms, marking a 60.6% improvement in performance.
The occlusion culling strategy reduces memory usage by eliminating occluded objects from rendering, while the batch rendering strategy minimizes memory pressure by grouping similar objects and sharing textures. Together, these strategies reduce client memory usage by 93.7%, ensuring the successful operation of the D3 high-resolution fusion model. Additionally, occlusion culling decreases the rendered data volume, improving efficiency, while batch rendering reduces CPU–GPU communication and idle GPU time, further boosting performance. The combined strategies cut the rendering load time by 60.6%, enabling the fast loading of the D3 model.

4.4. Case Study

Figure 11 displays the comprehensive application results of the digital exploration three-dimensional visualization analysis system in a gold–copper exploration area. The area covers 4.58 km² and exhibits multiple phases of hydrothermal alteration with superimposed features. The main alteration types include (1) silicification, as shown by the purple zone in Figure 11h; (2) alunite alteration; (3) kaolinite alteration; and (4) sericite alteration. Among these, the strongly silicified zone is distributed in a dome shape in the upper part of the orebody. It shows a significant spatial coupling with gold mineralization, which is indicated by the orange zone in Figure 11h.
Mineralization characteristics indicate that the gold orebody, marked in orange in Figure 11b, and the copper orebody, marked in green in Figure 11b, occur in vertical zonation. The gold orebody mainly occurs in the oxidation zone above the water table (at elevations between 600 and 640 m), depicted in light blue in Figure 11g, and gradually transitions into a copper sulfide orebody along a northeast-trending extension. Three-dimensional modeling reveals that the orebody exhibits local discontinuities in the X direction, as shown in Figure 11i, and displays a typical gourd-shaped structure overall. This system integrates digital data from 189 exploration drill holes, with rock core data marked in green in Figure 11a and a cumulative drilling length of 99,000 m. Users can obtain real-time information on lithological characteristics, stratigraphic attribution, and mineralization for any drill segment by using an interactive drilling footage visualization module shown in Figure 11c. The lithology pie chart analysis module, as shown in Figure 11e, provides a quantitative characterization of the drill hole lithological composition, revealing that siliceous rocks account for 63.2% within the mineralized zone, which serves as a basis for identifying key prospecting marker layers.
Based on the kriging geostatistical method and using the reference point (X = 39,439,281.81; Y = 2,786,910.52), a three-dimensional block model was constructed by dividing the volume into standardized blocks measuring 12 m × 12 m × 12 m, totaling 271,568 blocks. The modeling range extends from the bottom boundary of the oxidation zone to an elevation of −200 m, spanning 1584 m along the 50° section and 1584 m along the 140° longitudinal section. As shown in Figure 11d, the final gold-grade block model indicates that the orebody extends in a northwest–southeast direction with a three-dimensional double-expanded gourd shape. It has a strike length of 1900 m, a width of 900 m, a vertical extension of 940 m, and a maximum actual thickness of 420 m, with mineralization elevations ranging from 592 to 1120 m. Through grade–tonnage association analysis, as illustrated in Figure 11f, the system automatically generates a resource reserve classification report based on industrial criteria, clearly identifying the proportion and spatial distribution of economically mineable reserves. This provides a precise geological basis for designing mine development systems and optimizing mining sequences.

5. Conclusions

This study presents and implements a big data-driven 3D visualization analysis system for promoting regional-scale digital geological exploration, addressing key challenges in digital exploration, including data silos, difficulties in data integration, and inefficiencies in visualization analysis. The system optimizes cross-cloud platform resource allocation by adopting an enhanced CMMN-based method for integrating and scheduling heterogeneous cloud resources. This results in improved task execution efficiency and increased cloud resource utilization. Experimental results indicate that the modified CMMN algorithm reduces cloud completion time by an average of 2.37%. In comparison, cloud resource utilization rises to 92.58%, demonstrating the method’s effectiveness in task scheduling and resource allocation. Using a block model-based dynamic aggregation approach, the system integrates structured, semi-structured, and unstructured geological data, generating different data views as needed. This approach improves the accuracy and timeliness of data integration. The application of intelligent data matching and dynamic aggregation techniques enhances the efficiency of geological data integration, particularly in multi-source heterogeneous data. Additionally, occlusion culling and batch rendering techniques were implemented to optimize the rendering performance of large-scale geological models, reducing memory usage by 93.7% and shortening the rendering time by 60.6%, alleviating the client-side performance burden and ensuring the efficient handling of large datasets.
Applied to a gold–copper exploration area, the system integrated 189 drill holes to construct a 3D block model, revealing orebody distribution and key silicification zones. Real-time interactive analysis identified 63.2% siliceous rocks in mineralized zones, enabling precise resource classification and mine planning. This validated the system’s ability to enhance decision making in complex geological environments.
These results significantly enhance the management of multi-source heterogeneous geological data and improve the visualization and analysis of 3D geological models. However, the system has some limitations that warrant further investigation. In light of these challenges, future research should focus on optimizing ultra-high-resolution models for low-end hardware, automating the semantic and spatial mapping processes in data fusion, and developing dynamic view generation frameworks that support real-time collaborative editing and streaming data integration, thereby extending the system’s utility in time-sensitive exploration workflows.

Author Contributions

Conceptualization, G.C., Y.T. and J.W.; Methodology, J.W. and G.C.; Software, J.W., G.C. and Y.T.; Validation, Y.T., G.L. and X.Z.; Formal analysis, Y.T., G.C. and J.W.; Investigation, G.C., X.Z. and J.W.; Resources, J.W., X.Z. and Y.T.; Data curation, J.W. and G.C.; Writing—original draft preparation, J.W. and G.C.; Writing—review and editing, G.C., Y.T., G.L. and X.Z.; Visualization, J.W. and G.C.; Supervision, Y.T., G.L. and X.Z.; Project administration, Y.T. and G.L.; Funding acquisition, Y.T., G.L. and X.Z. All authors have read and agreed to the published version of the manuscript.

Funding

This work was supported by the Major Science and Technology Special Project of Guizhou Provincial Department of Science and Technology entitled “Big Data-Based Metallogenic Regularity and Efficient Prospecting and Exploration of Strategic Mineral Resources in Western Guizhou” [2025–2027]; National Key Research and Development Program of China under grant 2023YFF0718000; the State Key Laboratory of Biogeology and Environmental Geology under grant 2021; Science and Technology Strategic Prospecting Project of Guizhou Province under grants [2022] ZD003 and [2022] ZD004; Solid mineral digital exploration innovation talent team under grant [2023] TD002; Central Funds Guiding the Local Science and Technology Development under grant [2021] 4027; National Natural Science Foundation of China under grants 42372345 and U1711267; and Key Laboratory of Urban Land Resources Monitoring and Simulation, Ministry of Natural Resources under grant KF-2023-08-25.

Institutional Review Board Statement

Not applicable.

Informed Consent Statement

Not applicable.

Data Availability Statement

The system under investigation can be accessed at https://github.com/zbomLeo (accessed on 1 March 2025). Due to confidentiality restrictions, the case study dataset is not publicly available.

Acknowledgments

We sincerely thank the Innovative Team (Innovative Team for the digital exploration and intelligent prospecting of mineral resources) for their support in data provision and funding. We would also like to express our gratitude to Shuo Wang for his invaluable technical guidance throughout this work. His professional advice and suggestions played a crucial role in the successful progress of the research study.

Conflicts of Interest

The authors declare no conflicts of interest.

References

  1. Zhou, Q.; Wu, C. Experimental research and progress on intelligent mineral exploration based on big data. Earth Sci. Front. 2024, 31, 350–367. [Google Scholar] [CrossRef]
  2. Wu, C.; Zhang, X.; Zhou, Q.; Tian, Y.; Zhang, Z.; Li, J.; Li, Y.; Xu, K. Digital exploration and digital transformation of the geological and mineral exploration industry. Guizhou Geol. 2021, 38, 119–128. [Google Scholar]
  3. Huang, Z.; Shi, Z. Digital exploration practices and exploration in the Mázōngling bauxite mining area, Zheng’an County, Guizhou Province. Eng. Technol. Res. 2023, 8, 1–4. [Google Scholar] [CrossRef]
  4. Wu, C.; Zhou, Q.; Xu, k.; Zhang, X.; Kong, C.; Li, Y.; Yang, B.; Zhang, S.; Yuan, L. A review study of the prospecting process of Datangpo manganese ore used for big data prediction. Guizhou Geol. 2022, 39, 189–204. [Google Scholar]
  5. Zhao, P.; Chen, Y. Digital geosciences and quantitative mineral exploration. J. Earth Sci. 2021, 32, 269–275. [Google Scholar] [CrossRef]
  6. Tavani, S.; Billi, A.; Corradetti, A.; Mercuri, M.; Bosman, A.; Cuffaro, M.; Seers, T.; Carminati, E. Smartphone assisted fieldwork: Towards the digital transition of geoscience fieldwork using LiDAR-equipped iPhones. Earth Sci. Rev. 2022, 227, 103969. [Google Scholar] [CrossRef]
  7. Wu, C. Can big data and geoinformatics promote the quantitative phase of geology? Earth Sci. 2022, 47, 3913–3914. [Google Scholar] [CrossRef]
  8. Zhang, X.; Wu, C.; Zhou, Q.; Weng, Z.; Yuan, L.; He, K.; Zhang, Q.; Yang, B. Three-dimensional geological modeling of manganese deposits based on exploration big data and data market. Bull. Geol. Sci. Technol. 2020, 39, 12–20. [Google Scholar] [CrossRef]
  9. Tian, Y.; Wu, C.; Weng, Z.; Liu, G.; Zhang, Z.; Chen, Q. Discussion on key technologies of geological big data visualization. Bull. Geol. Sci. Technol. 2020, 39, 29–36. [Google Scholar] [CrossRef]
  10. Maljers, D.; Stafleu, J.; Van der Meulen, M.; Dambrink, R. Advances in constructing regional geological voxel models, illustrated by their application in aggregate resource assessments. Neth. J. Geosci. 2015, 94, 257–270. [Google Scholar] [CrossRef]
  11. Yang, H.Q.; Chu, J.; Wu, S.; Zhu, X.; Qi, X.; Chiam, K. Advancing geological modelling and geodata management: A web-based system with AI assessment in Singapore. Georisk Assess. Manag. Risk Eng. Syst. Geohazards 2025, 19, 218–232. [Google Scholar]
  12. Liu, G.; Wu, C.; He, Z.; Weng, Z.; Que, X.; Tian, S.; Li, Y. Research on data models for expression and storage management of geological spatiotemporal big data. Bull. Geol. Sci. Technol. 2020, 39, 164–174. [Google Scholar] [CrossRef]
  13. Di Curzio, D.; Castrignanò, A.; Fountas, S.; Romić, M.; Rossel, R.A.V. Multi-source data fusion of big spatial-temporal data in soil, geo-engineering and environmental studies. Sci. Total Environ. 2021, 788, 147842. [Google Scholar] [CrossRef] [PubMed]
  14. Chen, G.; Liu, G.; Chen, Q.; Zhao, L.; Shize, X.; Qing, L.; Junjie, Z. Key technologies and applications of 3D spatial data management system for mining based on multi-source data integration and WebGIS. Softw. Guide 2023, 22, 18–28. [Google Scholar] [CrossRef]
  15. Wu, C.; Liu, G.; Zhou, Q.; Zhang, X.; Xu, K. Basic issues in the integrated application of geological big data. Bull. Geol. Sci. Technol. 2020, 39, 1–11. [Google Scholar] [CrossRef]
  16. Zhang, Y.H.; Wen, C.; Zhang, M.; Xie, K.; He, J.B. Fast 3d visualization of massive geological data based on clustering index fusion. IEEE Access 2022, 10, 28821–28831. [Google Scholar] [CrossRef]
  17. Slawik, M.; Zilci, B.I.; Demchenko, Y.; Baranda, J.I.A.; Branchat, R.; Loomis, C.; Lodygensky, O.; Blanchet, C. CYCLONE unified deployment and management of federated, multi-cloud applications. In Proceedings of the 2015 IEEE/ACM 8th International Conference on Utility and Cloud Computing (UCC), Limassol, Cyprus, 7–10 December 2015; pp. 453–457. [Google Scholar] [CrossRef]
  18. Castañé, G.G.; Xiong, H.; Dong, D.; Morrison, J.P. An ontology for heterogeneous resources management interoperability and HPC in the cloud. Future Gener. Comput. Syst. 2018, 88, 373–384. [Google Scholar] [CrossRef]
  19. Yang, C.T.; Chen, S.T.; Cheng, W.H.; Chan, Y.W.; Kristiani, E. A heterogeneous cloud storage platform with uniform data distribution by software-defined storage technologies. IEEE Access 2019, 7, 147672–147682. [Google Scholar] [CrossRef]
  20. Panda, S.K.; Jana, P.K. Efficient task scheduling algorithms for heterogeneous multi-cloud environment. J. Supercomput. 2015, 71, 1505–1533. [Google Scholar] [CrossRef]
  21. Chen, W.; Xie, G.; Li, R.; Bai, Y.; Fan, C.; Li, K. Efficient task scheduling for budget constrained parallel applications on heterogeneous cloud computing systems. Future Gener. Comput. Syst. 2017, 74, 1–11. [Google Scholar] [CrossRef]
  22. Panda, S.K.; Jana, P.K. An energy-efficient task scheduling algorithm for heterogeneous cloud computing systems. Clust. Comput. 2019, 22, 509–527. [Google Scholar] [CrossRef]
  23. Behera, I.; Sobhanayak, S. Task scheduling optimization in heterogeneous cloud computing environments: A hybrid GA-GWO approach. J. Parallel Distrib. Comput. 2024, 183, 104766. [Google Scholar] [CrossRef]
  24. Olierook, H.K.; Scalzo, R.; Kohn, D.; Chandra, R.; Farahbakhsh, E.; Clark, C.; Reddy, S.M.; Müller, R.D. Bayesian geological and geophysical data fusion for the construction and uncertainty quantification of 3D geological models. Geosci. Front. 2021, 12, 479–493. [Google Scholar] [CrossRef]
  25. Zhuang, C.; Zhu, H.; Wang, W.; Liu, B.; Ma, Y.; Guo, J.; Liu, C.; Zhang, H.; Liu, F.; Cui, L. Research on urban 3D geological modeling based on multi-modal data fusion: A case study in Jinan, China. Earth Sci. Inform. 2023, 16, 549–563. [Google Scholar] [CrossRef]
  26. Wu, J.; Han, W.; Chen, J.; Wang, S. Improving Geological Remote Sensing Interpretation via Optimal Transport-Based Point–Surface Data Fusion. Remote Sens. 2023, 16, 53. [Google Scholar] [CrossRef]
  27. Sjöbergh, J.; Li, X.; Goebel, R.; Tanaka, Y. A visualization-analytics-interaction workflow framework for exploratory and explanatory search on geo-located search data using the meme media digital dashboard. In Proceedings of the 2015 19th International Conference on Information Visualisation, Barcelona, Spain, 22–24 July 2015; pp. 300–309. [Google Scholar] [CrossRef]
  28. Stehle, S.; Kitchin, R. Real-time and archival data visualisation techniques in city dashboards. Int. J. Geogr. Inf. Sci. 2020, 34, 344–366. [Google Scholar] [CrossRef]
  29. Farmanbar, M.; Rong, C. Triangulum city dashboard: An interactive data analytic platform for visualizing smart city performance. Processes 2020, 8, 250. [Google Scholar] [CrossRef]
  30. Wu, L.; Hou, J.; Zhu, Y.; Li, Y. Research on the sharing technology of large-scale 3D geological models based on 3D Tiles. Comput. Tech. Geophys. Geochem. Explor. 2024, 46, 242–250. [Google Scholar] [CrossRef]
  31. Xu, D.; Peng, H.; Xiao, J.; Yang, Q.; Li, S.; Liu, H. Key technologies and applications of integrated management for urban full-space 3D model data. Bull. Geol. Sci. Technol. 2023, 42, 388–397. [Google Scholar] [CrossRef]
  32. Li, F.; Gao, C.; Liu, Y.; Huang, K.; Pan, M.; Chen, X.; Yuan, Y. Integrated multi-scale reservoir data representation and indexing for reservoir data management and characterization. Comput. Geosci. 2020, 138, 104433. [Google Scholar] [CrossRef]
  33. Graciano, A.; Rueda, A.J.; Feito, F.R. Real-time visualization of 3D terrains and subsurface geological structures. Adv. Eng. Softw. 2018, 115, 314–326. [Google Scholar] [CrossRef]
Figure 1. System architecture diagram.
Applsci 15 04003 g001
Figure 2. Heterogeneous cloud resource integration framework.
Applsci 15 04003 g002
Figure 3. Data fusion workflow.
Applsci 15 04003 g003
Figure 4. Modular design-based method for dynamic data view generation.
Applsci 15 04003 g004
Figure 5. Two-stage occlusion culling strategy.
Applsci 15 04003 g005
Figure 6. Shell block identification diagram: (a) Case with 5 neighbor blocks; (b,c) Two cases with 4 neighbor blocks; (d,e) Two cases with 3 neighbor blocks; (f,g) Two cases with 2 neighbor blocks; (h) Case with 1 neighbor block.
Applsci 15 04003 g006
Figure 7. Batch rendering strategy: (a) Rendering without batch merging; (b) Over-merged batching before rendering; (c) Grouping first, then proper batching before rendering.
Applsci 15 04003 g007
Figure 8. Dynamic data view interaction interface.
Applsci 15 04003 g008
Figure 9. Dynamic data view interaction interface: (a) Data position selection; (b) Dimension position selection; (c) Metric position selection; (d) Dimensions and metrics in the current chart.
Applsci 15 04003 g009
Figure 10. Performance optimization comparison.
Applsci 15 04003 g010
Figure 11. Dynamic data view interaction interface: (a) Drillhole distribution map; (b) Gold (orange) and copper (green) orebody structure; (c) Drillhole depth chart; (d) Predicted gold ore grade block model; (e) Drillhole lithology pie chart; (f) Gold ore grade-tonnage estimation table; (g) Relationship of oxidation zone (light blue), reduction zone (dark blue), and orebody (orange); (h) Relationship of orebody (orange) and alteration zones (other colors); (i) Drillhole distribution in different directions, reflecting orebody distribution.
Applsci 15 04003 g011
Table 1. Adaptive scheduling experimental results.
DatasetsCloud Completion Time (ms)Average Cloud Utilization
CMMNOptimizedImprovementCMMNOptimizedImprovement
100 × 460,583.9859,528.531.77%0.96440.96850.43%
200 × 837,110.8136,367.852.04%0.93850.94961.18%
300 × 1226,606.1626,029.342.22%0.93020.93510.53%
400 × 1621,091.3820,655.712.11%0.92100.92990.97%
500 × 2017,500.0117,109.372.28%0.91710.92150.48%
600 × 2414,910.7014,519.722.69%0.90930.91410.53%
700 × 2813,171.0512,823.782.71%0.90390.91230.93%
800 × 3211,747.9311,436.662.72%0.90400.90940.60%
900 × 3610,528.3810,258.252.63%0.90810.91190.42%
1000 × 409636.759399.242.52%0.90120.90540.47%
Table 2. Memory usage (MB).
DatasetsBasic RenderingOcclusion CullingBatch RenderingBoth
D0724189189113
D12281444295144
D2Out of memory22411080382
D3Out of memoryOut of memory7325384
Table 3. Memory usage (MB).
DatasetsBasic RenderingOcclusion CullingBatch RenderingBoth
D016,406313116,4063131
D1126,06712,892126,06712,892
D2Out of memory53,876983,02153,863
D3Out of memoryOut of memory7,743,278251,885
Table 4. Memory usage (MB).
DatasetsBasic RenderingOcclusion CullingBatch RenderingBoth
D016,41931444139
D1126,08012,9055041
D2Out of memory53,87612642
D3Out of memoryOut of memory80158
Table 5. Memory usage (MB).
DatasetsBasic RenderingOcclusion CullingBatch RenderingBoth
D075.561.780.358.26
D1651.6563.8568.8388.3
D2Out of memory2969.71585.63148.1
D3Out of memoryOut of memory44,96125,753.8
Disclaimer/Publisher’s Note: The statements, opinions and data contained in all publications are solely those of the individual author(s) and contributor(s) and not of MDPI and/or the editor(s). MDPI and/or the editor(s) disclaim responsibility for any injury to people or property resulting from any ideas, methods, instructions or products referred to in the content.

