1. Introduction
According to Global Cancer Statistics 2020, there were 905,000 new cases of primary liver cancer and 830,000 deaths worldwide in 2020, ranking sixth and third among all cancers, bringing huge losses to patients [
1]. Hepatocellular carcinoma (HCC) is the most common pathological type of liver cancer, accounting for 70–85% of all cases [
2]. At present, hepatectomy remains the primary treatment for liver cancer, though its effectiveness heavily relies on the precise segmentation of the organ and lesions. Identifying tumor location and count pre-operatively while maximizing the preservation of liver volume and function is crucial for enhancing long-term survival rates following resection [
3].
Compared with computed tomography (CT), contrast-enhanced magnetic resonance imaging has higher soft-tissue resolution and can realize multi-sequence and multi-parameter imaging. It is an essential medical imaging method for diagnosing and monitoring HCC. After the contrast agent is injected, the CE-MRI scan images, such as the arterial, venous, and delayed phases, can be obtained by scanning in different time periods. These images have higher contrast and can display the lesion more clearly, especially in the arterial phase for liver tumors (shown in
Figure 1). Liver and tumor segmentation can be the basis for disease diagnosis, surgical planning, and evaluation of efficacy [
4]. Therefore, it is significant to segment liver and tumor from CE-MRI images. In the traditional segmentation of liver and tumor, clinicians mainly perform manual delineation slice by slice, which is tedious and time-consuming. In addition, there are intra-observer and inter-observer subjective factors. Therefore, there is an urgent clinical need to segment liver and tumor for CE-MRI images automatically and accurately.
In earlier research, various traditional image-processing methods were employed for automatic liver tumor segmentation [
5,
6,
7,
8,
9,
10,
11]. These methods primarily focused on structural, grayscale, and texture-based approaches. However, traditional segmentation methods often rely heavily on expert knowledge, which can impact the model’s performance. In recent years, convolutional neural networks (CNNs) have achieved remarkable success in medical image segmentation, surpassing traditional methods in terms of accuracy, with the encoder–decoder architecture (U-Net) being the most commonly adopted [
12,
13,
14,
15]. Although models based on convolutional neural networks have made substantial progress over traditional techniques, segmenting HCC lesions remains challenging. This is primarily due to the low contrast between the liver and lesions, variability in contrast levels, tissue abnormalities, and significant differences in lesion size, quantity, and morphology [
16]. Consequently, CNNs still need enhancements to fulfill clinical requirements. A key limitation of CNNs is their focus on local features, often failing to capture the broader context of an image. When it is challenging to recognize the liver and tumor from local features, CNN-based networks may not be the optimal framework for segmentation. In contrast to CNNs, Vision Transformers (ViT) [
17] offer an innovative architecture that encodes visual information across a series of patches within the entire image, overcoming the limited receptive field of CNNs. Among ViT models, Swin-Transformer [
18] has emerged as one of the most efficient, achieving state-of-the-art performance in computer vision tasks such as BTCV [
19], MSD [
20], ImageNet [
21].
Inspired by Swin-Transformer, we aim to propose a Swin-Transformer-based network framework for segmenting the liver and tumor in CE-MRI images, addressing the needs of clinical practice and surgical procedures. As illustrated in
Figure 1, the exact location and shape of the liver and tumor are distinctly outlined. Following the administration of a contrast agent, the blood flow dynamics of the tumor and normal liver differ, leading to relatively clear boundaries on CE-MRI images. However, the tumor’s boundary can be either smooth or irregular and may vary in size. Thus, accurately locating the tumor within the liver and delineating its boundaries is essential. To capture the global spatial relationships between the liver and tumor, we have designed a Swin-Transformer-based U-Net framework that extracts global features from the CE-MRI. Furthermore, we integrated attention gate and SDM regression tasks into the Swin-Transformer-based encoder–decoder architecture, providing additional shape and global constraints for the segmentation task. These enhancements significantly improve the model’s ability to capture local details of small targets, such as tumors.
Deep-learning methods typically require large amounts of annotated data, but in medical imaging, only a small portion is labeled, leaving much data unannotated. Self-supervised learning is an innovative approach that enables the model to learn relevant visual features for segmentation tasks through pretraining on pretext tasks. Compared to CNN-based architectures, ViT-based frameworks can learn more stable visual representations during pretraining on these tasks [
22]. Recent studies have developed creative pretext tasks, which yield promising results when fine-tuned for downstream tasks [
23,
24,
25,
26,
27,
28]. In our approach, we apply contrastive learning to differentiate between various image regions, enabling the model to capture more meaningful data representations. We pretrain the encoder using contrastive learning to acquire valuable visual features, which are then refined through supervised learning in the subsequent training phase.
The main contributions of our work are threefold:
We propose a deep-learning architecture based on the Swin-Transformer structure, which is employed to capture the spatial relationships and global information for liver and tumor segmentation.
To enhance the Swin-Transformer framework’s ability to capture local details of small targets (such as tumors), we incorporate attention gate and SDM regression tasks into the Swin-Transformer-based encoder–decoder architecture, providing additional shape and global constraints for the segmentation task.
We design an upstream pretext task to pretrain the proposed network, enabling it to learn effective visual features from a larger amount of unlabeled data, thereby enhancing the model’s performance.
Our model is evaluated on a dataset of 192 CE-MRI from liver cancer patients, with performance compared against other segmentation approaches. Additionally, we conduct several ablation studies to demonstrate the significance of our key design choices.
3. Methodology
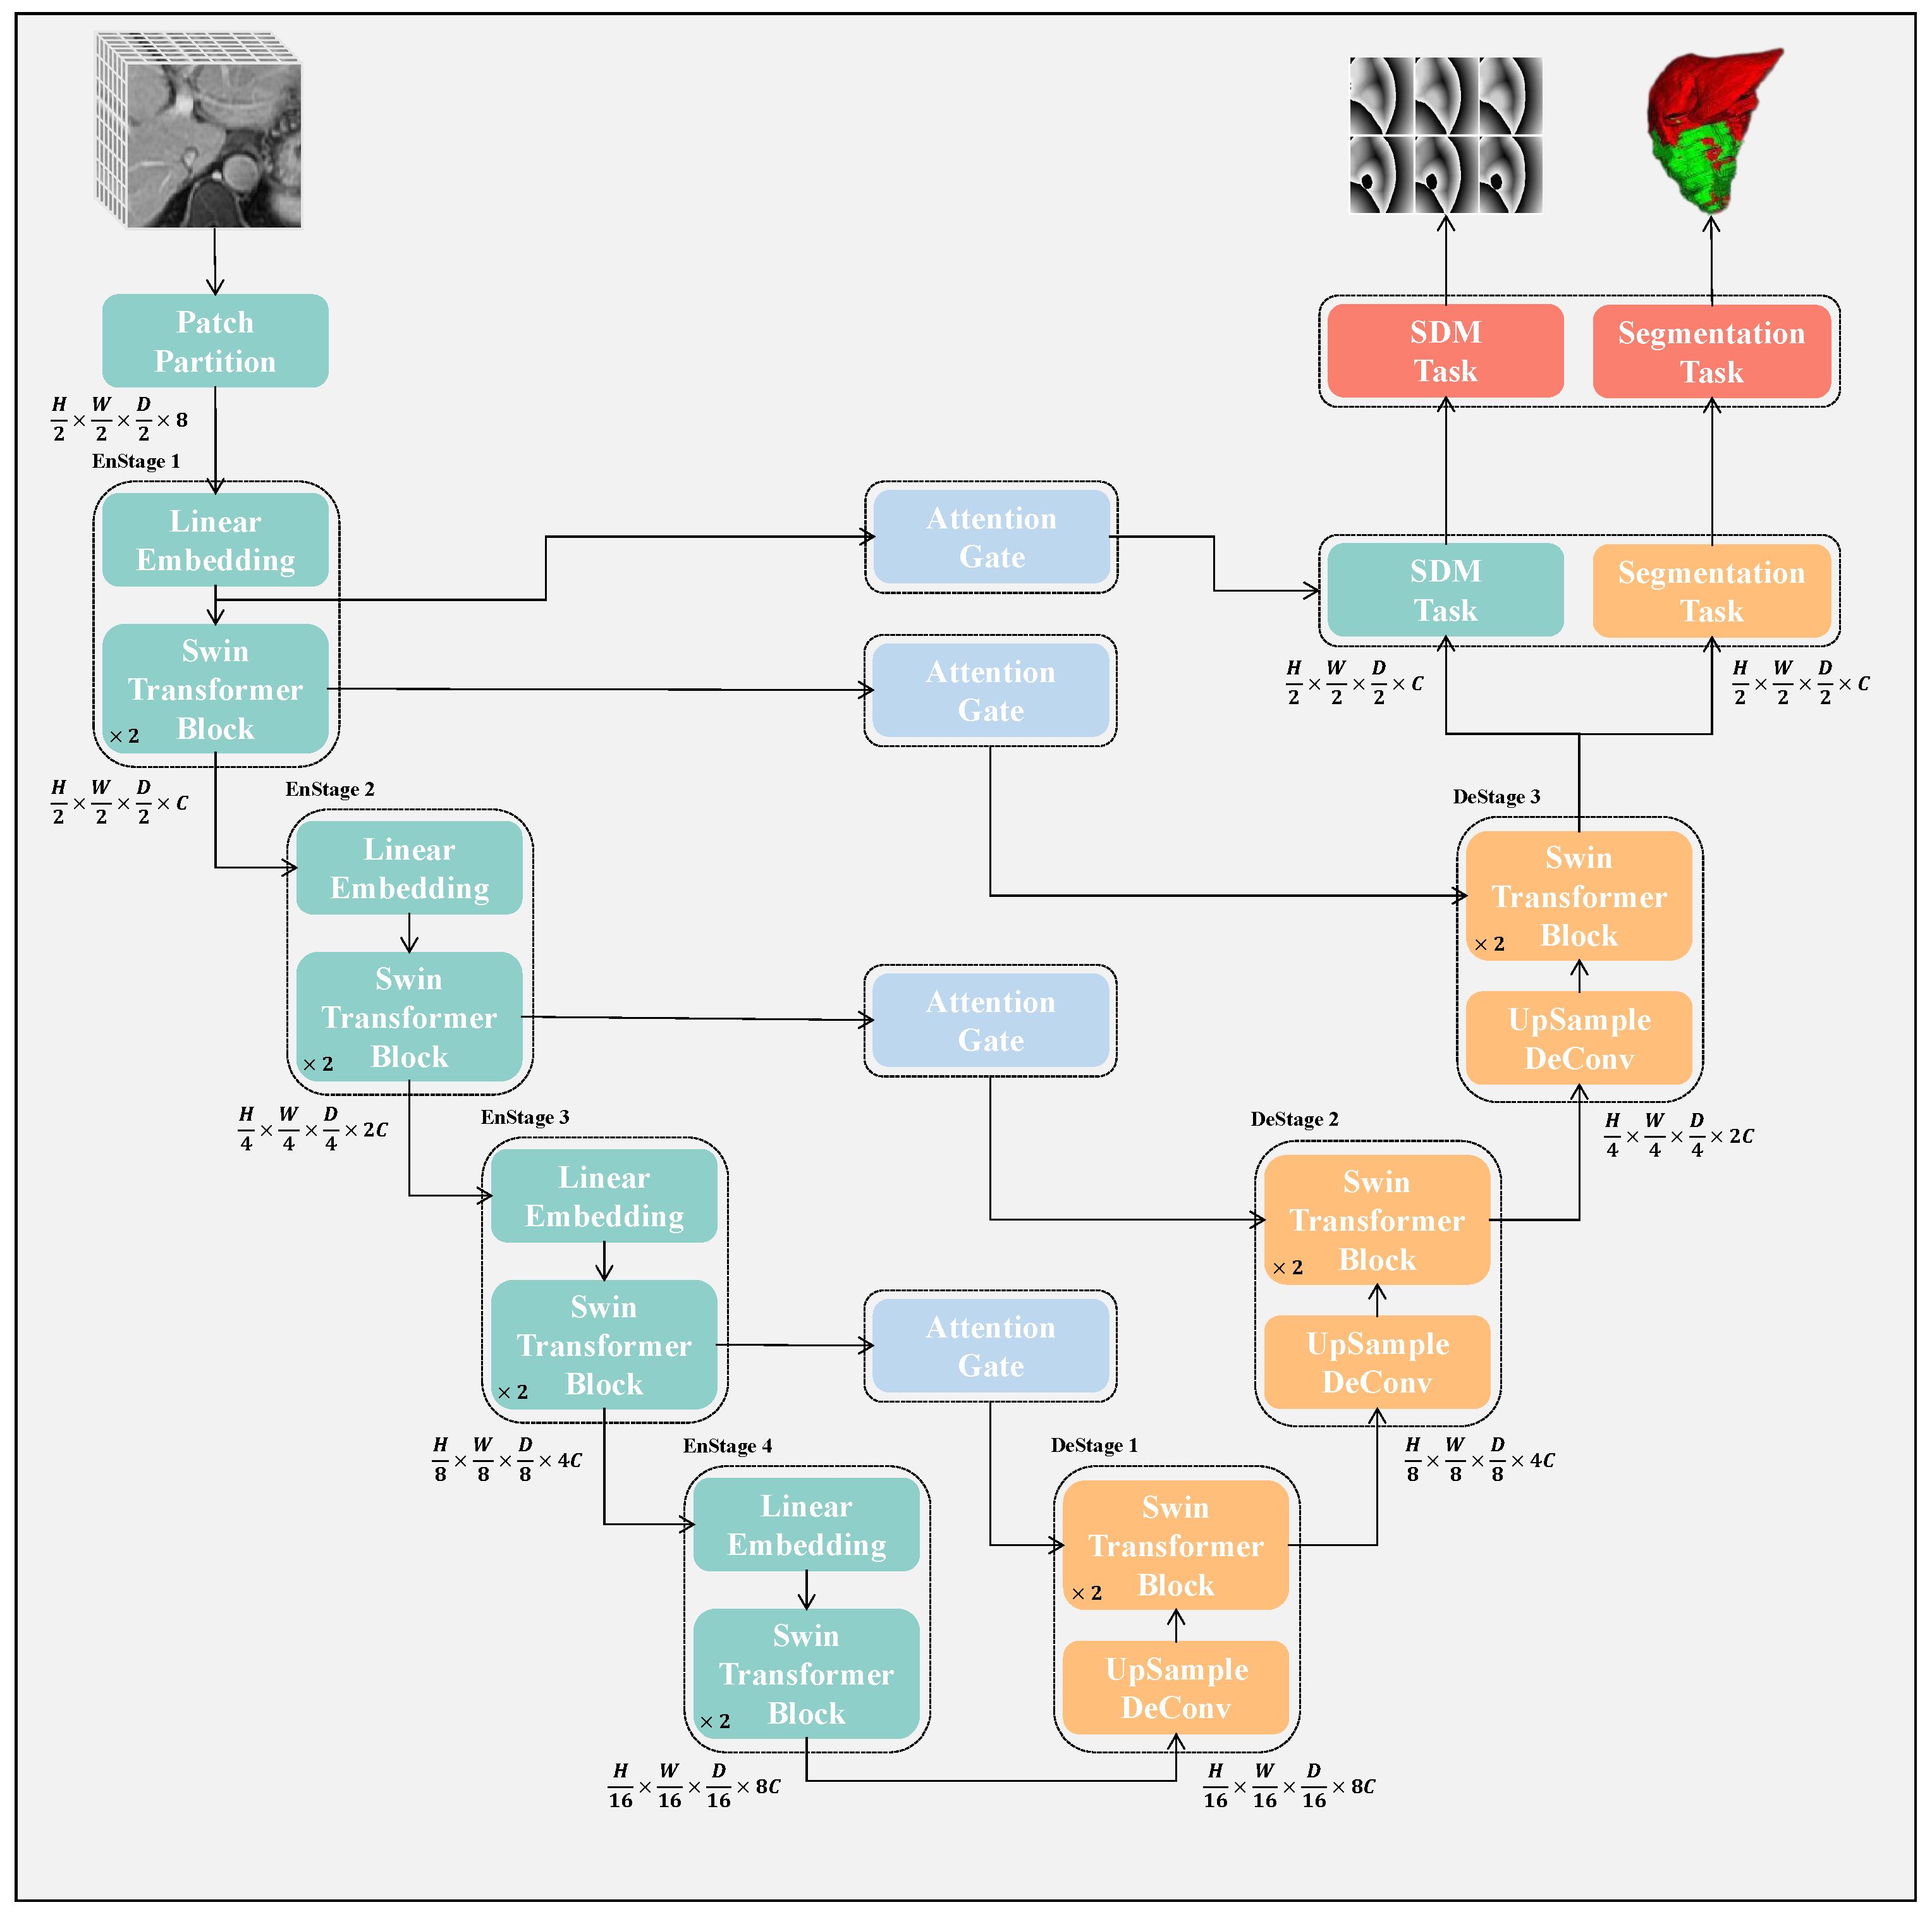
The structure of the proposed network is illustrated in
Figure 2. It comprises both an encoder and a decoder path, both based on Swin-Transformer. Each MRI volume is processed in the encoder path as a patch. After passing through the encoder, we repeatedly apply upsampling followed by a Swin-Transformer block to generate high-resolution segmentation results and the corresponding
. The semantic gap problem is alleviated by the skip connections between the encoder and decoder. In addition, an attention-gating mechanism is added between the encoder and decoder features to suppress the features of irrelevant background regions. Finally, after the decoder, the segmentation result and the signed distance map of the liver and the tumor are, respectively, output through the
layer and the
layer. In addition, we used self-supervised learning to pretrain the model. The details are as follows:
3.1. Segmentation Network Based on Swin-Transformer
Our proposed architecture is built around an encoder based on the Swin-Transformer architecture that processes patches linked to a decoder based on the Swin-Transformer architecture through skip connections at multiple stages. The overall workflow of the architecture is depicted in
Figure 2, and we will provide further details in this section.
Swin-Transformer Encoder: To hierarchically capture global features, we employ a four-stage Swin-Transformer that progressively reduces the resolution of the input images for segmentation. The input is a patch with dimensions
, where
H,
W, and
D represent the height, width, and depth of the MRI, and the last dimension corresponds to the single input channel. The input is initially divided into non-overlapping 3D tokens of size
by a patch partitioning layer, resulting in
tokens. This step reduces computation costs while preserving local characteristics in each patch. In our approach,
S is set to 2, which results in a feature size of
per token, and the token dimension becomes
. A linear embedding layer then projects this feature into a hidden dimension
C. To achieve multiscale feature extraction and hierarchical representation, a patch merging layer groups tokens with a
resolution, concatenating them and producing the feature map with
dimensions at each stage. The linear layer follows downsample resolution and reduces dimension to
. The process generates feature maps at stage 2, stage 3, and stage 4 with dimensions
,
, and
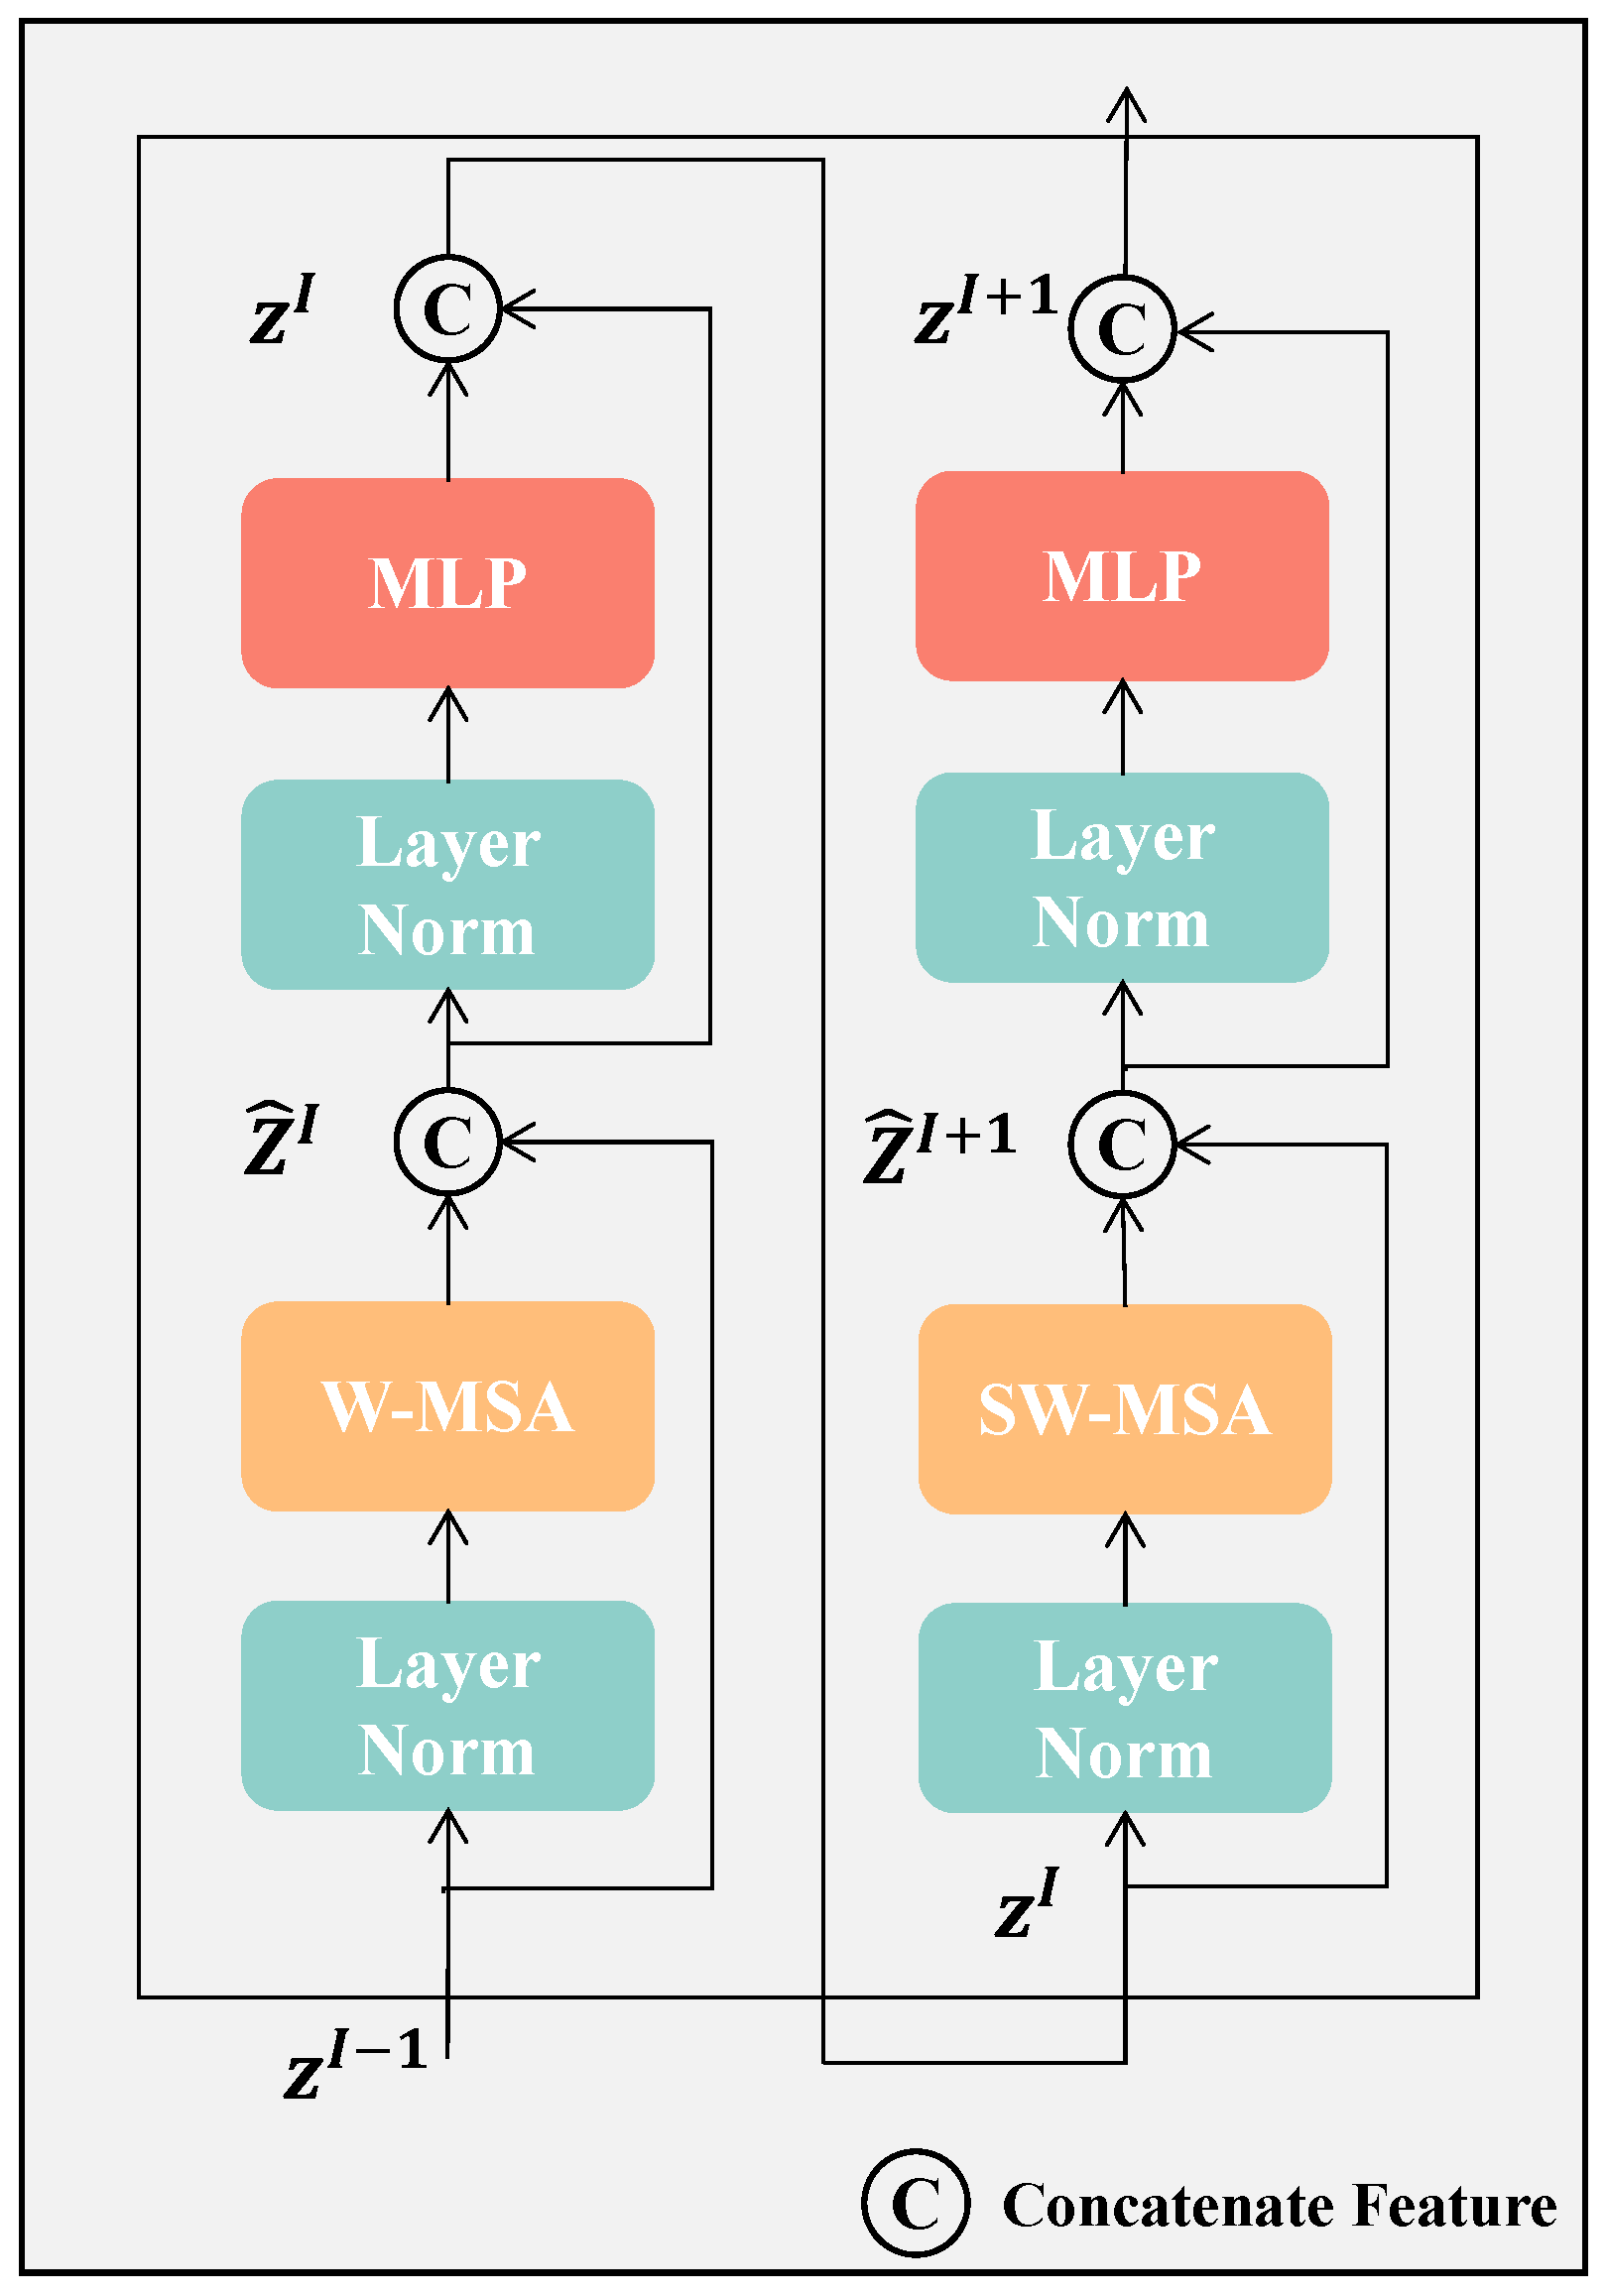
, respectively. For modeling token interactions efficiently, self-attention is computed for each token through Swin-Transformer blocks. In
Figure 3, we illustrate that each Swin-Transformer block applies a Window-based Multi-head Self-Attention (W-MSA) module followed by a Shifted Window-based Multi-head Self-Attention (SW-MSA) module. The self-attention is computed by these two modules using both regular and shifted window partitioning strategies. Between the attention modules, the two-layer MLP incorporating GELU activation functions is utilized. LayerNorm is introduced before each MSA module, and residual connections are added after each module to enhance stability and efficiency during training. To lessen the computational burden, W-MSA partitions tokens into non-overlapping windows, computing self-attention (SA) within each window. To maintain computational efficiency while enabling cross-window interactions and global attention, SW-MSA adjusts the window positions by shifting them
pixels from their original locations.
Figure 4 illustrates the 3D multi-head self-attention mechanism in Swin-Transformer.
Swin-Transformer Decoder: To transform the global information obtained by the encoding into a segmentation map, the 3-stage Swin-Transformer decoder is employed, which gradually upsamples the features. At each decoder stage
i, an upsampling layer first increases the resolution of
H,
W, and
D by a factor of two while concurrently decreasing the channel dimensions via deconvolution. After upsampling, the resulting features are combined with the output from the previous encoder stage
, denoted as
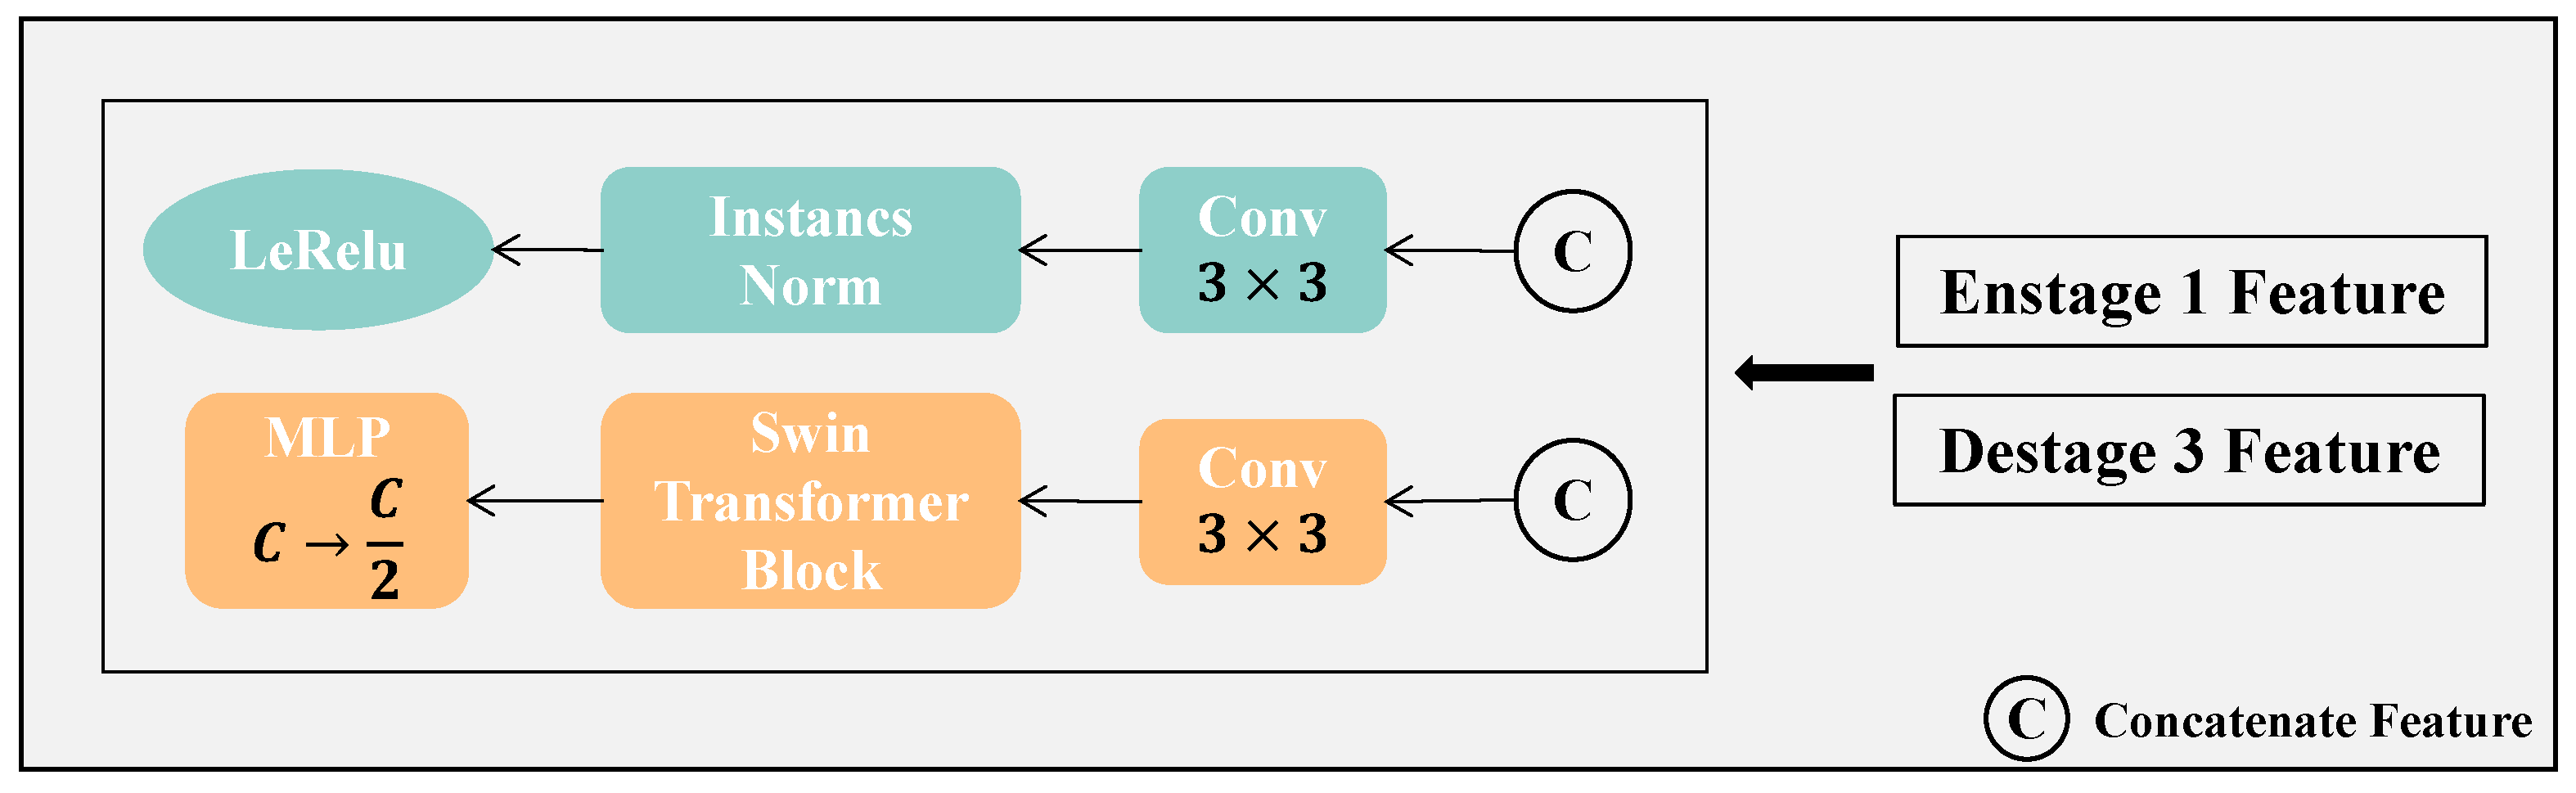
, which acts as a skip connection to mitigate any information loss during the encoder’s downsampling. The concatenated features are then input into a Swin-Transformer block, which captures long-range dependencies throughout the feature map. In this architecture, the deconvolution layer is solely responsible for upsampling, while the Swin-Transformer block handles the decoding of the features. We believe this strategy facilitates the extraction of richer and more meaningful features while also improving the modeling of spatial dependencies, especially for accurate segmentation of the liver and tumor boundaries. Finally, as illustrated in
Figure 5, a feature extraction block is employed to separately extract features for the SDM task (blue branch) and the segmentation task (orange branch).
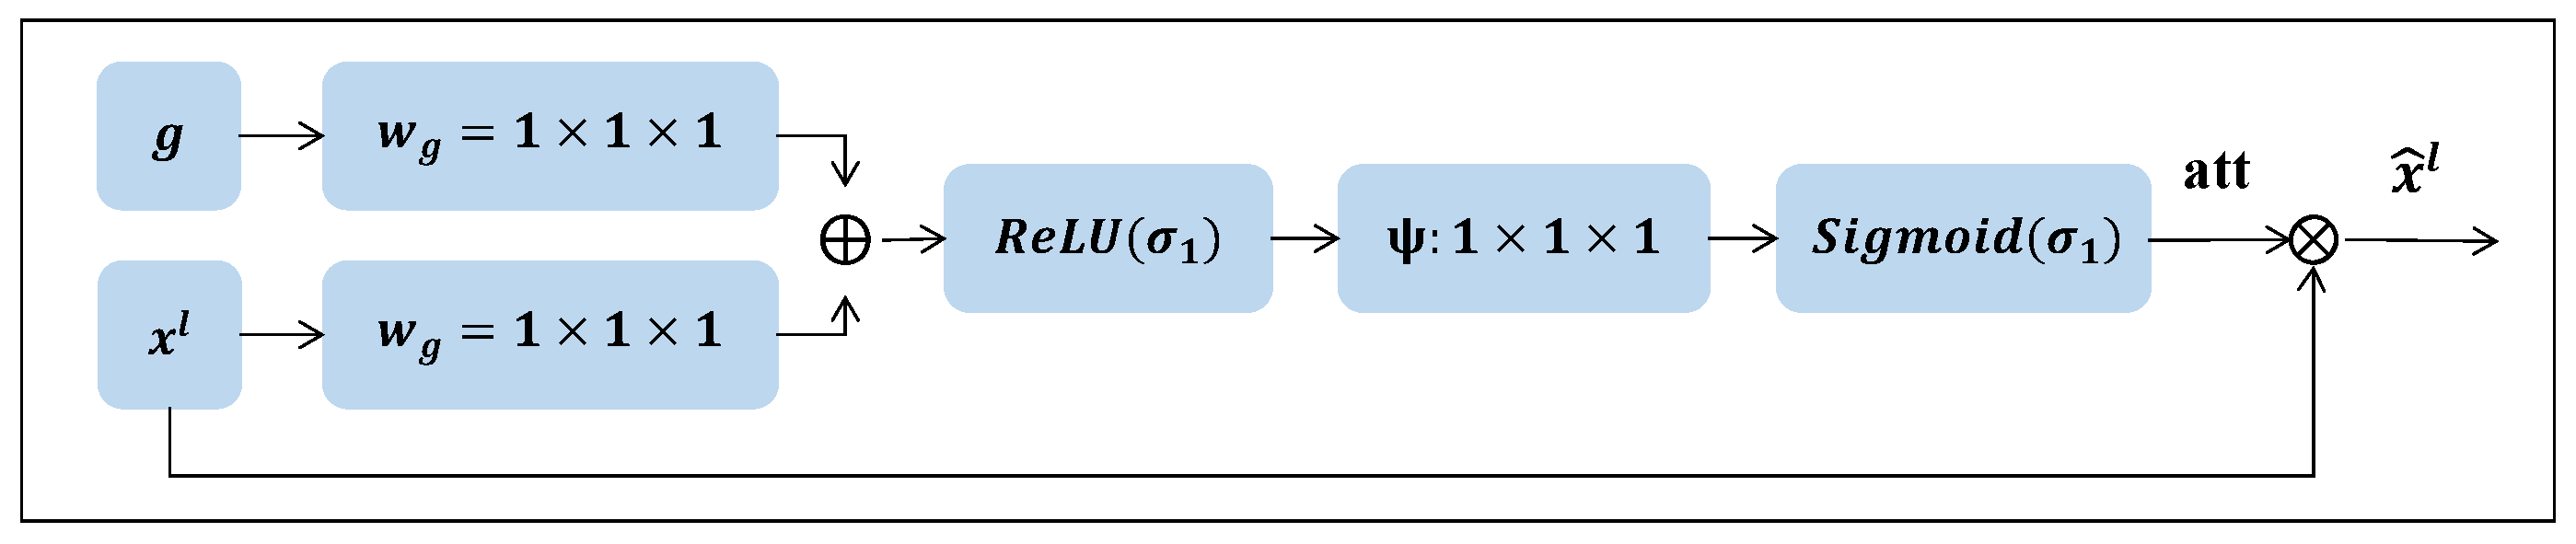
3.2. Attention Gate and SDM Branch
Attention gates are added between the encoder and its corresponding decoder layers to improve features in important regions and suppress responses in the irrelevant background. As shown in
Figure 6, the attention gate receives two input features:
and
g. These inputs undergo two
convolution operations followed by batch normalization. Afterward, the resulting features are summed element-wise, and this sum is passed through a
activation layer. To generate the attention map, a final
convolution layer is applied, followed by a
operation. The output of the attention gate is the element-wise multiplication of the input features and the attention map. The specific formula is as follows:
Among them, , , and represent three different convolution operators, and represent and Sigmoid activation functions, is the feature output from the layer l of the encoder, and is The features from the process of the layer of the decoder, is the attention vector generated by the attention-gating mechanism. ⊗ represents the matrix element-wise multiplication operation, and is the output result of the attention-gating mechanism.
In our multitask network, we define task 1 as a segmentation task and task 2 as an SDM regression task. In existing work, pixel-level classification for segmentation has been extensively studied, while the SDM regression is a traditional task that captures active geometric contours and distance information [
57], recently when combined with CNN rejuvenate [
58], which is specifically defined as follows:
where
x and
y are two different pixels in the same segmentation mask,
is a zero-level set, which also represents the outline of the target object.
and
denote the inner and outer regions of the segmentation target. We then define
as the transformation from a segmentation map to an SDM. In this experiment, a segmentation mask is first converted into three different binarized channels by
operation, representing the background, liver, and tumors. Then, the corresponding SDMs are calculated for the liver and tumor channels using the above formula.
The proposed network is trained using a mixed loss function, which includes cross-entropy loss (CE loss), DSC loss, and SDM loss. CE loss is defined as follows:
Among them, N represents the number of speed-ups for each sample,
p,
represent ground truth and prediction, respectively, and
,
represent the probability values at position
i from ground truth and prediction, respectively. The specific definition of DSC loss is as follows:
In this case,
G and
P represent the voxel sets for the ground truth and prediction, respectively, and
denotes the voxel count calculation. The definition of the Sdm loss is as follows:
Among them, S and M, respectively, represent the predicted SDM and the corresponding mask.
represents the operation of calculating the SDM ground truth through the mask, and
represents the operation of calculating the
loss. Combine the above three parts of the loss, and use the parameter
to adjust the weight of
.
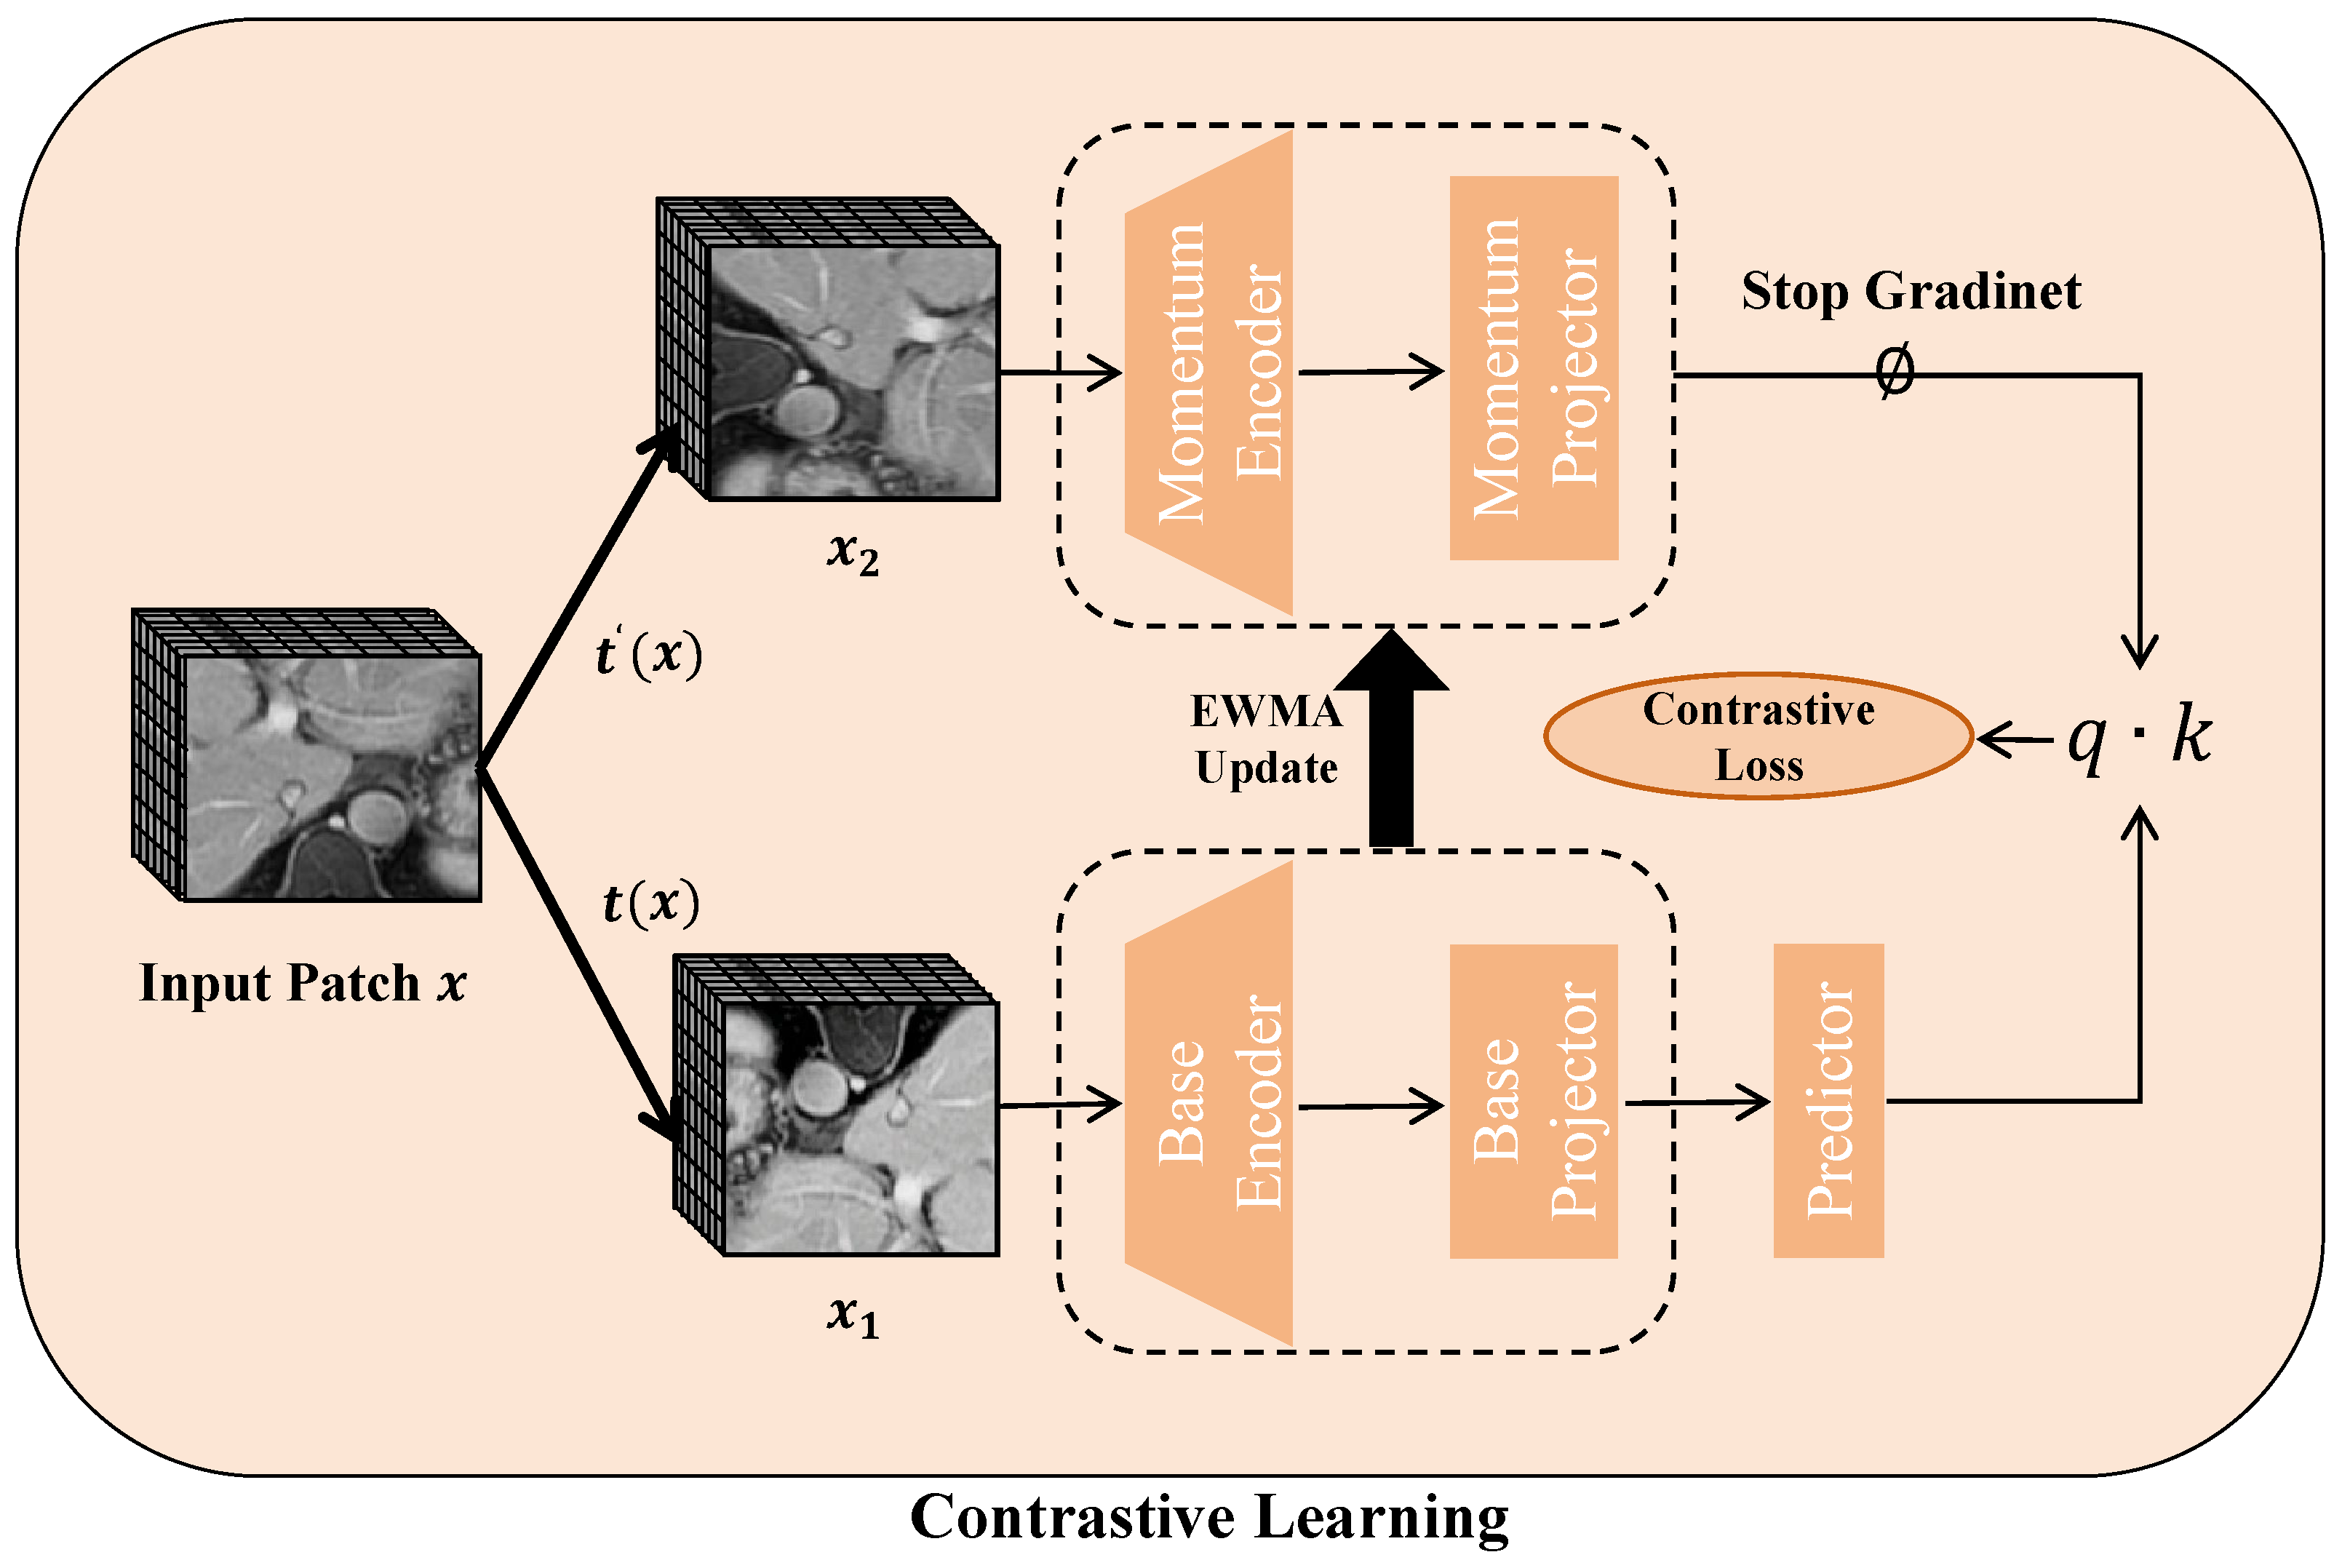
3.3. The Self-Supervised Learning in Our Framework
As illustrated in
Figure 7, pretext tasks are employed for self-supervised learning by combining contrastive learning with an exponentially weighted moving average (EWMA) technique. This method helps in learning strong feature representations from the input data. Once the pretext training is finished, the obtained weights are utilized to initialize the encoder, and the entire model undergoes fine-tuning via supervised learning.
Contrastive learning boosts representation robustness by distinguishing similar (positive) from dissimilar (negative) pairs or by improving the alignment within positive pairs. Given an input batch
x, we apply random image augmentations
, generating two augmented views:
and
, where
t and
are drawn from
. These augmented versions are passed through both the base and momentum networks, each consisting of a Swin-Transformer encoder and a two-layer MLP projector. The base model
is trained with backpropagation, while the momentum network
updates its parameters using an exponentially weighted moving average from the base model:
where
is the decay rate. A one-layer MLP predictor is added to the base network to prevent representational collapse. The similarity between representations is computed via the dot product, and the contrastive loss for a pair
and
is given by:
In this equation, serves as an indicator function that equals 1 when , and denotes the temperature parameter. As a pretext task, contrastive learning draws intra-class pairs closer together while separating inter-class pairs, thus capturing essential semantic features.
4. Experiments
4.1. Datasets and Preprocessing
Segmentation Dataset
The network was trained and validated using a clinical dataset obtained from the First Affiliated Hospital of Dalian Medical University. This dataset consists of contrast-enhanced MRI (CE-MRI) scans, including arterial phase, venous phase, and delayed phase images, collected from 192 patients diagnosed with hepatocellular carcinoma (HCC). The regions of interest (ROIs) of the liver and tumors were manually annotated by two radiologists with more than five years of clinical experience. Each image slice has a resolution of 512 × 512 pixels, with 60–140 slices per scan and a voxel spacing of [0.78 mm, 0.78 mm, 2.2 mm]. Based on patient-level grouping, the dataset was divided into a training cohort (128 patients, 384 MRIs), a validation cohort (32 patients, 96 MRIs), and a test cohort (32 patients, 96 MRIs). MRI scans from different phases of the same patient were kept within the same cohort to prevent data leakage.
To improve the accuracy of liver tumor segmentation, all images underwent several preprocessing steps. First, the MR images were cropped to remove irrelevant background regions. Next, the images were resampled to an isotropic resolution of [1.00 mm, 1.00 mm, 1.00 mm], and pixel intensities were normalized to the range [0, 255]. Furthermore, to enhance the model’s generalization and robustness, several image augmentation techniques were applied during training. These included random rotations, horizontal and vertical flips, scaling, elastic deformations, and intensity variations such as Gaussian noise and contrast adjustment. These augmentations help simulate real-world variability and reduce the risk of overfitting.
SSL Dataset
Our self-supervised learning dataset was created by gathering chest MRI scans from 594 patients, comprising 192 annotated cases and 402 unannotated cases. During pretraining, only the unannotated cases were used, with no reliance on the existing annotations. To maintain consistency, the preprocessing applied to the unlabeled patient MRIs mirrored that of the segmentation dataset.
The study was approved by the ethics committee of the First Affiliated Hospital, Dalian Medical University (PJ-KS-KY-2019-167).
4.2. Implementation Details and Evaluation Metrics
The deep network is trained with the Adam optimizer. The initial learning rate is
, and the learning rate is automatically attenuated according to the CosineAnnealingLR strategy. Until the 100th epoch, the learning rate is attenuated to
. Due to the limitation of computing resources, images must be randomly cropped before input into the network. The patch size is set to
. Each image is randomly divided into eight patches, and the batch size is set to 4. The network is implemented using Pytorch 2.0 and MONAI 1.2.0 [
59], and the server configuration is Intel(R) Xeon(R) CPU E5-16200, 3.60 GHZ, 64 GB RAM, Nvidia GeForce RTX 3090 (24 GB), Ubuntu18.04 (Intel, Santa Clara, CA, USA). To improve the generalization performance of the model and reduce overfitting, we use data augmentation during the training procedure, including random bias field, random Gaussian noise, random contrast adjustment, and random intensity value offset, with a probability of 0.5. We did not use any post-processing or ensemble methods for a fair comparison. In the self-supervised learning phase, a batch size of 4 is utilized. The learning rate begins at
, employing the Adam optimizer alongside a warm-up scheduler for the initial 500 steps. The model undergoes training for 200,000 iterations, with the final model being used for subsequent fine-tuning tasks.
We use the Dice Similarity Coefficient (DSC), 95% Hausdorff Distance (95HD), and Average Symmetric Distance (ASD) to evaluate the segmentation performance of the proposed model. The DSC coefficient measures the volumetric overlap between ground truth and segmentation results, while the 95HD measures the distance between ground truth and the boundary pixels of the segmentation result. Additionally, the ASD provides a measure of the average distance between the boundary points of the segmentation and ground truth. These metrics give a well-rounded understanding of both the volumetric overlap and the boundary discrepancies between the ground truth and the segmentation results.
4.3. Quantitative Results
This section compares the proposed network with five state-of-the-art methods to evaluate its effectiveness and robustness on the CE-MRI dataset. 3DUNet [
60] is widely used for medical image segmentation. It includes an encoder for downsampling to extract features, a decoder for upsampling to generate the segmentation map and skip connections that bridge the encoder and decoder to recover information lost during the downsampling phase. The structure of V-Net [
61] is like 3DUNet but employs residual connections to enhance feature learning across layers. nnU-Net [
62] presents a framework that automatically adapts to different datasets, built upon the foundation of standard U-Nets. UNETR [
43] is a Transformer-based medical image segmentation network that combines the advantages of U-Net and Transformer, uses the self-attention mechanism to capture the global information in the image, and uses U-Net’s encoder–decoder structure to perform local feature extraction and upsampling. SwinUNetR [
46] uses Swin-Transformer for feature extraction and encoding. Swin-Transformer is a new type of Transformer that uses a layered local attention mechanism to capture global information in an image while using a cross-layer attention mechanism to promote feature transmission and integration.
Comparing the proposed method with other advanced methods, DSC, 95HD and ASD are used to measure the segmentation performance of the model for liver and tumor, respectively. As shown in
Table 1, the proposed method outperforms other approaches across five metrics, achieving a DSC score of
for liver segmentation and
for tumor segmentation. The proposed model outperforms other segmentation networks on tumor segmentation by a large margin and slightly outperforms other models on liver segmentation. This is mainly because the proposed model can segment the small tumor more accurately.
Table 2 compares the computational cost and parameter size of our method with several representative 3D medical image segmentation networks. Although transformer-based architectures are generally associated with increased computational burden, our approach demonstrates a favorable trade-off between accuracy and efficiency. Notably, while our model achieves competitive performance (as shown in
Table 1), it only introduces 63.4 M parameters and 188.6 GFLOPs, which is comparable to SwinUNetR (62.1 M, 237.9 GFLOPs) and significantly lower than nnU-Net (91.2 M, 213.8 GFLOPs). Compared with UNetR and SwinUNetR, our method shows only a modest increase in parameters (by 4.9 M and 1.3 M, respectively) and even a notable reduction in GFLOPs compared to SwinUNetR. These results suggest that our design is efficient in terms of computational complexity and model size and that the performance gains do not come at the expense of a significant increase in resource consumption.
To evaluate the statistical significance of the improvements made by our model, A paired
t-test was conducted between the others and our model, with the calculation of the two-sided
p-value. A threshold of 0.05 was set for significance. In
Table 3, we report the
p-values for liver and tumor based on DSC. The results indicate a statistically significant difference between all the compared models and our model, with the lowest different
p-values observed in comparison to nnU-Net: 0.0151 for liver and 0.0032 for tumor.
To determine if the contours predicted by our model are generally larger or smaller than the annotated ones, we calculated the Volume Similarity for all models, and the results are shown in
Table 4. It was observed that the majority of models tend to predict smaller contours for both the liver and tumor. However, our model and nnU-Net [
62] typically predict slightly larger contours for both the liver and tumor, showing better performance in detecting smaller tumors. In particular, for the liver, the average difference between our model’s predictions and the annotated contours in the test set is 4.32% smaller, with a standard deviation of 9.53%. For the tumor, the model’s predictions are, on average, 4.67% smaller, with a standard deviation of 8.67%.
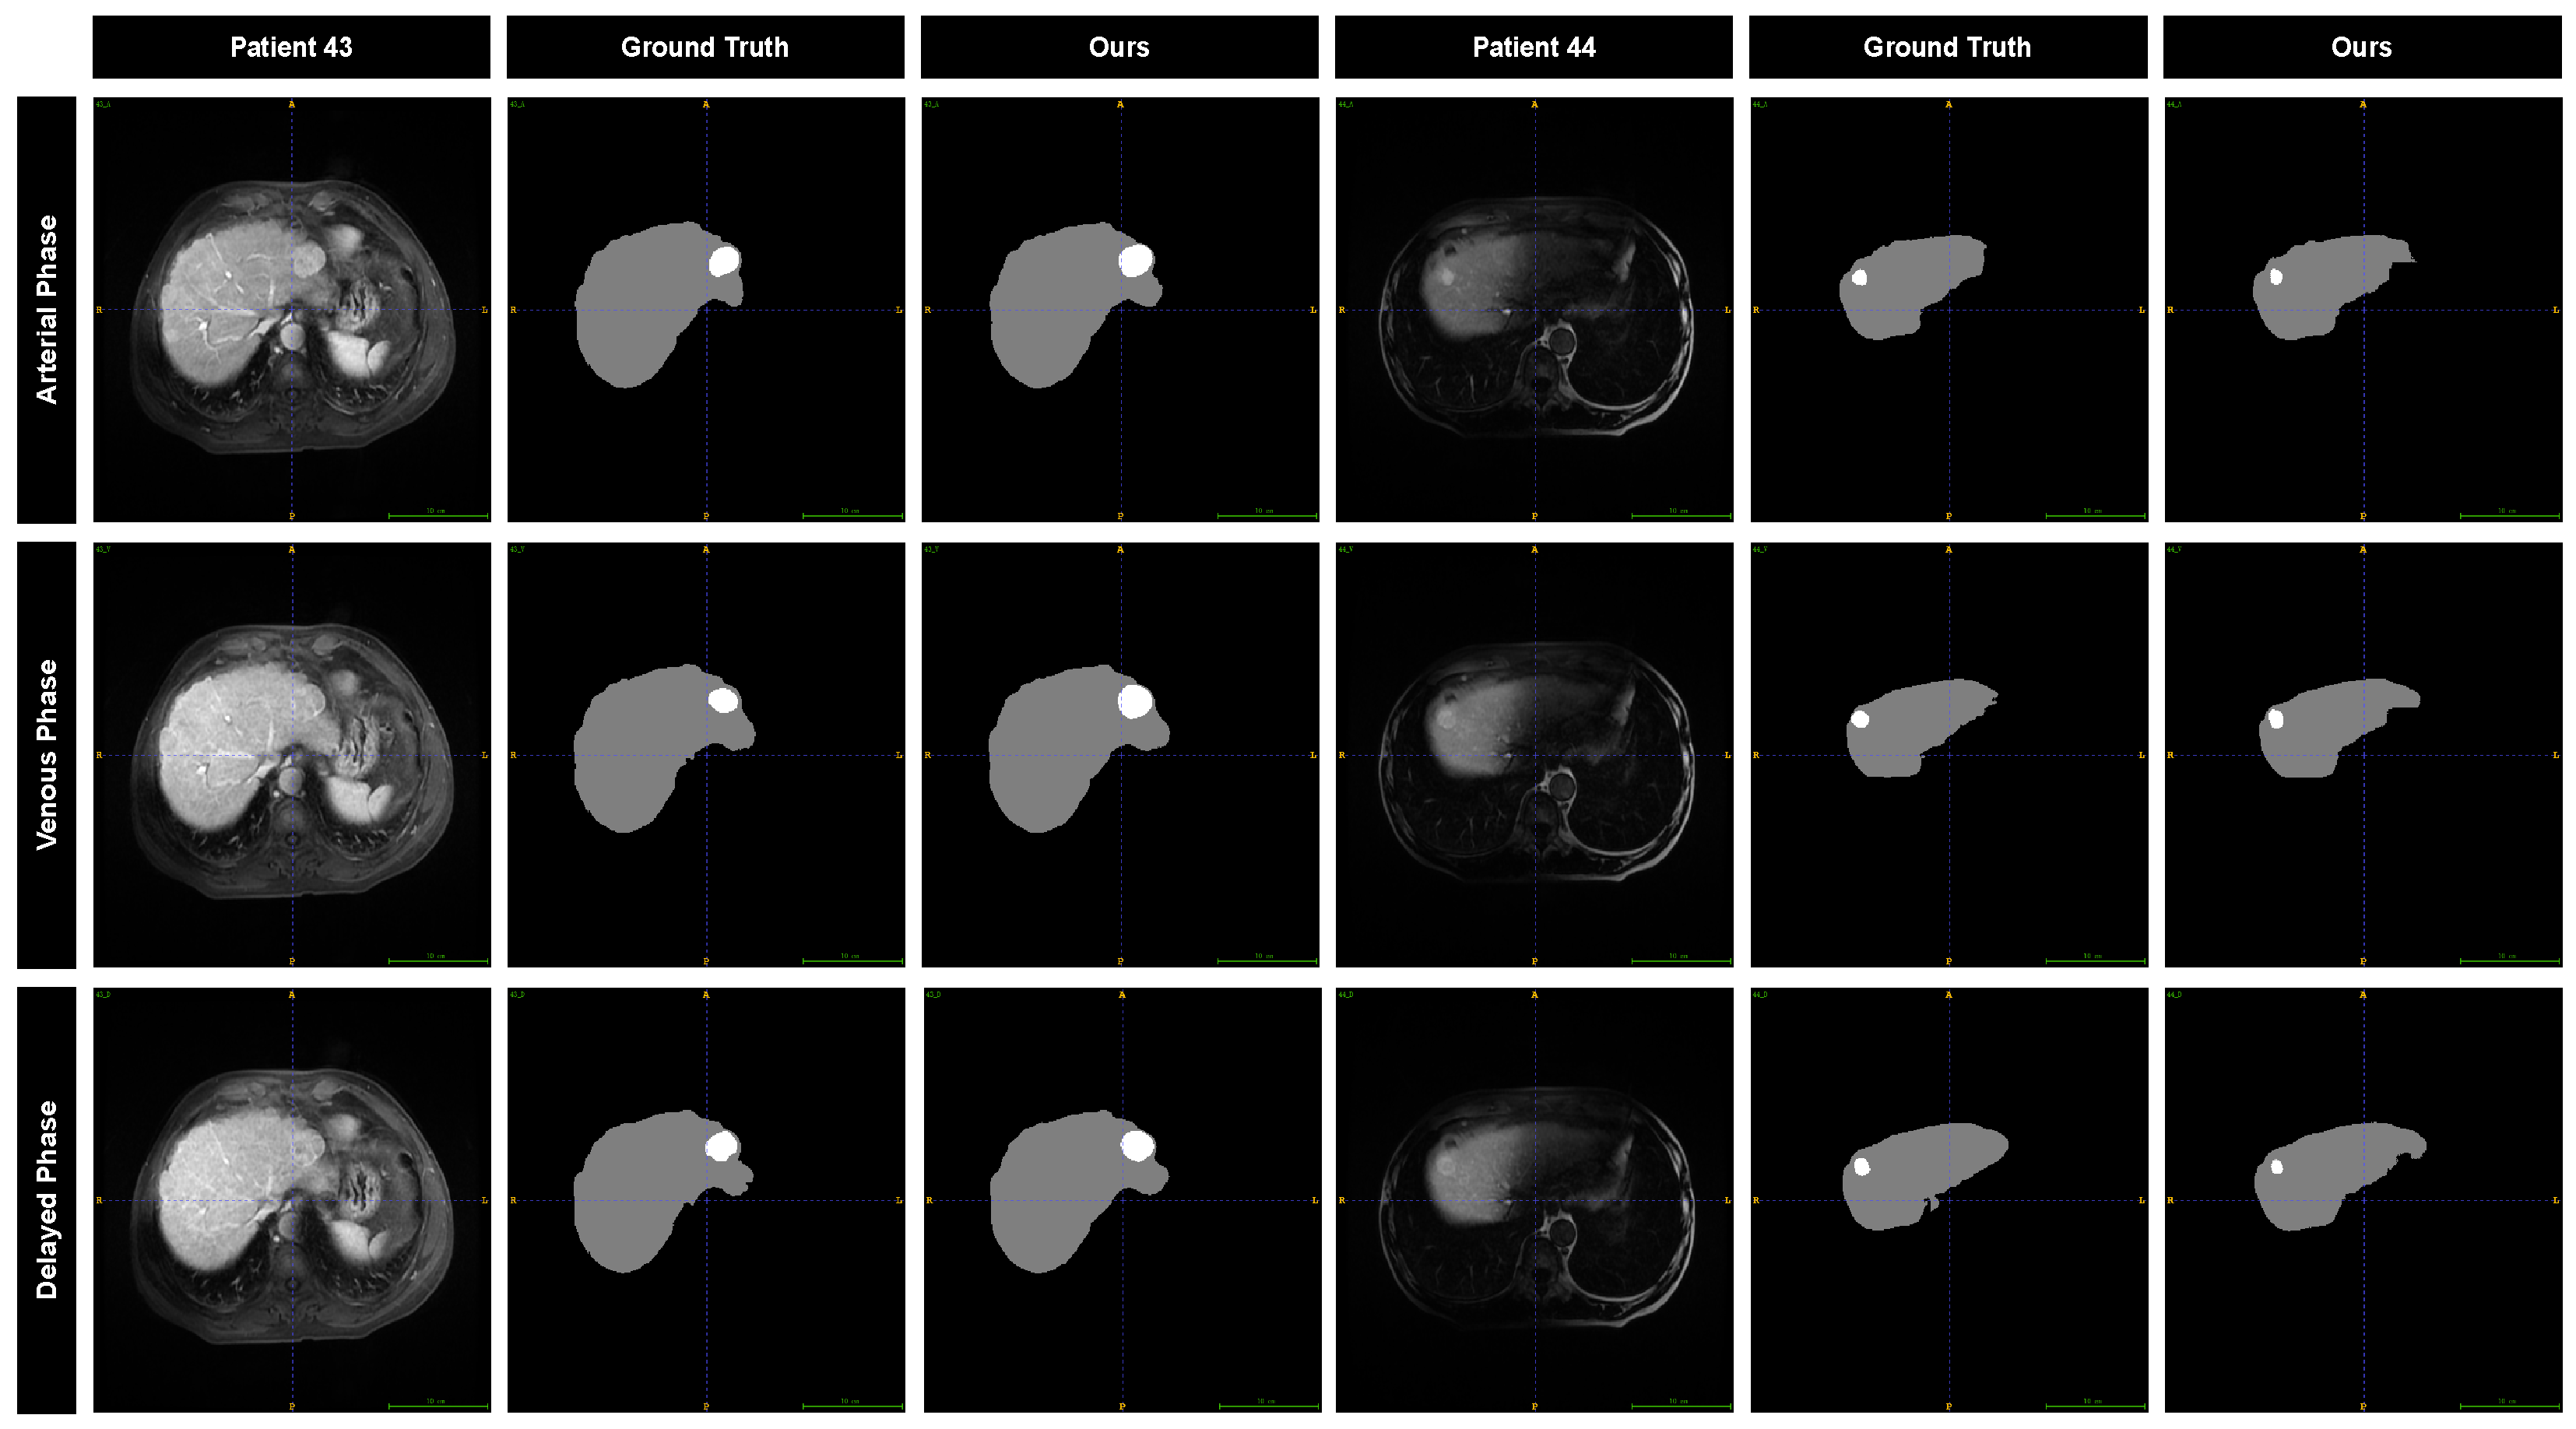
4.4. Qualitative Results
To further evaluate the performance of our model, we visualized the segmentation results and compared them with the annotations provided by the radiation oncologist. The segmentation results for two different patients across three MRI phases are displayed in
Figure 8. The predicted liver contours are in close agreement with the manual annotations, showing minimal discrepancies. For the tumor, the predicted contours exhibit a slight outward expansion relative to the manual annotations, while the overall shape still aligns with the manually drawn contours.
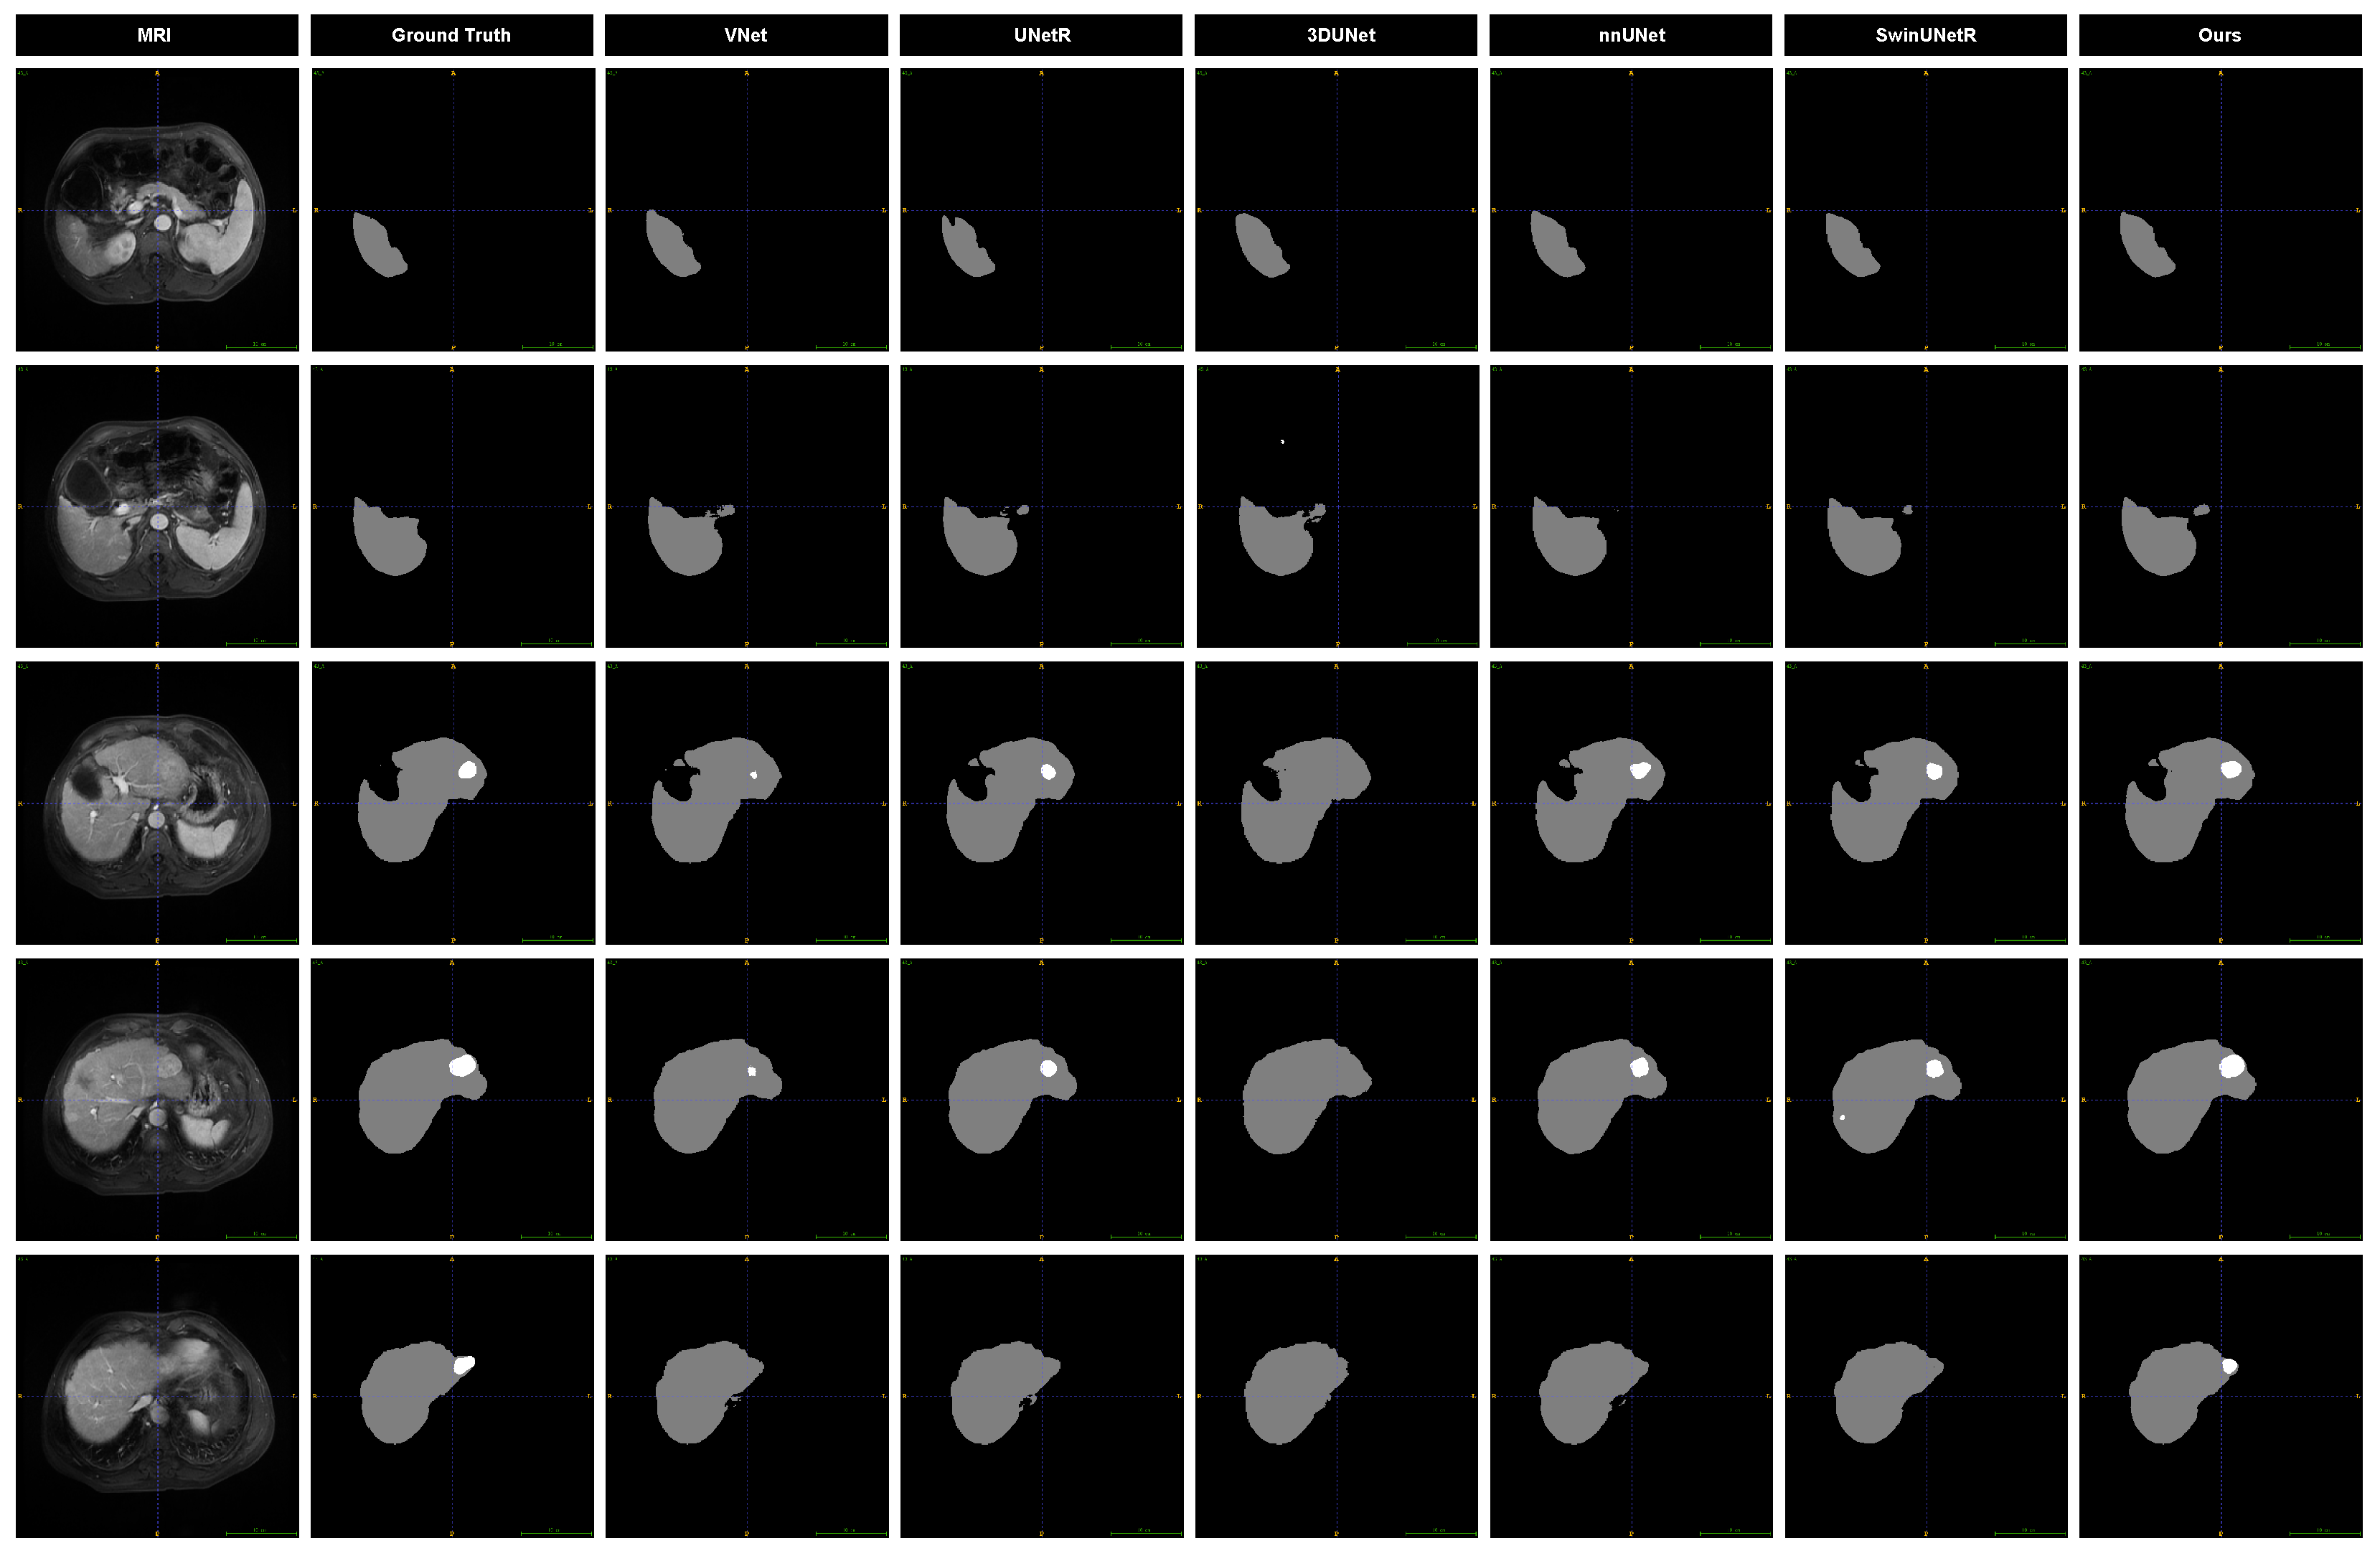
We present slices from arterial phase MRI images of the same patient, highlighting liver and tumor regions at six distinct locations, along with the segmentation results from various models to visually assess their performance. As illustrated in
Figure 9, the prediction outcomes of different models are compared. Notable differences are observed in the segmentation of tumor edges, particularly for smaller tumors. Specifically, 3DUNet and V-Net do not perform well in tumor segmentation, and 3DUNet does not even detect small tumors. While the other three baseline models identify the presence of tumors, their results significantly deviate from the ground truth. In contrast, our model demonstrates superior performance in both liver and tumor segmentation.
4.5. Ablation Experiment
In this section, we conducted different ablation experiments to analyze the proposed model comprehensively. First, we evaluate the improvement of the SDM regression branch on segmentation results to demonstrate the importance of multitask learning.
Table 5 shows the segmentation results of removing the SDM branch and retaining the SDM branch. We also use DSC and 95HD for evaluation. The results show that the model that retains the SDM branch has a higher DSC value and a lower 95HD in terms of liver and tumor segmentation, indicating that it can better find the tumor location and segment the marginal region.
Introducing the SSL method for pretraining, the network helps improve the performance of the liver and tumor segmentation model, as shown in
Table 5. By pretraining on a large amount of unlabeled data, the model can learn richer feature representations, enabling better generalization on limited labeled data. Experimental results demonstrate that, compared to models without self-supervised pretraining, models trained with self-supervised learning achieve significant improvements in DSC score, 95HD, and ASD, leading to more accurate target region predictions and smoother boundary segmentation. This indicates that self-supervised pretraining can effectively enhance the model’s representation capability, thereby improving liver and tumor segmentation performance.
After introducing the attention gate mechanism, the performance of the liver and tumor segmentation model has significantly improved, as shown in
Table 5. Specifically, DSC increased by approximately 0.59% and 1.39% for liver and tumor segmentation, respectively, indicating that the model can more accurately capture the boundaries and shapes of the target regions. Furthermore, 95HD for liver and tumor decreased by approximately 0.2 and 0.25, respectively, demonstrating a notable enhancement in prediction accuracy for boundary regions, particularly when handling complex and small-sized tumors. These improvements suggest that the attention gate mechanism effectively enhances the model’s ability to focus on critical regions, thereby improving segmentation accuracy and robustness.
Table 6 presents the segmentation results of our model on different CE-MRI images. It is worth noting that the model performed best in the arterial enhanced MRI images. The liver and tumor DSC values reached
and
, respectively, higher than the performance of the model in the venous phase and delayed phase, which may be attributed to tumors being associated with more excellent contrast and sharper visualization of surrounding areas in the arterial phase.
Figure 8 shows the segmentation results of the model for different MRI images of the two different patients. The results showed that CE-MRI in the arterial phase was superior to the other two MRI images, with more complete segmentation results and more accurate edges.
Finally, to analyze the SDM branch’s impact on the segmentation performance, we set
with different weights for experiments. The results in
Table 7 show that with the increase of the weight
, the model performance does not produce a corresponding improvement but produces an inevitable decline. This is mainly reflected in the 95HD and the ASD of the tumor, indicating that the segmentation performance of the edge part of the model has declined. Finally, when
, the model achieved the best performance.
5. Discussion
To address the challenging problem of liver and tumor segmentation in HCC patients, we developed a Swin-Transformer-based segmentation framework with a multitask and attention strategy for liver and tumor segmentation. In contrast to CNN-based segmentation models, the Swin-Transformer leverages self-attention mechanisms, enabling it to capture contextual information and long-range dependencies across the entire CE-MRI. The global attention capability enhances the model’s understanding of the spatial relationships between the liver and tumor in MRI scans, thereby improving the segmentation accuracy for both regions.
To further enhance the attention mechanism, the liver and tumor segmentation model showed significant performance improvements following the integration of the attention gate mechanism, as shown in
Table 5. Specifically, the DSC scores for liver and tumor segmentation increased by approximately
and
, respectively, highlighting the model’s enhanced ability to accurately delineate the boundaries and shapes of the target regions. Additionally, the 95HD for both liver and tumor decreased by approximately
and
, respectively, indicating a marked improvement in boundary prediction accuracy, particularly in the context of small or complex tumors. These results underscore the effectiveness of the attention gate mechanism in improving the model’s focus on critical regions, thereby boosting both segmentation accuracy and robustness.
We introduced the SDM regression branch in the proposed method, which realized the simultaneous learning of the segmentation and SDM regression tasks. At the same time, introducing the SDM regression branch added additional shape constraints to the segmentation task, further improving the robustness and stability. To evaluate the effectiveness of the proposed method, we conducted comprehensive experiments on ablation analysis.
Table 1 and
Figure 9 show the comparison results with other methods. Our proposed method is superior to other methods in terms of DSC, 95HD, and ASD. The DSC values for liver and tumor segmentation reached
and
, 95HD reached
and
, and ASD reached
and
. The visualization of the segmentation results shows that compared with the baseline model, the proposed model can detect small tumors better, and the segmentation results of the target edge region are smoother. Several works have explored the application of distance sign maps to medical images. Xue et al. [
58] converted the segmentation task to predicting SDM. They introduced an approximate Heaviside function to train the model by simultaneously predicting SDM and segmentation mask so that the segmentation results have better smoothness and shape continuity. Ma et al. [
63] embed the global geometric information of objects into the learning framework through the classic geodesic active contours (GAC) and propose a level set function (LSF) regression network, which not only predicts the segmentation mask but also minimize the GAC energy function. Li et al. [
64] incorporated SDM into the semi-supervised segmentation task to enforce geometric shape constraints in the segmentation output. A multitask deep network is proposed to predict semantic segmentation jointly and SDM of object surfaces. Based on this, Luo et al. [
65] transformed the SDM into an approximate segmentation map via a differentiable task conversion layer. They introduced dual-task consistency regularization between the SDM map and the directly predicted segmentation map. However, it has yet to be found that the predicted distance sign map and segmentation results are applied to the liver tumor segmentation of CE-MRI images. This study is the first to explore this.
Obtaining high-quality annotated images for HCC patients is a challenging endeavor, as deep-learning models need big datasets to realize their full potential. To alleviate the manual labeling burden for training data, we employ SSL methods by designing a pretraining task focused on liver and tumor segmentation. By collecting A significant volume of unlabeled data sourced from hospitals, the model can learn meaningful visual representations from this extensive dataset before transitioning to supervised learning. Experimental results show that our self-supervised pretraining task significantly boosts the accuracy of the final segmentation model. Specifically, without self-supervised learning, the DSC scores for liver and tumor segmentation are and , respectively, with 95HD values of 3.76 mm and 4.21 mm and ASD values of 0.97 mm and 1.09 mm. After applying self-supervised learning, the DSC scores remain unchanged at and , while the HD95 values improve to 3.62 mm and 4.12 mm, and the ASD values reduce to 0.92 mm and 1.02 mm.
Despite the strong performance of our method on the test set, several limitations remain in this study. The most significant limitation is that the test set comprises only 32 patients, all from a single medical center. This relatively small and homogeneous dataset may not capture the variability in imaging protocols, scanner types, and patient populations that exist across different institutions. For example, in our study, all enrolled cases were patients diagnosed with hepatocellular carcinoma (HCC), which accounts for approximately 80–90% of all liver cancer cases. Other types of primary liver tumors, such as intrahepatic cholangiocarcinoma, combined hepatocellular–cholangiocarcinoma, and hepatic angiosarcoma, were not included in our dataset. As a result, there may be potential dataset biases, and the current results may not fully generalize to broader clinical settings. To address this issue, multicenter validation is essential to evaluate the robustness and applicability of the proposed method in real-world clinical practice. In future work, we plan to collect more diverse datasets from multiple medical centers and MRI devices to comprehensively assess the generalizability and reliability of our approach. This will help mitigate potential biases and ensure that our method performs consistently across varying clinical environments.


