1. Introduction
In modern agricultural systems, the drying of crop grains is a critical step in preserving quality and extending storage life [
1]. Due to the high moisture content of freshly harvested crops, prompt drying is essential to prevent mold growth [
2]. The inadvertent use of mold-contaminated grains in food processing not only compromises their nutritional and functional value but may also result in the production of aflatoxins under favorable conditions [
3], posing significant risks to human health. Furthermore, contamination can markedly reduce the germination rate of seeds, thereby impeding subsequent agricultural production [
4]. Therefore, timely dehydration and drying are essential to lower grain moisture content, improve storage and transport stability, and maintain grain quality and germination viability—key objectives in post-harvest crop management.
Traditional drying methods typically involve placing grains on trays within a drying chamber, where hot air is circulated to facilitate moisture removal [
5]. However, this approach presents several limitations. Alam et al. [
6] reported that an extended stationary placement of grains on trays during drying can result in localized overheating (scalding), which degrades grain quality. Additional studies [
7] have shown that temperature gradients develop between the tray-contacting surface of the grain and the exposed surface, leading to non-uniform heating. This discrepancy often results in uneven internal moisture distribution and structural damage, such as endosperm rupture. Previous investigations [
8] also revealed that frequent opening of the oven door during the drying process destabilizes the internal temperature and prevents the real-time monitoring of grain weight. As a consequence, it becomes challenging to quantify moisture loss accurately, often leading to issues such as grain discoloration or burning. These limitations hinder drying efficiency and adversely affect crop yield and economic returns.
To address the limitations of traditional drying methods, researchers have begun to explore more efficient and intelligent drying technologies. Among these, vibratory heating has garnered significant attention due to its distinct advantages [
9]. Lim et al. [
10] introduced a vibration module within the drying tray to induce continuous grain motion during the drying process. This transient separation from the tray surface effectively mitigated the risk of scalding caused by prolonged contact.
Building on this foundation, the integration of piezoelectric detection technology offers further optimization of the drying process. This technology enables the real-time monitoring of both the vibration module’s operational state and the dynamic behavior of the grains, allowing the precise regulation of vibration frequency and amplitude to ensure uniform and efficient drying. Piezoelectric sensors are integral to such systems [
11]. Previous studies [
12] have demonstrated that the mechanical stress generated from grain collisions induces charge output due to changes in material properties. This weak electrical signal is then amplified via a charge amplifier and converted into a measurable voltage signal. These voltage outputs encapsulate critical vibrational parameters—including frequency, amplitude, and phase—that reflect the dynamic state of the system during operation [
13]. By analyzing these signals, it becomes possible to implement real-time monitoring and control of the heating–vibration process, thereby providing a robust basis for the optimization of drying parameters [
14].
Moreover, earlier research [
15] has shown that different grain types and qualities generate distinguishable vibration response signals. For example, Li et al. [
16] utilized time-domain signal features such as voltage amplitude and specific frequency to differentiate between grains and impurities in mixed samples. By constructing corresponding signal feature models, Kaygusuz et al. [
17] achieved the low-cost sorting and cleaning of granular agricultural products in vibrational environments, enhancing the automation and intelligence of grain processing systems.
However, in practical applications, the acquisition and analysis of vibration signals present several challenges. One significant issue is signal aliasing, which compromises the generalizability of extracted features across different categories, thereby impeding the construction of accurate classification models. Additionally, hardware malfunctions and degradation can adversely affect signal transmission quality. Therefore, appropriate compensation and optimization strategies are necessary to maintain system reliability and performance.
Building upon the aforementioned research, this study introduces a novel grain drying apparatus integrated with a vibration-based piezoelectric detection system. The proposed system not only improves upon the mechanical design of conventional crop seed dryers but also enables the real-time monitoring of moisture variation in grains, thereby facilitating precise control of the drying process. By analyzing the time-domain response signals resulting from interactions among seeds, impurities, and the drying tray—and accounting for discontinuities due to vibration or hardware-related interference in the communication link—the system derives the outage probability (OP) and a progressive closed-form solution for signal transmission. This is modeled under a Rayleigh fading channel using the shortest routing protocol (SRP) to enhance signal reliability and data integrity throughout the drying process.
2. The Mechanical Structure of the Intelligent Drying Apparatus
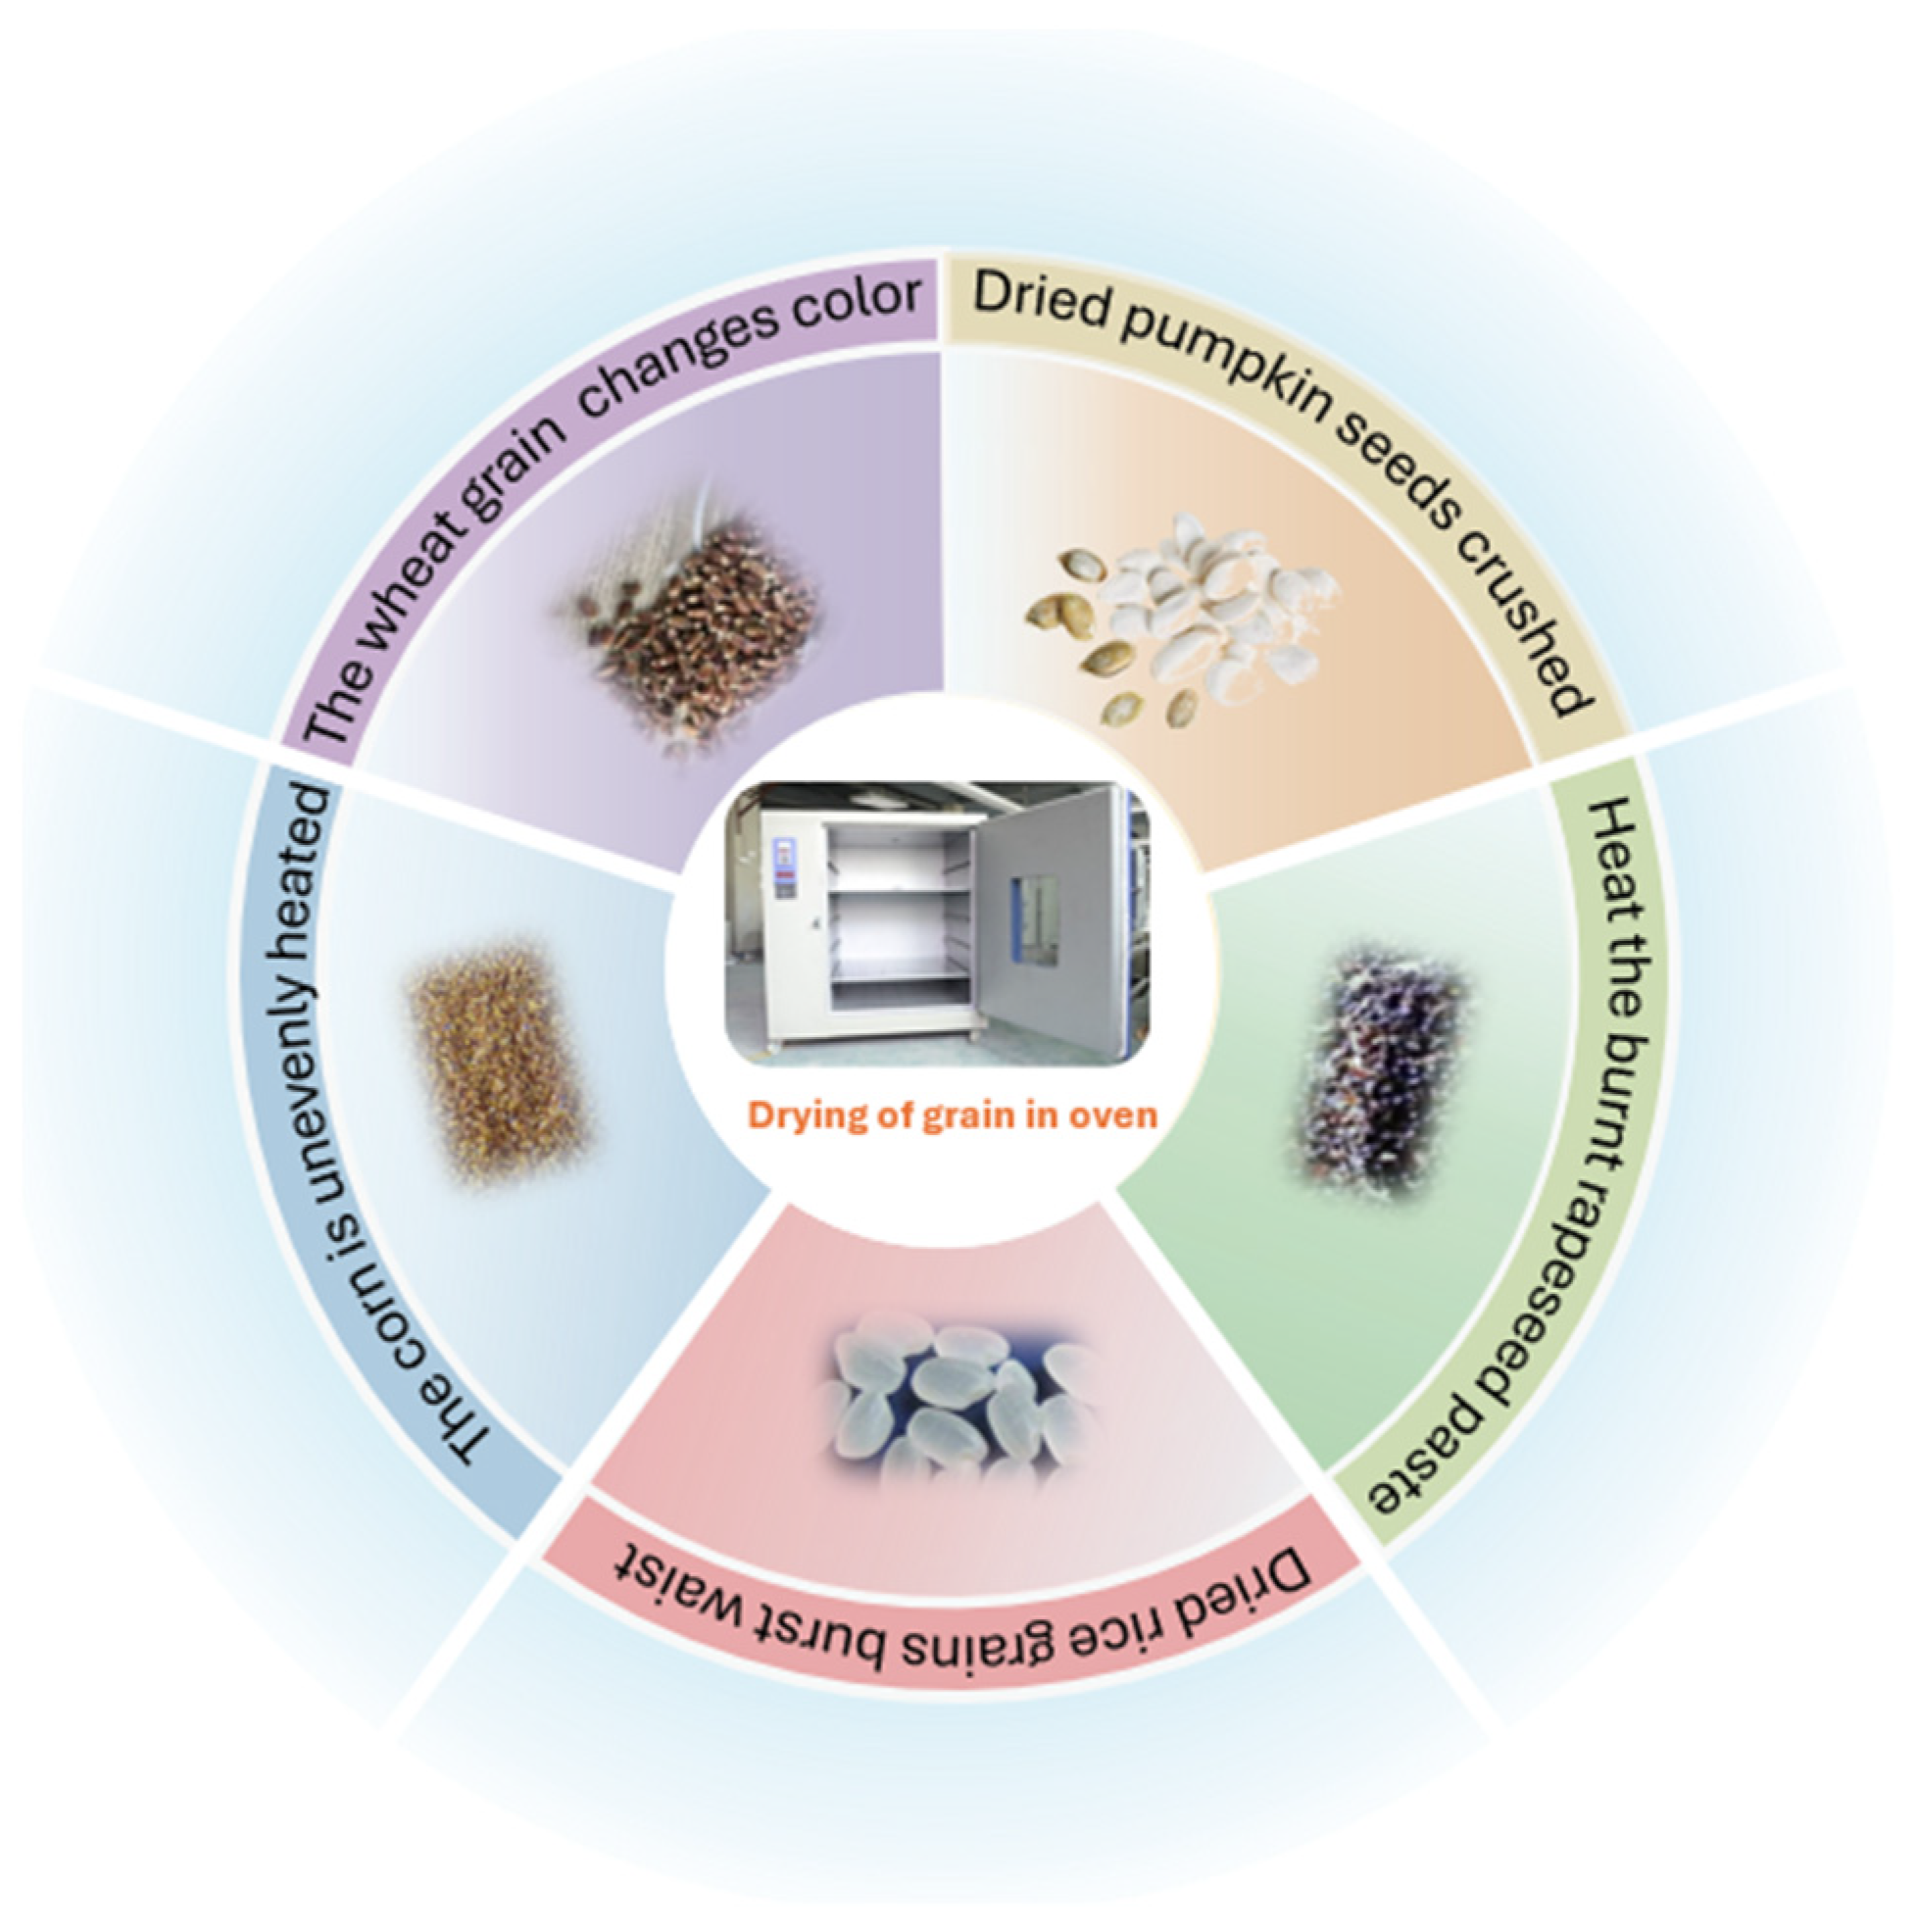
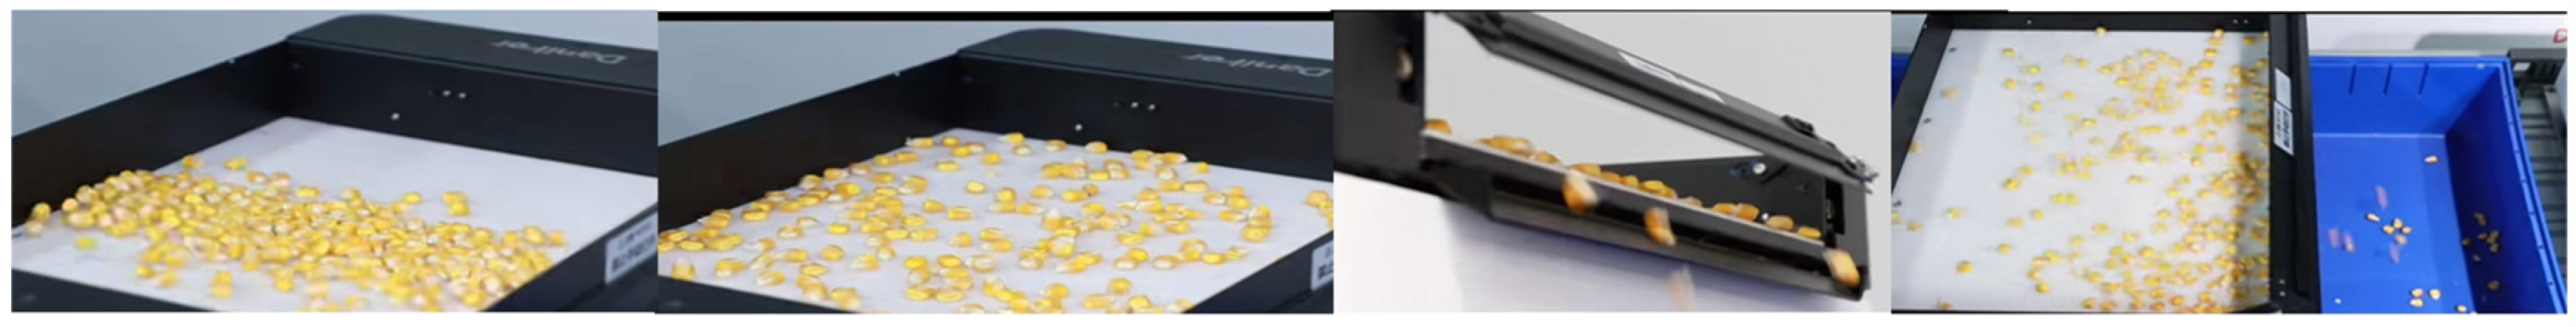
Efficient grain drying systems that prevent seed scalding, allow for automated weighing, and accurately distinguish seed mixtures are essential for enhancing the productivity and sustainability of agricultural operations. In current practice, seeds are typically placed on drying trays, which are then inserted into a drying chamber. The drying process is manually monitored with operators removing trays periodically to assess moisture levels by weighing and visual inspection. In experimental trials, however, the static placement of seeds on trays often results in several issues, including seed cracking (e.g., kernel bursting), discoloration, uneven heat distribution, and even localized burning due to improper control of temperature or drying duration—conditions that ultimately compromise drying quality (as illustrated in
Figure 1). Furthermore, the inability to monitor moisture evaporation continuously over time limits the accuracy of the drying process, leading to suboptimal results and reduced operational efficiency.
2.1. Overall Structure of the Device
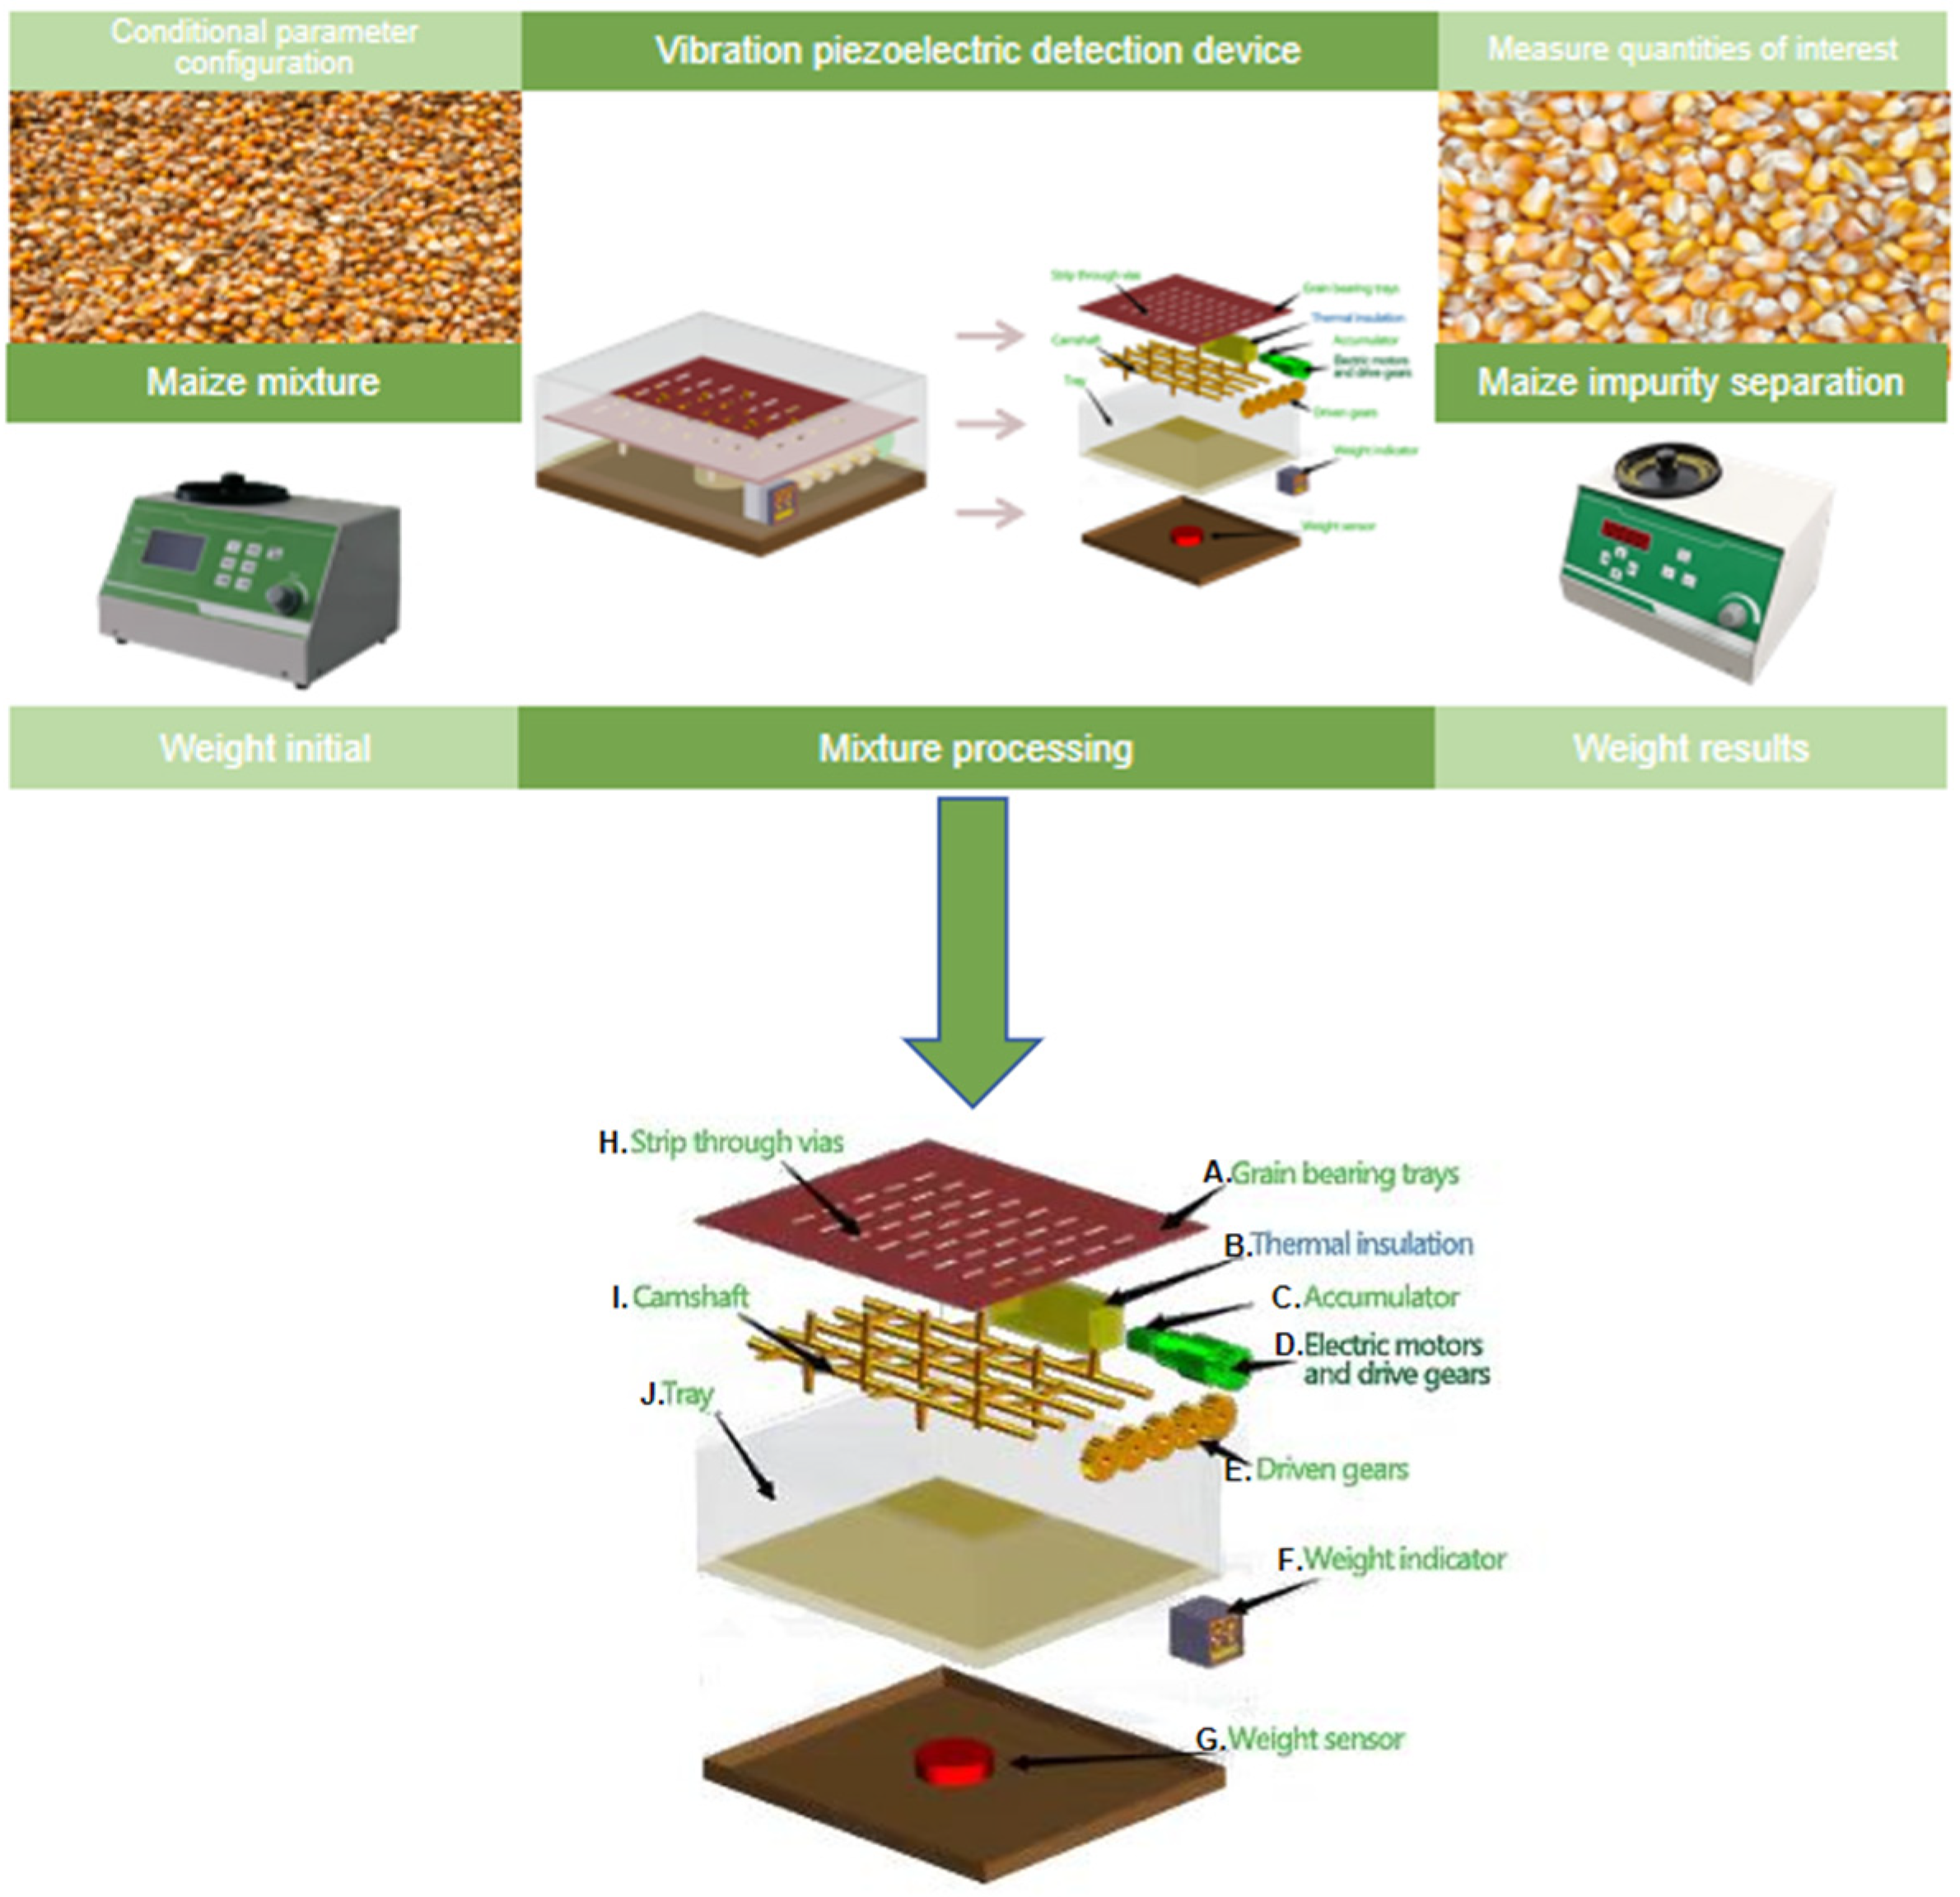
In this study, a novel independent vibration-based piezoelectric detection apparatus is designed, as illustrated in
Figure 2. The core structure consists of a tray body (J) with a fixedly mounted seed support plate (A) inside its cavity. The seed support plate (A) features multiple elongated through-holes (H), which are dimensioned narrower than the cross-sectional size of the crop grains to ensure that seeds remain securely on the plate without passing through the openings.
A plurality of mutually parallel and rotatable camshafts (I) are mounted below the seed carrier plate (J), the cam parts on the camshafts (vertical posts in I) being in insertion fit or presented to support the carrier plate (A) with strip through holes (H) in the seed carrier plate (A).
A vacuum-insulated box (B) is arranged in the chamber of the tray body (J) and is located on the side of the camshaft. An interconnected battery (C) and a motor (D) are arranged in a vacuum-insulated box.
The main gear is solidly mounted on the motor, and the driven gears and main gears are solidly mounted on the multiple camshafts. These are sequentially connected with several camshafts on the slave gear (E), tray body (J), along with an overall configuration in the weight sensor (G), which is installed in the tray body on the outer side of the wall of the weight display (F). The wire is for the weight sensor, and the weight display is connected to the composition of crop seed drying anti-scald and automatic weighing tray.
2.2. Modeling the Working System
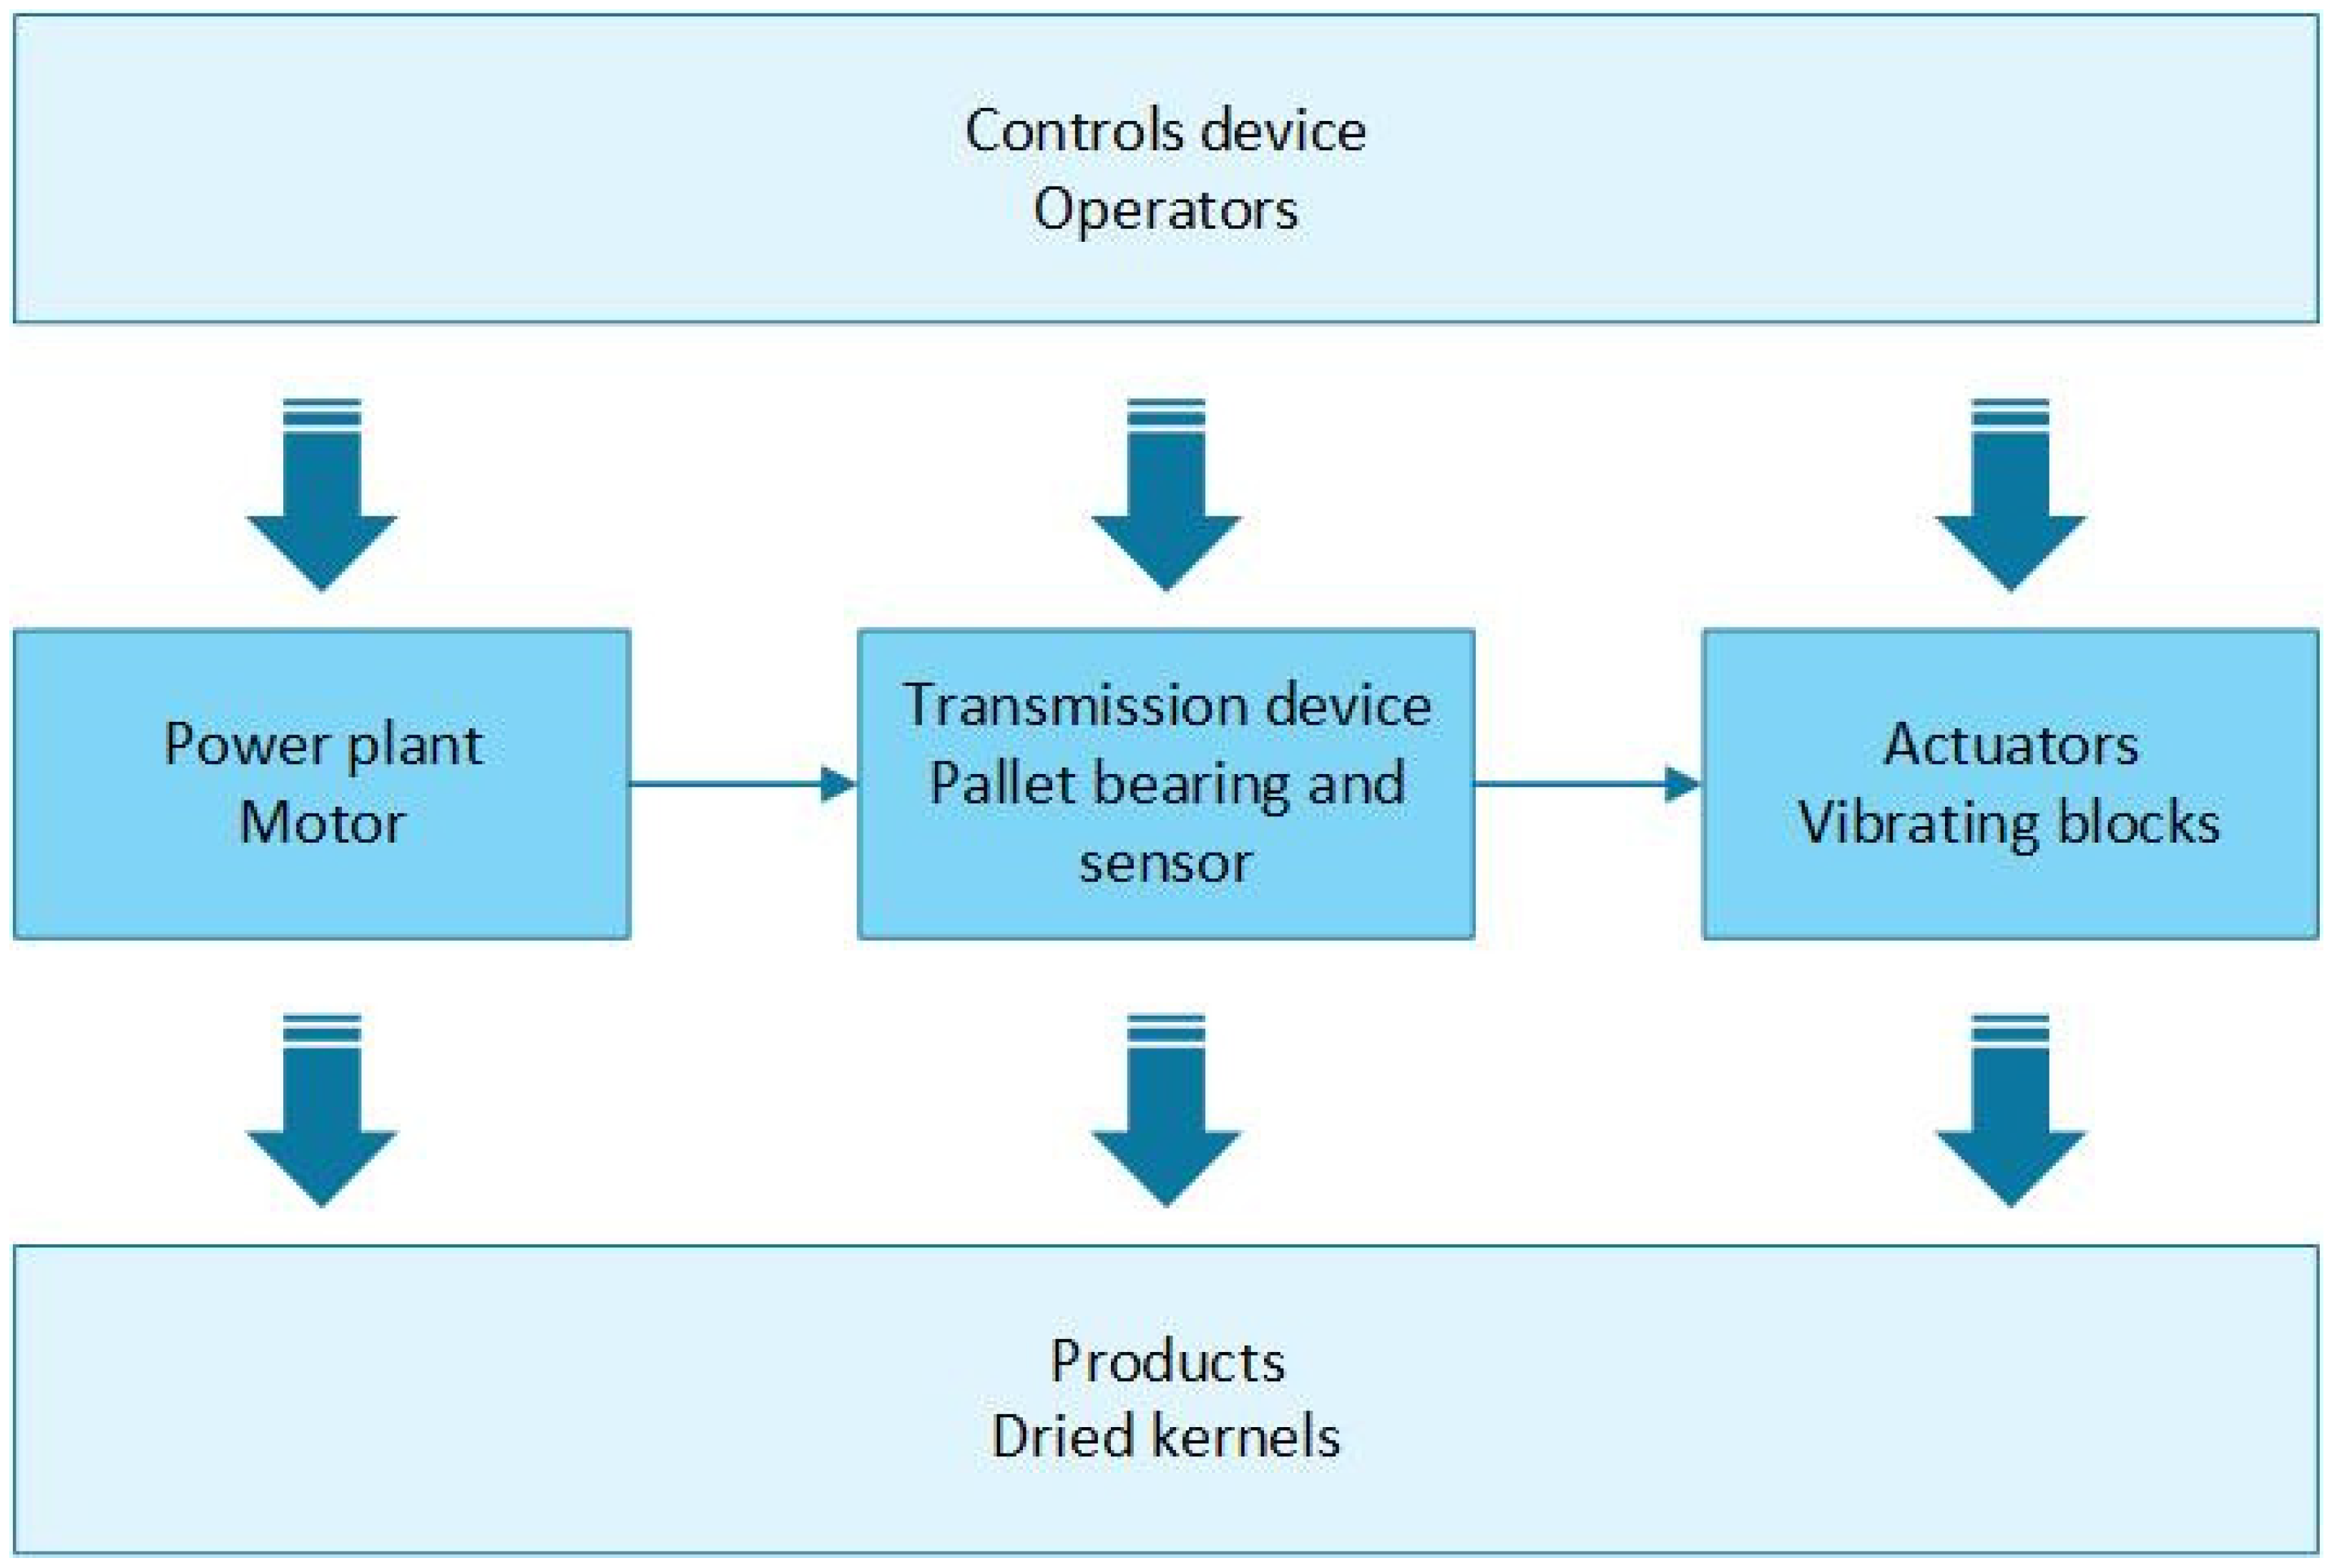
Conventional static drying methods result in prolonged contact between crop grains and the drying tray, often leading to localized burning or scorching. To address this issue, intermittent separation between the grains and the tray can be achieved by applying controlled external force. In this study, the proposed grain-processing tray system comprises four main components: a power unit, a transmission mechanism, an actuator, and a control unit. As illustrated in
Figure 3, the transmission and actuator subsystems are critical to the operational efficiency of the entire mechanism.
The transmission device modulates the parameters of the seed support plate and regulates the vibration frequency of the actuator to optimize drying performance and enhance process quality. Key technical specifications of the system include the structural design of the actuator’s vibration block, input voltage, operational frequency, dimensions of the drying unit, and motor power, as shown in
Table 1.
This study adopts a dynamic vibration-based drying approach. A vibration block is positioned beneath the seed support plate and configured to operate at a predetermined frequency. During operation, the vibration block induces oscillatory motion in the otherwise static seed plate, intermittently lifting the grains and enabling momentary separation from the tray surface. The entire tray assembly, including the weight sensor, is placed inside the drying chamber. Intermittent vibration is controlled through the precise adjustment of frequency and duty cycle. Real-time weight measurements are taken during static intervals to ensure accurate mass data acquisition while minimizing the influence of vibration. This setup effectively balances the need for grain–tray separation with high-precision weight monitoring during the drying process.
2.3. Vibratory Conveyor Theory
The synergistic interaction between the vibration transmission mechanism and airflow plays a critical role in the grain-drying process. In this study, experimental design parameters are selected to account for both vibration characteristics and airflow conditions, aiming to optimize drying efficiency and enhance grain quality.
Vibration-assisted drying: Vibration enables an intermittent separation between the grains and the drying tray, thereby reducing the duration of contact and minimizing the risk of scorching. Additionally, vibration promotes grain turnover, increases the effective contact area for heat exchange, and enhances the overall heat transfer efficiency.
Effect of airflow on vibration: Airflow can interfere with the vibration process, potentially compromising system stability. Therefore, the influence of airflow must be considered in the system design to ensure reliable and consistent vibration performance.
Vibration period (T): The period required to complete a full vibration cycle is inversely related to the frequency, which is defined as .
Amplitude (A): Amplitude refers to the maximum displacement during vibration. It directly influences the effectiveness of grain–tray separation. Larger amplitudes facilitate better separation; however, excessive amplitudes may damage grains. In this study, optimal amplitude values range from 1 mm to 3 mm.
Damping: Damping refers to the dissipation of vibrational energy. Appropriate damping minimizes excessive oscillations and contributes to system stability. The damping ratio (ζ) quantifies this effect, typically ranging from 0 to 1.
By fine-tuning vibration frequency, amplitude, damping, and airflow parameters (e.g., wind speed and angle), the optimal synergistic effect between vibration and airflow can be achieved, thereby significantly improving both drying efficiency and grain quality.
3. Processing Method of Vibration Piezoelectric Signal
3.1. Capture of Vibro-Piezoelectric Response Signals
Capturing time-domain signals generated from interactions among seeds, impurities, and drying trays presents significant challenges. Signal aliasing, in particular, impairs the generalization of extracted features between seed and impurity classes, thereby limiting the accuracy of crop seed classification models. According to Shannon’s sampling theorem, the sampling frequency of the detection system must twice exceed the maximum frequency component of the signal. This requirement ensures that the original time-domain response signal is fully retained and accurately reconstructed, effectively preventing aliasing. Consequently, the maximum effective frequency of the piezoelectric vibration detection system is limited to half the sampling frequency.
When subjected to vibration, seeds and impurities intermittently collide with the support plate. These mechanical collisions generate stress signals, which are transduced into electrical charges by the piezoelectric sensor. The charge amplifier then converts these weak charge outputs into measurable voltage signals, amplifying them to form a complete time-domain response. These signals provide a rich dataset for distinguishing between grain and impurity characteristics during model training. To ensure signal compatibility with subsequent digital processing, a chopper circuit is integrated into the charge amplifier. This prepares the amplified signals for conversion via an analog-to-digital converter (ADC), which—based on a signal acquisition card as the core component—continuously samples and stores time-domain response data using dynamic link library (DLL) functions.
This signal acquisition framework enables efficient transmission even under dynamic channel conditions. In contrast to conventional interference cancellation techniques that rely on instantaneous received power, the proposed shortest routing protocol (SRP) utilizes instantaneous channel state information (CSI) alone. This allows the system to dynamically adapt to channel fluctuations, thereby ensuring enhanced reliability and overall performance under variable communication conditions.
3.2. Hardware Damage Condition
Considering the effect of hardware damage on the transmission of particle vibration piezoelectric signals, specifically, when there is damage to the device, the transmission
→ and
→
signals are expressed as follows:
where
is the transmit power of the transmitter
,
is the link channel coefficient,
and
represent the noise caused by the damage of the transmitting and receiving equipment, and
and
represent additive white Gaussian noise (AWGN), which are Gaussian random variables (RVs) with mean zero and variance
. Considering the effect of additive Gaussian white noise, the signal-processing algorithm of the vibration piezoelectric detection system can be optimized to improve the system’s anti-interference ability and monitoring accuracy.
Here, is the channel gain, and the channel is Rayleigh fading. In agriculture, such as in vibrating piezoelectric detection systems used in crop seed drying, signals may be affected by equipment vibration, mechanical interference, or environmental factors, resulting in unstable signal transmission. The Rayleigh fading channel model can help us to understand and predict such signal variations in order to optimize the system design, reduce signal interference and improve the accuracy and reliability of the detection.
follows
RV,
and its probability density function (PDF) is shown below:
where
represents the parameters of
,
=
, defined as
, and
is the expectation operator. Considering path loss [
18] yields the following:
is the link distance between
X and
Y, and
is the path loss exponent.
To simplify the system model, the distortion noise
~(0,
),
~(0,
) follows the circular symmetric complex Gaussian distribution, and the damage degree is assumed to be the same as the node architecture to obtain the following:
Referring to [
19], the instantaneous signal-to-noise ratio (SNR) of
→
and
→
links can be written as follows:
By optimizing the signal-to-noise ratio, the accuracy of the vibrating piezoelectric detection system can be improved, and false and missed detections due to noise interference can be reduced, thus better monitoring the drying process of crop seeds.
The method of distinguishing a single-point voltage amplitude or a specific frequency from a one-dimensional time-domain signal is suitable for crop seed mixtures with complex composition and time-varying modes. The maximum transmit power of the piezoelectric monitoring transmitter
is written as follows:
Therefore, the channel capacity (
) of a
→
link can be expressed as follows:
where
is duration, and
is the difference between the signal at points
i and
j.
3.3. Evaluate the Anti-Interference Performance of SRP
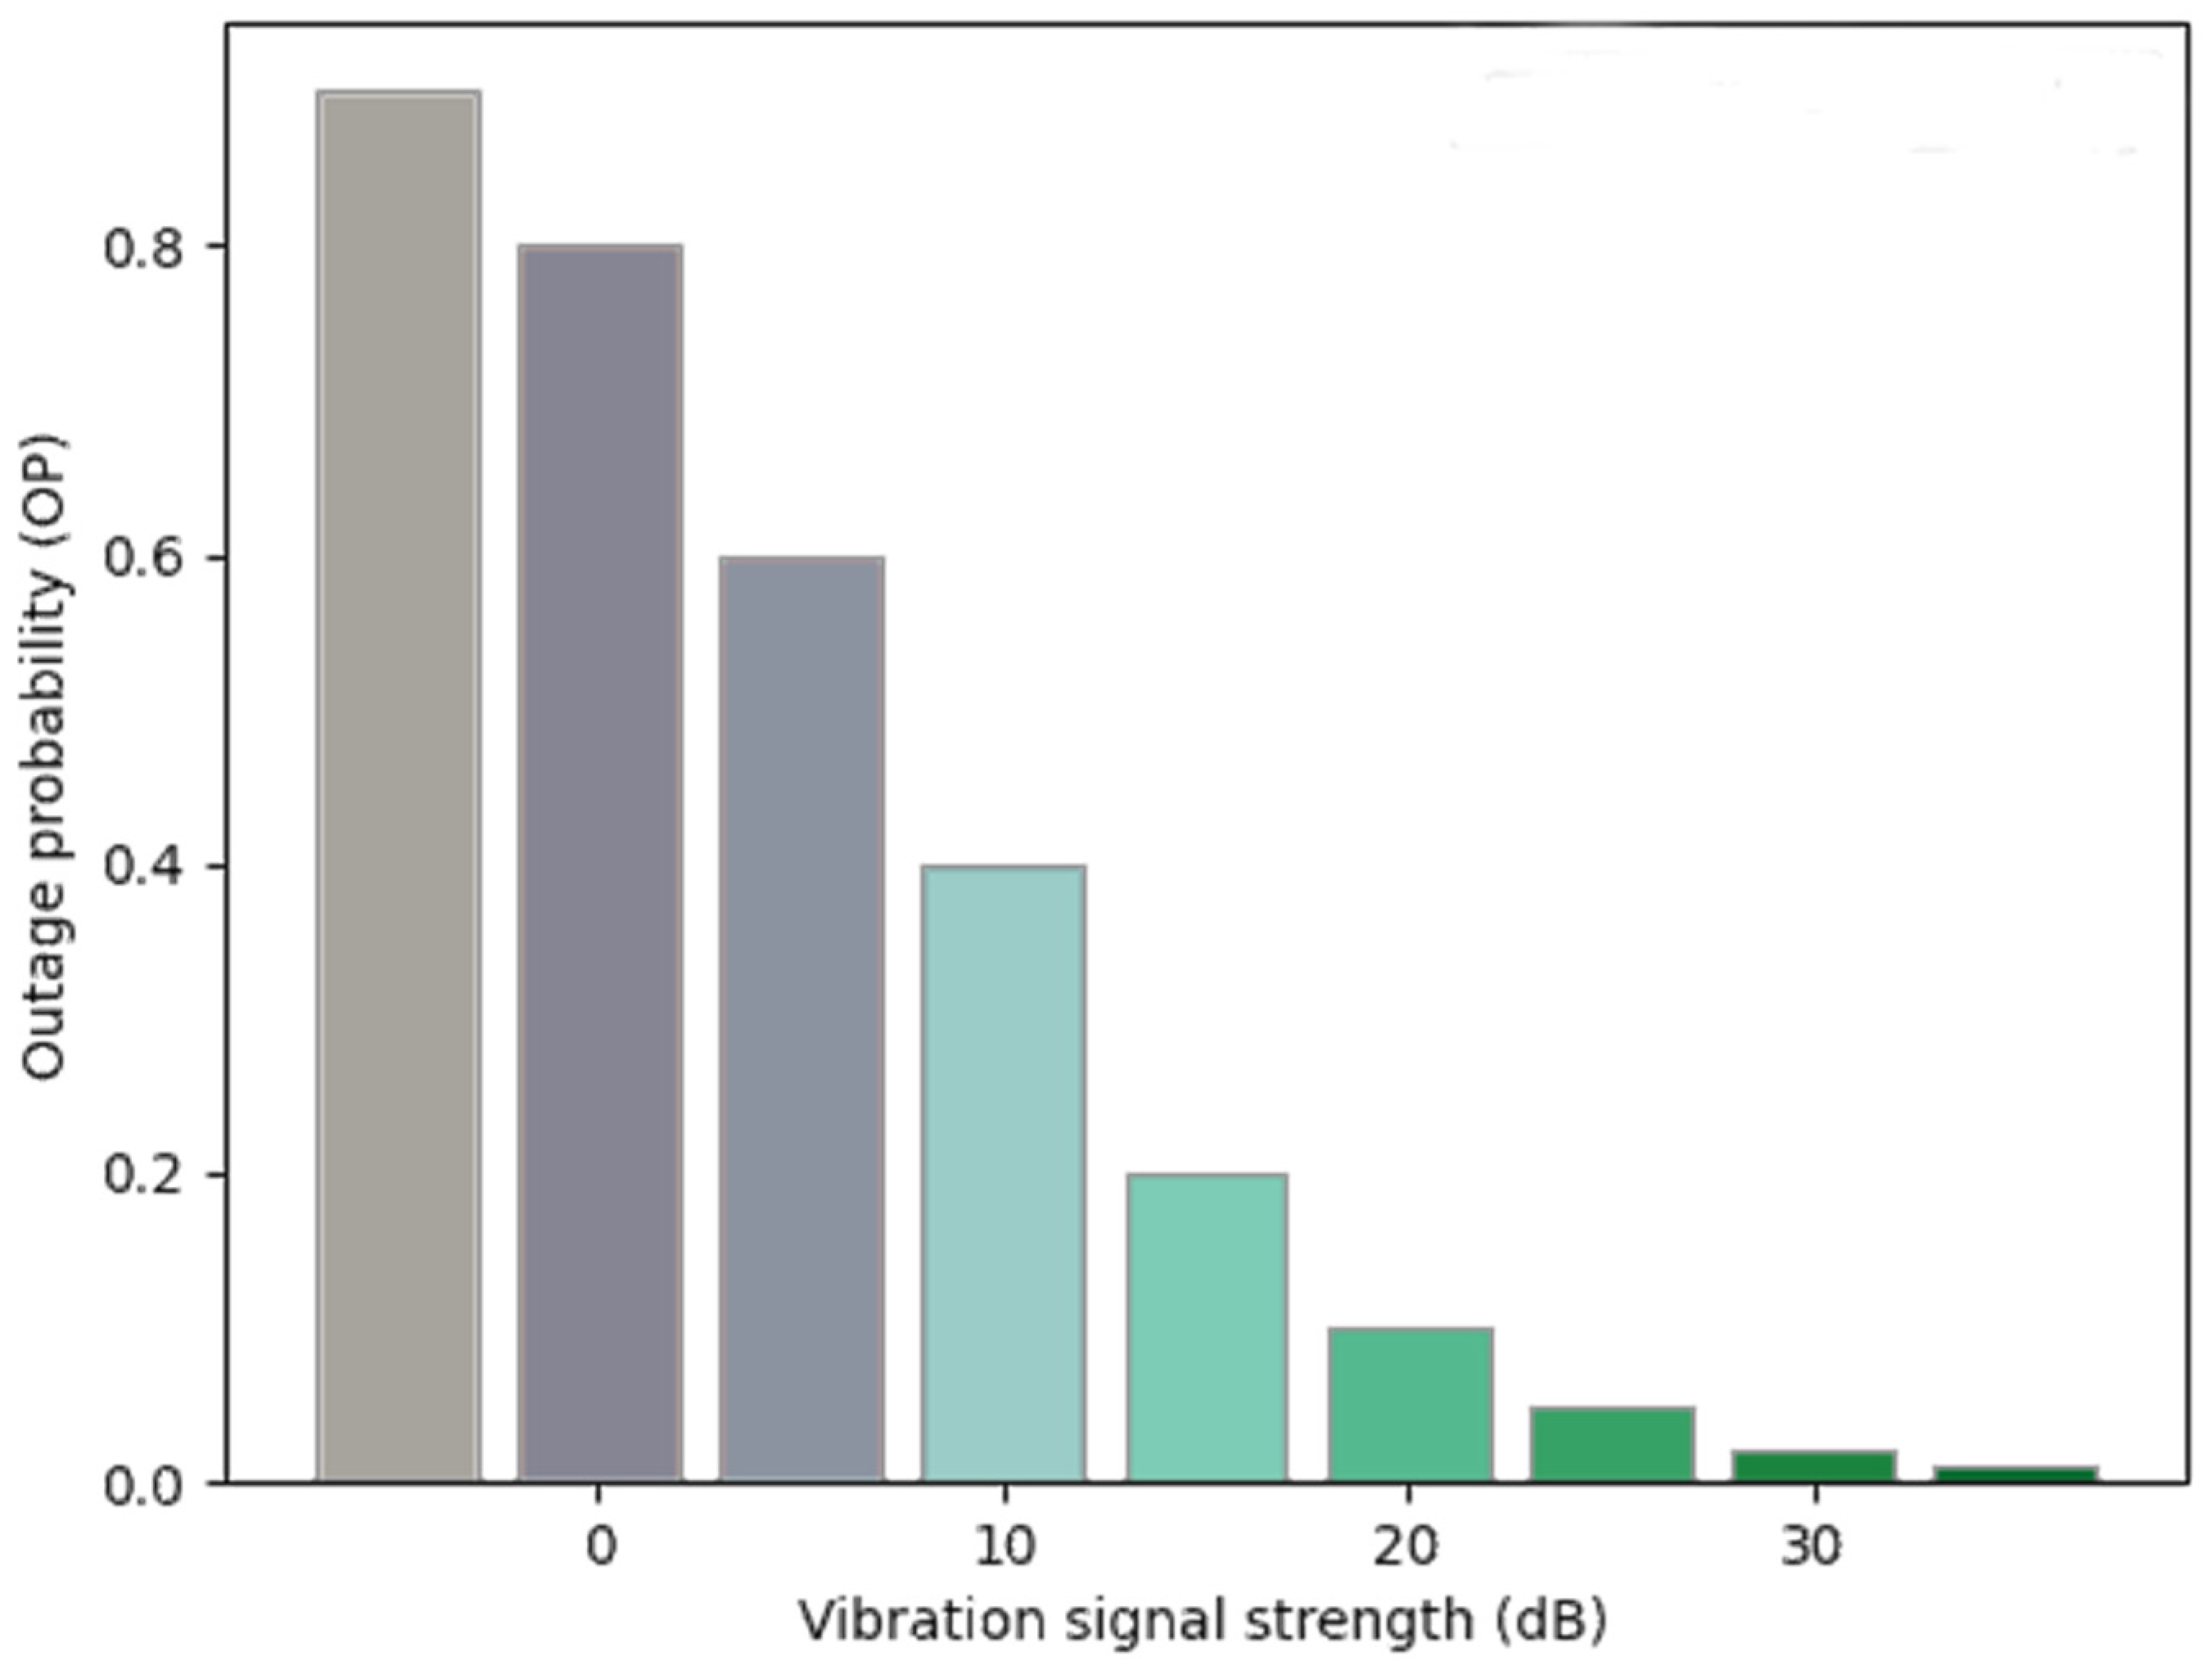
The system’s performance is highly sensitive to both the statistical channel state information and the stability of the transmitted vibration signals. By incorporating the proposed protocol, the stability and reliability of the vibratory piezoelectric detection system are significantly enhanced. This reduces the likelihood of false alarms and missed detections caused by equipment faults or environmental interference, thereby improving the overall monitoring accuracy of the crop seed drying process.
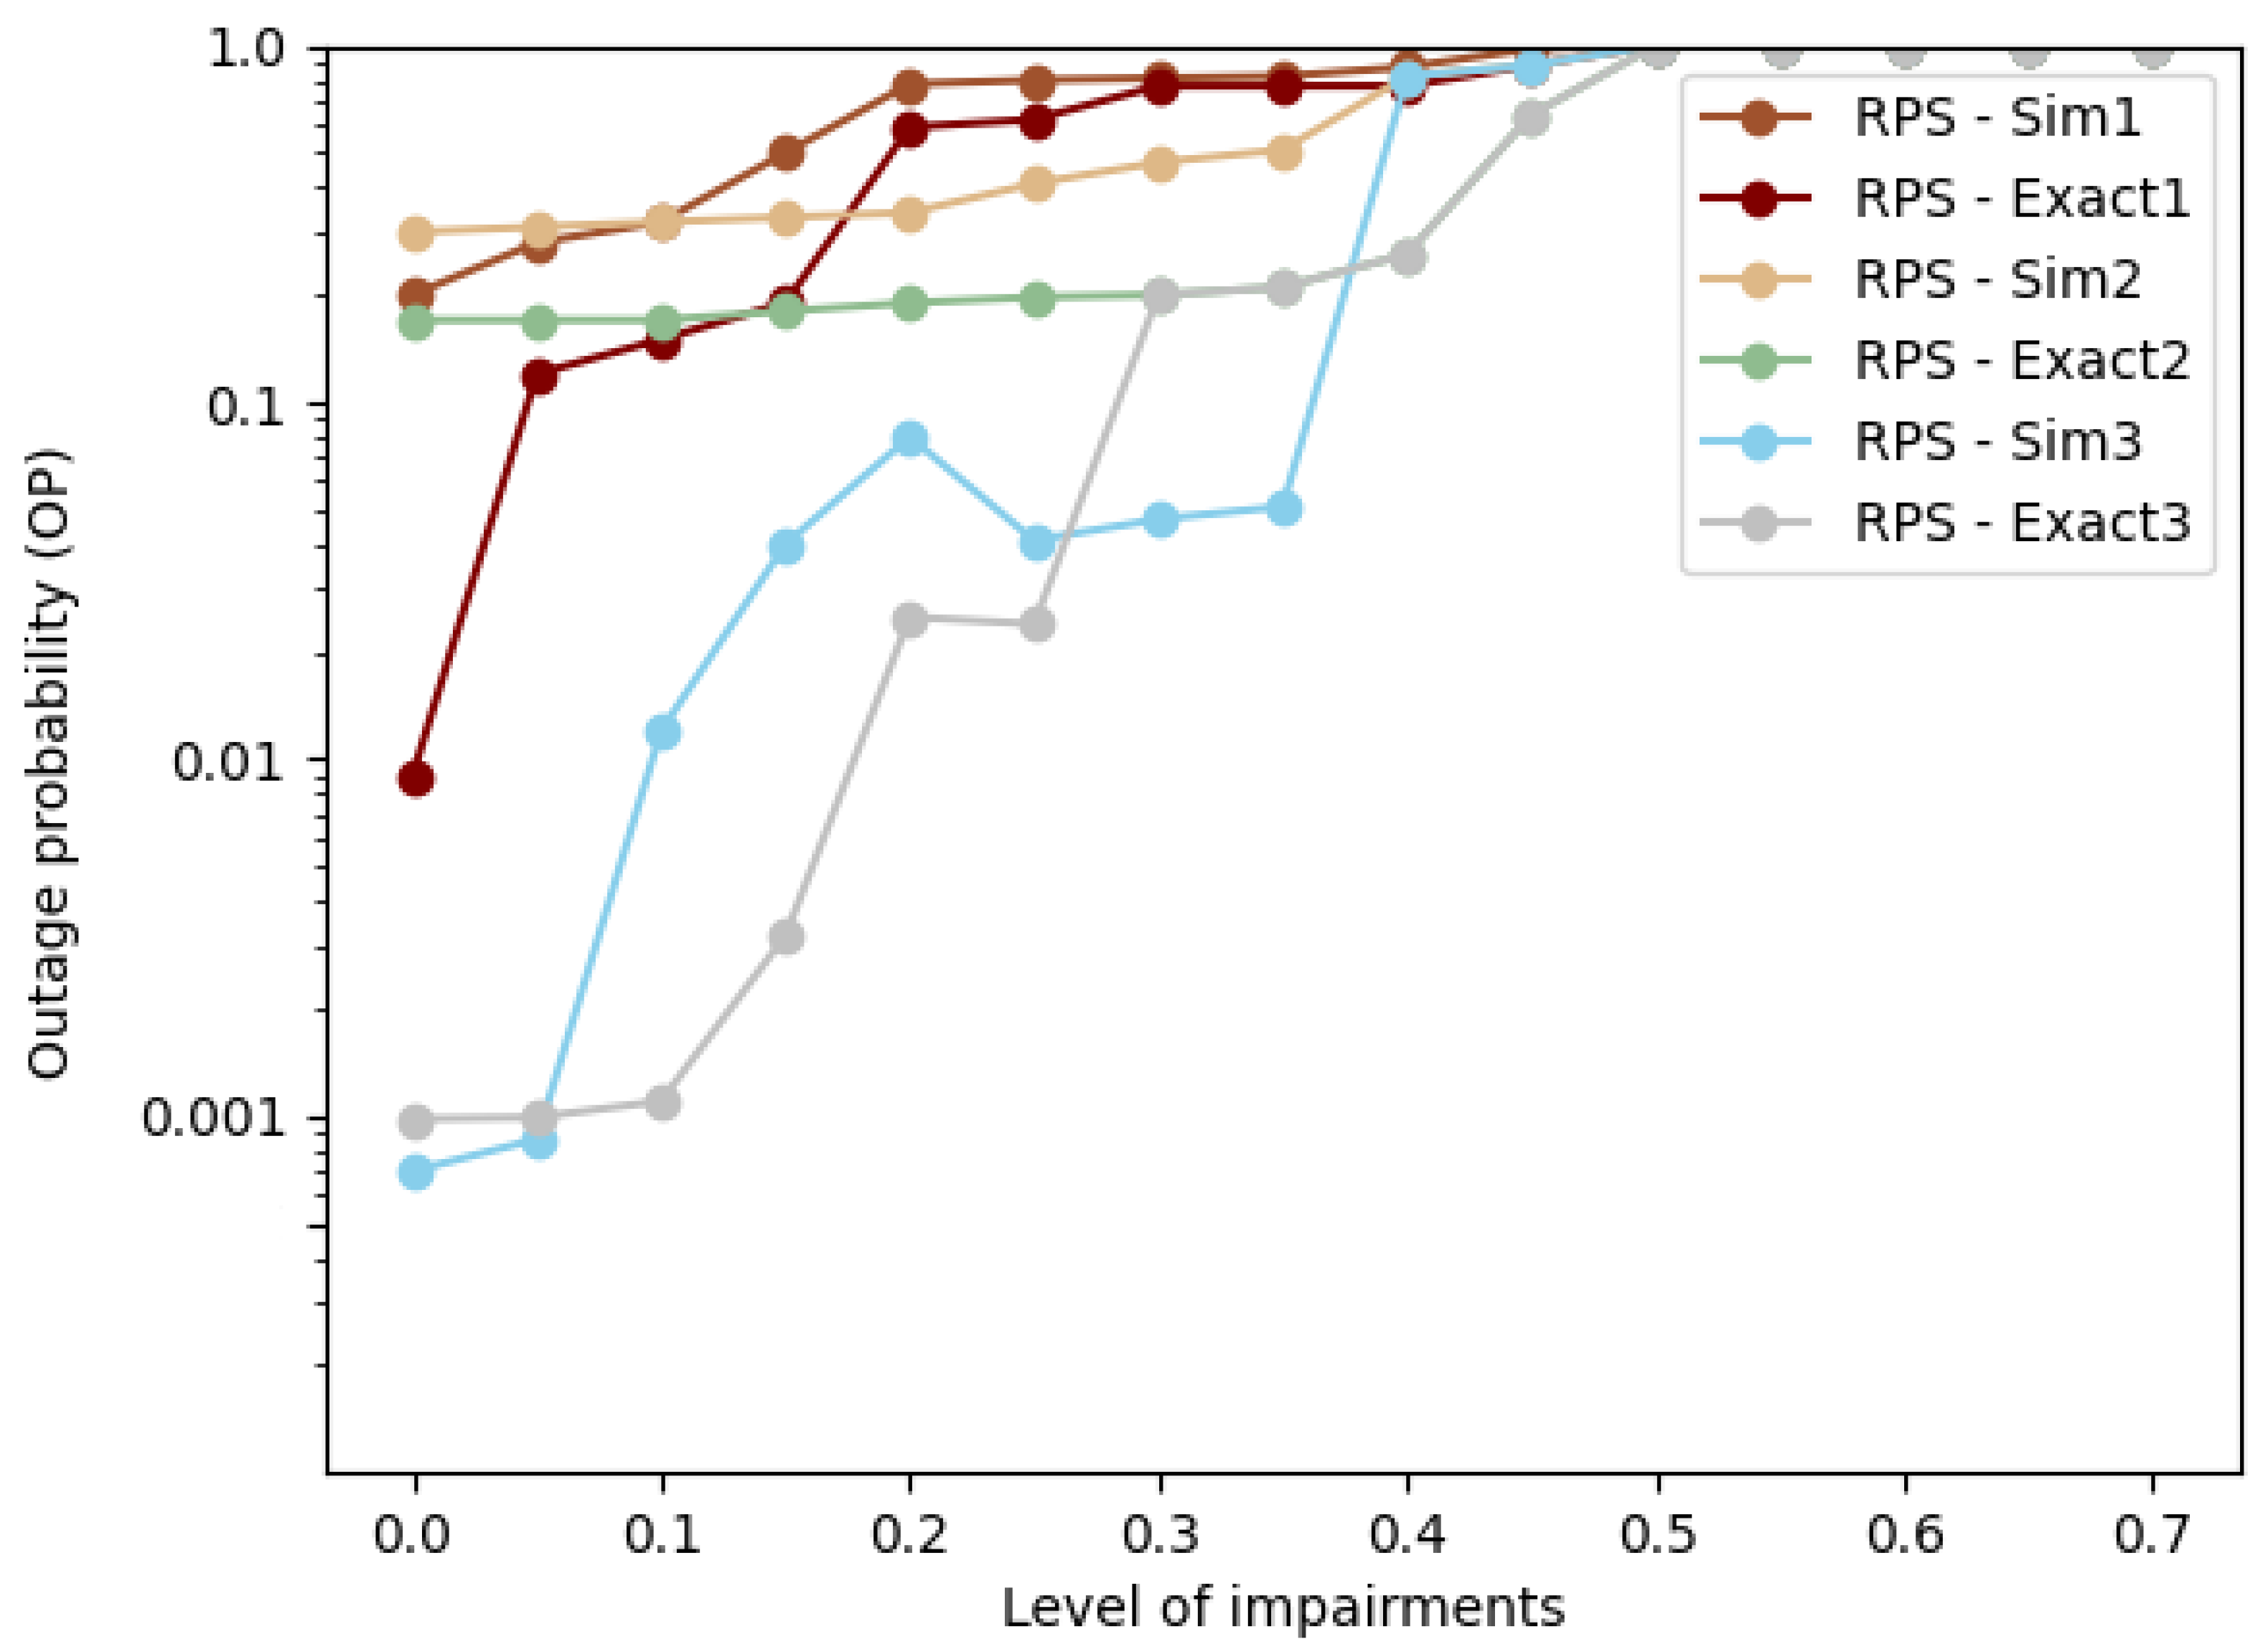
To assess the effectiveness of the shortest routing protocol (SRP), outage probability (OP) metrics and corresponding refined closed-form expressions were derived. By calculating and optimizing the outage probability, the operational performance of the vibratory piezoelectric detection system can be thoroughly evaluated and enhanced. This ensures stable and accurate signal transmission in complex agricultural environments—characterized by factors such as mechanical vibration and elevated temperatures—thus improving the reliability and quality of the drying process monitoring.
The channel capacity of the i-th path in the process from sending to receiving was calculated using the following equation:
The monitoring model constructed using one-dimensional raw time-domain signals exhibited a markedly higher error rate in assessing the drying status of crop seeds. This can be attributed to the fact that the time-domain signal distributions of the seeds during the transition from unheated to heated states are highly similar, resulting in minimal discriminative feature information. Consequently, classification methods relying on voltage peaks, specific frequencies, or full-band spectral features are prone to misclassification. To address this limitation, this study introduces outage probability as a quantitative performance metric. It is defined as the probability that the instantaneous achievable transmission rate falls below the predetermined target rate, which was formally expressed as
.
The outage probability of hop
j in SRP is as follows:
the exact closed-form expression of is used to characterize the normal operation of the system and the signal processing capability to evaluate the accuracy and reliability of the detection unit, as shown in (13) and (14):
formulation:
where
is CDF, and
is PDF; to obtain
, refer to [
20] to solve
,
where
,
where
, and
K is the Neumann function reference [
21], concluding that
Combining it with
= , we obtain the following:
where
where
Substituting (20) into (11), we obtain
as the following:
Solve from (21) as follows
.
4. Result and Discussion
4.1. Experimental Setup
The pallet size diagram and sensor location diagram with labels are provided as shown below.
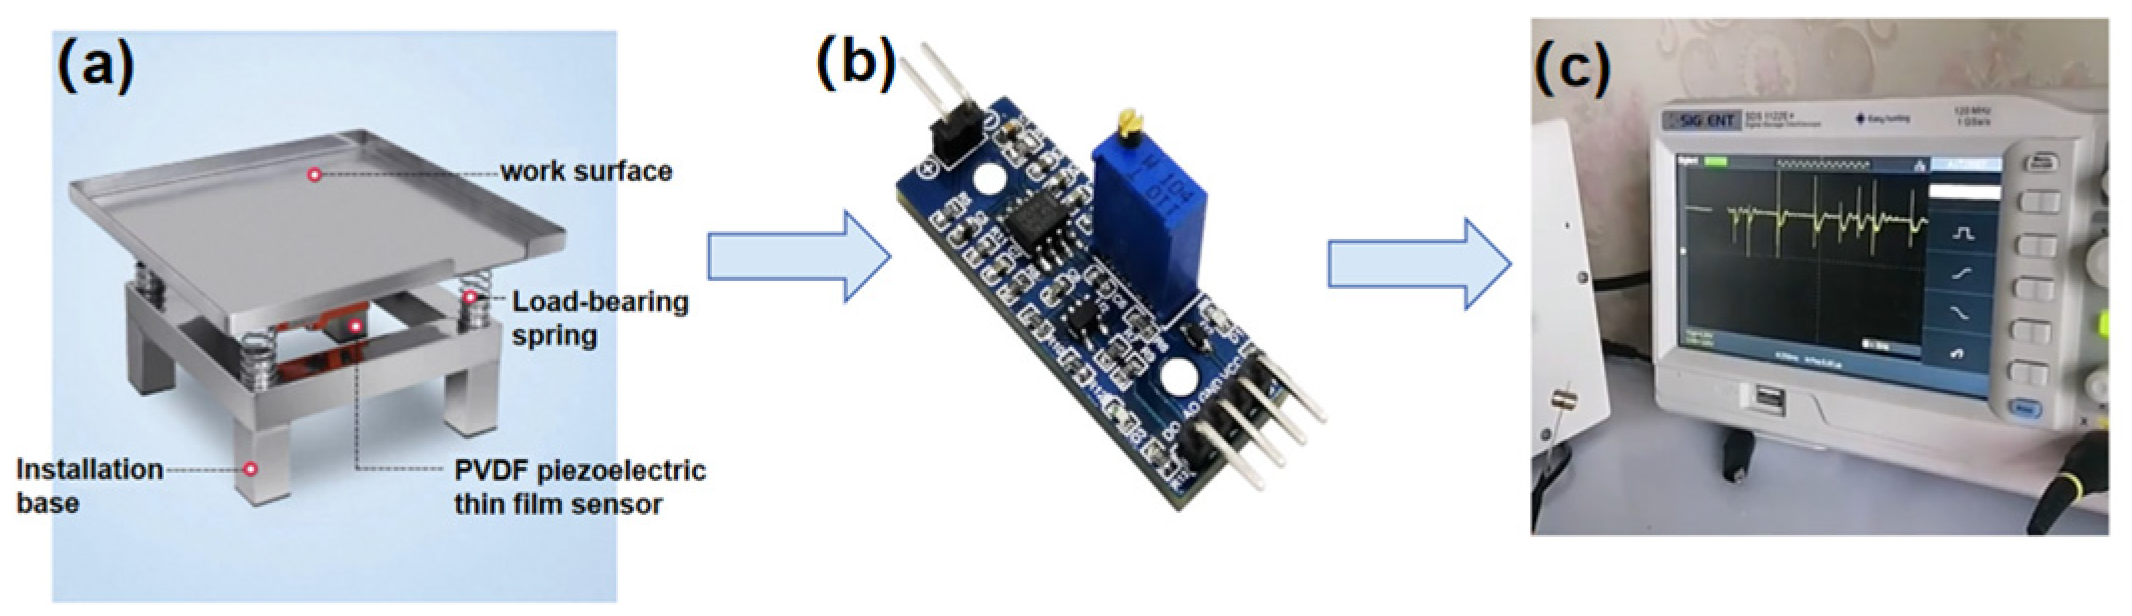
The size of the tray in
Figure 4a is a standard rectangle that is 38 cm long and 35 cm wide. The height of the protection plate is set to 2.5 cm, and the height of the tray is set to 22 cm.
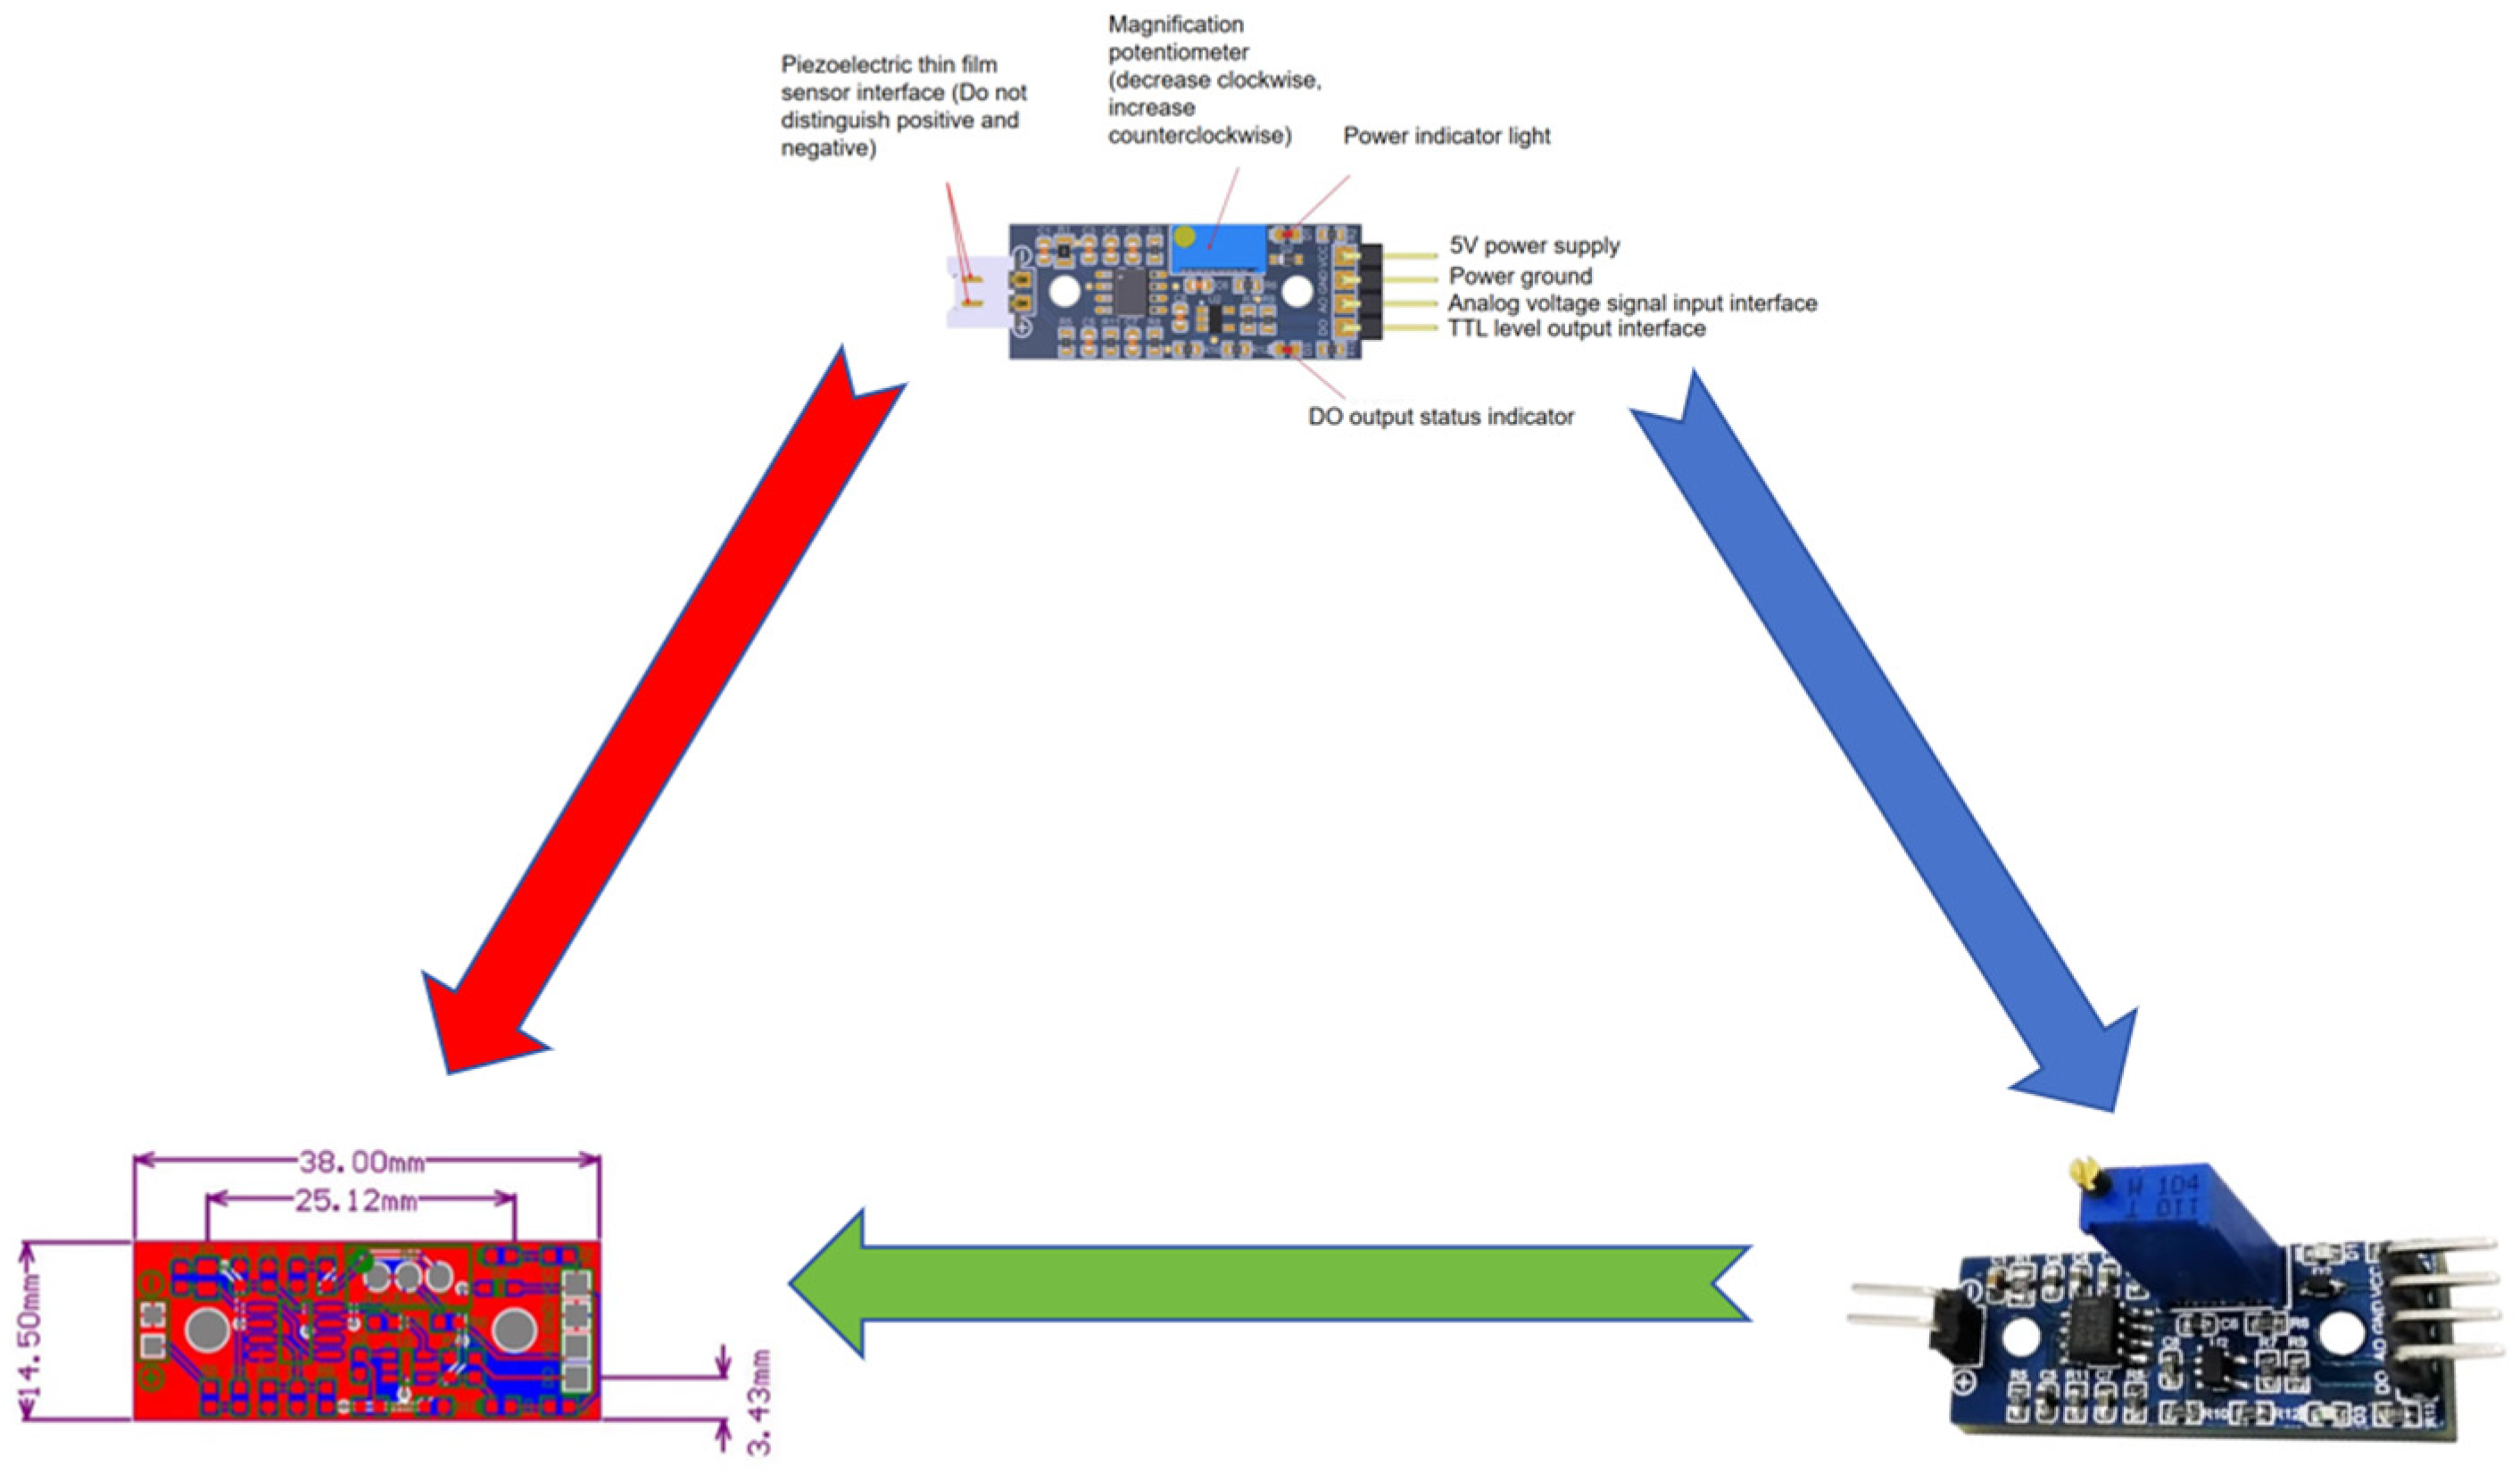
The electronic board for the piezoelectric signal processing is shown in
Figure 4b.
The PVDF piezoelectric film sensor is a flexible sensing element composed of a 28 μm thick piezoelectric film with screen-printed silver paste electrodes. The film is laminated onto a 0.125 mm polyester substrate, and electrical connections are made via two crimped terminals. When an external force is applied perpendicular to the surface—causing the film to deflect from its central axis—significant strain is induced, generating a high-voltage output. When directly deformed, the sensor functions as a flexible switch capable of producing output levels sufficient to trigger MOSFET and CMOS circuits without the need for amplification. Alternatively, when supported at one end and free to vibrate, the element functions as an accelerometer or vibration sensor. Its resonant frequency and sensitivity can be tuned by adjusting the attached mass or altering the cantilever length. Moreover, a multi-axis response can be achieved by offsetting the mass from the central axis.
The sensor adopts a cantilever beam structure, where one end is connected to the signal terminal and the opposite end supports a fixed mass. This configuration provides high sensitivity for detecting low-frequency vibrations. The typical operating temperature range is consistent with standard PVDF sensor specifications. According to the technical manual, when powered with a 5 V supply and in the absence of vibration, the sensor generates an output voltage of approximately 2 V.
As illustrated in
Figure 4c, the vibration block induces oscillatory motion in the tray, and the pressure sensor transduces these dynamic forces into electrical signals, which are visualized via an oscilloscope. Under vibratory conditions, the output voltage fluctuates around the 2 V reference level. The time-domain signals recorded on the oscilloscope capture key vibrational features, including the following:
Amplitude represents the magnitude of vibration, which correlates with the impact force of seeds on the vibrating plate.
Waveform characterizes the dynamic collision behavior between seeds and the vibrating surface, including impact duration and variations in collision intensity.
The applied signal processing and feature extraction algorithms are described below:
Analysis of the waveform characteristics in the time domain reveals that collision signals typically exhibit sharp rise and fall times, which are indicative of sudden mechanical impacts. In contrast, the intrinsic vibration signal of the tray exhibits smoother, more continuous waveform patterns, reflecting its periodic and stable nature.
- (2)
Frequency-domain analysis
The frequency-domain analysis is performed using the Fast Fourier Transform (FFT) algorithm, which converts time-domain signals into their corresponding frequency components. This transformation allows for the identification of dominant frequency characteristics. The inherent vibration of the tray produces a distinct spectral peak near the predefined excitation frequency, whereas collision events introduce additional frequency components, particularly in higher frequency ranges, reflecting the impulsive and non-periodic nature of such interactions.
4.2. The Schematic of Piezoelectric Detection Device
The electronic circuit schematic of the chip-based vibration piezoelectric detection device is illustrated in
Figure 5.
We further describe the relevant chip electronic circuit principle as well as the technical parameters. The pin definitions are provided in
Table 2. The technical parameter list is shown in
Table 3.
In this study, wireless communication technology was integrated into a vibration-assisted crop seed drying tray system to enable the real-time monitoring of seed moisture variation and the overall drying process. The specific implementation strategies are detailed as follows:
Piezoelectric sensors were embedded within the vibrating plate to detect collision signals resulting from interactions between seeds and the tray as well as to monitor the dynamic motion of the seeds. The acquired signals are transmitted wirelessly to a receiver via an embedded communication module, enabling real-time tracking of the drying process.
- 2.
Real-Time Data Transmission:
The wireless communication module facilitates the real-time transfer of time-domain response signals—such as seed collisions and moisture variation—captured by the piezoelectric sensors to the processing unit. This capability allows the system to dynamically adjust operational parameters, thereby optimizing drying performance based on real-time feedback.
The complete workflow of the wireless communication subsystem is as follows. The piezoelectric sensor detects collision events between seeds and the tray surface. These raw signals are conditioned through an amplification and filtering circuit to enhance signal quality. The shortest routing protocol (SRP) is employed to mitigate discontinuous interference in the communication link, thereby improving transmission reliability. A microcontroller unit (STM32) acquires the conditioned analog signal via an analog-to-digital converter (ADC) and performs preliminary signal processing. The processed data are then transmitted to a cloud platform (Ali IoT) via a wireless module (Wi-Fi). On the cloud platform, the data are stored and subsequently analyzed using MATLAB 2020, where advanced signal processing algorithms extract key features such as collision frequency and amplitude. These features are then used to assess the drying status of the crop seeds.
The wireless communication module also facilitates the real-time monitoring of the equipment’s operational status by providing continuous feedback on parameters such as vibration frequency and airflow velocity. This functionality aids in the early detection of mechanical faults and supports timely maintenance, thereby ensuring uninterrupted and stable operation of the drying system.
4.3. Calibrate and Select Vibration Frequency
1. The selection of vibration frequency is tailored to the physical properties of different grain types and is determined through controlled experimental testing. Trials were conducted on various grains—including corn, wheat, and soybean—to assess the effectiveness of grain separation under different vibration frequencies. The motion behavior of grains during vibration was carefully observed to ensure consistent separation from the tray while avoiding excessive vibration that could lead to mechanical damage. The frequency range was adjusted according to grain size and morphology. For instance, larger grains generally required lower frequencies (e.g., 4–5 Hz), whereas smaller grains responded better at higher frequencies (e.g., 6–7 Hz). The optimal vibration frequency range for each grain type was determined empirically based on these observations.
2. Frequency calibration was performed through an experimental stepwise adjustment method. Beginning at a reference frequency of 5.2 Hz, as reported in the literature, the frequency was incrementally increased or decreased in 0.1 Hz intervals. For each frequency setting, the effectiveness of grain separation and the signal quality from the piezoelectric sensor were evaluated. Key experimental metrics—such as seed loss rate and moisture monitoring accuracy—were recorded at each step. The frequency that yielded the best overall performance was identified as the calibrated optimal frequency.
Comparison of multiple experiments: To validate the selected frequency ranges, multiple experiments were conducted to evaluate the drying performance of different seed types under varying vibration frequencies. Statistical analysis methods, such as analysis of variance (ANOVA), were employed to compare experimental outcomes across frequency settings.
3. Calibration was also conducted through detailed analysis of the piezoelectric sensor’s output signal using SEGGER J-Scope V6.11 or comparable signal acquisition software. Key signal characteristics—including amplitude, frequency, and waveform—were analyzed to identify a vibration frequency that could effectively distinguish between crop grains and impurities. The vibration frequency was then optimized to enhance the signal-to-noise ratio (SNR), reduce the signal outage probability (OP), and improve the system’s real-time monitoring and feedback capabilities. During the drying process, the piezoelectric signal was continuously monitored. Based on the real-time signal quality, the vibration frequency was dynamically adjusted to accommodate varying drying conditions and differences in grain physical properties.
4. Frequency scanning experiment: A series of experiments were conducted across a range of vibration frequencies (e.g., 4 Hz to 6 Hz) to evaluate their effect on seed separation efficiency and the occurrence of thermal damage (burning). During the tests, airflow speed was maintained at a constant 3 m/s. Corn was used as the representative crop for analysis. Key performance metrics recorded included burn rate, moisture monitoring accuracy, and signal outage probability. The results are presented in
Table 4.
As shown in the table, a vibration frequency of 5.2 Hz yielded the most favorable outcomes: it achieved the lowest seed burn rate, the highest monitoring accuracy for moisture variation, and the minimal signal outage probability. Accordingly, 5.2 Hz was identified as the optimal vibration frequency following calibration.
4.4. Environmental Influence
In the experimental setup, it is essential for the piezoelectric detection unit to operate under stable airflow conditions to ensure the accurate detection of particle collision signals. To achieve this, fan inverters were employed to regulate airflow speed, thereby enhancing the overall stability and reliability of the system.
Fan Inverter Adjustment: By fine tuning the fan inverter, researchers were able to precisely control the airflow velocity. In this study, the airflow speed was set to 3 m/s—a value commonly adopted to maintain consistent experimental conditions. This setting was optimized to ensure the repeatability and stability of signal acquisition throughout the drying process.
Airflow Direction Control: The direction of airflow was regulated by adjusting the angle of a deflection plate. This allowed real-time optimization of the airflow trajectory, guiding particles to naturally impact the piezoelectric detection unit while minimizing signal interference caused by misaligned airflow.
Maintaining stable and uniform airflow is critical to ensuring consistent particle trajectories. The use of a fan inverter enabled controlled particle motion within the airstream, ensuring that particles followed a predictable path and made reliable contact with the piezoelectric sensor.
However, in practical applications, airflow speed may need to be adapted to account for differences in seed type, particle size, or specific experimental requirements. Fan inverters offer the flexibility to dynamically adjust airflow parameters, enabling rapid adaptation to various experimental conditions and enhancing the robustness of the system.
4.5. Statistical Validation
A Chi-square test was employed in this study to evaluate the statistical significance of differences in burn rate between the control group and the experimental group. The experimental setup utilized a newly designed drying tray (as illustrated in
Figure 4), incorporating a PVDF piezoelectric film sensor composed of a 28 μm piezoelectric film with filamentary silver paste electrodes. The test sample consisted of a uniform batch of corn seeds with a total mass of 10,000 g for both groups.
Hypothesis 0 (H0): There is no statistically significant difference in burn rates between the control group and the experimental group.
Hypothesis 1 (H1): There is a statistically significant difference in burn rates between the control group and the experimental group.
- 2.
Collect data
Multiple experimental trials were conducted. As shown in
Table 5, one representative dataset is presented as an example for statistical analysis.
- 3.
Calculate Chi-square statistics
The calculation formula of Chi-square statistics is
- 4.
Definite degree of freedom (df)
The calculation formula for degrees of freedom is
- 5.
Find critical value
The critical value was determined using the Chi-square distribution table based on the degrees of freedom and the significance level (typically set at 0.05). For a degree of freedom (df) of 1 and α = 0.05, the corresponding critical value is 3.841.
- 6.
Compare Chi-square statistics and critical values.
If is greater than the critical value, reject the null hypothesis.
If it is less than or equal to the critical value, the null hypothesis cannot be rejected.
This paper calculates that = 135.533 is greater than the critical value of 3.841, so the null hypothesis is rejected.
- 7.
Based on the results of the Chi-square test, it can be concluded that there is a statistically significant difference in the burn rate between the control group and the experimental group. This indicates that the newly developed vibrating piezoelectric drying tray significantly reduces the occurrence of grain burning during the drying process.
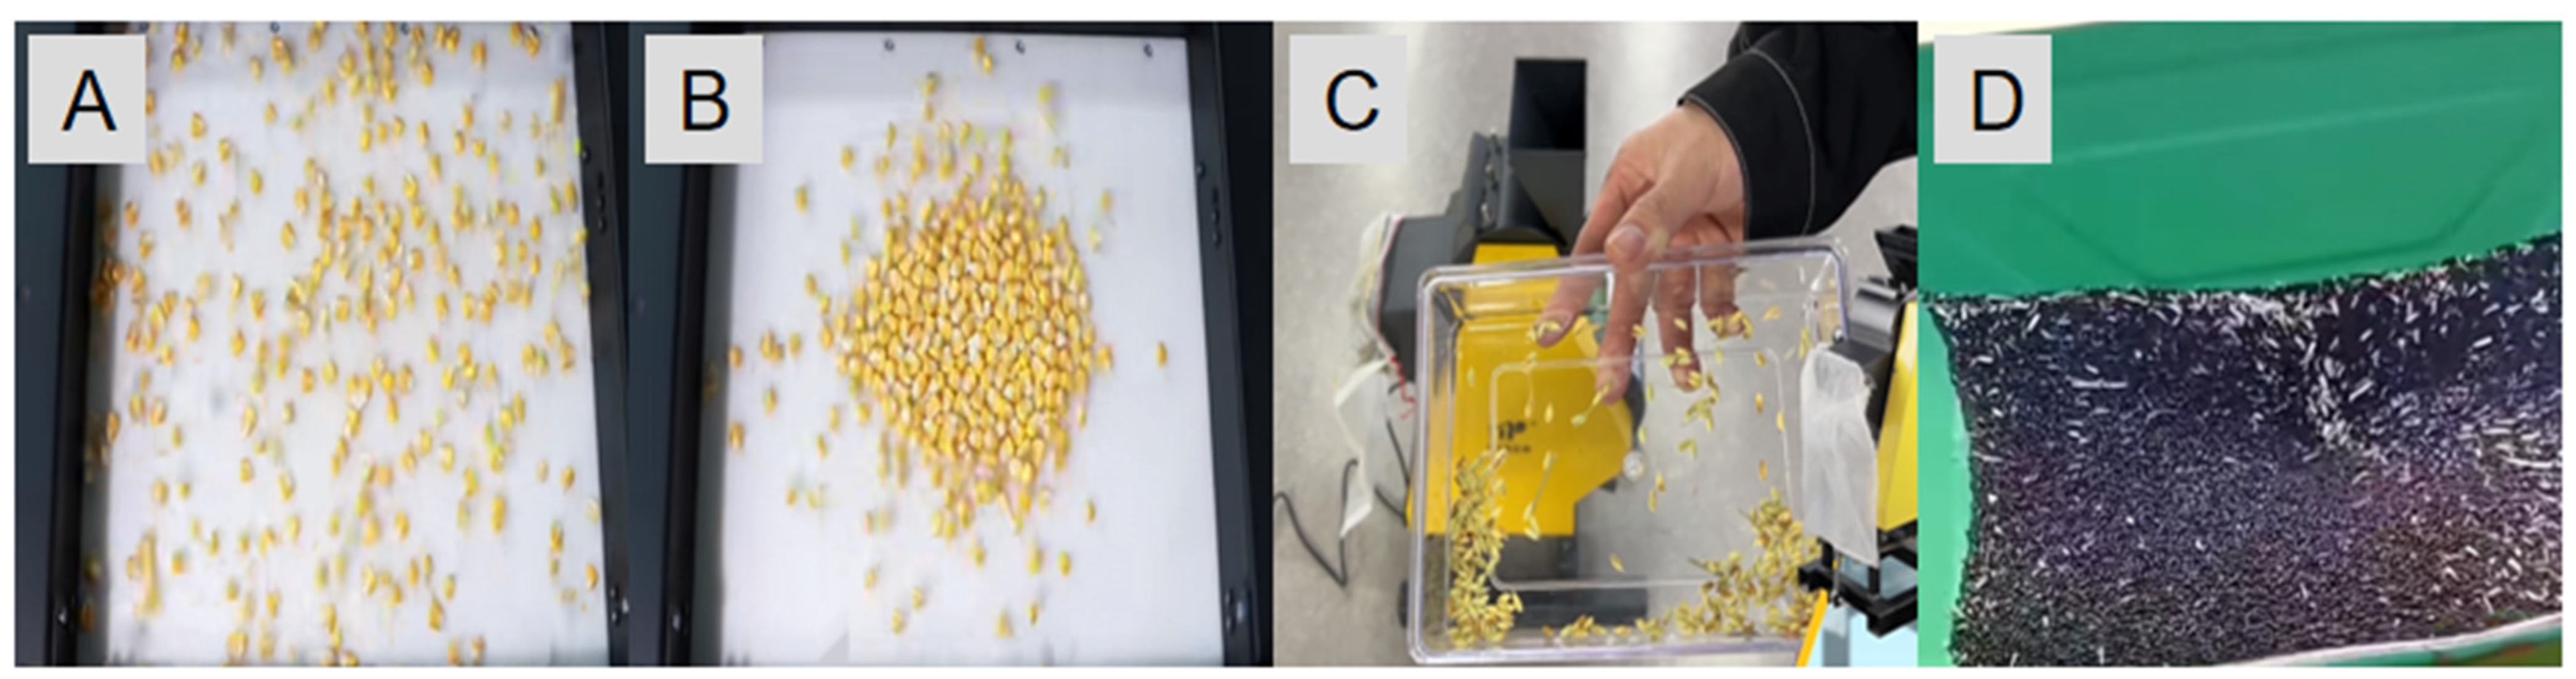
4.6. Results and Analyses of Maize Mixture Trials
The drying temperature was set according to the intended use of the maize: (1) edible corn: 45 °C; (2) industrial corn for starch fermentation: 50 °C; (3) seed corn: 40 °C.
The vibration frequency was fixed at 5.2 Hz. Prior to testing, the piezoelectric detection unit was evaluated ten times for each grain–impurity pair. The output signals recorded by the acquisition system consistently reflected accurate identification results, indicating the system’s robustness against vibrational disturbances. Corn samples were individually weighed and mixed; then, they were uniformly distributed across the designated loading area of the vibrating tray. The feed rates were set at 2, 4, 6, and 8 kg/s. After the drying process, separated impurities or lost particles were collected and weighed. The corresponding data were transmitted in real time to a digital display unit via the integrated weight sensor, enabling the dynamic monitoring of mass variation throughout the drying process.
Table 6 illustrates the direct impact of feed rate on grain loss. As the feed rate increases, both the quantity and quality of lost grains rise significantly. When the system operates under high load conditions, the drying apparatus becomes processing-constrained, leading to greater grain damage and loss during the vibration-assisted drying process. Moreover, the quality of lost material is not uniform. Higher feed rates result in increased seed flow density, which intensifies inter-particle collisions and friction. This, in turn, reduces the effectiveness of the piezoelectric detection unit for seed–impurity separation, impairs detection accuracy, and contributes to a higher absolute error in loss rate measurements. Under these conditions, the detection unit is unable to reliably quantify the true loss rate of the seed material. Nevertheless, seed and impurity classification based on one-dimensional time–frequency signal features demonstrates strong generalizability and accuracy, providing a robust foundation for non-contact, real-time classification even under varying operating conditions.
The weighing process of the maize mixture is shown in
Figure 6, then evenly place the 7 kg, 7.5 kg, 8 kg, and 8.5 kg corn mixture into the designated areas of the oscillating grain tray.
The composition, moisture loss measurements, and drying times were determined by field trials (see
Table 7).
According to the
Table 7, we can conclude the following:
The novel vibratory heating tray proposed in this study demonstrated strong experimental performance. After heating, the moisture loss rate of maize seeds consistently stabilized between 0.77% and 0.79%, indicating both effectiveness and repeatability.
4.7. Control Experiment
To validate the effectiveness of the newly designed drying tray, a comparative experiment was conducted using conventional drying methods as a control. The comparison focused on the seed loss rate during drying. The results are presented in
Table 8.
4.8. Sampling Rate Selection
The signal acquired by the piezoelectric sensor includes the time-domain response generated by collisions between the grains and the drying tray. These signals inherently contain high-frequency noise components resulting from transient impacts. Specifically, the collision events may induce sharp, short-duration high-frequency signals due to the sudden transfer of mechanical energy.
Additionally, the vibratory system may generate harmonic components—frequencies that are integer multiples of the fundamental frequency. In this setup, the highest harmonic frequency can reach approximately 5 to 10 times the fundamental frequency, corresponding to a range of 26–52 Hz.
According to Shannon’s sampling theorem, the sampling rate must be at least twice the maximum frequency component present in the signal to prevent aliasing and ensure accurate signal reconstruction.
is the highest frequency of the signal.
If only the fundamental frequency signal (5.2 Hz) is considered, the sampling rate should be at least
Considering the high-frequency noise generated by collisions, assuming that the highest frequency may reach 5–10 times the fundamental frequency (i.e., 26–52 Hz), the sampling rate should be at least
To ensure signal integrity and avoid aliasing, a higher sampling rate is recommended. However, excessively high sampling frequencies may introduce data processing delays, thereby compromising the system’s real-time performance. To balance accuracy and responsiveness, the sampling frequency in this study was set between 104 Hz and 200 Hz.
4.9. Vibration Piezoelectric Signal Analysis
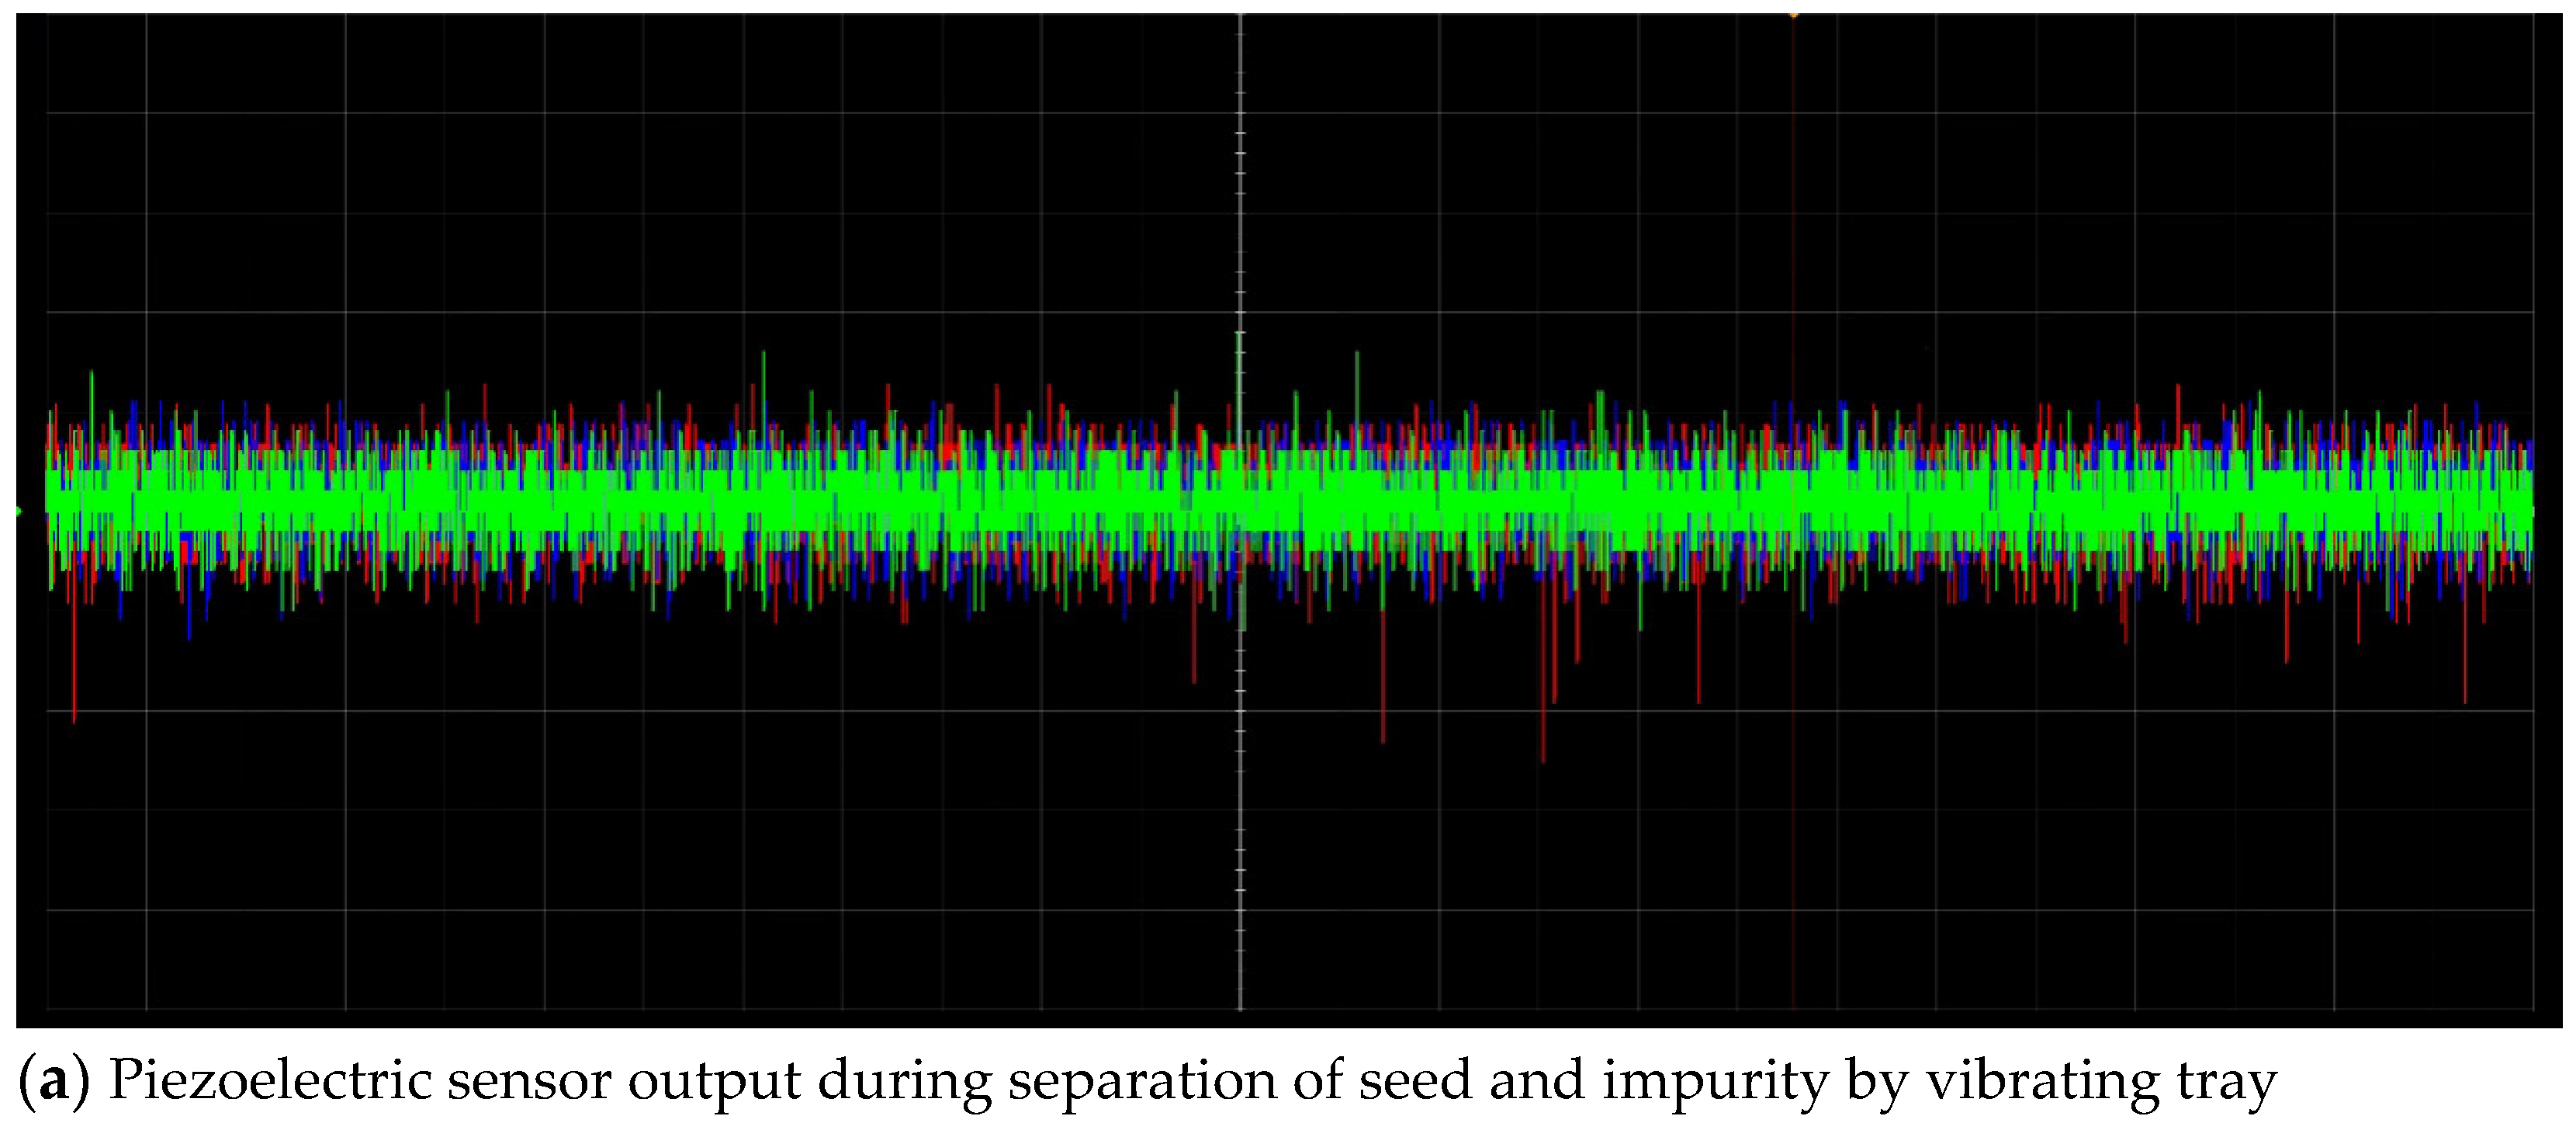
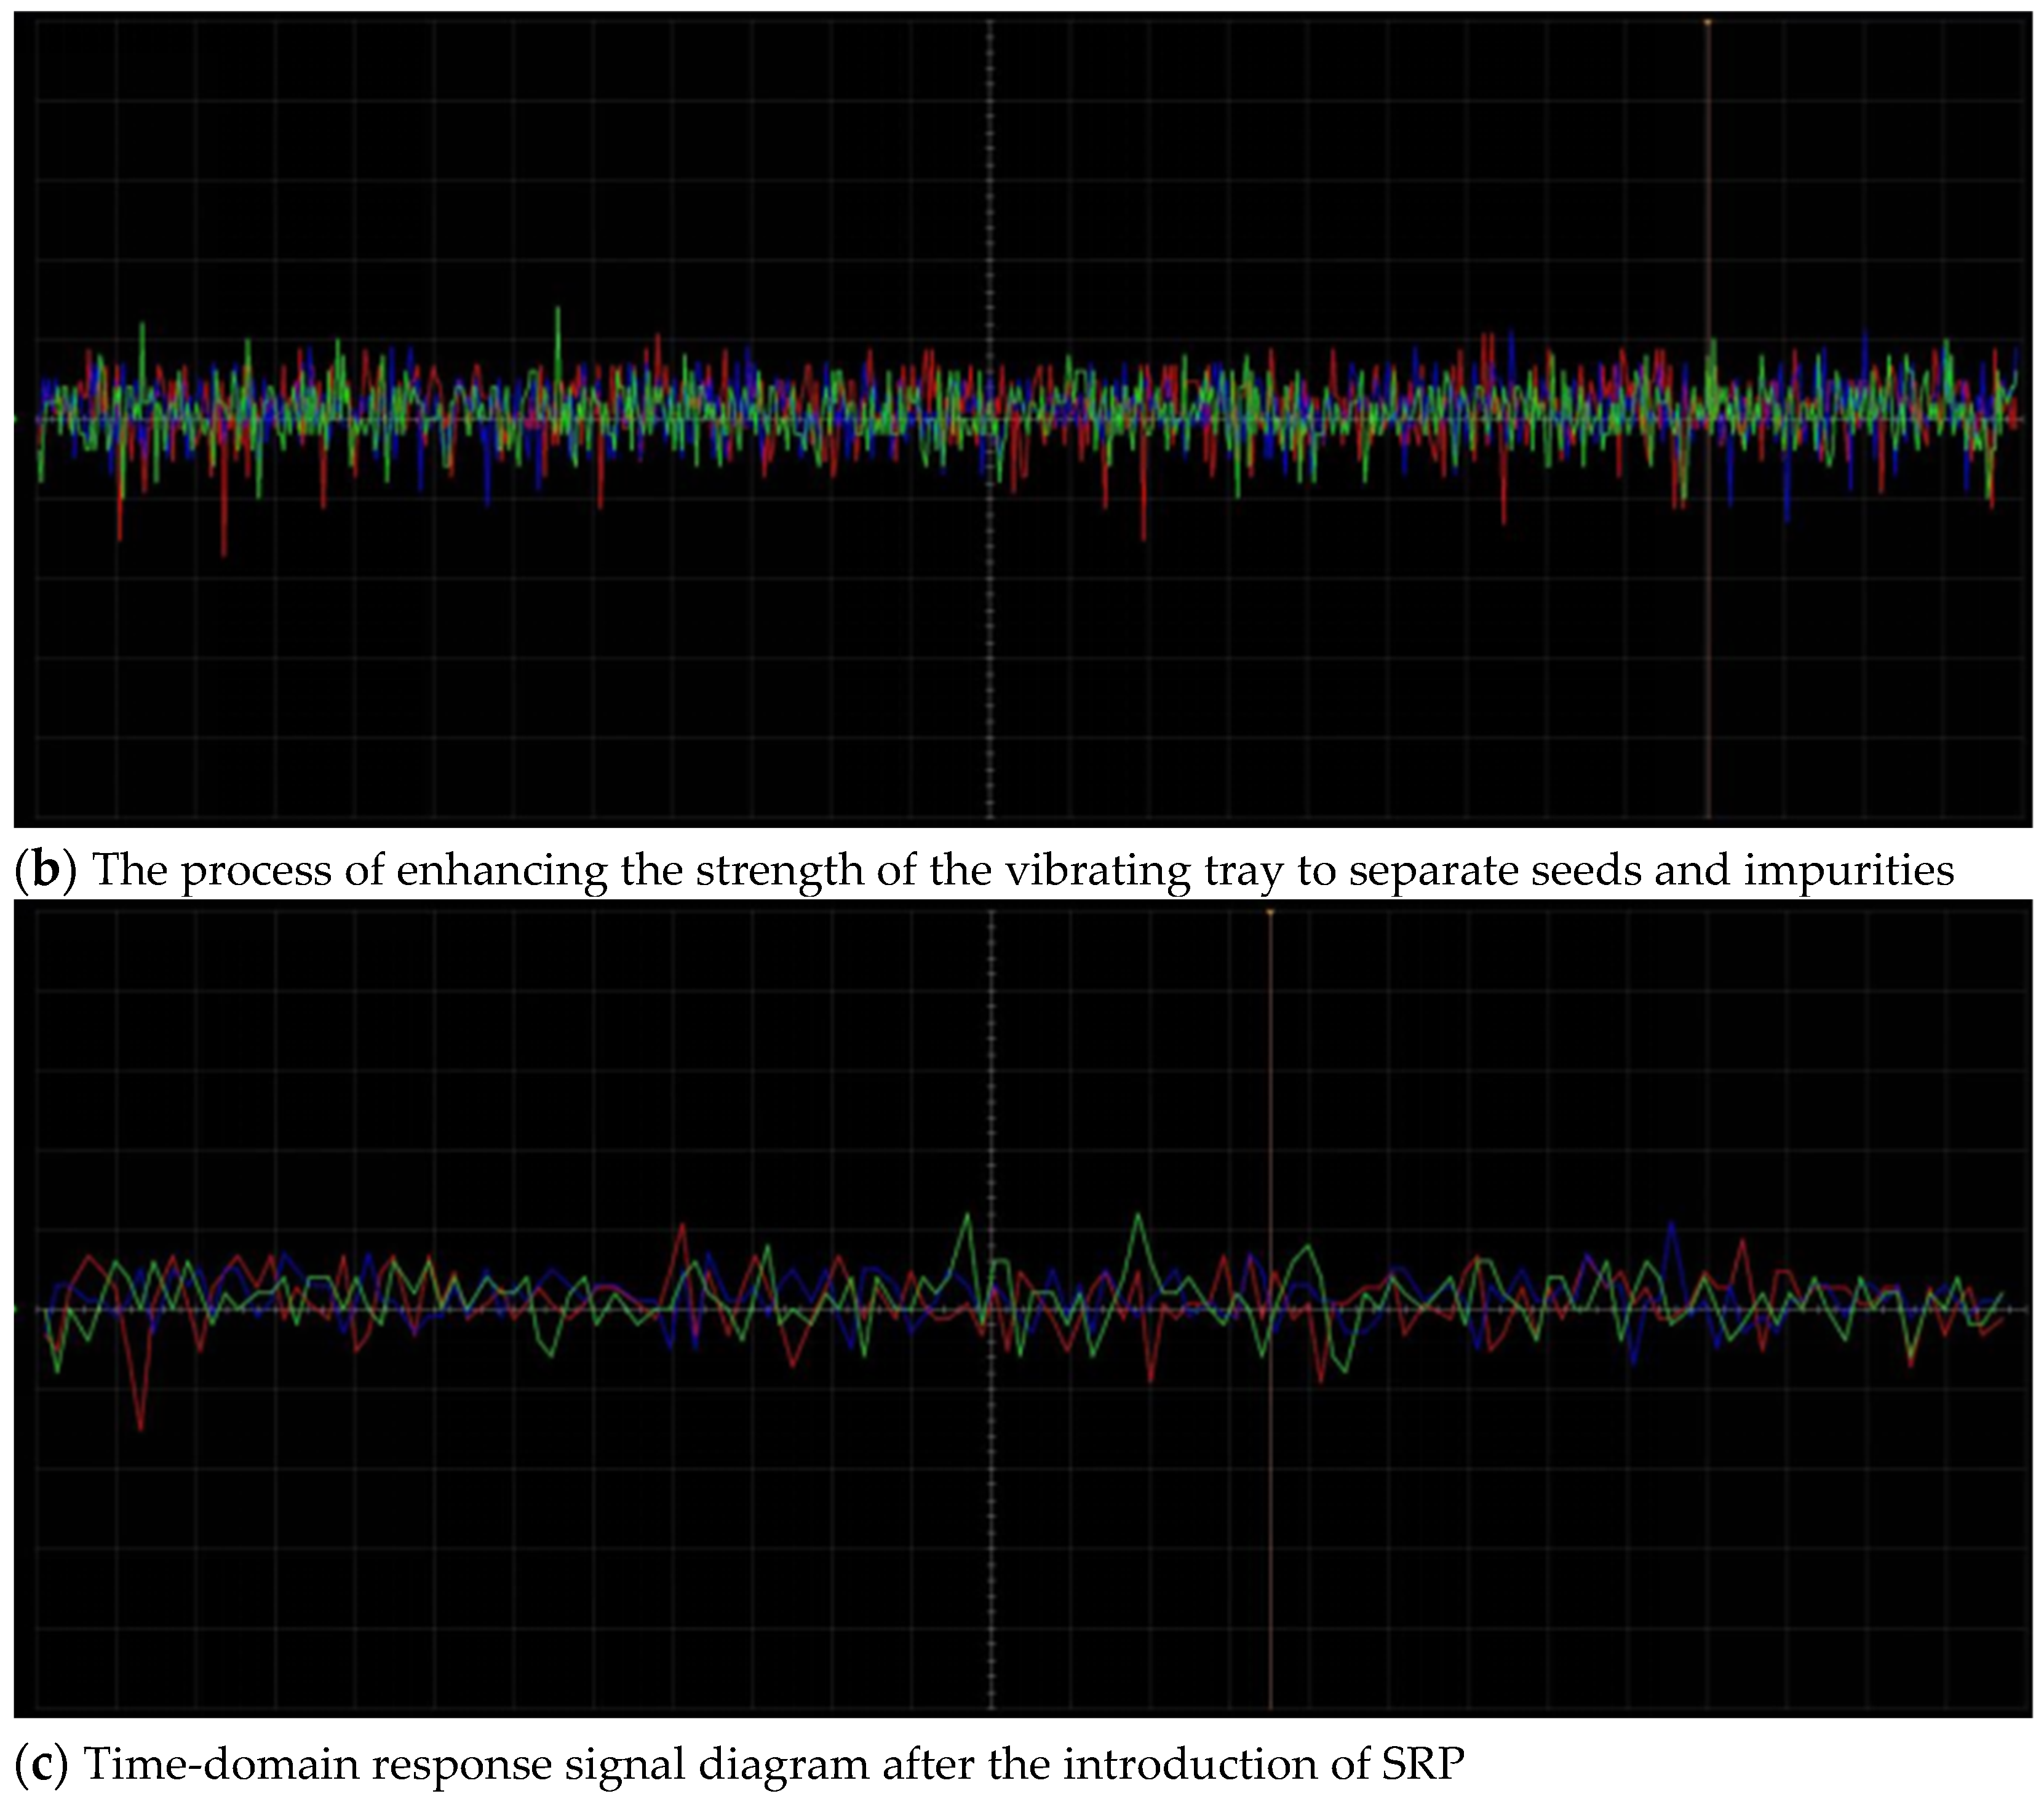
Waveform acquisition was conducted using SEGGER J-Scope software to monitor the output signals of the piezoelectric sensor during seed–impurity separation facilitated by the vibrating tray. The horizontal axis represents time in milliseconds (ms), while the vertical axis indicates voltage amplitude. The waveform sampling interval was set at 5 ms/div, and the target frame rate was maintained at 30 frames per second (FPS) for real-time visualization.
Figure 7a–c display three waveform traces in red, blue, and green, corresponding to piezoelectric signals captured at different time intervals. These waveforms represent signal variations associated with the classification of seeds and impurities. (1) Waveform Features: The amplitude, frequency, and morphology of the waveforms reflect the physical interactions between the seed material and the tray during vibration. Differences in seed morphology—such as shape, structure, texture, and hardness—result in variations in contact mechanics, feedback force, and acoustic response, which manifest as differences in energy amplitude and waveform structure. (2) Buffer Utilization: The lower display panel shows the real-time status of the data buffer, including total capacity and the number of captured samples. This provides insight into the system’s data-handling efficiency. (3) Vibration Intensity and Signal Characteristics: The amplitude of the waveform correlates with the intensity of tray vibration. Higher amplitudes indicate stronger vibration, which facilitates the improved separation of seeds and impurities. The shape of the waveform reflects the physical attributes of the contacting material, allowing differentiation between seed and impurity profiles. (4) Material-Specific Responses: Experimental results indicate that different materials produce distinct waveform patterns. Moreover, the specific vibration frequency significantly influences separation efficiency, highlighting the importance of frequency optimization for precise seed–impurity classification.
6. Conclusions
In this study, a vibration-assisted piezoelectric detection-based crop seed drying tray was designed and optimized to address the issue of seed scalding commonly observed in conventional drying methods. The proposed system mitigates overheating through the controlled, periodic vibration of seeds and integrates the automatic weighing and real-time monitoring of seed moisture content to enhance drying efficiency and accuracy.
The primary findings and novel contributions of this work are summarized as follows:
A novel drying tray configuration was developed, featuring a vibration module integrated beneath the seed carrier by fixing a seed support plate within the tray cavity. This configuration enables intermittent separation between seeds and the tray surface, effectively preventing scalding and promoting uniform drying. Through experimental calibration, the optimal vibration frequency was identified as 5.2 Hz, which reduced the seed scald rate to 1.5% and achieved 97.0% accuracy in moisture change monitoring.
The system incorporates piezoelectric sensors and wireless transmission modules to enable the real-time monitoring of seed moisture and automated weight measurement during drying. Mechanical collisions between seeds and impurities generate stress signals that are converted into electrical charge outputs by the piezoelectric elements. These weak signals are amplified into measurable voltage waveforms via a charge amplifier, serving as a robust foundation for training classification models to distinguish seeds from impurities.
To address the discontinuities in signal communication caused by vibration and potential equipment failure, a shortest routing protocol (SRP) was implemented. By analyzing time-domain response signals, the system outage probability (OP) was derived alongside a refined closed-form solution under Rayleigh fading channel conditions. This formulation quantifies the likelihood of misdetection or missed detection events arising from hardware failure or abnormal operation, providing a theoretical basis for improving system robustness and reliability.
The proposed method is not limited to a specific crop type; it is applicable to the classification and moisture loss detection of various crop seeds. This demonstrates the method’s broad adaptability and potential for widespread implementation in agricultural drying processes.
The cost-effectiveness of the system was achieved by employing readily available components, such as piezoelectric sensors and standard wireless communication modules. The modular architecture facilitates the scalability and ease of integration, making it suitable for both smallholder farms and large-scale agricultural operations. Compared to conventional drying methods, the system reduced seed loss by 0.4%, highlighting its economic viability and practical value.
This study addresses critical limitations of traditional crop seed drying methods, including seed scald and inefficient moisture monitoring. By integrating piezoelectric sensing, vibration-assisted separation, and wireless communication technologies, the proposed system offers an adaptable, real-time, and cost-effective solution for modern agricultural applications. Future research will focus on enhancing system performance through the application of information fusion techniques, enabling the acquisition and analysis of multidimensional data. This is expected to further improve the accuracy of seed classification and moisture detection, thereby advancing the intelligence and automation of post-harvest processing systems.


 ,
, 
