Article

Damage Recovery Method for Air–Sea Cross-Domain Communication Network Based on Improved Dijkstra and Load Balancing

1
National Key Laboratory of Underwater Acoustic Technology, Harbin Engineering University, Harbin 150001, China
2
Key Laboratory of Marine Information Acquisition and Security (Harbin Engineering University), Ministry of Industry and Information Technology, Harbin 150001, China
3
College of Underwater Acoustic Engineering, Harbin Engineering University, Harbin 150001, China
4
Sanya Nanhai Innovation and Development Base of Harbin Engineering University, Sanya 572024, China
*
Author to whom correspondence should be addressed.
Appl. Sci. 2025, 15(7), 3956; https://doi.org/10.3390/app15073956
Submission received: 19 February 2025 / Revised: 22 March 2025 / Accepted: 23 March 2025 / Published: 3 April 2025
(This article belongs to the Special Issue Digital Twin and IoT)

Abstract

:
With the complexity of the future battlefield and the increasing demand for multi-domain operations, the importance of air–sea cross-domain communication networks is rising. Communication technology connecting air and sea faces many challenges: for example, multi-node failure may lead to network partition, communication interruption and even task failure. Therefore, research on the multi-node failure recovery method of air–sea cross-domain communication networks has become an urgent need to ensure their stability and mission continuity. This paper proposes a link selection strategy based on an improved Dijkstra algorithm and load balancing on the basis of link quality prediction. The simulation results show that the algorithm can effectively achieve network recovery.

1. Introduction

The application of air–sea cross-domain communication networks has gained increasing prominence across military, civilian, and commercial domains. However, these networks face significant challenges due to their complex propagation environments, which involve both aerial and underwater media [1,2]. Their vulnerability to various factors, including natural disasters and human-induced attacks, often leads to node failures, substantially compromising communication continuity and reliability. Consequently, investigating network damage recovery methods is crucial for enhancing the performance and reliability of air–sea cross-domain communication networks. Implementing adaptive network topology recovery following node failures is essential for maintaining the stable operation of these networks [3].
The network topology of air–sea cross-domain communication networks exhibits distinct characteristics compared to traditional networks, featuring multi-layered structures, long-distance connectivity, and time-varying properties. These unique attributes significantly increase the complexity of network recovery processes. Traditional fault tolerance and recovery approaches, which primarily address single or limited node failures through shortest-path algorithms [4,5,6,7,8], prove inadequate for handling multi-node failure scenarios. Such limitations often lead to network partitioning into disconnected subsets, substantially compromising communication reliability and data transmission efficiency [9]. Recent advancements have introduced various network topology recovery strategies, including graph-theory-based shortest-path algorithms, swarm intelligence optimization techniques, and load-balancing mechanisms. While these methods aim to enhance network robustness through optimized structural configurations and path selection, they frequently demonstrate limited flexibility and efficiency when confronted with large-scale node failures or significant topology alterations [10,11,12].
This paper presents a novel approach for damage recovery in air–sea cross-domain communication networks under multi-node failure scenarios. Our proposed method integrates an improved Dijkstra algorithm with load-balancing mechanisms, incorporating link quality prediction and minimum communication cost principles to optimize both path selection and load distribution. This comprehensive approach not only restores network connectivity but also minimizes communication overhead. The methodology comprises two key phases. In the prediction phase, we use the whale optimization algorithm to optimize the gray prediction model, overcoming the poor adaptability of the original model when processing dynamically changing data. During the link selection phase, we design a path selection strategy that combines the improved Dijkstra algorithm and load balancing to avoid the overload of certain links, ensuring a more balanced load distribution across the network and enhancing network stability and recovery efficiency.
Through comprehensive simulation analysis, we validate the effectiveness of the proposed algorithm, particularly by comparing its performance with traditional recovery strategies in two failure scenarios: random node failures and deliberate attacks. The results further demonstrate the superior performance of our algorithm in network recovery, particularly in scenarios involving large-scale node failures.
The main contributions of this paper are summarized as follows:
  • We propose a multi-node failure recovery method that integrates link quality prediction with minimum communication cost, leveraging an improved Dijkstra algorithm and load-balancing strategy to achieve more efficient network recovery.
  • Considering the characteristics of air–sea cross-domain communication networks, we develop an objective function that balances load distribution and communication cost and solve it using the whale optimization algorithm to optimize path selection and load allocation during the recovery process.
  • Through simulation analysis, we validate the effectiveness of the proposed algorithm, particularly by comparing its performance with traditional recovery strategies in two scenarios: random node failures and deliberate attacks. The results further demonstrate the superior performance of our algorithm in network recovery.
  • This study provides a novel approach and solution for damage recovery in air–sea cross-domain communication networks, significantly contributing to the enhancement of network reliability and stability.

2. Related Work

Building upon existing research in the topology recovery of underwater sensor networks and drone cluster networks, the air–sea cross-domain communication network is regarded as an extension of underwater networks to water-based networks. For multi-node failure network damage, the network generally becomes multiple disconnected subsets; topology reconstruction and swarm intelligence are often used to restore the network.

2.1. Topology Reconstruction

Network topology reconstruction refers to improving the characteristics of a network by redesigning its structure, adjusting the connections between nodes, or adding new nodes. When certain nodes in the network fail, they are replaced to restore the normal operation of the network. Its essence lies in finding the shortest path between disconnected subsets in the network. Zhang [13] proposed a connectivity determination algorithm for minimum link design in multilateral networks using algebraic graph theory, which has low complexity, and a communication topology reconstruction method was proposed for multiple multi-agent systems with different functions after networking. Qin [14] proposed a partition dual connectivity recovery algorithm to solve the problem of poor fault tolerance in partition connectivity. The core idea is to construct backbone polygons in the central region of the network. Ma [15] proposed an obstacle avoidance-based partition connectivity restoration method for wireless sensor networks. Kang [16] proposed a multi-objective optimization genetic algorithm by introducing virtual fragments and a hierarchical chromosome structure to address the issue of optimal data collector location and movement path. The algorithm also includes custom encoding and decoding. Currently, the recovery methods for air–sea cross-domain communication networks are commonly based on traditional graph theory and shortest path algorithms with Dijkstra’s algorithm being a particularly well-known approach. Dijkstra’s algorithm is widely applied in network recovery due to its efficiency in identifying the shortest path. Numerous studies have proposed enhancements to Dijkstra’s algorithm, integrating dynamic changes in network topology to facilitate network recovery. However, a key limitation of these approaches is their typical focus on a singular objective—minimizing communication cost—while neglecting critical factors such as node load and link quality. A notable example of this is the dynamic network reconfiguration method proposed by Du [17], which utilizes Dijkstra’s algorithm to dynamically calculate optimal paths and reconfigure routers, thereby improving network reliability and transmission efficiency. While this method allows for real-time network reconstruction and path optimization during network failures, it is prone to challenges when the network topology becomes more intricate or when multiple failures occur simultaneously [18,19]. In such scenarios, the method is likely to result in increased path computation delays and elevated resource utilization [20,21].

2.2. Swarm Intelligence

Swarm intelligence network recovery refers to the use of swarm intelligence methods to repair faults or restructure networks in order to restore normal network operation and optimize network performance. Zuo [22] designed a topology reconstruction algorithm for node self-repair and a topology reconstruction algorithm for the dynamic repair of redundant nodes. Chen [23] proposed a damage recovery strategy based on swarm intelligence for unmanned aerial vehicle swarm networks, which has good performance in terms of recovery ability, convergence time, and communication overhead. Cui [24] proposed a multi-unmanned ship network topology optimization control algorithm based on improved particle swarm optimization, taking into account factors such as network connectivity, communication link quality, and network connection cost. Chouikhi [25] proposed a distributed solution for multi-channel wireless sensor network connection recovery to address the issues of network failures and network function recovery [26]. This scheme only uses neighborhood information when performing channel reallocation and does not consider the routing followed by the data toward the sink [27].
Based on the previous review, in this paper, for the air–sea cross-domain communication network, in the prediction stage, the whale optimization algorithm is used to optimize the gray model to solve the problem of fixed time response function structure and poor adaptability to the original data. In the reselection link stage, aiming at the problem of excessive network load for minimum communication cost recovery, a link selection scheme combining improved Dijkstra and load balancing is proposed to realize the recovery of the network. The proposed algorithm is simulated in this paper. The results show that the proposed algorithm can effectively restore the network and maintain the network connectivity better than traditional recovery methods.

3. Methodology

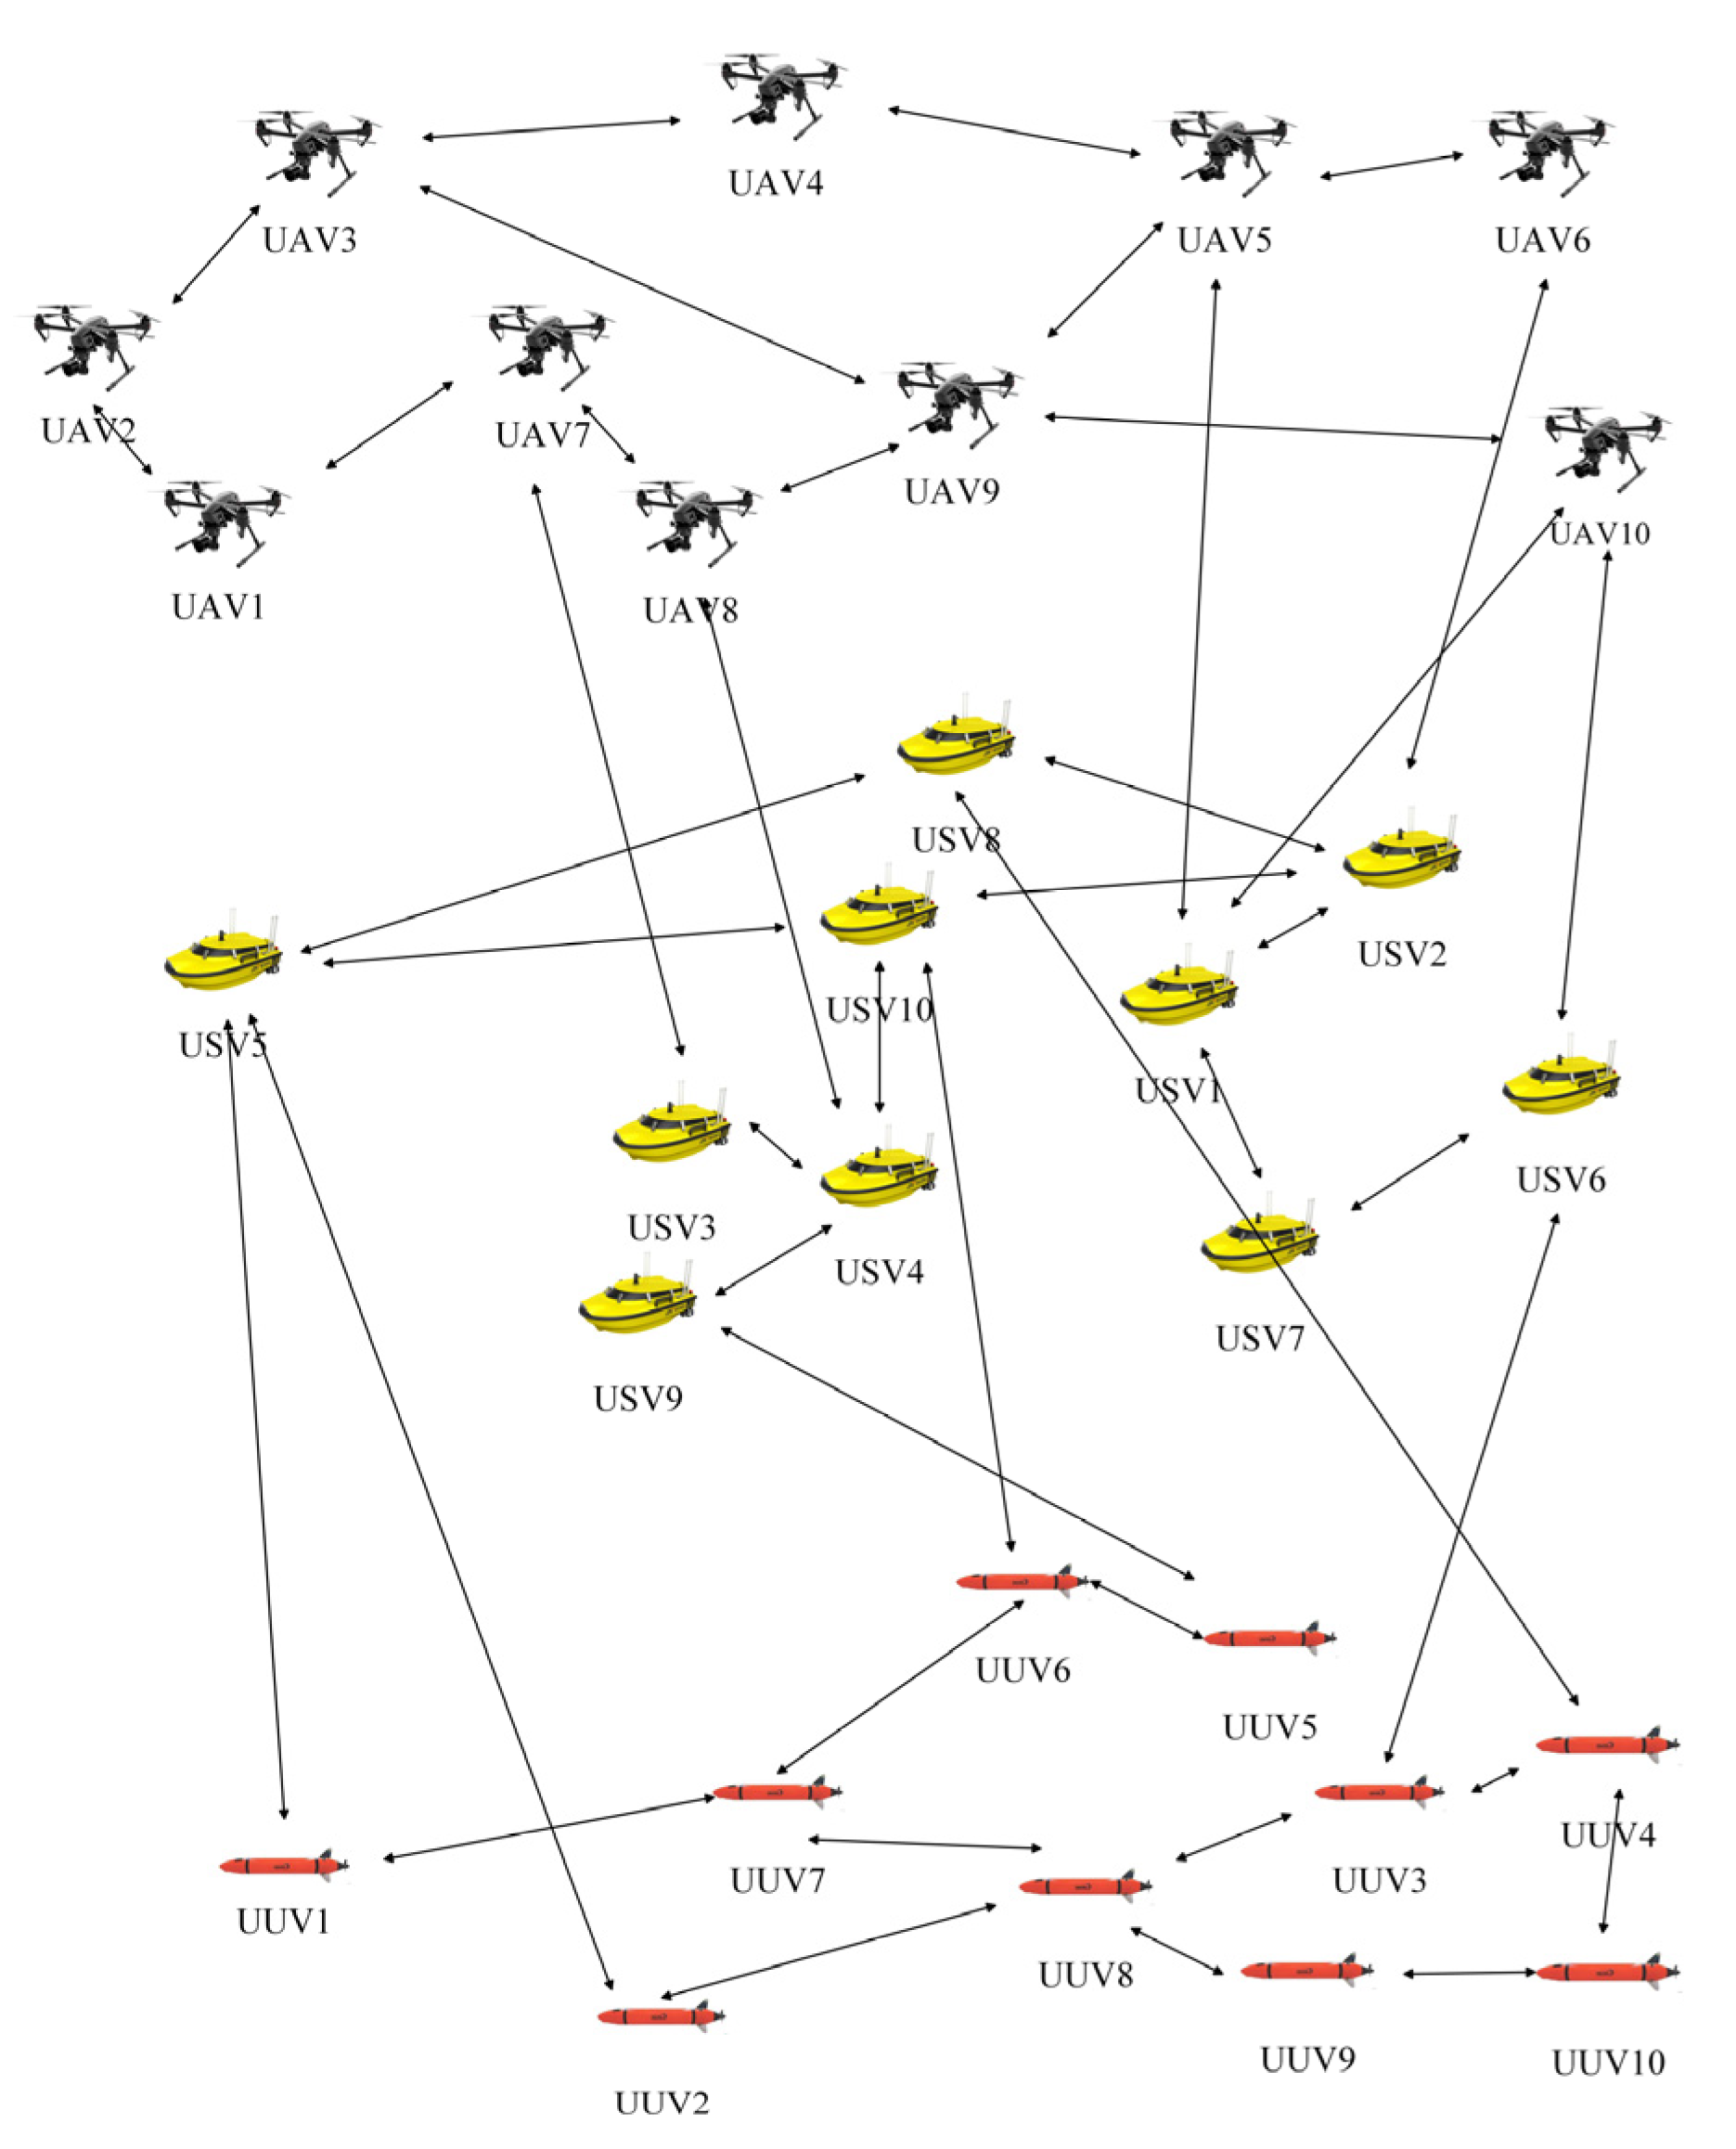
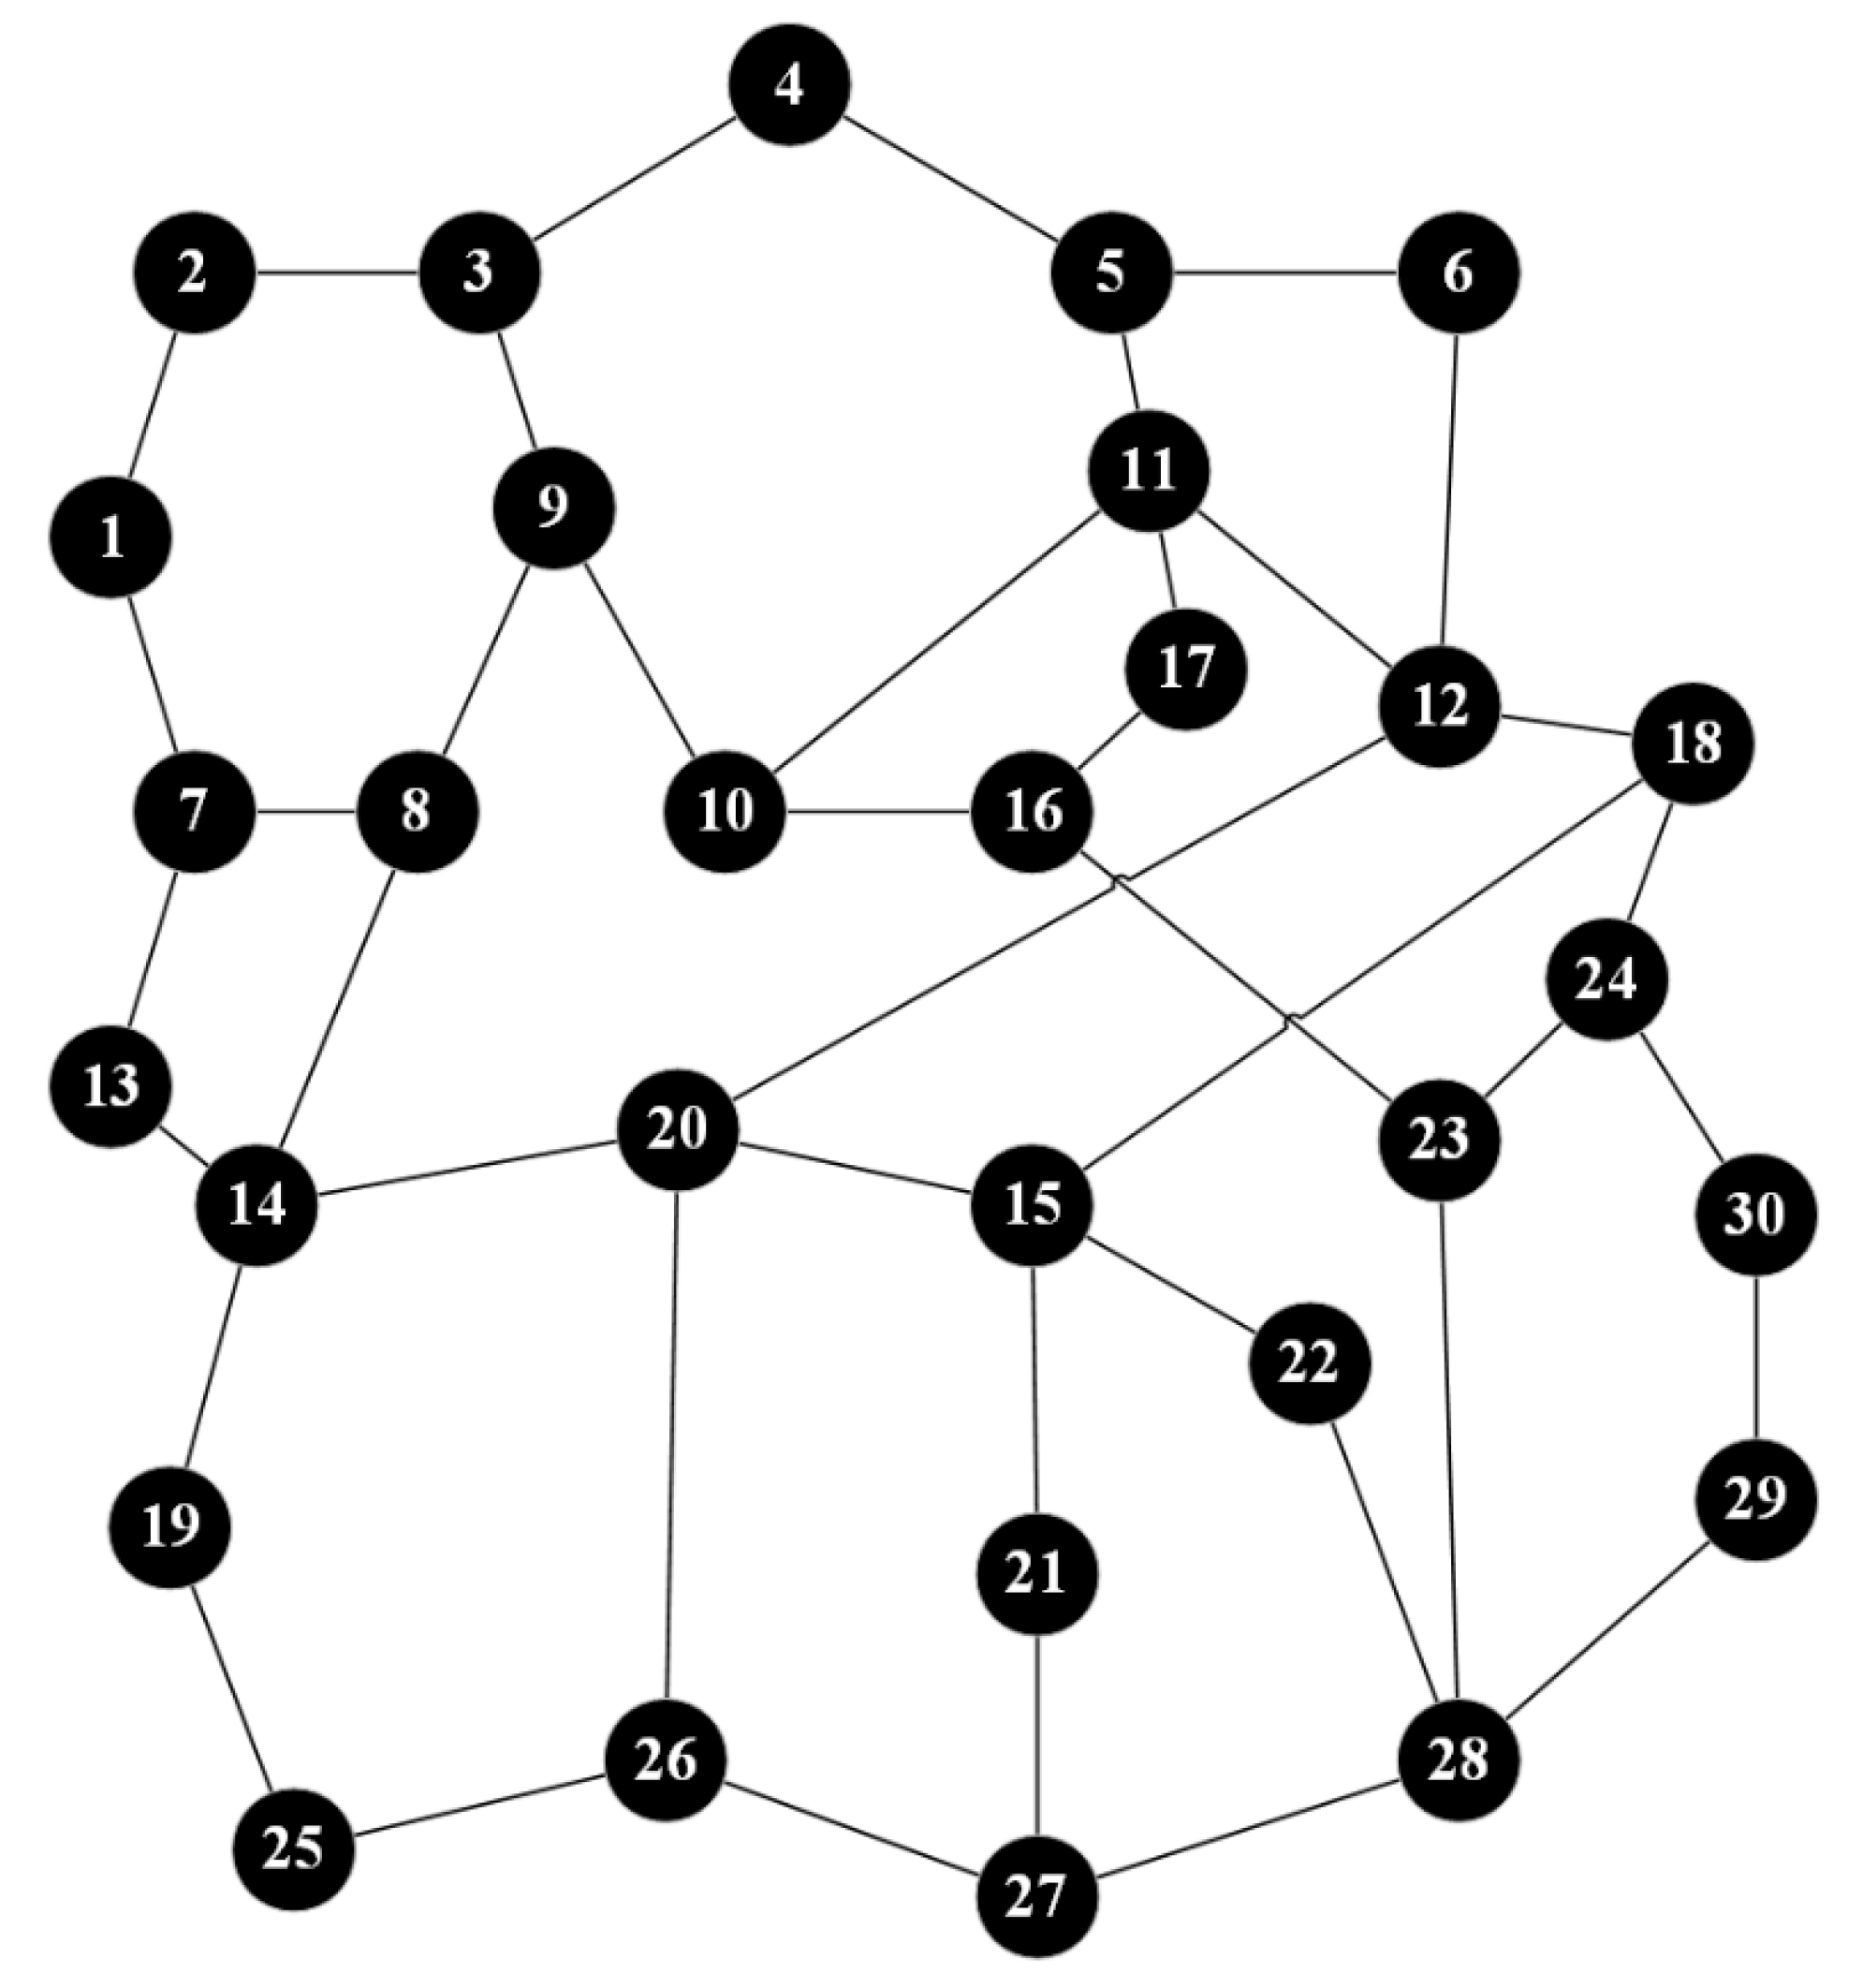
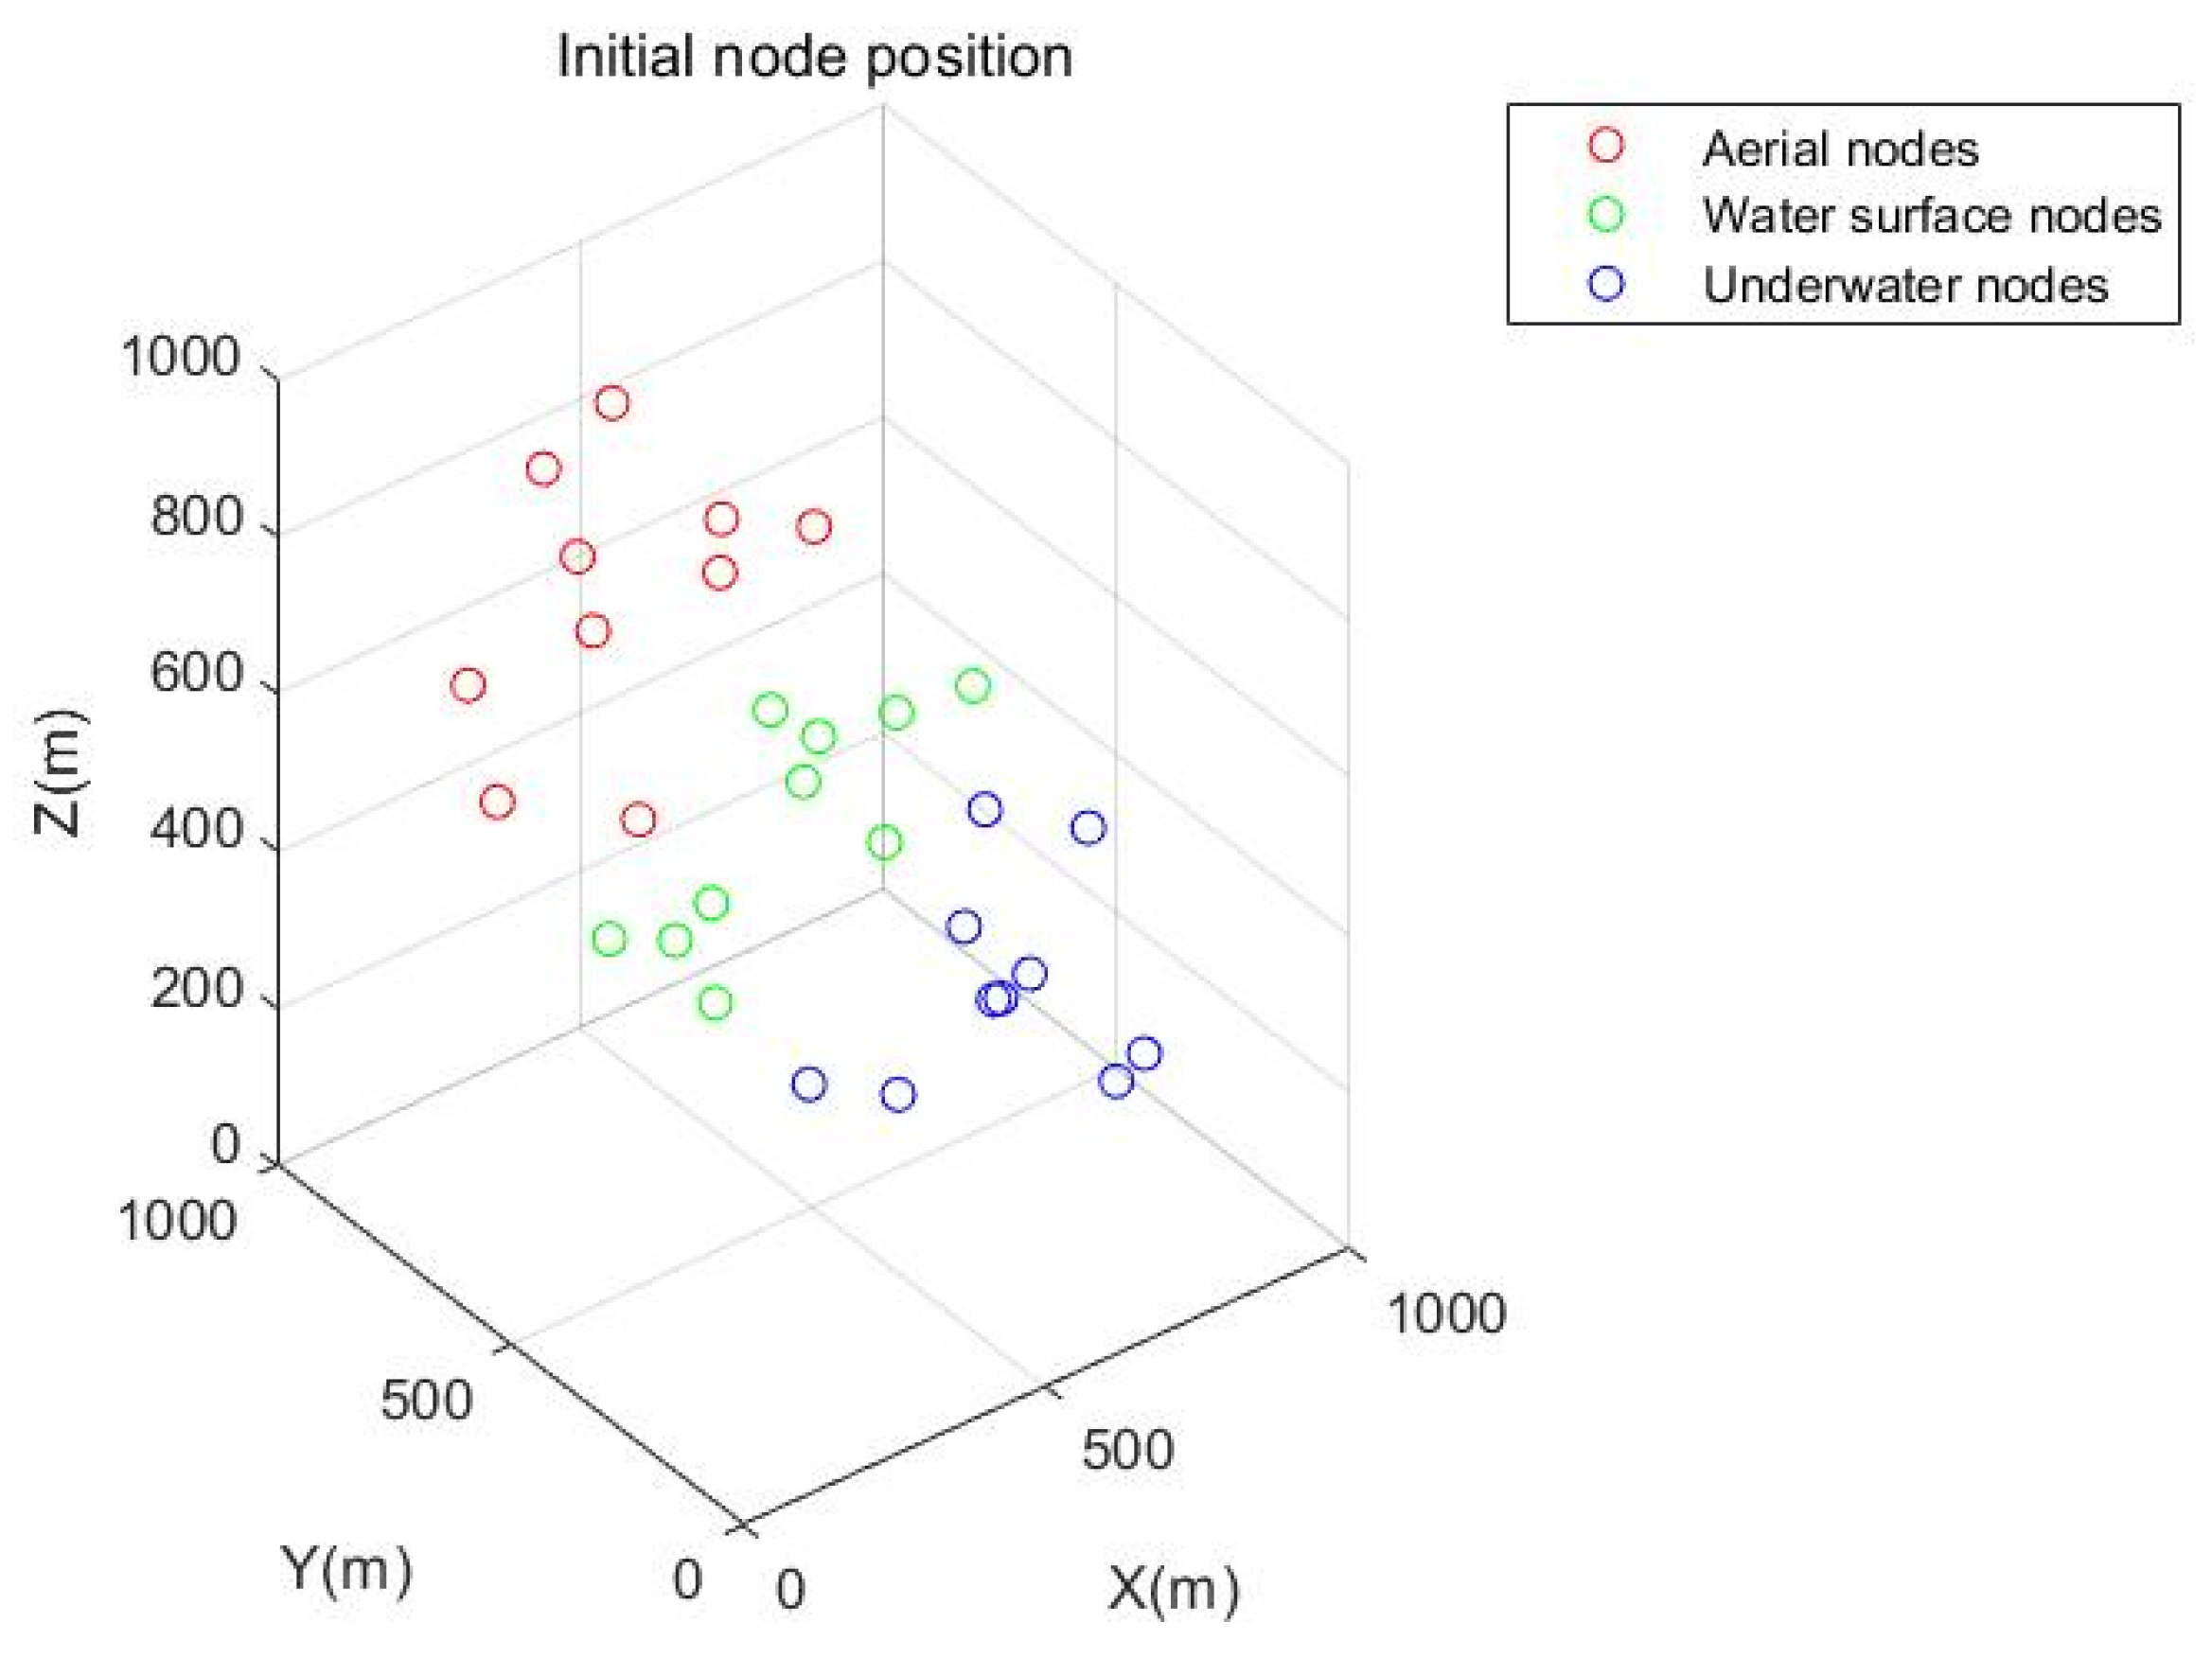
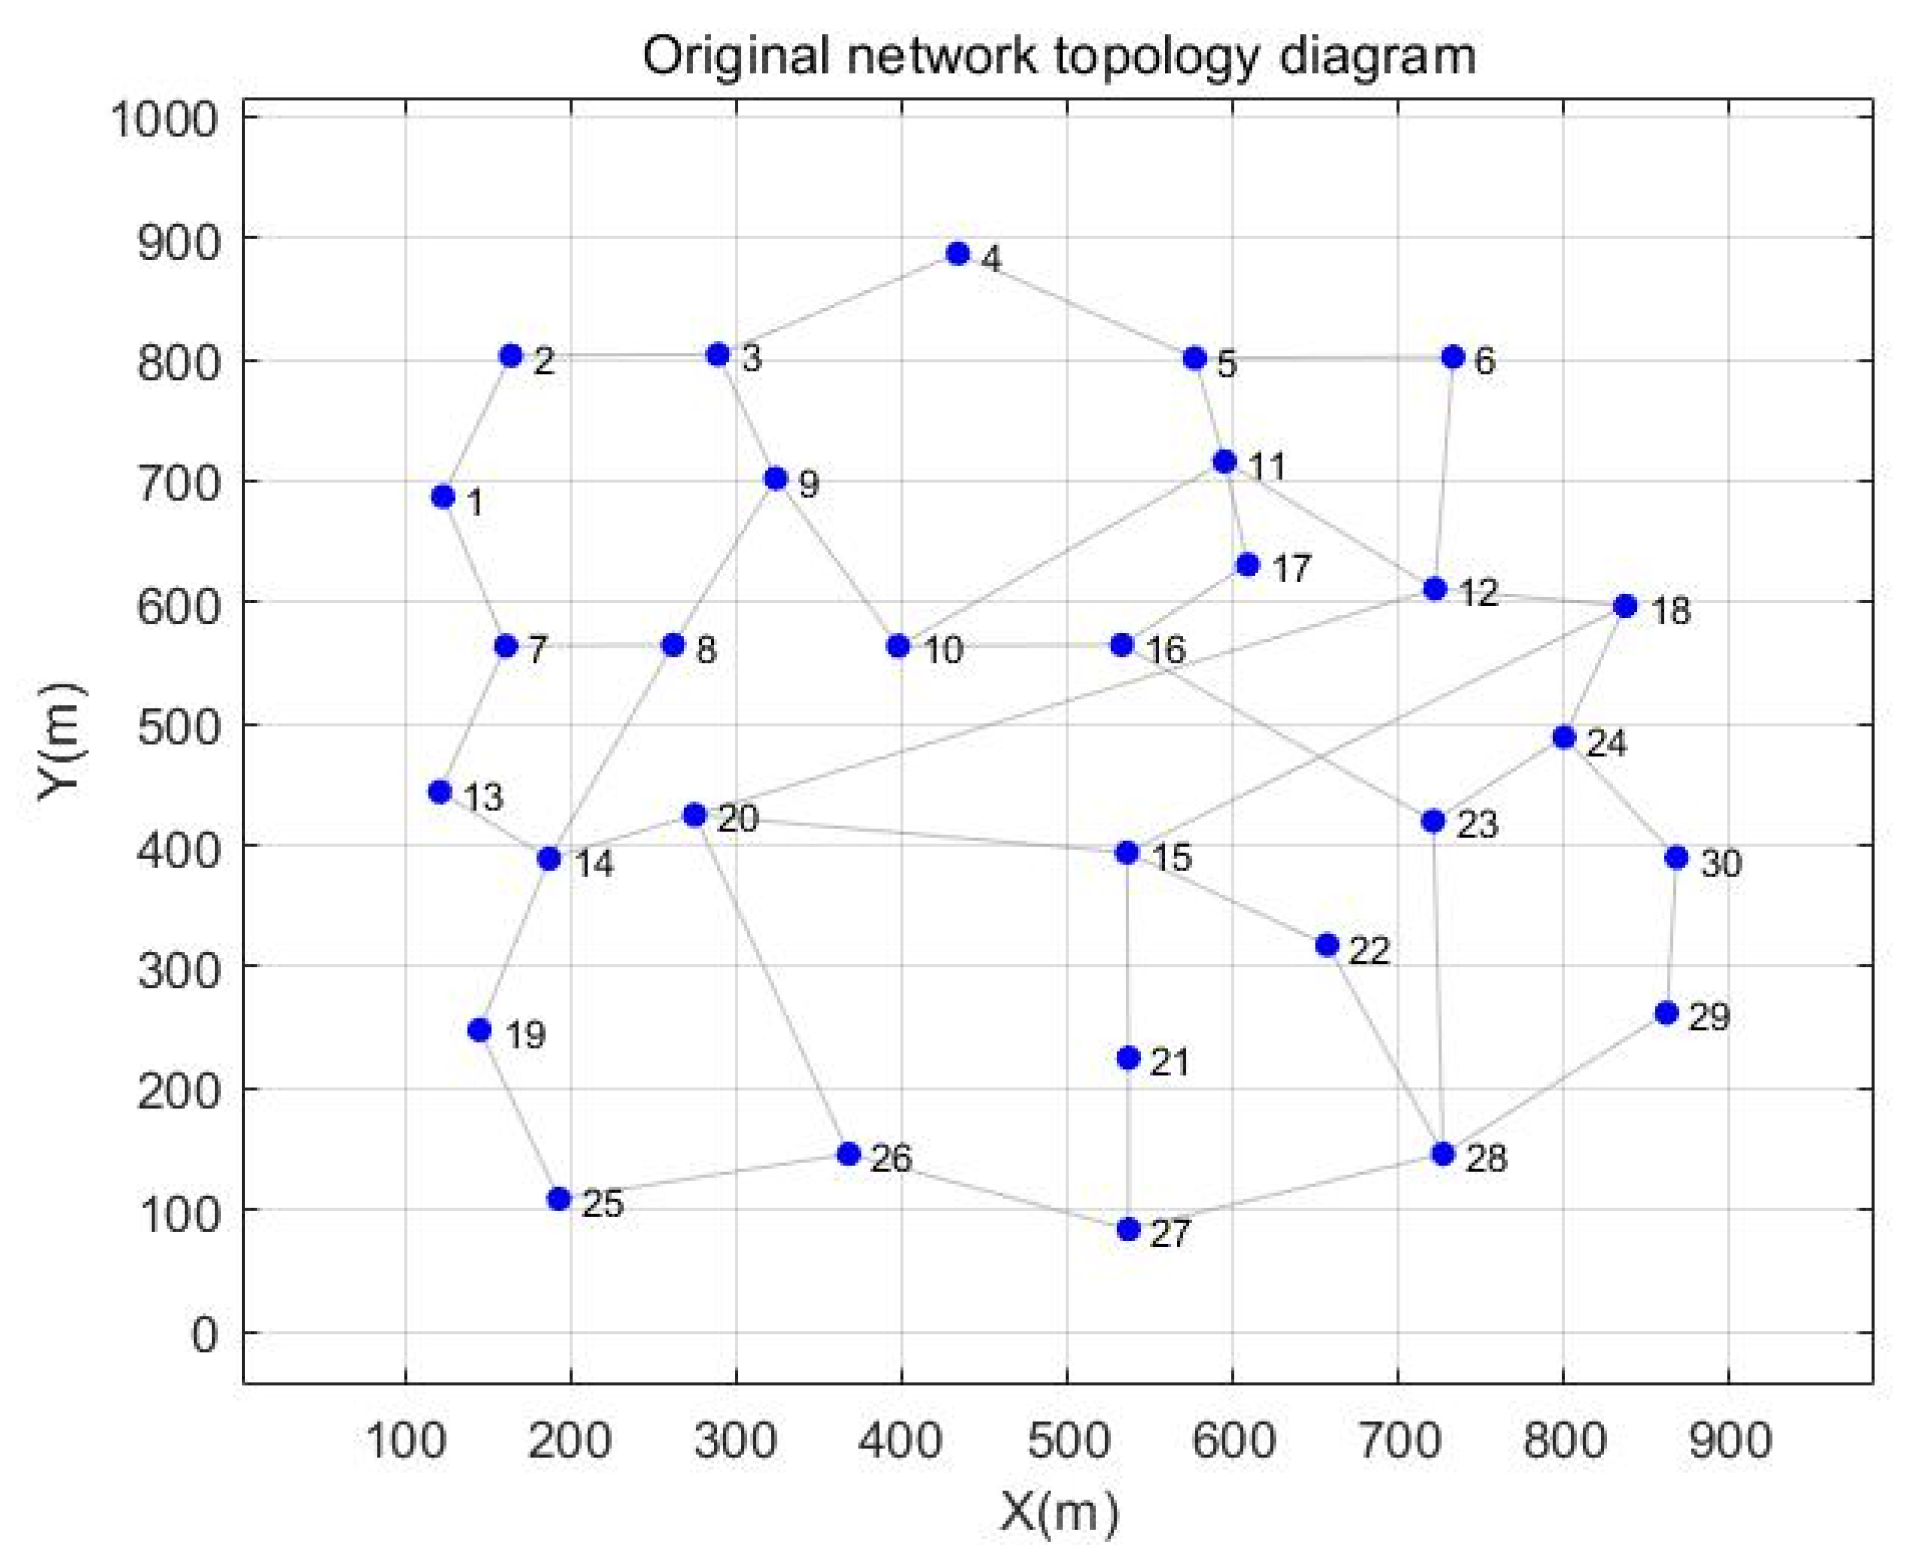
3.1. Air–Sea Cross-Domain Communication Network Model

This paper assumes that there are only three kinds of nodes in the air–sea cross-domain communication network. The nodes above the water are unmanned aerial vehicles (UAVs), the nodes on the water are unmanned surface vessels (USVs), and the nodes under the water are unmanned underwater vehicles (UUVs). The whole network moves in formation mode. Within each spatial domain, each communication entity communicates with its nearest neighbor node. For instance, in the airspace, each UAV node communicates with its nearest neighbor node. Between spatial domains, only surface nodes can communicate with both aerial and underwater nodes. Aerial nodes can only communicate with surface nodes and cannot communicate with underwater nodes. Similarly, underwater nodes can only communicate with surface nodes and cannot communicate with aerial nodes. It is assumed that all nodes of the same type have the same structure and motion capability. The movement mode of the whole network is the reference group movement model. The network structure is shown in Figure 1. The air–sea cross-domain communication network is modeled by graph theory. The nodes and links in the network are mapped to vertices and edges in graph theory, and the problem of link reconnection is transformed into the problem of edge reconnection in graph theory. It is assumed that the overall movement of the network is consistent, all nodes move within the same speed range, and the transmission power is consistent. The network structure is mapped by graph theory, and the sequence of UAV1-10, USV1-10 and UUV1-10 is sorted and mapped as shown in Figure 2.
Considering the multi-layer architecture, long distance, and time-varying topology of the air–sea cross-domain communication network, a topology model of the air–sea cross-domain communication network is established based on the communication connections between network nodes per unit time. By using graph theory [28], the network is abstractly mapped into a graph G (V, E, W), where V represents the set of nodes, E represents the set of edges, and W represents the communication weight matrix.  e i j  represents the edge between node i and node j w i j  represents the communication weight between node i and node j. The communication cost weight is determined by signal stability and load.
The signal stability is defined as the weighted sum of the power intensity and relative speed between nodes. A higher signal power between nodes indicates better link quality between them. The interpolation of the power at adjacent moments is used as the condition for solving the relative motion between nodes.
As shown in Figure 3, at time t, the relative positions of nodes u and v are 1 and 2, and after the movement  Δ t , the relative positions of nodes u and v change to 1 and 3 with a relative velocity of  v u v . The power of node v at position 2 is  P v 2  with a frequency of  f v 2 ; at position 3, the power is  P v 3  with a frequency of  f v 3 . When the received power of the node is  P min , the corresponding maximum communication distance between the transmitting and receiving nodes is  R max . Therefore, the distance between node v at positions 2 and 3 and node u is as follows:
d 12 = P v 2 P min R max ,
d 13 = P v 3 P min R max ,
Assuming that all nodes in the network transmit at the same frequency, denoted as  f , then  Δ t = 1 f , and the frequency of the carrier received by node v from node u is  f . According to the Doppler effect, it can be inferred that
v u v = c f f f cos 2 ,
By combining the above formulas with simple trigonometric derivations, the formula for the relative velocity v can be derived. Since the time interval  Δ t  is very short, and to simplify the calculation, the velocity  v u v  can be approximated as constant. Therefore  d 13 v u v Δ t , the formula for v can be simplified as follows:
v u v = f R m 2 c f f P v 2 P min f 2 R max P v 2 P v 3 P min ,
To avoid selecting links with a very short lifetime for nodes, the received power at the edge nodes corresponding to the maximum communication radius in the network is set as the power threshold as follows:
P threshold = P s G s G r λ 2 4 π 2 R max 2 v max t d e l a y 2 L ,
where  t d e l a y  represents the communication delay. Therefore, the signal stability between nodes u and v is defined as follows:
S u v = p P u v max min P u v , P t h r e s h o l d P s max min P u v , P t h r e s h o l d + q v max v u v v max ,
where  P u v  represents the signal power intensity between nodes u and v;  v u v  is the relative motion velocity between nodes u and v P s  is the transmission power;  v max  is the maximum velocity of the node; and p and q are the weight coefficients for power and velocity, satisfying the condition p + q = 1.
The load  L u v  between nodes u and v is defined as the arithmetic average of the message queue lengths of nodes u and v at the current moment. The smaller the load at both ends of the link, the smoother and faster the communication between the nodes, resulting in a lower communication cost between the nodes.
Under normal conditions, the smaller the relative motion velocity between two nodes, the stronger the signal intensity and the smaller the link load, making the communication between the nodes simpler and the communication cost lower. Conversely, the communication cost increases. It can be observed that the signal strength is inversely proportional to the link load. The ratio of link load to signal stability is defined as the communication cost, as expressed in the following formula:
w u v = k L L u v k S S u v , P u v > P t h r e s o l d inf , P u v P t h r e s o l d ,
where  k L  is the weight of the link load, and  k S  is the weight of the signal stability. After calculating the communication cost of the air–sea cross-domain communication network and combining the theory of undirected weighted graphs, the network model can be obtained as follows:
W = w 11 w 12 w 1 n w 21 w 22 w 2 n w n 1 w n 2 w n n ,
where W represents the network communication cost weight matrix, which is an n-order matrix. When  w u v  is a real number, it indicates that a link can be established between node u and node v. The larger the value of  w u v , the higher the communication cost. When  w u v  is infinite, it means that a link cannot be established between node u and node v beyond the maximum communication distance.

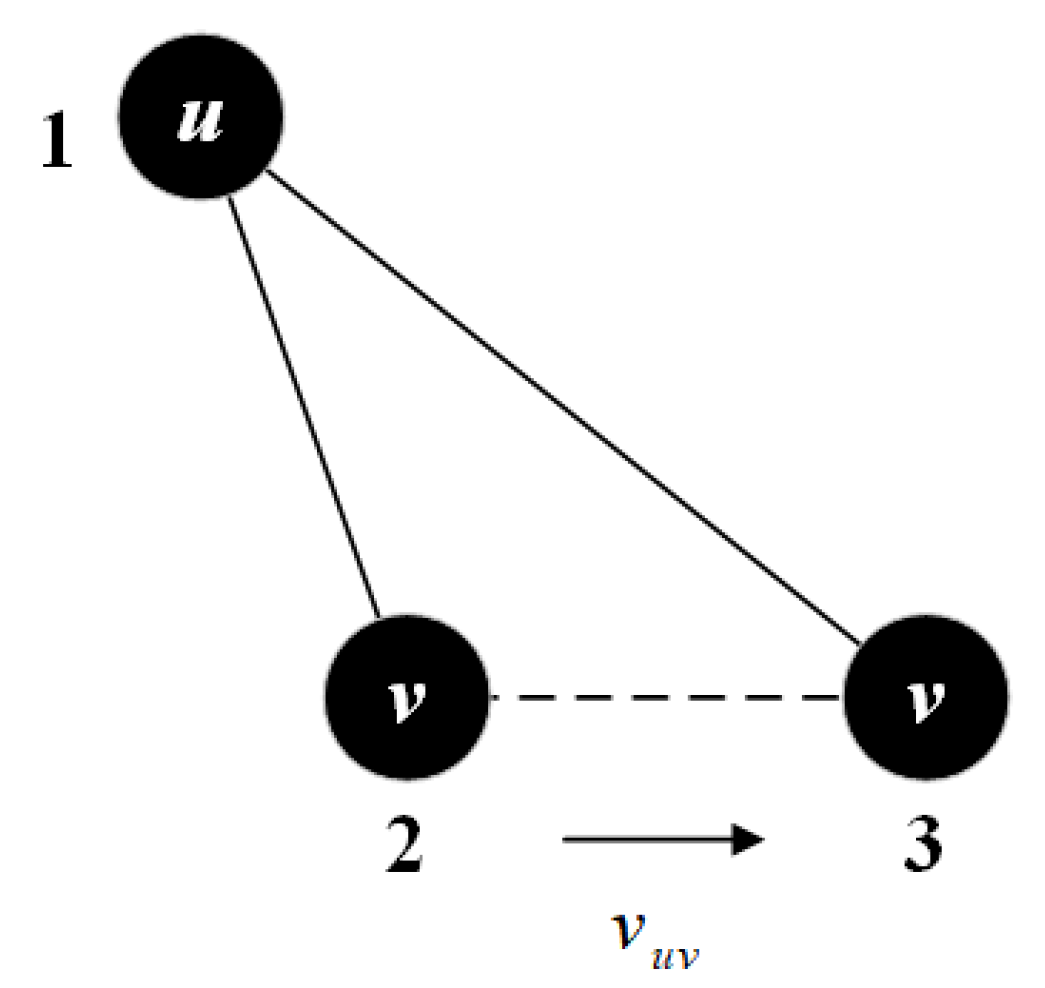
3.2. Link Quality Prediction Algorithm

This article proposes a multi-node failure recovery method for air–sea cross-domain communication networks using a combination of minimum communication cost and load balancing. We obtain the communication cost prediction matrix through link quality prediction and select the method with the minimum communication cost to reconstruct the network. To solve the problem of excessive load on certain links in the network, a shortest path algorithm based on minimum communication cost and load balancing is designed. The relationship between minimizing communication costs and balancing link loads enables the entire network to achieve information balance and fast transmission. In the following two subsections, a comprehensive derivation and detailed explanation of the link quality prediction algorithm, as well as the path selection strategy, will be provided.
Accumulate the original link quality data  W ( 0 ) = w ( 0 ) ( 1 ) , w ( 0 ) ( 2 ) , , w ( 0 ) ( n )  to obtain generated data  W ( 1 ) = w ( 1 ) ( 1 ) , w ( 1 ) ( 2 ) , , w ( 1 ) ( n ) ,
w ( 1 ) ( k ) = i = 1 k w ( 0 ) ( i ) ,   k = 1 , 2 , , n ,
The average generated sequence is  z ( 1 ) = z ( 1 ) ( 2 ) , z ( 1 ) ( 3 ) , , z ( 1 ) ( n ) ,
z ( 1 ) ( k ) = 1 2 w ( 1 ) ( k ) + w ( 1 ) ( k 1 ) , k = 2 , 3 , , n ,
Generate a first-order differential equation based on the preprocessed cumulative sequence. The predicted sequence obtained by solving it through matrix method is
w ^ ( 1 ) ( k + 1 ) = w ( 1 ) ( 1 ) b ^ a ^ e a ^ k + b ^ a ^ , k = 1 , 2 , , n 1 u = a b , B = z ( 1 ) ( 2 ) 1 z ( 1 ) ( 3 ) 1 z ( 1 ) ( n ) 1 , Y = w ( 0 ) ( 2 ) w ( 0 ) ( 3 ) w ( 0 ) ( n ) u ^ = a ^ b ^ T = B T B 1 B T Y ,
Due to the fixed and invariant time response function structure of the classical gray prediction model [29], this situation results in poor adaptability to changes in the original data. Therefore, optimization algorithms are used to optimize the time response function, making it have variable weighting coefficients. The optimized predicted value is
w ^ ( 1 ) ( k ) = w ( 1 ) ( β ) b ^ a ^ e a ^ ( k β ) + b ^ a ^ , k = 2 , 3 , , n ,
where  w ( 1 ) ( β )  is the initial condition of the time response function. The optimal values for  α  and  β  are calculated based on the condition that the average absolute percentage error between the predicted value and the actual value is minimized. The objective function for optimization can be derived as
min α , β 1 n k = 1 n w ^ ( 0 ) ( k ) w ( 0 ) ( k ) w ( 0 ) ( k ) × 100 % s . t . B = z ( 1 ) ( 2 ) 1 z ( 1 ) ( 3 ) 1 z ( 1 ) ( n ) 1 , Y = w ( 0 ) ( 2 ) w ( 0 ) ( 3 ) w ( 0 ) ( n ) w ^ ( 1 ) ( k ) = w ( 1 ) ( β ) b ^ a ^ e a ^ ( k β ) + b ^ a ^ a ^ b ^ T = B T B 1 B T Y w ^ ( 0 ) ( k ) = w ^ ( 1 ) ( k ) w ^ ( 1 ) ( k 1 ) α ( 0 , 1 ) ; β 0 , 1 ; k = 1 , 2 , , n ,
After finding the optimal solution through the above method, performing a subtraction operation on it can obtain the predicted link quality sequence:
w ^ ( 0 ) ( k ) = 1 e a ^ w ( 0 ) ( 1 ) b ^ a ^ e a ^ ( k 1 ) , k = 2 , 3 , , n ,

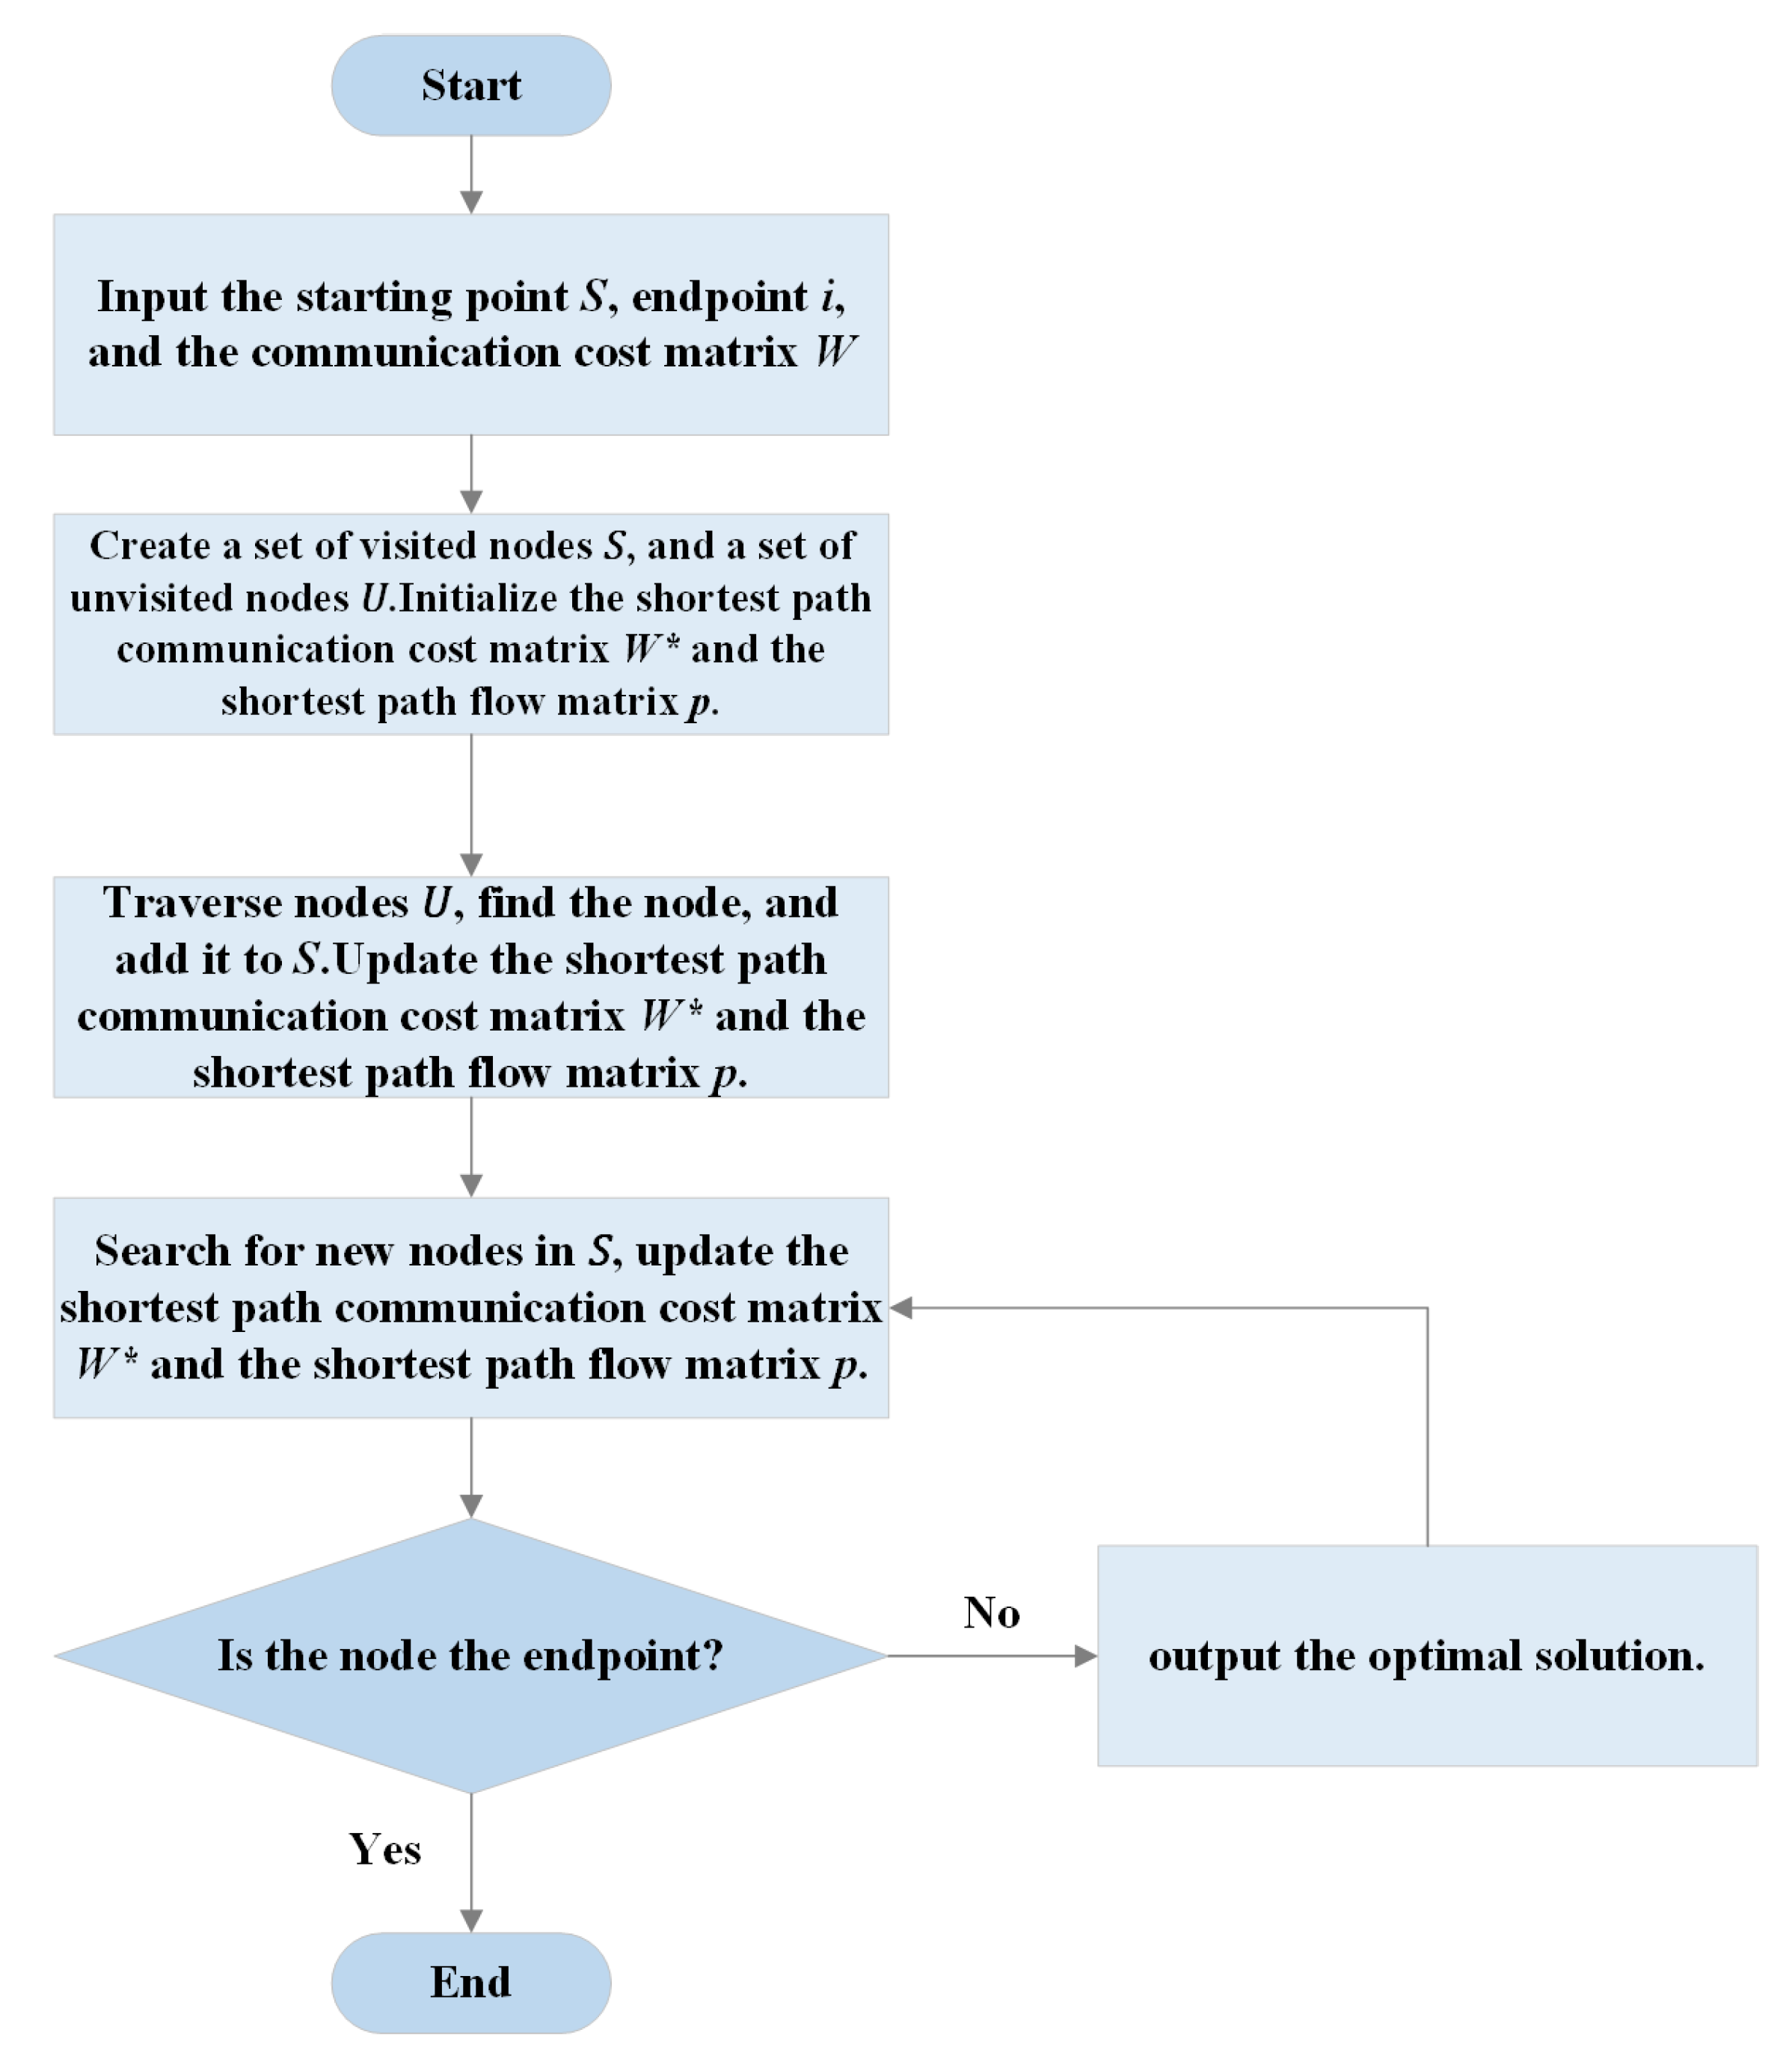
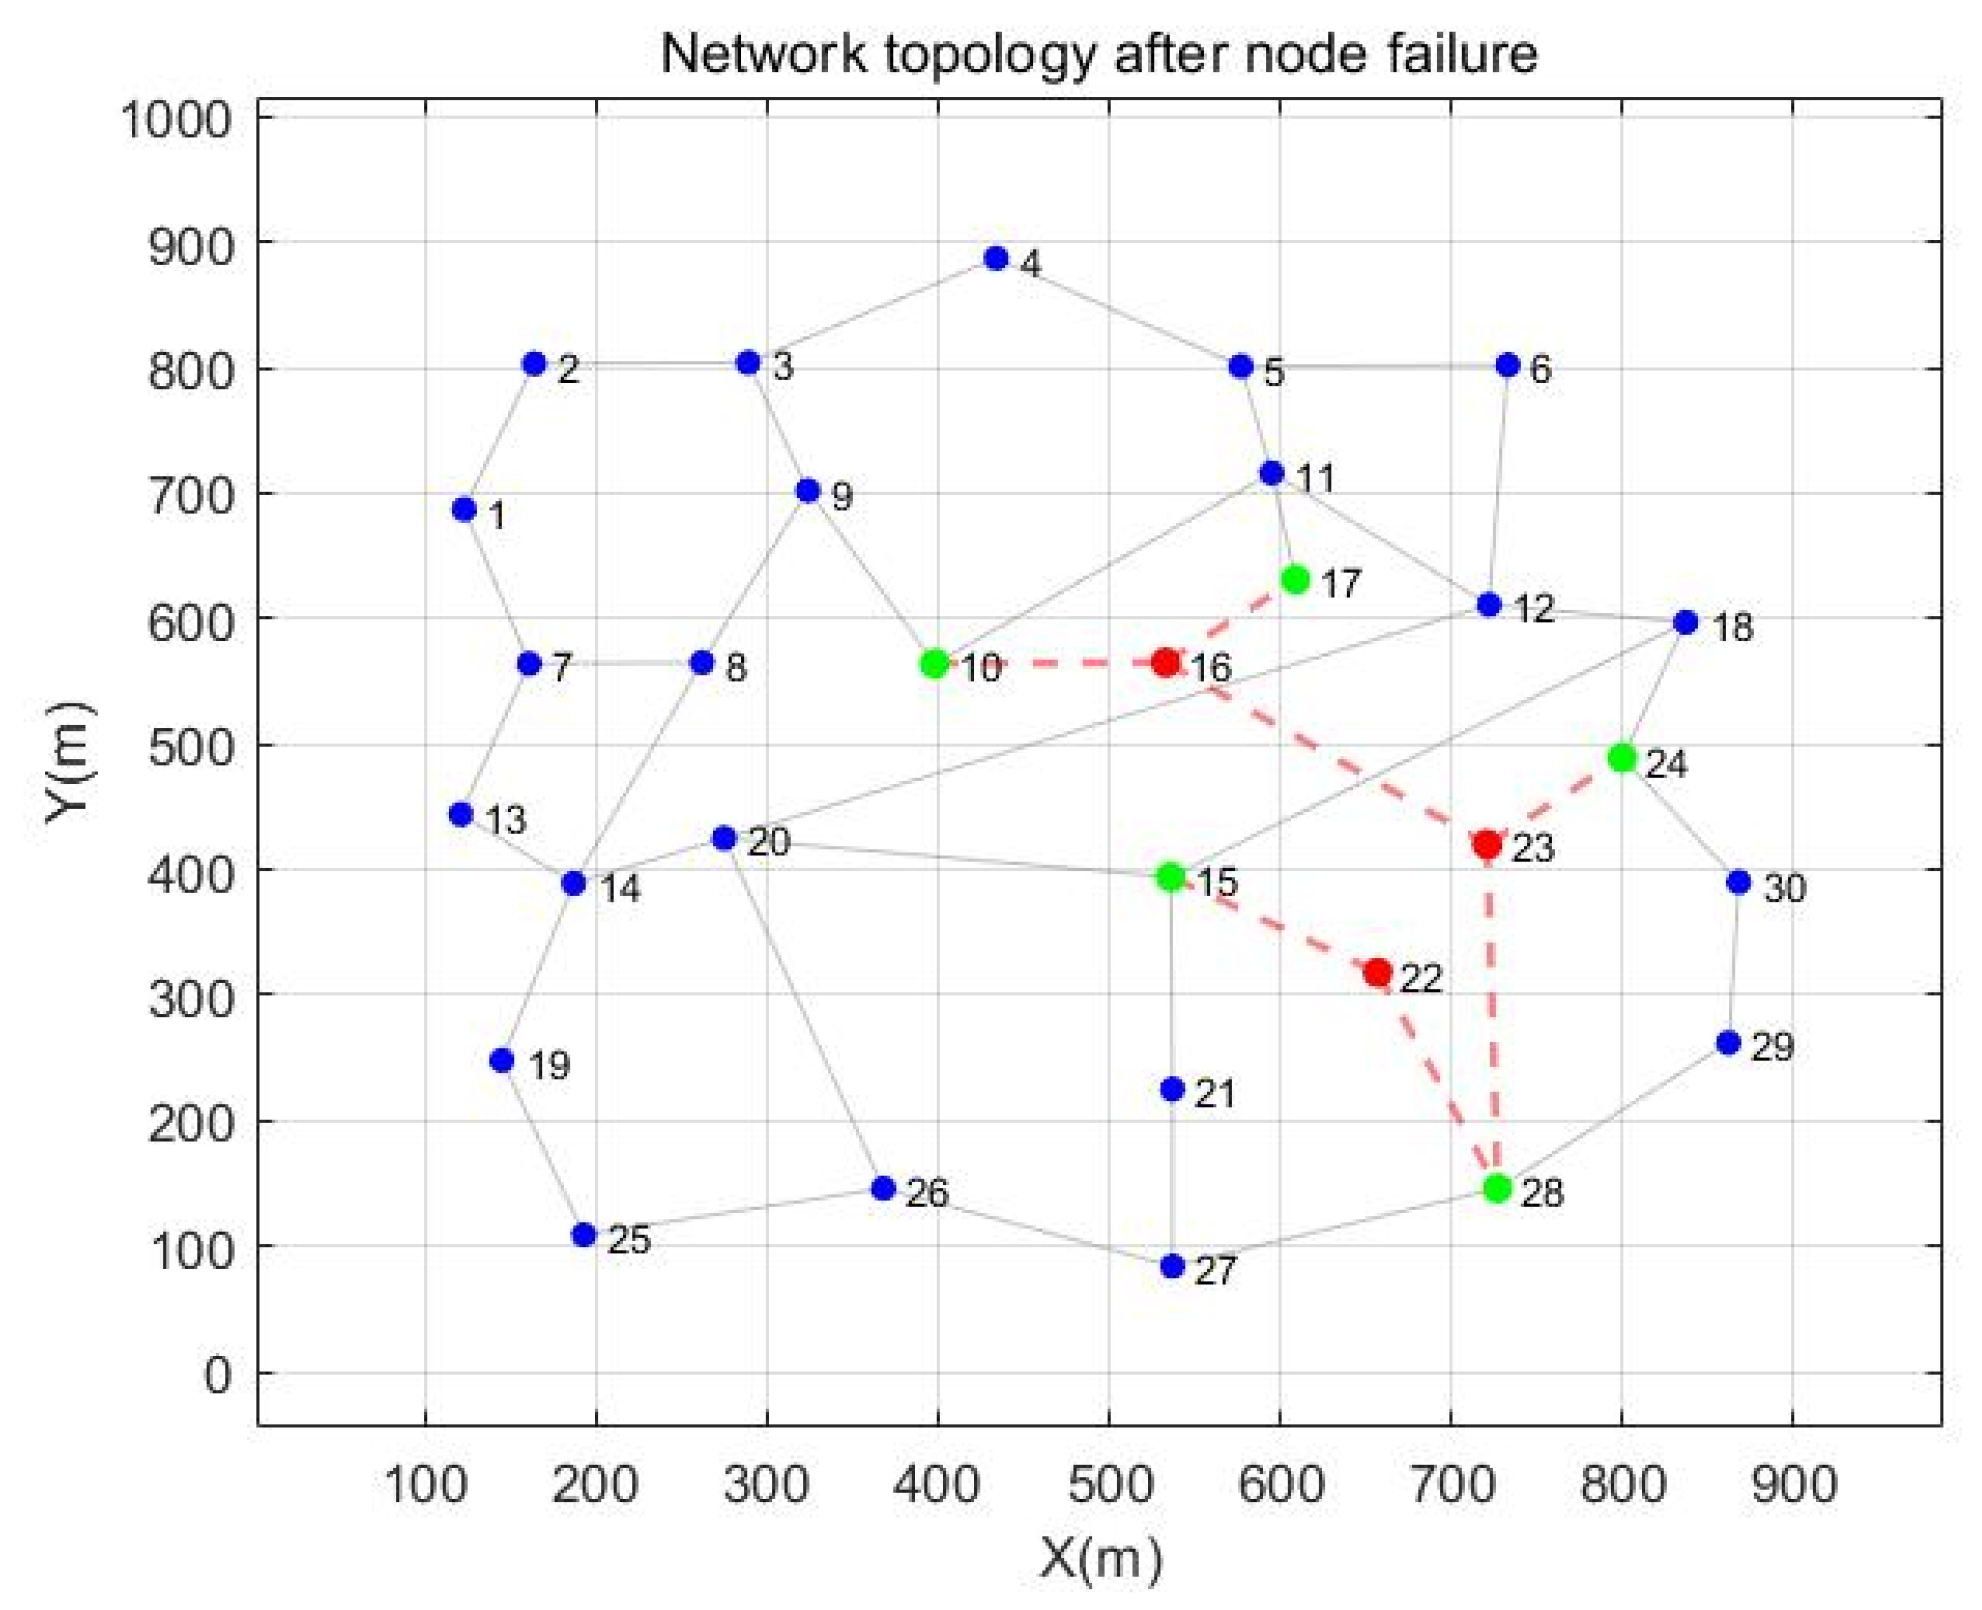
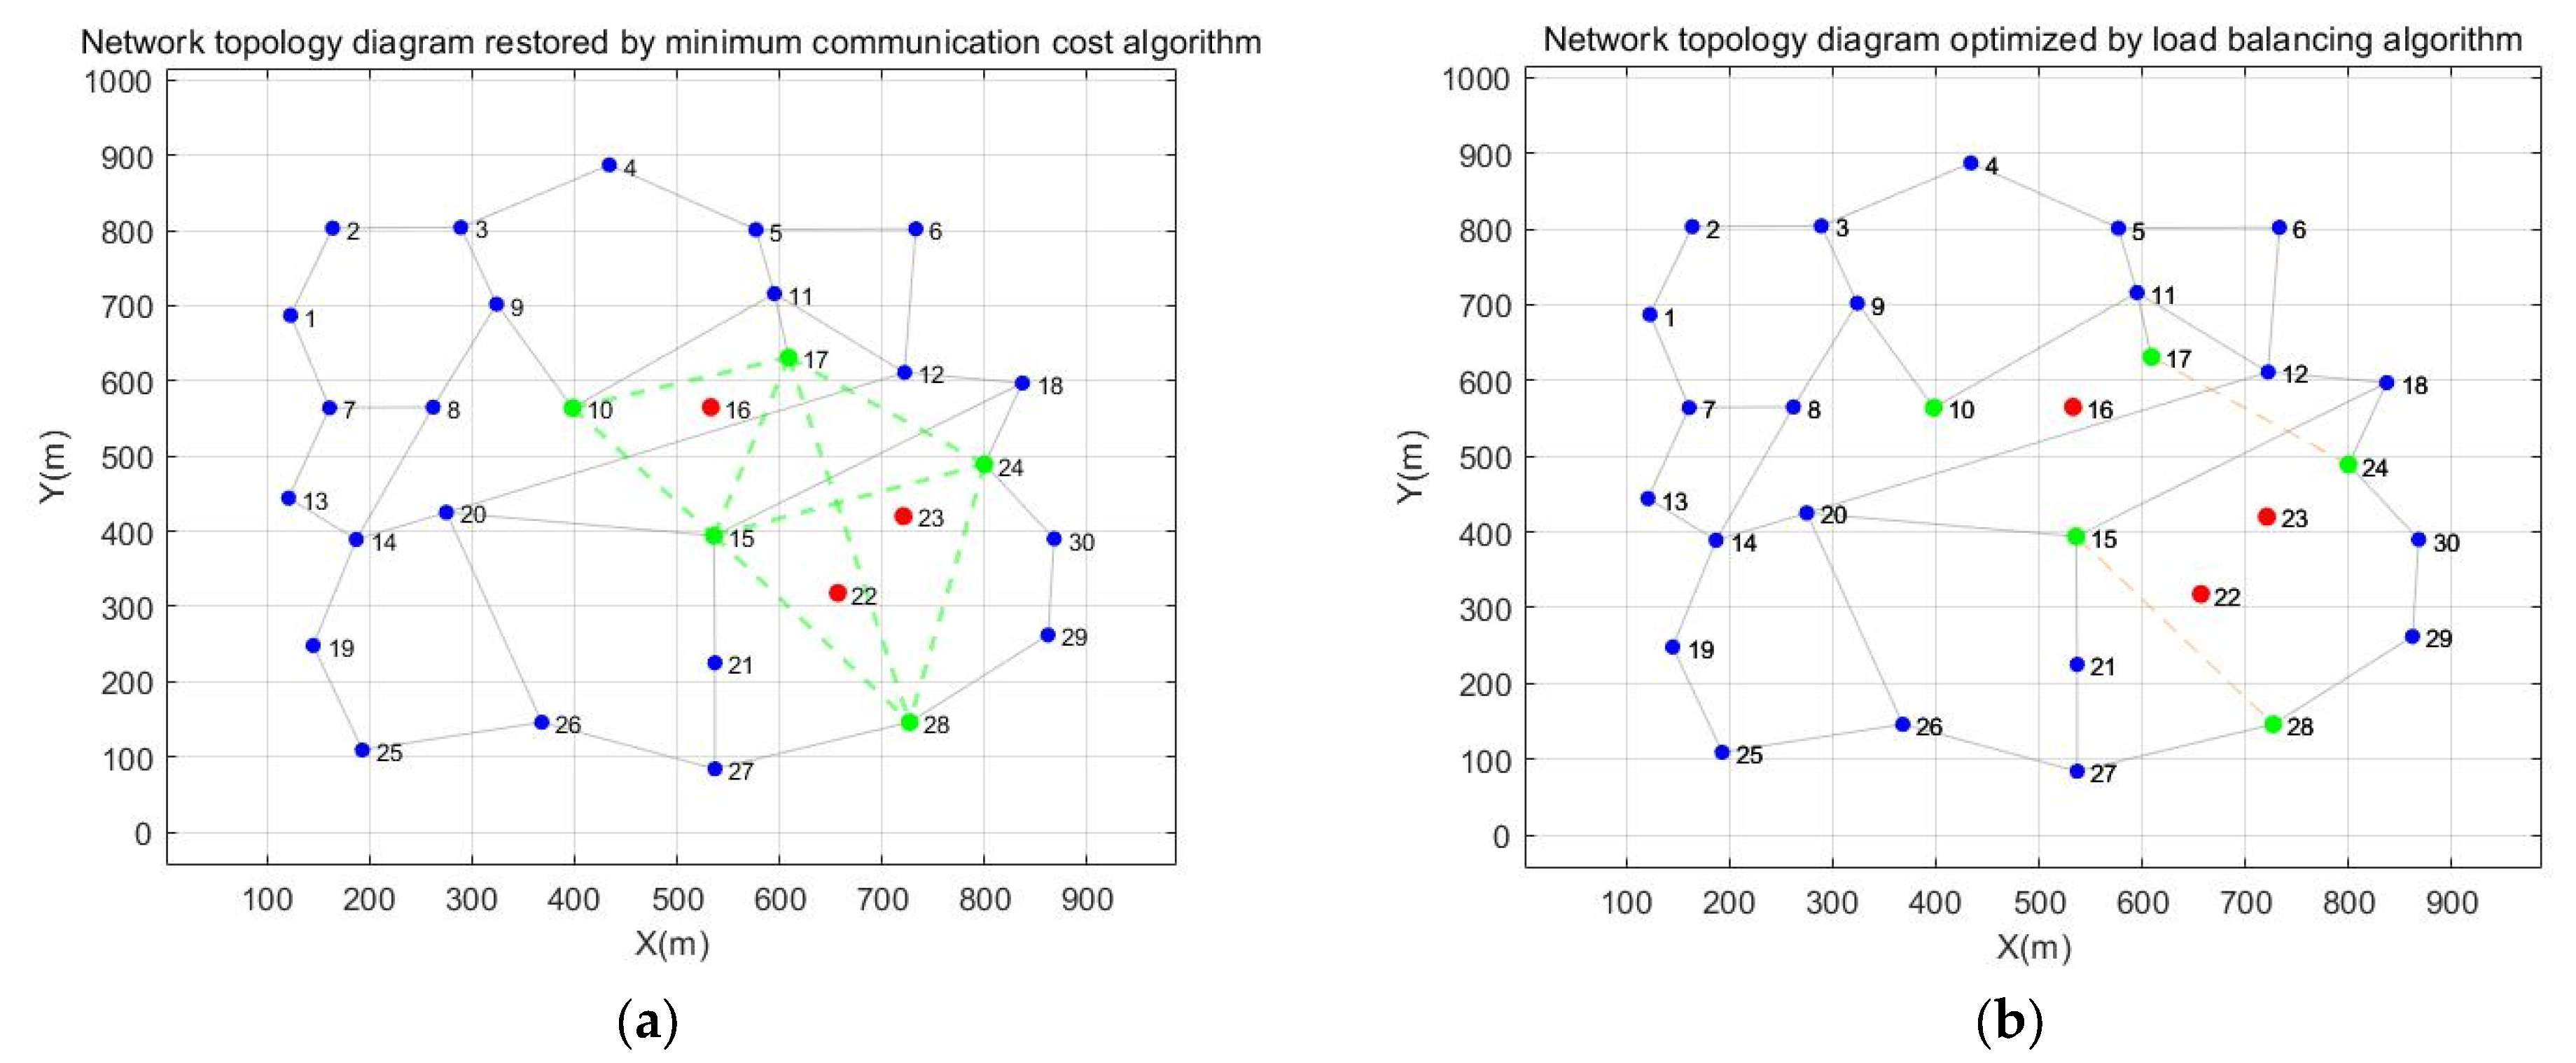
3.3. Path Selection Strategy Based on Improved Dijkstra and Load Balancing

Firstly, improve the minimum communication cost algorithm to record link information during node search. Defining the set of all nodes in the network as V, labeled nodes as S, and unlabeled nodes as U satisfies the following criteria:
V = S + U ,
The initial node is denoted as s, and its communication cost is initialized to 0. The communication cost of the remaining nodes is infinite. Add s to S. Compare the path weights of s with all its adjacent nodes, select the node with the smallest weight as the starting node for the next hop, and add it to S. Traverse the communication cost of all neighboring nodes j of the current node. If the communication cost of a neighboring node k is greater than the sum of the communication cost of the current node and the communication cost from the current node to j, update the communication cost of the neighboring node and add k to S. Repeat this step until the endpoint is found or U is empty. Specifically,
w s k = min w s j ,
The communication cost between the starting node s and the newly added node j is recorded as
w s j = min ( w s j , w s k + w k j ) ,
The minimum communication cost matrix for updating the starting node is
W s , i * = W s , i * + W j , i * ,
Define the shortest path vector  p  and record the shortest path from the update starting node to the current one
p s , i = p s , i + p j , i ,
If the endpoint cannot be found, return to the previous branch node and search for the endpoint from other branches. At this point, the update records the minimum communication cost matrix and the shortest path vector,
W s , i * = W s , i * ( p a s t ) ; p s , i = p s , i ( p a s t ) ,
Secondly, a load-balancing algorithm is proposed to solve the problem of excessive load on some links in the network. The ratio of the data volume  M d a t a  transmitted by link e to the link bandwidth  B e  is defined as the load  Z e  of link e. Then, we used a variance of  Z e  as a variable to measure the load situation:
Z variance = e E Z e Z a v e r a g e 2 n ,
Among them,  Z average  is the average load, and n is the number of nodes. When  Z variance  exceeds the load threshold of  Z max , it indicates that the network needs to perform load-balancing operations. Therefore,
Z e = min Z e , Z max ,
At this point, load balancing is achieved by reducing the number of links connected at both ends of the high load link.
Finally, in order to achieve the optimal recovery method for multi-node failed networks, a link selection strategy is proposed by comprehensively considering the minimum communication cost algorithm and load-balancing algorithm. For topology  G damage , the objective function is set to the communication cost W and load-balancing degree  Z variance  of the network, and a weight coefficient k is introduced to achieve a balance between communication cost and load-balancing degree. The final recovery method requires the minimum value of the objective function, at which point the restored network topology is also load balanced with low communication costs,
min W G damage + k Z var i a n c e G damage ,
When solving the function, if  G damage  is discrete and finite, the enumeration method can be used to obtain the optimal solution. If  G damage  is continuous, basic optimization methods such as gradient descent can be used to obtain the optimal solution. However, if the initial value is not selected well, it is easy to become stuck in local optimal solutions. Therefore, this article adopts the whale optimization algorithm [30] to solve it, forming a topology optimization method for communication cost and load balancing. The objective function is as follows:
min W G damage + k Z var i a n c e G damage s . t . Z average = e G d a m a g e Z e n W G d a m a g e = e G d a m a g e w e Z variance G d a m a g e = e G d a m a g e Z e Z a v e r a g e 2 n 0 < Z e < Z max , e G d a m a g e ,
The algorithmic process is presented in Figure 4.

4. Validation of Algorithm Effectiveness

Assuming there are 30 nodes in the network, including 10 unmanned aerial vehicles, 10 unmanned surface vessels, and 10 unmanned underwater vehicles, the performance parameters of each type of node are the same. The movement speed of air nodes in the entire network remains consistent based on the benchmark of water surface and underwater nodes. The entire network is based on a reference point group movement model, and it moves in a specific direction at a certain speed with a maximum movement speed of 10 m/s. The maximum number of iterations for the whale algorithm is 50. During the simulation process, the positions of each node in the network are shown in Figure 5.
Using a plane of z = 500 m as the sea surface, its initial topological structure is shown in Figure 6.
We conducted simulation experiments on the failure of multiple nodes in air–sea cross-domain communication networks, assuming the set of failed nodes is  V lapse  and the set of affected nodes that need to be restored is  V recover . When a network node fails, the node that needs to be restored sends a link establishment request to neighboring nodes, and each node in the network learns the set of nodes that need to be restored through sharing. The network topology with multiple node failures is shown in Figure 7. Here, the red nodes represent failed nodes,  V lapse = { 16 , 22 , 23 } ; the green nodes represent the nodes that need to be restored,  V recover = { 10 , 15 , 17 , 24 , 28 } ; the red dashed line represents the interrupted link. We restored the failed nodes and used the minimum communication cost algorithm described in the previous section to find the minimum communication cost path. The nodes in  V recover  find the minimum communication cost path based on the predicted value of link quality, as shown in Table 1.
The topology of the network is restored using the minimum communication cost algorithm, as shown in Figure 8a, where the green dashed line represents the restored links. After using the minimum communication cost algorithm to restore the network, connectivity is restored, and then load optimization is performed on it, as shown in Table 2. The optimized network topology is shown in Figure 8b.
As shown in Figure 8b, the nodes that need to be restored in the figure have undergone network repair based on the minimum communication cost and load-balancing algorithm. Through load-balancing algorithms, the number of links is reduced, communication costs are lowered, and the load is restored more evenly compared to using only the minimum communication cost algorithm.

5. Comparison of Algorithm Performance

To assess the performance of the proposed improved Dijkstra–load-balancing algorithm, we conduct a comparative analysis with two traditional recovery algorithms: the no-prediction shortest path recovery algorithm and the one-hop neighbor link prediction recovery algorithm. The performance of each algorithm is evaluated under two distinct failure scenarios: random node failures and deliberate attacks. This comparison allows for a comprehensive evaluation of the algorithms’ resilience and efficiency in handling network disruptions. In random failure scenarios, the failed nodes are selected randomly; in deliberate attack scenarios, the failed nodes prioritize disrupting the communication links of critical nodes.

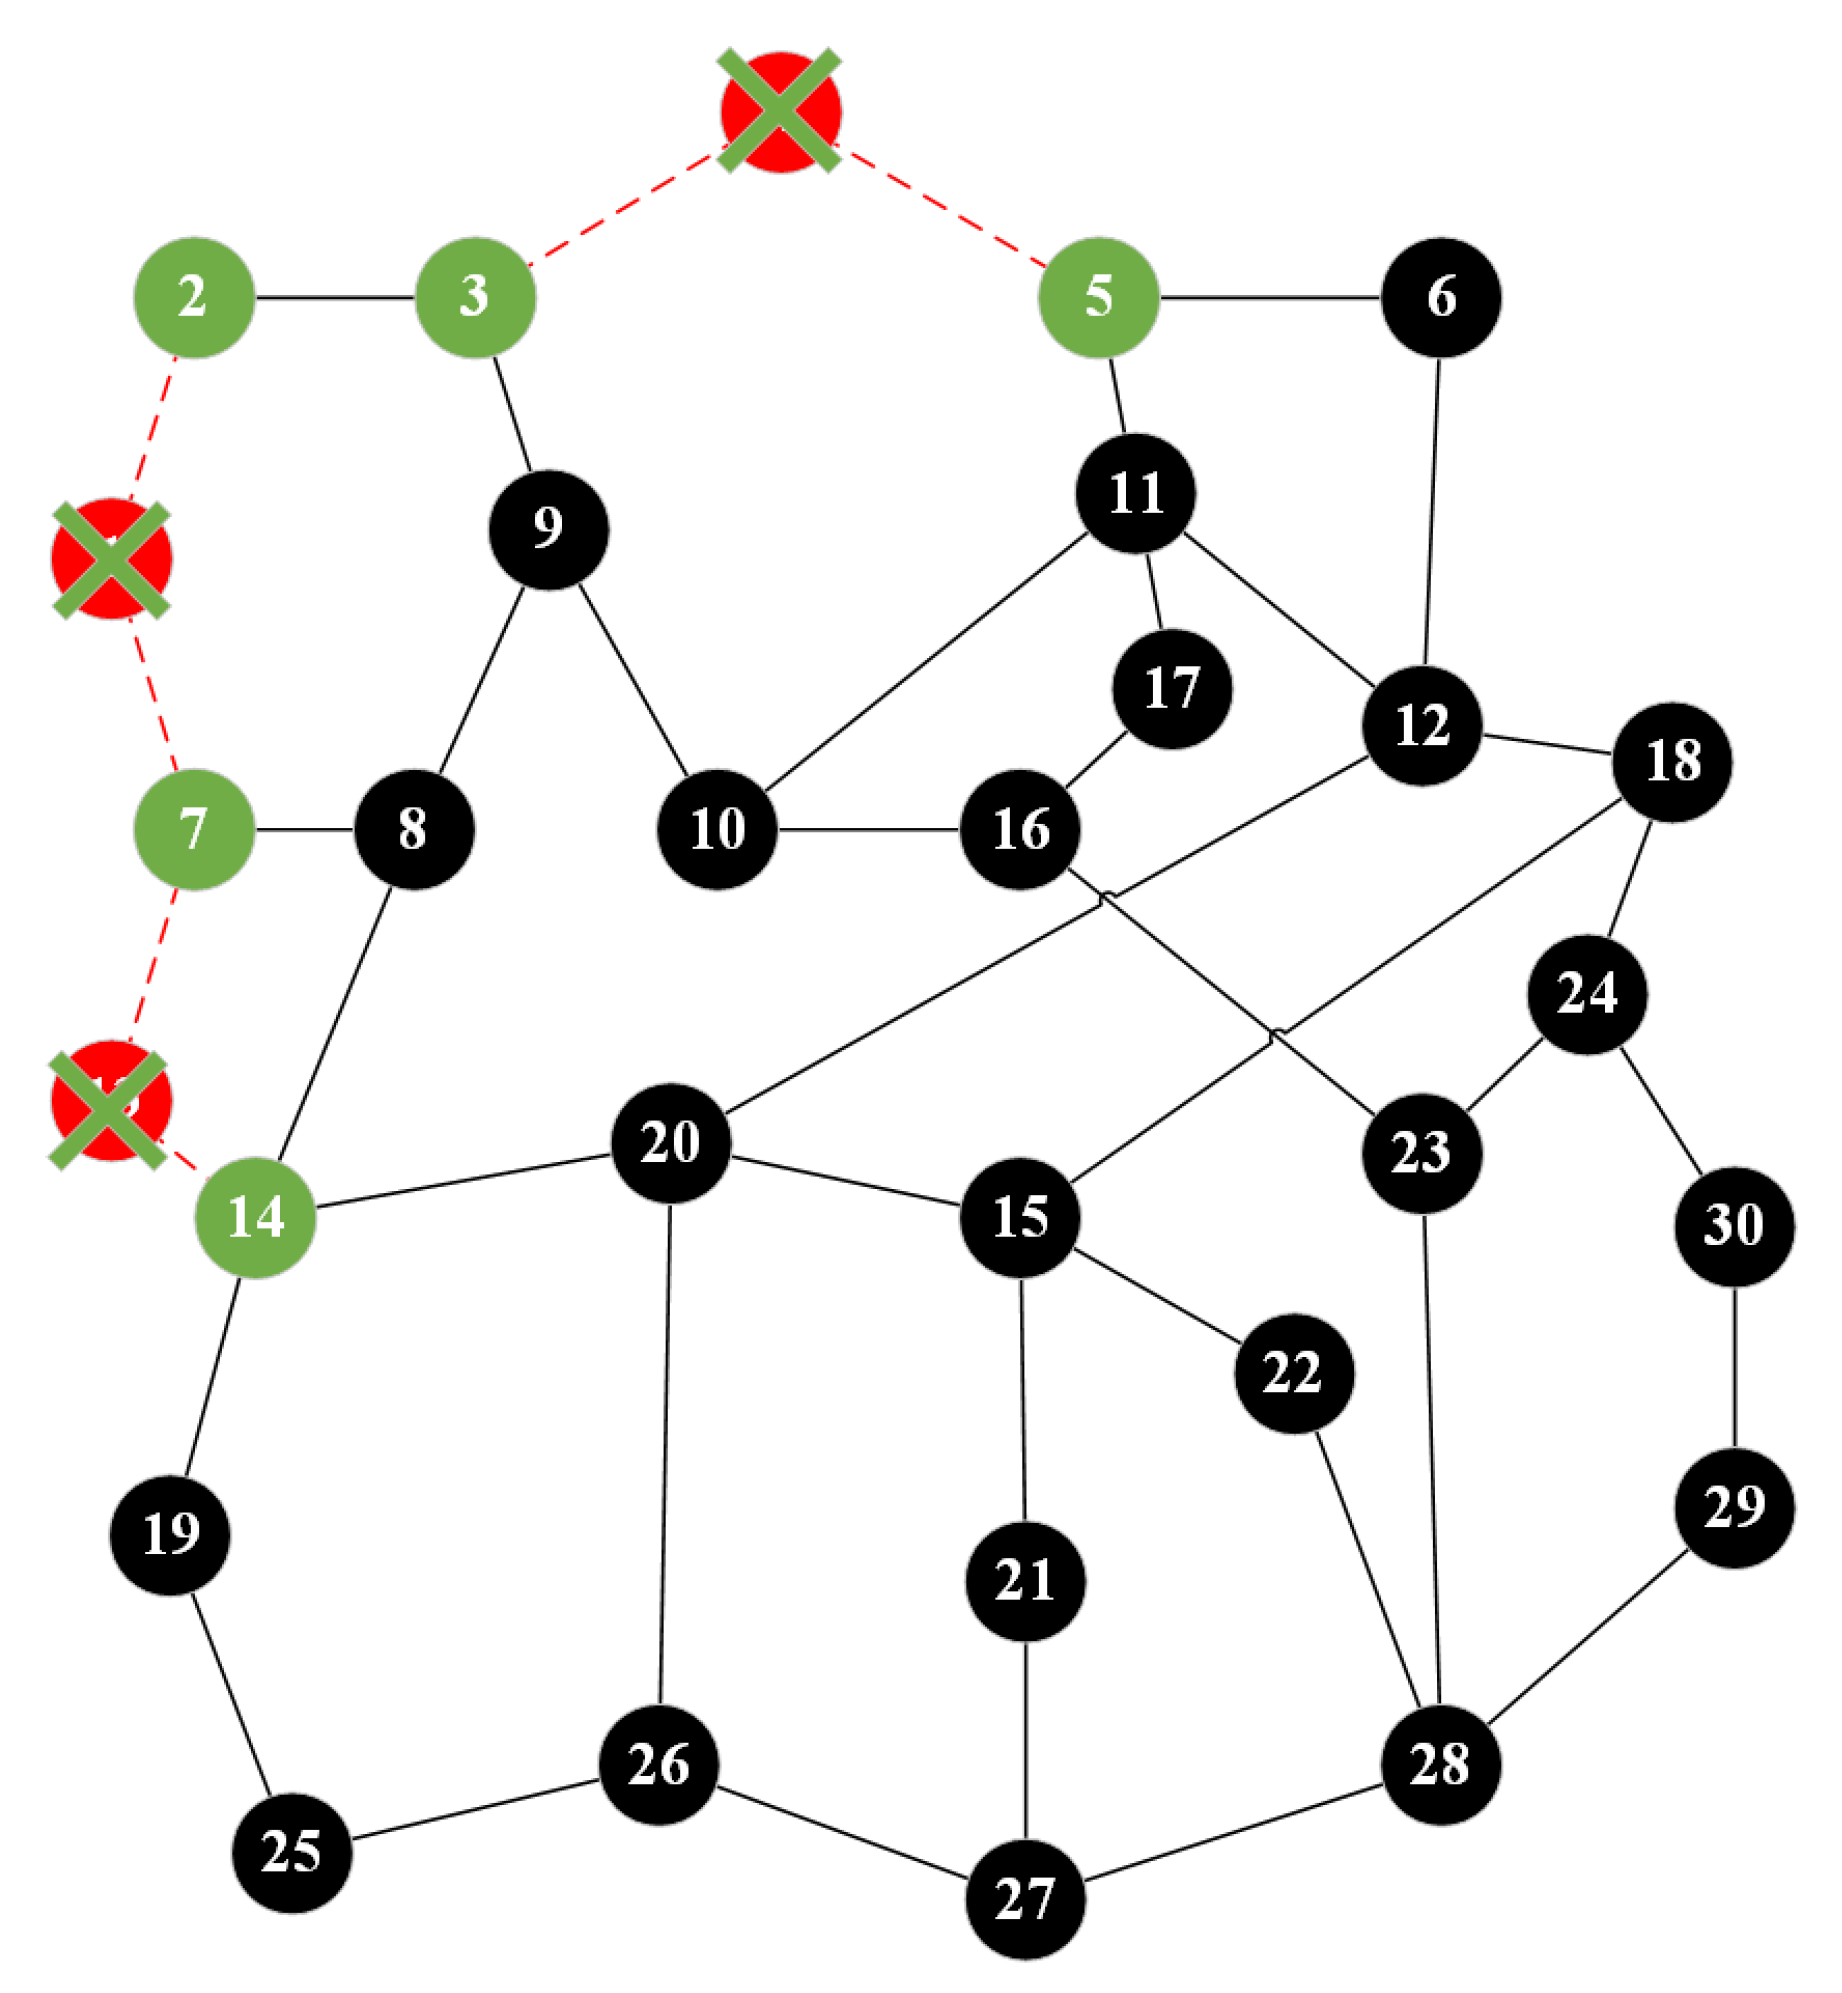
5.1. Random Failure Scenario

Random failures refer to failures caused by unpredictable or incidental events. For example, the aging of system components, unplanned equipment malfunctions, or sudden environmental changes (such as extreme temperature or humidity fluctuations) can lead to such failures. These failures are often random, discontinuous, and cannot be fully prevented by simple preventive measures. As shown in Figure 9, nodes 1, 4, and 13 experience failures, causing a slight decrease in overall network connectivity.
During data transmission in the upper-left region of the network, some degree of congestion is observed. The modeling of this scenario involves assigning an infinite communication cost to the failed nodes, indicating that they are unable to communicate. Therefore, the communication cost matrix for this network is as follows:
W = w 11 w 12 w 1 n w 21 w 22 w 2 n w n 1 w n 2 w n n ; W 1 , : = inf ; W : , 1 = inf W 4 , : = inf ; W : , 4 = inf W 13 , : = inf ; W : , 13 = inf ,

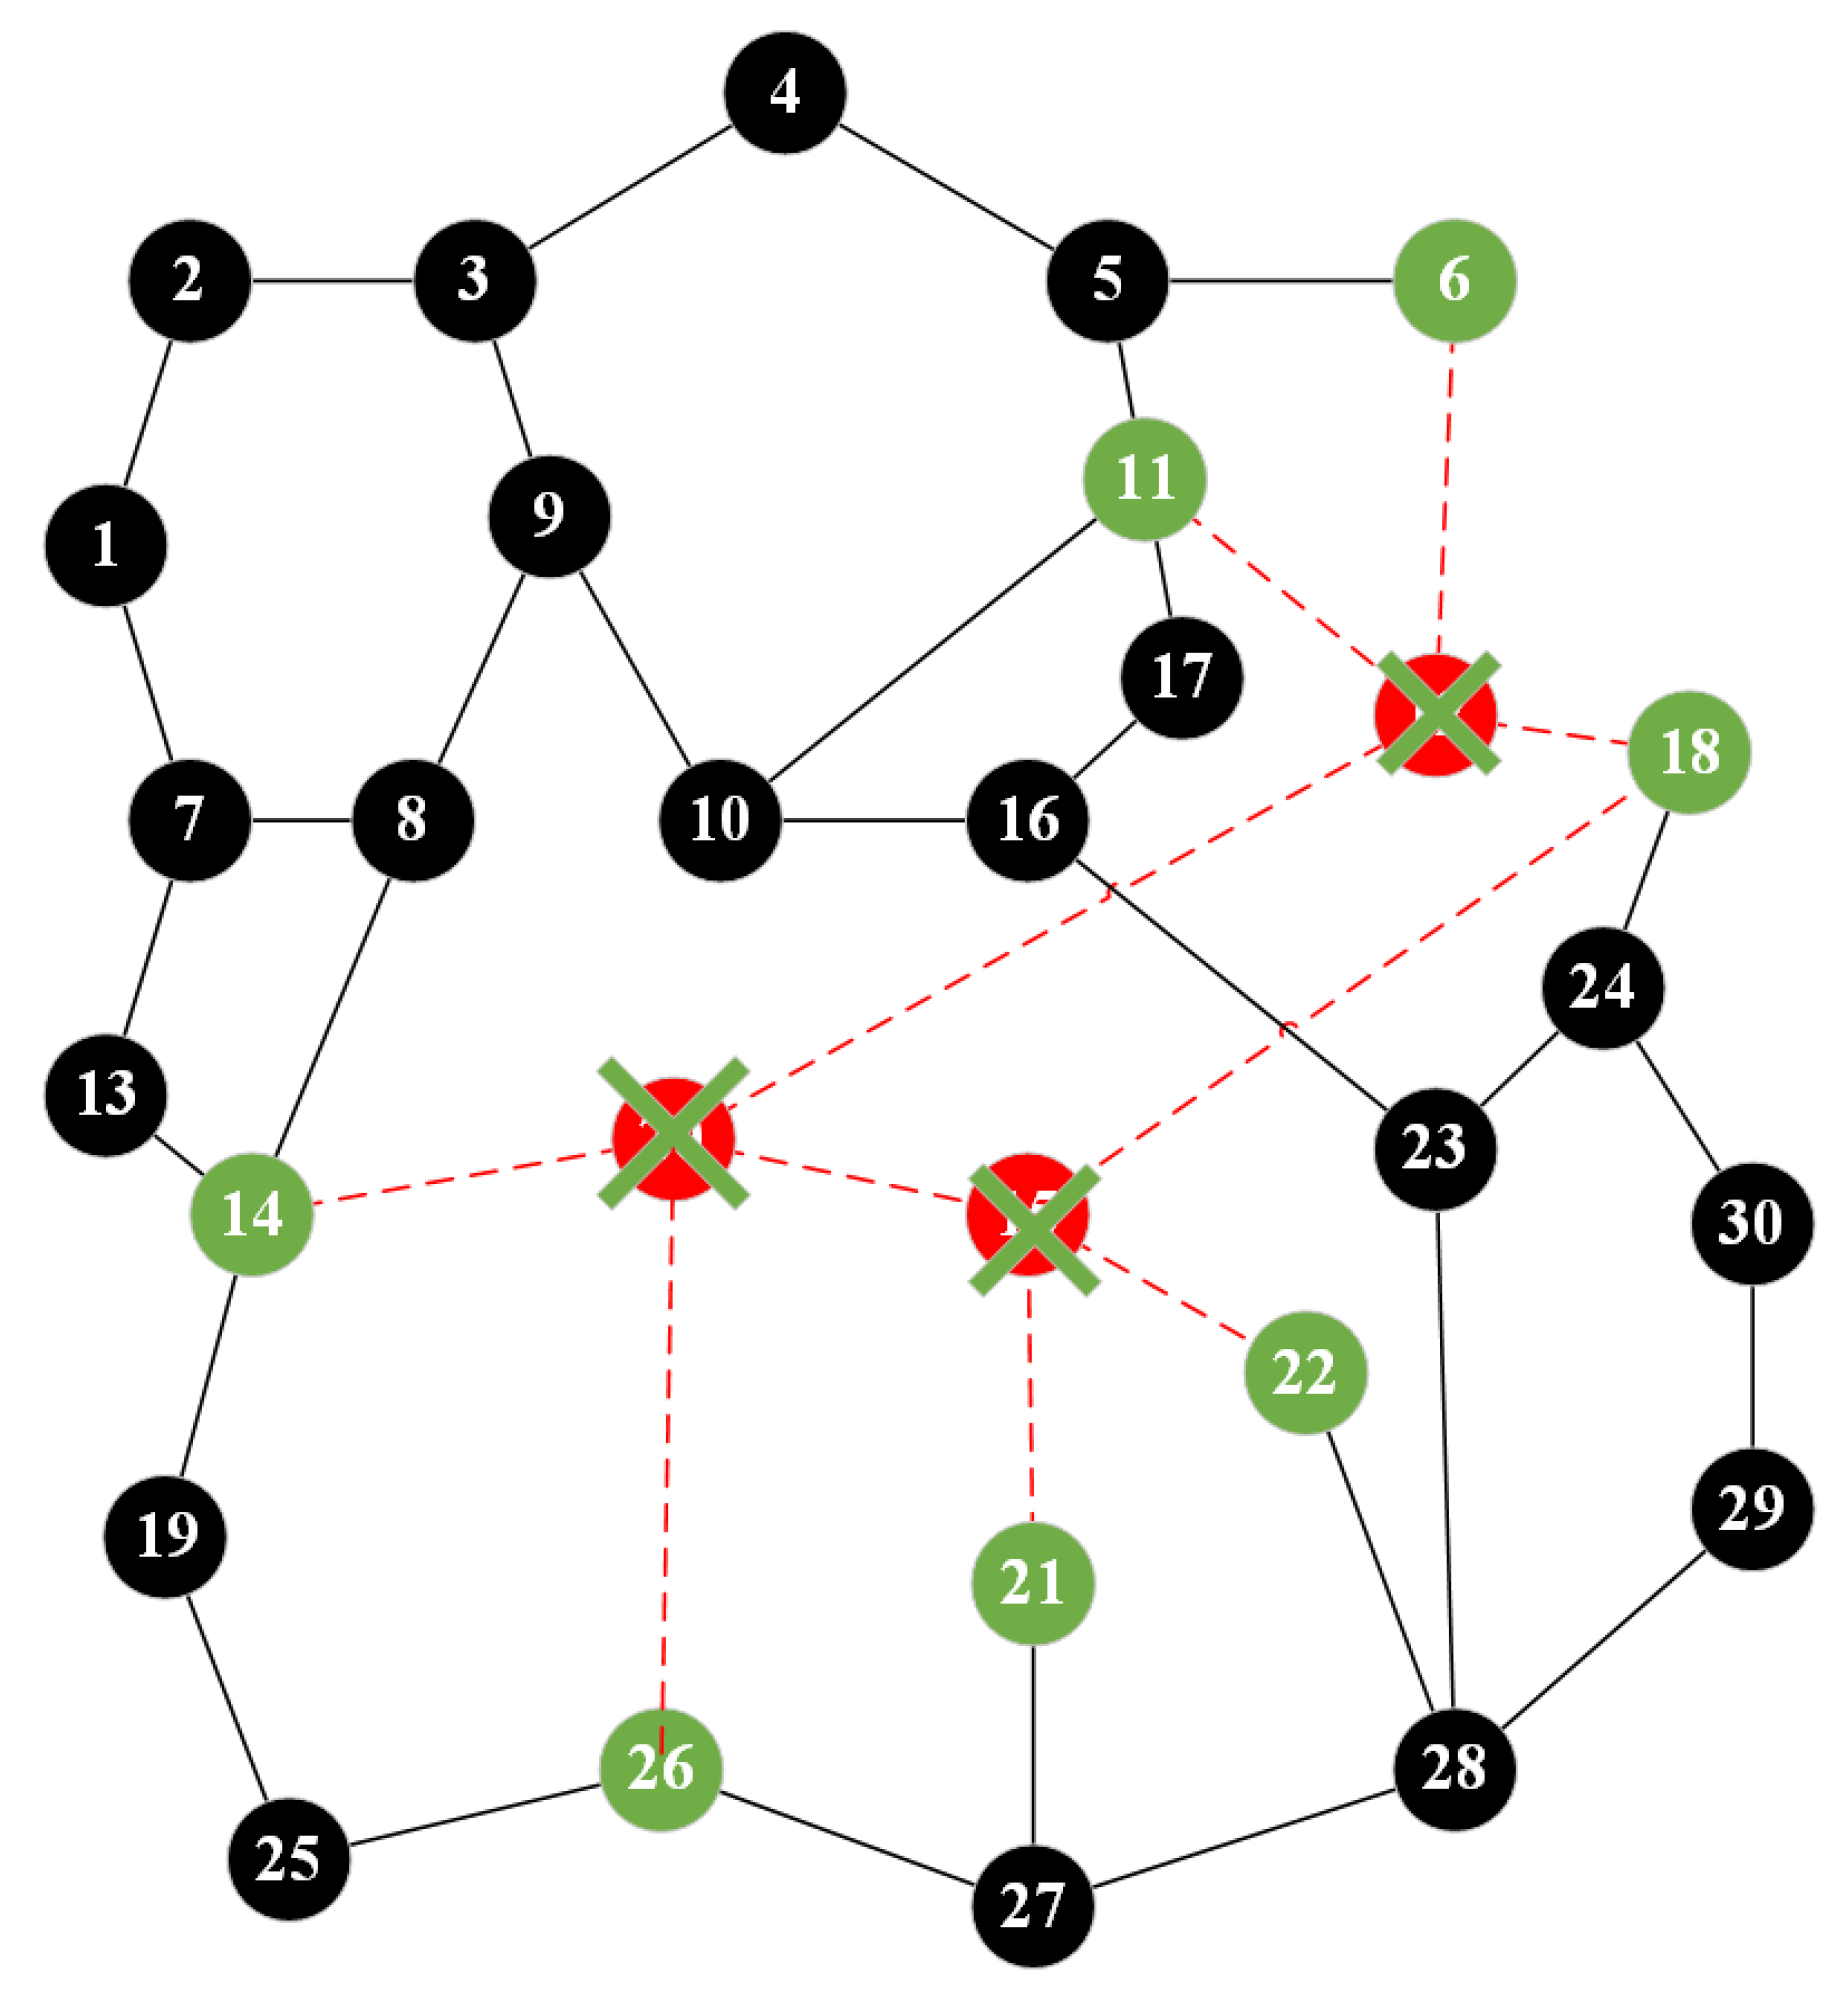
5.2. Deliberate Attack Scenario

Deliberate attacks refer to intentional acts of aggression perpetrated by adversaries or malicious users with the objective of damaging or sabotaging the system. These attacks may include network-based assaults, physical attacks, or destructive actions through internal threats, as illustrated in Figure 10.
The failure of nodes 12, 15, and 20 leads to a significant degradation in overall network connectivity, even resulting in the emergence of disconnected regions within the network. To model this scenario, the communication cost of the failed nodes is assigned an infinite value, signifying that communication is no longer feasible through these nodes. Consequently, the communication cost matrix for this network is as follows:
W = w 11 w 12 w 1 n w 21 w 22 w 2 n w n 1 w n 2 w n n ; W 12 , : = inf ; W : , 12 = inf W 15 , : = inf ; W : , 15 = inf W 20 , : = inf ; W : , 20 = inf ,

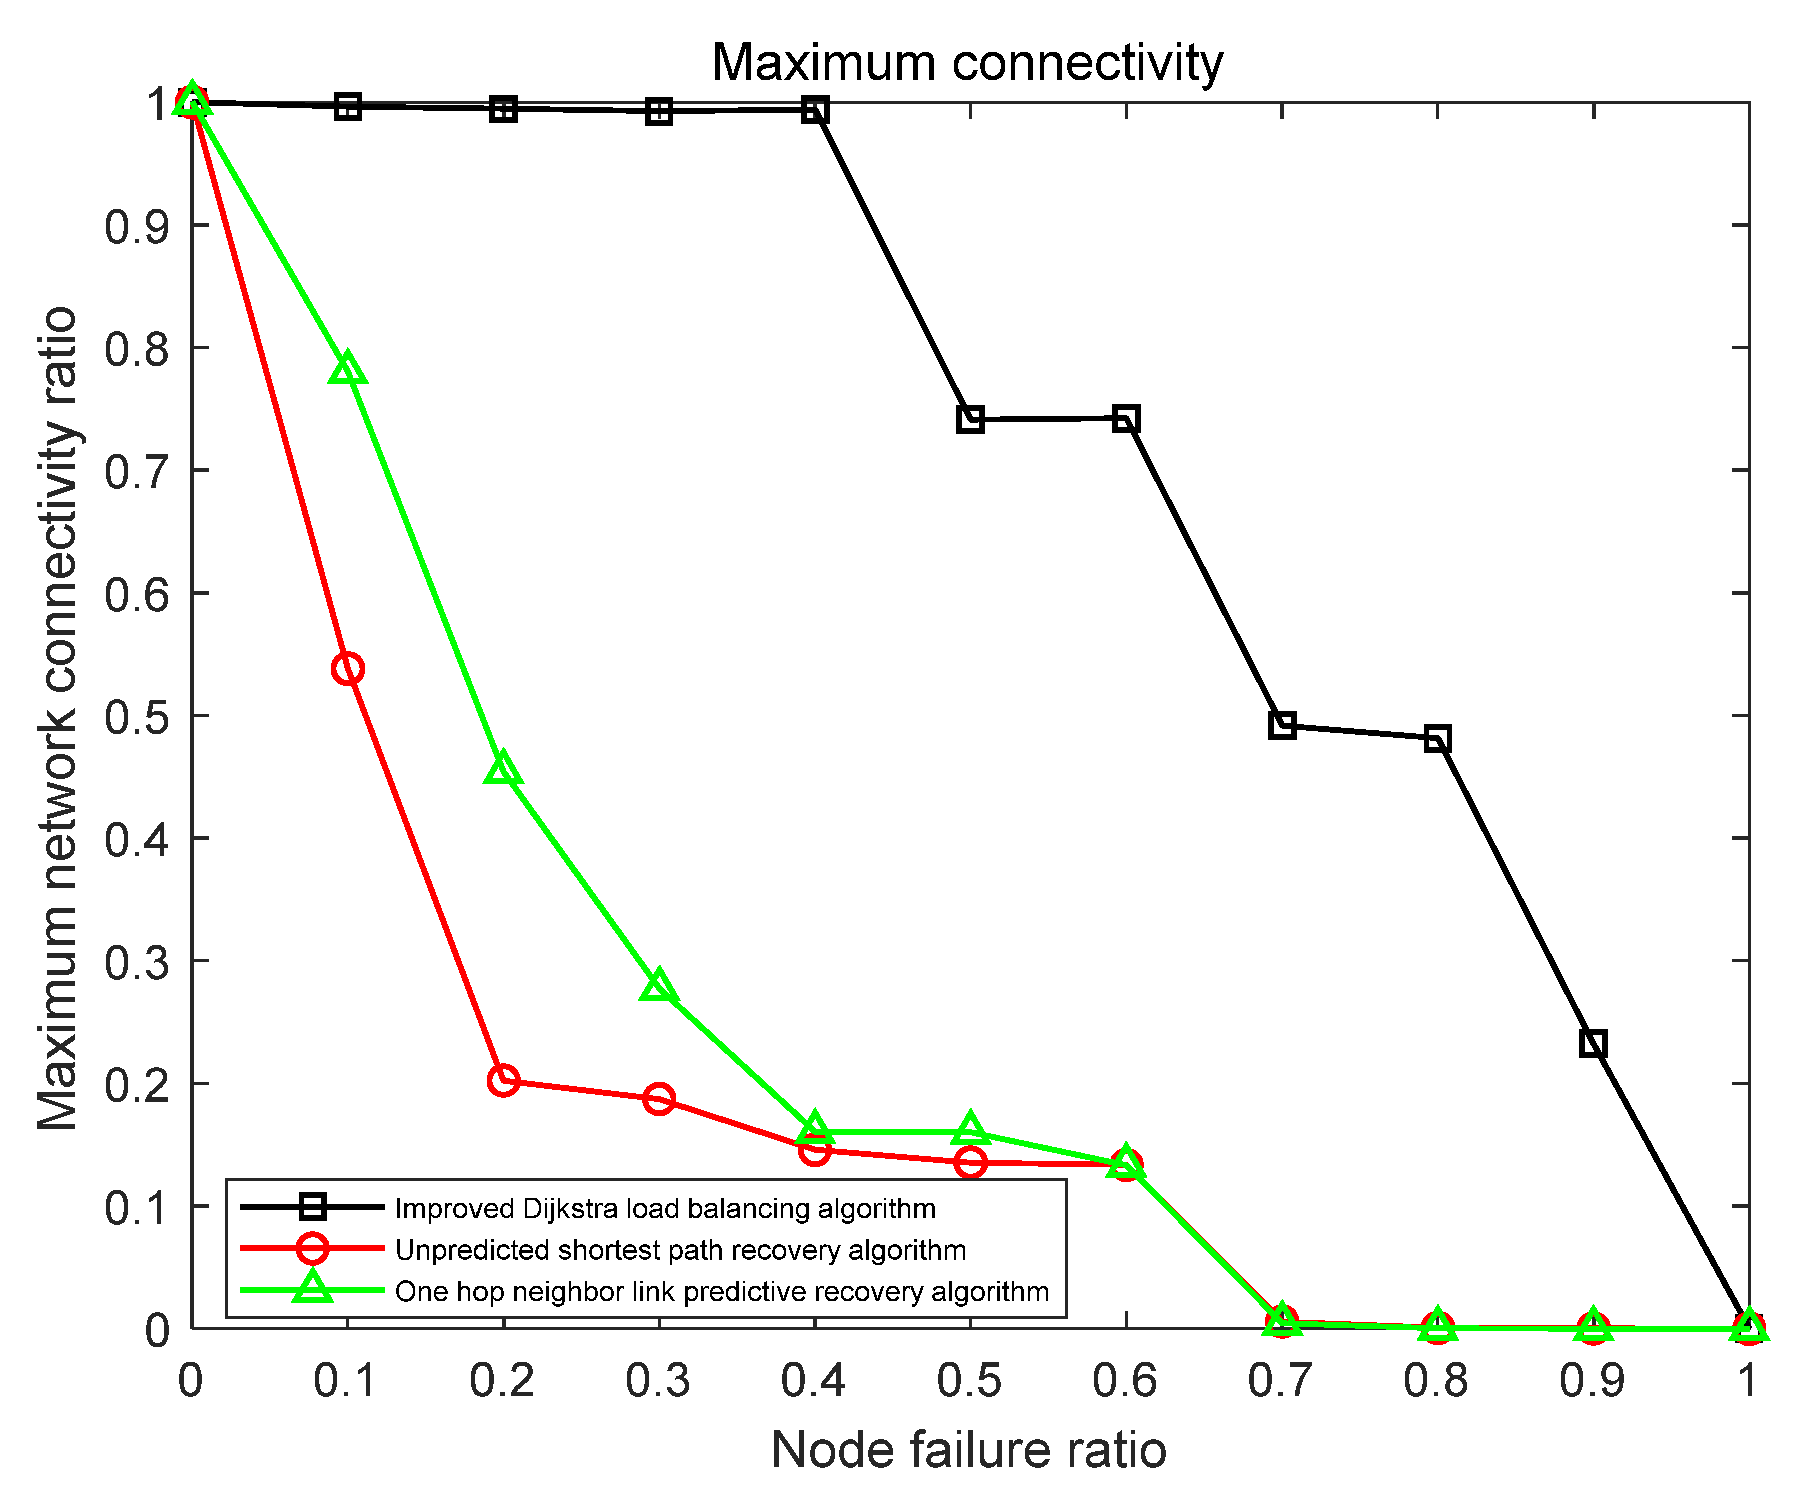
5.3. Performance Comparison

The survivability and fault tolerance of a network are critical metrics for assessing the ability of a communication network to maintain its functionality and performance in the face of various external threats and internal failures. These attributes are particularly crucial for air–sea cross-domain communication networks, which often operate in complex and dynamic environments and are subject to a diverse range of threat sources. Both survivability and fault tolerance refer to the network’s capacity to continue functioning and provide services despite attacks, failures, or other anomalous conditions.
In this study, the maximum connectivity ratio (C) is selected as the key performance metric, defined as the ratio of the number of nodes in the largest connected subgraph to the total number of nodes in the network, as shown in Equation (27). This metric quantifies the ability of the network to maintain connectivity after node failures and reflects the resilience and recovery capability of the network under partial node failures. By comparing the results of different algorithms under random failure and deliberate attack scenarios, this paper aims to assess the effectiveness of each algorithm in maintaining and restoring network connectivity, thereby providing a basis for selecting the optimal recovery strategy.
C = n n ,
where  n  is the number of nodes of the most connected subgraph, and n represents the total number of nodes in the air–sea cross-domain communication network.
Next, we compare the maximum network connectivity of the proposed algorithm with that of the unpredicted shortest path recovery algorithm and the one-hop neighbor link prediction recovery algorithm, as shown in Figure 11. It can be seen that the maximum network connectivity ratio of the three algorithms decreases with the increase in the proportion of failed nodes. The proposed algorithm comprehensively considers the connectivity restoration between all affected nodes, so it can maintain the connectivity of the network when the proportion of failed nodes is small. Its performance in network connectivity recovery is better than that of the other two classical algorithms.
As illustrated in Figure 12, the change in the maximum network connectivity under different node failure scales is presented. It is evident that as the proportion of failed nodes increases, the maximum connectivity ratio of all three algorithms decreases. In comparison with Figure 11, the network connectivity of the unpredicted shortest path recovery algorithm and the one-hop neighbor link prediction recovery algorithm decreases more significantly. This is due to the malicious nature of deliberate attacks, which specifically target nodes of higher importance within the network, resulting in more severe network damage compared to random failures. The proposed improved Dijkstra–load-balancing algorithm demonstrates superior fault tolerance compared to both the no-prediction shortest path recovery algorithm and the one-hop neighbor link prediction recovery algorithm. When the proportion of failed nodes is less than 0.4, this algorithm is capable of maintaining the overall network connectivity. Furthermore, as the failure rate increases, the decline in connectivity is more gradual, outperforming the other two algorithms.

6. Conclusions

This paper proposes a link selection scheme based on improved Dijkstra and load balancing to address the problem of decreased network connectivity caused by multi-node failure in air–sea cross-domain communication networks. The stability and reliability of the network have been improved to a certain extent. Simulation results show that the algorithm can achieve network recovery. As shown in Table 2, the algorithm not only optimizes the number of reconnected links but also significantly improves the balanced allocation of link load. In addition, compared with the classical network recovery algorithm, the algorithm can maintain the network connectivity well in the two scenarios of random node failure and intentional attack failure. As shown in Figure 11 and Figure 12, the algorithm can still maintain the overall connectivity of the network under large-scale network damage and significantly improve the overall stability and reliability of the network.

Author Contributions

Conceptualization, Z.S. and H.Z.; methodology, Z.S.; validation, H.Z. and Z.S.; formal analysis, H.Z. and J.Y.; writing—original draft preparation, H.Z. and J.Y.; writing—review and editing, H.Z. All authors have read and agreed to the published version of the manuscript.

Funding

This research was funded by the National Key Research and Development Program of China, grant number 2023YFC2810200, Fundamental Research Funds for Central Universities of China, grant number 3072023CFJ0502, Innovation Fund Project of Marine Defense Technology Innovation Center in China, grant number JJ-2023-715-02, and Sanya Science and Technology Innovation Project of China, grant number 2022KJCX33.

Data Availability Statement

Owing to the policies and confidentiality agreements adhered to in our laboratory, we regretfully cannot furnish the data.

Conflicts of Interest

The authors declare no conflict of interest.

Abbreviations

The following abbreviations are used in this manuscript:
UAVunmanned aerial vehicle
USVunmanned surface vessels
UUVunmanned underwater vehicles

References

  1. Shang, Z.G.; Zhang, H.Y.; Liu, S.Z.; Qiao, G.; Yu, H.; Miao, B.; Ma, L.; Wang, Z. Research Progress and Development Trend of Air-Sea Cross-domain Communication. J. Unmanned Undersea Syst. 2024, 32, 592–610. [Google Scholar]
  2. Xing, M.H.; Shang, Z.G.; Qiao, G.; Zhou, F.; Nie, D.; Zhang, T.; Li, T.; Xie, J. Cross-Domain Communication Buoy System Based on Optimal Communication Link Selection. J. Unmanned Undersea Syst. 2024, 32, 650–658. [Google Scholar]
  3. Yazıcıoğlu, A.Y.; Egerstedt, M.; Shamma, J.S. Formation of robust multi-agent networks through self-organizing random regular graphs. IEEE Trans. Netw. Sci. Eng. 2015, 2, 139–151. [Google Scholar] [CrossRef]
  4. Zhang, J. Multi-UAV Collaborative Surveillance Network Recovery via Deep Reinforcement Learning. IEEE Internet Things J. 2024, 11, 34528–34540. [Google Scholar] [CrossRef]
  5. Xing, M.; Deng, H.; Han, R. ICN-Oriented Mobility Support Method for Dynamic Allocation of Mobile Data Flows. Electronics 2023, 12, 1701. [Google Scholar] [CrossRef]
  6. Vijaya Vardan Reddy, S.P.; Kishore, V.V.; Diwakaran, S.; Sujatha, V.; Jayakumar, T. A Robust Design of Fault Nodes Identification and Recovery Model Over Wireless Sensor Network. In Proceedings of the Ninth International Conference on Science Technology Engineering and Mathematics (ICONSTEM), Chennai, India, 4–5 April 2024; pp. 1–7. [Google Scholar]
  7. Caleb, S.; Thangaraj, S.J.J. Enhancing Fault Tolerance in Wireless Mesh Networks through Adaptive and Resilient Routing Protocols. In Proceedings of the 2023 International Conference on Data Science, Agents & Artificial Intelligence (ICDSAAI), Chennai, India, 21–23 December 2023; pp. 1–6. [Google Scholar]
  8. Hu, P.; Xue, H.; Wu, C.; Guo, M.; Li, J.; Chen, X.; Liu, S.; Zhou, L.; Xie, S. HGR: A Hybrid Global Graph-Based Recovery Approach for Cloud Storage Systems with Failure and Straggler Nodes. In Proceedings of the 44th International Conference on Distributed Computing Systems (ICDCS), Jersey City, NJ, USA, 23–26 July 2024; pp. 750–761. [Google Scholar]
  9. Wójcik, R.; Domżał, J.; Duliński, Z. Flow-aware multi-topology adaptive routing. IEEE Commun. Lett. 2014, 18, 1539–1542. [Google Scholar] [CrossRef]
  10. Menth, M.; Martin, R. Network resilience through multi-topology routing. In Proceedings of the Fifth International Workshop on Design of Reliable Communication Networks, Naples, Italy, 16–19 October 2005; pp. 271–277. [Google Scholar]
  11. Gardner, M.T.; May, R.; Beard, C.; Medhi, D. Using multi-topology routing to improve routing during geographically correlated failures. In Proceedings of the 2014 10th International Conference on the Design of Reliable Communication Networks (DRCN), Ghent, Belgium, 1–3 April 2014; pp. 1–8. [Google Scholar]
  12. Cevher, S.; Ulutas, M.; Altun, S.; Hokelek, I. Multi topology routing based IP fast re-route for software defined networks. In Proceedings of the 2016 IEEE Symposium on Computers and Communication (ISCC), Messina, Italy, 27–30 June 2016; pp. 1224–1226. [Google Scholar]
  13. Zhang, R.Y.; Xiao, G.Y.; Shan, Q.H.; Zou, T.; Li, D.; Teng, F. Communication topology reconstruction method for multi-agent cooperative control in polymorphic networks. J. Commun. 2022, 43, 50–59. [Google Scholar]
  14. Qin, N.N.; Wu, D.E.; Yu, Y.H. A double connectivity recovery algorithm in partition based on backbone polygon in sensor networks. Comput. Eng. Sci. 2017, 39, 673. [Google Scholar]
  15. Ma, G.Z. Fault-Tolerant Topology Control and Connectivity Restorantion in Wireless Sensor Networks. Ph.D. Thesis, Beijing University of Posts and Telecommunications, Beijing, China, 2017. [Google Scholar]
  16. Kang, Z.; Zeng, H.; Hu, H.; Xiong, Q.; Xu, G. Multi-objective optimized connectivity restoring of disjoint segments using mobile data collectors in wireless sensor network. EURASIP J. Wirel. Commun. Netw. 2017, 2017, 65. [Google Scholar] [CrossRef]
  17. Du, R.; Fei, H.; W Zhang, W. Research and Design of a SpaceWire Network Dynamic Reconfiguration Method Based on Dijkstra Algorithm. In Proceedings of the 2016 9th International Symposium on Computational Intelligence and Design (ISCID), Hangzhou, China, 10–11 December 2016; pp. 168–173. [Google Scholar]
  18. Jabarulla Mohammed, M.; Asim Basha, M. Shortest Path Problem under Pythagorean Fuzzy Network Using Dijkstra’s Algorithm. Asian Res. J. Math. 2024, 10, 47–57. [Google Scholar] [CrossRef]
  19. Wang, N.; Ho, K.H.; Pavlou, G. AMPLE: An adaptive traffic engineering system based on virtual routing topologies. IEEE Commun. Mag. 2012, 50, 185–191. [Google Scholar] [CrossRef]
  20. Altenhofen, K.; Zobel, J.; Scheuermann, B. Increasing Network Resilience Through Dynamic Routing with Disjoint Paths. In Proceedings of the 2024 IFIP Networking Conference (IFIP Networking), Thessaloniki, Greece, 3–6 June 2024; pp. 23–31. [Google Scholar]
  21. Willis, P.; Shenoy, N.; Hamilton, J.; Pan, Y. Resiliency in Networks Through Meshed Trees. In Proceedings of the 15th International Conference on Network of the Future (NoF), Castelldefels, Spain, 2–4 October 2024; pp. 45–53. [Google Scholar]
  22. Zuo, J.X. Research on Topological Reconstruction of UAV Swarm Network and Key Technology. Master’s Thesis, Xi’an Technological University, Xi’an, China, 2022. [Google Scholar]
  23. Chen, M.; Wang, H.; Chang, C.Y.; Wei, X. SIDR: A swarm intelligence-based damage-resilient mechanism for UAV swarm networks. IEEE Access 2020, 8, 77089–77105. [Google Scholar] [CrossRef]
  24. Cui, Y.N.; Ren, J.; Du, W.C. Network topology optimization control algorithm for multiple unmanned surface vehicle. Control Theory Appl. 2016, 33, 1639–1649. [Google Scholar]
  25. Chouikhi, S.; El Korbi, I.; Ghamri-Doudane, Y.; Saidane, L.A. Distributed connectivity restoration in multichannel wireless sensor networks. Comput. Netw. 2017, 127, 282–295. [Google Scholar] [CrossRef]
  26. Pliatsios, D. Comparison of Swarm Intelligence Methods for Joint Resource Orchestration in Open Radio Access Network. In Proceedings of the 14th International Symposium on Communication Systems, Networks and Digital Signal Processing (CSNDSP), Rome, Italy, 17–19 July 2024; pp. 632–637. [Google Scholar]
  27. Volovoda, T. Swarm Intelligence for UAV. In Proceedings of the 7th International Conference on Actual Problems of Unmanned Aerial Vehicles Development (APUAVD), Kyiv, Ukraine, 22–24 October 2024; pp. 313–316. [Google Scholar]
  28. Bondy, J.A.; Murty, U.S.R. Graph Theory; Springer: Berlin/Heidelberg, Germany, 2008. [Google Scholar]
  29. Xie, N.; Wang, R. A historic Review of Grey Forecasting Models. J. Grey Syst. 2017, 29, 1–29. [Google Scholar]
  30. Gharehchopogh, F.S.; Gholizadeh, H. A comprehensive survey: Whale Optimization Algorithm and its applications. Swarm Evol. Comput. 2019, 48, 1–24. [Google Scholar] [CrossRef]
Figure 1. Schematic diagram of air–sea cross-domain communication network.
Applsci 15 03956 g001
Figure 2. Map of air–sea cross-domain communication network.
Applsci 15 03956 g002
Figure 3. The diagram illustrating the relative motion between nodes.
Applsci 15 03956 g003
Figure 4. Algorithmic process for path selection.
Applsci 15 03956 g004
Figure 5. Node location map of air–sea cross-domain communication network.
Applsci 15 03956 g005
Figure 6. Initial network topology diagram of air–sea cross-domain communication network (top view).
Applsci 15 03956 g006
Figure 7. Network topology diagram after multi-node failure.
Applsci 15 03956 g007
Figure 8. The restored network topology diagram: (a) minimum communication cost algorithm; (b) load-balancing algorithm.
Applsci 15 03956 g008
Figure 9. Topology of air–sea cross-domain communication networks with random failures.
Applsci 15 03956 g009
Figure 10. Topology of air–sea cross-domain communication networks with deliberate attack.
Applsci 15 03956 g010
Figure 11. The maximum network connectivity in random failure scenarios.
Applsci 15 03956 g011
Figure 12. The maximum network connectivity in a deliberate attack scenario.
Applsci 15 03956 g012
Table 1. Path quality table between nodes in  V recover .
StartEndShortest PathPath Quality
101510→1517.33
101710→1710.40
102410→17→2420.28
102810→17→2826.99
151715→1711.92
152415→2420.04
152815→2816.35
172417→249.88
172817→2816.59
242824→2816.21
Table 2. Comparison before and after load optimization.
Number of LinksAverage LoadLoad Variance
Minimum communication cost algorithm163.20.675
Load-balancing optimization algorithm410
Disclaimer/Publisher’s Note: The statements, opinions and data contained in all publications are solely those of the individual author(s) and contributor(s) and not of MDPI and/or the editor(s). MDPI and/or the editor(s) disclaim responsibility for any injury to people or property resulting from any ideas, methods, instructions or products referred to in the content.

