Article

Numerical Investigation of Axial Velocity Uniformity in Porous Medium of Gasoline Particulate Filters

State Key Laboratory of Engines, Tianjin University, Tianjin 300072, China
*
Author to whom correspondence should be addressed.
Appl. Sci. 2025, 15(7), 3854; https://doi.org/10.3390/app15073854
Submission received: 18 February 2025 / Revised: 27 March 2025 / Accepted: 29 March 2025 / Published: 1 April 2025

Abstract

:
In order to meet new real-world emissions standards and reduce particulates emitted by GDI engines, automakers are increasingly adopting gasoline particulate filters (GPFs). The uniformity of axial permeation velocity through porous medium in GPFs significantly impacts filtration efficiency. Consequently, a three-dimensional single-channel GPF–CFD model is developed to investigate the impact of partition coatings and pins on flow characteristics. Different coating amounts are compared by adjusting porosity using a single-channel GPF model, with pins strategically placed along the upper and lower sides of the inlet channel. Simulation results indicate that optimizing porosity and length across different coated sections enhances the consistency of axial permeation velocity, particularly when the ratio of coated length falls within the range of 30–40%. Pins reduce the axial variance by increasing permeation velocity near the inlet surface, with a symmetrical arrangement of four pairs and a height of 0.3 mm yielding optimal performance. Moreover, the combination of partitions and pins shows potential to improve maximum homogeneity by approximately 75%.

1. Introduction

Due to the escalating impact of global warming, direct injection spark ignition (DISI) gasoline engines have gained widespread adoption over the past decade owing to their potential for improving fuel efficiency and reducing carbon dioxide emissions [1]. However, previous studies have demonstrated that DISI leads to increased ultra-fine particle levels, which can potentially affect respiratory and cardiovascular systems [2], compared to traditional port fuel injection (PFI) [3,4]. Governments worldwide have implemented stringent regulations to limit particulate emissions from gasoline engines. The Euro 6 regulation strictly limits particulate number (PN) emissions to a maximum of 6 × 10¹¹ #·km−1. China has also implemented PN restrictions since 2020 [5]. It is essential to implement measures to reduce particle emissions.
The utilization of particulate filters spans over four decades [6]. The initial purpose of the design was to mitigate the particles in diesel exhaust. Since 2007, diesel particulate filters (DPFs) have been extensively integrated into diesel engines. They exhibit a remarkable efficiency in reducing diesel particulate emissions by nearly 100% [7,8]. Particulate filters primarily operate through two stages: deep-bed filtration and cake-layer filtration. Once a cake layer forms on the porous medium, particles encounter increased difficulty in penetrating both the cake layer and the underlying porous structure. In this context, the larger particle size of diesel exhaust promotes the formation of a cake layer on the porous medium surface, thereby enhancing filtration efficiency [9]. Consequently, particulate filters are implemented into after-treatment systems to reduce particle emissions from gasoline engines [10]. In contrast, gasoline engine exhausts exhibit higher levels of ultra-fine particles (<100 nm) but lower total quantities [11], which presents challenges for achieving cake layer formation. The experimental data indicates that the DPF can achieve nearly complete filter capture of larger particles. For particles smaller than 10 nm, the collection efficiency decreases to 40–50% [12]. The capture of ultra-fine particles primarily depends on Brownian diffusion mechanisms. Nevertheless, the relatively large pore size and limited number of pores in the DPF contribute to reduced efficiency in Brownian diffusion capture. Furthermore, the higher exhaust temperature and the change in the physical and chemical properties of particles from gasoline engines intensify both active and passive regeneration processes within GPF [13,14], thereby increasing the difficulty of filter cake-layer formation [15,16]. Hence, further investigation and optimization of porous medium structure should be pursued.
Recent studies have explored various factors influencing GPF performance, including coating materials, structural design, and operational conditions. Lambert et al. [17] conducted a comparative study on fresh empty GPFs and catalyst-coated GPFs, revealing that the filtration efficiency of GPFs can vary significantly (30–85%) depending on the coating material. This variation is attributed to alterations in the porous structure of the GPF, which affect permeation velocities and particle filtration efficiency. Furthermore, apart from permeation velocity, gas flow velocity within the channel also influences GPF performance. An increase in engine exhaust flow and velocity reduces filtration efficiency for most particle sizes [18]. Additionally, Jang et al. [19] optimized the positioning of GPFs in vehicles, demonstrating that placing the GPFs farther away from the engine reduces PN and mass, thereby enhancing filtration efficiency by over 50% in full-cycle tests. This improvement is linked to lower temperatures, reduced inlet velocities, and decreased particle mass compared to GPFs installed closer to the engine.
In parallel with experimental studies, computational modeling has emerged as a powerful tool for understanding GPF mechanisms, reducing experimental costs, and optimizing design parameters. Gong et al. [20,21] developed GPF models based on pore, wall, and channel scales, incorporating experimental data to simulate particles with non-uniform size distributions. The models also accounted for non-uniform radial porosity distributions in porous medium, revealing that particle accumulation predominantly occurs in localized areas at the top of the filter [22,23]. This non-uniform distribution results in fewer particles penetrating the porous medium, thereby optimizing filtration efficiency and pressure drop [15]. Cooper et al. [24] further investigated the impact of inlet gas velocity on GPF performance, demonstrating that axial permeation velocity distribution correlates with the axial distribution of trapped particles. As velocity increases, both distributions become uneven, leading to reduced filtration efficiency [25,26]. To address this, Onori et al. [27] introduced small solid pins into the inlet channels, improving axial flow uniformity and slightly enhancing filtration efficiency. Additionally, the distribution of washcoat on porous medium has been shown to influence permeation velocity and particle filtration, with studies by Walter et al. [28] and Boger et al. [29] highlighting the benefits of high and low coated zones at the front and rear of the filter. Despite these advancements, systematic studies on the combined effects of GPF patterns, coated zones, and pin configurations on axial permeation velocity uniformity and filtration efficiency remain limited.
Numerous methods have been developed to simulate gas flow in the inlet and outlet channels of particulate filters and through the porous medium [30]. Bissett et al. [31] developed a classical one-dimensional flow model, integrating finite element and finite difference methods for spatial discretization, and simulated the deposition and oxidation of PM by solving the mass, momentum, and energy conservation equations. Based on this model, numerous additional approaches have subsequently been employed in constructing particle filtration models, such as the finite volume method for developing the gas flow model of the filter [24] and statistical theory for establishing the micro-heterogeneous porous media model [15] Flow optimization primarily focuses on gas hydrodynamics, specifically examining the impact of porous media on channel flow [24], and particulate fluid dynamics [32]. Additionally, the model structure was refined by incorporating a filter cake layer [33] and an ash layer [4], as well as redesigning the channel structure [34]. As research has progressed, this flow model has evolved from a one-dimensional to a three-dimensional framework. Zhang et al. [35] modified the structure of GPF and constructed a three-dimensional model to further optimize the enhancement of pressure drop and filtration efficiency. Moreover, a comparison between one-dimensional and three-dimensional models conducted by Cooper et al. [27] revealed that the three-dimensional model exhibits superior accuracy, particularly under high inlet flow velocities, and can accurately predict the local gas fluid dynamics. Although existing models effectively simulate gas flow dynamics, they remain inadequate for studying factors influencing axial permeation uniformity, particularly due to high computational complexity and limited simulation accuracy. To address these limitations, the particulate filter structure is optimized, and single-phase flow simulation is adopted to reduce computational load and enhance model tractability, enabling a more efficient analysis of key factors affecting axial permeation uniformity.
Building on these developments, this study develops a three-dimensional single-channel GPF model by Fluent to simulate gas flow dynamics in porous medium. The model incorporates various pin configurations and washcoat distributions on zoned-coated GPFs to investigate their impact on the homogeneity of axial permeation velocity and particle filtration. By analyzing these fluid dynamics, the study aims to elucidate the respective effects and functions of different design parameters, contributing to the optimization of GPF performance.

2. Physical and Mathematical Model
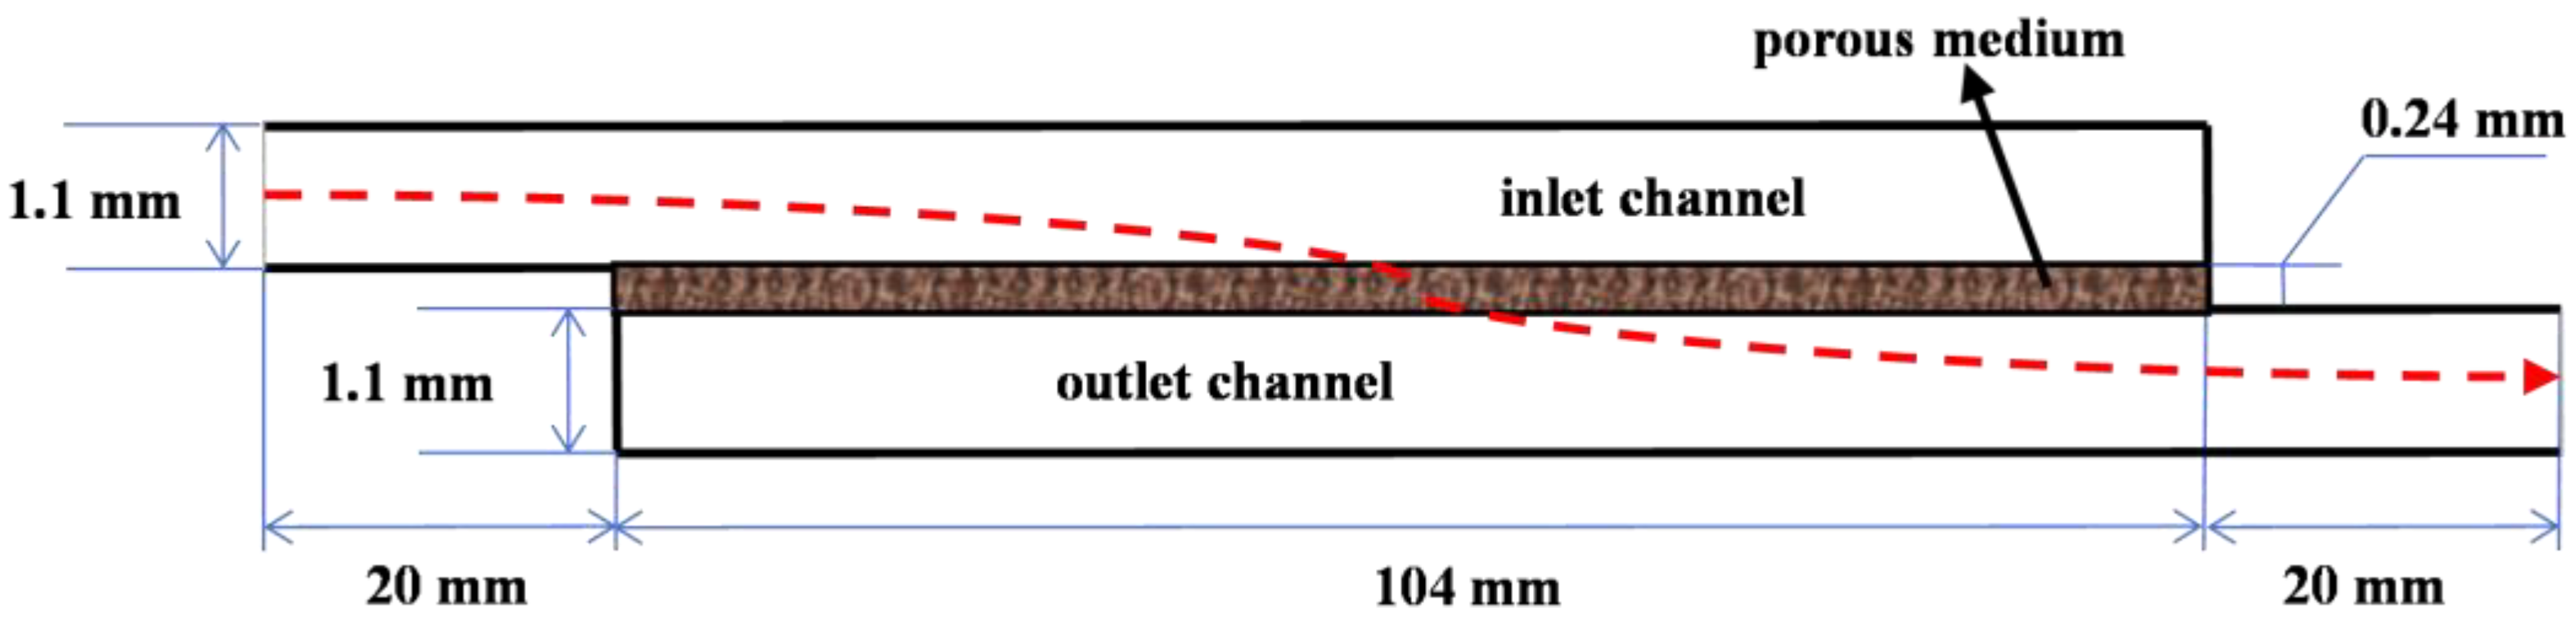
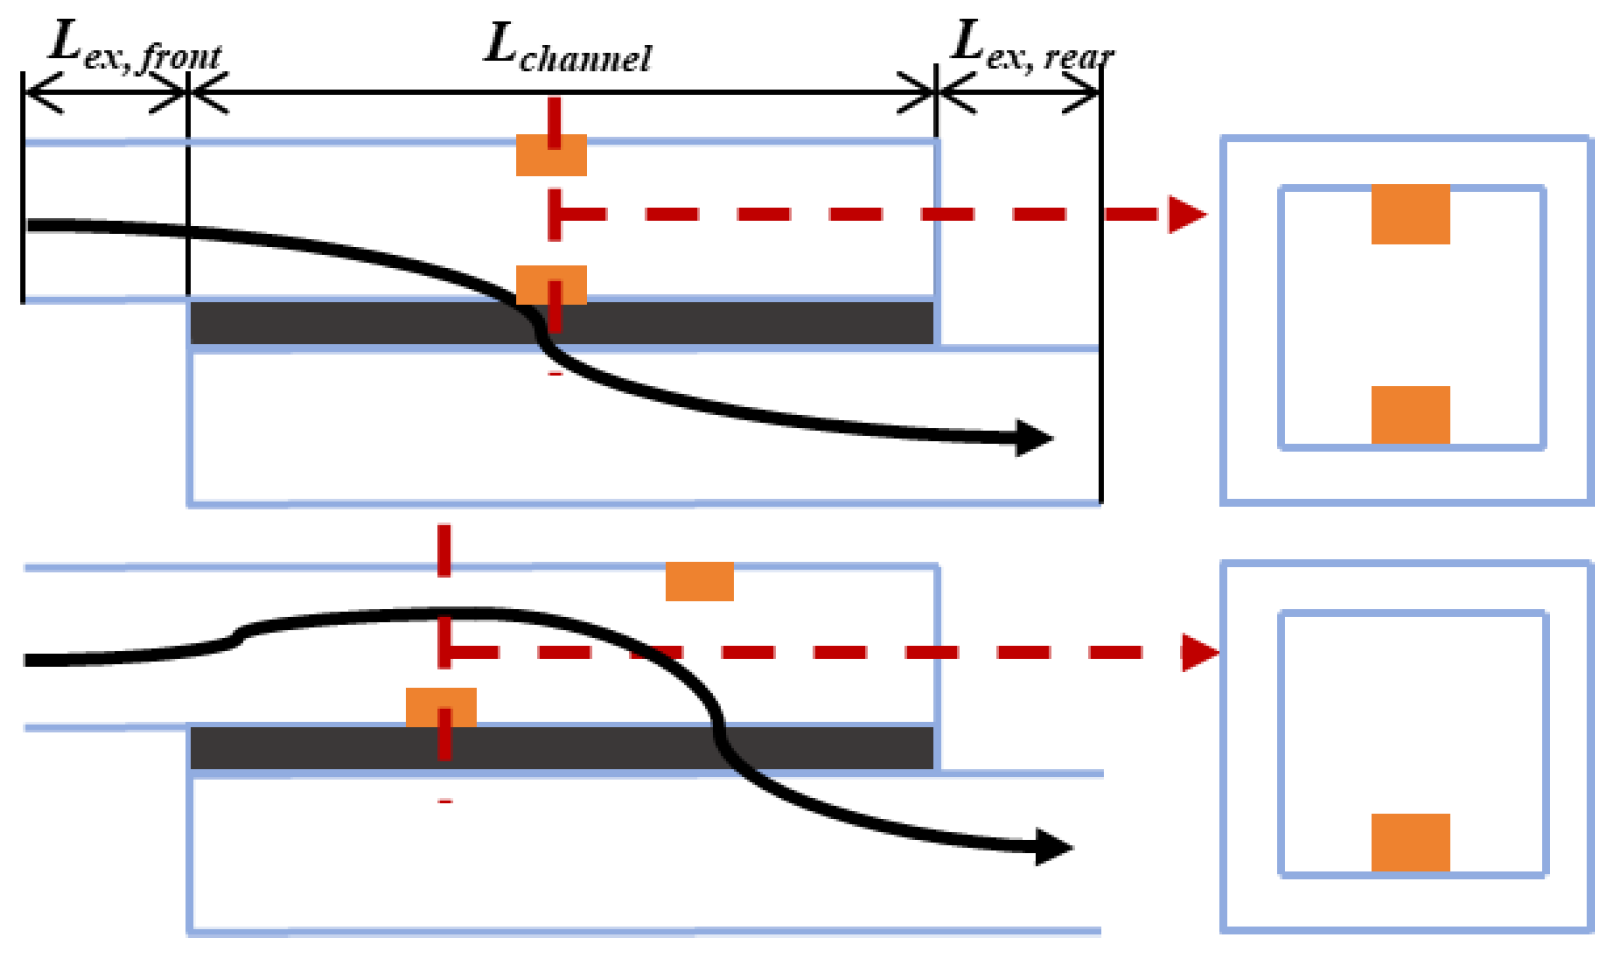
The model comprises an inlet and an outlet channel with a width of 1.1 mm and a porous medium thickness of 0.24 mm, as depicted in Figure 1. The length is adjusted based on the verification model, which is set to 104 mm by considering the dimensions of the gasoline particulate filter [36].
To mitigate boundary effects, two extended zones with a length of 20 mm each are set in the velocity upstream and downstream of the GPF [37,38].
Some assumptions are raised to simplify computation: firstly, gas flow within the channels is simulated using a laminar model, as the calculated Reynolds number (Re) in the channels is 484, below 2000. Meanwhile, fluid flow in porous medium is characterized as non-Darcian. Secondly, all heat exchange is disregarded for simplicity, focusing solely on gas-flow characteristics. Thirdly, the model simulates a steady-state operating condition, wherein particles and gases are uniformly fixed.

2.1. Channel Model

Continuity equation [39]:
𝛻 · V = 0
where V is the velocity in all directions.
Momentum conservation equation:
𝛻 · ( ρ V V ) = 𝛻 P + 𝛻 τ ̿ + S
where ρ is the density of fluid, P is the pressure, τ ̿ is the stress tensor, and S is the momentum source term, which is 0 in all regions except the porous medium. It mainly includes the loss terms caused by viscous resistance and inertial resistance, as described by the Darcy equation.
Darcy–Forchheimer equation [40]:
S = μ k v w + β ρ v w 2
where μ is the viscosity of the fluid; k is the permeability; β is the Forchheimer coefficient, which represents the nonlinear flow effect; and v w is the wall velocity. For high flow velocity in porous medium, Re is calculated to be between 1 and 10. It should be noted that Forchheimer’s extension in the Darcy equation is included to consider the nonlinear flow effect.
For the model limitations and potential errors, it should be noted that this simulation neglects the detailed microscopic structures of the GPF along both the axial and the radial directions due to catalyst coating and the particle-loading process. It only employs different permeability and porosity to simulate the velocity and pressure within the GPF, which may result in discrepancies between the simulated and experimental flow characteristics.

2.2. Simulation Details

2.2.1. Physical Parameters

The porosity ε 0 is uniformly set at 0.5 for the clean porous medium. It changes in the porous medium, which is caused by varying degrees of washcoat, resulting in corresponding adjustments to the resistance term. A functional relationship is derived between porosity and resistance according to Ref. [20], implying that when the amount of washcoat increases, the porosity decreases and the resistance increases.
R v = R v 0 · ( 1 ε 0 1 ε ) 2 3 · f ( ε 0 ) f ( ε )
f ( ε ) = 2 9 [ 1 5 9 ( 1 ε ) 1 3 + ( 1 ε ) 1 5 ( 1 ε ) 2 ] 1 ε
where Rv is the resistance, which is the reciprocal of permeability; f ( ε ) is the hydrodynamic factor of flow through packed bed; and ε is the porosity.

2.2.2. Boundary Conditions

The boundary conditions are based on experimental data from Wang’s research [41], as summarized in Table 1 [42]. A constant velocity of 11 m·s−1 and a zero-pressure gradient are imposed at the inlet, while the atmospheric pressure is used at the outlet.

3. Results and Discussion

3.1. Feasibility Analysis of the Model

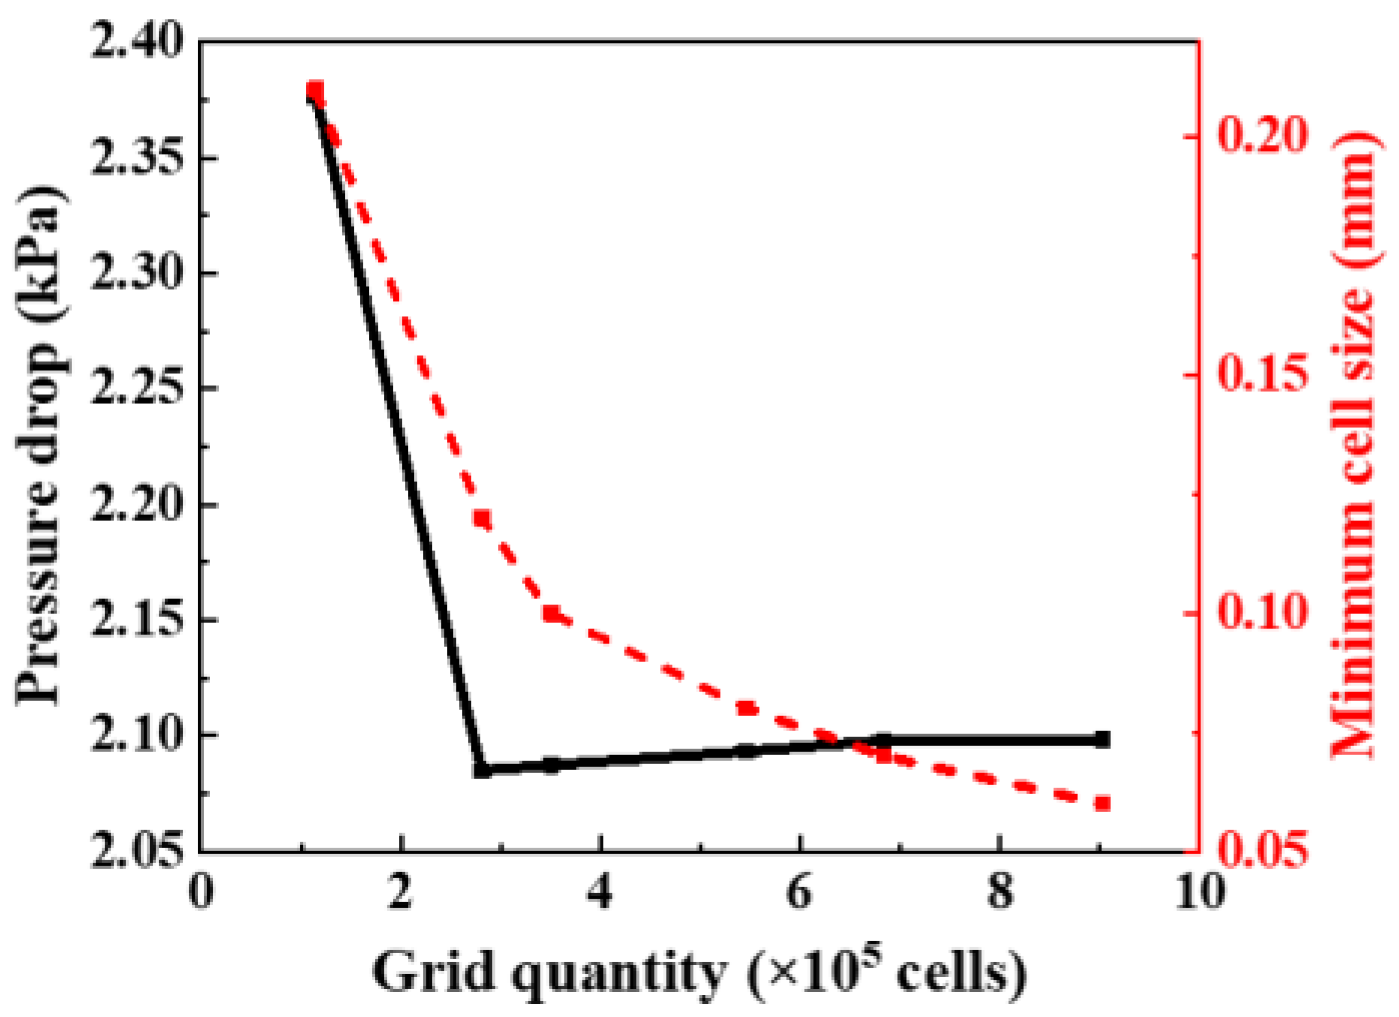
3.1.1. Analysis of Grid Independence

The calculation domain grid is refined to assess grid independence and determine the optimal grid size. The maximum grid spacing in the calculation domain is set to 3.6 mm, while the minimum grid size and the porous medium refinement size are set to 0.21 mm and 0.06 mm, respectively. Consequently, the number of grids increases from 114,660 to 902,560. Figure 2 illustrates the impact of grid density on pressure drop. As the number of grids increases, the difference in pressure drop between adjacent operating conditions gradually diminishes. Notably, the calculated pressure drop results for minimum grid sizes of 0.06 mm and 0.07 mm are nearly identical. Therefore, a minimum grid size of 0.07 mm can reduce computational cost while maintaining the accuracy of the simulation results.

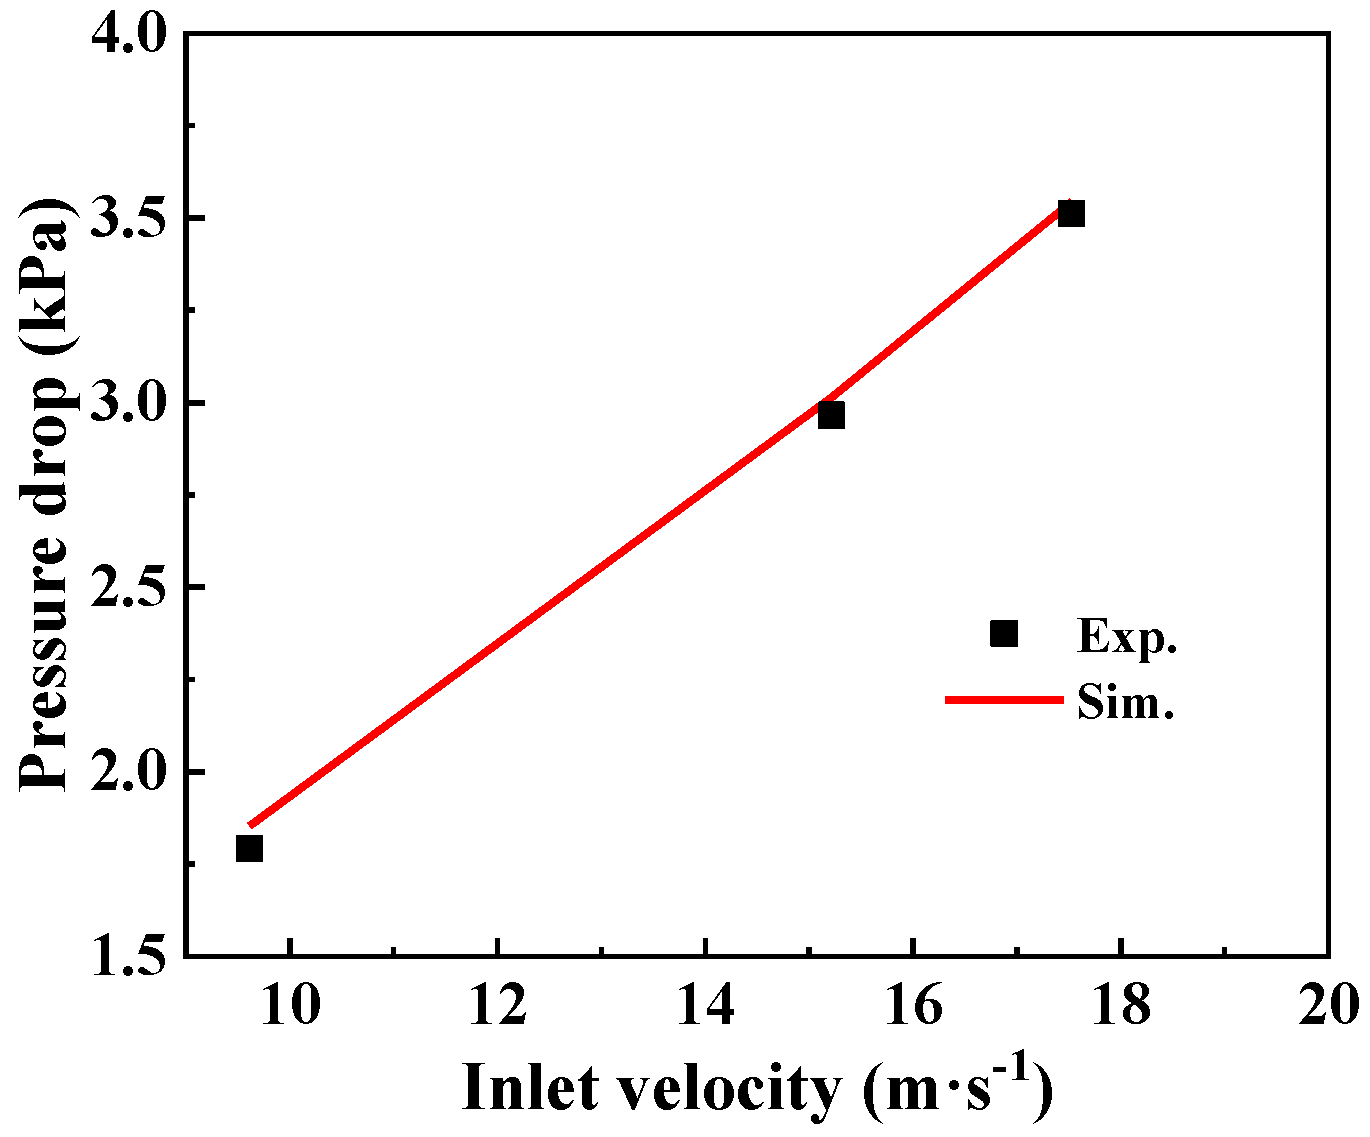
3.1.2. Model Validation

To enhance the model’s accuracy, calibration and verification are undertaken based on steady-state pressure drop experimental data for a clean GPF, as described in Ref. [41]. Various flow conditions without soot load are chosen for validation, keeping the GPF structural parameters and inlet conditions shown in Table 2 consistent to establish the relationship between GPF pressure drop and inlet velocity, resulting in the curve depicted in Figure 3. The viscous resistance and inertial resistance are determined as 6.5 × 10¹² m−2 and 2 × 10⁸ m−2, respectively. The simulated GPF pressure drop value represents the difference between the average pressure at the inlet and outlet interface. While simplifications and assumptions inherent to the current model may introduce some error compared to experimental values, it is noteworthy that the simulated pressure drop error remains below 5%. Therefore, it is concluded that this model accurately represents experimental results and will provide a solid foundation for future simulation studies.

3.2. Zoned Washcoat

The porous medium in this model is divided into two parts, with the first part having an appropriately increased porosity ε f r o n t (low coated) and the second part having a decreased porosity ε r e a r (high coated), aiming to enhance axial distribution uniformity. To elucidate the partitioning and uniformity, the partition ratio (the length ratio of the coated low zone) X [28] and variance of axial speed V are introduced:
X = L f r o n t L f r o n t + L r e a r
V = i = 1 n ( v i v a v e ) 2 n
where Lfront and Lrear represent the length of the porous medium’s low and high coated parts, respectively; n is the number of data acquisitions and vi is the velocity of each measuring point in the axial direction; and vave is the average of all velocities.
The average porosity of two parts of the porous medium is controlled at 0.5 by adjusting the porosity of both. The majority of most porous media typically exhibit a porosity of approximately 0.5 due to their relatively high capture efficiency and low pressure drop [17,43]. There is a relationship between the porosity of the coated high part and the coated low part, which can be expressed by the following equation:
X ε f r o n t + ( 1 X ) ε r e a r = 0.5

3.2.1. Average Partition

While keeping the other conditions of the model unchanged, we uniformly distribute the lengths of two segments of the porous medium (X = 0.5). The segment close to the inlet surface is designated as the first part, while the remaining one is referred to as the second. Five values are equally selected, with the porosity of the front part ranging from 0.5 to 0.505, while the corresponding porosity of the rear part varies between 0.5 and 0.495. The change in catalyst coating amount corresponds to approximately 1.76 g·L−1 [28] and 0.148% pore volume filled with washcoat [44] for every 0.001 variation in porosity. The simulation results are depicted in Figure 4. The axial position, defined as the location along the central axis of the porous medium, is normalized such that the minimum value of 0 corresponds to the beginning segment and the maximum value of 1.0 corresponds to the end segment. In comparison, the values of the inlet channel rate and permeation rate exhibit a similar order of magnitude as reported in the reference [45], while the axial rate distribution also demonstrates certain similarities.
The deviation in porosity from the average value in two parts of the porous medium leads to an increase in the permeation velocity of the first part, and a decrease is observed in the second part, with a similar quantity of change occurring throughout the whole porous medium, as shown in Figure 4a. An increase in porosity within the low coated zone expands its internal space, which consequently leads to increased resistance for gas flow, accompanied by a corresponding reduction in space within the high coated zone [46]. Furthermore, as porosity increases within the first part, there is an enhanced tendency for gas passage through this place, gradually widening the variation range across the two parts.
The velocity variances in the porous medium are calculated for different porosity conditions, and the corresponding results are presented in Figure 4b. As the porosity gradually deviates from the average value, the variance initially decreases and then increases. The minimum variance of 3.8 × 10⁻⁶ occurs when ε r e a r varies in the range of [0.503, 0.504]. With a further increase in porosity, a higher variance of 5.2 × 10⁻⁶ is observed. This indicates that excessively large differences in porosity between two parts can counter-productively improve uniformity.

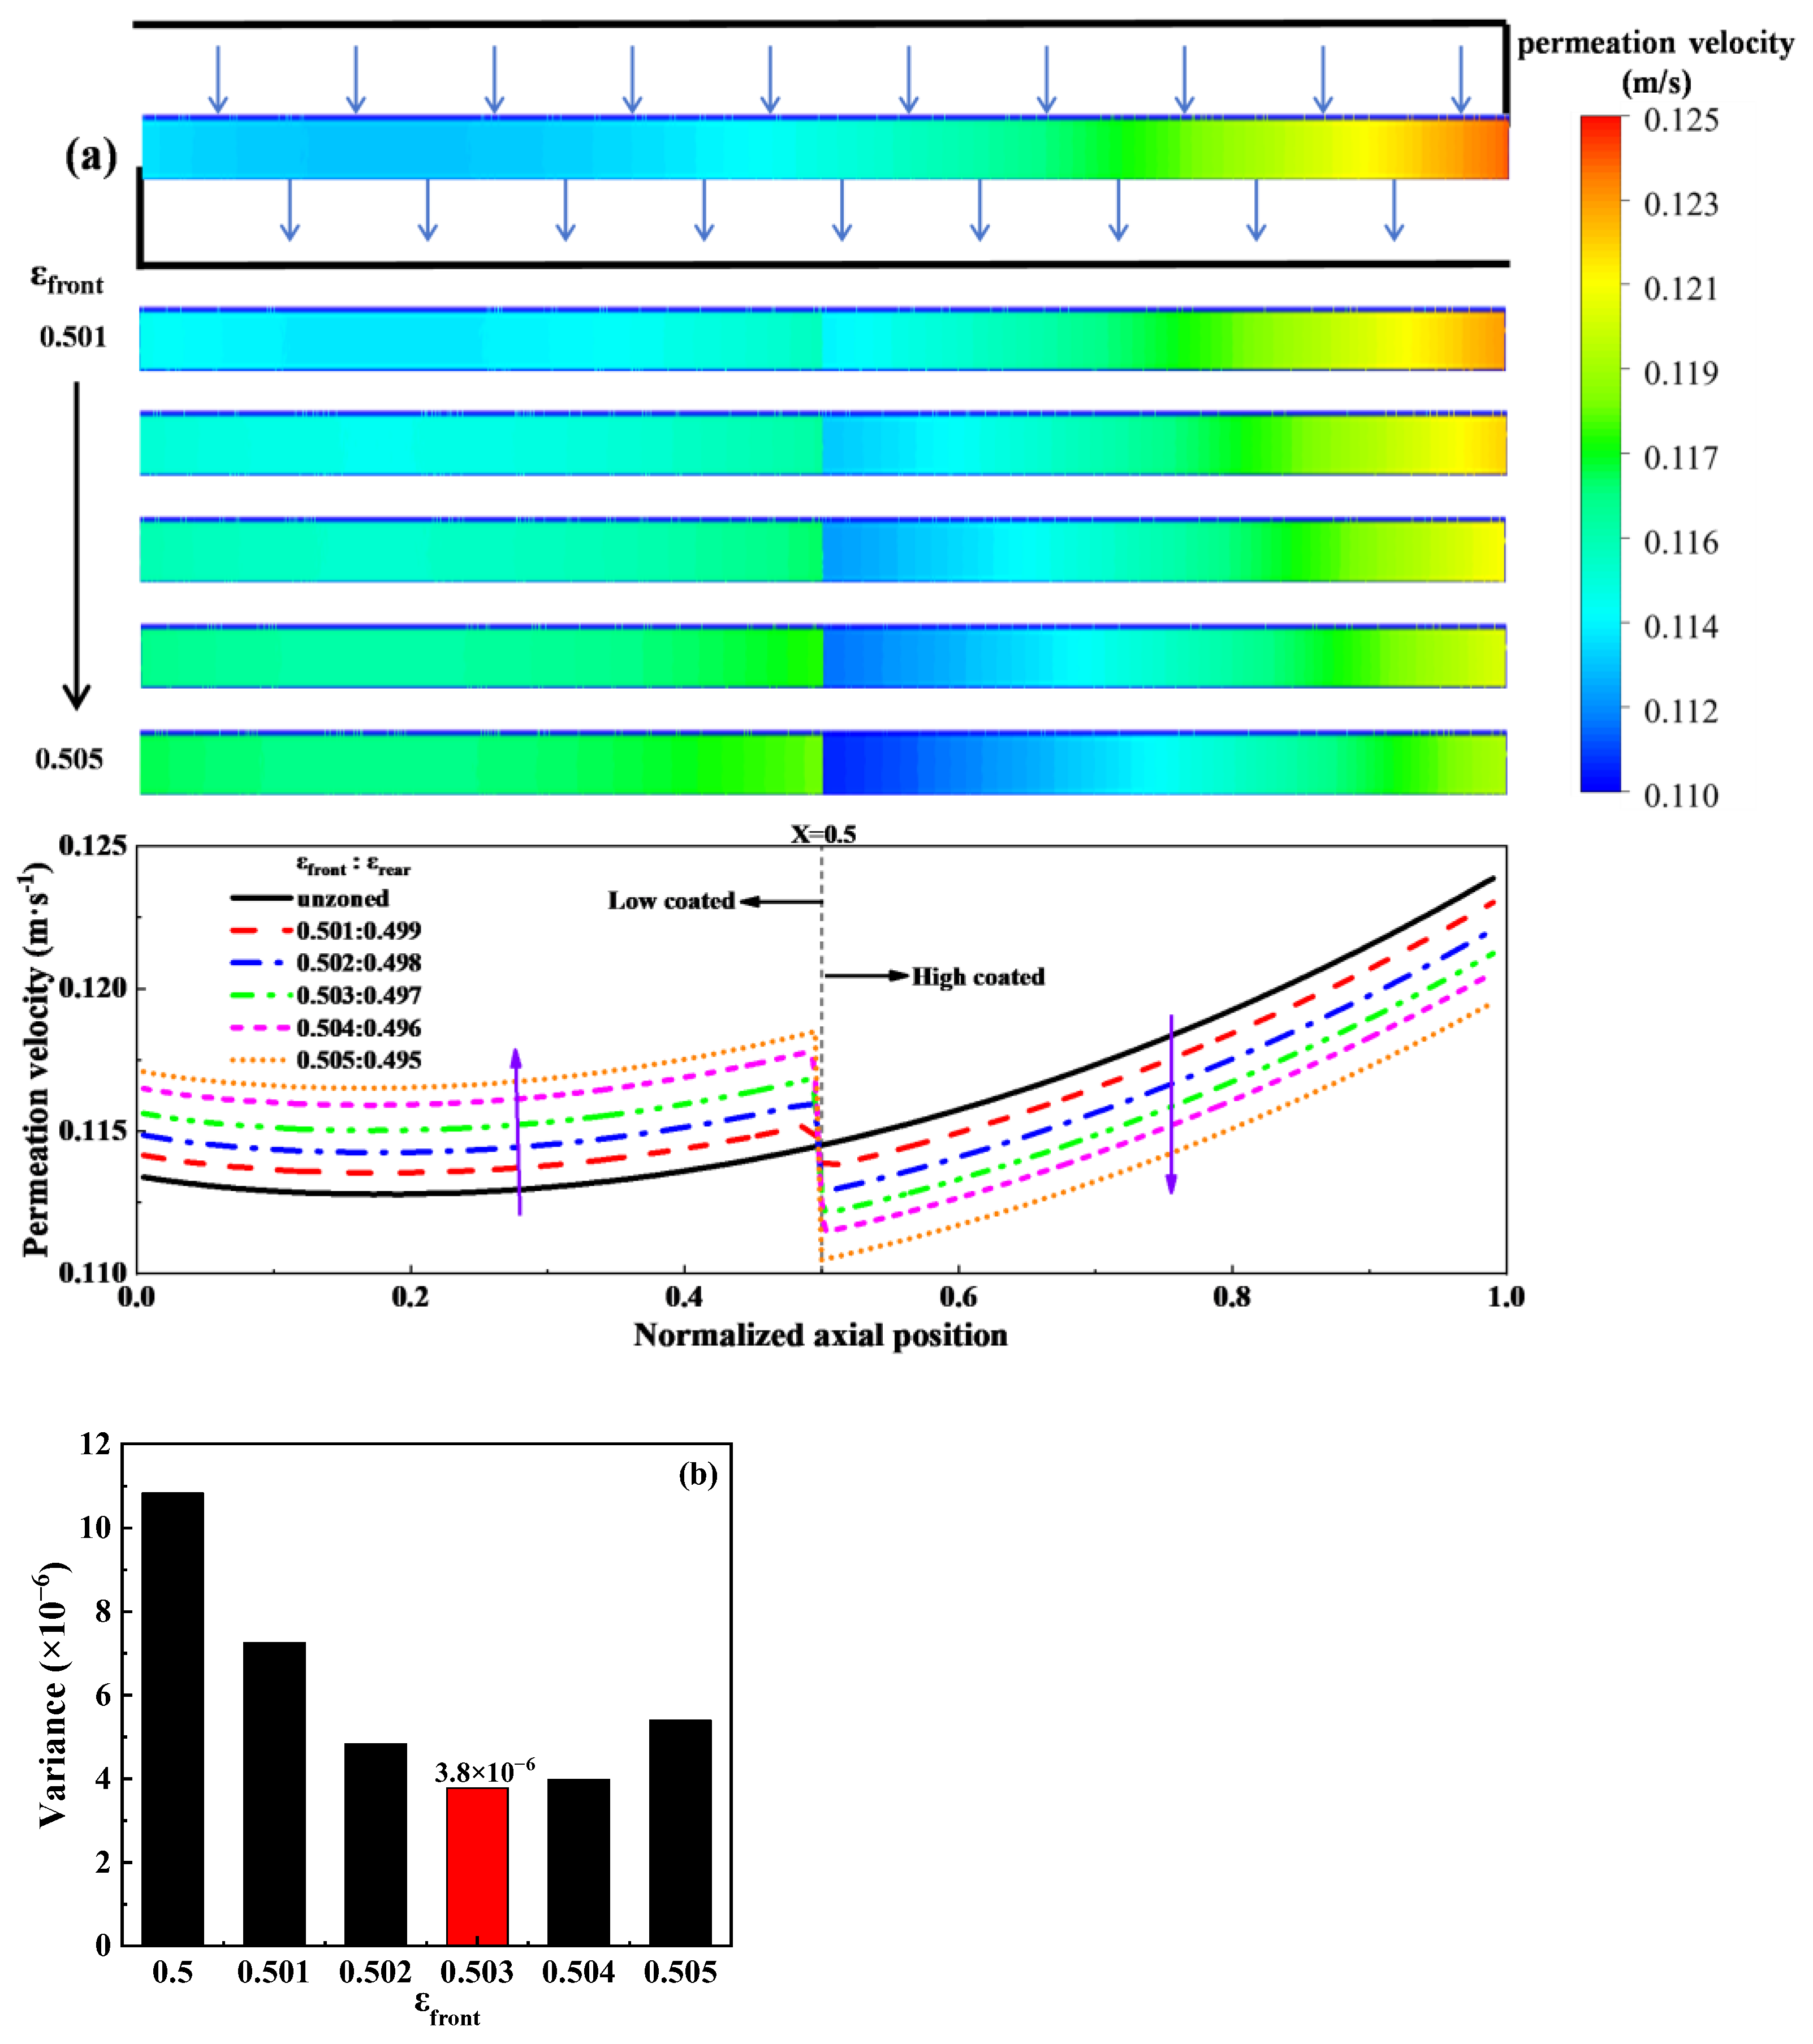
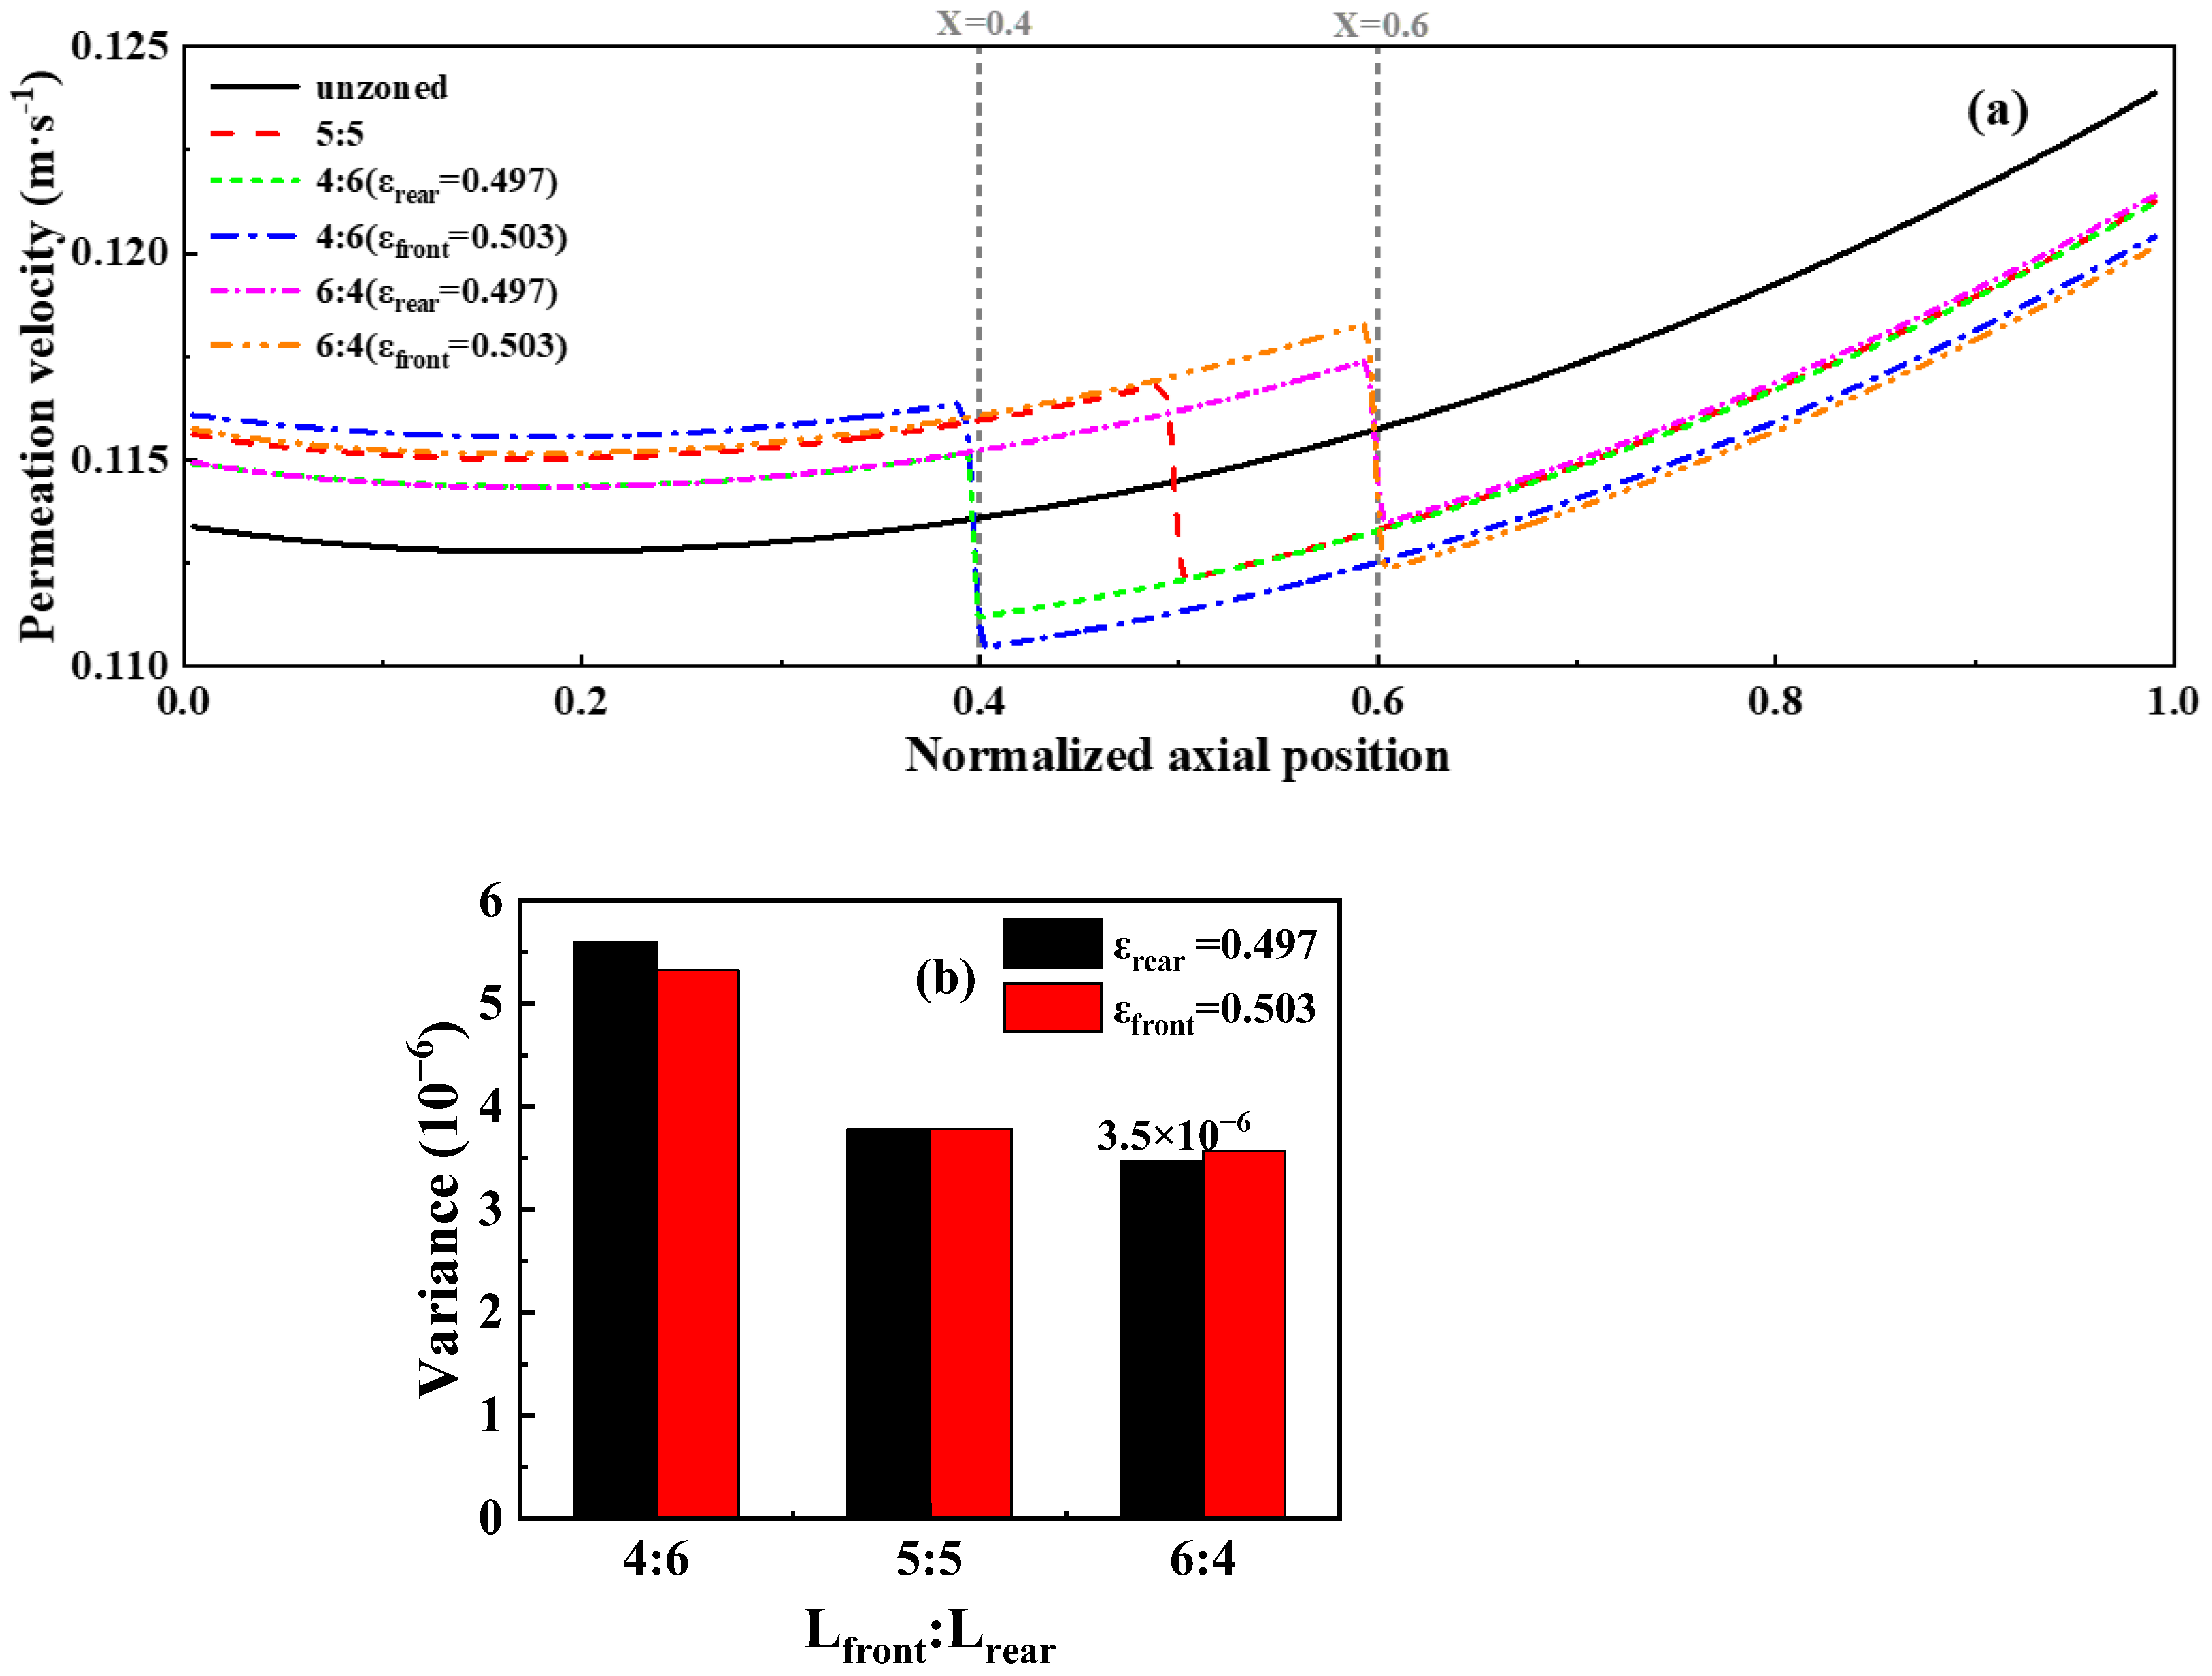
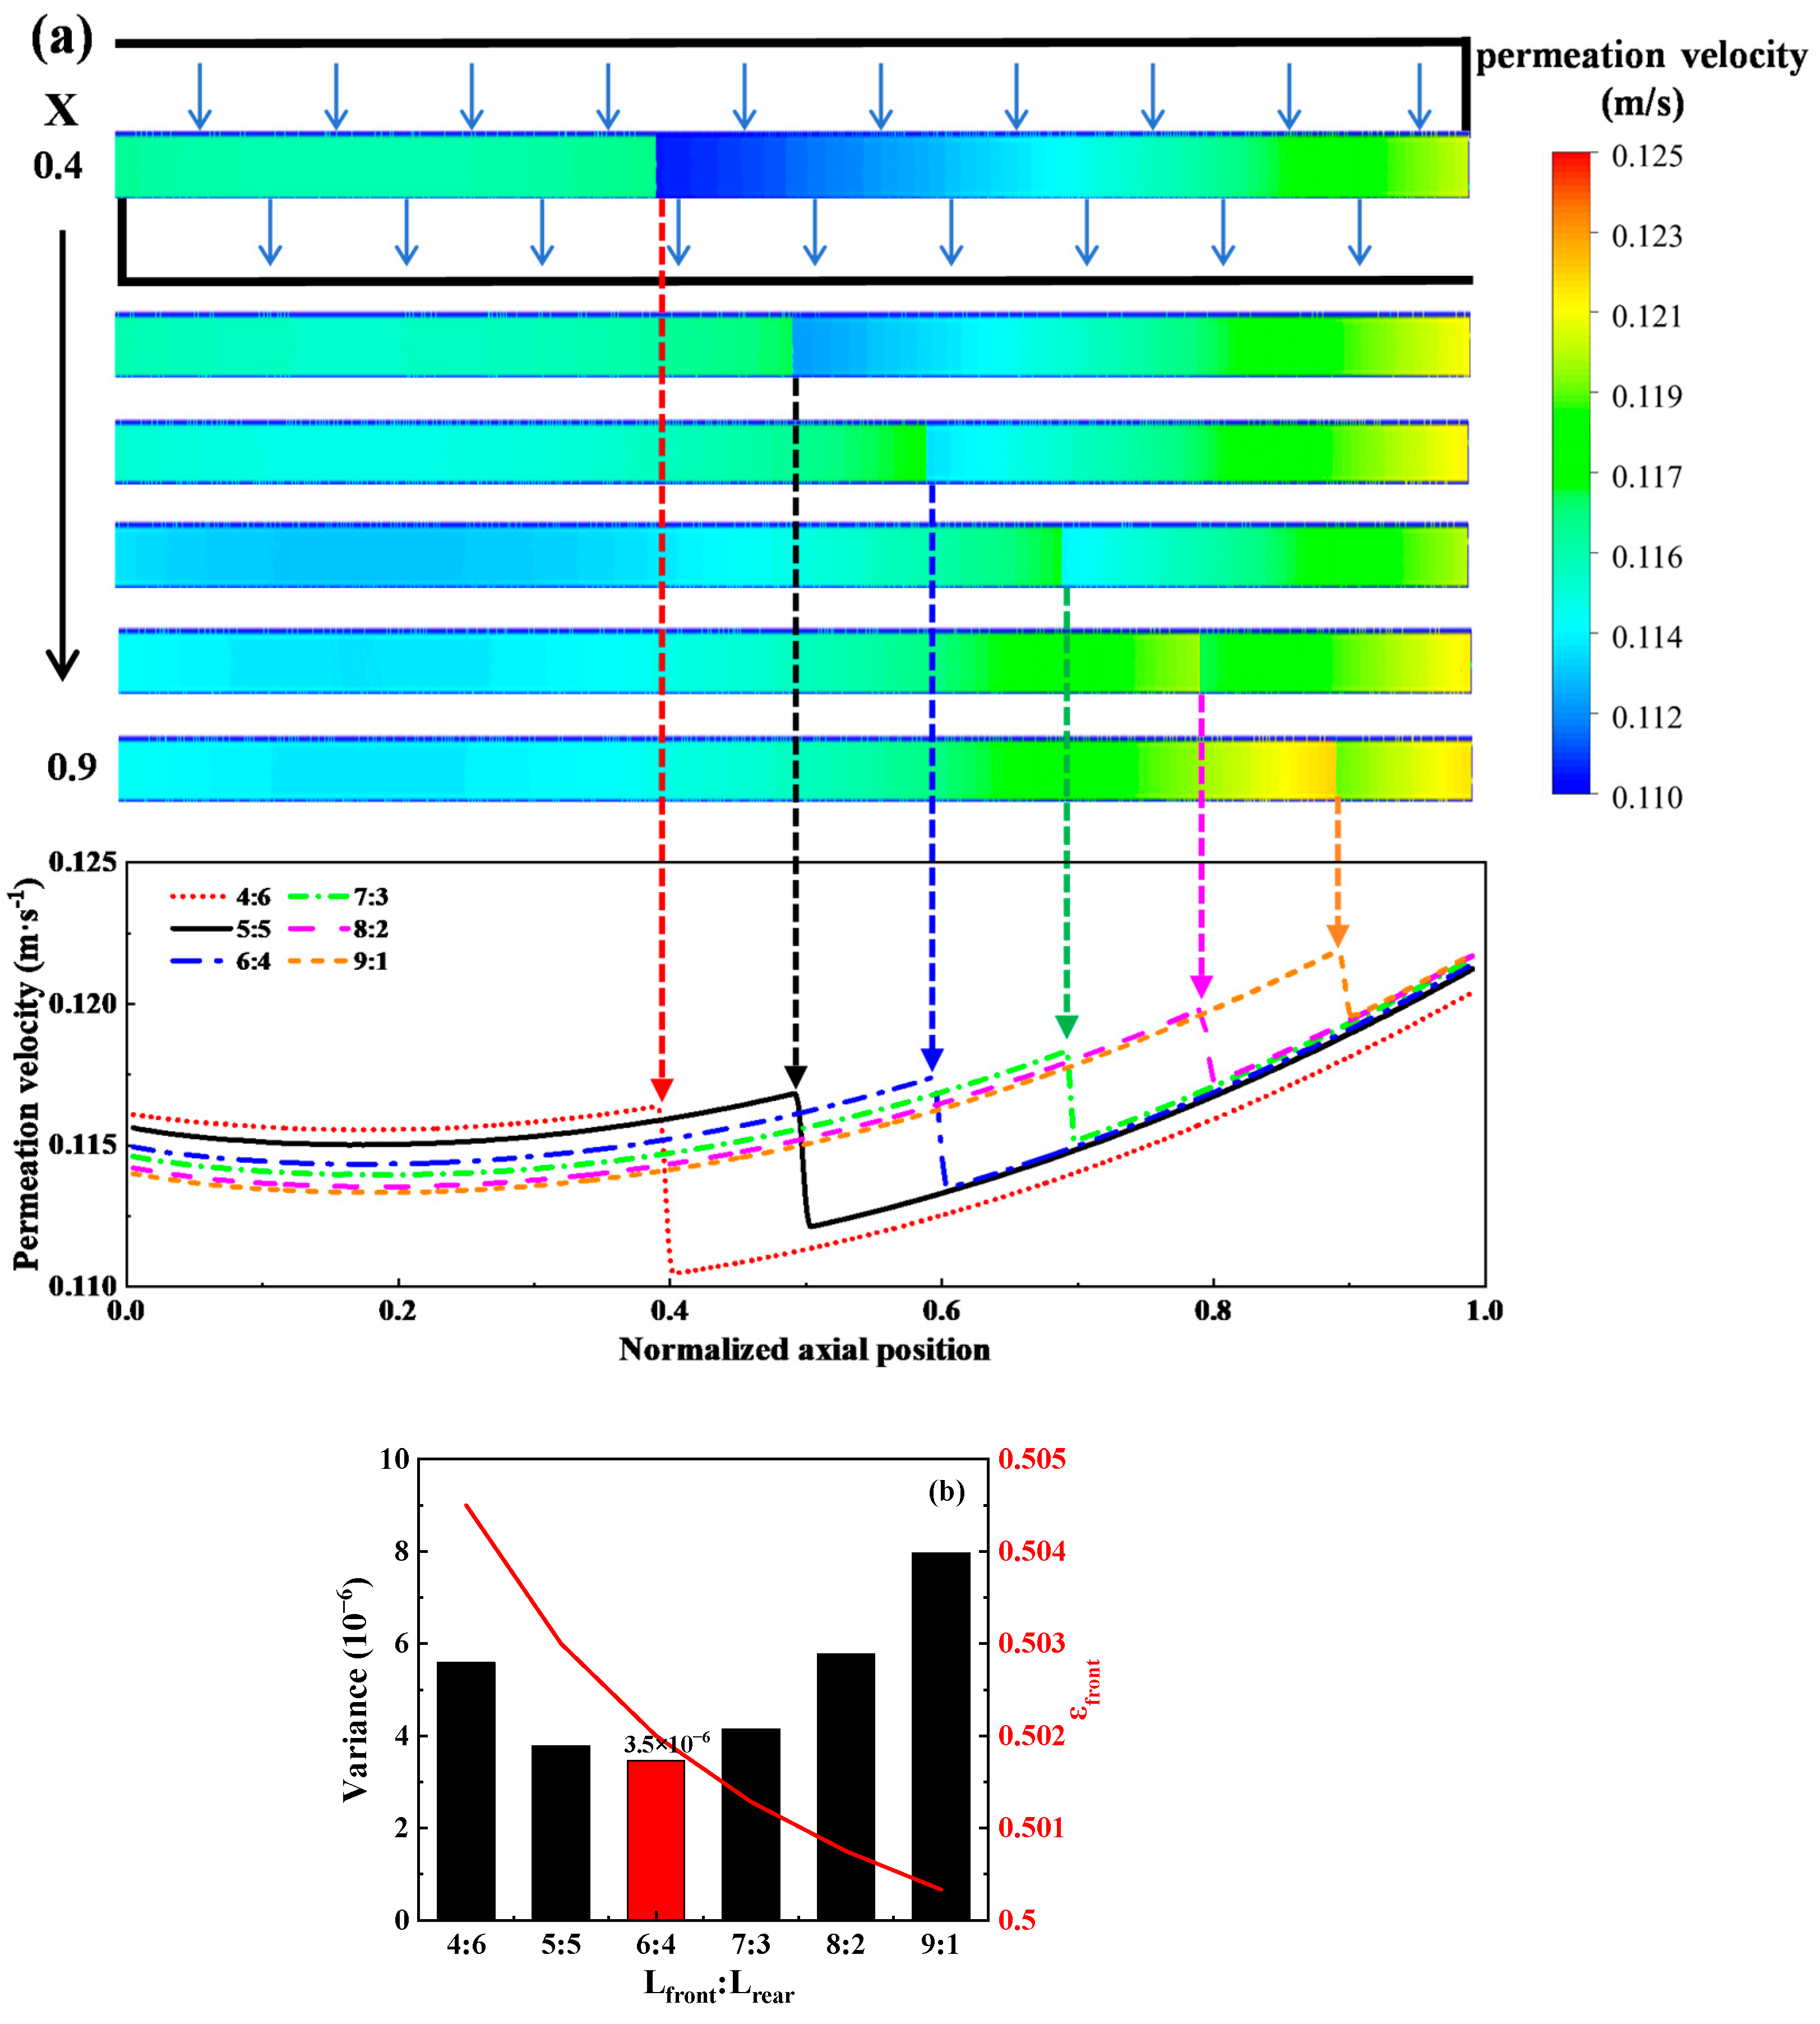
3.2.2. Different Length Proportion and Porosity Configuration

To further enhance flow consistency, the lengths of the two regions are adjusted based on the above research findings (as shown in Figure 4), while the porosity of the low coated region is fixed at 0.503 or the porosity of the high coated region is fixed at 0.497. Two sets of simulations are established at X = 0.4 and X = 0.6 to investigate the impact of the high length ratio of the first or second part on flow characteristics. The results are depicted in Figure 5.
When X = 0.4, with a fixed porosity of the low coated zone ( ε f r o n t = 0.503), ensuring an average porosity of 0.5 requires the porosity of the high coated zone (0.498) to be slightly higher than 0.497. The permeation velocity aligns with the curve of average partition in the first part but slightly surpasses the curve for a porosity of 0.497 in the second part. Conversely, with a fixed porosity of the high coated zone ( ε r e a r = 0.497), the porosity of the low coated zone (0.5045) should be slightly higher than 0.503. The permeation velocity curve for the first part will be marginally higher than the curve for a porosity of 0.503, and there will be an overlap between the two curves in the second part compared to the average partition.
When the length of the first part is longer (X = 0.6) compared to the average partition condition, a fixed porosity ( ε f r o n t = 0.503) results in a coincident curve for the first part. However, if the porosity of the high coated zone is fixed ( ε r e a r = 0.497), the coincident curve corresponds to the second part. In other words, the permeation velocity of a certain part remains constant as long as its porosity is fixed, regardless of changes in X. Moreover, maintaining a constant value for the porosity of the first part results in a more pronounced disparity in permeation velocities compared to that of the second part with fixed porosity.
The variance of axial velocity in the porous medium is calculated under four different conditions, as depicted in Figure 5b. Compared to the variance observed under the average partition, a larger variance and heterogeneity are found under X = 0.4. Fixing the porosity of the second part results in a greater variance compared to fixing the porosity of the first part. Conversely, a smaller variance and further improved uniformity are observed under X = 0.6. Fixing the porosity of the first part results in a greater variance compared to fixing the porosity of the second part. Consequently, it can be inferred that increasing the proportion of the length of the low coated zone and specifying the porosity of the high coated part appropriately enhances axial permeation velocity distribution uniformity.
As the proportion of the length of the first part is further increased, with the porosity of the second part remaining fixed, the porosity of the first part gradually decreases and approaches 0.5 as X increases, as depicted in Figure 6b. Consequently, the permeation velocity of the first part gradually decreases and approaches the original curve (without partitioning), while the curves of the second part remain almost the same. The variations between adjacent working conditions also gradually decrease.
The variances of axial permeability velocity for different X are calculated and compared in Figure 6b. It is observed that with an increase in X, variance initially decreases before increasing again. Combined with Figure 6a, it is found that as X increases, there is a trend towards an initial increase followed by a decrease in differences between maximum and minimum axial permeation velocities, providing a simple explanation for variance variation concerning X. The minimum variance is generally achieved when X changes within the range of 0.6–0.7, resulting in an approximate 65% improvement in uniformity through partitioning.

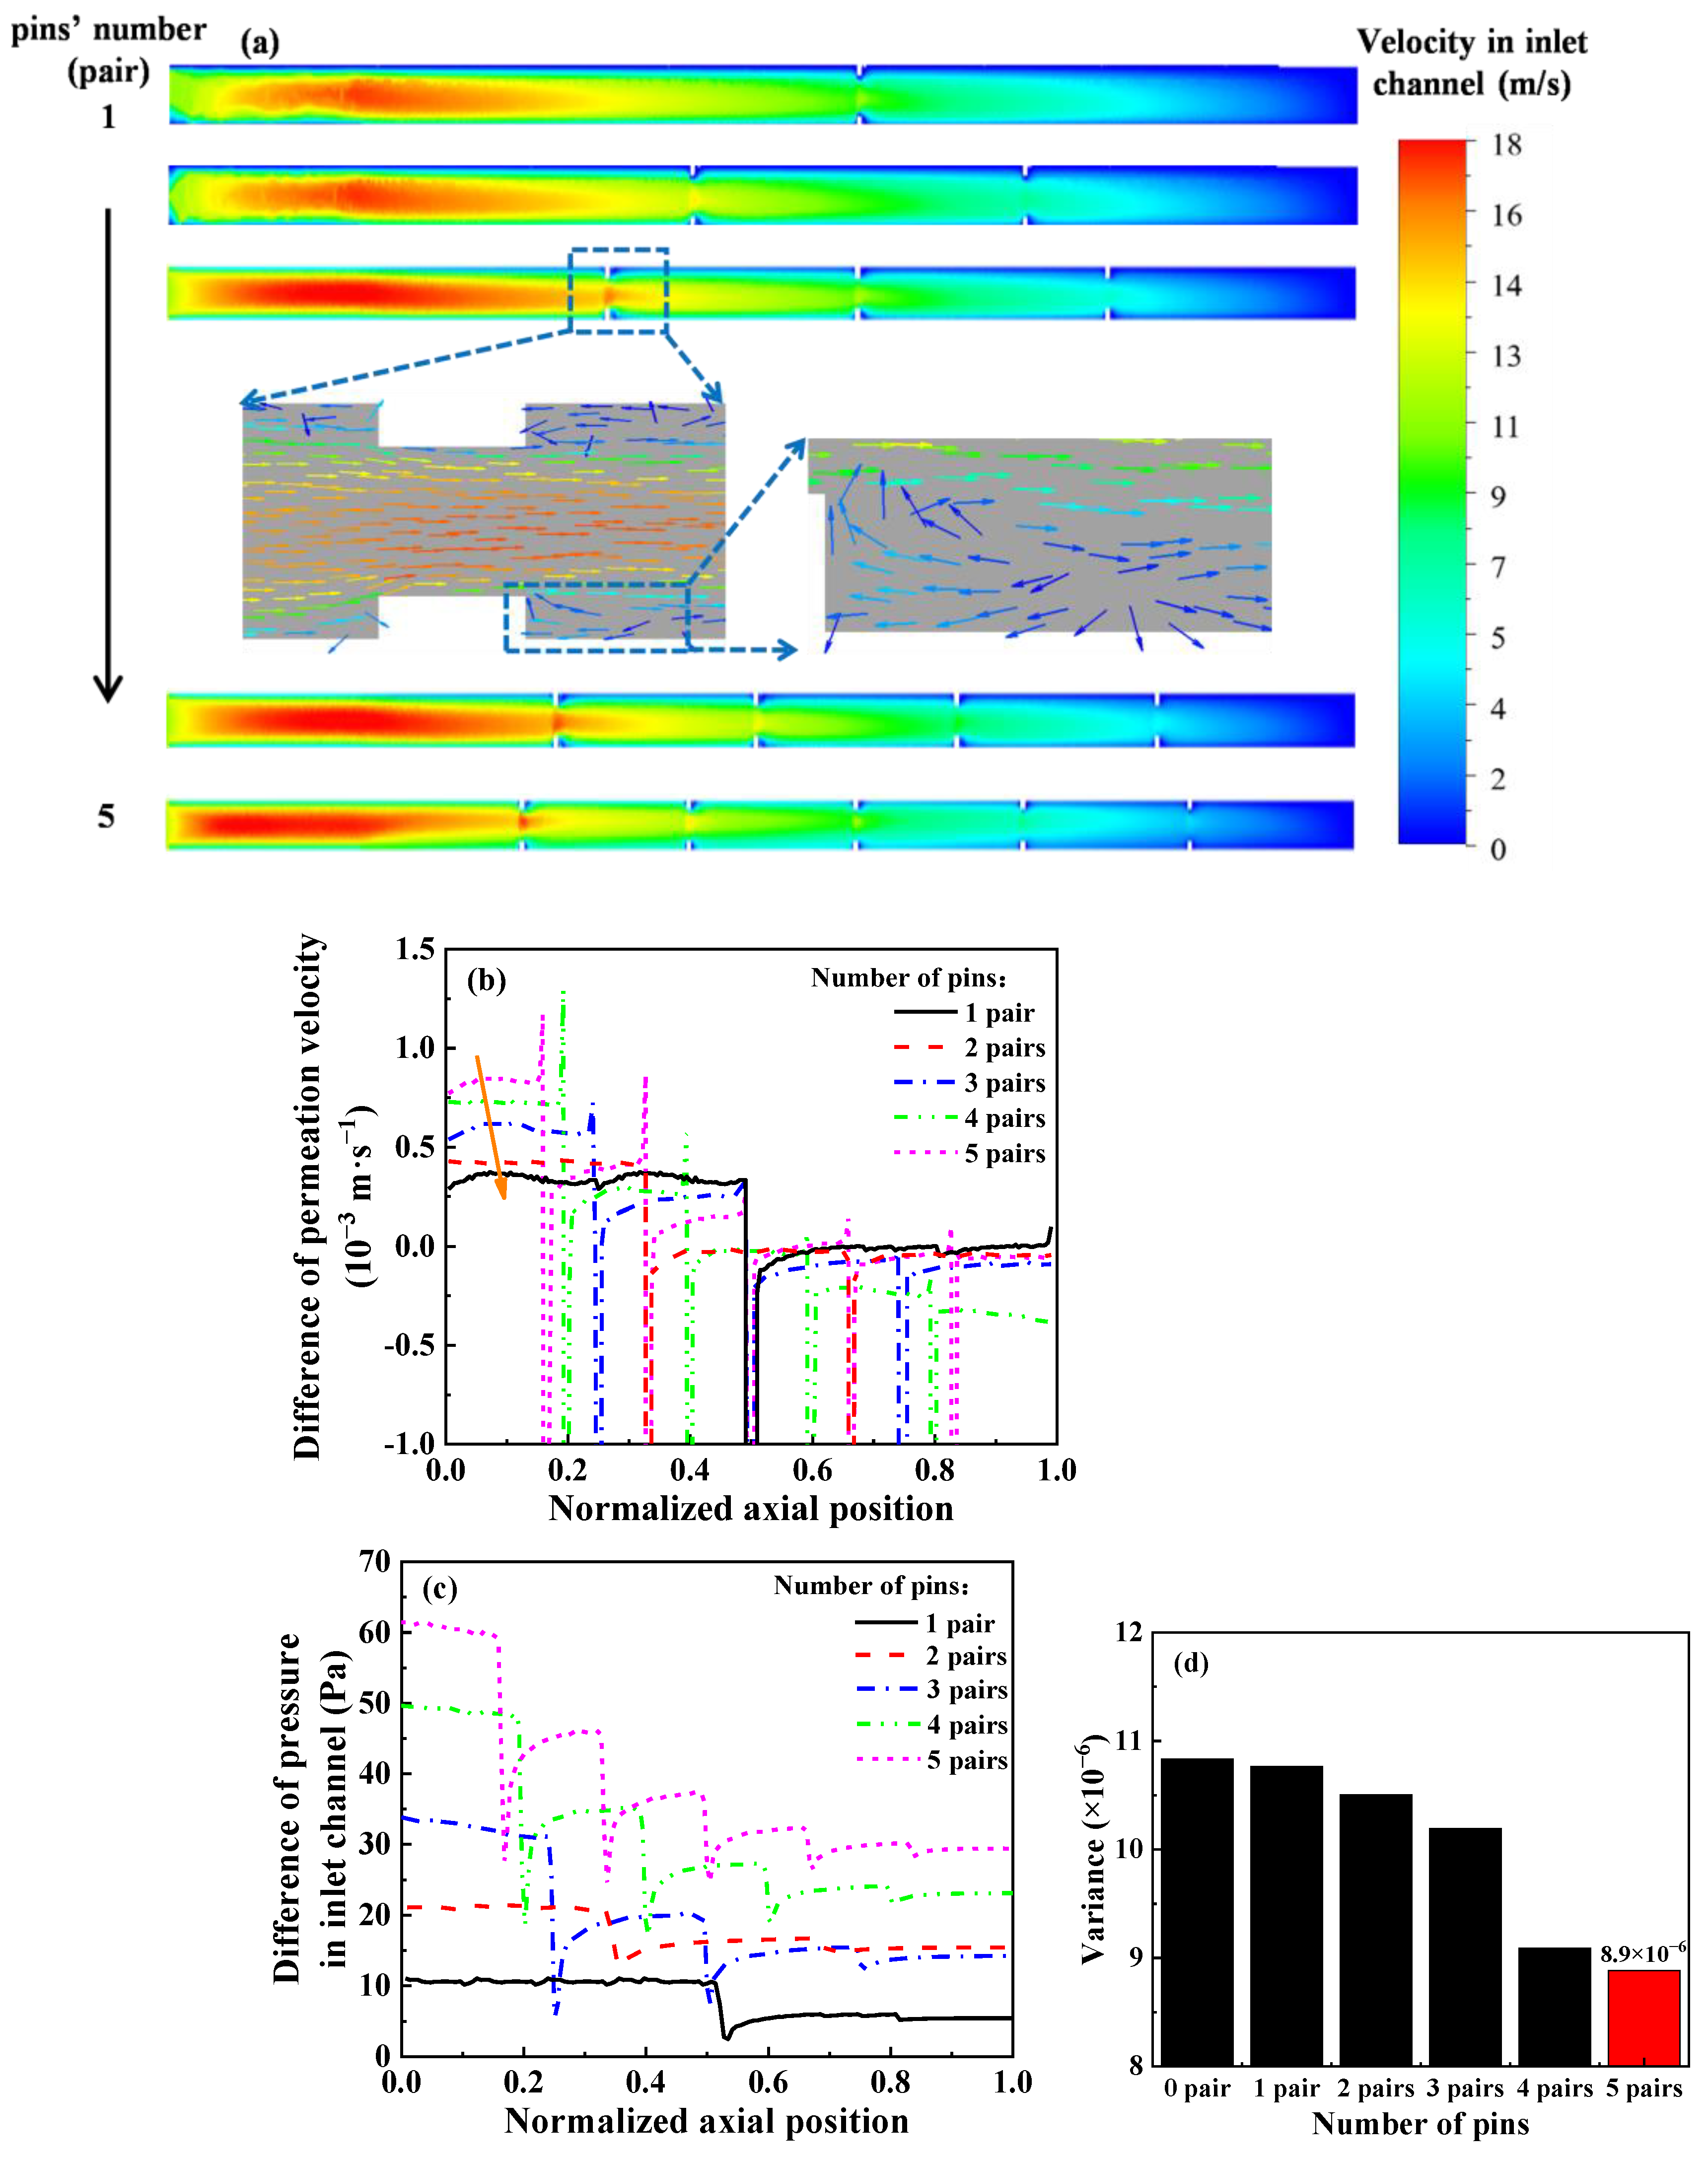
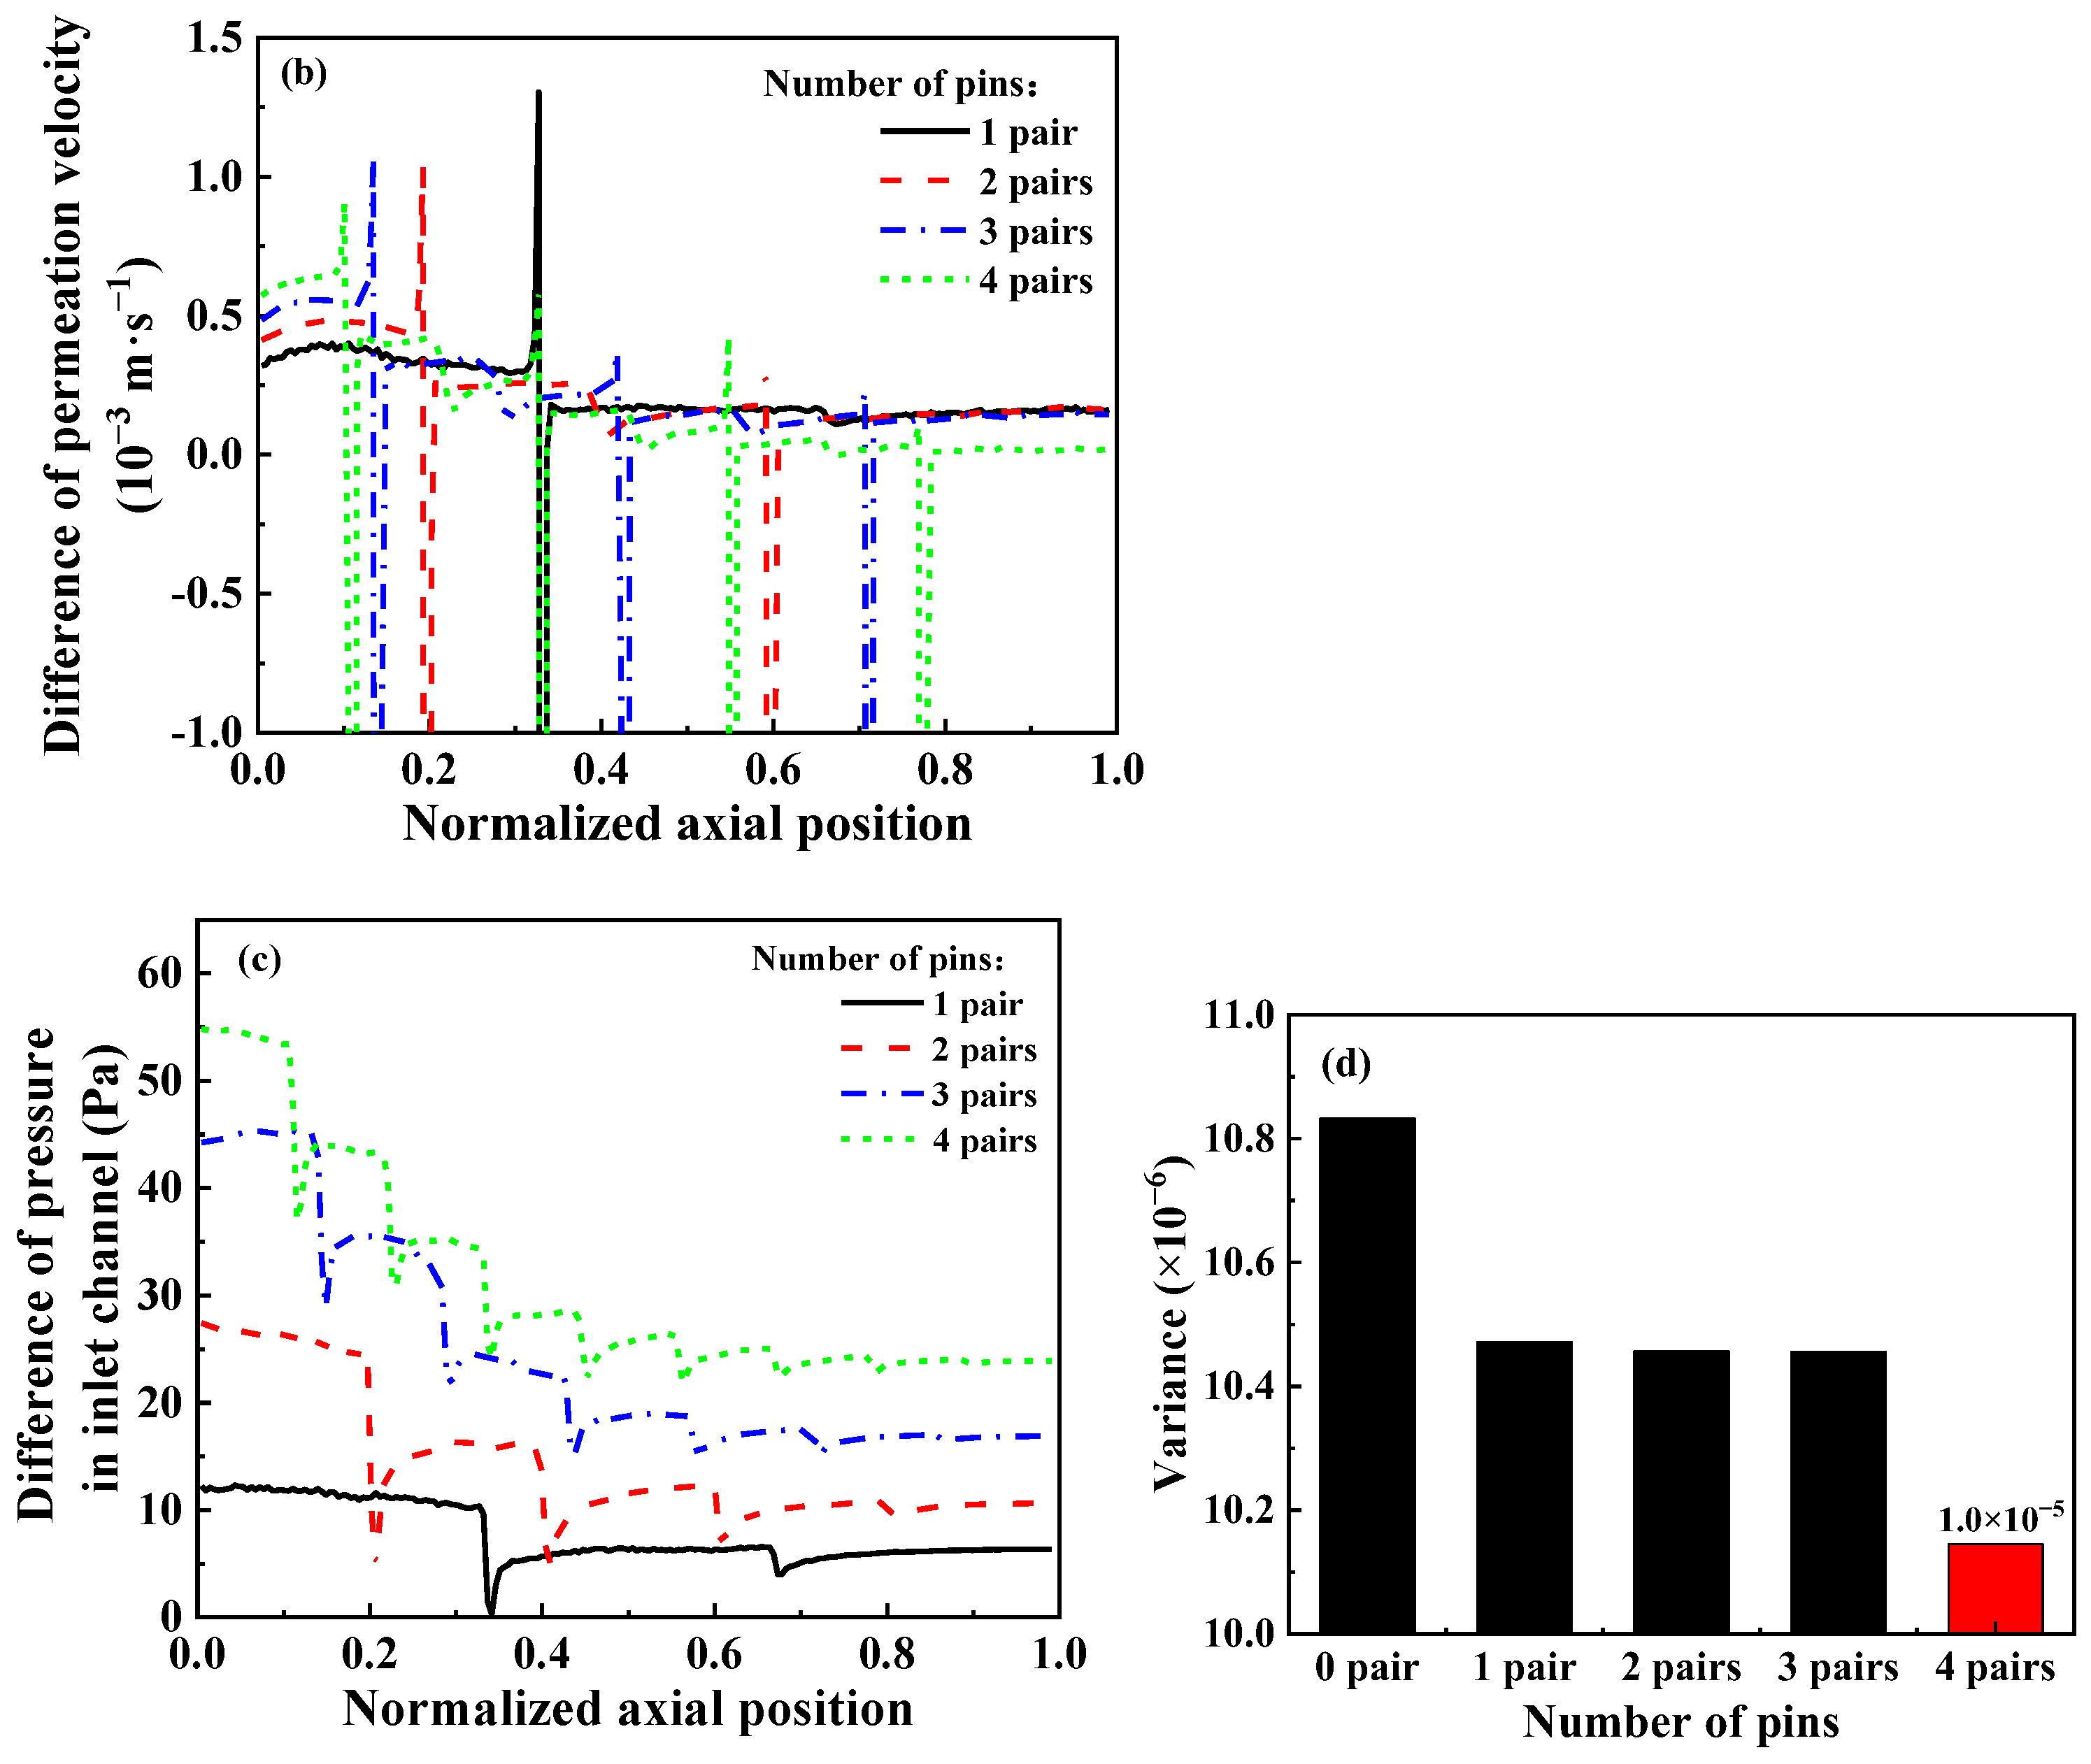
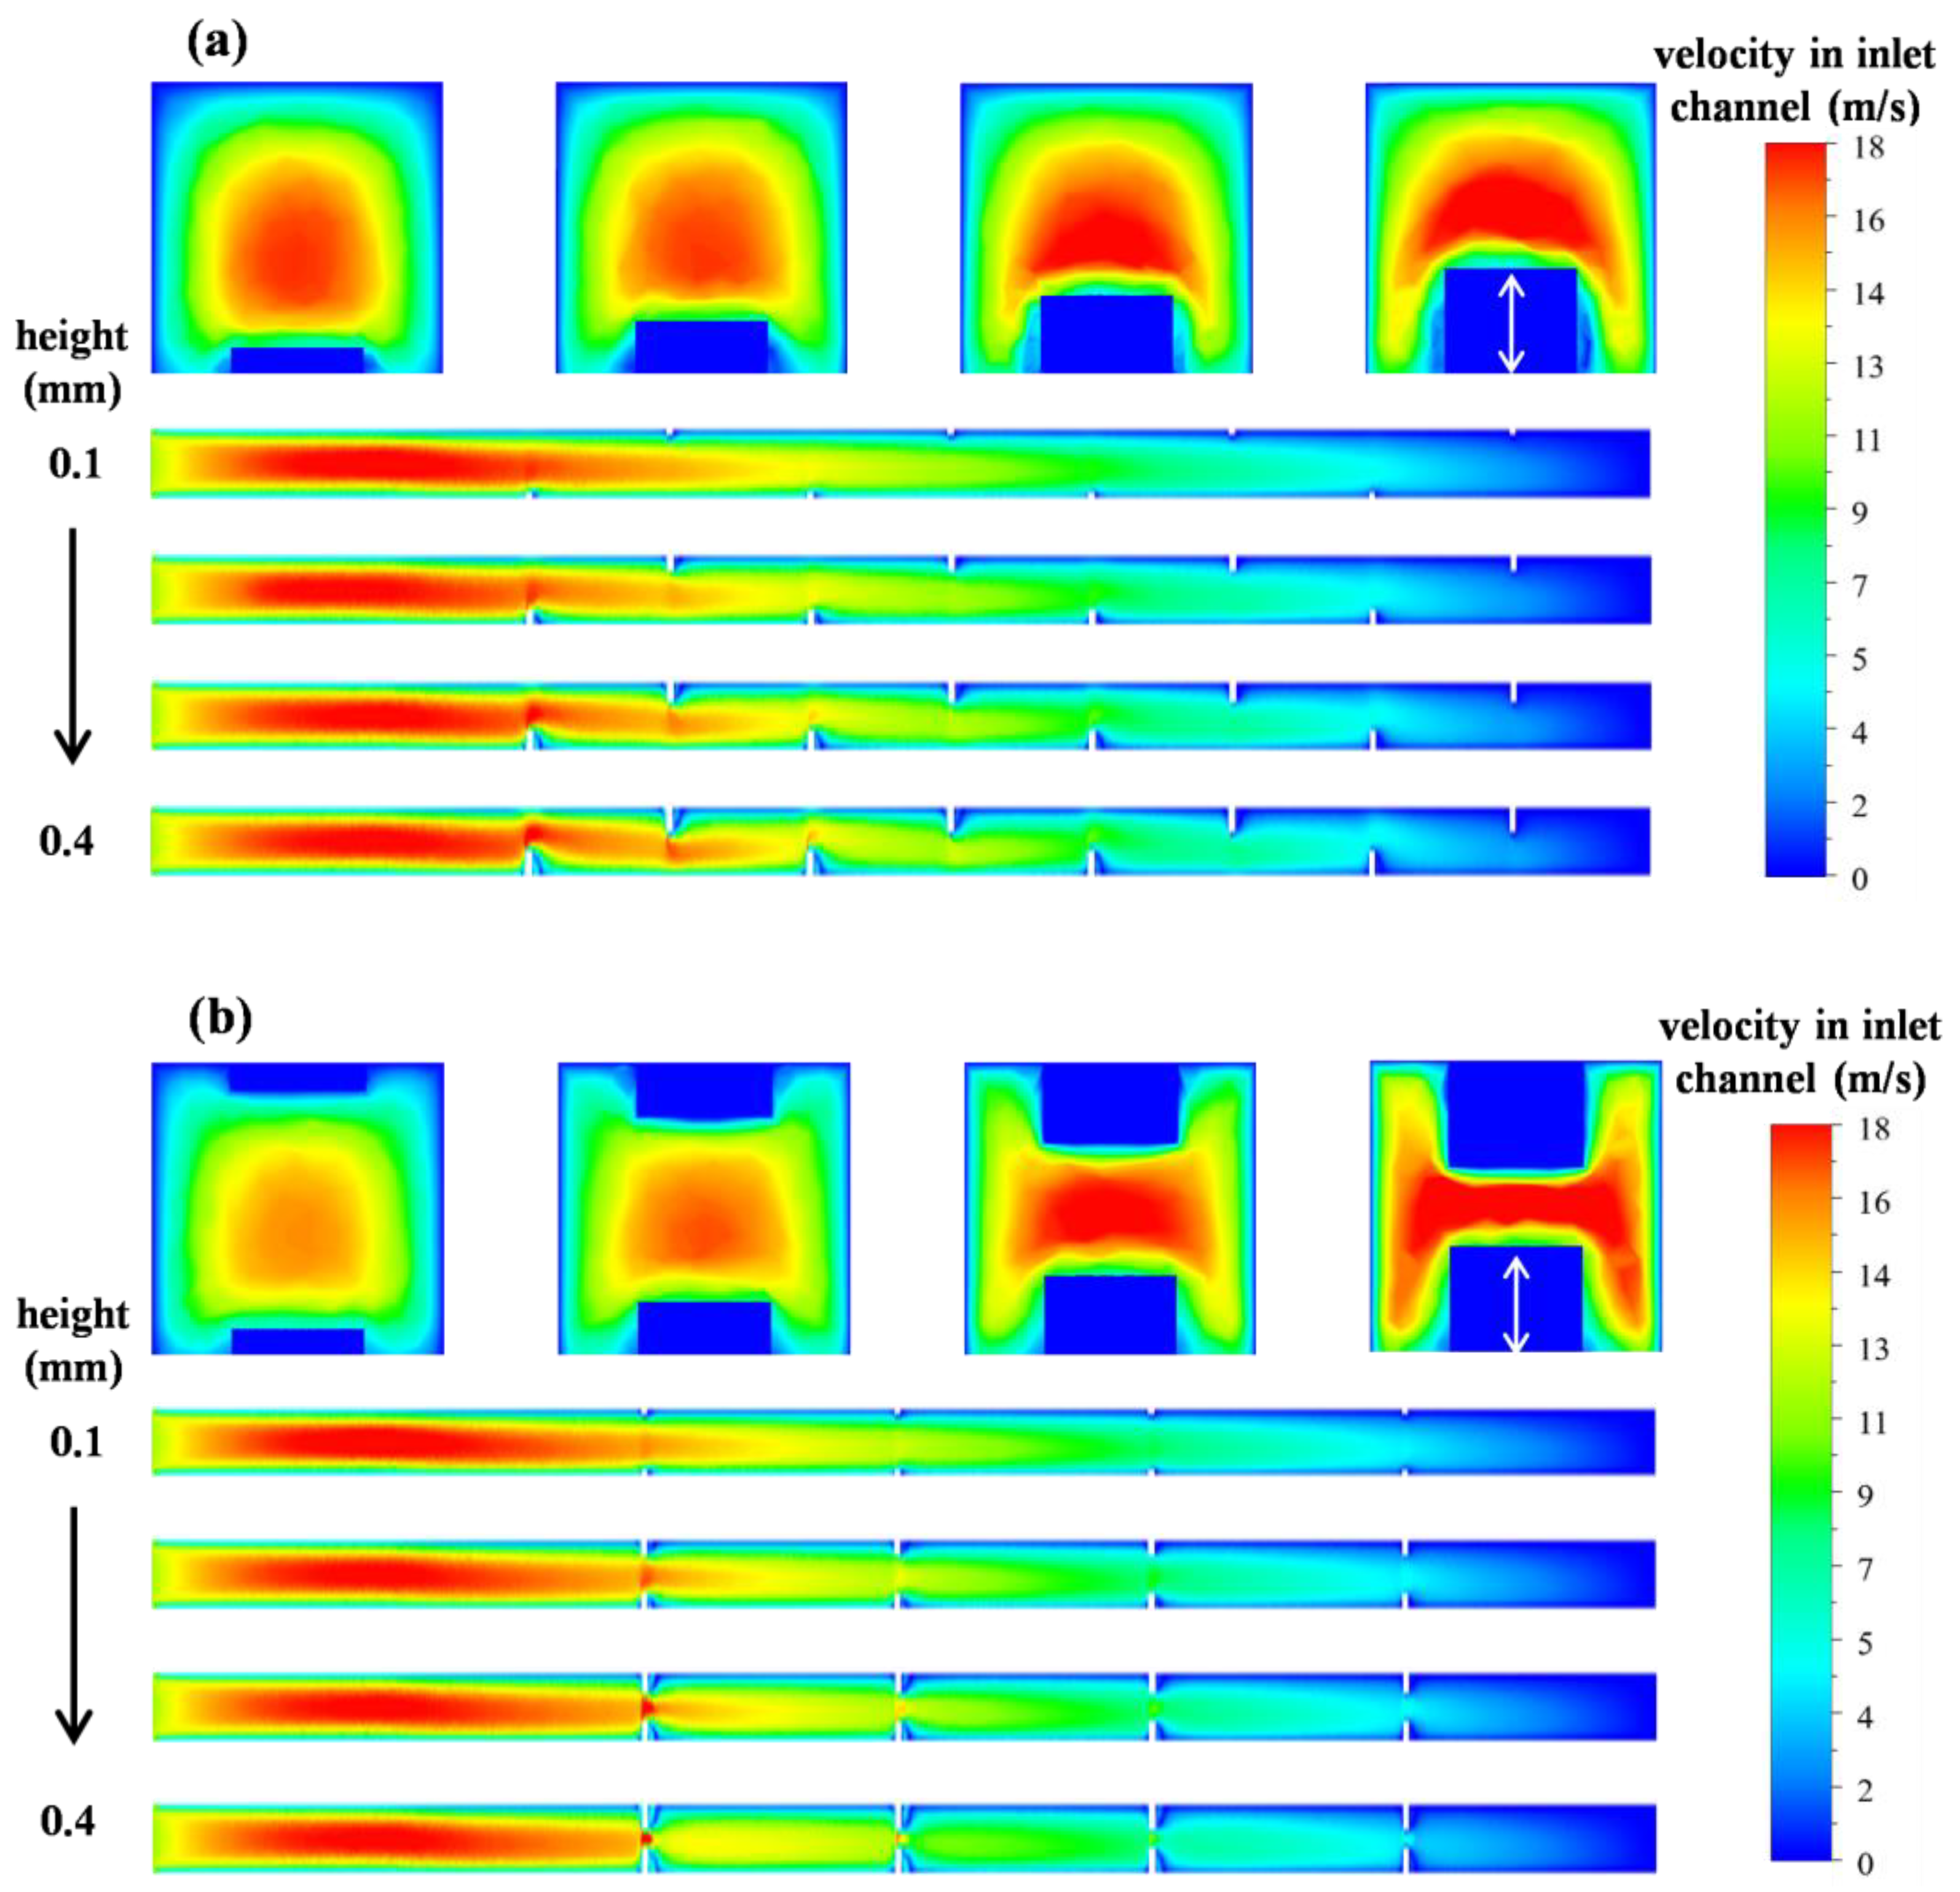
3.3. Pins in Inlet Channel

The presence of pins in the inlet channel induces modifications in flow velocity and direction due to changes in the structure and dimensions of the channel as gas flows through it [27]. Moreover, the pins directly obstruct the passage of certain gases. Different numbers of pins are evenly positioned above and below the inlet channel either symmetrically or alternately, as shown in Figure 7, enabling observation of their impact on velocity distribution within both the inlet channel and the porous medium.

3.3.1. Symmetrical Arrangement

The pins are distributed symmetrically in three, four, and five groups above and below the inlet channel, respectively, as seen in Figure 8a. Each pin has a length of 0.5 mm and a height of 0.2 mm. In the porous medium region corresponding to the pins, there is a sudden change in permeation velocity due to the coverage of the porous medium, which influences the size of the permeation velocity at the same radial position. However, its impact on flow heterogeneity can be negligible because the coverage area is limited. Additionally, for the convenience of observation and statistical calculation, the permeation velocity in this area is excluded from variance calculation.
Figure 8b demonstrates that the permeation velocity increases most near the inlet and proportionally with the increasing number of pins. When pins are introduced into the inlet channel, there is a varying degree of reduction in the corresponding position’s permeation velocity as the gas passes through each pin. Nevertheless, throughout the entire axial porous medium region, the permeation velocity exhibits an increase relative to the initial condition, potentially attributable to the pressure increase in the inlet channel induced by pins (Figure 8c).
In conjunction with the contour and streamlines of velocity in the inlet channel in Figure 8a, the presence of pins can be attributed to multiple groups of converging–diverging nozzles in the inlet channel [40]. When the gas flows past the pin, the pressure at the front side of the pin increases due to the contraction of the channel diameter, leading to increased gas flow through the porous medium in this place. As the gas flows between two pins, the velocity increases suddenly, causing a drop in permeation velocity in this position. After this place, the velocity in the inlet channel returns to normal, and the pressure reduces slightly. Consequently, the velocity of permeation exhibits variations at a lower magnitude. Furthermore, the pins’ presence also influences the gas flow direction in the inlet channel, subsequently impacting the axial permeability velocity. In front of the pins, part of the gas is obstructed and redirected around. Upon passing through the region occupied by the pins, fluid disperses laterally, resulting in an increased gas flow toward the porous medium. Simultaneously, low-speed eddy recirculation zones form in front of and behind the pins, altering fluid direction and converting a portion of gas kinetic energy into pressure potential energy, thereby enhancing the regional permeation rate. Moreover, the greater the kinetic energy present near the pins, the more obvious the effect of eddy motion and pressure on kinetic energy reduction [47].
The variance in axial permeation velocities among the three conditions with different numbers of pins is compared to investigate their impact on the axial permeation velocities. The findings are presented in Figure 8d. The addition of pins can partially enhance the axial permeation velocity, exhibiting an enhancement in uniformity.

3.3.2. Alternate Arrangement

The pins are arranged in a staggered pattern above and below the inlet channel, with one to four pairs of pins set at regular intervals, as depicted in Figure 9. Compared to the symmetrical arrangement, the increase in permeation velocity near the inlet is relatively smaller. However, with a deeper airflow within the inlet channel, each pin’s corresponding permeation velocity will also experience a sudden drop to some extent, which can be attributed to flow velocity and pressure distribution within the inlet channel, as indicated in Figure 9a–c.
The channel size at the pins of an alternating distribution exceeds that of a symmetrical distribution. Consequently, this leads to smaller changes in front pressure and permeation velocity. Eddy recirculation is also present at the rear of the pins. When combined with the pressure changes depicted in Figure 9c, it is evident that, with the same number of pins, the pressure within the inlet channel will experience a slight increase due to their alternate distribution. This may be attributed to the fact that positioning a pin in a region with higher fluid power allows for stronger disturbance to the fluid and more pronounced recirculation, consequently resulting in greater kinetic energy dissipation.
Furthermore, a small range of high-permeability areas exist in front of each pin because the flow redirection changes, which is caused by partial blockage. When an alternating arrangement is employed, this high-permeability phenomenon becomes more pronounced within that area. There are two possible reasons:
The first reason is that under an equal number of pins, the alternating positions are more dispersed, effectively disrupting gas flow at higher speeds compared to symmetrical arrangements, thus influencing airflow direction less significantly than that of alternating distribution [48].
The second reason concerns the impact of the symmetrical arrangement on airflow direction, which is less significant compared to alternative arrangements. This can be attributed to the substantial variation in size within the symmetrical arrangement area, resulting in higher pressure ahead of the pins. This increase in permeation velocity in front of the pins primarily stems from such pressure differences, while the influence of changes in airflow direction on permeation velocity remains inconspicuous.
The variance of axial seepage velocity is also compared, as illustrated in Figure 9d. In the model, as the number of pins increases, the variance initially decreases before slightly increasing. When the number of pins is four pairs, there is a slight increase in variance. However, this value remains comparable to that observed with three pairs of pins. In addition, the comparative analysis of the two arrangements reveals that the symmetrical arrangement offers a small advantage in enhancing uniformity with an equivalent number of pins.

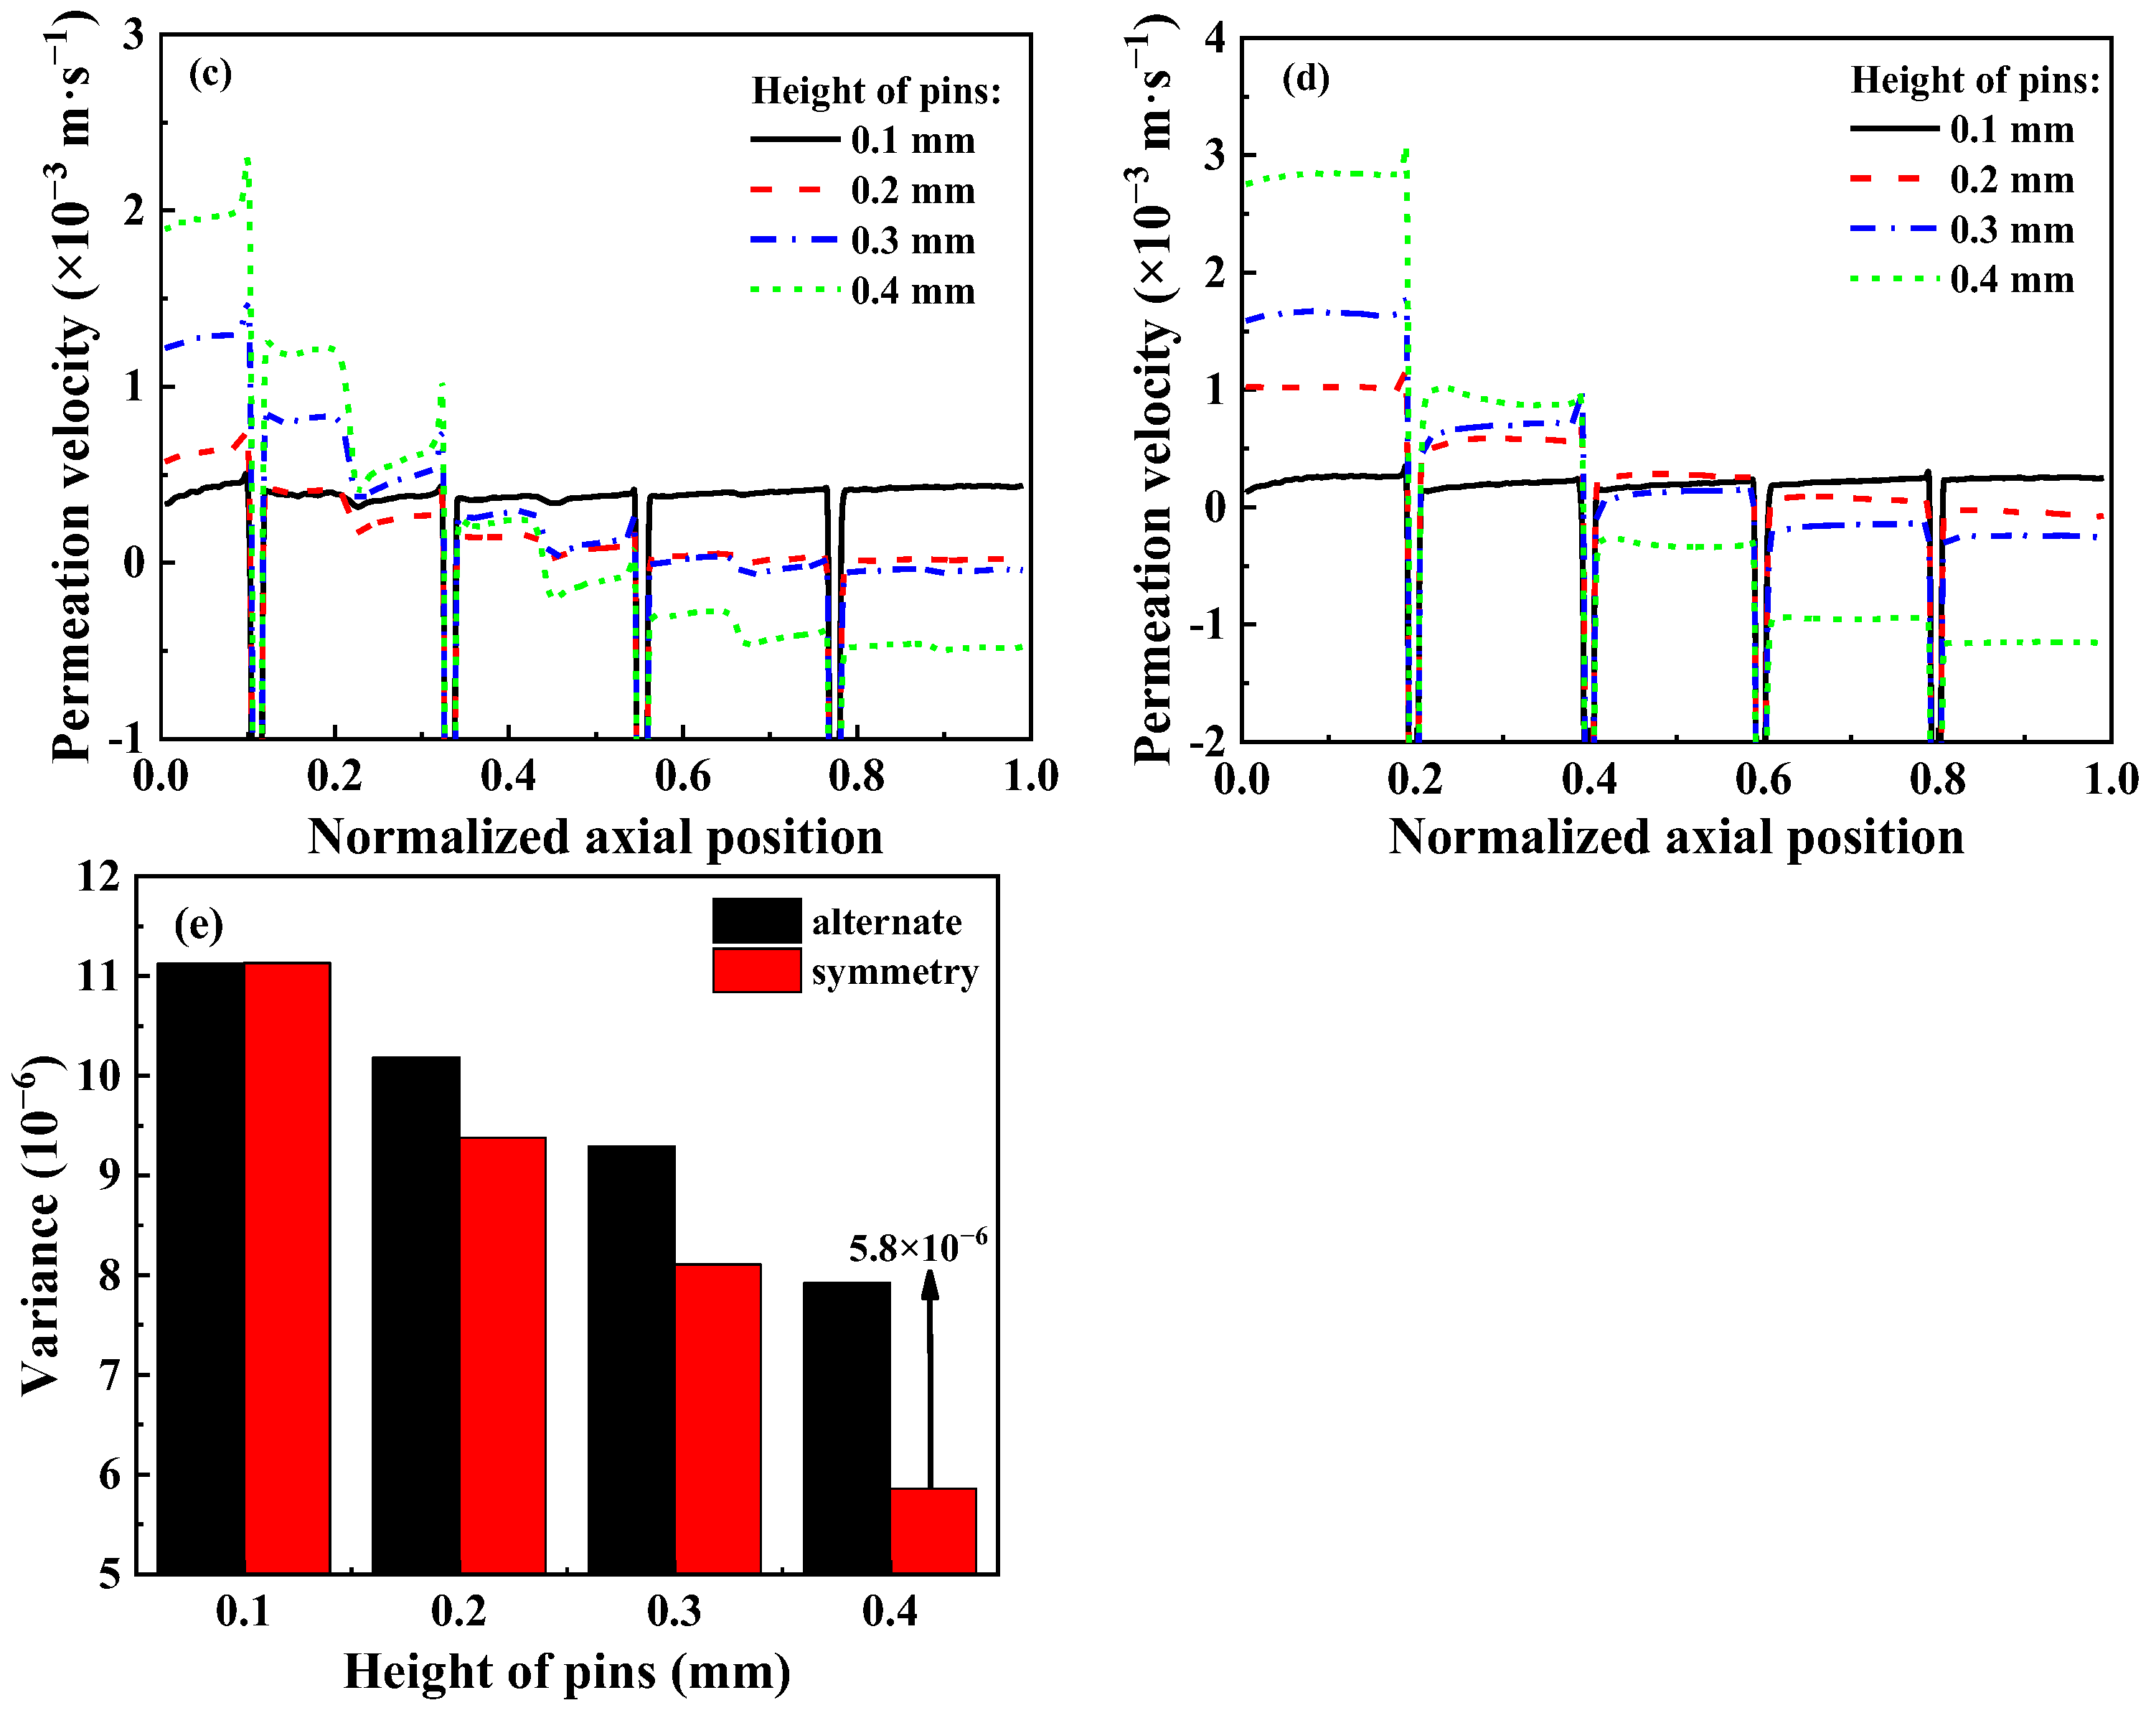
3.3.3. Different Height

The size structure of the inlet channel is influenced by the height of the pins, subsequently impacting both pressure drop and permeation velocity. In this model, the heights of symmetrical and staggered disturbance bodies are adjusted to within a range of 0.1–0.4 mm.
With the increase in pin height, the permeation velocity at the front of the porous medium increases, while the permeation velocity at the back of the porous medium decreases. The change in symmetrical arrangement becomes more pronounced. By comparing the velocity distributions of both arrangements, it is evident that an increase in pin height results in a contraction of flow space at corresponding positions, leading to local flow velocity increases. This causes a gradual shift in fluid flow from the center to the side without pins and the space on both sides of the pins (particularly in symmetrical arrangements) [49], as shown in Figure 10a,b. When the pin height is 0.4 mm, the velocities on both sides tend to align with those at the center. When the pin height reaches 0.4 mm, the channel size at the pins is reduced to 0.3 mm, severely restricting gas flow. This significantly increases the local velocity and high pressure in the front of the inlet channel, thereby impacting the permeation rate. The comparison of permeation velocities at different pin heights in Figure 10c,d reveals that as the pin height increases, the permeation velocity at the same axial position increases, leading to enhanced pressure and permeation speed at corresponding positions.
Figure 10e illustrates the variance in axial permeation velocity for both arrangements. As the pin height increases, the variance gradually decreases for both arrangements, indicating that within a height of 0.4 mm in our model, there is improved axial permeation velocity performance with increasing height, and the effect of the symmetrical arrangement is more obvious.

3.4. Combination

Based on the above findings, the alteration in wall velocity due to changes in zoned coating remains consistent along the axial direction. However, the introduction of pins primarily results in an increased wall velocity near the inlet surface. Consequently, from a theoretical perspective, the integration of zoned coating with disturbed fluid can potentially enhance the axial uniformity of wall velocity. For the high coated zone (the second part) with partition ratio X = 0.6–0.8, four sets of symmetrical or alternating pins are introduced, with respective heights set at 0.3 mm. The results are illustrated in Figure 11.
With the addition of pins, the permeation velocity near the inlet is further augmented, while that in the second part is reduced. Meanwhile, the lowest permeability velocity in the first part experiences a slight increase. Based on relevant working conditions of all pins, it is observed that, compared to the initial working conditions without pins, the curves of the condition of adding pins changes around the point, 80% away from the inlet surface, with an increased permeation velocity in front of the point and a decreased permeation velocity behind.
Upon comparing the differences in Figure 11c, it is observed that the effect of symmetrical arrangement is slightly better than that of the alternate arrangement when only one pair of pins is placed at the rear end of the zoned porous medium. Notably, when X = 0.6, combining porosity partitioning with pins yields the most significant effect, resulting in an approximately 75% enhancement in homogeneity compared to the initial working condition.
While the use of pins significantly improves flow uniformity and enhances mixing, it also leads to an increase in pressure drop across the channel. This trade-off between improved flow distribution and higher energy consumption should be carefully considered in the design of such systems.

4. Conclusions

This study investigates the effects of partition coatings and pin configurations on flow uniformity in a three-dimensional single-channel GPF model. Key findings are summarized as follows:
A porosity of 0.497 in the high coated zone (second part) of the porous medium achieves superior flow uniformity under average partitioning conditions. Adjusting the length ratio (X) between the first and second parts to 0.4 and 0.6, respectively, while maintaining constant porosity in the shorter part, significantly improves flow distribution. Optimal variance is achieved at X = 0.6–0.7, resulting in a 65% improvement uniformity.
Symmetrically and alternately arranged pins on the upper and lower sides of the inlet channel enhance flow homogeneity. Increasing the number of pins reduces velocity variance, with symmetrically arranged pins showing gradual variance reduction and alternately arranged pins demonstrating continuous improvement. Varying pin heights from 0.1 to 0.4 mm while maintaining four groups consistently decreases variance, further enhancing flow uniformity. Permeation velocity near the inlet surface increases with the number of pins, attributed to pressure and eddy effects within the pin regions.
Combining partition-coated zones with pin configurations improves permeation velocity in the first 80% of the porous medium. The integrated approach enhances flow uniformity by approximately 75%, demonstrating the synergistic effect of these two methods. These results provide valuable insights for optimizing porous medium designs to achieve enhanced flow uniformity in GPF applications.

Author Contributions

Y.H.: formal analysis, software, methodology, investigation, writing—original draft. F.Z.: conceptualization, writing—review and editing, funding acquisition. Y.P.: funding acquisition, conceptualization, writing—review and editing, project administration. All authors have read and agreed to the published version of the manuscript.

Funding

This research was funded by Scientific and Technological Project of Yunnan Precious Metals Laboratory (No.: YPML-2023050263).

Institutional Review Board Statement

Not applicable.

Informed Consent Statement

Not applicable.

Data Availability Statement

The raw data presented in this study are included in the article. Further inquiries can be directed at the corresponding author.

Acknowledgments

The authors would like to express their gratitude to Dongxia Yang, Wenzheng Xia, Xinbo Yuan, and Qiang Ren for their valuable contributions to the investigation, resources, methodology, and supervision of this work.

Conflicts of Interest

The authors declare no conflict of interest.

Nomenclature

Abbreviation
GPFgasoline particulate filter
Symbols
ρ fluid density
t time
V velocity components in the x, y, and z directions
Ppressure
μ viscosity
v magnitude of the velocity
Llength
S momentum source term
vwwall velocity
Subscripts
frontporous medium’s low coated parts
rearporous medium’s high coated parts
aveaverage

References

  1. Yanzhao, A. Experimental and Numerical Studies on the Soot Particle Formation Mechanism in the Gasoline Direct Injection Engine D. Ph.D. Thesis, Tianjin University, Tianjin, China, 2016. [Google Scholar]
  2. Pope Iii, C.A.; Burnett, R.T.; Thun, M.J.; Calle, E.E.; Krewski, D.; Ito, K.; Thurston, G.D. Lung Cancer, Cardiopulmonary Mortality, and Long-Term Exposure to Fine Particulate Air Pollution. J. Am. Med. Assoc. 2002, 287, 1132–1141. [Google Scholar] [CrossRef]
  3. Gong, J.; Rutland, C. A Quasi-Dimensional NOx Emission Model for Spark Ignition Direct Injection (SIDI) Gasoline Engines; SAE: Melbourne, Australia, 2013. [Google Scholar]
  4. Zhang, J.; Wong, V.W.; Shuai, S.; Chen, Y.; Sappok, A. Quantitative Estimation of the Impact of Ash Accumulation on Diesel Particulate Filter Related Fuel Penalty for a Typical Modern on-Road Heavy-Duty Diesel Engine. Appl. Energy 2018, 229, 1010–1023. [Google Scholar] [CrossRef]
  5. Nakamura, K.; Sugaya, Y.; Yamaguchi, K.; Kusaka, J.; Arndt, M.; Dardiotis, C. Characterization of Soot Loading and Filtration Efficiency of a Gasoline Particulate Filter with Photoacoustic Sensor and Particle Number Counting Systems. Atmosphere 2023, 14, 476. [Google Scholar] [CrossRef]
  6. Johnson, T. Vehicular Emissions in Review. SAE Int. J. Engines 2016, 9, 1258–1275. [Google Scholar] [CrossRef]
  7. Park, G.; Park, S.; Hwang, T.; Oh, S.; Lee, S. A Study on the Impact of DPF Failure on Diesel Vehicles Emissions of Particulate Matter. Appl. Sci. 2023, 13, 7592. [Google Scholar] [CrossRef]
  8. Cho, I.; Moon, I.; Kim, D.; Park, T.; Lee, D.; Lee, J. Experimental Investigation on OBD Signal and PN Emission Characteristics by Damaged-DPF Types of 2.0 L Diesel Vehicle. Appl. Sci. 2022, 12, 7853. [Google Scholar] [CrossRef]
  9. Di Sarli, V.; Di Benedetto, A. Using CFD Simulation as a Tool to Identify Optimal Operating Conditions for Regeneration of a Catalytic Diesel Particulate Filter. Appl. Sci. 2019, 9, 3453. [Google Scholar] [CrossRef]
  10. Richter, J.M.; Klingmann, R.; Spiess, S.; Wong, K.-F. Application of Catalyzed Gasoline Particulate Filters to GDI Vehicles. SAE Int. J. Engines 2012, 5, 1361–1370. [Google Scholar] [CrossRef]
  11. Prikhodko, V.Y.; Curran, S.J.; Barone, T.L.; Lewis, S.A.; Storey, J.M.; Cho, K.; Wagner, R.M.; Parks, J.E. Emission Characteristics of a Diesel Engine Operating with In-Cylinder Gasoline and Diesel Fuel Blending. SAE Int. J. Fuels Lubr. 2010, 3, 946–955. [Google Scholar] [CrossRef]
  12. Sirignano, M.; D’Anna, A. Filtration and Coagulation Efficiency of Sub-10 nm Combustion-Generated Particles. Fuel 2018, 221, 298–302. [Google Scholar] [CrossRef]
  13. Yu, M.; Luss, D.; Balakotaiah, V. Regeneration modes and peak temperatures in a diesel particulate filter. Chem. Eng. J. 2013, 232, 541–554. [Google Scholar] [CrossRef]
  14. Mamakos, A.; Steininger, N.; Martini, G.; Dilara, P.; Drossinos, Y. Cost Effectiveness of Particulate Filter Installation on Direct Injection Gasoline Vehicles. Atmos. Environ. 2013, 77, 16–23. [Google Scholar] [CrossRef]
  15. Gong, J.; Stewart, M.L.; Zelenyuk, A.; Strzelec, A.; Viswanathan, S.; Rothamer, D.A.; Foster, D.E.; Rutland, C.J. Importance of Filter’s Microstructure in Dynamic Filtration Modeling of Gasoline Particulate Filters (GPFs): Inhomogeneous Porosity and Pore size Distribution. Chem. Eng. J. 2018, 338, 15–26. [Google Scholar] [CrossRef]
  16. Chan, T.W.; Meloche, E.; Kubsh, J.; Rosenblatt, D.; Brezny, R.; Rideout, G. Evaluation of a Gasoline Particulate Filter to Reduce Particle Emissions from a Gasoline Direct Injection Vehicle. SAE Int. J. Fuels Lubr. 2012, 5, 1277–1290. [Google Scholar] [CrossRef]
  17. Lambert, C.; Chanko, T.; Dobson, D.; Liu, X.; Pakko, J. Gasoline Particle Filter Development. Emiss. Control Sci. Technol. 2017, 3, 105–111. [Google Scholar] [CrossRef]
  18. Liu, H.; Li, Z.; Zhang, M.; Xu, H.; Ma, X.; Shuai, S. Exhaust Non-Volatile Particle Filtration Characteristics of Three-Way Catalyst and Influencing Factors in a Gasoline Direct Injection Engine Compared to Gasoline Particulate Filter. Fuel 2021, 290, 120065. [Google Scholar] [CrossRef]
  19. Jang, J.; Lee, J.; Choi, Y.; Park, S. Reduction of Particle Emissions from Gasoline Vehicles with Direct Fuel Injection Systems Using a Gasoline Particulate Filter. Sci. Total Environ. 2018, 644, 1418–1428. [Google Scholar] [CrossRef]
  20. Gong, J.; Viswanathan, S.; Rothamer, D.A.; Foster, D.E.; Rutland, C.J. Dynamic Heterogeneous Multiscale Filtration Model: Probing Micro- and Macroscopic Filtration Characteristics of Gasoline Particulate Filters. Environ. Sci. Technol. 2017, 51, 11196–11204. [Google Scholar] [CrossRef]
  21. Gong, J.; Rutland, C.J. PDF-Based Heterogeneous Multiscale Filtration Model. Environ. Sci. Technol. 2015, 49, 4963–4970. [Google Scholar] [CrossRef] [PubMed]
  22. Gong, J.; Rutland, C.J. Filtration Characteristics of Fuel Neutral Particulates Using a Heterogeneous Multiscale Filtration Model. J. Eng. Gas Turbines Power 2015, 137, 111507. [Google Scholar] [CrossRef]
  23. Viswanathan, S.; Rothamer, D.; Sakai, S.; Hageman, M.; Foster, D.; Fansler, T.; Andrie, M. Effect of Particle Size Distribution on the Deep-Bed Capture Efficiency of an Exhaust Particulate Filter. J. Eng. Gas Turbines Power 2015, 137, 101504. [Google Scholar] [CrossRef]
  24. Cooper, J.D.; Liu, L.; Ramskill, N.P.; Watling, T.C.; York, A.P.E.; Stitt, E.H.; Sederman, A.J.; Gladden, L.F. Numerical and Experimental Studies of Gas Flow in a Particulate Filter. Chem. Eng. Sci. 2019, 209, 115179. [Google Scholar] [CrossRef]
  25. Kong, X.; Li, Z.; Shen, B.; Wu, Y.; Zhang, Y.; Cai, D. Simulation of Flow and Soot Particle Distribution in Wall-Flow DPF Based on Lattice Boltzmann Method. Chem. Eng. Sci. 2019, 202, 169–185. [Google Scholar] [CrossRef]
  26. Zou, J.; Chen, X.; Song, B.; Cui, Y. Bionic Spider Web Flexible Strain Sensor Based on CF-L and Machine Learning. ACS Appl. Mater. Interfaces 2024, 16, 23761–23770. [Google Scholar] [CrossRef] [PubMed]
  27. Onori, S.; Korneev, S. Modeling the Flow and Transport Dynamics in Gasoline Particulate Filters to Improve Filtration Efficiency. J. Dyn. Syst. Meas. Control 2020, 142, 061006. [Google Scholar] [CrossRef]
  28. Walter, R.; Neumann, J.; Hinrichsen, O. A Model-Based Analysis of Washcoat Distribution on Zoned Coated Gasoline Particulate Filters. Chem. Eng. J. 2022, 441, 135615. [Google Scholar] [CrossRef]
  29. Thorsten Boger, W.C. Reducing Particulate Emissions in Gasoline Engines; SAE: Melbourne, Australia, 2018. [Google Scholar]
  30. Yang, S.; Liu, K.-b.; Yi, S.; Ye, S.; Li, J.; Yuan, H.; Zhao, G.; Pei, S.; He, L.; Ding, X.; et al. Distribution and Provenance of Modern Pollen and Spores in the Surface Sediments of Liaodong Bay, China. Mar. Geol. 2016, 376, 1–14. [Google Scholar] [CrossRef]
  31. Bissett, E.J. Mathematical Model of the Thermal Regeneration of a Wall-Flow Monolith Diesel Particulate Filter. Chem. Eng. Sci. 1984, 39, 1233–1244. [Google Scholar] [CrossRef]
  32. Gomez-Flores, A.; Hwang, G.; Ilyas, S.; Kim, H. A CFD study of the transport and fate of airborne droplets in a ventilated office: The role of droplet-droplet interactions. Front. Environ. Sci. Eng. 2021, 16, 31. [Google Scholar] [CrossRef]
  33. Peters, B.J. Numerical Simulation of a Diesel Particulate Filter during Loading and Regeneration. In Proceedings of the ASME 2003 Internal Combustion Engine Division Spring Technical Conference, Salzburg, Austria, 11–14 May 2003. [Google Scholar]
  34. Xiao, G.; Li, B.; Tian, H.; Leng, X.; Long, W. Numerical Study on Flow and Pressure Drop Characteristics of a Novel Type Asymmetric Wall-Flow Diesel Particulate Filter. Fuel 2020, 267, 117148. [Google Scholar] [CrossRef]
  35. Zhang, X.; William Ruona, P.T. 3D Numerical Study of Pressure Loss Characteristics and Filtration Efficiency through a Frontal Unplugged DPF. SAE Int. J. Fuels Lubr. 2010, 3, 177–193. [Google Scholar]
  36. Li, Y. GPF Capture and Regeneration Characteristics of GDI Engine under Typical Working Conditions. Master’s Thesis, Jilin University, Changchun, China, 2022. [Google Scholar]
  37. Wang, X.; Deng, Y.; Yan, T.; Liu, Y. Numerical Investigation on the Progressive Evolution of Regeneration Pattern with Feed Temperature in a Wall-Flow-Catalyzed Diesel Particulate Filter. Ind. Eng. Chem. Res. 2022, 61, 10736–10746. [Google Scholar] [CrossRef]
  38. Chiavola, O.; Chiatti, G.; Sirhan, N. Impact of Particulate Size During Deep Loading on DPF Management. Appl. Sci. 2019, 9, 3075. [Google Scholar] [CrossRef]
  39. Özşimşek, A.O.; Omar, M.A. A numerical study on the effect of employing porous medium on thermal performance of a PV/T system. Renew. Energy 2024, 226, 120327. [Google Scholar] [CrossRef]
  40. Jahangir, S.; Hogendoorn, W.; Poelma, C. Dynamics of Partial Cavitation in an Axisymmetric Converging-Diverging Nozzle. Int. J. Multiph. Flow. 2018, 106, 34–45. [Google Scholar] [CrossRef]
  41. Wang, Y.; Pan, Y.; Su, C.; Srinivasan, A.; Gong, J.; Kamp, C.J. Performance of Asymmetric Particulate Filter with Soot and Ash Deposits: Analytical Solution and Its Application. Ind. Eng. Chem. Res. 2018, 57, 15846–15856. [Google Scholar] [CrossRef]
  42. Opitz, B.; Votsmeier, M. A Simulation Study on the Conversion Efficiency of Catalytically Active Particulate Filters. Chem. Eng. Sci. 2016, 149, 117–128. [Google Scholar] [CrossRef]
  43. Zuo, Q.; Xie, Y.; Zhu, G.; Wei, K.; Zhang, B.; Chen, W.; Tang, Y.; Wang, Z. Investigations on a New C-GPFs with Electric Heating for Enhancing the Integrated Regeneration Performance under Critical Parameters. Energy 2021, 225, 120265. [Google Scholar] [CrossRef]
  44. Belot, I.; Vidal, D.; Votsmeier, M.; Hayes, R.E.; Bertrand, F. Numerical Investigation of the Impact of Washcoat Distribution on the Filtration Performance of Gasoline Particulate Filters. Chem. Eng. Sci. 2020, 221, 115656. [Google Scholar] [CrossRef]
  45. Di Sarli, V.; Di Benedetto, A. Modeling and Simulation of Soot Combustion Dynamics in a Catalytic Diesel Particulate Filter. Chem. Eng. Sci. 2015, 137, 69–78. [Google Scholar] [CrossRef]
  46. Boger, T.; Cutler, W. Reducing Particulate Emission in Gasoline Engines; SAE International: Warrendale, PA, USA, 2019. [Google Scholar]
  47. Bres, G.A.; Ham, F.E.; Nichols, J.W.; Lele, S.K. Unstructured Large-Eddy Simulations of Supersonic Jets. AIAA J. 2017, 55, 1164–1184. [Google Scholar]
  48. Kai, C. Numerical Investigation on Heat Transfer Performance and Flow Behavior of Special-Shaped Pipe. Master’s Thesis, Tianjin University, Tianjin, China, 2006. [Google Scholar]
  49. Bensaid, S.; Marchisio, D.L.; Fino, D.; Saracco, G.; Specchia, V. Modelling of Diesel Particulate Filtration in Wall-Flow Traps. Chem. Eng. J. 2009, 154, 211–218. [Google Scholar] [CrossRef]
Figure 1. Structure scheme of a single-channel wall-flow GPF model.
Applsci 15 03854 g001
Figure 2. Grid independence test and verification.
Applsci 15 03854 g002
Figure 3. Verification of pressure drop under different engine torques with experimental data.
Applsci 15 03854 g003
Figure 4. (a) Contour and curve of axial permeation velocity distribution, (b) velocity variance corresponding to different porosity when X = 0.5.
Applsci 15 03854 g004
Figure 5. (a) Curve of axial permeation velocity distribution, and (b) velocity variance corresponding to different X and fixed coated zones.
Applsci 15 03854 g005
Figure 6. (a) Contour and curve of axial permeation velocity distribution, (b) variance (solid line, variance) and ε f r o n t corresponding to different X when ε r e a r is fixed.
Applsci 15 03854 g006
Figure 7. Structural diagram of GPF with pins.
Applsci 15 03854 g007
Figure 8. (a) Contour and vector of axial inlet channel velocity, (b,c) curve of permeation velocity difference and pressure distribution, and (d) variance corresponding to different numbers of pins arranged symmetrically.
Applsci 15 03854 g008
Figure 9. (a) Contour and vector of axial inlet channel velocity, (b,c) curve of permeation velocity difference and pressure distribution, and (d) variance corresponding to different numbers of pins arranged alternately.
Applsci 15 03854 g009aApplsci 15 03854 g009b
Figure 10. (a,b) Contours of axial inlet channel velocity, (c,d) curves of permeation velocity distribution, and (e) variance corresponding to different heights of pins arranged alternately and symmetrically.
Applsci 15 03854 g010aApplsci 15 03854 g010b
Figure 11. (a,b) Curve of axial permeation velocity distribution, and (c) variance corresponding to zoned washcoat and pins arranged alternately and symmetrically.
Applsci 15 03854 g011
Table 1. Initial condition.
Initial ParametersNumber
Inlet velocity (m·s−1)11
Outlet pressureAtmospheric pressure
Porosity0.5
Viscous resistance (m−2)6.5 × 10¹²
Inertial resistance (m−1)2 × 10⁸
Exhaust density (kg·m−3)1
Dynamic viscosity (Pa·s)2.9 × 10⁻⁵
Re417
Table 2. Model validation condition.
ParametersValue
Diameter (mm)330.2
Length (mm)177.8
Thickness (mm)0.31
Inlet volume flow rate (m3·s−1)0.2–0.8
Cell density (cpsi)300
Disclaimer/Publisher’s Note: The statements, opinions and data contained in all publications are solely those of the individual author(s) and contributor(s) and not of MDPI and/or the editor(s). MDPI and/or the editor(s) disclaim responsibility for any injury to people or property resulting from any ideas, methods, instructions or products referred to in the content.

