1. Introduction
As global life expectancy increases, the demographic shift towards aging populations has precipitated a surge in age-related health conditions, with neurodegenerative diseases, particularly Alzheimer’s disease (AD), emerging as a significant public health challenge. AD, characterized by complex pathology and progressive cognitive decline, is the leading cause of dementia, accounting for 60% to 70% of the nearly 10 million new dementia cases reported annually worldwide, according to the latest report from the World Health Organization (WHO) [
1]. The socioeconomic burden is equally alarming, with the global cost of dementia surpassing USD 1.3 trillion in 2019, nearly half of which falls on informal caregivers [
2]. These staggering figures underscore the urgent need for advancements in early diagnosis and disease management.
Despite decades of research, AD remains incurable, with existing treatments addressing only symptomatic relief while failing to target underlying disease mechanisms. Moreover, the diagnostic landscape is similarly limited. AD is notoriously difficult to diagnose in its preclinical stages, during which pathological changes—such as A
plaque deposition and tau protein tangles—begin years before clinical symptoms manifest [
3,
4,
5]. These early biomarkers are crucial for intervention yet notoriously difficult to detect. Nonetheless, they have become a staple in the defining criteria for the diagnosis of AD [
6].
While these biomarkers are pivotal for early intervention, their detection remains a significant challenge due to the limitations of current diagnostic tools. Traditional diagnostic methods—relying on clinical observations and post mortem analyses—have evolved into new diagnostic modalities, including neuroimaging and biochemical testing, which have significantly enhanced our ability to detect these biomarkers in vivo. These advancements represent significant progress, but they are often limited by high costs, low sensitivity and specificity, and barriers to widespread clinical adoption, which hampers a wide spread to clinical applications [
7,
8,
9]. Therefore, to attain these challenges, there is an urgent need for the creation of innovative diagnostic platforms that combine real-time, sensitive biomarker detection with scalability and accessibility.
Biosensors, particularly optical biosensors, have emerged as promising solutions for addressing these diagnostic gaps [
10]. Optical biosensors utilize light–matter interactions to detect biomolecular signatures, with high sensitivity and specificity. They can detect biomolecular interactions originating from several intertanglements of light such as absorbance, transmittance, and fluorescence levels. These biosensors have the ability to provide non-invasive, real-time molecular insights, which makes them particularly suitable for applications in preclinical and clinical Alzheimer’s research [
11]. Particularly, fluorescence-based biosensors offer a powerful approach for the visualization and quantification of biomarkers, providing high sensitivity and real-time detection capabilities [
12]. These advantages stem from the unique optical properties of fluorescence, which enable highly specific signals, and offer rapid and non-destructive analysis, making them well suited for continuous monitoring in biological systems, which further enhances their applicability in multiplexed assays for Alzheimer’s biomarker detection [
13,
14,
15]. In the context of AD, optical sensors enable the detection of A
by identifying the binding of a fluorescent probe to the target biomarker.
Undoubtedly, biosensors attain one aspect of this research framework. However, it is also essential to recognize the recent advancements in microfluidics and sensor miniaturization, which have enabled the development of complex integrated platforms, such as the brain-on-a-chip (BoC) [
16,
17]. These systems’ purpose is to replicate the microenvironment of the human brain by comprising miniaturized brain organoids, allowing researchers to study neurodegenerative mechanisms under physiologically relevant conditions [
10,
16,
18]. Due to their capability to operate with remarkably smaller concentrations of biological compounds and emulate dynamic conditions, the scientific community can study intricate biochemical interactions and disease progression with higher precision and relevance. These platforms have the potential to significantly transform the approach to addressing neurological diseases, either in their diagnosis or in the investigation of effective treatments.
Moreover, advanced microfluidic devices offer distinct advantages over traditional bulkscale (macro) diagnostic setups. By operating at the microscale, these systems minimize reagent consumption, reduce operational costs, and provide precise control over experimental environments, enabling higher sensitivity and specificity in biomarker detection. They also replicate the dynamic in vivo conditions found in the human body, such as mimicking cerebrospinal fluid flow, further enhancing their relevance to physiological studies [
19,
20]. When combining advanced microfluidic devices, such as BoC with biosensors, a controlled and physiologically relevant environment is created, enabling improved biomarker detection without disturbing the homeostasis of the biomodels [
21,
22].
However, transitioning from macro- to microfluidic platforms poses challenges, such as maintaining signal integrity and ensuring reproducibility under flow conditions and miniaturized setups. Overcoming these obstacles is crucial, as doing so could provide valuable insights into the study of neurodegenerative diseases and the evaluation of drug efficacy. So far, as for the research conducted for the detection of AD hallmark the A biomarker, few studies have directly compared biomarker detection performance across macro- and microfluidic platforms, leaving a critical gap in understanding the benefits and trade-offs of biosensing integrated with microfluidics as a platform for AD detection and monitoring. Given the scarcity of research in this area and the pressing need within the scientific community to address this neurodegenerative disorder, validating the hypothesis of integrating a biosensor for AD detection in an advanced microfluidic device would be a significant breakthrough.
To achieve this scientific goal, the present study presents a proof-of-concept miniaturized sensing platform for detecting the AD-specific A
biomarker, using the commercial fluorophore CRANAD-2, with high affinity for A
aggregates (Kd = 38 nM) [
23]. CRANAD-2 is a fluorescent probe specifically designed for A
in vivo bioimaging, offering high binding specificity and a robust fluorescence response, making it an ideal candidate for optical biosensing [
23,
24]. The selectivity of this fluorescent probe for A
binding has been thoroughly characterized, both in vivo and in vitro [
23,
24,
25,
26]. Previous studies have demonstrated specific binding to A
fibril compared to other proteins such as a-synuclein and insulin [
26]. This study also included specificity binding results by immunohistochemistry and its capability for in vivo multi-spectral optoacoustic tomography (MSOT) cerebral A
mapping, confirming CRANAD-2 as a suitable optical detection probe for AD. The proposed methodology involves a two-tier experimental approach: (i) the validation of CRANAD-2’s fluorescence properties and binding efficacy in a macroscale configuration, using an optical spectrophotometer to establish baseline detection performance and feasibility; (ii) the adaptation of the macroscale experiments into a microfluidic platform, designed to evaluate the respective probe’s performance. This comparative analysis elucidates critical differences in sensitivity, specificity, and scalability between the two setups, highlighting the advantages of microfluidic integration for real-time biomarker detection.
To the best of our knowledge this microfluidic-sensing approach for the detection of A
using CRANAD-2 has never been reported before.
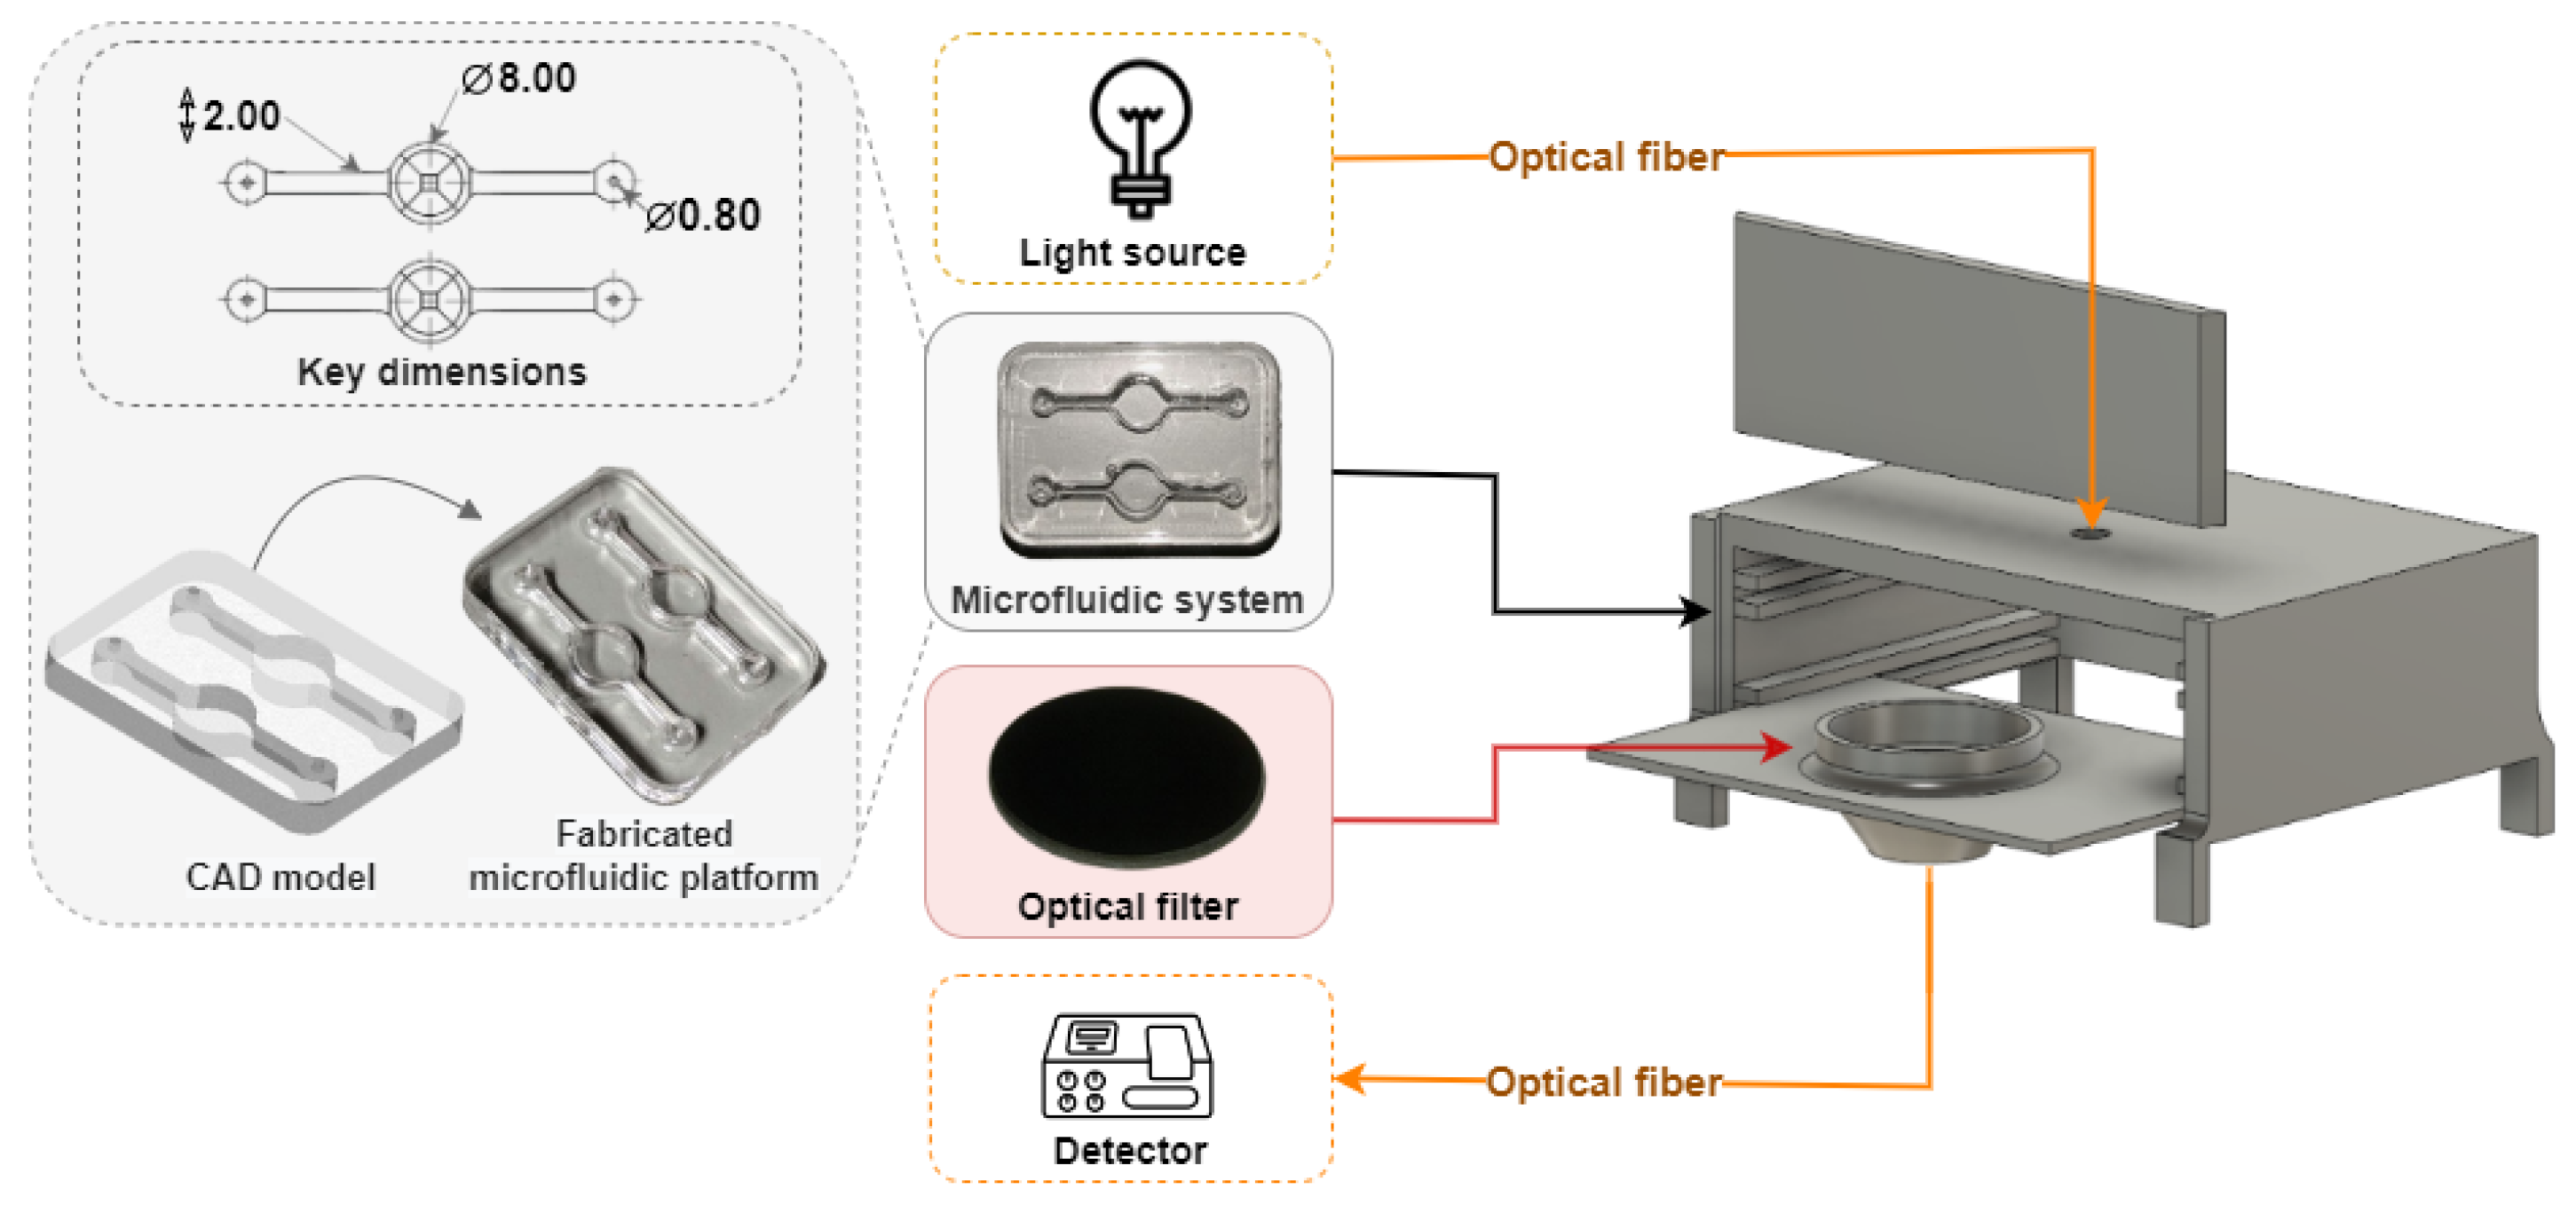
Figure 1 shows a graphical representation of the microfluidic-sensing device and the experimental setup used for A
detection.
By advancing this proof-of-concept system, we lay the groundwork for a fully integrated microfluidic-sensing platform. Ultimately, this technological tool can be uplifted to a BoC-sensing device, which has the potential to facilitate progress in AD research, especially in the preclinical screening of new AD drug formulations, early diagnosis, and personalized medicine.
2. Materials and Methods
2.1. Reagents
CRANAD-2, a commercial near-infrared fluorescent probe highly selective for A
aggregates, was used as an optical reporter of the AD hallmark. CRANAD-2 is described to display a typical 70-fold increase in fluorescence and a 90 nm blue shift when interacting with A
[
23]. In our study, CRANAD-2 (abcam, AB141775) was prepared using two solvents: phosphate-buffered saline (PBS, 1×, pH 7.4) purchased from CORNING (21-040-CMR) and methanol (MeOH, HPLC grade) purchased from Labkem (MTOL-0GH-2K5). A
peptides (1–40), human (abcam, AB120479), were used as oligomers and fibrils conformations. The oligomeric A
was prepared in PBS (pH 7.4), while fibrils were formed in a 10 mM hydrochloric acid solution (HCL prepared from 1M HCL stock solution diluted in PBS) incubated at 37 ºC during 24 h, following the protocol described by Stine et al. [
27].
For preliminary assessments, CRANAD-2 samples were prepared in both PBS and MeOH to evaluate solvent effects and optimize conditions for fluorescence detection. CRANAD-2 was prepared at concentrations of 0.5 μM, 1 μM, and 2 μM in both solvents to investigate how solvent choice influenced its fluorescence properties. For further optimization, CRANAD-2 was also prepared at concentrations of 5 μM and 25 μM, in MeOH. A peptides were prepared at a series of concentrations—5 nM, 10 nM, 25 nM, 50 nM, 100 nM, 200 nM, 500 nM, and 1000 nM—to establish a concentration gradient for studying both oligomeric and fibrillar A forms. Both A conformations were analyzed by dynamic light scattering and zeta potential (Antor Paar, litesizer DLS 500), focusing on their hydrodynamic size and electrophoretic mobility measurement features.
For fluorescence assays, CRANAD-2 was mixed with A oligomers or fibrils at a 1:1 (v/v) ratio. For macroscopic validations, this translates into a final volume of 2 mL per sample. At microfluidic scale, the same procedure was used, but with a volume of 150 μL per sample, following the same ratio. All samples’ preparations and fluorescence measurements were performed at room temperature (RT).
To ensure reproducibility, the solutions containing A and CRANAD-2 were mixed immediately before the optical analysis (i.e., prior to loading into the cuvette or pumping to the inlet of the microfluidic channel using a syringe pump), allowing adequate interaction and analysis between the molecules. All samples were prepared freshly before each experiment to maintain the structural integrity of A peptides and ensure reliable fluorescence measurements.
2.2. Macroscale Experimental Tests
Fluorescence and absorbance measurements were conducted using an Avantes AvaSpec-ULS2048x64-EVO spectrometer, which operates over a broad spectral range from 200 nm to 1100 nm. The excitation wavelength was set to 590 nm, selected based on the measured absorption profile of CRANAD-2 (
Figure S1 in Supplementary Materials). The excitation source consisted of a specialized color LED (HLMP-EL10-13K00) configured to deliver a stable and uniform light output. The emitted fluorescence spectrum was collected using an optical fiber. A long-pass optical filter (Thorlabs FGL695) with a 695 nm cut-off wavelength was also integrated into the detection pathway to block the excitation light. To verify the filter’s proper performance and ensure accurate fluorescence measurements, e.g., suppressing the excitation light, transmission tests were conducted (
Figure S2 in Supplementary Materials) to confirm its expected behavior, as any deviation in filter performance could significantly impact the fluorescence results. Measurements were performed using an Avantes cuvette support holder (Avantes CUV-ALL-UV/VIS), ensuring consistent sample positioning and minimizing alignment errors between samples. Additionally, the excitation pathway was positioned at a 90° angle relative to the emission or detection pathway to minimize stray light from the source that could interfere with the fluorescence signal.
2.3. Microfluidic System and Tests
To extend the demonstration of the feasibility of this fluorescence-based biomarker detection in a microfluidic-sensing device, a microfluidic system was developed. This system provides a platform to study the Alzheimer’s-related biomarker A at a miniaturized scale, while preserving the optical and fluidic precision established in macroscale experiments.
The microfluidic device was constructed using polydimethylsiloxane (PDMS) due to its optical transparency, biocompatibility, and scalability [
28,
29]. PDMS’s transparency across a wide range of wavelengths ensures minimal interference with fluorescence detection, while its ease of fabrication supports the creation of intricate microchannel designs. The fabricated device consists of a fluid chamber tailored for fluorescence observation, with an inlet and outlet for delivery and removal of reagents.
Key design features included a circular well with a diameter of 8 mm and a height of 3 mm, coupled with inlet and outlet channels that are 2 mm wide, the same dimensions of the chamber used to culture tissue in previous OOC studies, as reported by Carvalho et al. (2024) [
28]. The microchannel system maintains a steady laminar flow and prevents turbulence that could interfere with fluorescence signal stability.
Figure 2 illustrates the CAD design and 3D layout of the microfluidic system, highlighting the chamber’s capacity to support consistent sample distribution for fluorescence detection. The microfluidic device was fabricated using a soft lithography technique, following the standard fabrication steps [
30]. Finally, the microfluidic devices were closed with a glass slide by oxygen plasm for 30 s at 30 W (Plasma Systems ZEPTO from Diener electronic (Ebhausen, Germany)). This procedure, besides creating the permanent sealing of the microfluidic devices with the glass, allows for the hydrophilization of PDMS, avoiding possible unwanted binding of organic molecules to the surface microfluidic channels.
For the fluorescence experiments, this device was integrated into a custom-designed setup created with Fusion AutoCAD software (version 2.0.20508). This setup was engineered to ensure precise component alignment and to minimize light interference during fluorescence detection. As illustrated in
Figure 2, the incident light and the collected emitted fluorescence are aligned on the same line, due to the miniaturization constraints, e.g., avoiding the circular side of the microfluidic chamber, which would compromise the reproducibility of the measurements. Additionally, the system comprises a black enclosure (colored in gray for better visualization) with a removable lid and two internal levels. The upper level houses the microfluidic device, while the lower level holds a support for the optical filter.
Furthermore, two optical fibers are carefully aligned and attached to collimating lenses for the illumination and fluorescence collection to/from the microfluidic device. Excitation light is directed into the well via an optical fiber inserted through the top of the box, while fluorescence emitted from the sample is collected by a second optical fiber attached at the bottom of the box. Each microfluidic chip is designed with two independent optical-reading wells, in which the excitation and detection fiber holes are strategically positioned to optimize fluorescence collection from one well at a time. Unlike the macroscale setup, the optical system in this configuration is aligned at a 180º angle, with the long-pass filter to effectively block the excitation light. This precise alignment ensures that only the emitted fluorescence is collected. Nonetheless, the same light source and detector (spectrophotometer and software) are used to obtain results from the present experiments. For the fluorescence detection, CRANAD-2 and A samples were pre-mixed (1/1, v/v) and introduced in the inlet of the microfluidic device using a syringe through the inlet. Fluorescence readings were then conducted immediately, i.e., under near-static flow conditions.
2.4. Fluorescent Spectroscopy Protocol
Fluorescence measurements were carried out using a series of control and calibration steps to ensure accuracy and reliability, including CRANAD-2-only solutions, A-only solutions, and blank PBS and MeOH samples to isolate baseline fluorescence interferences and other ambient light influences. These control measurements account for ambient light influences or system-specific artifacts. Fluorescence spectra were also acquired for each solution to assess CRANAD-2’s intrinsic fluorescence characteristics and identify potential interference from the fluorophore or A itself, ensuring data integrity.
Dark measurements were taken to minimize any noise introduced by electronic interference, while reference scans were used to further mitigate the impact of ambient light. Together, these calibration steps established a solid baseline for subsequent measurements and enabled the extraction of meaningful fluorescence signal variations.
2.5. Data Analysis
Following data acquisition, MATLAB-based (version 24.1.0.2689473 (R2024a)) data processing methods were employed to refine signal quality and enhance the accuracy of the results. A series of analytical procedures were applied to address baseline normalization, peak identification, noise reduction, and data visualization, all aimed at optimizing the fluorescence signals for more reliable interpretation.
Baseline normalization and wave subtraction was applied through integrated spectrophotometer software, to adjust for any shifts in the baseline by subtracting the minimum intensity value from each spectrum. This procedure centered the data around zero, reducing fluctuations and preparing the spectra for accurate comparison across samples. Moreover, for peak identification, a specific algorithm was employed to locate the primary fluorescence peaks associated with CRANAD-2’s emission, and retrieving the targeted wavelength (
Algorithm S1 in Supplementary Materials). The intensity values at these peaks were then extracted and analyzed in relation to the analyte concentration, providing insights into the quantitative relationship between fluorescence and concentration. Noise reduction was accomplished using a Savitzky–Golay smoothing filter [
31]. This filter was selected for its ability to preserve the shape of the fluorescence peaks while reducing high-frequency noise. The optimal parameters for the filter were determined through iterative testing, with a polynomial order of 3 and a frame size of 77, which proved to be the best balance between noise suppression and signal preservation (
Algorithm S2 in Supplementary Materials). To quantify the fluorescence response, a concentration-dependent analysis was performed. Fluorescence intensity data points were plotted against CRANAD-2 concentration, and linear regression was applied to generate a concentration–response curve. This curve provided a clear depiction of how fluorescence intensity varied with changes in analyte concentration, enabling the quantitative assessment of CRANAD-2’s fluorescence behavior.
3. Results and Discussion
3.1. Macroscale Optimization and Characterization
The first stage of this study focused on macroscale experiments, which primarily provided an optimization of CRANAD-2 fluorescence properties, including solvent selection, temporal stability, baseline fluorescence characteristics, and binding to A, while also providing an initial assessment of fluorescence response across a defined concentration range.
3.1.1. Pre-Validation Study of CRANAD-2: Solvent Selection, Stability, and Fluorescence Signal
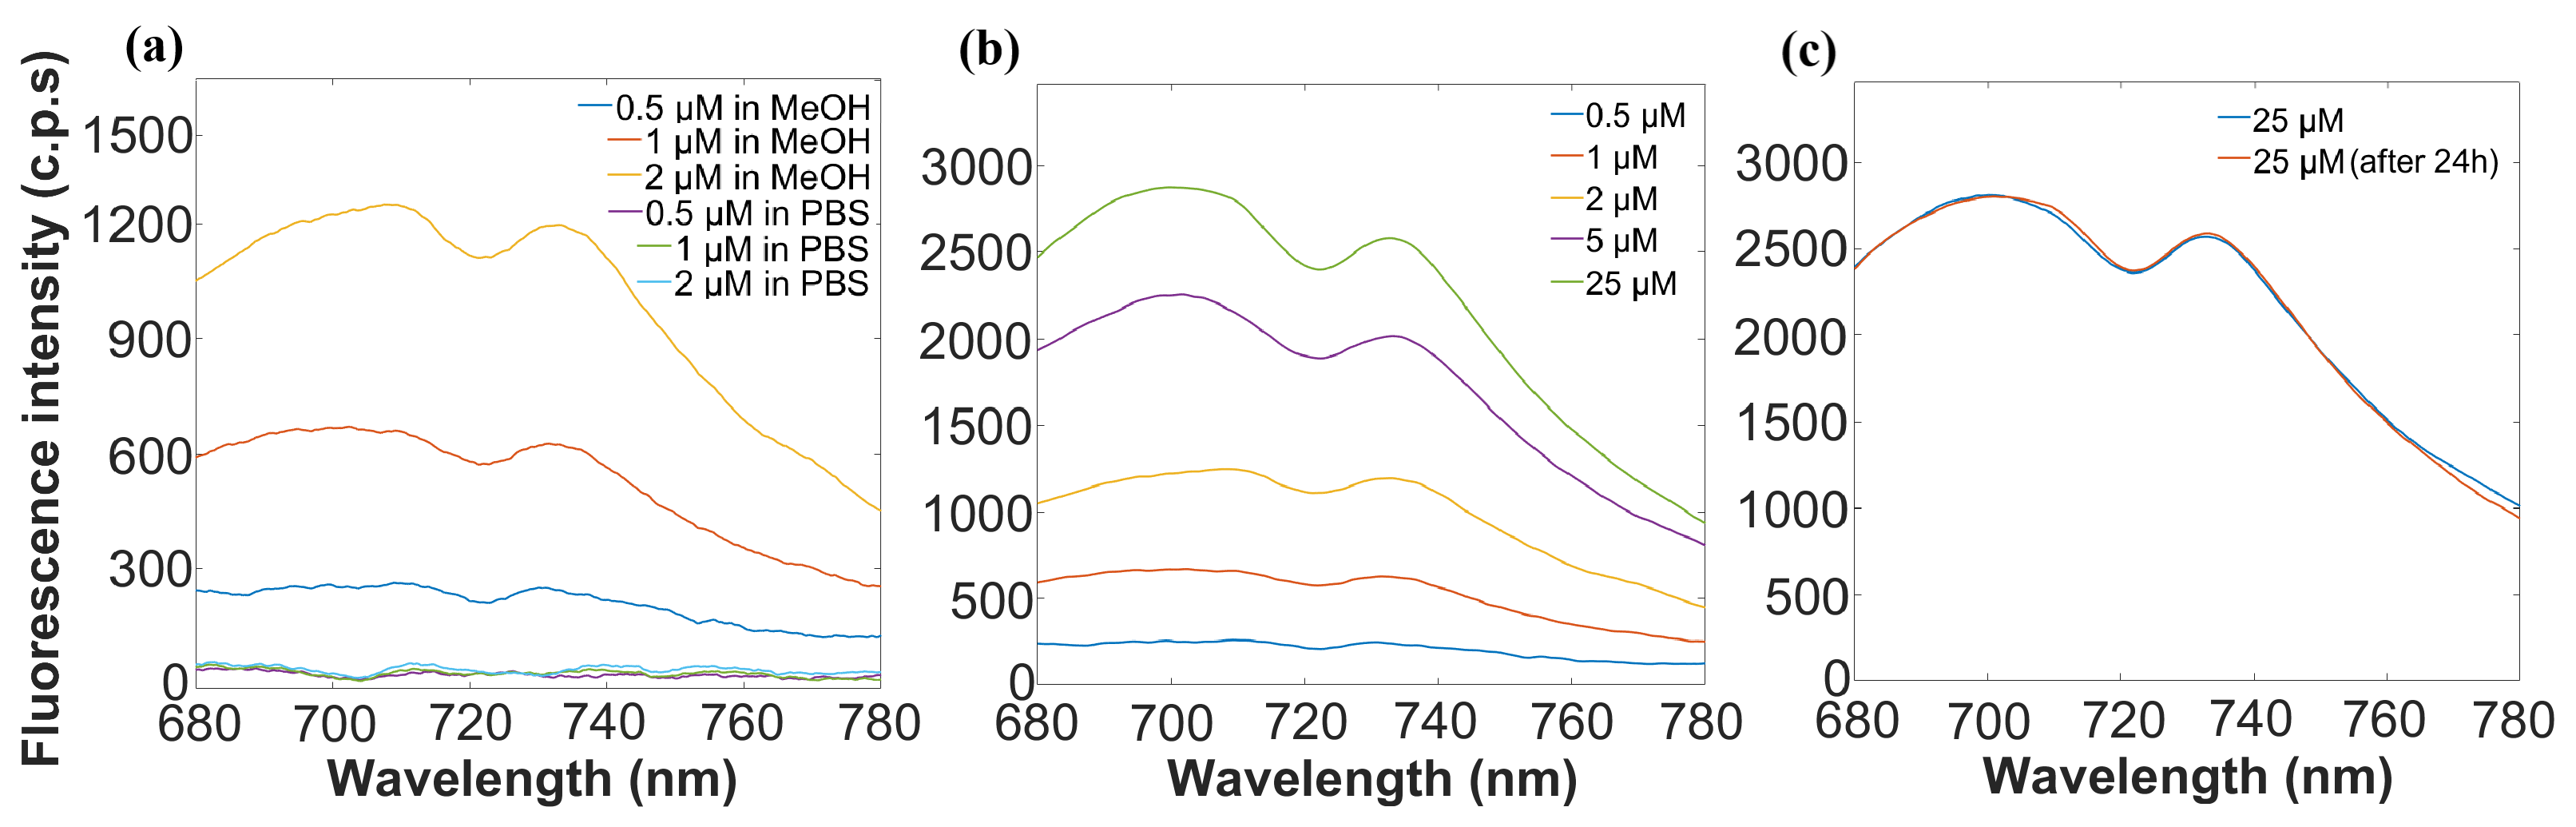
The optimization of CRANAD-2 for fluorescence detection began with identifying the most suitable solvent. CRANAD-2’s emission properties were evaluated in both MeOH and PBS. As shown in
Figure 3a, MeOH emerged as the most suitable solvent, enhancing fluorescence intensity and stability, while PBS resulted in negligible fluorescence. Based on these results, MeOH was selected for all subsequent experiments, and higher-concentration samples were also examined, with the goal of maximizing fluorescence output to mitigate potential signal loss and ensure robust detection, especially considering the expected noise increase in microfluidic measurements.
To establish a primary relationship between probe concentration and fluorescence intensity, a series of experiments were conducted at concentrations ranging from 0.5 μM to 25 μM, in MeOH.
Figure 3b illustrates the direct relationship observed between CRANAD-2 concentration and fluorescence intensity, confirming a concentration-dependent trend; higher concentrations of CRANAD-2 yield stronger fluorescence signals essential for its use in quantitative biomarker detection. Additionally, the concentration of 25 μM was selected for subsequent experiments based on its ability to enhance fluorescence signal intensity, optimizing sensitivity while maintaining cost-efficiency. These findings establish the foundational fluorescence characteristics of CRANAD-2, providing a baseline for its use in subsequent binding studies with A
samples.
Next, the temporal stability of CRANAD-2 fluorescence was assessed for a period of 24 h. The probe, prepared in MeOH, was tested immediately after preparation and after 24 h of storage. The results presented in
Figure 3c demonstrate that CRANAD-2 fluorescence remained stable over the 24 h period, which is beneficial for real-time and continuous monitoring in assays that need several-hour analysis.
3.1.2. Characterization of Amyloid-Beta Conformation as Oligomers and Fibrils
The characterization of A
using dynamic light scattering (DLS) and zeta potential analysis confirmed the successful preparation of fibrillar structures, which were subsequently used in optical experiments. To validate the successful preparation of the fibrillar structures, dynamic light scattering (DLS) and zeta potentials were analyzed, as described elsewhere [
32]. Given that A
aggregates typically exhibit non-spherical morphologies, the measured hydrodynamic diameter represents an average diffusion-based size, through their light scattering. Therefore, this value serves as an approximation rather than an exact representation of the particles’ geometric dimensions, indicating their apparent hydrodynamic size and possible size growth.
Table 1 summarizes the hydrodynamic diameter and zeta potential values obtained for A
oligomers and fibrils. Oligomeric A
exhibited an average hydrodynamic diameter of 483 nm, which is in the range between oligomers and protofibrils [
33], with a zeta potential of −19.2 mV, indicative of its relatively smaller and dispersed structure. In contrast, fibrillar A
demonstrated a substantial increase in hydrodynamic diameter (2179 nm) and a marked reduction in zeta potential (−8.8 mV), consistent with the aggregation process and formation of larger fibril structures, typically with a lower solubility profile (less negative mV). These results validate the presence of A
fibrils, providing a reliable basis for subsequent fluorescence-based detection experiments.
3.1.3. Optical Analysis of CRANAD-2 Binding with Amyloid-Beta
The next phase of experiments focused on CRANAD-2’s interaction with A
. CRANAD-2 fluorescence was measured immediately after mixing with oligomeric and fibrillar forms of A
at concentrations ranging from 100 nM to 1000 nM. This range is particularly relevant for measuring absolute baseline levels of A
observed in adult control groups, where concentrations fall within or above this threshold [
34,
35]. The oligomers, presented in
Figure 4a, exhibit an inverse relationship with fluorescence intensity, where an increase in concentration results in a decrease in fluorescence intensity. This comes in contrast to the behavior observed for A
fibrils, where the binding to A
fibrils resulted in increasing fluorescence intensity, as depicted in
Figure 4b. A
fibrils showcased significantly more luminescence intensity, which confirms the manufacture indication that CRANAD-2 has a higher affinity for fibrillated A
structures than for oligomeric conformation. The binding of CRANAD-2 to A
was further validated by the red shift of the main peak (710–740 nm). This shift is directly illustrated in the
Supplementary Materials (Figure S3).
3.2. Microfluidic-Sensing Studies for Amyloid-Beta Analysis
As a proof-of-concept for the optical biosensor integration in advanced microfluidic devices, several tests using CRANAD-2 as a fluorescent reporter were performed to detect and quantify A in a microfluidic device. This platform enables the analysis of the probe’s performance to detect and quantify A in in vitro microenvironments, such as BoCs, that can emulate the human brain.
3.2.1. Fluorescence Baseline Efficiency of CRANAD-2 Without Amyloid-Beta
To establish a baseline for subsequent binding studies, CRANAD-2 at 25 μM in MeOH was evaluated in both macroscale and microfluidic configurations for A
(0 nM A
) in PBS, which represents a ratio of 1:1 (
v/
v) between MeOH and PBS. Both setups exhibited the same emission peak wavelength, confirming consistency in CRANAD-2’s fluorescence response. However, the microfluidic platform yielded a lower absolute fluorescence intensity than the macroscale environment, likely due to optical path miniaturization and system constraints. A direct comparison of these fluorescence signals is presented in the
Supplementary Materials (Figure S4). This baseline characterization provides the necessary reference point for analyzing fluorescence trends as A
concentrations increase, allowing for a more accurate interpretation of CRANAD-2’s binding interactions in the microfluidic system.
To account for differences in sample volumes and facilitate a fair comparison of fluorescence efficiency, a relative analysis was performed by normalizing fluorescence intensity per milliliter. Therefore, a sample from the microfluidic system yielded 3333.3 c.p.s./mL, which is approximately 4.93 times greater than the normalized intensity of 675 c.p.s./mL observed in the 2 mL macroscale sample. This substantial difference underscores the microscale system’s capacity to preserve a fluorescence signal despite the drastic reduction in sample volume (about 75%). Although the smaller sample size and lower signal-to-noise ratio (SNR) reduced raw fluorescence intensity, the phenomenon remains detectable, allowing for robust quantitative analysis. These results highlight that the microscale environment offers a higher fluorescence intensity per unit volume, potentially due to a higher effective concentration within the confined microfluidic setup, with a detectable fluorescence response despite the significant reduction in sample volume.
3.2.2. Binding Effects of CRANAD-2 with Amyloid-Beta
Following the confirmation of CRANAD-2’s fluorescence efficiency under miniaturized conditions, its binding interactions with A
were evaluated in the microfluidic platform.
Figure 4c,d presents the fluorescence results for both oligomeric and fibrillar A
across concentrations ranging from 100 nM to 1000 nM, when bonded with 25 μM CRANAD-2, mirroring the macroscopic assays (
Figure 4a,b) to establish a basis for comparison between both experimental scales. Once again, it can be seen that oligomeric conformation (
Figure 4c) attains a lower fluorescence intensity than fibrillar A
(
Figure 4d). These findings are consistent with macroscale results (
Figure 4i), confirming CRANAD-2’s higher affinity for fibrillar structures.
As expected, the intensity range in the microscale system is reduced compared to macroscale results (following
Section S4 of Supplementary Materials), which does not hinder effective differentiation. Due to the optical phenomena and prototype’s miniaturized design, the SNR in the microfluidic environment was notably lower than in the macroscale setup. Specifically, this reduction stems from lower absolute fluorescence intensities coupled with inherent background noise. Nonetheless, the fluorescence response was still sufficient to enable reliable quantitative analysis and so this limitation does not compromise the detection of distinct intensity gradients, as the probe’s fluorescence behavior remains concentration-dependent and differentiable for both protein forms.
3.2.3. Optimizing Binding Studies of CRANAD-2 with Amyloid-Beta in a Microfluidic Device
One of the goals of this study was to explore the viability of the microfluidic platform for detecting A
pushing the boundaries of previous detection ranges and approximating the variability reported in the literature for A
aggregate variations in the presence of AD [
35,
36]. To achieve this, the experimental setup was optimized by reducing the concentrations to ranges between 5 nM and 100 nM.
Figure 4e,f illustrate the results obtained at these lower concentrations, revealing a consistent trend. As in the previous experiments, oligomeric A
exhibits an inverse relationship between concentration and fluorescence intensity, whereas fibrillar A
shows a positive correlation.
The results demonstrate that even with an optical path miniaturized, the microfluidic-sensing system presented in this work is able to effectively differentiate a lower concentration range of A
(5 nM). While absolute fluorescence signals were attenuated in the microscale environment, fibrillar A
consistently yielded higher signals compared to oligomers across all tested concentrations. These results serve as a strong validation for the microfluidic system’s potential, providing a foundation for further optimization and exploration of its capabilities at low concentration levels, which are more in line with the ones found in vivo [
34,
35,
36].
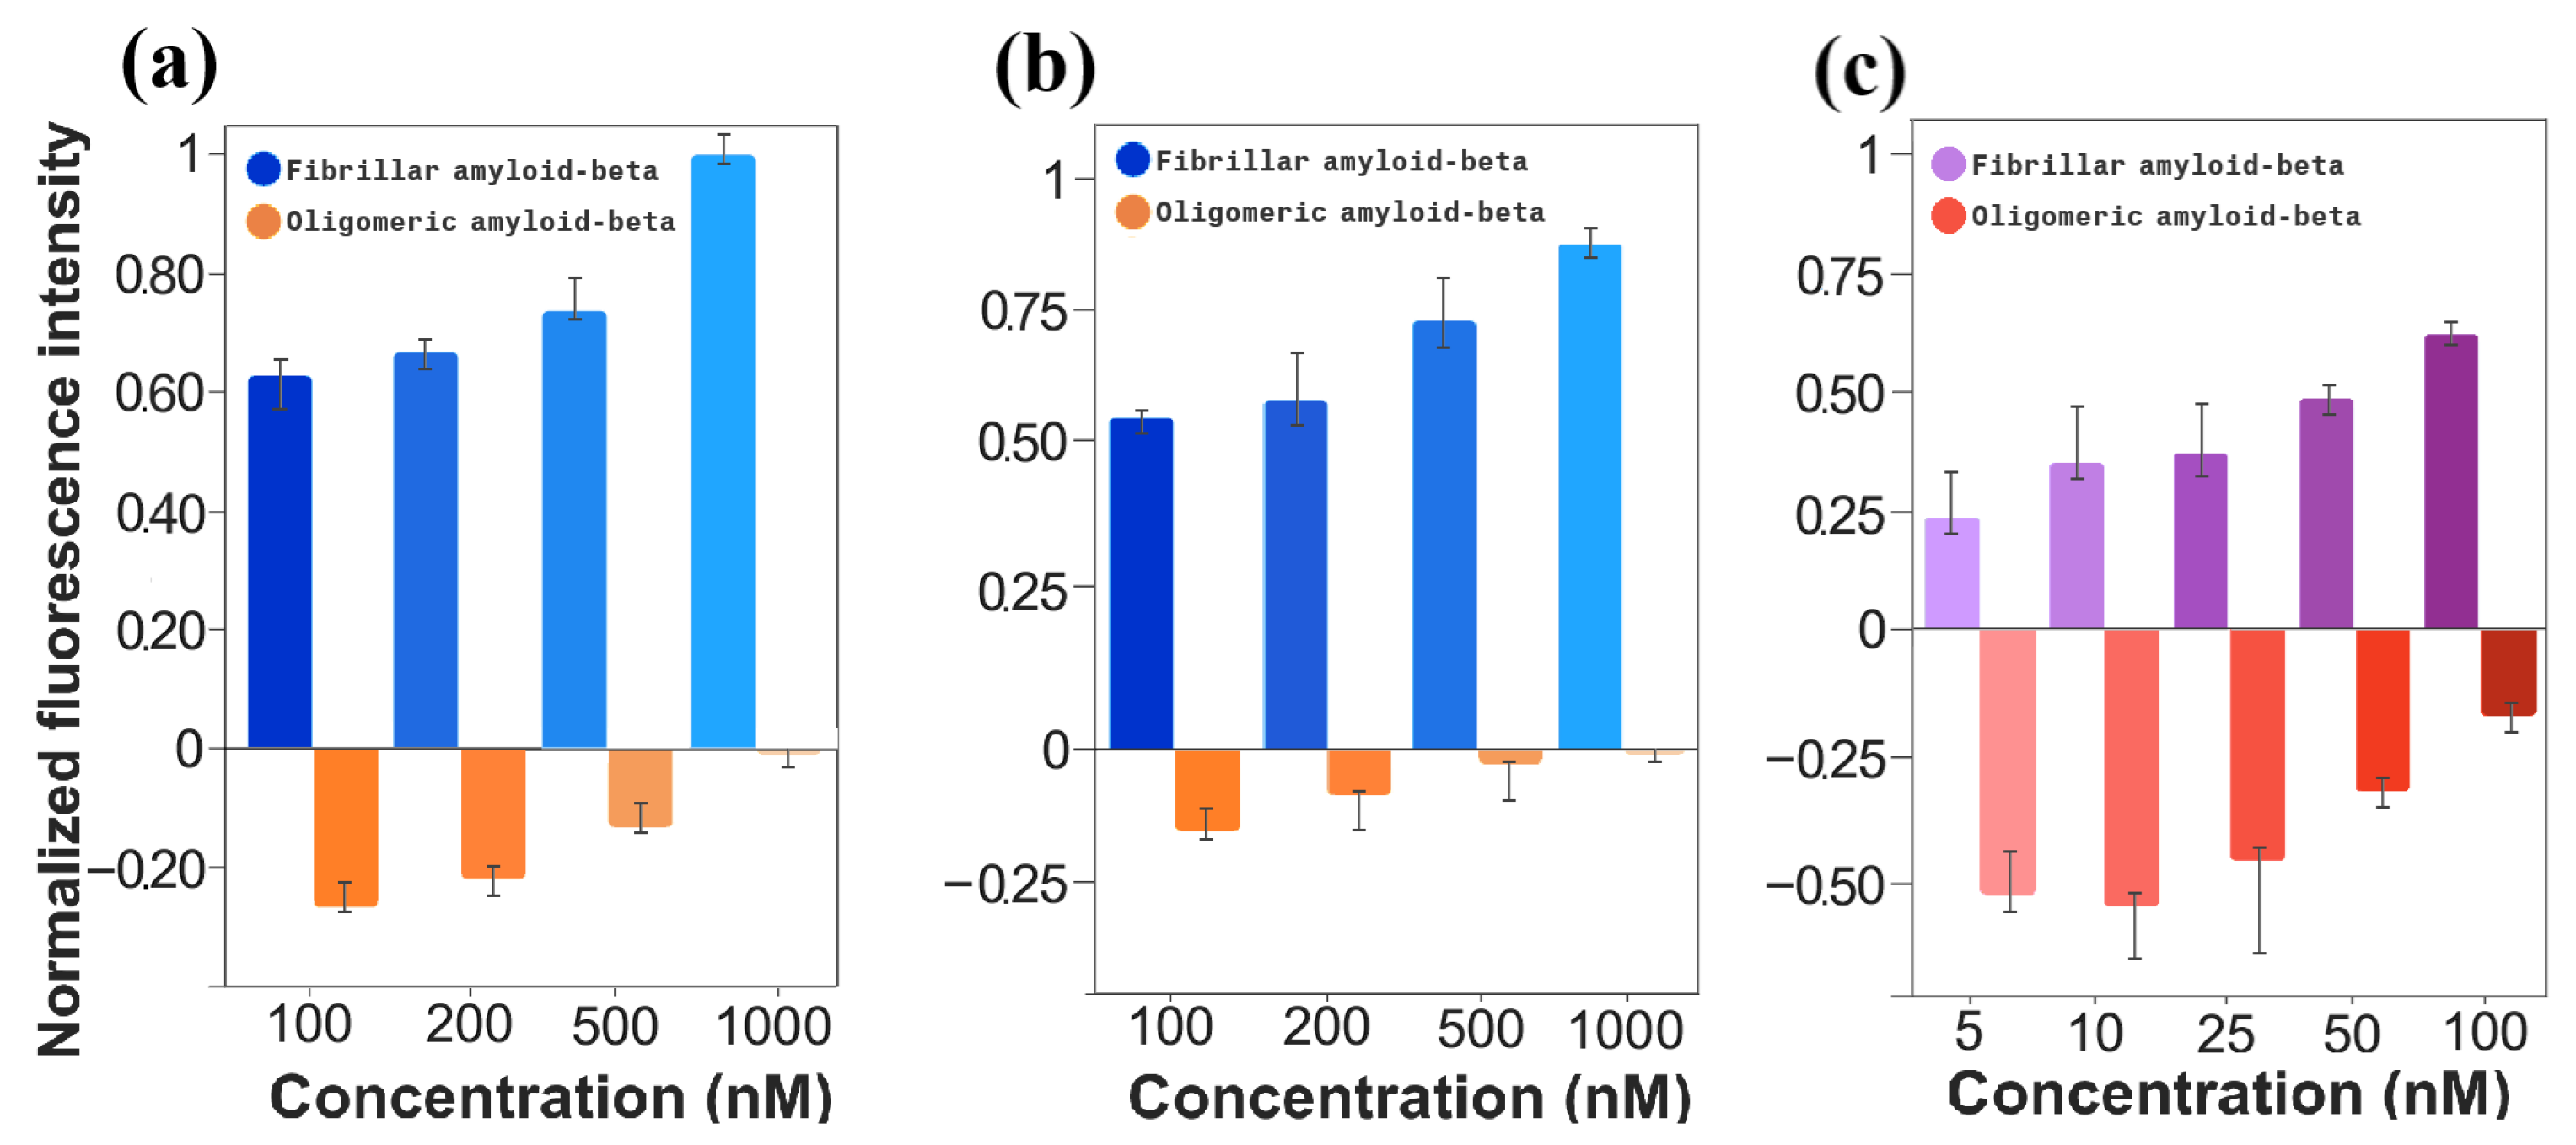
To fully understand the luminescence difference at wavelength 736 nm between the different forms of the protein, a bar graph for normalized relative difference is presented in
Figure 5a. Here, it can be seen that even for the highest light intensity scenarios in both forms, oligomers did not yield even 50% of the light emitted by fibrils. Additionally, since the fibrilated A
structures present as the pathological hallmark of Alzheimer’s disease, this specificity supports the use CRANAD-2 as an optical reporter to detect and quantify fibrilated A
with a high potential for in vitro AD studies.
Moreover, the normalized fluorescence intensities, shown in
Figure 5b, further emphasize the consistent results between oligomeric and fibrillar A
. Similar to the macroscale results, the relative difference in fluorescence intensity is predominantly attributed to the fluorescence produced by A
fibrils. These findings support the successful transition of CRANAD-2 from macroscale to microfluidic platforms for fluorescence-based A
detection. While absolute fluorescence intensities were lower in the microfluidic system and signals were more affected by noise, the probe’s reliable fluorescence response across concentrations confirms its potential for use in advanced microfluidic biosensing applications. This demonstrates that, despite the challenges posed by the microfluidic environment, CRANAD-2 retains its sensitivity and specificity, making it a viable candidate for scalable, low-volume biomarker detection in Alzheimer’s disease diagnostics.
Figure 5c examines the normalized intensity difference for a broader range of lower A
concentrations in the microfluidic setup. Unlike the pronounced disparity observed in panels (a) and (b), the differences between fibrillar and oligomeric A
become less distinct in this range. However, the clear trends of increasing fluorescence for fibrillar A
and decreasing fluorescence for oligomeric A
across the tested concentrations are of particular interest. These trends validate the probe’s capability to detect even subtle changes in fluorescence, which is crucial for precise biomarker quantification in early detection scenarios. Thus, while the magnitude of the difference is less pronounced, this panel underscores the robustness of CRANAD-2 in capturing concentration-dependent fluorescence variations, further confirming its suitability for scalable, low-concentration biomarker detection in microfluidic platforms.
Furthermore, the fluorescence characteristics of the fibrils, including both intensity and the linear relationship with A concentration, remain consistent. This indicates reliability across platforms and confirms that quantification is possible. As a result, fibrils were established as the baseline for subsequent studies and further analysis. This provides a preliminary set for the use of microfluidic systems in detecting AD and lays the groundwork for further exploration of this optical sensing tool in advanced microfluidic devices.
3.3. Comparative Analysis of Fluorescence Intensity of Bonded CRANAD-2 in Macroscale and Microscale Experiments
Following the confirmation of CRANAD-2’s binding specificity and consistent fluorescence response to A
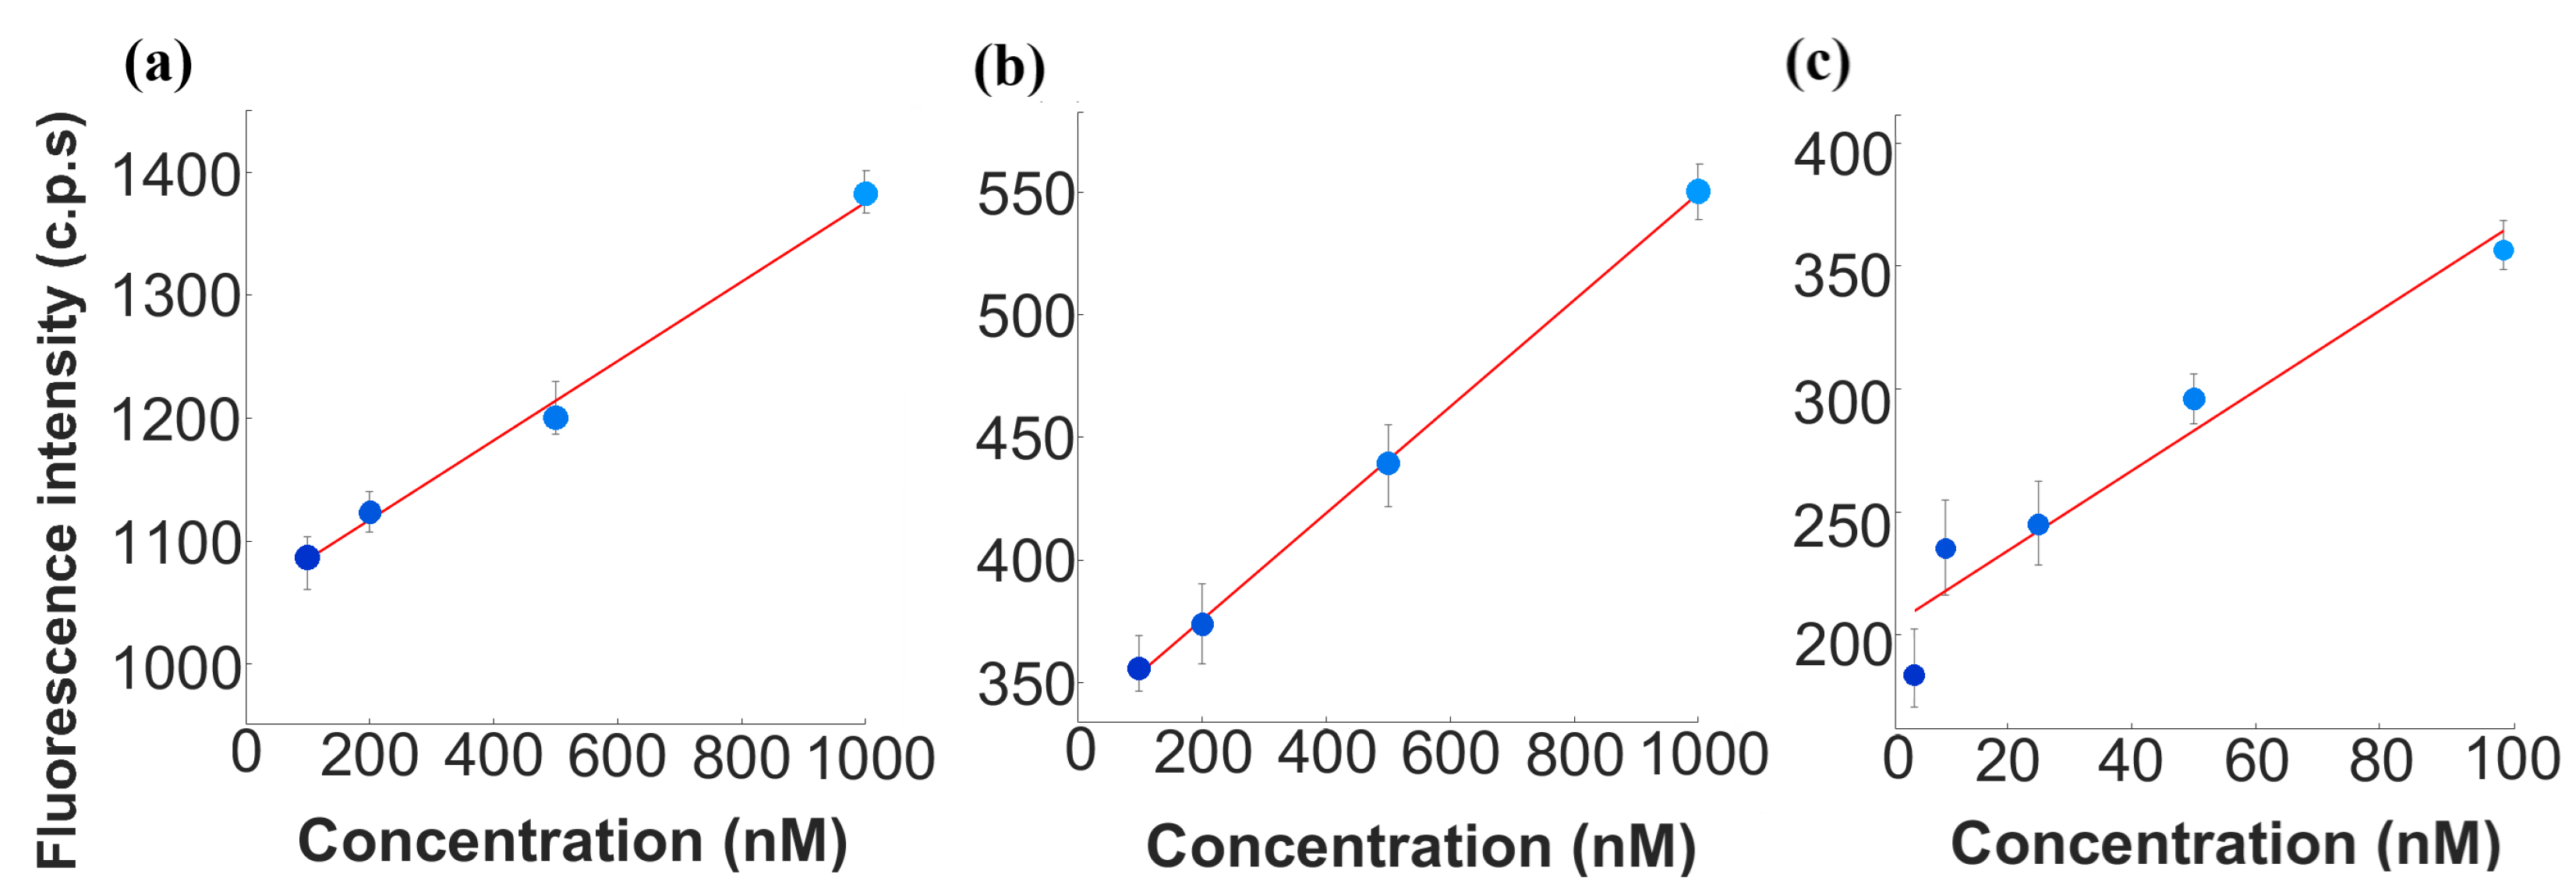
fibrils, the transition from macroscale to microfluidic platforms marks a pivotal advancement in biomarker detection strategies for Alzheimer’s disease. By establishing fibrils as the primary analyte, the upcoming comparative analysis highlights fluorescence intensity trends, sensitivity, and the inherent advantages of microfluidic systems. To quantitatively assess these variations, three linear regression analyses were performed, characterizing the relationship between A
concentration and CRANAD-2 fluorescence intensity across both experimental platforms. The resulting plots are presented in
Figure 6. The corresponding regression equations are presented in
Table 2.
A comparison of the slopes between the same concentration ranges but in different setup scales reveals distinct differences in sensitivity. The macroscale setup demonstrated higher sensitivity () in the 100–1000 nM range, likely due to its ability to maximize fluorescence capture through larger interaction volumes. Conversely, the microfluidic platform exhibited slightly lower sensitivity () in the same range. The relative reduction in sensitivity by 31.25% in the microfluidic system suggests that miniaturization influences fluorescence signal detection due to optical constraints and increased noise, as mentioned previously. However, despite these factors, the system retained a clear and quantifiable fluorescence response, demonstrating its feasibility for biomarker detection in microfluidic platforms. The regression results also highlight differences in baseline fluorescence intensities between platforms. Additionally, the fluorescence response in the lower microfluidic concentration range (5–100 nM) exhibited a markedly higher slope ().
The values obtained for these regressions provide further insights into the linearity and reliability of fluorescence intensity measurements. For the macroscale experiments, the value of 0.996 indicates an excellent fit, reflecting strong consistency and reproducibility. The microfluidic experiment within the same concentration range (100–1000 nM) yielded an even higher value of 0.998, confirming the robustness of the fluorescence response in this range. However, in the extended microfluidic dataset (5–100 nM), the value decreased to 0.925, likely due to increased background noise and detection limitations at lower concentrations. Statistical validation of these correlations was assessed using p-values, confirming the significance of the fluorescence intensity response across all experimental setups. The macroscale setup (100–1000 nM) exhibited the highest statistical confidence (p = 2.51×, reflecting minimal variability in fluorescence measurements. The microscale setup within the same range (100–1000 nM) yielded a slightly higher p-value (p = 3.72 ×, consistent with the expected increase in experimental noise due to microfluidic constraints. At lower concentrations (5–100 nM), the microscale platform showed greater signal variability, resulting in a higher yet still significant p-value (p = 0.0315). These results confirm that fluorescence intensity remains a reliable indicator of A concentration across both macroscale and microfluidic conditions, despite increased variability at lower concentrations due to optical and fluidic factors.
Despite the attenuated fluorescence signals in the microfluidic-sensing system, the proportional intensity ratio of fibrillar A
remains consistent with macroscale trends (
Figure 4b,d). Both platforms demonstrated CRANAD-2’s strong specificity for fibrillar A
, which consistently generated higher fluorescence signals due to its aggregated structure and enhanced binding affinity. A population-based study conducted by Hilal et al. provided clearer benchmarks for plasma A
levels in relation to neurodegeneration and dementia risk. Concentrations of A
were reported at 43.0 nM and A
at 12.5 nM, offering critical insights into the clinical relevance of these biomarkers, with variations as low as 8.3 nM and 1.4 nM [
36]. These values provide critical insights into the clinical relevance of these biomarkers. Notably, these concentrations align closely with the lower detection limits of our system, highlighting its capability to accurately detect both normal and pathological shifts in A
levels. Hence, the transition to microfluidic systems offers several practical advantages. The microfluidic platform requires significantly smaller sample volumes, reducing reagent consumption by approximately 92.5%. Furthermore, the flow conditions in microfluidics enable precise control over reaction parameters, improving specificity and facilitating integration into automated systems. Notably, even at reduced fluorescence intensities, the microfluidic system demonstrated the ability to detect A
fibrils at concentrations as low as 5 nM, highlighting its sensitivity and the feasibility of using it as a tool for AD detection. The system’s capability to quantify A
concentrations reliably, with minimal error, aligns well with established clinical values, further validating its potential use for early biomarker detection in preclinical settings.
Nonetheless, the current experiments were conducted using pure A preparations, which may not fully replicate the complexity of biological matrices within the real sample. Future studies should explore the performance of these environments, including this optical sensing system integrated in BoC. Additionally, the microfluidic system could benefit from further optimization, including channel design and flow dynamic studies, to enhance sensitivity and minimize nonspecific interactions. Overall, this study showcased a foundation baseline for this area of research, which could pave the way for more comprehensive and accessible advanced preclinical tools for AD studies.
4. Conclusions and Future Perspectives
This proof-of-concept study demonstrates the feasibility to detect and monitor physiological relevant concentrations of AD biomarker A, using the commercial fluorescent probe CRANAD-2 in a microfluidic-sensing platform. This technological achievement represents a critical step toward the integration of biosensors in advanced preclinical tools, such as BoCs, which promise to revolutionize the improvement of AD treatments and early diagnosis.
For that, initial fluorescence experiments conducted in macroscale conditions validated the sensitivity and specificity of CRANAD-2 for both oligomeric and fibrillar conformations. Static optimization of experimental parameters, including solvent selection, excitation/emission profiles, and probe concentration, confirmed robust fluorescence signals, with a strong preference for fibrillar A
over oligomers. These findings are in good agreement with the literature [
23], which shows that CRANAD-2 exhibits a great affinity for A
(Kd = 38 nM), especially fibrils, with rapid association and slow dissociation, making it a powerful tool for fluorescent imaging of A
. These results established a baseline for assessing the probe’s behavior under controlled conditions, ensuring a reliable foundation for subsequent microfluidic-sensing validation.
The integration of optical sensing in microfluidic platforms revealed several advantages over macroscale setups. The nature of the microfluidic-sensing platforms requires a significantly smaller sample volume and lower reagent consumption, and it enables automated real-time monitoring of A at multiple time points. Comparative analysis demonstrated that fluorescence properties remained consistent across scales. Additionally, the ability to isolate and detect A fibrils in physiologically relevant concentrations highlights the potential of microfluidic systems for translational biomedical applications.
The findings underscore CRANAD-2’s optical properties as a fluorophore with (i) good molecular stability, (ii) consistent Stoke’s shift, and (iii) specificity for fibrillated A. This shows its suitability to be used as fluorescent probe in optical biosensors integrated in advanced microfluidic devices, such BoCs. This work showcases the suitability for the development of new devices that catalyze new methods for Alzheimer’s disease progression monitoring and the evaluation of new therapeutic strategies, more effective than the current ones.
To enhance the compactness and scalability of the detection system, future integration steps could replace the current optical detection setup with a fully integrated solution comprising a CMOS-fabricated photodiode, LED source, and optical filters. The in-house-designed optical biosensor, integrated with the microplatform, will be used to detect and continuously quantify A
in real time, further expanding the scope of this research. This approach would not only reduce the system’s overall footprint but also enable greater automation and portability, essential for high-throughput screening. The feasibility of such integration was demonstrated by Santos et al. (2024), where CMOS-compatible photodetectors combined with on-chip optical components achieved efficient detection [
30]. Moreover, to optimize the collection of the fluorescence signals, one could study the integration of lenses, waveguides, and total internal reflection geometries into the microfluidic die, which could also have a high impact on the sensitivity and reproducibility and in the reduction in errors resulting from optical components’ alignment. The geometry of the lenses (degree of aperture, curvature, single or composite lenses, etc.), waveguides, and reflection geometries can be tailored to obtain high efficiency in the convergence of excitation and emission light. Leveraging these advancements could lead to a robust, low-cost, and miniaturized biosensing platform capable of continuous monitoring of Alzheimer’s biomarkers, thereby significantly advancing preclinical testing.
Despite its promise, this study recognizes some limitations that warrant future investigation. These include the need to evaluate the probe’s performance in complex biological matrices within the multiplex of the brain fluids, leading to the optimization of the microfluidic system for enhanced sensitivity and the optical and physical characterization of the probe and its interactions with evolving compounds. Besides biosensor optimization, the transition of microfluidic-sensing platforms from laboratory research to clinical applications must also address other critical factors, including scalability and regulatory approval. For scalability, this involves producing biosensors using efficient and cost-effective procedures and materials that allow for large-scale production, while maintaining sensitivity and specificity. Our optical microfluidic-sensing strategy fits well in this endeavor by miniaturizing biomarker analysis with microfluidic devices, which, in addition to reducing reagent and volume requirements, also utilizes low-cost fabrication strategies and materials for production. Moreover, our biosensor, based on fluorescent optical sensing, has the advantage of enabling continuous analysis over long periods, without losing efficiency and without requiring intermediate cleaning or functionalization steps—a competitive advantage over electrochemical-sensing devices. On the other hand, regulatory approval remains the most challenging factor for clinical implementation. Compliance with international standards (such as FDA, CE, and ISO 13485) requires extensive preclinical testing, clinical validation, and adherence to Good Manufacturing Practices (GMPs). Demonstrating biosensor reliability through analytical validation and real-world patient trials is crucial for approval, although it often involves collaboration with regulatory experts and healthcare professionals, a process that can take several years. Addressing these challenges will be crucial for advancing towards better preclinical microfluidic platforms, ensuring its reliability in real-time and continuous monitoring scenarios, particularly in BoCs for AD studies.
In conclusion, this work bridges the gap between macroscale setups and microscale systems, providing a foundation for future advancements in biomarker detection technologies. This research establishes a link between concept and application, contributing to the ongoing efforts to enhance treatments and diagnostic precision for neurodegenerative diseases. Overall, this study exemplifies the potential of fluorescence-based technologies for in situ biomarker detection in advanced microfluidic devices, which, besides the exploration of their clinical translation in biomedical research, can have applications in other research fields, such as environmental, food quality, and pharmaceutics, among others.


