

A User-Centric Smart Library System: IoT-Driven Environmental Monitoring and ML-Based Optimization with Future Fog–Cloud Architecture


Abstract
1. Introduction
Contributions
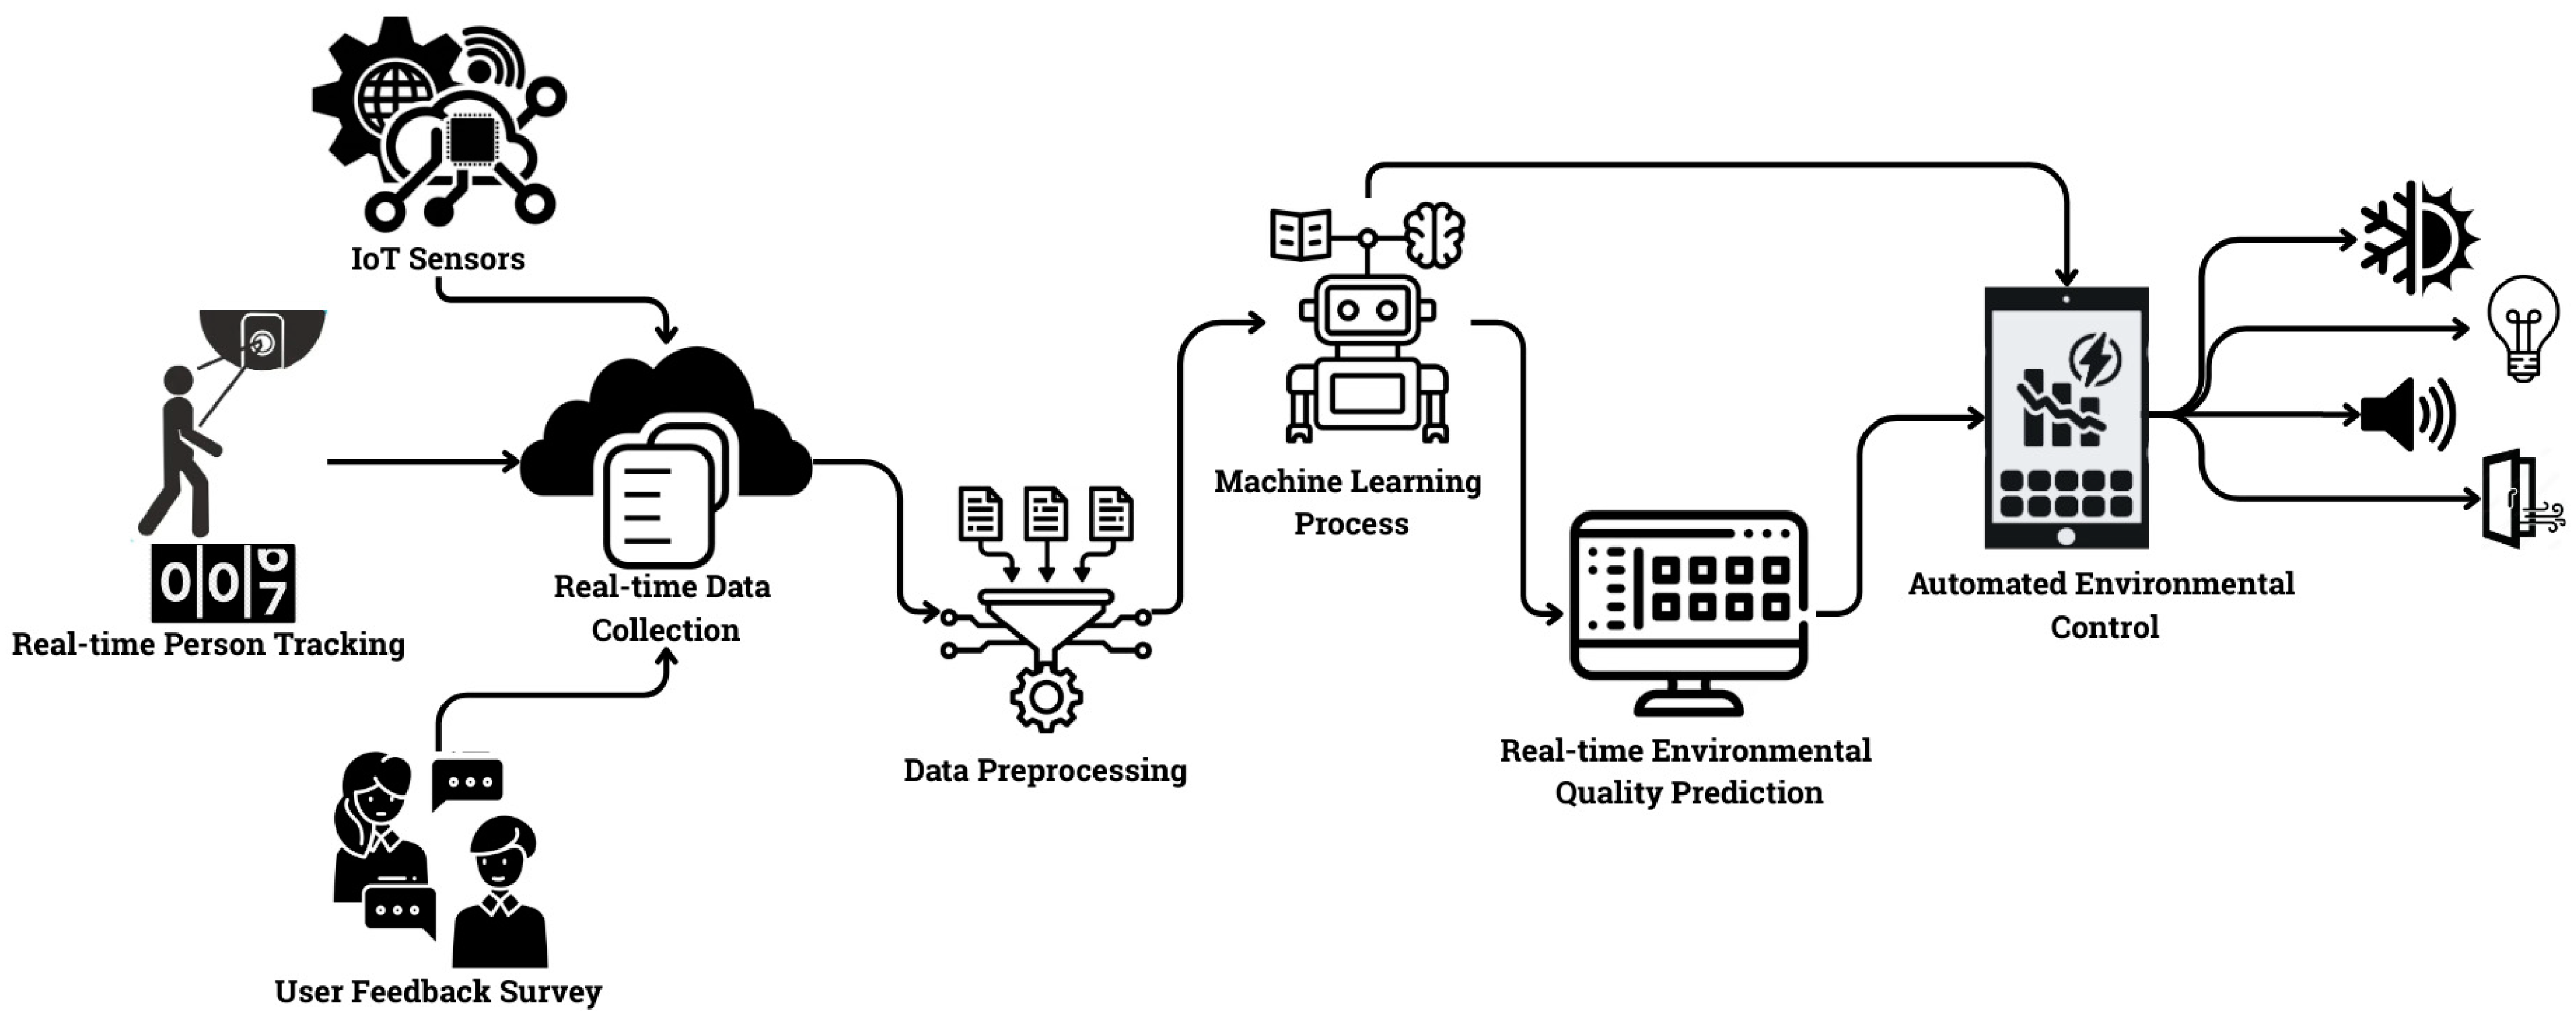
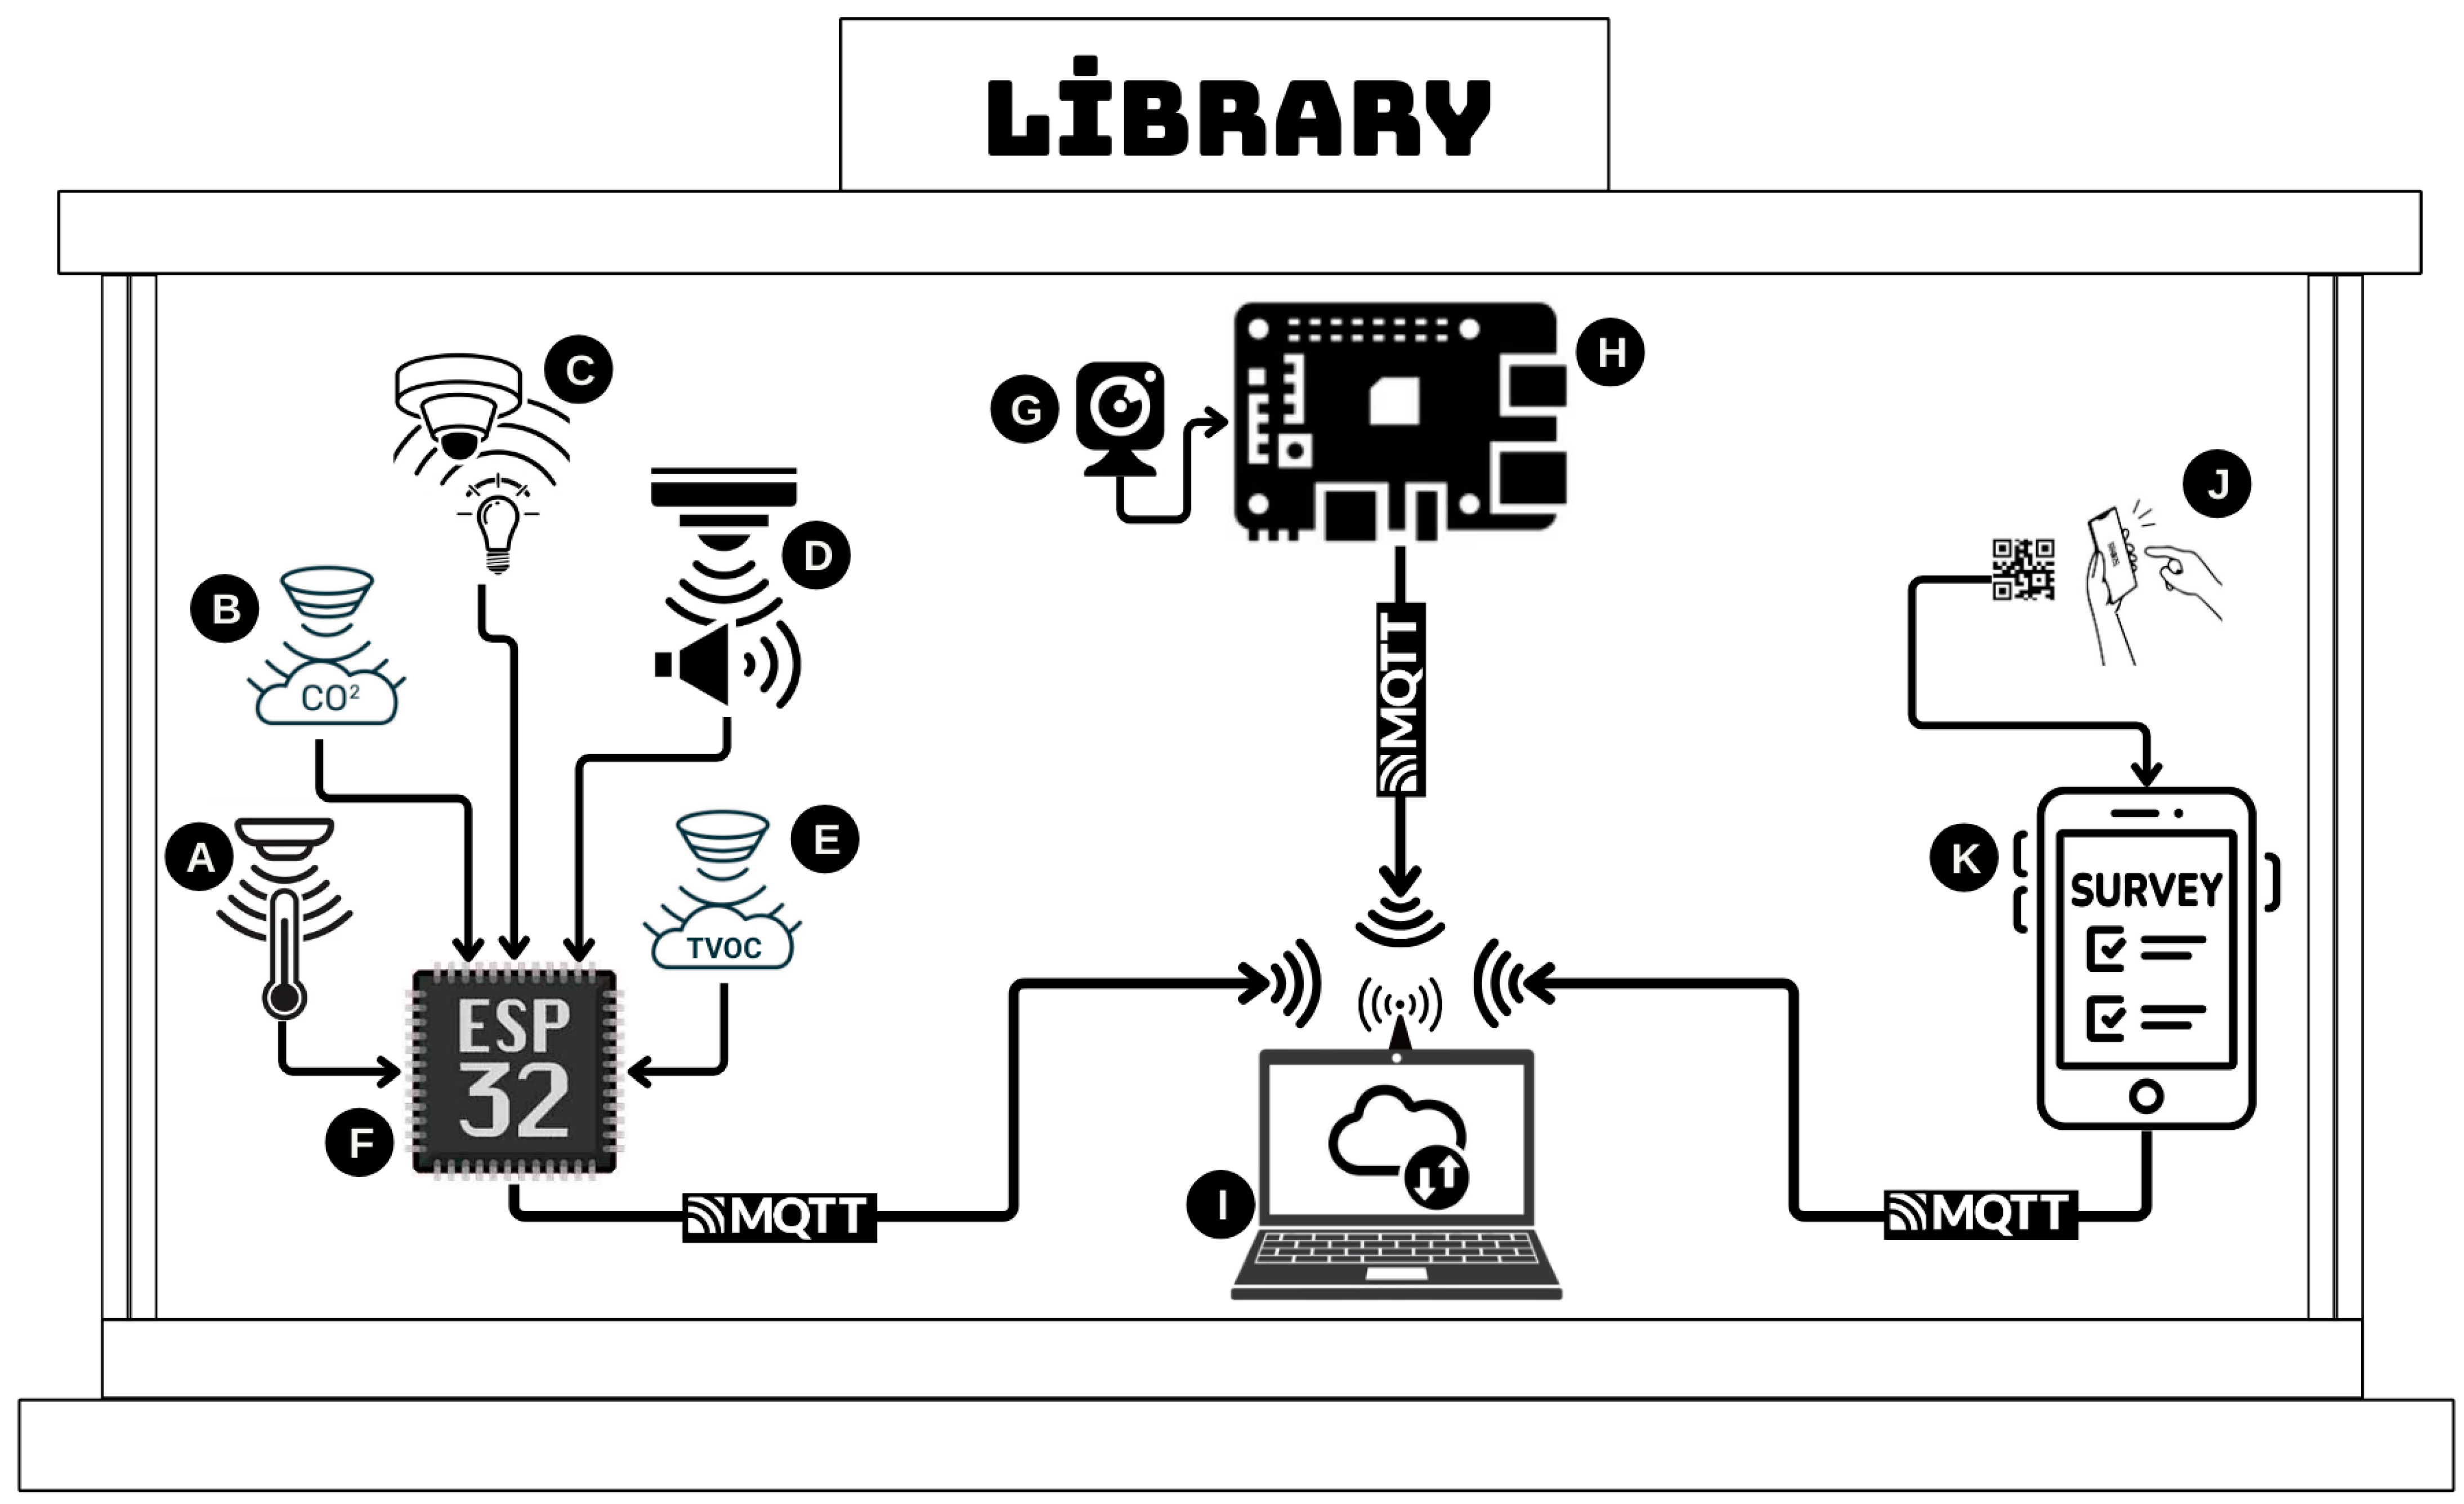
- Development of an IoT-based system: the system monitors and analyzes environmental factors such as sound, light, temperature, humidity, air quality, and occupancy, collecting real-time data and storing them in the cloud.
- User feedback integration: the system integrates user feedback to assess work experiences and productivity, offering actionable recommendations for efficiency improvements [15].
- Use of machine learning: machine learning algorithms process the collected data to identify ideal conditions for optimizing library workspaces [16].
- Environmental optimization: the system addresses environmental factors holistically, aiming to enhance learning and productivity in libraries, which are crucial spaces for students and academic staff.
- Impact of environmental factors on cognitive functions: research highlights the influence of temperature, lighting, and air quality on cognitive function, attention, and overall work effectiveness [16].
- Focus on air quality: the system analyzes key air quality parameters (CO, CO2, TVOCs) and optimizes ventilation, pollutant control, and humidity regulation [17].
- Comprehensive framework: this study presents a comprehensive IoT-driven library management framework that combines objective sensor data with user feedback, creating more adaptive and efficient learning environments.
- Advances in technology: The use of IoT sensors enables the real-time monitoring of environmental factors in libraries. The data from these sensors are analyzed with machine learning to optimize conditions, improving library management and user experience [20].
2. Related Works
2.1. The Impact of Environmental Factors on Academic Performance
2.2. Spatial Innovations and Environmental Optimization in Libraries
2.3. The Role of IoT and AI in Library Environmental Monitoring
2.4. Fog–Cloud Computing for Enhanced Library Systems
2.5. Literature Comparison
2.6. Contributions to the Literature
- This study goes beyond traditional approaches that rely solely on environmental sensors by introducing an integrated system that combines IoT sensor data, real-time image-based occupancy tracking, and direct user feedback. By developing a multi-dimensional optimization model, it transforms passive study environments into adaptive, user-responsive intelligent spaces, making a significant contribution to the literature on smart libraries.
- This research introduces a first-of-its-kind hybrid environmental assessment model, addressing the gap between previous studies that predominantly focus on either objective (sensor-based) or subjective (survey-based) evaluations. By combining both approaches, this study leads to a more accurate and personalized environmental optimization method. The hybrid framework enables a dynamic learning process, where continuous user feedback refines the optimization model, enhancing its robustness and context-awareness.
- This research uniquely integrates real-time and long-term environmental data analysis, enabling trend identification and sustainable management strategies beyond snapshot-based studies. By examining gradual changes in air quality, noise, temperature, humidity, and lighting, it reveals their impact on user productivity over time, making the approach highly relevant for dynamic workspaces. While initially focused on university libraries, the model is scalable to various smart work environments, demonstrating how the IoT and AI enhance adaptability. Additionally, the interactive interface not only monitors conditions but also provides actionable insights, allowing facility managers to implement proactive, data-driven improvements for an optimized learning and working environment.
- This research introduces a unique open-source dataset that combines IoT-based sensor readings with user feedback, offering a valuable resource for future studies on smart environments, human–computer interaction, and AI-driven space optimization. By filling a major gap in the literature, this dataset enables further exploration of the relationship between environmental conditions and cognitive performance.
3. Proposed System Model
3.1. Real-Time Data Collection and Integration
3.2. Dataset Overview and Data Preprocessing
3.3. Selection and Application Methods of Machine Learning Algorithms
3.3.1. Logistic Regression (LR) Algorithm
3.3.2. Naive Bayes Algorithm
3.3.3. K-Nearest Neighbors (KNNs) Algorithm
3.3.4. Decision Tree Algorithm
3.3.5. Random Forest Algorithm
3.3.6. Support Vector Machine (SVM) Algorithm
3.3.7. XGBoost (Gradient Boosting) Algorithm
3.4. Performance Measurement of Machine Learning Classification Algorithms
3.4.1. Confusion Matrix
3.4.2. Accuracy
3.4.3. Precision
3.4.4. Recall
3.4.5. F1 Score
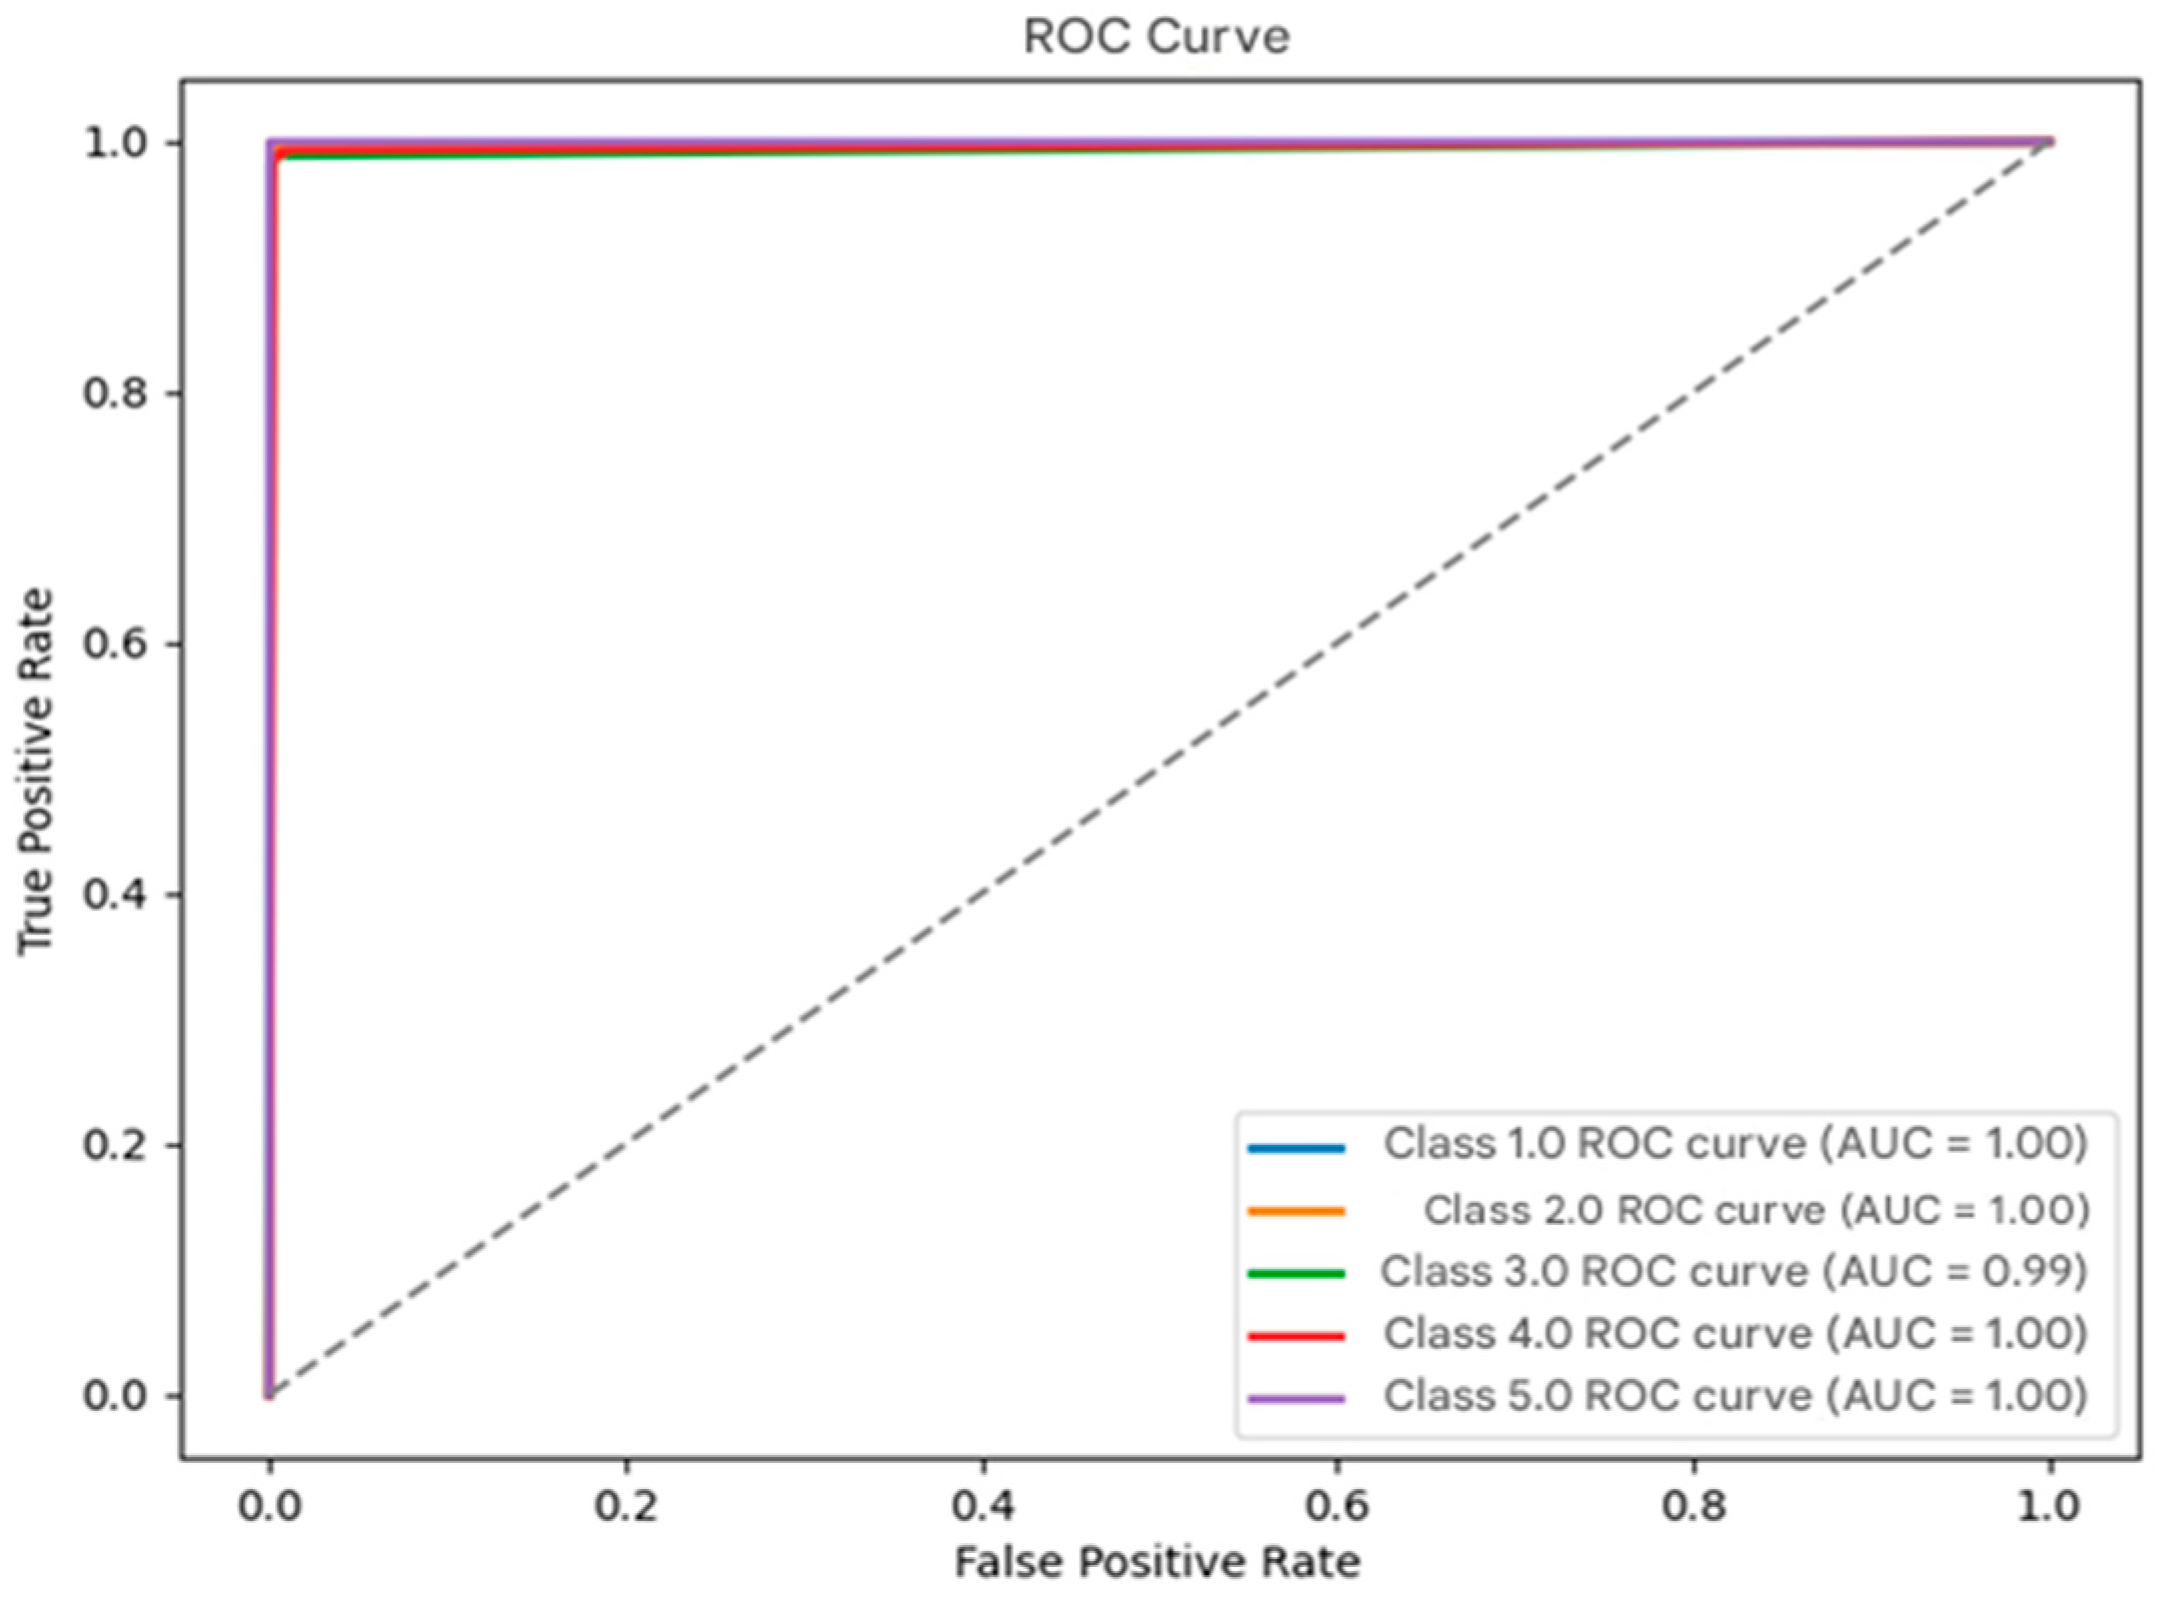
3.4.6. ROC Curve
3.5. Methods Used in the Machine Learning Phase
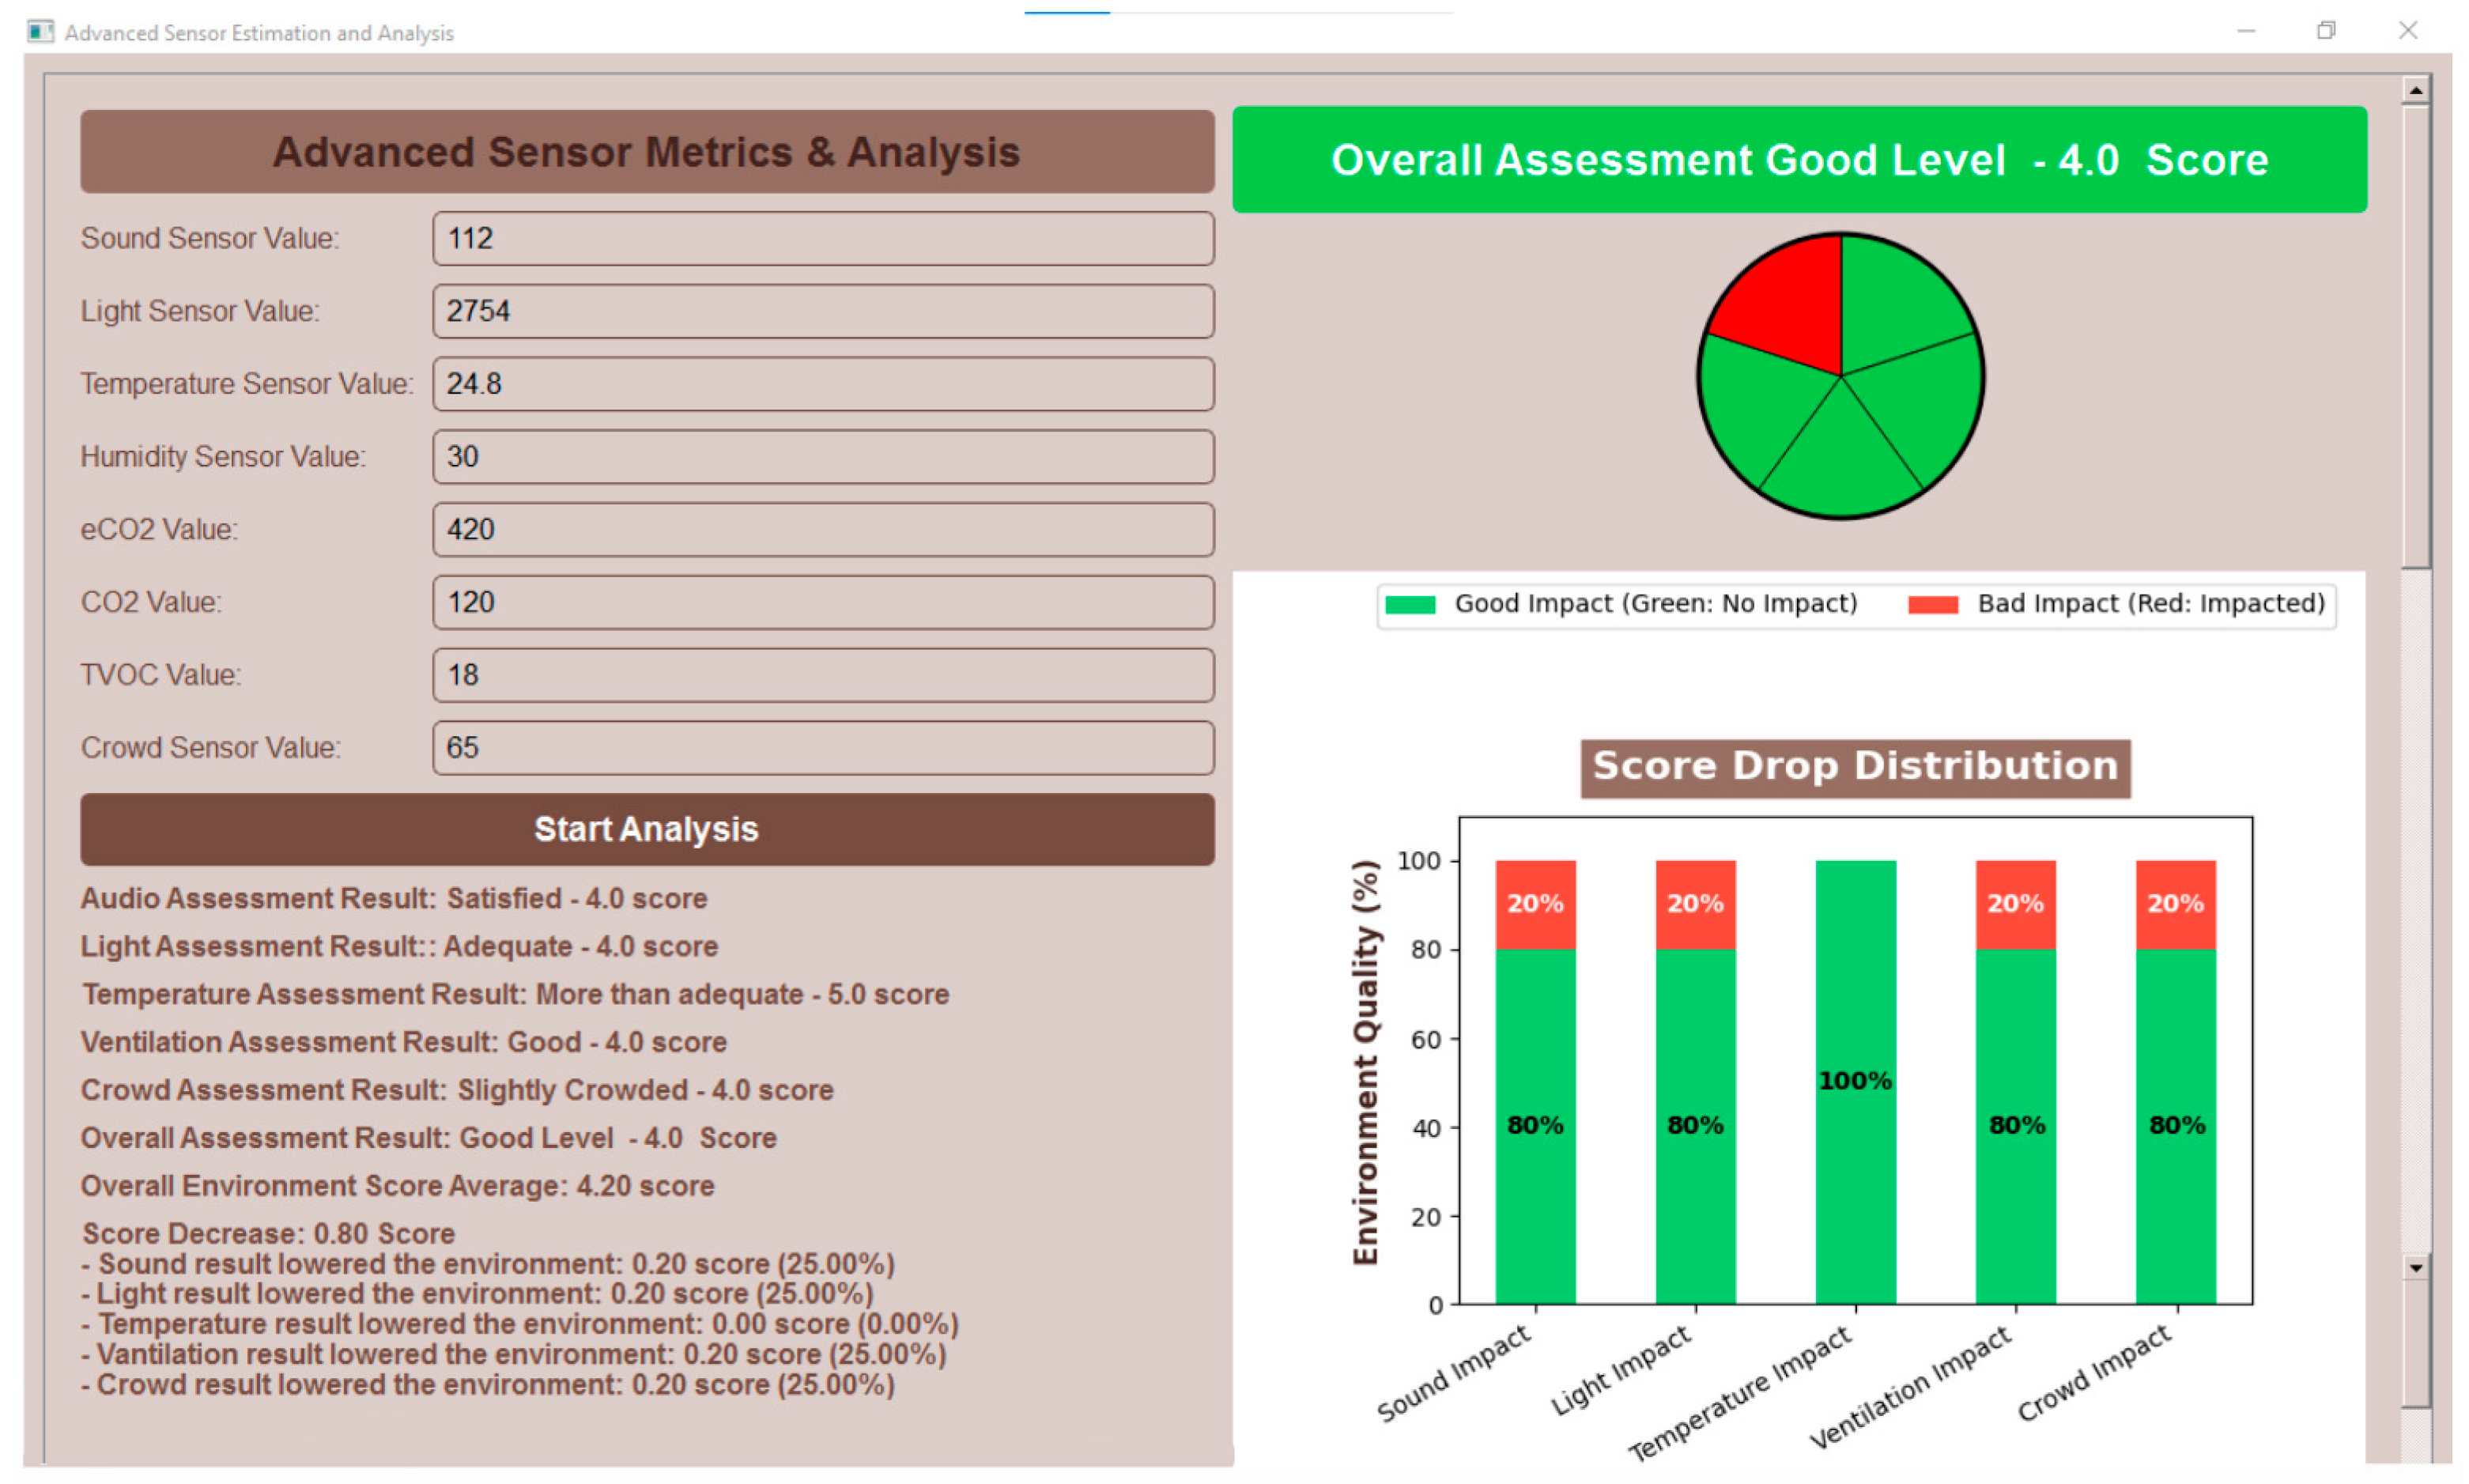
3.6. Application Interface Design
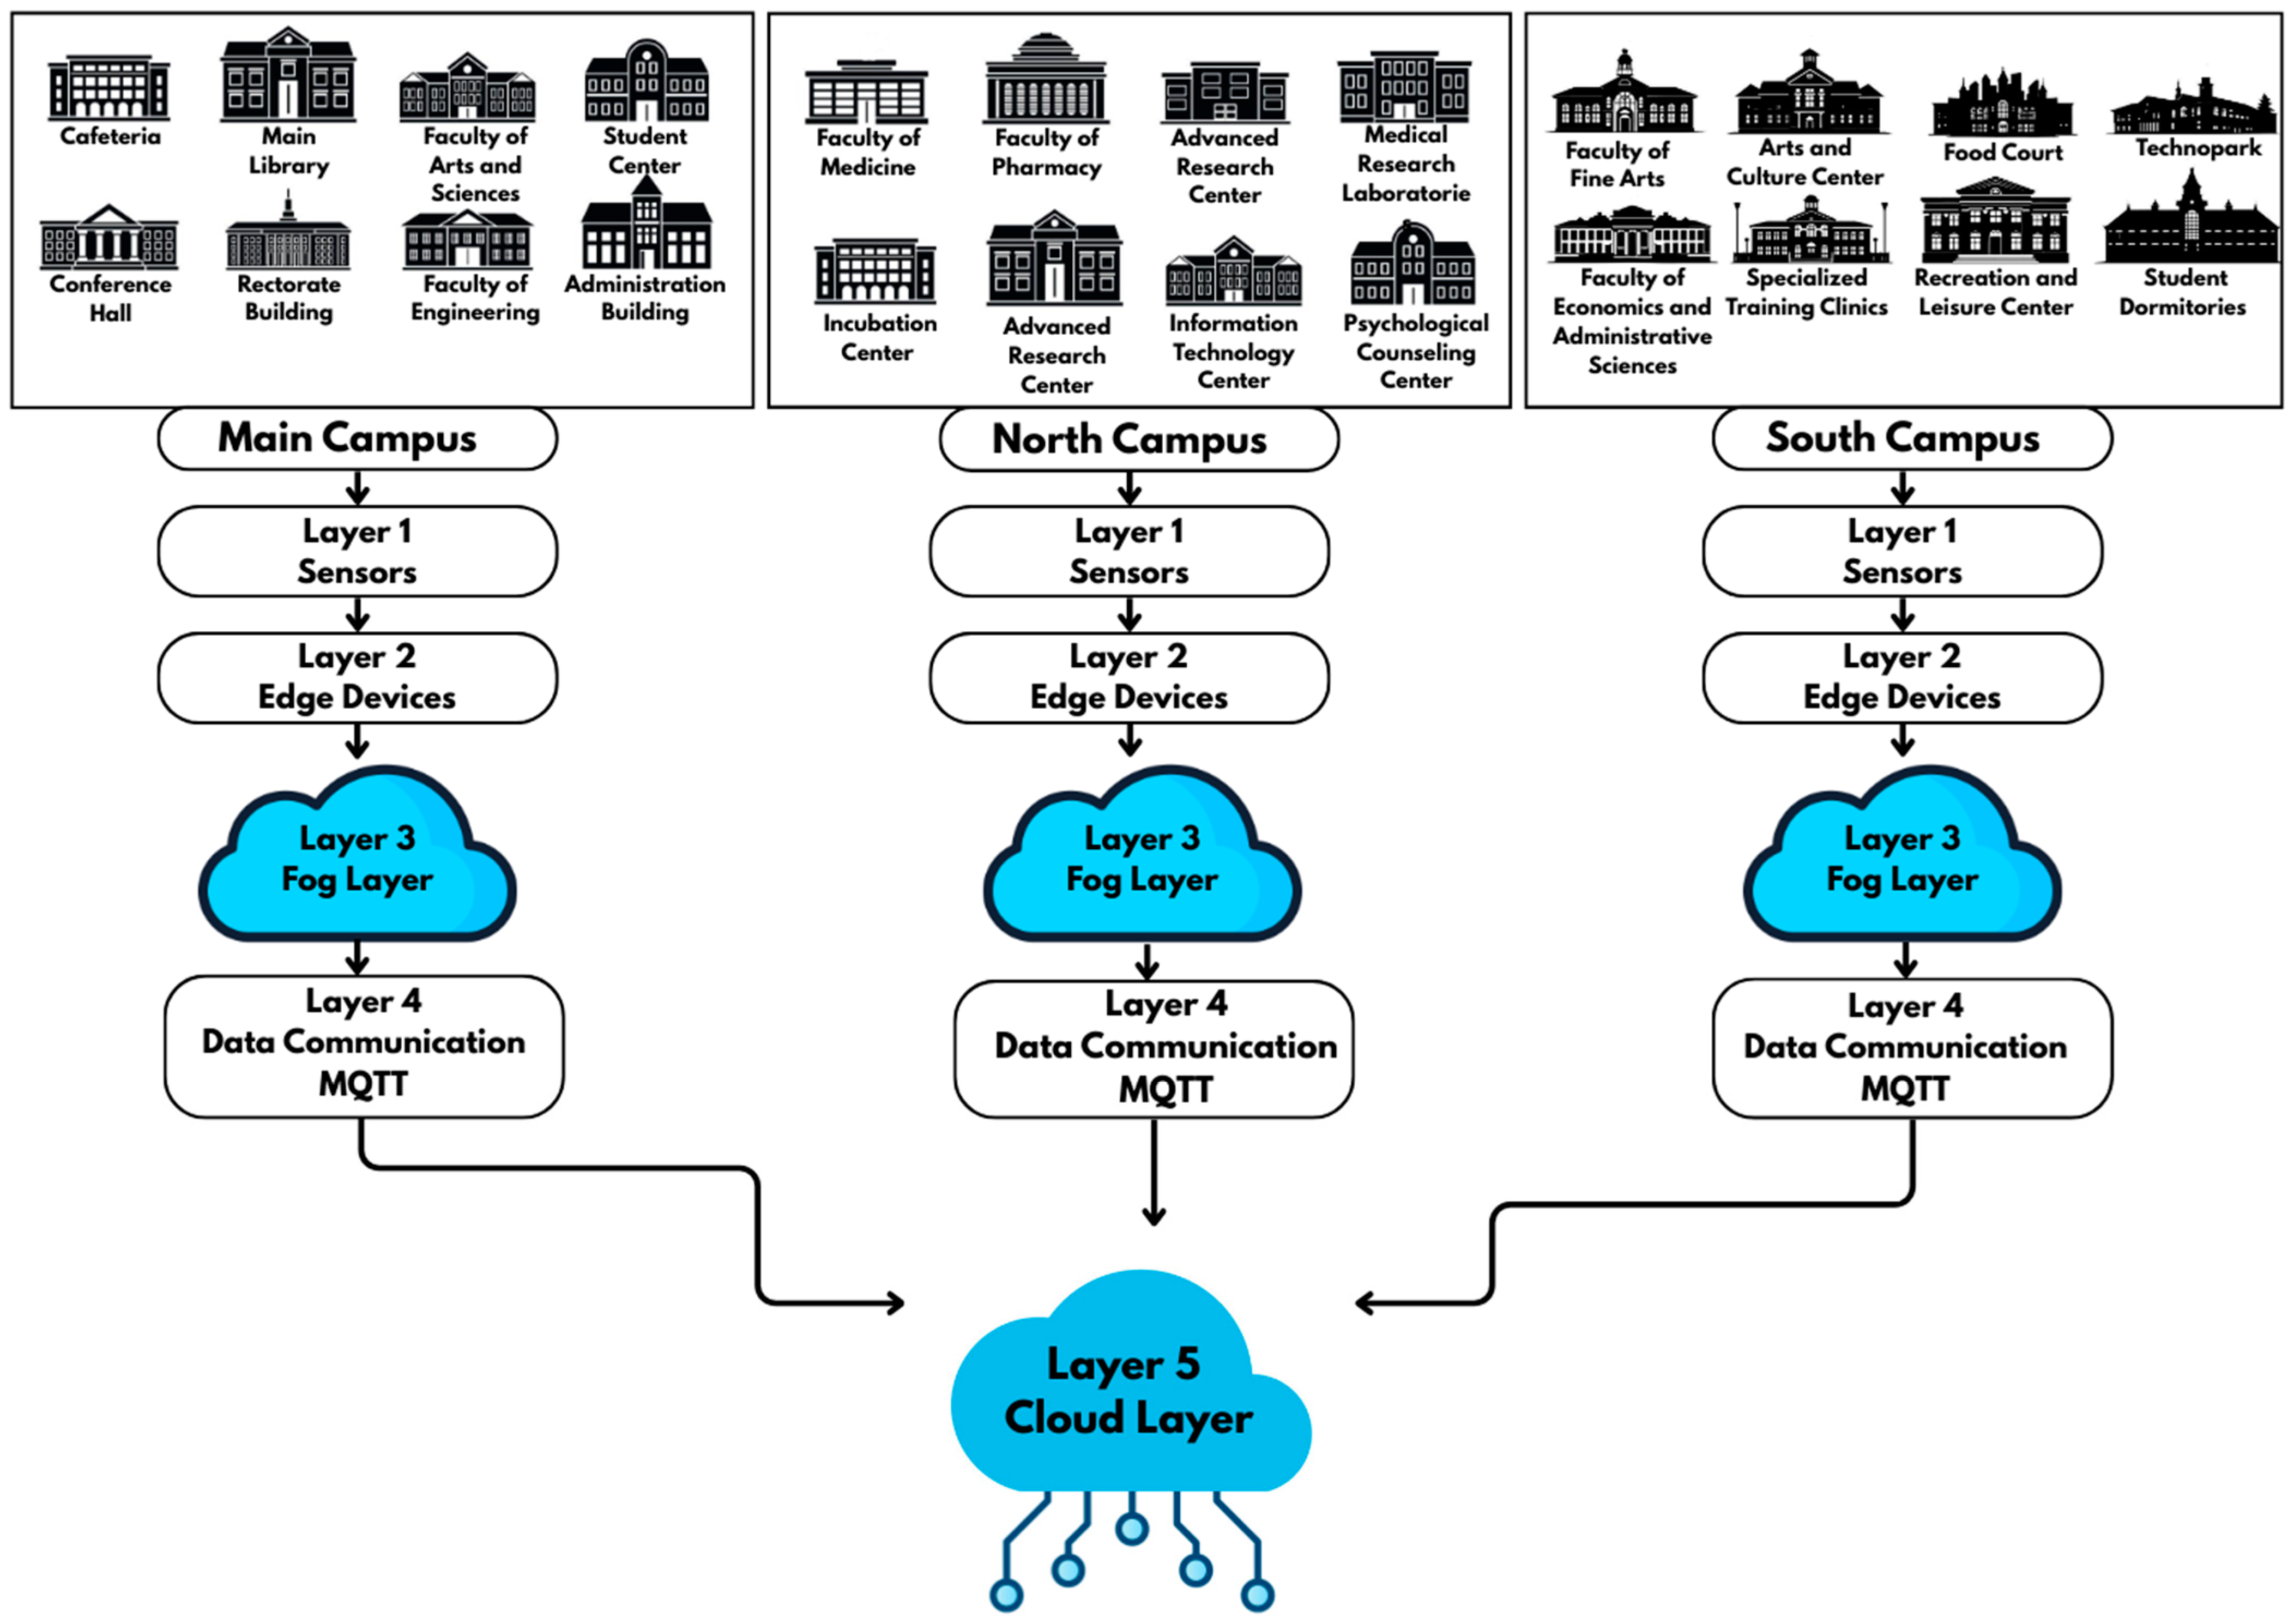
3.7. Proposed Fog–Cloud Architecture
4. Results
4.1. Findings Obtained from the Data Augmentation Process
4.2. Comparison of Machine Learning Algorithms’ Performance
4.2.1. Performance Comparison of All Algorithms on Sensor Data
4.2.2. User General Evaluation Findings Obtained from All Sensor Data Using the K-Nearest Neighbors (KNNs) Algorithm
5. Discussion
6. Conclusions
Future Work: Towards a Smarter and More Adaptive Campus Environment
- Advancing crowding analysis through multi-modal data fusion.
- Multi-modal sensor integration: combining camera-based occupancy tracking, Wi-Fi access logs, and motion sensors with existing environmental data could offer a more comprehensive understanding of space utilization.
- Deep learning-based scene recognition: leveraging Convolutional Neural Networks (CNNs) and Transformer-based models could enable automated crowd density estimation from real-time visual data, improving prediction robustness.
- 2.
- Implementation of deep learning for dynamic environmental adaptation.
- Reinforcement learning-based optimization: implementing self-learning AI systems that continuously adjust environmental conditions (e.g., lighting, ventilation) in response to user behavior, improving both efficiency and user comfort.
- Deep learning-based scene recognition: leveraging Convolutional Neural Networks (CNNs) and Transformer-based models could enable automated crowd density estimation from real-time visual data, improving prediction robustness.
- Temporal analysis with LSTMs and Transformer models: using time-series deep learning models to predict future environmental trends based on historical data, enabling proactive adjustments in smart campus systems.
- 3.
- Expanding the smart campus concept beyond libraries.
- Smart classrooms: automated adjustments in lighting, temperature, and sound based on real-time lecture dynamics and student concentration levels.
- Smart dormitories: personalized environmental settings based on student preferences and biometric data to enhance comfort and well-being.
- Energy-efficient smart buildings: integrating machine learning-driven climate control to optimize energy consumption across campus buildings, aligning with sustainability goals.
- This study was conducted in a library environment; however, it can be easily applied in the future to places where people gather in large numbers, such as offices, restaurants, and cafés.
- 4.
- Enhancing edge computing for real-time decision-making.
- Deploying AI-driven edge computing: using tiny machine learning (TinyML) models directly on IoT sensor nodes to process data locally, reducing the need for cloud-based inference.
- Smart dormitories: personalized environmental settings based on student preferences and biometric data to enhance comfort and well-being.
- Blockchain integration for data security: implementing blockchain-based decentralized data management to enhance privacy and ensure secure, tamper-proof transactions between IoT devices.
- 5.
- Developing an AI-powered decision support system for university administrators.
- Visualize and analyze real-time environmental data via interactive dashboards.
- Automatically generate reports on student productivity trends based on historical sensor data.
- Receive AI-driven recommendations for optimizing campus resource allocation and space utilization.
Author Contributions
Funding
Institutional Review Board Statement
Informed Consent Statement
Data Availability Statement
Acknowledgments
Conflicts of Interest
Abbreviations
| AI | Artificial intelligence |
| BGDTs | Boosted Gradient Decision Trees |
| dB | Decibel |
| DNN | Deep Neural Network |
| DSRA | Dynamic Sampling Rate Algorithm |
| GOLRM | Generalized Ordered Logit Regression Model |
| IAQ | Indoor air quality |
| IEQ | Indoor environmental quality |
| IoT | Internet of Things |
| KNNs | K-Nearest Neighbors |
| LR | Logistic Regression |
| ML | Machine learning |
| PPM | Parts Per Million |
| SEM | Structural Equation Modeling |
| SVM | Support Vector Machine |
| TVOCs | Total Volatile Organic Compounds |
| VOCs | Volatile Organic Compounds |
References
- Hoşten, G.; Dalbay, N. Evaluation of Indoor Air Quality in Terms of Occupational Health and Safety. Aydın J. Health 2018, 4, 1–12. [Google Scholar]
- Kahn, M.; Li, P. The Effect of Pollution and Heat on High Skill Public Sector Worker Productivity in China. 2019. Available online: https://www.nber.org/system/files/working_papers/w25594/w25594.pdf (accessed on 19 November 2024). [CrossRef]
- Tham, S.; Thompson, R.; Landeg, O.; Murray, K.A.; Waite, T. Indoor Temperature and Health: A Global Systematic Review. Public. Health 2020, 179, 9–17. [Google Scholar] [CrossRef] [PubMed]
- Bischo, W.; Lahrz, T. Gesundheitliche Bewertung von Kohlendioxid in Der Innenraumluft [Health Evaluation of Carbon Dioxide in Indoor Air]. Bundesgesundheitsblatt Gesundheitsforschung Gesundheitsschutz 2008, 51, 1358–1369. [Google Scholar] [CrossRef]
- Tabuenca, B.; Borner, D.; Kalz, M. Effects of an Ambient Learning Display on Noise Levels and Perceived Learning in a Secondary School. IEEE Trans. Learn. Technol. 2021, 14, 69–80. [Google Scholar] [CrossRef]
- Shishegar, N.; Boubekri, M. Natural Light and Productivity: Analyzing the Impacts of Daylighting on Students’ and Workers’ Health and Alertness. Int’l J. Adv. Chem. Engg. Biol. Sci. (IJACEBS) 2016, 3, 72–77. Available online: https://www.iicbe.org/upload/4635AE0416104.pdf (accessed on 1 December 2024).
- Viola, A.; James, L.; Schlangen, L.D. Blue-Enriched White Light in the Workplace Improves Self-Reported Alertness, Performance and Sleep Quality. Scand. J. Work. Environ. Health 2008, 34, 297–306. [Google Scholar]
- Rezaee, M.R.; Abdul Hamid, N.A.W.; Hussin, M.; Zukarnain, Z.A. Fog Offloading and Task Management in IoT-Fog-Cloud Environment: Review of Algorithms, Networks, and SDN Application. IEEE Access 2024, 12, 39058–39080. [Google Scholar] [CrossRef]
- Bernard, L.; Yassa, S.; Alouache, L.; Romain, O. Efficient Pareto Based Approach for IoT Task Offloading on Fog–Cloud Environments. Internet Things 2024, 27, 101311. [Google Scholar] [CrossRef]
- Salehnia, T.; Seyfollahi, A.; Raziani, S.; Noori, A.; Ghaffari, A.; Alsoud, A.R.; Abualigah, L. An Optimal Task Scheduling Method in IoT-Fog-Cloud Network Using Multi-Objective Moth-Flame Algorithm. Multimed. Tools Appl. 2024, 83, 34351–34372. [Google Scholar] [CrossRef]
- The Council of Higher Education. Turkish Higher Education Law. No. 2547 (YÖK Legislation), Official Gazette of 1177 the Republic of Turkey, No. 17506; The Council of Higher Education: Ankara, Turkey, 1981; Volume 21, p. 3. [Google Scholar]
- Farmer, L.S.J. Library Space: Its Role in Research. Ref. Libr. 2016, 57, 87–99. [Google Scholar] [CrossRef]
- Vogus, B.; Frederiksen, L. Designing Spaces in Libraries. Public. Serv. Q. 2019, 15, 45–50. [Google Scholar] [CrossRef]
- Aslam, M. Changing Behavior of Academic Libraries and Role of Library Professional. Inf. Discov. Deliv. 2022, 50, 54–63. [Google Scholar] [CrossRef]
- Klain Gabbay, L.; Shoham, S. The Role of Academic Libraries in Research and Teaching. J. Librariansh. Inf. Sci. 2019, 51, 721–736. [Google Scholar] [CrossRef]
- Haverinen-Shaughnessy, U.; Shaughnessy, R.J. Effects of Classroom Ventilation Rate and Temperature on Students’ Test Scores. PLoS ONE 2015, 10, e0136165. [Google Scholar] [CrossRef]
- Samani, S.A.; Samani, S.A. The Impact of Indoor Lighting on Students’ Learning Performance in Learning Environments: A Knowledge Internalization Perspective. Int. J. Bus. Social. Sci. 2012, 3, 127–136. [Google Scholar]
- Hou, H.; Lan, H.; Lin, M.; Xu, P. Investigating Library Users’ Perceived Indoor Environmental Quality: SEM-Logit Analysis Study in a University Library. J. Build. Eng. 2024, 93, 109805. [Google Scholar] [CrossRef]
- Azra, M. Investigating Indoor Environment Quality for a University Library. 2019. Available online: https://www.researchgate.net/publication/344349310_Investigating_Indoor_Environment_Quality_for_a_University_Library (accessed on 28 November 2024).
- Abraham, S.; Beard, J.; Manijacob, R. Remote Environmental Monitoring Using Internet of Things (IoT). In Proceedings of the 2017 IEEE Global Humanitarian Technology Conference (GHTC), San Jose, CA, USA, 19–22 October 2017; pp. 1–6. [Google Scholar] [CrossRef]
- Khritish, S. The Impact of Study Environment on Students’ Academic Performance: An Experimental Research Study. TechRxiv 2023. [Google Scholar] [CrossRef]
- Aflaki, A.; Esfandiari, M.; Jarrahi, A. Multi-Criteria Evaluation of a Library’s Indoor Environmental Quality in the Tropics. Buildings 2023, 13, 1233. [Google Scholar] [CrossRef]
- Akanmu, W.P.; Nunayon, S.S.; Eboson, U.C. Indoor Environmental Quality (IEQ) Assessment of Nigerian University Libraries: A Pilot Study. Energy Built Environ. 2021, 2, 302–314. [Google Scholar] [CrossRef]
- Twardella, D.; Matzen, W.; Lahrz, T.; Burghardt, R.; Spegel, H.; Hendrowarsito, L.; Frenzel, A.C.; Fromme, H. Effect of Classroom Air Quality on Students’ Concentration: Results of a Cluster-Randomized Cross-over Experimental Study. Indoor Air Int. J. Indoor Environ. Health 2012, 22, 378–387. [Google Scholar] [CrossRef]
- Sadick, A.M.; Kpamma, Z.E.; Agyefi-Mensah, S. Impact of Indoor Environmental Quality on Job Satisfaction and Self-Reported Productivity of University Employees in a Tropical African Climate. Build. Environ. 2020, 181, 107102. [Google Scholar] [CrossRef]
- Peng, L.; Wei, W.; Fan, W.; Jin, S.; Liu, Y. Student Experience and Satisfaction in Academic Libraries: A Comparative Study among Three Universities in Wuhan. Buildings 2022, 12, 682. [Google Scholar] [CrossRef]
- Shah, S.K.; Tariq, Z.; Lee, J.; Lee, Y. Real-Time Machine Learning for Air Quality and Environmental Noise Detection. In Proceedings of the 2020 IEEE International Conference on Big Data (Big Data), Atlanta, GA, USA, 10–13 December 2020; pp. 3506–3515. [Google Scholar] [CrossRef]
- Lee, Y.S. Collaborative Activities and Library Indoor Environmental Quality Affecting Performance, Health, and Well-Being of Different Library User Groups in Higher Education. Facilities 2014, 32, 88–103. [Google Scholar] [CrossRef]
- Brink, H.W.; Lechner, S.C.M.; Loomans, M.G.L.C.; Mobach, M.P.; Kort, H.S.M. Understanding How Indoor Environmental Classroom Conditions Influence Academic Performance in Higher Education. Facilities 2024, 42, 185–200. [Google Scholar] [CrossRef]
- Xiong, L.; Huang, X.; Li, J.; Mao, P.; Wang, X.; Wang, R.; Tang, M. Impact of Indoor Physical Environment on Learning Efficiency in Different Types of Tasks: A 3 × 4 × 3 Full Factorial Design Analysis. Int. J. Environ. Res. Public. Health 2018, 15, 1256. [Google Scholar] [CrossRef]
- Hong, S.; Kim, Y.; Yang, E. Indoor Environment and Student Productivity for Individual and Collaborative Work in Learning Commons: A Case Study. Libr. Manag. 2022, 43, 15–34. [Google Scholar] [CrossRef]
- Khan, A.U.; Zhang, Z.; Chohan, S.R.; Rafique, W. Factors Fostering the Success of IoT Services in Academic Libraries: A Study Built to Enhance the Library Performance. Libr. Hi Tech. 2022, 40, 1976–1995. [Google Scholar] [CrossRef]
- Salamone, F.; Bellazzi, A.; Belussi, L.; Damato, G.; Danza, L.; Dell’aquila, F.; Ghellere, M.; Megale, V.; Meroni, I.; Vitaletti, W. Evaluation of the Visual Stimuli on Personal Thermal Comfort Perception in Real and Virtual Environments Using Machine Learning Approaches. Sensors 2020, 20, 1627. [Google Scholar] [CrossRef]
- Marzouk, M.; Atef, M. Assessment of Indoor Air Quality in Academic Buildings Using IoT and Deep Learning. Sustainability 2022, 14, 7015. [Google Scholar] [CrossRef]
- Dumitrezcu, M.V.; Voicu, I.; Vasılıca, A.F.; Panaitescu, F.V. High-Performance Techniques and Technologies for Monitoring and Controlling Environmental Factors. Hidraulica 2024, 1, 48–55. [Google Scholar]
- Zareb, M.; Bakhti, B.; Bouzid, Y.; Batista, C.E.; Ternifi, I.; Abdenour, M. An Intelligent IoT Fuzzy Based Approach for Automated Indoor Air Quality Monitoring. In Proceedings of the 29th Mediterranean Conference on Control and Automation (MED), Puglia, Italy, 22–25 June 2021; pp. 770–775. [Google Scholar] [CrossRef]
- Ullo, S.L.; Sinha, G.R. Advances in Smart Environment Monitoring Systems Using IoT and Sensors. Sensors 2020, 20, 3113. [Google Scholar] [CrossRef] [PubMed]
- Mohammadi, M.; Yeganə, M. IOT: Applied New Technology in Academic Libraries. In Proceedings of the International Conference on Distributed Computing and High Performance Computing (DCHP 2018), Qom, Iran, 25–27 November 2018; pp. 1–12. [Google Scholar]
- Bi, S.; Wang, C.; Zhang, J.; Huang, W.; Wu, B.; Gong, Y.; Ni, W. A Survey on Artificial Intelligence Aided Internet-of-Things Technologies in Emerging Smart Libraries. Sensors 2022, 22, 2991. [Google Scholar] [CrossRef] [PubMed]
- Maashi, M.; Alabdulkreem, E.; Maray, M.; Shankar, K.; Darem, A.A.; Alzahrani, A.; Yaseen, I. Elevating Survivability in Next-Gen IoT-Fog-Cloud Networks: Scheduling Optimization with the Metaheuristic Mountain Gazelle Algorithm. IEEE Trans. Consum. Electron. 2024, 70, 3802–3809. [Google Scholar] [CrossRef]
- Mahapatra, A.; Majhi, S.K.; Mishra, K.; Pradhan, R.; Rao, D.C.; Panda, S.K. An Energy-Aware Task Offloading and Load Balancing for Latency-Sensitive IoT Applications in the Fog-Cloud Continuum. IEEE Access 2024, 12, 14334–14349. [Google Scholar] [CrossRef]
- Khezri, E.; Yahya, R.O.; Hassanzadeh, H.; Mohaidat, M.; Ahmadi, S.; Trik, M. DLJSF: Data-Locality Aware Job Scheduling IoT Tasks in Fog-Cloud Computing Environments. Results Eng. 2024, 21, 101780. [Google Scholar] [CrossRef]
- Bharathi, P.D.; Velu, A.N.; Palaniappan, B.S. Design and Enhancement of a Fog-Enabled Air Quality Monitoring and Prediction System: An Optimized Lightweight Deep Learning Model for a Smart Fog Environmental Gateway. Sensors 2024, 24, 5069. [Google Scholar] [CrossRef]
- Moreno-Rodenas, A.M.; Duinmeijer, A.; Clemens, F.H.L.R. Deep-Learning Based Monitoring of FOG Layer Dynamics in Wastewater Pumping Stations. Water Res. 2021, 202, 117482. [Google Scholar] [CrossRef]
- Bhargavi, P.; Jyothi, S. Object Detection in Fog Computing Using Machine Learning Algorithms. In Research Anthology on Machine Learning Techniques, Methods, and Applications; IGI Global: Hershey, PA, USA, 2022; pp. 472–485. ISBN 9781668462928. [Google Scholar]
- Verma, P.; Tiwari, R.; Hong, W.C.; Upadhyay, S.; Yeh, Y.H. FETCH: A Deep Learning-Based Fog Computing and IoT Integrated Environment for Healthcare Monitoring and Diagnosis. IEEE Access 2022, 10, 12548–12563. [Google Scholar] [CrossRef]
- Dahouda, M.K.; Joe, I. A Deep-Learned Embedding Technique for Categorical Features Encoding. IEEE Access 2021, 9, 114381–114391. [Google Scholar] [CrossRef]
- Huawei Technologies Co., Ltd. (Ed.) Artificial Intelligence Technology; Official Textbooks for Huawei ICT Academy; Huawei ICT Academy: Hangzhou, China; Springer: Singapore, 2021; ISBN 978-981-19-2878-9. [Google Scholar]
- Elreedy, D.; Atiya, A.F.; Kamalov, F. A Theoretical Distribution Analysis of Synthetic Minority Oversampling Technique (SMOTE) for Imbalanced Learning. Mach. Learn. 2024, 113, 4903–4923. [Google Scholar] [CrossRef]
- Wei, W.; Xu, X.; Hu, G.; Shao, Y.; Wang, Q. Deep Learning and Histogram-Based Grain Size Analysis of Images. Sensors 2024, 24, 4923. [Google Scholar] [CrossRef] [PubMed]
- Gong, H.; Li, Y.; Zhang, J.; Zhang, B.; Wang, X. A New Filter Feature Selection Algorithm for Classification Task by Ensembling Pearson Correlation Coefficient and Mutual Information. Eng. Appl. Artif. Intell. 2024, 131, 107865. [Google Scholar] [CrossRef]
- Talukdar, W.; Biswas, A. Synergizing Unsupervised and Supervised Learning: A Hybrid Approach for Accurate Natural Language Task Modeling. Int. J. Innov. Sci. Res. Technol. (IJISRT) 2024, 9, 1499–1508. [Google Scholar] [CrossRef]
- Sarker, I.H. Machine Learning: Algorithms, Real-World Applications and Research Directions. SN Comput. Sci. 2021, 2, 160. [Google Scholar]
- Sun, D.; Xu, J.; Wen, H.; Wang, D. Assessment of Landslide Susceptibility Mapping Based on Bayesian Hyperparameter Optimization: A Comparison between Logistic Regression and Random Forest. Eng. Geol. 2021, 281, 105972. [Google Scholar] [CrossRef]
- Zou, X.; Hu, Y.; Tian, Z.; Shen, K. Logistic Regression Model Optimization and Case Analysis. In Proceedings of the IEEE 7th International Conference on Computer Science and Network Technology, ICCSNT 2019, Dalian, China, 19–20 October 2019; pp. 135–139. [Google Scholar] [CrossRef]
- Wickramasinghe, I.; Kalutarage, H. Naive Bayes: Applications, Variations and Vulnerabilities: A Review of Literature with Code Snippets for Implementation. Soft Comput 2021, 25, 2277–2293. [Google Scholar] [CrossRef]
- Dilki, G.; Deniz Başar, Ö. Istanbul Commerce University Journal of Science-Comparison Study of Distance Measures Using K-Nearest Neighbor Algorithm on Bankruptcy Prediction. Istanb. Commer. Univ. J. Sci. 2020, 19, 224–233. [Google Scholar]
- Kemalbay, G.; Alkış, B.N. Prediction of Stock Market Index Movement Direction Using Multinomial Logistic Regression and K-Nearest Neighbor Algorithm. Pamukkale Univ. J. Eng. Sci. 2021, 27, 556–569. [Google Scholar] [CrossRef]
- Mailagaha Kumbure, M.; Luukka, P. A Generalized Fuzzy K-Nearest Neighbor Regression Model Based on Minkowski Distance. Granul. Comput. 2022, 7, 657–671. [Google Scholar]
- Lubis, A.R.; Prayudani, S.; Al-Khowarizmi; Lase, Y.Y.; Fatmi, Y. Similarity Normalized Euclidean Distance on KNN Method to Classify Image of Skin Cancer. In Proceedings of the 2021 4th International Seminar on Research of Information Technology and Intelligent Systems, ISRITI 2021, Yogyakarta, Indonesia, 16–17 December 2021; pp. 68–73. [Google Scholar] [CrossRef]
- Ehsani, R.; Drabløs, F. Robust Distance Measures for KNN Classification of Cancer Data. Cancer Inform. 2020, 19, 1–9. [Google Scholar] [CrossRef]
- Mahesh, B. Machine Learning Algorithms—A Review. Int. J. Sci. Res. (IJSR) 2020, 9, 381–386. [Google Scholar] [CrossRef]
- Özlüer Başer, B.; Yangin, M.; Selin Saridaş, E. Classification of Diabetes Disease Using Machine Learning Techniques. J. Inst. Sci. Suleyman Demirel Univ. 2021, 25, 112–120. [Google Scholar] [CrossRef]
- Rastogi, V. Machine Learning Algorithms: Overview. Int. J. Adv. Res. Eng. Technol. 2020, 11, 512–517. [Google Scholar]
- Tangirala, S. Evaluating the Impact of GINI Index and Information Gain on Classification Using Decision Tree Classifier Algorithm. Int. J. Adv. Comput. Sci. Appl. 2020, 11, 612–619. [Google Scholar] [CrossRef]
- Song, Y.Y.; Lu, Y. Decision Tree Methods: Applications for Classification and Prediction. Shanghai Arch. Psychiatry 2015, 27, 130. [Google Scholar] [CrossRef]
- Rigatti, S.J. Random Forest. J. Insur. Med. 2017, 47, 31–39. [Google Scholar] [CrossRef]
- Yaşlı, G.S. Prediction Study in Healthcare System Using Machine Learning Algorithms. Master’s Thesis, Sakarya University, Ankara, Turkey, 2024. [Google Scholar]
- Sathish Kumar, L.; Pandimurugan, V.; Usha, D.; Nageswara Guptha, M.; Hema, M.S. Random Forest Tree Classification Algorithm for Predicating Loan. Mater. Today Proc. 2022, 57, 2216–2222. [Google Scholar] [CrossRef]
- Bansal, M.; Goyal, A.; Choudhary, A. A Comparative Analysis of K-Nearest Neighbor, Genetic, Support Vector Machine, Decision Tree, and Long Short Term Memory Algorithms in Machine Learning. Decis. Anal. J. 2022, 3, 100071. [Google Scholar] [CrossRef]
- Roy, A.; Chakraborty, S. Support Vector Machine in Structural Reliability Analysis: A Review. Reliab. Eng. Syst. Saf. 2023, 233, 109126. [Google Scholar] [CrossRef]
- Liu, Q.J.; Jing, L.H.; Wang, L.M. The Development and Application of Support Vector Machine. J. Phys. Conf. Ser. 2021, 1748, 052006. [Google Scholar] [CrossRef]
- Rochim, A.F.; Widyaningrum, K.; Eridani, D. Performance Comparison of Support Vector Machine Kernel Functions in Classifying COVID-19 Sentiment. In Proceedings of the 2021 4th International Seminar on Research of Information Technology and Intelligent Systems, ISRITI 2021, Yogyakarta, Indonesia, 16–17 December 2021; pp. 224–228. [Google Scholar] [CrossRef]
- Dhaliwal, S.S.; Al Nahid, A.; Abbas, R. Effective Intrusion Detection System Using XGBoost. Information 2018, 9, 149. [Google Scholar] [CrossRef]
- Chen, T.; Guestrin, C. XGBoost: A Scalable Tree Boosting System. In Proceedings of the 22nd ACM SIGKDD International Conference on Knowledge Discovery and Data Mining, San Francisco, CA, USA, 13–17 August 2016; pp. 785–794. [Google Scholar] [CrossRef]
- Liew, X.Y.; Hameed, N.; Clos, J. An Investigation of XGBoost-Based Algorithm for Breast Cancer Classification. Mach. Learn. Appl. 2021, 6, 100154. [Google Scholar] [CrossRef]
- Sathyanarayanan, S. Confusion Matrix-Based Performance Evaluation Metrics. Afr. J. Biomed. Res. 2024, 27, 4023–4031. [Google Scholar] [CrossRef]
- Hoo, Z.H.; Candlish, J.; Teare, D. What Is an ROC Curve? Emerg. Med. J. 2017, 34, 357–359. [Google Scholar] [CrossRef]
- Narkhede, S. Understanding AUC—ROC Curve. Towards Data Sci. 2018, 1, 220–227. [Google Scholar]
- Rimal, Y.; Sharma, N.; Alsadoon, A. The Accuracy of Machine Learning Models Relies on Hyperparameter Tuning: Student Result Classification Using Random Forest, Randomized Search, Grid Search, Bayesian, Genetic, and Optuna Algorithms. Multimed. Tools Appl. 2024, 83, 74349–74364. [Google Scholar] [CrossRef]
- Zhang, X.; Liu, C.A. Model Averaging Prediction by K-Fold Cross-Validation. J. Econom. 2023, 235, 280–301. [Google Scholar] [CrossRef]
- Preuveneers, D.; Tsingenopoulos, I.; Joosen, W. Resource Usage and Performance Trade-Offs for Machine Learning Models in Smart Environments. Sensors 2020, 20, 1176. [Google Scholar] [CrossRef]
- Al-Shareeda, M.A.; Alsadhan, A.A.; Qasim, H.H.; Manickam, S. The Fog Computing for Internet of Things: Review, Characteristics and Challenges, and Open Issues. Bull. Electr. Eng. Inform. 2024, 13, 1080–1089. [Google Scholar] [CrossRef]
- Sarkohaki, F.; Sharifi, M. Service Placement in Fog–Cloud Computing Environments: A Comprehensive Literature Review. J. Supercomput. 2024, 80, 17790–17822. [Google Scholar] [CrossRef]


| Study | Environmental Factors Used | Data Collection Methods | Machine Learning/ Analysis Methods | Contributions and Innovations | What is the Added Value of Our Paper? |
|---|---|---|---|---|---|
| [21] | Noise | Surveys and observations | - | Highlights the negative effects of noise on academic performance. | By analyzing noise and other environmental factors together, more comprehensive results are presented. |
| [19] | IAQ (indoor air quality), light, and acoustics | Physical measurements and surveys | - | Examined the impact of environmental factors in the library on user experience. | Combines environmental factors in the library with user feedback and allows more efficient monitoring through IoT sensors. |
| [22] | Temperature, humidity, CO2, noise, and light | Environmental sensors and portable devices | - | Provides suggestions for monitoring and optimizing various environmental factors. | This study analyzes sensor data with machine learning algorithms and improves environmental factors through more detailed decision support systems. |
| [23] | Acoustic, visual, and thermal comfort | Portable devices | - | Proposes improvements to comfort levels in library environments. | More personalized environmental improvements are achieved using IoT-enabled sensors and user feedback. |
| [24] | IAQ (indoor air quality) | Environmental sensors | - | Investigated the impact of the IAQ on student concentration. | IAQ optimization can be conducted dynamically and instantaneously with sensor data and machine learning. |
| [25] | IAQ, light, and acoustics | Surveys and physical measurements | - | Evaluated the experiences of students and academic staff regarding the indoor environmental quality (IEQ) in library environments. | In this study, more precise environmental control is provided, optimized through student and staff feedback. |
| [26] | Service accessibility, interior design, and environmental factors | Surveys and observations | Regression analysis | Investigated the effect of environmental factors in libraries on user satisfaction. | With IoT- and AI-based solutions, the continuous monitoring of environmental factors and data-driven decision support systems are proposed. |
| [27] | Air quality and noise | Sensors and AI-based data | AI | Suggested ways to optimize air quality and noise levels. | Real-time data analysis enables more effective improvement in environmental conditions. |
| [28] | IAQ, temperature, and acoustics | Surveys and sensors | - | Investigated the priorities of library users regarding environmental factors. | This study offers more flexible and dynamic environmental optimization through user feedback. |
| [29] | Temperature, light, acoustics, and IAQ | Surveys and observations | - | Analyzed the impact of poor environmental conditions on education and learning. | Continuous monitoring with IoT sensors allows faster and more targeted environmental improvements. |
| [30] | Temperature, noise, and light | Sensors and observations | - | Tested the environmental factors affecting learning efficiency. | Sensor data and machine learning facilitate rapid adaptation to environmental conditions. |
| [31] | IAQ and noise | IoT sensors | - | Proposed IoT-based solutions for IAQ and noise management. | Real-time feedback is provided with IoT- and AI-based environmental monitoring systems. |
| [32] | IAQ and thermal comfort | Surveys and sensors | - | Investigated how IoT technologies can be more effectively utilized in library environments. | In this study, the continuous optimization of environmental data is ensured with IoT and AI integration. |
| [33] | Thermal comfort | Sensors and AI | Machine learning (Extra Trees classifier) | Used IoT and machine learning for personal thermal comfort modeling. | Environmental factors are dynamically optimized according to personal preferences. |
| [34] | IAQ | Sensors and microcontrollers | AI | Developed an IAQ assessment system. | Integration of IAQ data with user feedback and environmental factors provides more comprehensive monitoring. |
| [35] | IAQ | Biometric data and IoT sensors | AI | Conducted IAQ analysis with biometric data. | This study enables real-time environmental monitoring using a broader sensor network integrated with IoT. |
| [36] | CO2, PM, NOx, VOCs, and water quality | IoT sensors | Machine learning | Developed IoT-based environmental monitoring systems. | Real-time data analysis and machine learning enable more efficient management of environmental data. |
| [37] | Environmental factors | IoT devices | - | Proposed IoT solutions for library infrastructure and security. | More detailed data analysis focused on infrastructure management and user satisfaction is achieved with IoT. |
| [38] | Environmental factors | IoT devices | - | Increased user satisfaction by integrating IoT into library infrastructure. | By combining IoT-enabled environmental optimization and security solutions, more secure and efficient library environments are provided. |
| [39] | Environmental factors | IoT devices | - | Introduced IoT and AI solutions for “smart libraries”. | Continuous optimization of environmental factors is achieved with AI and IoT integration, enhancing the user experience. |
| [40] | Environmental factors | Sensors and IoT devices | - | Ensured local data processing with cloud and fog computing integration. | In this study, environmental data are processed and optimized more quickly through IoT and fog computing integration. |
| [41] | Environmental factors | IoT devices | - | Local data processing was enabled using fog computing. | Machine learning- and AI-based solutions are provided for faster processing of environmental factors. |
| [42] | Environmental factors | IoT devices | - | Overcame data transfer bottlenecks in IoT devices with fog computing. | This study ensures faster data flow through IoT devices and AI-based solutions for optimizing environmental data. |
| [43] | Air quality (AQI), temperature, humidity, and Gas Sensors | IoT sensors and data transmission via LPWAN (LoRa) | Seq2Seq GRU Attention, Post-Training Quantization (PTQ) Model Optimization | Provides optimized real-time air quality prediction with fog computing, with model reduction for operation on low-cost devices. | This study integrates not only air quality but also light, sound, temperature, and user feedback to achieve a more comprehensive optimization. Additionally, it provides actionable, user-experience-oriented recommendations rather than relying solely on predictive models. |
| [44] | Wastewater Pumping (Fat, Grease, Solid Waste Accumulation), Water Level, Flow Rate, and Surface Vortices | Camera-based Imaging System and local processing via edge AI | Deep learning-based Computer Vision Algorithms (Image Analysis, Shape Change, Flow Dynamics) | Optimizes maintenance planning for wastewater stations, offering low-cost and long-term data collection. | This study combines multiple environmental factors (light, sound, temperature, humidity, air quality, user feedback) for real-time optimization and a decision support system that enhances user experience. Additionally, the fog–cloud architecture ensures data security and efficient data transfer. |
| [45] | IoT devices, Network Load Reduction, and Resource-Intensive Functions | IoT devices, sensor data, and data communication | Machine learning (object detection, text detection, algorithms) | Reduces network load with fog computing, enabling advanced tasks like object and text detection via machine learning. | It not only reduces network load but also combines a wide range of environmental factors with user feedback to provide deeper, real-time optimizations. The system dynamically improves both the physical environment and user experience, offering real-time recommendations for more effective decision support. |
| [46] | Health data (e.g., Heart Disease) | Edge Computing Devices and Deep Learning Technology | Automated monitoring and deep learning-based analysis | Focuses on solving device latency and high-data-volume issues in health systems. | Unlike this study, this study goes beyond health data by integrating various environmental factors such as air quality, light, sound, temperature, humidity, and user feedback. This offers real-time, dynamic, and multi-dimensional data analysis, enhancing not only system performance but also personalized recommendations to actively improve user experience, especially in complex environments like libraries with dynamic user interactions. |
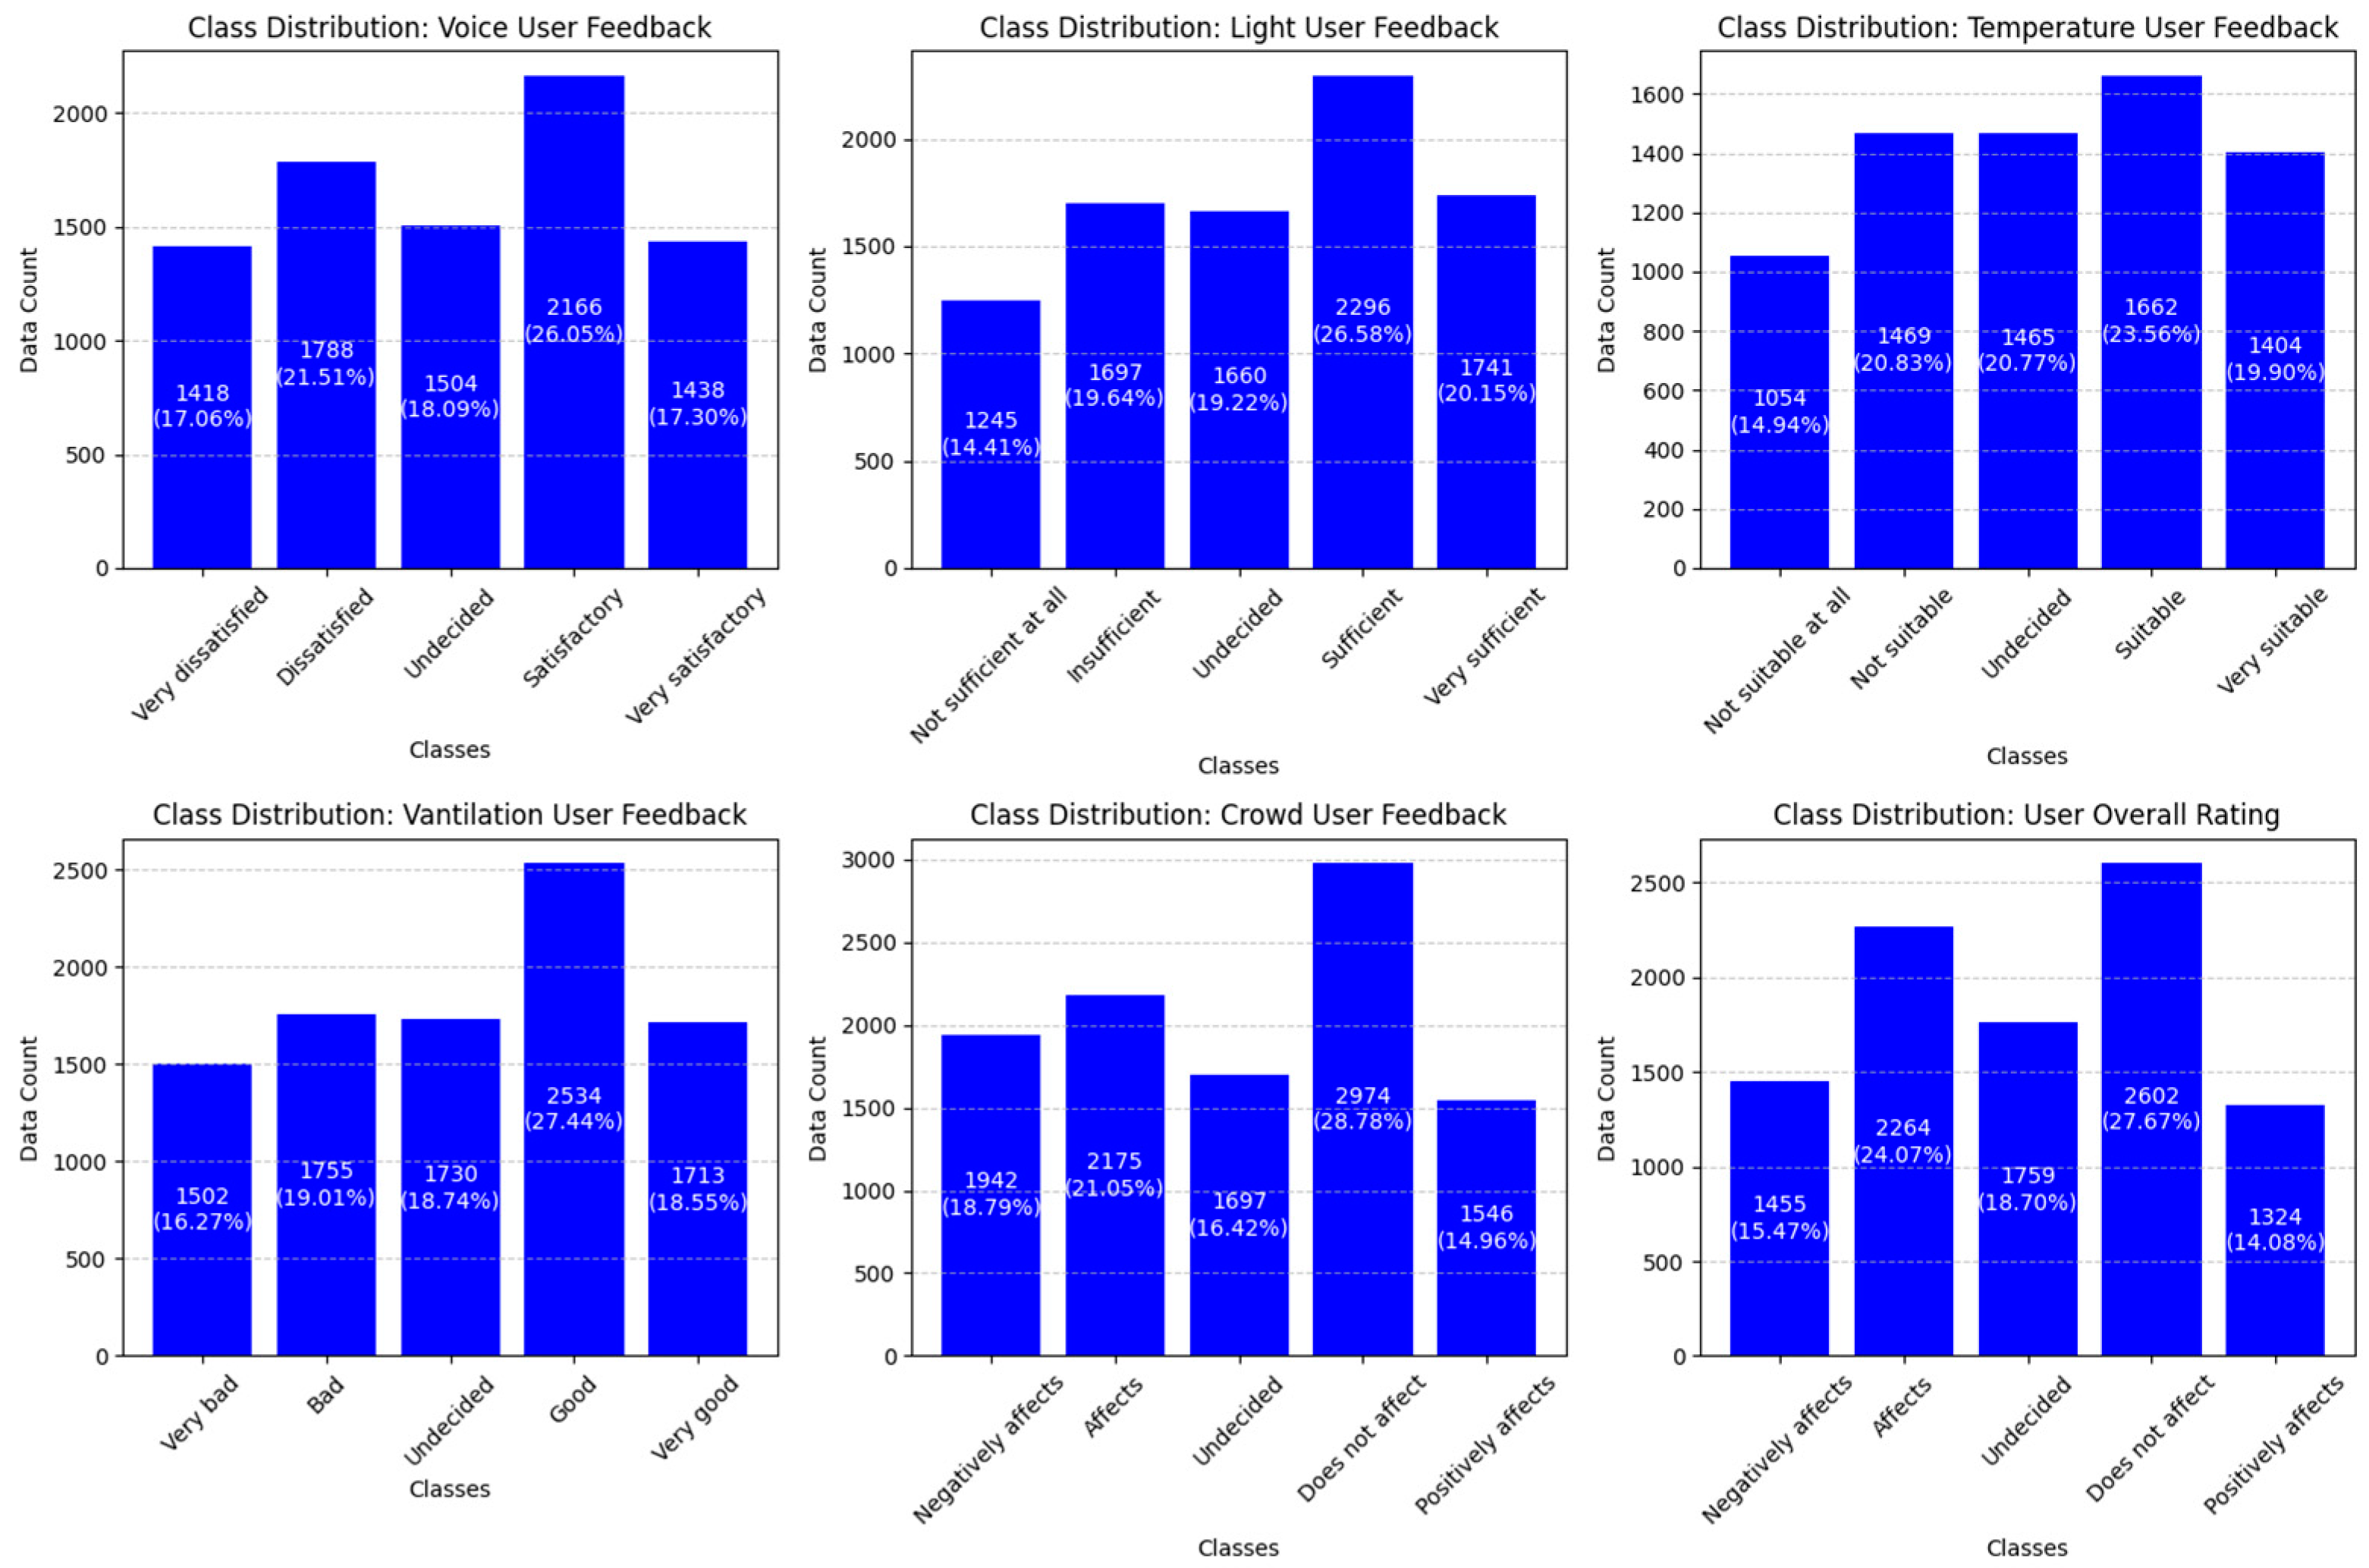
| Class 1 | Class 2 | Class 3 | Class 4 | Class 5 | Total | |
|---|---|---|---|---|---|---|
| Sound sensor value (dB) | 1418 | 1788 | 1504 | 2166 | 1438 | 8314 |
| Light sensor value (lux) | 1245 | 1697 | 1660 | 2296 | 1741 | 8639 |
| Temperature sensor value (°C) | 1054 | 1469 | 1465 | 1662 | 1404 | 7054 |
| Humidity sensor value (%) | 1054 | 1469 | 1465 | 1662 | 1404 | 7054 |
| CO2 sensor value (ppm) | 1502 | 1755 | 1730 | 2534 | 1713 | 9234 |
| eCO2 sensor value (ppm) | 1502 | 1755 | 1730 | 2534 | 1713 | 9234 |
| TVOC sensor value (ppb) | 1502 | 1755 | 1730 | 2534 | 1713 | 9234 |
| Crowd sensor value (Count) | 1942 | 2175 | 1697 | 2974 | 1546 | 10,334 |
| Algorithm | P1 | P2 | P3 | P4 | P5 | P6 | Combinations | |
|---|---|---|---|---|---|---|---|---|
| Logistic Regression | Parameter | C | class_weight | max_ iterations | Solver | Tolerance | 40 | |
| Value | 3 | Balanced | 5000 | liblinear | 0.0001 | |||
| Naive Bayes | Parameter | Priors | Var_ smoothing | 450 | ||||
| Value | Auto | 20 | ||||||
| Random Forest | Parameter | Criterion | n_estimators | Max_depth | Min_ samples_leaf | Min_samples split | 1600 | |
| Value | Gini | 300 | 30 | 1 | 2 | |||
| Decision Trees | Parameter | Criterion | Class_weight | Max_depth | Min_samples leaf | Min_samples split | Splitter | 640 |
| Value | Gini | Balanced | 30 | 1 | 2 | Best | ||
| KNNs | Parameter | Algorithm | Lead_size | Metric | N_neighbors | P | Weights | 2592 |
| Value | Auto | 20 | Manhattan | 3 | 1 | Distance | ||
| SVM | Parameter | C | Gamma | Kernel | Degree | 56 | ||
| Value | 10000 | 10 | Rbf | 2 | ||||
| XGBoost | Parameter | Learning rate | Max_depth | N_estimator | Subsample | Gamma | Reg_alpha | 729 |
| Value | 0.08 | 7 | 130 | 0.9 | 0.15 | 0.7 | ||
| Sound Training Models | F1 Score ↑ | Precision ↑ | Recall ↑ | Training Time (s) ↓ | Test Time (s) ↓ | Memory Usage (MB) ↓ |
|---|---|---|---|---|---|---|
| KNNs | 0.961 | 0.962 | 0.961 | 109.187 | 0.149 | 2.621 |
| SVM | 0.662 | 0.662 | 0.664 | 323.364 | 4.850 | 2.168 |
| Random Forest | 0.956 | 0.957 | 0.955 | 4125.98 | 0.137 | 45.102 |
| Decision Trees | 0.957 | 0.957 | 0.957 | 2777.85 | 0.005 | 32.883 |
| XGBoost | 0.682 | 0.695 | 0.677 | 10.212 | 0.054 | 66.902 |
| Naive Bayes | 0.618 | 0.628 | 0.615 | 9.898 | 0.017 | 5.297 |
| Logistic Regression | 0.658 | 0.656 | 0.667 | 307.733 | 0.350 | 7.000 |
| Light Training Models | F1 Score ↑ | Precision ↑ | Recall ↑ | Training Time (s) ↓ | Test Time (s) ↓ | Memory Usage (MB) ↓ |
|---|---|---|---|---|---|---|
| KNNs | 0.7452 | 0.743 | 0.749 | 14,327.1 | 0.061 | 69.664 |
| SVM | 0.616 | 0.628 | 0.626 | 19,487.8 | 6.815 | 81.918 |
| Random Forest | 0.7457 | 0.744 | 0.748 | 5263.3 | 0.225 | 39.305 |
| Decision Trees | 0.743 | 0.667 | 0.751 | 30.647 | 0.006 | 14.043 |
| XGBoost | 0.664 | 0.667 | 0.671 | 2.584 | 0.038 | 15.465 |
| Naive Bayes | 0.613 | 0.626 | 0.615 | 12.955 | 0.010 | 2.891 |
| Logistic Regression | 0.622 | 0.626 | 0.635 | 24.623 | 0.162 | 1.945 |
| Temperature Training Models | F1 Score ↑ | Precision ↑ | Recall ↑ | Training Time (s) ↓ | Test Time (s) ↓ | Memory Usage (MB) ↓ |
|---|---|---|---|---|---|---|
| KNNs | 0.981 | 0.982 | 0.981 | 3696.6 | 0.067 | 31.711 |
| SVM | 0.594 | 0.595 | 0.605 | 249.240 | 4.545 | 1.820 |
| Random Forest | 0.981 | 0.981 | 0.980 | 13,725.8 | 0.113 | 46.973 |
| Decision Trees | 0.979 | 0.979 | 0.979 | 507.194 | 0.016 | 12.316 |
| XGBoost | 0.607 | 0.608 | 0.612 | 30.615 | 0.049 | 67.668 |
| Naive Bayes | 0.415 | 0.459 | 0.442 | 19.217 | 0.008 | 2.609 |
| Logistic Regression | 0.552 | 0.564 | 0.563 | 125.52 | 0.150 | 3.871 |
| Ventilation Training Models | F1 Score ↑ | Precision ↑ | Recall ↑ | Training Time (s) ↓ | Test Time (s) ↓ | Memory Usage (MB) ↓ |
|---|---|---|---|---|---|---|
| KNNs | 0.894 | 0.895 | 0.894 | 758.95 | 0.063 | 11.820 |
| SVM | 0.659 | 0.665 | 0.668 | 452.18 | 6.990 | 3.238 |
| Random Forest | 0.899 | 0.901 | 0.899 | 10,182.2 | 0.281 | 18.160 |
| Decision Trees | 0.895 | 0.897 | 0.897 | 737.32 | 0.005 | 10.730 |
| XGBoost | 0.723 | 0.727 | 0.721 | 30.625 | 0.068 | 70.602 |
| Naive Bayes | 0.424 | 0.447 | 0.449 | 36.778 | 0.005 | 5.902 |
| Logistic Regression | 0.560 | 0.569 | 0.575 | 79.824 | 0.156 | 3.160 |
| Crowd Training Models | F1 Score ↑ | Precision ↑ | Recall ↑ | Training Time (s) ↓ | Test Time (s) ↓ | Memory Usage (MB) ↓ |
|---|---|---|---|---|---|---|
| KNNs | 0.402 | 0.402 | 0.411 | 94.980 | 0.015 | 5.629 |
| SVM | 0.268 | 0.321 | 0.326 | 725.271 | 11.595 | 5.352 |
| Random Forest | 0.406 | 0.412 | 0.422 | 1143.8 | 0.187 | 9.668 |
| Decision Trees | 0.396 | 0.412 | 0.435 | 141.59 | 0.005 | 6.629 |
| XGBoost | 0.388 | 0.420 | 0.400 | 279.93 | 0.111 | 86.316 |
| Naive Bayes | 0.243 | 0.233 | 0.316 | 53.552 | 0.013 | 2.004 |
| Logistic Regression | 0.276 | 0.256 | 0.311 | 69.552 | 0.214 | 5.297 |
| General Evaluation Training Models | F1 Score ↑ | Precision ↑ | Recall ↑ | Training Time (s) ↓ | Test Time (s) ↓ | Memory Usage (MB) ↓ |
|---|---|---|---|---|---|---|
| KNNs | 0.9904 | 0.9906 | 0.9901 | 1360.9 | 0.071 | 12.332 |
| SVM | 0.945 | 0.951 | 0.941 | 3146.9 | 6.510 | 2.902 |
| Random Forest | 0.9902 | 0.9905 | 0.9906 | 7309.2 | 0.422 | 21.762 |
| Decision Trees | 0.984 | 0.984 | 0.984 | 330.470 | 0.005 | 8.785 |
| XGBoost | 0.741 | 0.750 | 0.743 | 20.602 | 0.152 | 71.059 |
| Naive Bayes | 0.429 | 0.434 | 0.450 | 36.160 | 0.004 | 5.992 |
| Logistic Regression | 0.493 | 0.491 | 0.515 | 300.32 | 0.155 | 1.215 |
Disclaimer/Publisher’s Note: The statements, opinions and data contained in all publications are solely those of the individual author(s) and contributor(s) and not of MDPI and/or the editor(s). MDPI and/or the editor(s) disclaim responsibility for any injury to people or property resulting from any ideas, methods, instructions or products referred to in the content. |
© 2025 by the authors. Licensee MDPI, Basel, Switzerland. This article is an open access article distributed under the terms and conditions of the Creative Commons Attribution (CC BY) license (https://creativecommons.org/licenses/by/4.0/).
Share and Cite
Mammadov, S.; Kucukkulahli, E. A User-Centric Smart Library System: IoT-Driven Environmental Monitoring and ML-Based Optimization with Future Fog–Cloud Architecture. Appl. Sci. 2025, 15, 3792. https://doi.org/10.3390/app15073792
Mammadov S, Kucukkulahli E. A User-Centric Smart Library System: IoT-Driven Environmental Monitoring and ML-Based Optimization with Future Fog–Cloud Architecture. Applied Sciences. 2025; 15(7):3792. https://doi.org/10.3390/app15073792
Chicago/Turabian StyleMammadov, Sarkan, and Enver Kucukkulahli. 2025. "A User-Centric Smart Library System: IoT-Driven Environmental Monitoring and ML-Based Optimization with Future Fog–Cloud Architecture" Applied Sciences 15, no. 7: 3792. https://doi.org/10.3390/app15073792
APA StyleMammadov, S., & Kucukkulahli, E. (2025). A User-Centric Smart Library System: IoT-Driven Environmental Monitoring and ML-Based Optimization with Future Fog–Cloud Architecture. Applied Sciences, 15(7), 3792. https://doi.org/10.3390/app15073792