Article

A User-Centric Smart Library System: IoT-Driven Environmental Monitoring and ML-Based Optimization with Future Fog–Cloud Architecture

by
Sarkan Mammadov
and
Enver Kucukkulahli
*
Department of Computer Engineering, Faculty of Engineering, Düzce University, Düzce 81620, Türkiye
*
Author to whom correspondence should be addressed.
Appl. Sci. 2025, 15(7), 3792; https://doi.org/10.3390/app15073792
Submission received: 1 March 2025 / Revised: 24 March 2025 / Accepted: 25 March 2025 / Published: 30 March 2025
(This article belongs to the Special Issue Application of Artificial Intelligence in the Internet of Things)

Abstract

:
University libraries are essential academic spaces, yet existing smart systems often overlook user perception in environmental optimization. A key challenge is the lack of adaptive frameworks balancing objective sensor data with subjective user experience. This study introduces an Internet of Things (IoT)-powered framework integrating real-time sensor data, image-based occupancy tracking, and user feedback to enhance study conditions via machine learning (ML). Unlike prior works, our system fuses objective measurements and subjective input for personalized assessment. Environmental factors—including air quality, sound, temperature, humidity, and lighting—were monitored using microcontrollers and image processing. User feedback was collected via surveys and incorporated into models trained using Logistic Regression, Decision Trees, Random Forest, Support Vector Machine (SVM), K-Nearest Neighbors (KNNs), Extreme Gradient Boosting (XGBoost), and Naive Bayes. KNNs achieved the highest F1 score (99.04%), validating the hybrid approach. A user interface analyzes environmental factors, identifying primary contributors to suboptimal conditions. A scalable fog–cloud architecture distributes computation between edge devices (fog) and cloud servers, optimizing resource management. Beyond libraries, the framework extends to other smart workspaces. By integrating the IoT, ML, and user-driven optimization, this study presents an adaptive decision support system, transforming libraries into intelligent, user-responsive environments.

1. Introduction

The effective management of environmental factors such as temperature, light, humidity, air quality, and occupancy is essential for an efficient working environment. Research has shown that optimizing these factors has positive effects on concentration, productivity, and overall performance [1]. In contrast, external environmental factors—such as air pollution and extreme temperatures—have negative impacts on human health and work performance [2]. Additionally, the extremities of indoor temperatures are highlighted as having adverse consequences on productivity and general health [3].
Elevated CO₂ levels in indoor air can lead to a decline in cognitive functions, difficulty concentrating, and overall fatigue. Inadequate ventilation can exacerbate these effects, while regular ventilation is critical for maintaining indoor air quality [4]. Additionally, exposure to noise has been found to disrupt teaching and learning processes, with noise levels influencing the perceived learning performance of students [5].
The quality of the learning environment also plays a crucial role in academic performance. Natural light, in particular, has been shown to improve health, satisfaction, attention, and performance for students and staff [6]. Moreover, lighting such as blue-toned white light has been found to enhance cognitive function and reduce eye fatigue, benefiting environments where long periods of reading and research occur, such as libraries [7].
Today, university libraries have evolved into dynamic, technologically advanced spaces that support academic and social development. In this context, fog computing plays a vital role. Fog computing is a distributed computing paradigm that processes data at the network’s edge, reducing latency and improving efficiency. The low latency and mobility support offered by fog computing in real-time applications, such as IoT devices and smart cities, also provide significant benefits in managing environmental factors in library settings [8].
By enabling real-time data processing from sensors, fog computing allows for the effective monitoring of environmental factors such as temperature, humidity, and air quality in library spaces, enhancing user productivity [9]. Furthermore, combining fog and cloud computing offers an ideal solution for managing large-scale data processing and storage needs in libraries, improving efficiency and reducing costs [10].
University libraries, as fundamental pillars of higher education, serve as central spaces for access to information, learning, and research processes for students, academics, and researchers [11]. These libraries are public spaces that play a crucial role in providing access to information, supporting learning, and facilitating research activities for both students and academic staff [12]. Today, these spaces are defined not only as providers of information but also as dynamic structures that support academic and social development, responding to changing needs [13]. Therefore, the design and management processes should be organized in a way that aligns with the institution’s educational goals and addresses the evolving needs of users. In recent years, rapid advancements in educational technologies and changes in learning habits have led to significant transformations in libraries [14].
Although the focus of this research is specifically on university libraries, this choice is not arbitrary. Libraries present a unique context for environmental optimization due to their distinct characteristics, such as their diverse user base, fluctuating occupancy rates, and the need for a conducive atmosphere for study and research. Unlike other settings like offices, restaurants, or industrial environments, libraries face specific challenges in creating an optimal environment that supports both individual and group activities, making them an ideal case study for this research. Additionally, the integration of the IoT and AI technologies in a library setting offers valuable insights that could be transferable to other environments in the future. This targeted approach allows for a more nuanced exploration of how environmental factors impact user experience in academic settings, which could serve as a model for broader applications.
The central challenge of this study lies in accurately modeling the complex relationships between environmental factors in university libraries and user productivity and satisfaction, with limited data and potential noise from sensor readings. Traditional machine learning algorithms often struggle with small datasets and class imbalance, which can lead to overfitting and reduced generalization. To address this, we implemented a comprehensive approach by carefully selecting robust algorithms like KNNs and Random Forest and applying the Synthetic Minority Over-sampling Technique (SMOTE) to balance the dataset. This ensured the model could generalize effectively while mitigating the risk of overfitting. Our approach also emphasizes the interpretability and efficiency of the selected models, making them well suited for real-world applications in smart campus environments. Through these strategies, we were able to achieve high accuracy and provide actionable insights into the influence of environmental factors on user behavior, overcoming the challenges posed by the limitations of the dataset and algorithmic complexity.

Contributions

This study presents several key contributions to the optimization of university library workspaces through an IoT-based system:
  • Development of an IoT-based system: the system monitors and analyzes environmental factors such as sound, light, temperature, humidity, air quality, and occupancy, collecting real-time data and storing them in the cloud.
  • User feedback integration: the system integrates user feedback to assess work experiences and productivity, offering actionable recommendations for efficiency improvements [15].
  • Use of machine learning: machine learning algorithms process the collected data to identify ideal conditions for optimizing library workspaces [16].
  • Environmental optimization: the system addresses environmental factors holistically, aiming to enhance learning and productivity in libraries, which are crucial spaces for students and academic staff.
  • Impact of environmental factors on cognitive functions: research highlights the influence of temperature, lighting, and air quality on cognitive function, attention, and overall work effectiveness [16].
  • Focus on air quality: the system analyzes key air quality parameters (CO, CO2, TVOCs) and optimizes ventilation, pollutant control, and humidity regulation [17].
  • Comprehensive framework: this study presents a comprehensive IoT-driven library management framework that combines objective sensor data with user feedback, creating more adaptive and efficient learning environments.
  • Impact on satisfaction and productivity: good air quality enhances satisfaction and productivity in study environments, and effective ventilation plays a crucial role in maintaining a healthy indoor atmosphere [18,19].
  • Advances in technology: The use of IoT sensors enables the real-time monitoring of environmental factors in libraries. The data from these sensors are analyzed with machine learning to optimize conditions, improving library management and user experience [20].

2. Related Works

Recent research has focused on environmental factors that impact work efficiency, particularly in educational settings like university libraries. Studies show that environmental conditions significantly affect academic performance and productivity, with factors such as lighting, temperature, humidity, noise, and air quality influencing concentration and work output. However, most research addresses individual factors, with limited studies evaluating multiple factors simultaneously. Additionally, there is a gap in the literature regarding the use of IoT-based systems for monitoring environmental data.

2.1. The Impact of Environmental Factors on Academic Performance

Various studies have explored the impact of environmental factors on academic performance, with noise being a significant distraction that negatively affects concentration and information processing. High noise levels have been shown to hinder effective academic performance [21]. Similarly, the indoor environmental quality (IEQ) is critical for health and productivity. A study evaluating the IEQ of a university library examined parameters such as the indoor air quality (IAQ), lighting, and acoustics, assessing their effects based on the LEED v4, ASHRAE 62.1, and WELL standards. The findings underscored the crucial role of these factors in shaping user experience [19].
Additional research on a campus library’s IEQ identified issues including high temperatures (above 21.2 °C), humidity levels ranging from 51.3% to 55.8%, poor air circulation, elevated CO2 levels (up to 588 ppm), noise levels of between 43 and 61 dB, and inadequate light intensity (below 300 lux). Recommendations included maintaining a temperature range of 24.5–26.5 °C, improving insulation, and optimizing window-to-wall ratios [22]. Another study assessed academic library environments in Nigeria during peak usage periods, analyzing the acoustic, visual, and thermal comfort using portable devices based on the ASHRAE 55 and ISO 7730 standards. The results were compared to CIBSE Guide A, providing insights for improving the IEQ [23].
Research has also explored the influence of the IAQ on student concentration. One study revealed that poor air quality (average 2115 ppm CO2) did not directly reduce concentration but significantly increased error rates in cognitive tasks [24]. Similarly, a study on the IEQ in educational buildings found that administrative staff in Ghana reported higher satisfaction with their office environments, enhancing productivity, whereas academic staff experienced a negative impact [25].

2.2. Spatial Innovations and Environmental Optimization in Libraries

Research on spatial innovations in university libraries has examined various aspects influencing user satisfaction. A study focusing on three university libraries in Wuhan, China, evaluated six key dimensions, including service accessibility, interior design, and environmental factors, using multiple linear regression analysis. The findings provided valuable recommendations for library design improvements [26].
Additionally, studies have investigated how outdoor air pollution and noise influence indoor environmental quality. One study proposed using sensors and AI-based real-time data detection to enhance air quality and minimize noise, promoting natural ventilation behaviors [27]. Another study identified the IEQ criteria affecting user performance and well-being in higher education libraries. Data from 421 students revealed varying priorities among different user groups, highlighting the need for targeted improvements [28].
A qualitative study with 11 faculty members and 24 students further emphasized the adverse effects of poor thermal, lighting, acoustic, and IAQ conditions on teaching and learning. Faculty struggled to maintain optimal environments, while students reported discomfort and reduced learning quality due to noise disturbances [29]. Another study tested the effects of temperature, noise, and lighting on learning efficiency, identifying the optimal environmental conditions for different cognitive tasks [30].

2.3. The Role of IoT and AI in Library Environmental Monitoring

IoT-based solutions have been increasingly explored to optimize environmental conditions in libraries. A study in metropolitan cities highlighted how IoT-enabled sensors could improve the IAQ and noise management [31]. Another investigation assessed the IEQ of a campus library, identifying thermal discomfort, high CO2 levels, and inadequate lighting, with recommendations for architectural modifications [22].
Furthermore, research on IoT adoption in libraries surveyed 389 staff members in Nanjing, China, emphasizing the importance of effective management and staff motivation for successful implementation [32]. Another study explored the integration of the IoT and machine learning for personal thermal comfort modeling, demonstrating high predictive accuracy using the Extra Trees classifier [33].
AI-driven environmental monitoring systems have also been proposed. A study introduced an IAQ evaluation system utilizing microcontrollers and sensors to collect real-time air parameters. Using artificial intelligence, the system compared indoor and outdoor data, aiding decision-making for library management [34]. Similarly, a Romanian study combined biometric data from wearable devices with environmental monitoring to create an ecological system aimed at enhancing air quality [35].
Recent advancements in Smart Environmental Monitoring (SEM) systems, powered by the IoT and modern sensors, have improved early pollution detection. These systems monitor environmental factors such as CO2, PM, NOx, VOCs, and water quality, with machine learning enhancing data analysis [36]. The IoT is also transforming libraries by improving infrastructure, collection management, and security [37]. The IoT is transforming libraries by enhancing areas like building management, collection management, education, and data security. It is important for librarians to understand the IoT and for users to be educated on security issues. The IoT has the potential to modernize library infrastructure, improving user satisfaction [38]. The rapid development of artificial intelligence (AI) and the IoT has led to the integration of smart devices, revolutionizing public services and library science, ushering in the era of “smart libraries” [39].

2.4. Fog–Cloud Computing for Enhanced Library Systems

Efficient IoT integration in libraries requires robust computing infrastructure for real-time data processing. Fog computing enhances performance by providing localized processing and storage at the network edge. This model acts as an intermediary between cloud and edge layers, optimizing network efficiency and reducing cloud dependency [40].
Fog computing plays a crucial role in IoT applications such as smart cities, industrial automation, and library management by processing data closer to the source. It reduces latency and enhances real-time decision-making, ultimately improving the efficiency of smart library systems [41]. Given the increasing number of IoT devices, cloud-based data transmission can create network bottlenecks. Fog computing addresses this challenge by utilizing intelligent gateways at the network edge, optimizing resource allocation and improving overall system performance [42].
Recent research highlights various applications of fog–cloud computing in enhancing system performance across multiple domains. For instance, air quality monitoring and forecasting systems benefit from fog computing by integrating the IoT, LPWANs, and deep learning models for real-time environmental analysis. The fog-enabled Air Quality Monitoring and Prediction (FAQMP) system utilizes Smart Fog Environmental Gateways (SFEGs) for localized deep learning processing, ensuring real-time predictions while optimizing resource usage [43].
Similarly, low-cost and automated monitoring systems employing edge AI computing have demonstrated effectiveness in the real-time observation of environmental dynamics. Such systems can be leveraged for library environments to monitor air quality, user occupancy, and energy consumption patterns, contributing to sustainable smart library ecosystems [44].
Furthermore, the convergence of cloud computing, fog computing, machine learning, and the IoT has opened new possibilities for intelligent data processing. Fog computing alleviates network burdens by enabling resource-intensive computations closer to the data source. Machine learning techniques, including object and text detection models, can be deployed within fog nodes to improve information retrieval and automation in library management systems [45].
Another emerging challenge is ensuring seamless data migration and synchronization between cloud and fog environments. Existing frameworks, such as FETCH, integrate deep learning and automated monitoring to enhance system compatibility, particularly in health monitoring applications. Applying similar frameworks in library systems could facilitate efficient data handling, reducing latency and improving service reliability through optimized fog–cloud interactions [46].
By incorporating these technological advancements, this study proposes a novel framework for integrating the IoT and AI in university libraries, aiming to enhance environmental conditions and optimize user experiences.

2.5. Literature Comparison

To further elucidate the unique contributions of this study, a comparison with similar research in the field is presented. Table 1 summarizes the key findings from previous studies, outlining the environmental factors, data collection methods, machine learning techniques, and innovative approaches. This structured comparison emphasizes the distinguishing elements of this research, highlighting how it extends and refines existing knowledge in the domain of smart library systems and environmental optimization.

2.6. Contributions to the Literature

This study makes the following contributions to the literature:
  • This study goes beyond traditional approaches that rely solely on environmental sensors by introducing an integrated system that combines IoT sensor data, real-time image-based occupancy tracking, and direct user feedback. By developing a multi-dimensional optimization model, it transforms passive study environments into adaptive, user-responsive intelligent spaces, making a significant contribution to the literature on smart libraries.
  • This research introduces a first-of-its-kind hybrid environmental assessment model, addressing the gap between previous studies that predominantly focus on either objective (sensor-based) or subjective (survey-based) evaluations. By combining both approaches, this study leads to a more accurate and personalized environmental optimization method. The hybrid framework enables a dynamic learning process, where continuous user feedback refines the optimization model, enhancing its robustness and context-awareness.
  • This research uniquely integrates real-time and long-term environmental data analysis, enabling trend identification and sustainable management strategies beyond snapshot-based studies. By examining gradual changes in air quality, noise, temperature, humidity, and lighting, it reveals their impact on user productivity over time, making the approach highly relevant for dynamic workspaces. While initially focused on university libraries, the model is scalable to various smart work environments, demonstrating how the IoT and AI enhance adaptability. Additionally, the interactive interface not only monitors conditions but also provides actionable insights, allowing facility managers to implement proactive, data-driven improvements for an optimized learning and working environment.
  • This research introduces a unique open-source dataset that combines IoT-based sensor readings with user feedback, offering a valuable resource for future studies on smart environments, human–computer interaction, and AI-driven space optimization. By filling a major gap in the literature, this dataset enables further exploration of the relationship between environmental conditions and cognitive performance.

3. Proposed System Model

In this study, specific hardware and software were utilized to collect environmental data. The collected data were processed and analyzed using predefined methods for training machine learning algorithms, with Python 3.11 employed for data processing and analysis. The materials used were systematically evaluated at each stage to ensure the reliability of the results. The steps taken to ensure the reliability and consistency of the data were carefully planned and integrated into the methodology, aligning with the objectives of this research.
Figure 1 presents an integrated system architecture developed for environmental quality prediction in a library environment. This system collects real-time environmental parameters through IoT sensors and user feedback, analyzes the interaction between the environment and the occupancy levels, and evaluates the gathered data. The collected data undergo preprocessing and are subsequently analyzed using machine learning algorithms, generating real-time environmental quality predictions. This multi-layered approach aims to optimize environmental monitoring and management processes in the library by providing a more effective, data-driven, and user-oriented model. The methodology seeks to offer high accuracy and efficiency in environmental quality assessment, ultimately fostering a healthier and more productive academic environment.

3.1. Real-Time Data Collection and Integration

This phase involves the real-time collection of data from environmental sensors and user feedback, followed by the integration of these data into a centralized platform. The sensors continuously monitor environmental parameters, providing a continuous data stream, while user feedback is collected and integrated with sensor data, making it suitable for subsequent analytical processes within the system.
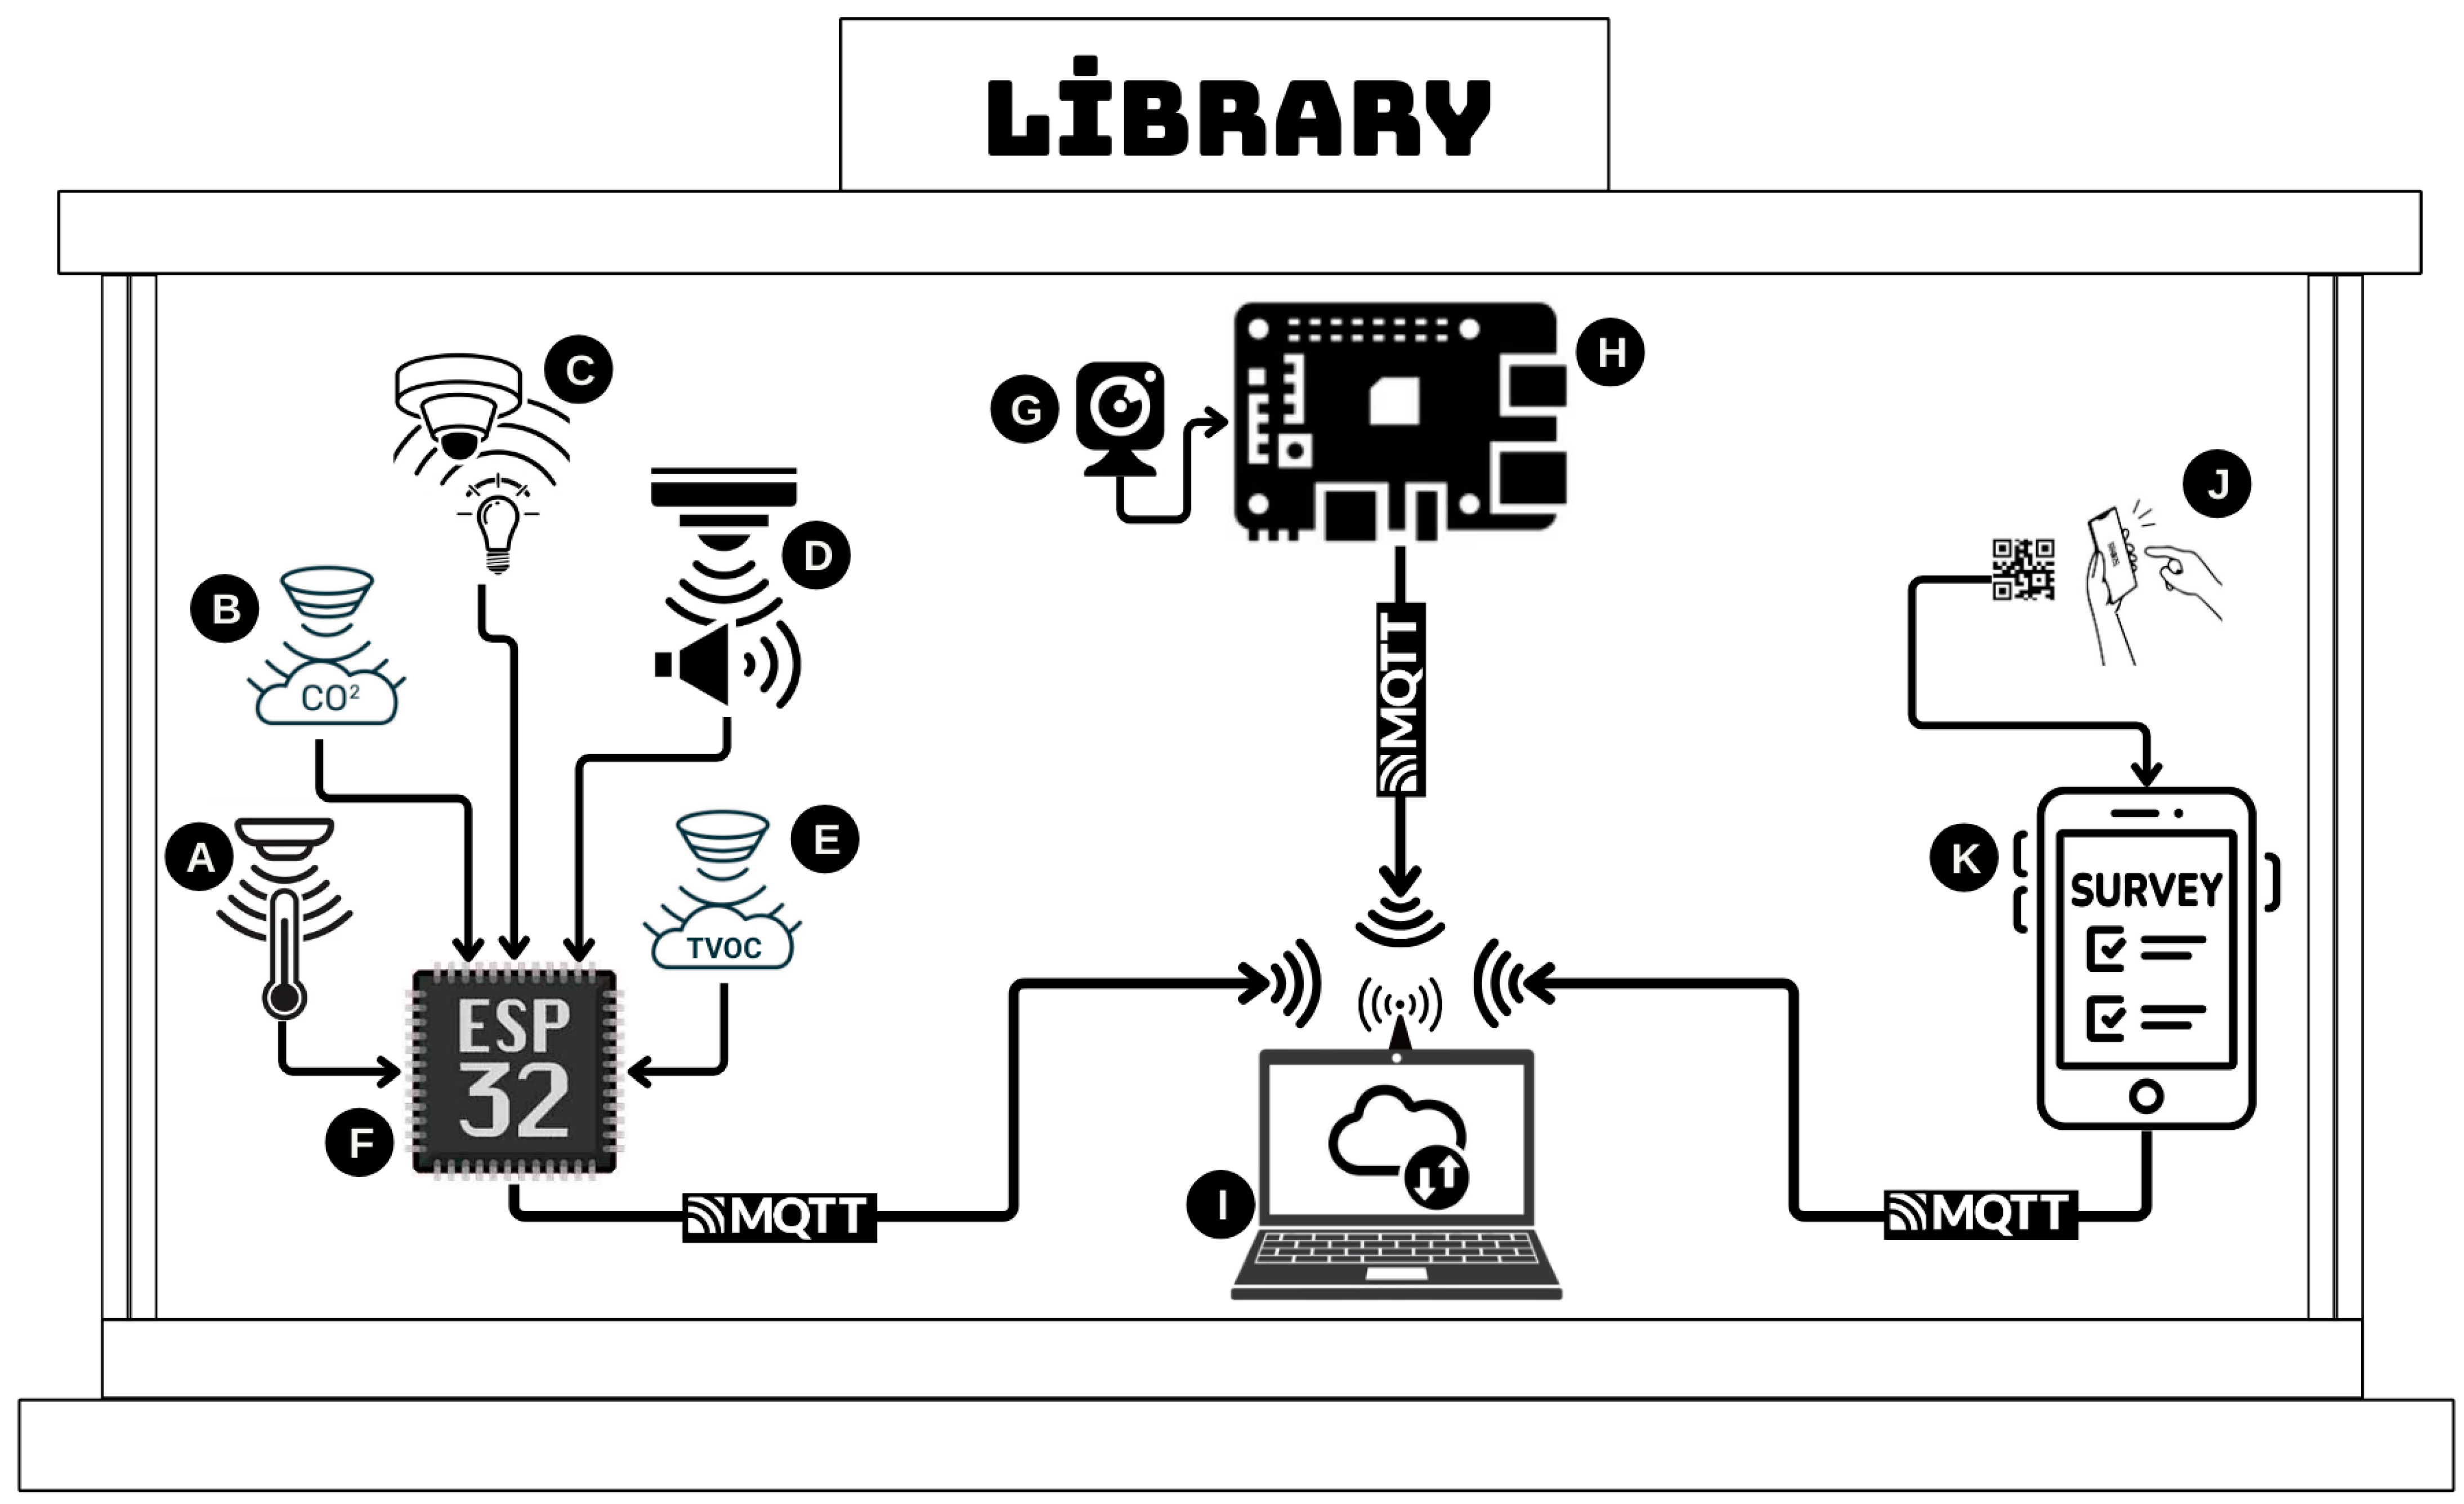
As shown in Figure 2, this study is designed to monitor and analyze the user experience in a library by integrating environmental sensors and visual perception technologies. The ESP WROOM 32 microcontroller (F), sourced from Espressif Systems, located in Shanghai, China, collects environmental data through the following sensors: the MQ135 sensor (B), sourced from Hanwei Electronics, located in Zhengzhou, China, which measures air quality (CO2, CO, ammonia, and other gases); the LDR sensor (C), sourced from Adafruit Industries, located in New York, NY, USA, which detects light intensity; the HTU21D sensor (A), sourced from TE Connectivity, located in Schaffhausen, Switzerland, which records the temperature and humidity levels; the DFR0034 sensor (D), sourced from DFRobot, located in Beijing, China, which detects sound levels; and the SGP30 sensor (E), sourced from Sensirion, located in Stäfa, Switzerland, which measures TVOC and eCO₂ levels. The collected environmental data are transmitted to a central computer via Wi-Fi using the MQTT protocol. By utilizing a Raspberry Pi 4B (H) sourced from Raspberry Pi Foundation, located in Cambridge, UK, and Raspberry Pi Camera (G), ourced from Raspberry Pi Foundation, located in Cambridge, UK, the number of people in the library is monitored in real time, and crowd density analysis is performed. Camera data are processed with the OpenCV library (version 4.5.3) and synchronized with the environmental data. This enables a more comprehensive examination of the effects of environmental factors on the user experience. The data are transmitted via Wi-Fi and saved as timestamped CSV files on the central computer (I), while Python 3.11 is employed for data recording and analysis. The entire system is powered by a portable power bank, making it mobile and adaptable for use in different environments. Additionally, user feedback is gathered via a QR code (J) linked to a Google Forms survey (K), which is stored on Google Sheets and synchronized with the environmental data based on timestamps. This method facilitates a more detailed analysis of the impact of environmental factors on the user experience. The data collection process was carried out in the main reading hall of Düzce University Library, selected due to its users’ sensitivity to environmental factors and the high traffic in the library.
During the dataset creation phase, environmental data, visual perception data, and user feedback were integrated by aligning them at specific time intervals. The data obtained from the sensors were transmitted via Wi-Fi and stored as timestamped CSV files on the central computer. These data were then synchronized with the user feedback collected from the surveys and aligned based on timestamps to allow for an analysis of the impact of each environmental factor on the user experience. User feedback, gathered via the QR code, was stored concurrently with the environmental sensor data, resulting in a comprehensive dataset. The user feedback was categorized into sections such as library usage habits, environmental conditions (noise, light, temperature, ventilation, crowd), and health and comfort status. This categorization enabled a more detailed investigation of the effects of environmental factors on the library experience. This process ensured that both sensor data and user feedback were integrated into a single dataset, providing a robust and meaningful basis for further analysis.

3.2. Dataset Overview and Data Preprocessing

The dataset consists of a range of components related to environmental factor measurements, user feedback, crowd density data in the library, and the timestamp for each record. The sensor data encompass environmental parameters such as light, CO2, temperature, humidity, sound, TVOCs, and eCO2, while user feedback provides insights into the perception of environmental conditions and overall user experience. The crowd density data were collected using Raspberry Pi to detect the number of individuals in the library, and the timestamp enables the accurate temporal association of each data point.
Categorical data were transformed into numerical values using the Label Encoding method, which is commonly employed in machine learning applications to facilitate data modeling [47]. For instance, qualitative user feedback ratings—such as “very sufficient”, “sufficient”, “indifferent”, “insufficient”, and “not sufficient at all”—were mapped to numerical values of 5, 4, 3, 2, and 1, respectively. This conversion enabled the integration of categorical data into the analysis, thereby improving the overall effectiveness of the modeling process. Following this transformation, sensor data were correlated with the numerically encoded user feedback categories to facilitate comprehensive analysis.
During the data preprocessing phase, the dependent variable, representing the environmental quality level (e.g., environmental condition classification based on user feedback), was identified, while independent variables, including the sensor data and crowd density, were selected as key predictive factors [48]. A thorough examination of class distribution revealed an imbalance, necessitating the application of the Synthetic Minority Over-sampling Technique (SMOTE) to generate additional samples for underrepresented classes. This approach has been demonstrated to improve model performance by ensuring that minority class instances are adequately learned while also mitigating overfitting risks [49].
To further explore the characteristics of the dataset, various visualization techniques were utilized. Histograms were employed to examine the distribution of variables, allowing for the identification of patterns and potential anomalies within the data [50]. Additionally, correlation analysis was conducted to assess the relationships between different environmental parameters and user feedback, providing deeper insights into the dependencies among variables [51].
Following the numerical encoding process, sensor data and user feedback were synchronized based on their respective timestamps. This alignment ensured that each data point was accurately associated with its corresponding environmental conditions and user perception, thereby creating a structured and temporally coherent dataset.
To enable a more comprehensive environmental assessment, CO2, TVOC, and eCO2 measurements were integrated to represent overall ventilation conditions. Similarly, the temperature and humidity parameters were grouped to facilitate a more holistic analysis of indoor environmental quality. Finally, feature selection techniques were applied to refine the dataset, enhancing model accuracy by prioritizing the most relevant attributes for predictive analysis.
Table 2 presents the distribution of sensor data based on the classes, providing a detailed insight into how the sensor data are distributed across each class. It allows for a systematic examination of the data collection density of specific sensor readings within each class.

3.3. Selection and Application Methods of Machine Learning Algorithms

Machine learning (ML) is a subfield of artificial intelligence focused on learning from data and making predictions based on the learned information. ML offers a variety of techniques for different data types and problem areas, one of which is supervised learning [52]. Supervised learning is a type of machine learning that aims to make predictions using algorithms trained on labeled data. Essentially, this method operates in two main categories: classification and regression. Classification refers to the process of assigning examples in a dataset to specific classes. Within the supervised learning framework, classification is studied in three primary types: binary classification, multi-class classification, and multi-label classification. Binary classification involves dividing data into two categories, such as “spam” and “not spam”, while multi-class classification differentiates between multiple classes, for example, identifying types of network attacks. Multi-label classification allows each example to be assigned multiple labels, such as a news article belonging to categories like “technology”, “city news”, and “breaking news”. Common algorithms used for classification tasks include Logistic Regression (LR), Support Vector Machines (SVMs), Random Forests (RFs), K-Nearest Neighbors (KNNs), Decision Trees (DTs), XGBoost, and Naive Bayes (NB). These algorithms are successfully applied in various domains, including natural language processing (NLP), image recognition, and fraud detection [53].

3.3.1. Logistic Regression (LR) Algorithm

Logistic Regression is used for binary classification to predict the probability of class membership, using the sigmoid function to convert data into probabilities between 0 and 1. Parameters are optimized through maximum likelihood estimation or gradient descent, allowing for the interpretation of independent variables’ effects on the target variable [54]. It is efficient for small to medium datasets and works well with linearly separable data, though overfitting can occur with nonlinear relationships or many variables. Regularization and hyperparameter tuning are key for improved performance [55].

3.3.2. Naive Bayes Algorithm

Naive Bayes is a fast, efficient classification method based on Bayes’ Theorem, assuming feature independence. It calculates the conditional probability of each feature belonging to a specific class and combines these probabilities to make decisions. There are three types: Gaussian Naive Bayes for continuous data (normal distribution), Multinomial Naive Bayes for discrete data (e.g., text or word frequencies), and Bernoulli Naive Bayes for binary data. It is widely used in text classification, spam detection, sentiment analysis, medical diagnosis, and cybersecurity. However, feature dependencies and unobserved feature values can reduce its effectiveness, with techniques like Laplace smoothing addressing these issues [56].

3.3.3. K-Nearest Neighbors (KNNs) Algorithm

K-Nearest Neighbors (KNNs) is a versatile algorithm used for classification and regression tasks [57]. It classifies new data points by measuring distances to the K-Nearest Neighbors in the feature space and assigning the majority class for classification or the average for regression [58]. The algorithm is based on the principle of “like attracts like”, where a point’s class is determined by its closest neighbors [48].
KNNs’ performance relies on the choice of distance metric, such as Euclidean, Manhattan, or Minkowski distances. Euclidean distance is the most common for continuous variables, while Manhattan is used for grid-like data, and Minkowski can generalize to both [59]. The choice of metric can significantly impact classification accuracy depending on the dataset structure [60]. KNNs’ effectiveness is influenced by the value of K and the dataset size, with optimal choices leading to high accuracy and flexibility [61].

3.3.4. Decision Tree Algorithm

The Decision Tree algorithm is a supervised learning method that classifies or regresses data by creating a tree-like structure of nodes, branches, and leaves [62]. At each node, a feature is tested, directing data points down the appropriate branch until reaching a leaf node that represents a class [63]. The algorithm uses criteria like the Gini Index and Entropy to optimize splits. The Gini Index measures class purity, with values closer to 0 indicating purer subsets, while Entropy measures disorder, also aiming for low values [64]. Although Decision Trees are interpretable, they are prone to overfitting, requiring constraints to prevent excessively deep trees [65]. They can handle both numerical and categorical data, but overly complex trees may reduce model transparency [66].

3.3.5. Random Forest Algorithm

Random Forest is a machine learning algorithm used for classification and regression [67]. It combines multiple Decision Trees, aggregating their predictions to improve accuracy and reduce overfitting. The algorithm uses bootstrap sampling and random feature selection to diversify trees and balance predictions [68]. Random Forest performs well with high-dimensional datasets, even with missing values, and is resilient to class imbalance and outliers. However, its complexity requires substantial computational resources [69].

3.3.6. Support Vector Machine (SVM) Algorithm

Support Vector Machine (SVM) is a powerful machine learning algorithm used for classifying both linear and nonlinear data [70]. It works by identifying the optimal decision boundary (hyperplane) that maximizes the margin between classes using support vectors, which are the data points closest to the boundary [71]. SVM is widely applied in various fields, such as image processing, text classification, and biological applications, and is also integral to technologies like self-driving cars and chatbots. For linear classification, SVM uses a “Hard Margin” for perfectly separable data and a “Soft Margin” for data with some errors [72]. Nonlinear data are handled using kernel functions, such as linear, polynomial, RBF, and sigmoid [73].

3.3.7. XGBoost (Gradient Boosting) Algorithm

XGBoost, developed by Tianqi Chen, is a high-performance machine learning algorithm using gradient-boosted Decision Trees (GBDTs) optimized for speed and memory usage with large datasets [74]. It employs gradient boosting, regularized boosting, and stochastic boosting, using regularization to prevent overfitting. New trees are built on residuals from initial predictions, minimizing loss [75]. The learning rate controls the model speed. Parallel processing, missing data handling, and optimization techniques enhance XGBoost’s accuracy, efficiency, speed, and flexibility [76].

3.4. Performance Measurement of Machine Learning Classification Algorithms

This study uses various performance metrics to evaluate the classification performance of machine learning models, focusing on accuracy, precision, and generalization ability. The definitions of these metrics are provided below.

3.4.1. Confusion Matrix

The confusion matrix evaluates classification model performance by comparing predicted values with actual ones, allowing the calculation of metrics such as the accuracy, precision, recall, and F1 score. It identifies four outcomes: True Positive (TP), where the model correctly predicts the positive class; False Positive (FP), where a negative instance is incorrectly predicted as positive; True Negative (TN), where the model correctly predicts the negative class; and False Negative (FN), where a positive instance is wrongly predicted as negative. These metrics are especially useful in imbalanced datasets for assessing model strengths and weaknesses [77].

3.4.2. Accuracy

The accuracy is the ratio of the total number of correct predictions made by the model to the total number of observations. This metric indicates the overall success of the model. The calculation is conducted using the formula given in Example 1 below:
A c c u r a c y = T P + T N T P + T N + F P + F N

3.4.3. Precision

Precision is the ratio of the number of truly positive observations among the ones that the model predicted as positive. This metric shows the model’s confidence in positive classes. The calculation is conducted using the formula given in Example 2 below:
P r e c i s i o n = T P T P + F P

3.4.4. Recall

Recall is the ratio of correctly predicted positive observations to the total number of truly positive observations. This metric shows the model’s ability to correctly capture positive classes. The calculation is conducted using the formula given in Example 3 below:
R e c a l l = T P T P + F N

3.4.5. F1 Score

The F1 score is the harmonic mean of precision and recall. It aims to maintain a good balance between both precision and recall. The calculation is conducted using the formula given in Example 4 below:
F 1 = P r e c i s i o n × R e c a l l P r e c i s i o n + R e c a l l
These metrics help evaluate the model’s performance in different aspects and assist in selecting the best classifier [48].

3.4.6. ROC Curve

The ROC curve is used to assess the performance of classification models, particularly in imbalanced datasets [78]. It plots the True Positive Rate (TPR) against the False Positive Rate (FPR) across various thresholds. The TPR represents the proportion of correctly identified positive cases, while the FPR shows the proportion of negative cases incorrectly identified as positive. The curve helps visualize the model’s ability to distinguish between classes and adjust its decision boundary effectively [79].

3.5. Methods Used in the Machine Learning Phase

The hyperparameters of all algorithms used in model training and their assigned values are summarized in Table 3. For each model, the dataset was split into 80% training and 20% test data, and all hyperparameter optimizations were performed using the GridSearch method. GridSearchCV aims to find the best result by systematically testing all combinations of hyperparameters, but it requires significant computational power. This method ensures that the model is optimized with the best parameters by evaluating all possibilities to achieve more accurate results [80].
While other optimization techniques such as RandomizedSearchCV, metaheuristics, and bio-inspired algorithms (e.g., genetic algorithms) could also be applied, GridSearchCV was selected for this study because of its systematic approach. Given the relatively limited and well-defined range of hyperparameters in this study, a more comprehensive search approach like GridSearchCV was deemed appropriate to thoroughly explore all potential parameter combinations. Additionally, the methods mentioned, such as RandomizedSearchCV, would provide faster results but might not guarantee the thorough evaluation of every possible combination, which is crucial for ensuring the most accurate model performance.
The cross-validation value used in model evaluation was set to 10. Cross-validation allows the model to be tested on different subsets of the data, providing a more reliable evaluation, and is generally used to improve the model’s generalizability [81]. This systematic approach ensured that each algorithm worked with optimal settings and allowed for a fair comparison of model performances [82].
In the evaluation of the results, various metrics such as the F1 score, precision, recall, confusion matrix, ROC-AUC curve, and precision–recall curve were used to measure model performance. Additionally, resource consumption metrics such as training and testing times and memory usage were also considered. These comprehensive analyses aim to reveal the overall efficiency and accuracy of each model in detail, and the performance findings will be presented in detail in the following sections.

3.6. Application Interface Design

The application uses pre-trained machine learning models to analyze incoming sensor data. Each environmental factor (sound, light, temperature, humidity, eCO2, CO2, TVOCs, and crowd) has a dedicated model. Additionally, a “general assessment” model integrates data from all sensors to provide an overall evaluation.
The application uses pre-trained machine learning models (.pkl files) for each environmental sensor and a general assessment. Different algorithms were tested during training, and the best-performing model (based on accuracy, precision, recall, and F1 score) was selected for each sensor and the general assessment.
This systematic approach aims to provide the highest prediction accuracy and reliability for each sensor and the general assessment, offering users reliable data to make more informed and effective decisions. The user interface of the application, as presented for user service, is shown below.
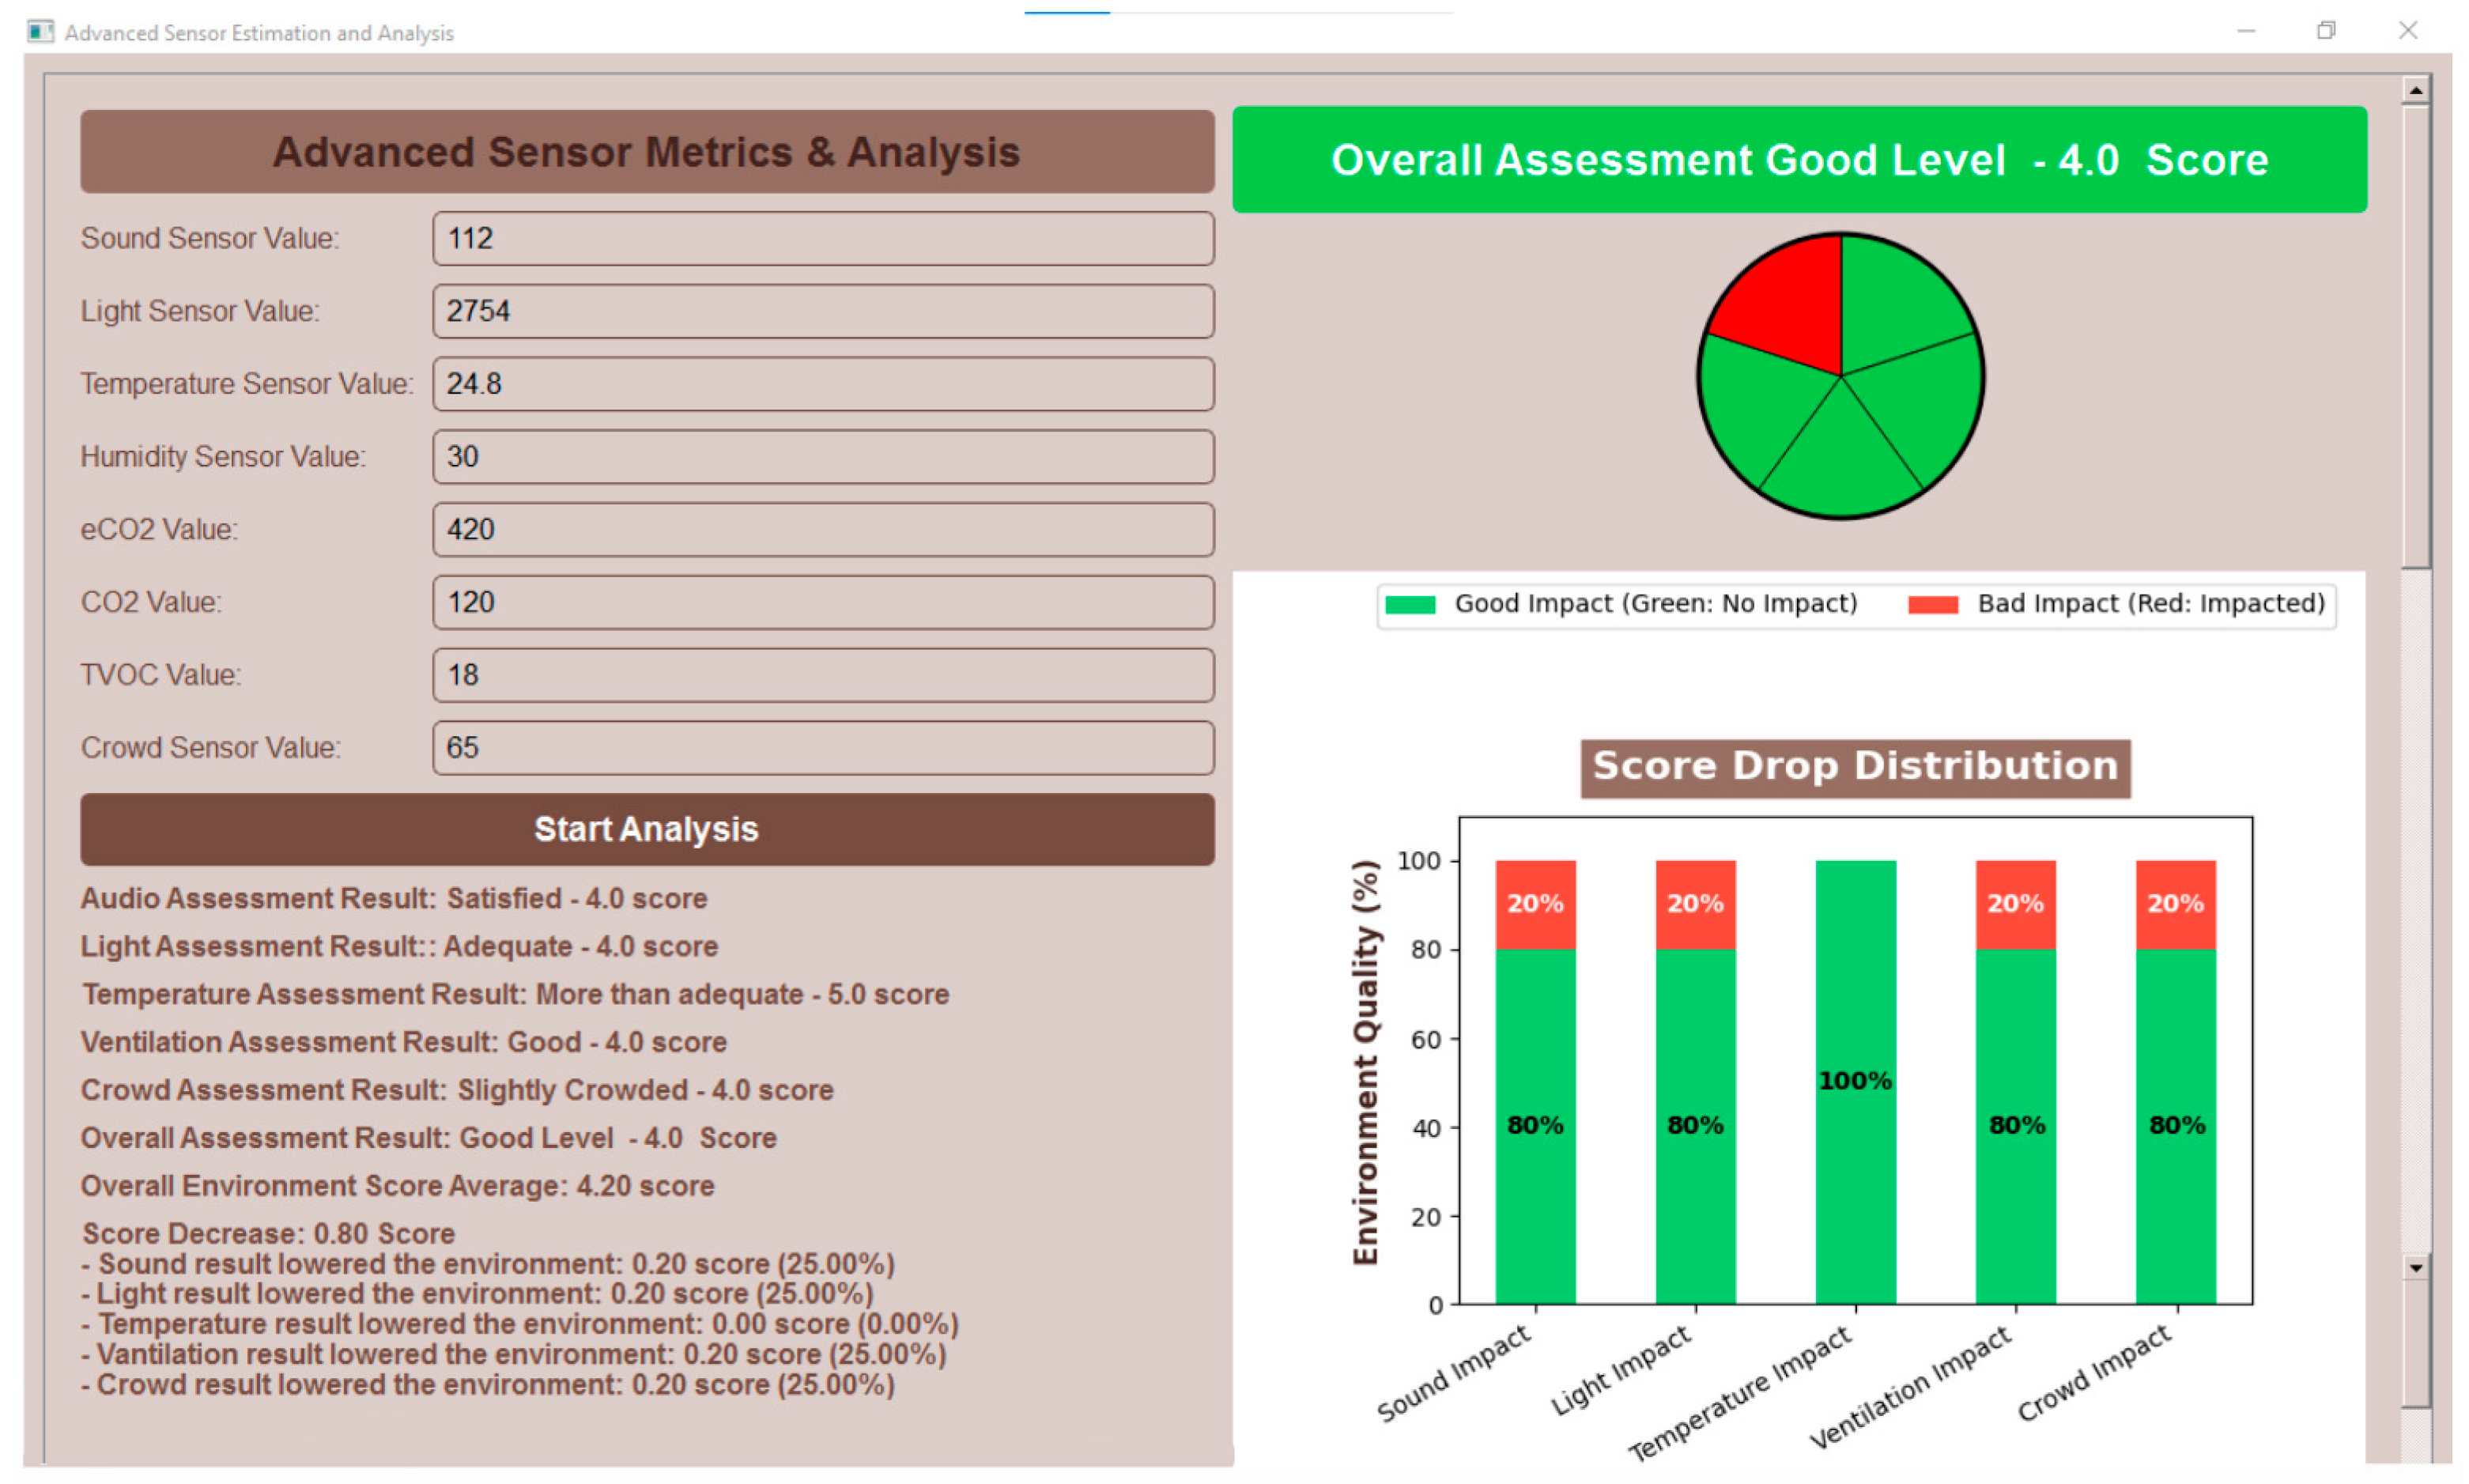
Figure 3 presents an interface that visualizes environmental quality by analyzing various parameters, including sound, light, temperature, ventilation, and crowd density. Color-coded graphs indicate the positive and negative impacts of each parameter, providing a quick overview of the overall environmental condition. This clear data visualization enables users to understand the environment and take appropriate actions for improvement.
This interface provides a comprehensive environmental quality assessment by integrating the effects of various parameters (sound, light, temperature, ventilation, and crowd). Measurement results are clearly presented, with green indicating positive effects and red indicating negative effects, allowing for easy interpretation. Users can quickly identify which factors are negatively impacting the overall environmental quality score. This design prioritizes the clear and understandable presentation of environmental data.
The interface presents a detailed environmental evaluation, visualized through graphs and other elements. This includes an overall score, a breakdown of how each environmental parameter (sound, light, temperature, ventilation, crowd) contributes to that score, and the visualization of their positive/negative impacts. This allows users to understand the overall environment and identify specific areas for improvement.
The interface evaluation results, including visualizations, will be detailed. This discussion will cover the overall score, score decline distribution, and environmental parameter impacts.

3.7. Proposed Fog–Cloud Architecture

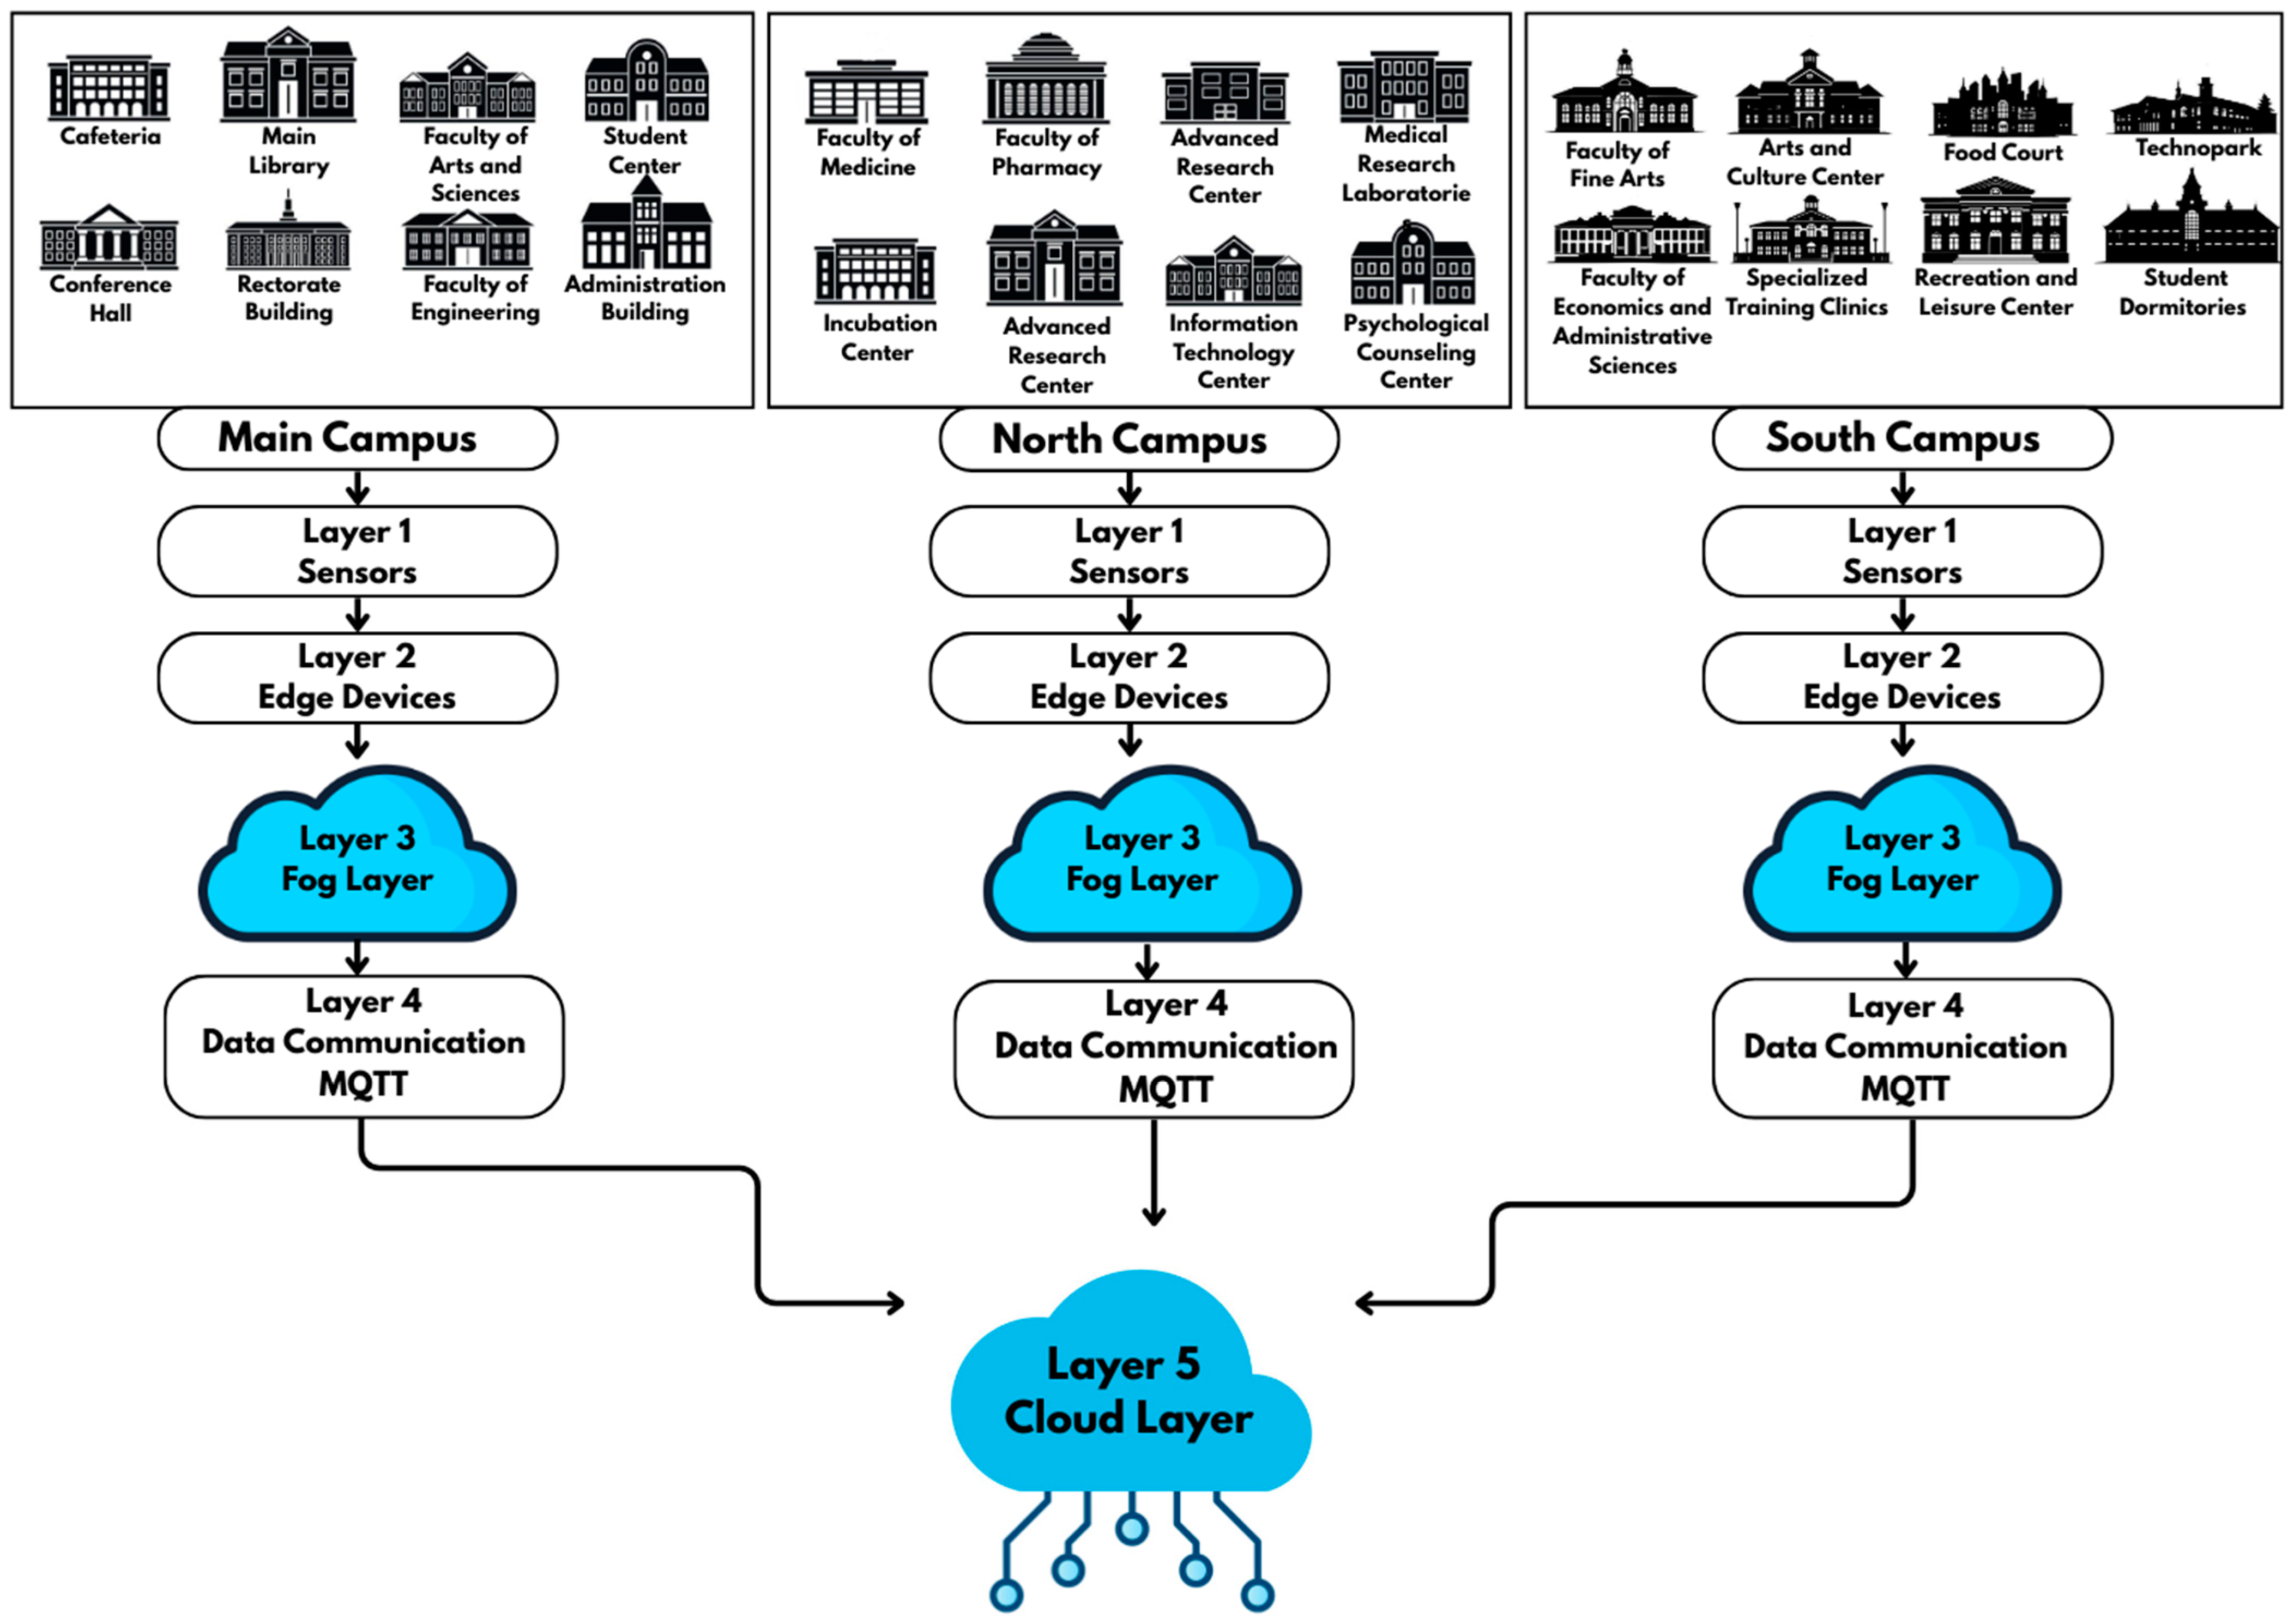
Higher education institutions are facing challenges arising from the increasing number of students, the diversification of educational activities, and technological advancements. In this context, the concept of a smart campus represents the vision of creating an efficient, sustainable, secure, and user-centered learning environment. In alignment with our university’s smart campus vision, this project, which initially started with the smart library project and is planned to gradually expand to different campuses and buildings (such as faculties, cafeterias, administrative buildings, etc.), highlights the need for a next-generation computing infrastructure that involves the collection, processing, and analysis of large amounts of data. While the existing system was initially designed to collect data from a single library, the projected expansion of the project requires data to be gathered from multiple campuses and different types of buildings, with real-time processing of these data. This situation could render a traditional, centralized cloud-based approach insufficient, leading to latency, bandwidth, and scalability issues. To overcome these challenges and establish a scalable, flexible, reliable, and efficient computing infrastructure that will form the foundation of the smart campus ecosystem, a fog–cloud-based architecture, as presented in Figure 1, is proposed.
Figure 4 illustrates the data flow, starting from the distributed sensors (Layer 1) across three different campuses (Main Campus, North Campus, South Campus) and various buildings within these campuses (library, faculty buildings, cafeterias, administrative buildings, etc.), extending through edge devices (Layer 2), the fog layer (Layer 3), data communication (Layer 4, MQTT protocol), and up to the cloud layer (Layer 5). This proposed architecture is based on the principle of processing data close to the source (fog layer), aiming to offer critical advantages such as real-time data analysis across the campus, fast response times, optimized resource utilization, and enhanced data security.
The fog–cloud infrastructure optimizes the data flow between IoT devices, the cloud, and the fog, providing low latency and high bandwidth. The fog computing layer typically performs data processing and storage locally, reducing dependence on cloud systems. This layer is commonly used in areas such as industrial automation, smart cities, healthcare, and agriculture, especially to meet high processing power and real-time data analysis requirements. Fog computing also offers additional advantages, such as local data sharing between devices, enhanced security measures, and optimized network management. This not only leads to the more efficient use of cloud resources but also increases the capacity to respond faster to users. Furthermore, fog computing provides local analytics to monitor the lifecycle and performance of IoT devices, ensuring energy savings and system efficiency [83].
The fog–cloud infrastructure consists of three layers: the cloud, fog, and IoT layers. The cloud layer includes cloud servers, the fog layer consists of fog servers, and the IoT layer encompasses IoT devices. The fog computing layer, similar to the cloud layer but operating on a smaller scale, provides data, processing, network, and storage services to end users. Fog nodes can be devices such as smart gateways, routers, or embedded servers. Fog computing resides between the cloud and IoT layers, being closer to IoT devices, which results in low latency and high bandwidth. It is a critical model, especially for dynamic networks like the IoT and VANET. With its processing capacity near the user, it offers a potential solution for delivering services required by IoT and VANET users [84].
In the Conclusions and Discussion Section of this study, the feasibility of this architecture, the advantages it offers, and its impact on the campus ecosystem will be elaborated. It will be emphasized that the fog layer reduces latency and enhances system security by performing data processing closer to the source. Additionally, the potential for this model to be expanded across the campus in the future and adapted to different use scenarios will be discussed.

4. Results

This section presents the results, beginning with data augmentation method findings, followed by a detailed discussion of machine learning algorithm performance comparisons for environmental data (sound, light, temperature, crowd, ventilation) and an overall evaluation.

4.1. Findings Obtained from the Data Augmentation Process

In real-world scenarios, achieving a perfectly balanced dataset is often impractical. In this study, data imbalance stems from natural factors such as the irregular nature of user feedback and the variability in environmental conditions. Users tend to be more active at certain hours or focus more on specific topics, leading to an uneven data distribution. For instance, variations in air quality and temperature may be more pronounced at specific times, resulting in a limited amount of data collected under certain conditions.
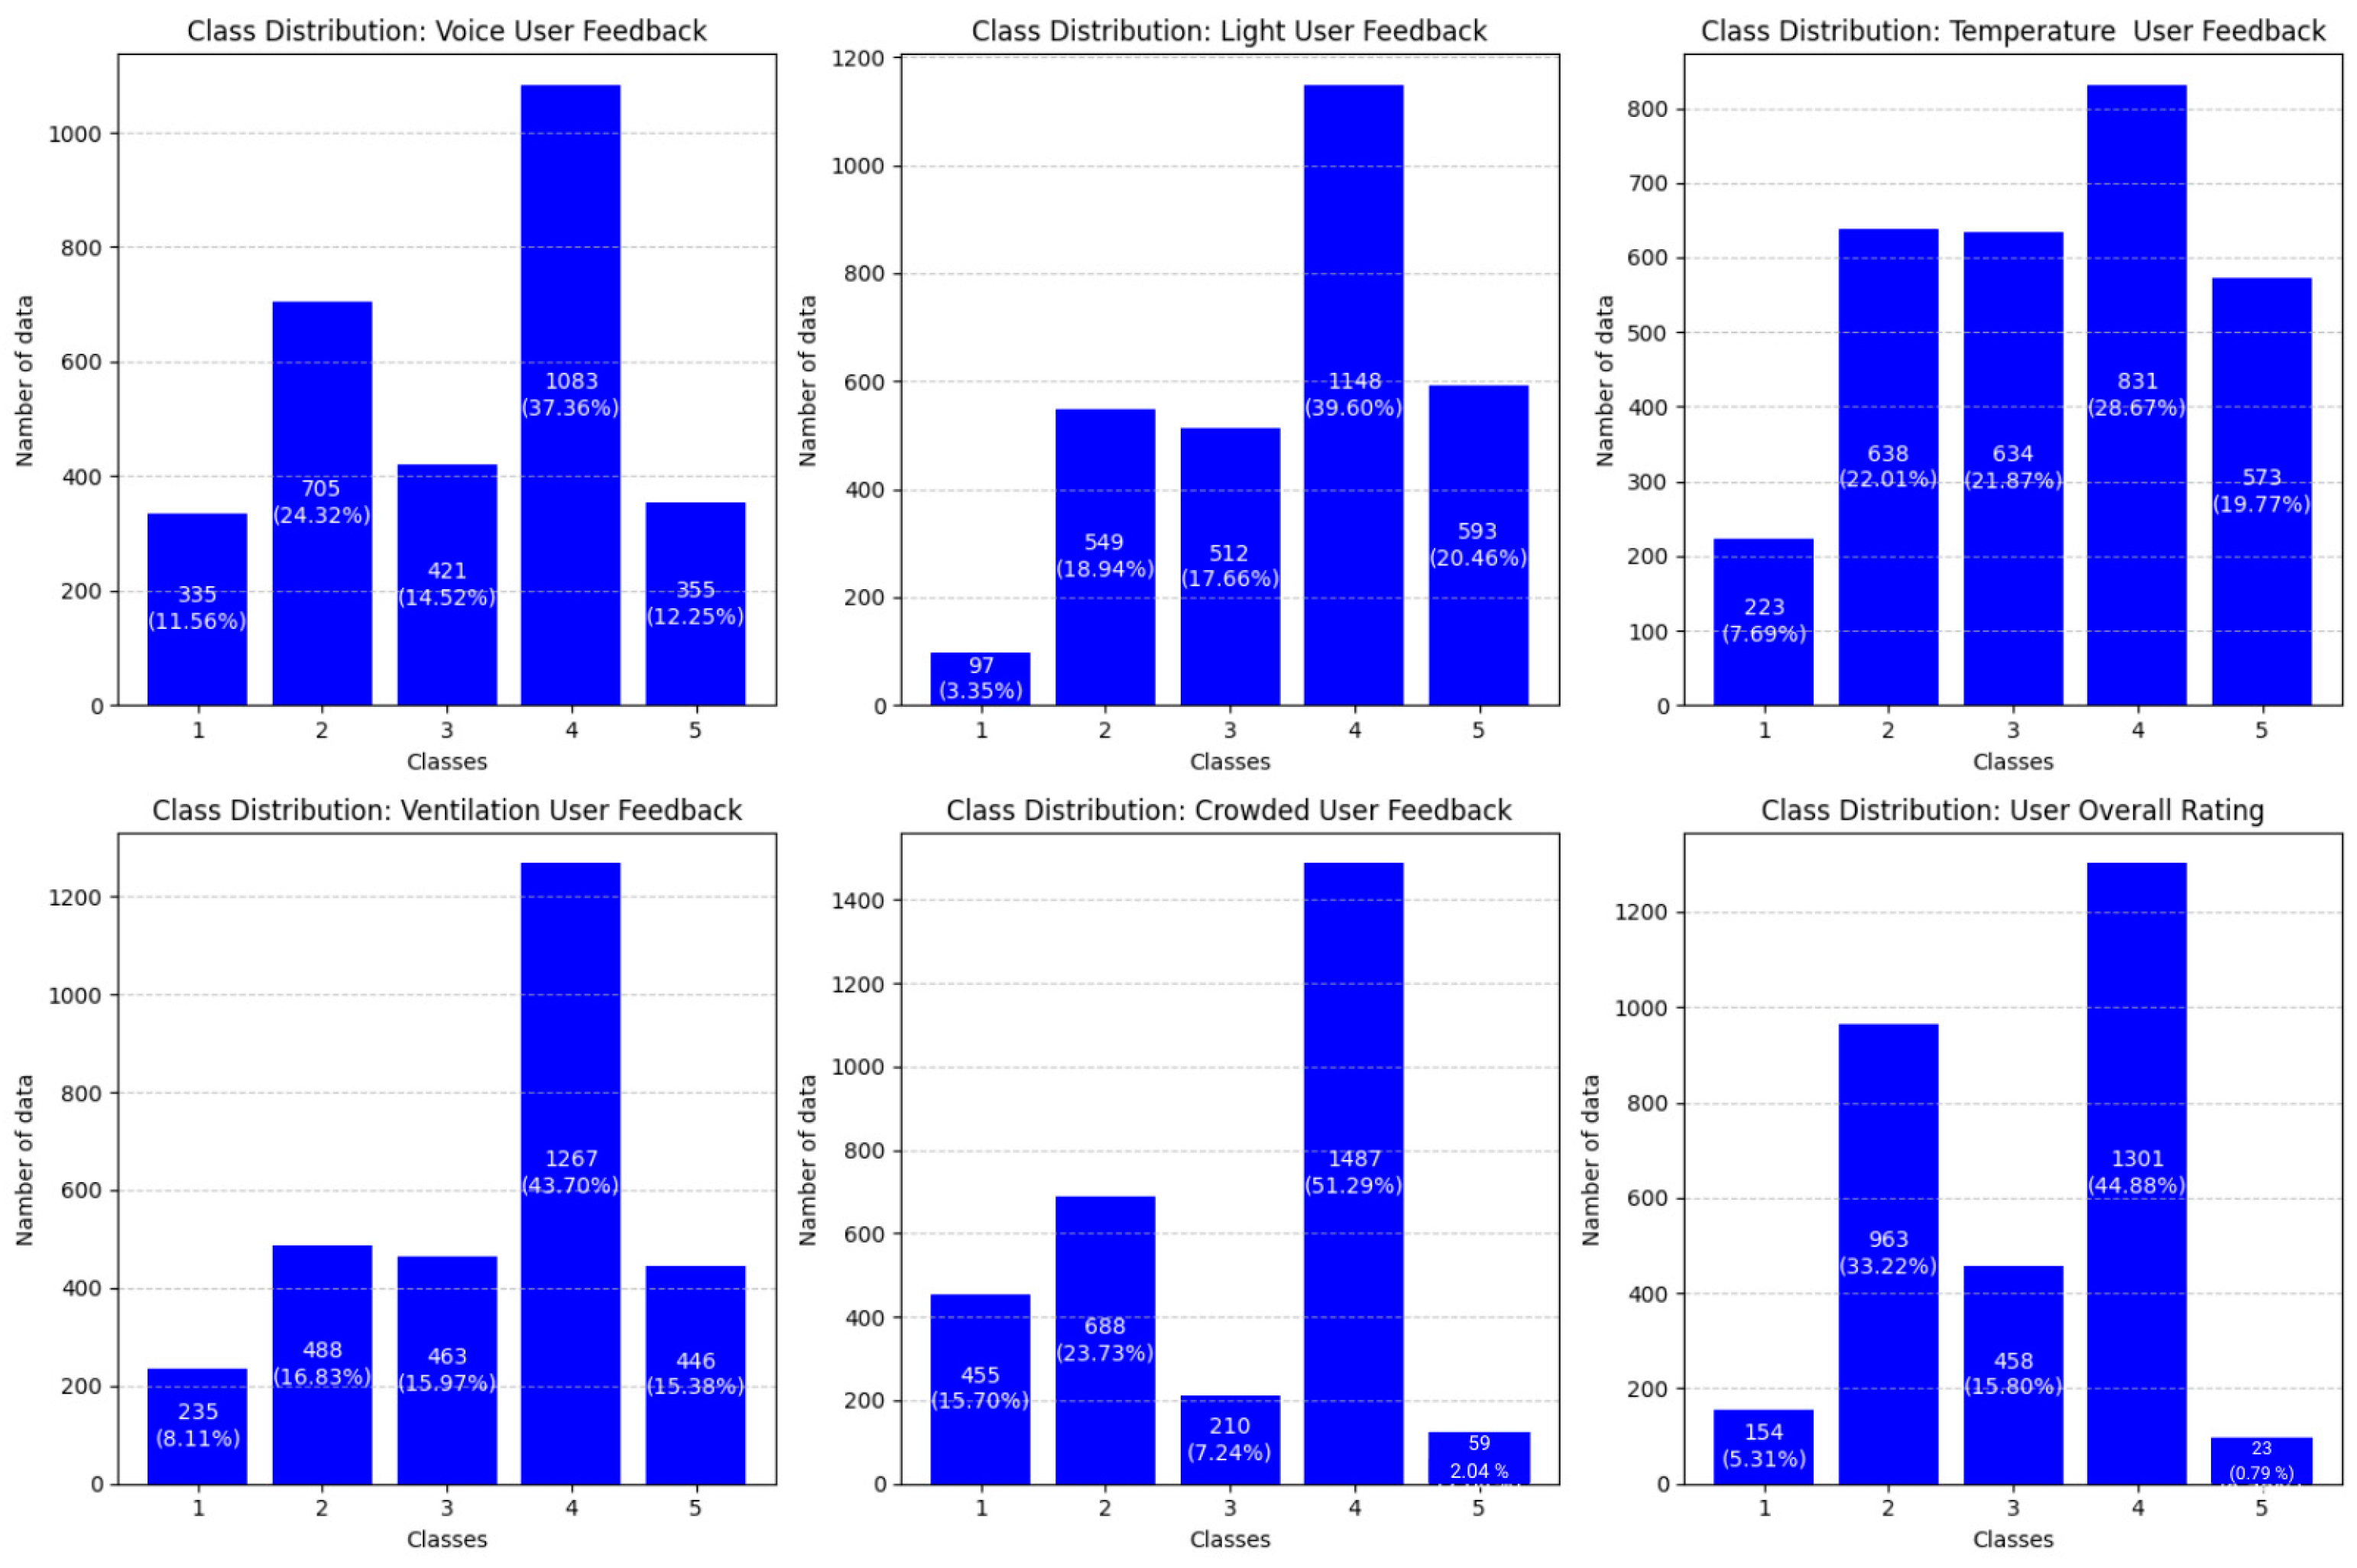
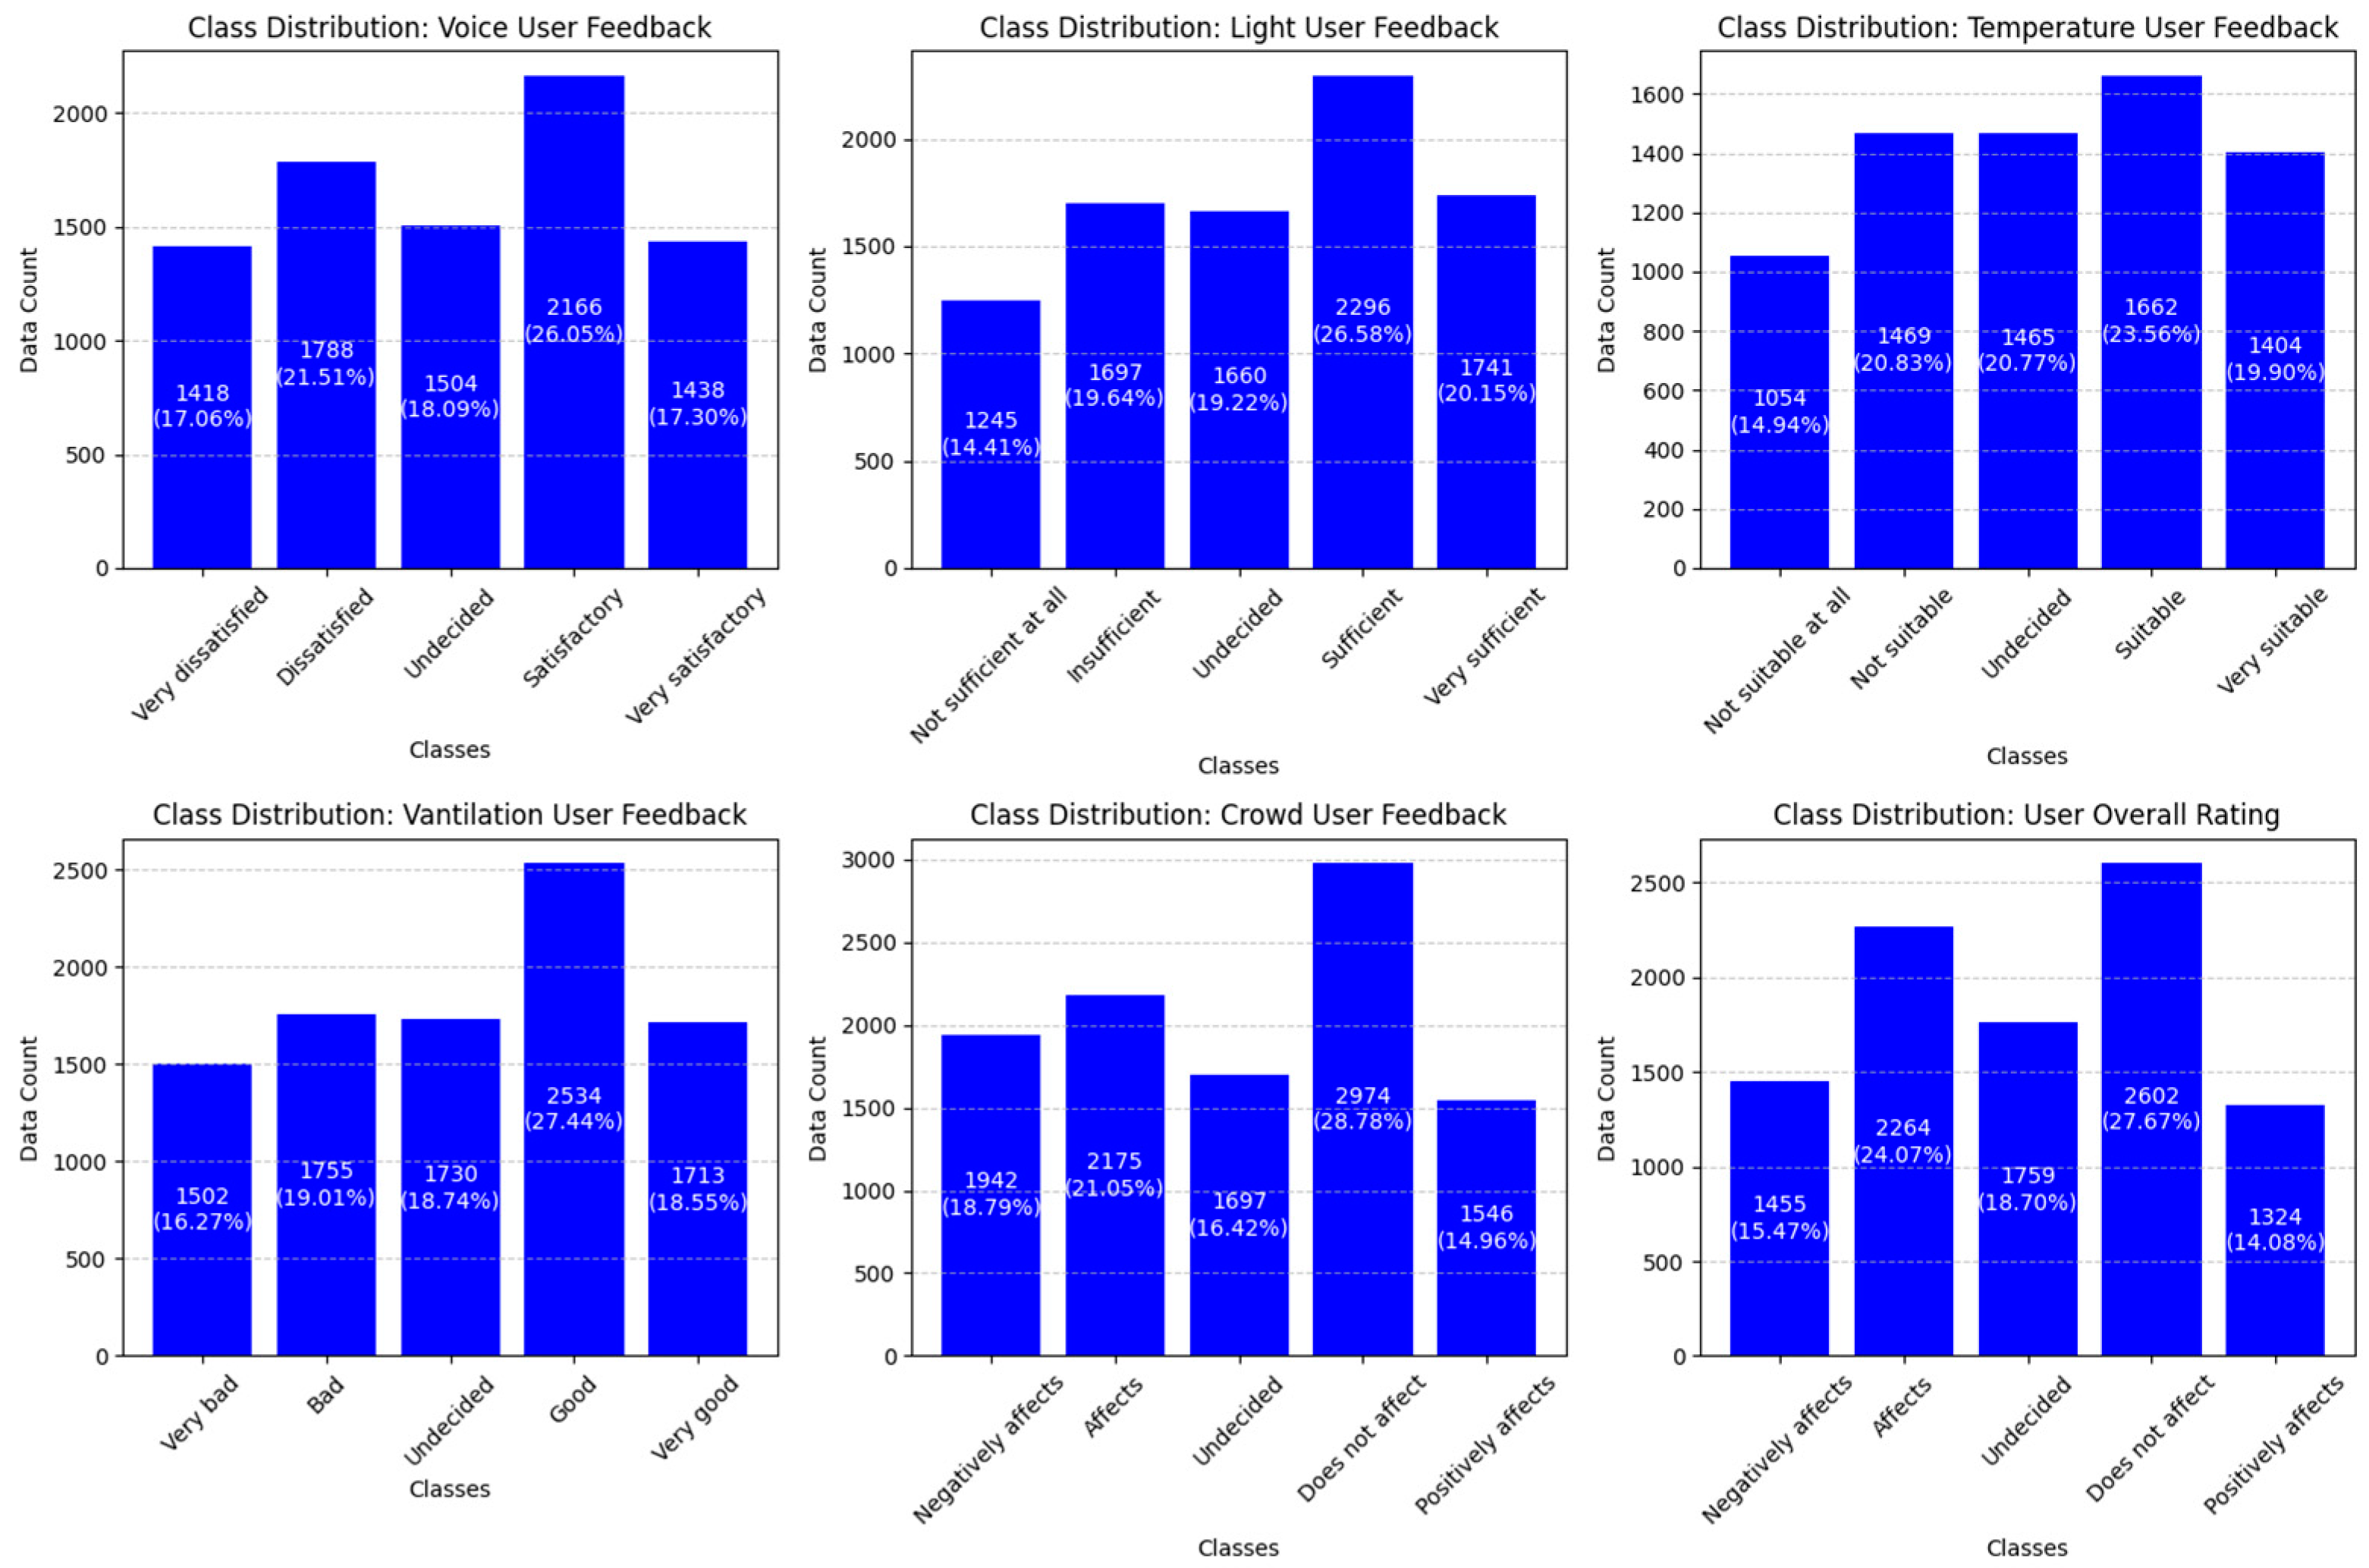
The initial dataset exhibited imbalanced class distribution, with classes 1 and 4 overrepresented, potentially hindering model performance. This section analyzes datasets augmented using the SMOTE, evaluating class distribution, correlation, and outlier detection.
The impact of data augmentation on addressing class imbalance by increasing minority class examples is examined. The analysis of class distribution clearly visualizes these effects. Figure 5 displays the class distribution of the original dataset, while Figure 6 illustrates the improvements achieved after applying the SMOTE.
The original dataset exhibited a highly imbalanced class distribution, with classes 1 and 4 being overrepresented. After applying the SMOTE for data augmentation, the class distribution became significantly more balanced. Figure 5 shows the original distribution, while Figure 6 illustrates the improvement after the SMOTE, with a more even representation of all classes. This balance is expected to reduce the model’s bias toward the overrepresented classes and improve its overall performance.

4.2. Comparison of Machine Learning Algorithms’ Performance

This section compares the performance of machine learning algorithms (Logistic Regression, Decision Trees, Random Forest, SVM, KNNs, XGBoost, and Naive Bayes) applied to individual and combined sensor data, including user general evaluations.
The performance of the algorithms was evaluated using metrics such as the F1 score, precision, recall, memory usage, training time, and testing time. Through the analysis, the best-performing models were identified both for individual sensor data and for the overall general evaluation. This comparison clearly reveals the impact of different sensor data and algorithms on the user general evaluations.

4.2.1. Performance Comparison of All Algorithms on Sensor Data

The performance metrics of sensor data training algorithms are compared across different dimensions (F1 score, precision, recall, training time, test time, and memory usage). In this visualization, the achievements of each algorithm in these metrics are presented in detail. Metrics such as the F1 score, precision, and recall provide crucial insights into the classification performance, revealing the accuracy and errors of each algorithm. The training and test times reflect the processor and time efficiency of each algorithm, while memory usage indicates the resource consumption. This visual representation highlights the performance differences across these metrics, allowing us to assess which algorithm delivers more efficient and accurate results under specific conditions. This comprehensive comparison aids in a deeper understanding of the algorithms’ overall performance in terms of both accuracy and computational resources.
In Table 4, the performance metrics of sound training algorithms, including the F1 score, precision, recall, training time, testing time, and memory usage, are compared. K-Nearest Neighbors (KNNs) leads in classification performance with an F1 score of 0.961, a precision of 0.962, and a recall of 0.961, offering a significant advantage with a training time of 109.187 s compared to other high-F1-scoring models, such as Random Forest (4125.98 s). During the testing phase, KNNs demonstrates resource efficiency with a speed of 0.149 s and memory consumption of 2.621 MB, making it suitable for practical applications. Although Random Forest shows a similar F1 score (0.956), its 4125.98 s of training time and 45.102 MB memory usage make it less scalable. Decision Trees stand out in speed-focused scenarios with an F1 score of 0.957 and a testing time of 0.005 s. Models like Support Vector Machine (SVM) (F1 = 0.662), XGBoost (F1 = 0.682), Naive Bayes (F1 = 0.618), and Logistic Regression (F1 = 0.658) lag behind in terms of performance metrics.
Table 5 compares light training algorithms (KNNs, Random Forest, Decision Trees, XGBoost, SVM, Naive Bayes, Logistic Regression). KNNs, Random Forest, and Decision Trees have similar F1 scores (~0.74). KNNs has a high training time/memory. Random Forest is more balanced. Decision Trees are fast and efficient. XGBoost has the fastest training time but a lower F1 score. SVM and Naive Bayes perform poorly. Logistic Regression uses minimal memory but has a low F1 score.
Table 6 compares temperature training algorithms (KNNs, Random Forest, Decision Trees, XGBoost, SVM, Logistic Regression, Naive Bayes). KNNs and Random Forest have the highest F1 score, precision, and recall (0.981) but a high training time/memory. Decision Trees (F1 0.979) have balanced performance and resource efficiency. XGBoost (F1 0.607) has a fast training time but low performance. SVM and Logistic Regression perform poorly. Naive Bayes has the lowest performance (F1 0.415) and least memory usage.
Table 7 compares ventilation training algorithms. Random Forest has the highest F1 score (0.899) but is resource-intensive (10,182.2 s training, 18,160 MB memory). Decision Trees (F1 0.895, 737.32 s, 10,730 MB) offer a good balance. KNNs (F1 0.894, 758.95 s) is a balanced alternative. XGBoost (F1 0.723, 30,625 s, 70,602 MB) has a fast training time but low performance and high memory. SVM (F1 0.659, 6990 s testing) performs poorly. Logistic Regression (F1 0.560, 3160 MB) and Naive Bayes (F1 0.424, 5902 MB) are lightweight but have low scores.
Table 8 compares crowd training algorithms. Random Forest has the highest F1 score (0.406), precision (0.412), and recall (0.422) with moderate resource usage (1143.8 s training, 9668 MB memory). KNNs (F1 0.402, 94.98 s) is a balanced alternative. Decision Trees (F1 0.396, 141.59 s, 0.005 s testing, 6629 MB) are fast and efficient. XGBoost (F1 0.388, 279.93 s, 86,316 MB) has a low F1 score and high memory. SVM (F1 0.268, 725,271 s) is weak. Naive Bayes (F1 0.243, 2004 MB) has the lowest performance and least memory. Logistic Regression (F1 0.276, 5297 MB) also has limited performance.
Table 9 compares general evaluation training algorithms. KNNs (F1 0.9904, 1360.9 s, 12332 MB) and Random Forest (F1 0.9902, 7309.2 s, 21,762 MB) have the highest F1 scores but are resource-intensive. Decision Trees (F1 0.984, 330.47 s, 0.005 s testing, 8785 MB) are the most balanced. XGBoost (F1 0.741, 20,602 s, 71,059 MB) has a fast training time but low performance and high memory. SVM (F1 0.945, 3146.9 s, 6510 s testing) is impractical. Naive Bayes (F1 0.429, 5992 MB) and Logistic Regression (F1 0.493, 1215 MB) are lightweight but have low performance.
The performance analysis compared models trained on individual sensor data versus a combined model. The combined model, analyzing all sensor data concurrently, significantly outperformed the individual models across the accuracy, precision, recall, and F1 score metrics.
The comparative analysis highlighted KNNs’ strong performance, especially its F1 score, in the general evaluation. This justifies focusing this study on KNNs. Further analysis findings will be detailed in subsequent sections, with a broader discussion of all algorithms in the Conclusions.

4.2.2. User General Evaluation Findings Obtained from All Sensor Data Using the K-Nearest Neighbors (KNNs) Algorithm

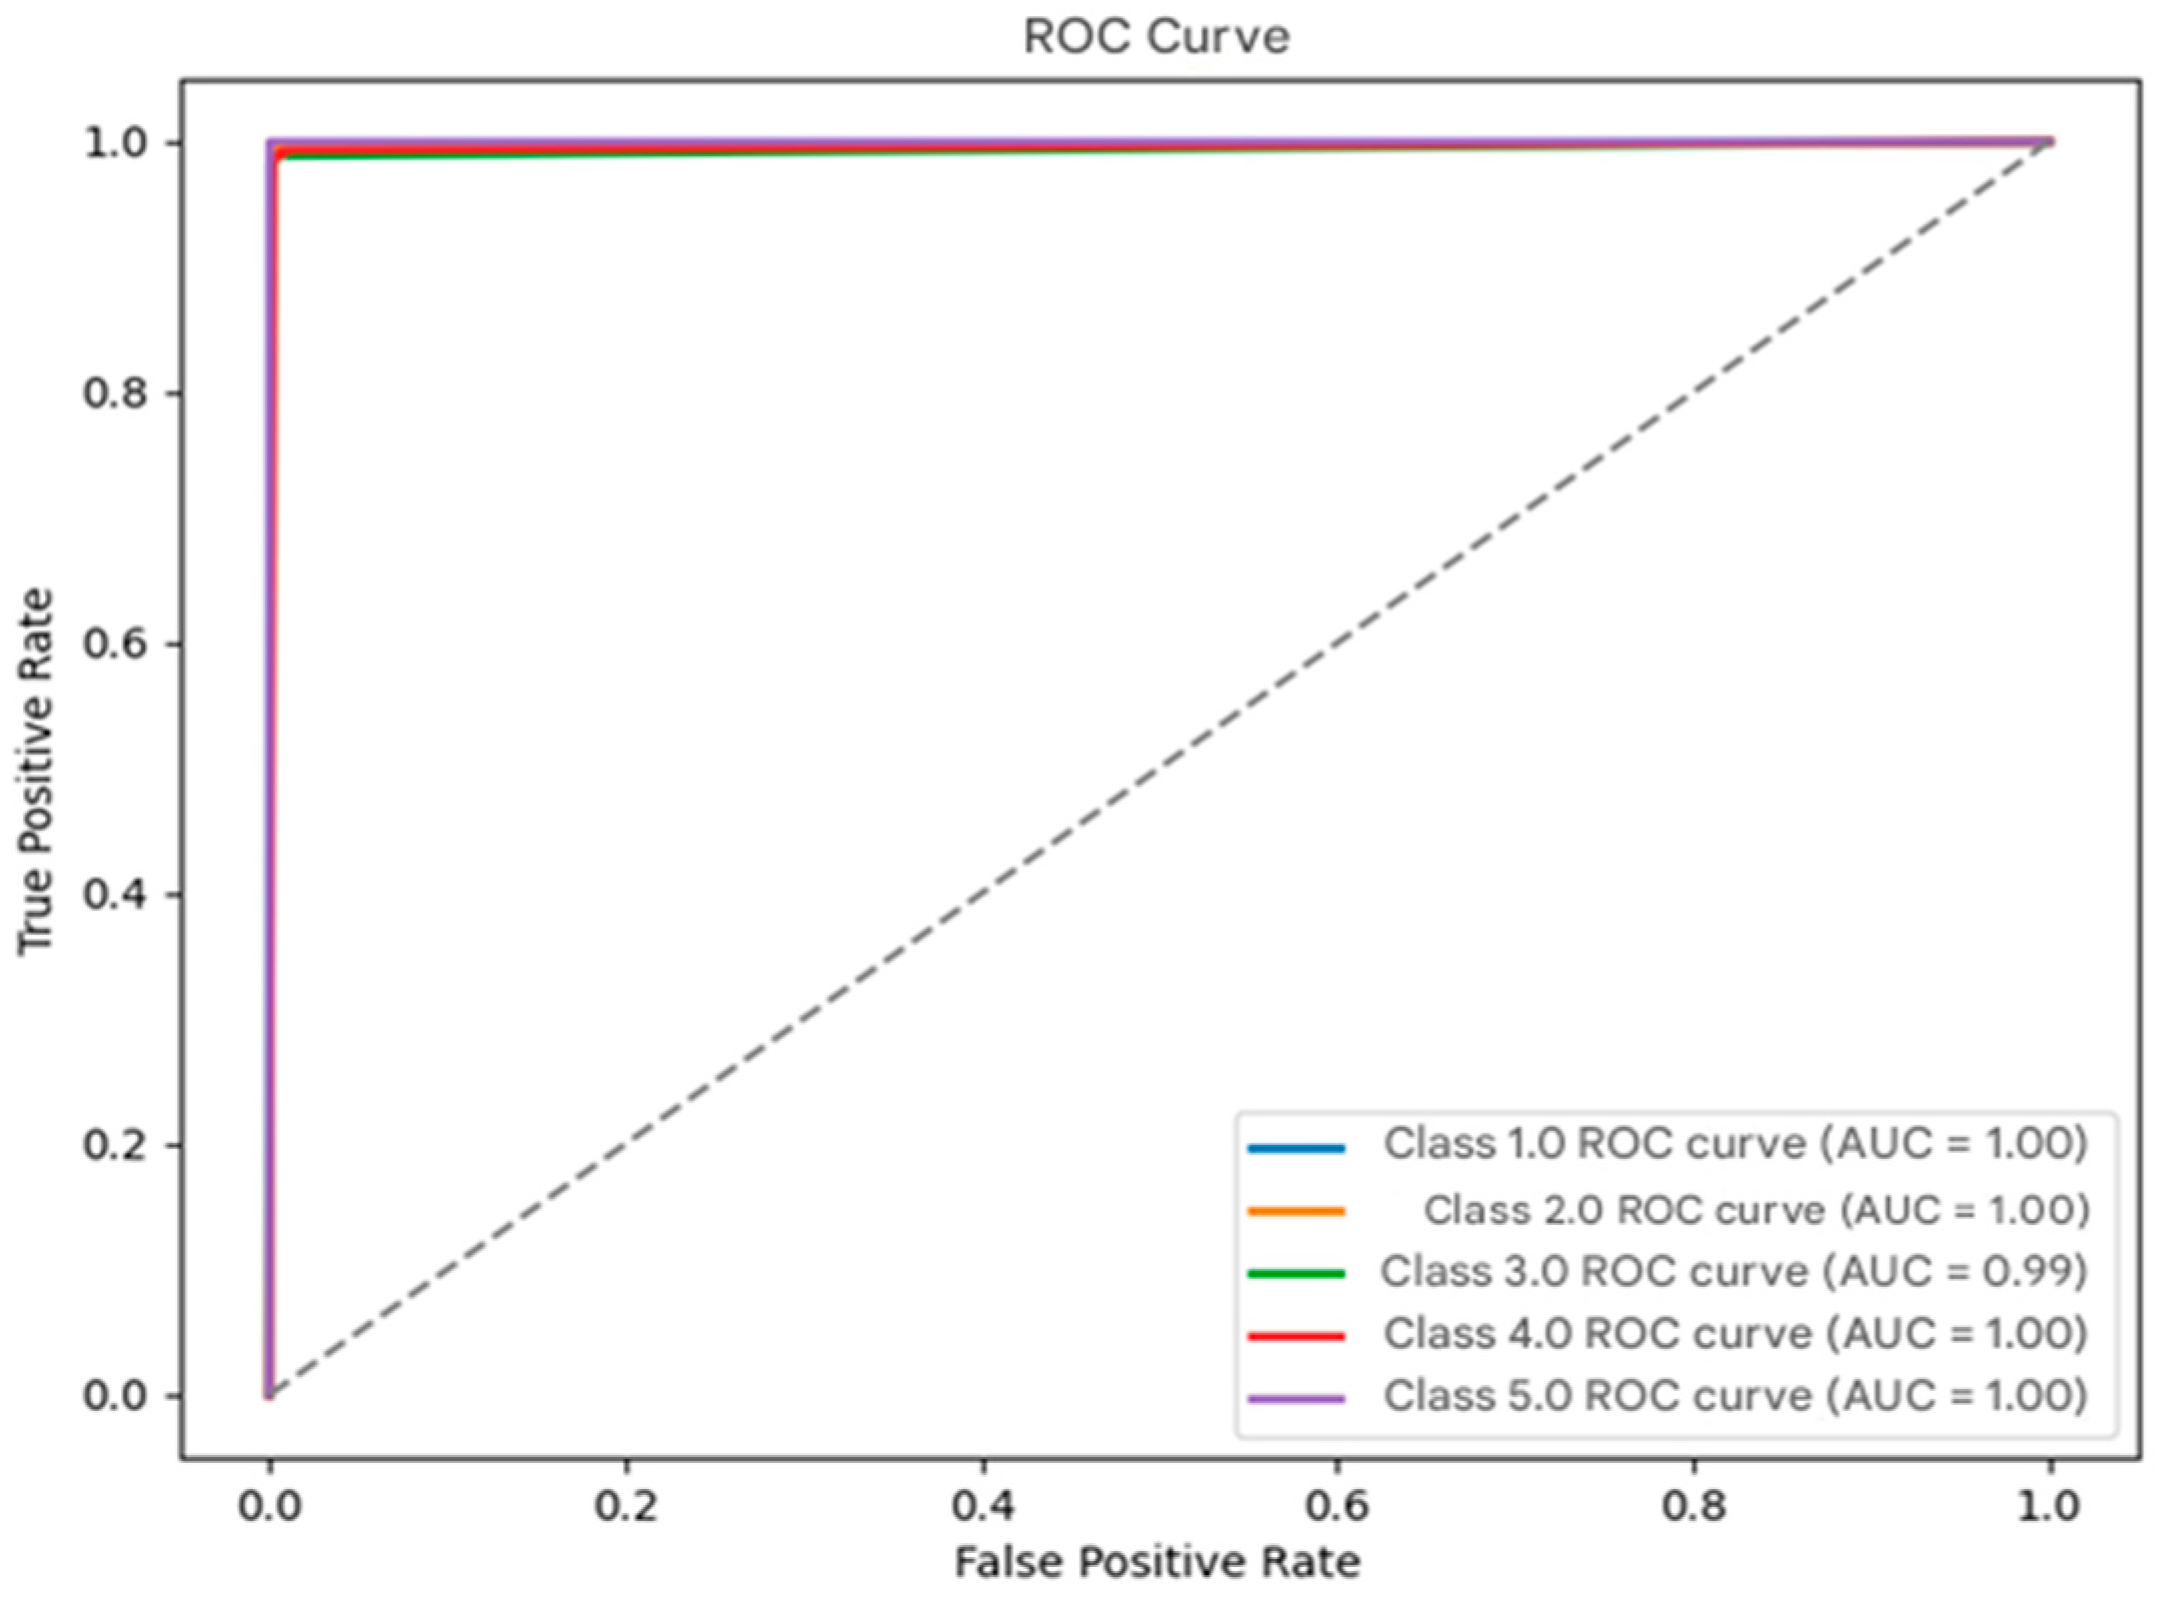
Figure 7 shows the KNNs algorithm’s ROC curve, derived from all sensor data, visualizing the sensitivity/specificity balance. The AUC value reflects the model’s class discrimination ability and overall classification performance, evaluating its effectiveness.
Figure 8 shows the KNNs algorithm’s confusion matrix, derived from all sensor data. It visualizes the distribution of correct and incorrect classifications, indicating the model’s strengths and weaknesses across classes.

5. Discussion

This study aimed to develop an IoT-based system that evaluates the impact of various environmental factors in university libraries on user productivity, satisfaction, and overall work quality. The collected data were analyzed using machine learning models to determine patterns and correlations among six key environmental factors: sound, light, temperature, ventilation, crowding, and overall evaluation. Seven different machine learning models—KNNs, Random Forest, Decision Trees, SVM, Naive Bayes, Logistic Regression, and XGBoost—were trained and tested to assess their predictive accuracy and efficiency.
The results indicate that KNNs demonstrated the highest predictive accuracy in sound (F1 = 96.14%) and temperature analysis (F1 = 98.13%), while Random Forest outperformed other models in light (F1 = 74.70%) and ventilation analysis (F1 = 90.14%). However, in crowding analysis, the best-performing model (Random Forest) only achieved an F1 score of 40.46%, suggesting that crowding prediction may require additional contextual features or alternative modeling techniques to improve accuracy.
A key aspect of this study was the comparison between individual-sensor-based models and a combined model that integrated data from all sensors. The findings indicate that the combined model exhibited significantly superior performance across all major evaluation metrics, including the accuracy, precision, recall, and F1 score. This improvement is attributed to the inter-sensor relationship analysis, which allows the model to capture the holistic impact of environmental conditions rather than treating each variable in isolation. The combined model also showed better generalization capabilities, greater resilience to noise, and improved predictive accuracy compared to models trained on single-sensor data.
In terms of computational efficiency, KNNs emerged as the most practical choice for real-time applications due to its high accuracy and efficient memory usage (12.332 MB), significantly lower than Random Forest (21.762 MB), despite achieving the same F1 score (0.9904). Moreover, KNNs required only 1369 s for training, while Random Forest took 7309.2 s, making KNNs the more cost-effective approach for practical implementations. Other models, such as SVM (F1 = 0.945) and Decision Trees (F1 = 0.941), demonstrated competitive performance but did not match the efficiency and reliability of KNNs and Random Forest. In contrast, XGBoost (F1 = 0.741), Naive Bayes (F1 = 0.429), and Logistic Regression (F1 = 0.493) significantly underperformed in comparison.
Beyond machine learning performance, this study highlights the importance of a scalable and efficient computing architecture for smart campus applications. The proposed fog–cloud computing framework provides low-latency processing, bandwidth optimization, and enhanced security, ensuring seamless integration with large-scale IoT deployments. The ability to process data locally at fog nodes reduces the reliance on centralized cloud computing, addressing latency-sensitive applications such as real-time environmental adjustments.

6. Conclusions

This study successfully demonstrates that environmental conditions in university libraries play a crucial role in influencing user productivity, satisfaction, and work efficiency. By leveraging an IoT-driven approach combined with machine learning-based predictive modeling, this research provides valuable insights into how various environmental factors impact user experience. The findings confirm that a holistic approach to sensor data processing enhances predictive accuracy and reliability, with the combined sensor model outperforming models trained on single-factor data.
Among the tested machine learning algorithms, KNNs emerged as the most efficient model, achieving the highest F1 score (0.9904) while maintaining lower memory consumption and faster training times compared to Random Forest. This makes KNNs the preferred model for real-time implementation in smart campus environments. Additionally, the fog–cloud architecture proposed in this study was identified as the most suitable computational framework for smart campus applications. This hybrid architecture offers several key advantages, including the following:
Scalability: The smart campus project is planned to start with the smart library application and gradually expand to different campuses and various buildings (faculties, cafeterias, administrative buildings, etc.) over time. Such growth at this scale could lead to overloading and performance issues on central servers in a traditional cloud-based system. However, the fog–cloud architecture addresses this issue by providing local data processing capacity at each campus and even within each building. As new sensors, devices, and buildings are added to the system, fog nodes can also be added, allowing the system to scale horizontally.
Low latency: In a smart campus environment, many applications require real-time or near-real-time response times. For example, scenarios such as automatically adjusting lighting and ventilation based on the occupancy rate in the library, providing instant notifications based on sound levels in classrooms, or detecting events that require rapid intervention in emergencies (such as a fire alarm) can be adversely affected by delays at the millisecond level, potentially negatively impacting the user experience or creating security risks. Fog computing ensures low latency, which is critical for such applications, by processing data at locations close to the source (e.g., at a fog node within the library).
Bandwidth efficiency: Within the scope of the smart campus project, data will be continuously collected from a large number of sensors (e.g., temperature, humidity, light, sound, images, etc.). Sending all of these raw data to the central cloud would result in unnecessary bandwidth consumption and high costs. In the fog–cloud architecture, however, data are primarily processed in the fog layer. In this layer, irrelevant data are filtered, and data are compressed and summarized, or only critical changes (e.g., a sudden increase in temperature, exceeding a certain sound threshold) are sent to the cloud. This significantly reduces network traffic and ensures a more efficient use of bandwidth.
Data privacy and security: Smart campus applications often involve personal data or sensitive information. For example, camera footage used to determine occupancy levels in the library or sensor data tracking student movements could raise privacy concerns. Fog computing enhances data privacy and security by processing such sensitive data at local fog nodes, preventing them from leaving the campus. Data can be stored in the fog layer in an encrypted form and made accessible only to authorized individuals. Additionally, local firewalls and intrusion detection systems can be implemented in the fog layer to provide extra protection against cyberattacks.
Advantages of the hybrid approach: The proposed architecture combines the benefits of both fog computing (local, real-time processing) and cloud computing (centralized, big data analytics, and long-term storage). The fog layer handles tasks that require quick responses and low latency and can be solved locally (e.g., real-time lighting control, emergency alerts), while the cloud layer handles more extensive tasks such as comprehensive analytics, training machine learning models, and long-term data storage. This division of labor enhances the overall performance and efficiency of the system.
Energy efficiency: Local data processing reduces unnecessary data transmission and central server load, optimizing energy consumption. This contributes to the sustainability goals of smart campus projects.
Modularity and flexibility: The fog architecture can be customized according to the needs of different departments and easily integrated with new technologies. As new sensors or services are added, the system can be easily scaled.
Maintenance and operational ease: Due to local processing and the distributed structure, system failures do not affect the entire campus but are limited to the affected area. This makes maintenance processes easier and more cost-effective.

Future Work: Towards a Smarter and More Adaptive Campus Environment

While this study provides a robust foundation for understanding the impact of environmental factors on user productivity in university libraries, it also opens new avenues for future research and system improvements. The integration of the IoT, machine learning, and fog–cloud computing in smart campus environments is still evolving, and several key areas deserve further exploration to maximize efficiency, accuracy, and user experience:
  • Advancing crowding analysis through multi-modal data fusion.
The relatively lower performance in crowding analysis (F1 = 40.46%) suggests that additional contextual data and more sophisticated modeling techniques could enhance accuracy. Future research could explore the following:
  • Multi-modal sensor integration: combining camera-based occupancy tracking, Wi-Fi access logs, and motion sensors with existing environmental data could offer a more comprehensive understanding of space utilization.
  • Deep learning-based scene recognition: leveraging Convolutional Neural Networks (CNNs) and Transformer-based models could enable automated crowd density estimation from real-time visual data, improving prediction robustness.
2.
Implementation of deep learning for dynamic environmental adaptation.
Current machine learning models provide accurate predictions, but they lack the ability to dynamically adapt to real-time changes. Future work could investigate the following:
  • Reinforcement learning-based optimization: implementing self-learning AI systems that continuously adjust environmental conditions (e.g., lighting, ventilation) in response to user behavior, improving both efficiency and user comfort.
  • Deep learning-based scene recognition: leveraging Convolutional Neural Networks (CNNs) and Transformer-based models could enable automated crowd density estimation from real-time visual data, improving prediction robustness.
  • Temporal analysis with LSTMs and Transformer models: using time-series deep learning models to predict future environmental trends based on historical data, enabling proactive adjustments in smart campus systems.
3.
Expanding the smart campus concept beyond libraries.
The proposed system can be extended to other university spaces to create a fully interconnected, intelligent campus infrastructure. Key expansion areas include the following:
  • Smart classrooms: automated adjustments in lighting, temperature, and sound based on real-time lecture dynamics and student concentration levels.
  • Smart dormitories: personalized environmental settings based on student preferences and biometric data to enhance comfort and well-being.
  • Energy-efficient smart buildings: integrating machine learning-driven climate control to optimize energy consumption across campus buildings, aligning with sustainability goals.
  • This study was conducted in a library environment; however, it can be easily applied in the future to places where people gather in large numbers, such as offices, restaurants, and cafés.
4.
Enhancing edge computing for real-time decision-making.
The fog–cloud architecture proposed in this study ensures low latency and efficient bandwidth usage, but further improvements could be made as follows:
  • Deploying AI-driven edge computing: using tiny machine learning (TinyML) models directly on IoT sensor nodes to process data locally, reducing the need for cloud-based inference.
  • Smart dormitories: personalized environmental settings based on student preferences and biometric data to enhance comfort and well-being.
  • Blockchain integration for data security: implementing blockchain-based decentralized data management to enhance privacy and ensure secure, tamper-proof transactions between IoT devices.
5.
Developing an AI-powered decision support system for university administrators.
To maximize the impact of this research, an AI-driven decision support system could be developed, allowing university administrators to conduct the following:
  • Visualize and analyze real-time environmental data via interactive dashboards.
  • Automatically generate reports on student productivity trends based on historical sensor data.
  • Receive AI-driven recommendations for optimizing campus resource allocation and space utilization.
The ultimate goal of future research in this area is to transform universities into fully intelligent, self-adaptive environments that seamlessly integrate AI, the IoT, and user-centric computing. By expanding and refining the proposed system, the next-generation smart campus will not only enhance user experience but also contribute to the broader goals of energy efficiency, sustainability, and data-driven decision-making in higher education institutions.

Author Contributions

Conceptualization, S.M. and E.K.; methodology, S.M. and E.K.; software, S.M.; validation, S.M.; formal analysis, S.M. and E.K.; investigation, S.M.; resources, S.M. and E.K.; data curation, S.M.; writing—original draft preparation, S.M. and E.K.; writing—review and editing, E.K.; visualization, S.M.; supervision, E.K.; project administration, S.M. and E.K.; funding acquisition, none; data collection, S.M. All authors have read and agreed to the published version of the manuscript.

Funding

This research received no external funding.

Institutional Review Board Statement

This study was conducted in accordance with the Declaration of Helsinki and approved by the Institutional Review Board of T.C. Düzce University Scientific Research and Publication Ethics Committee (meeting number 11, decision number 2024/300, and date of approval: 4 October 2024).

Informed Consent Statement

Informed consent was obtained from all subjects involved in this study. All collected data were anonymized, and no personally identifiable information was retained.

Data Availability Statement

The data supporting the findings of this study are available from the corresponding author upon reasonable request. The data are not publicly available due to privacy concerns. Specific details are kept confidential to protect the personal and sensitive information of participants.

Acknowledgments

We sincerely thank the individuals and institutions that contributed to various stages of this research process. The language of this article has been reviewed using artificial intelligence technologies to enhance clarity and consistency. All data used in this research have been carefully anonymized to protect the privacy of participants, and necessary measures have been taken to prevent identity disclosure, ensuring compliance with ethical standards. We extend our special thanks to all participants who played a crucial role during the data collection phase in shaping the scope of this research and enhancing the reliability of the findings. We would like to emphasize that their contributions have helped us gain a deeper understanding of our research questions and obtain more robust results.

Conflicts of Interest

The authors declare no conflicts of interest.

Abbreviations

AIArtificial intelligence
BGDTsBoosted Gradient Decision Trees
dBDecibel
DNNDeep Neural Network
DSRADynamic Sampling Rate Algorithm
GOLRMGeneralized Ordered Logit Regression Model
IAQIndoor air quality
IEQIndoor environmental quality
IoTInternet of Things
KNNsK-Nearest Neighbors
LRLogistic Regression
MLMachine learning
PPMParts Per Million
SEMStructural Equation Modeling
SVMSupport Vector Machine
TVOCsTotal Volatile Organic Compounds
VOCsVolatile Organic Compounds

References

  1. Hoşten, G.; Dalbay, N. Evaluation of Indoor Air Quality in Terms of Occupational Health and Safety. Aydın J. Health 2018, 4, 1–12. [Google Scholar]
  2. Kahn, M.; Li, P. The Effect of Pollution and Heat on High Skill Public Sector Worker Productivity in China. 2019. Available online: https://www.nber.org/system/files/working_papers/w25594/w25594.pdf (accessed on 19 November 2024). [CrossRef]
  3. Tham, S.; Thompson, R.; Landeg, O.; Murray, K.A.; Waite, T. Indoor Temperature and Health: A Global Systematic Review. Public. Health 2020, 179, 9–17. [Google Scholar] [CrossRef] [PubMed]
  4. Bischo, W.; Lahrz, T. Gesundheitliche Bewertung von Kohlendioxid in Der Innenraumluft [Health Evaluation of Carbon Dioxide in Indoor Air]. Bundesgesundheitsblatt Gesundheitsforschung Gesundheitsschutz 2008, 51, 1358–1369. [Google Scholar] [CrossRef]
  5. Tabuenca, B.; Borner, D.; Kalz, M. Effects of an Ambient Learning Display on Noise Levels and Perceived Learning in a Secondary School. IEEE Trans. Learn. Technol. 2021, 14, 69–80. [Google Scholar] [CrossRef]
  6. Shishegar, N.; Boubekri, M. Natural Light and Productivity: Analyzing the Impacts of Daylighting on Students’ and Workers’ Health and Alertness. Int’l J. Adv. Chem. Engg. Biol. Sci. (IJACEBS) 2016, 3, 72–77. Available online: https://www.iicbe.org/upload/4635AE0416104.pdf (accessed on 1 December 2024).
  7. Viola, A.; James, L.; Schlangen, L.D. Blue-Enriched White Light in the Workplace Improves Self-Reported Alertness, Performance and Sleep Quality. Scand. J. Work. Environ. Health 2008, 34, 297–306. [Google Scholar]
  8. Rezaee, M.R.; Abdul Hamid, N.A.W.; Hussin, M.; Zukarnain, Z.A. Fog Offloading and Task Management in IoT-Fog-Cloud Environment: Review of Algorithms, Networks, and SDN Application. IEEE Access 2024, 12, 39058–39080. [Google Scholar] [CrossRef]
  9. Bernard, L.; Yassa, S.; Alouache, L.; Romain, O. Efficient Pareto Based Approach for IoT Task Offloading on Fog–Cloud Environments. Internet Things 2024, 27, 101311. [Google Scholar] [CrossRef]
  10. Salehnia, T.; Seyfollahi, A.; Raziani, S.; Noori, A.; Ghaffari, A.; Alsoud, A.R.; Abualigah, L. An Optimal Task Scheduling Method in IoT-Fog-Cloud Network Using Multi-Objective Moth-Flame Algorithm. Multimed. Tools Appl. 2024, 83, 34351–34372. [Google Scholar] [CrossRef]
  11. The Council of Higher Education. Turkish Higher Education Law. No. 2547 (YÖK Legislation), Official Gazette of 1177 the Republic of Turkey, No. 17506; The Council of Higher Education: Ankara, Turkey, 1981; Volume 21, p. 3. [Google Scholar]
  12. Farmer, L.S.J. Library Space: Its Role in Research. Ref. Libr. 2016, 57, 87–99. [Google Scholar] [CrossRef]
  13. Vogus, B.; Frederiksen, L. Designing Spaces in Libraries. Public. Serv. Q. 2019, 15, 45–50. [Google Scholar] [CrossRef]
  14. Aslam, M. Changing Behavior of Academic Libraries and Role of Library Professional. Inf. Discov. Deliv. 2022, 50, 54–63. [Google Scholar] [CrossRef]
  15. Klain Gabbay, L.; Shoham, S. The Role of Academic Libraries in Research and Teaching. J. Librariansh. Inf. Sci. 2019, 51, 721–736. [Google Scholar] [CrossRef]
  16. Haverinen-Shaughnessy, U.; Shaughnessy, R.J. Effects of Classroom Ventilation Rate and Temperature on Students’ Test Scores. PLoS ONE 2015, 10, e0136165. [Google Scholar] [CrossRef]
  17. Samani, S.A.; Samani, S.A. The Impact of Indoor Lighting on Students’ Learning Performance in Learning Environments: A Knowledge Internalization Perspective. Int. J. Bus. Social. Sci. 2012, 3, 127–136. [Google Scholar]
  18. Hou, H.; Lan, H.; Lin, M.; Xu, P. Investigating Library Users’ Perceived Indoor Environmental Quality: SEM-Logit Analysis Study in a University Library. J. Build. Eng. 2024, 93, 109805. [Google Scholar] [CrossRef]
  19. Azra, M. Investigating Indoor Environment Quality for a University Library. 2019. Available online: https://www.researchgate.net/publication/344349310_Investigating_Indoor_Environment_Quality_for_a_University_Library (accessed on 28 November 2024).
  20. Abraham, S.; Beard, J.; Manijacob, R. Remote Environmental Monitoring Using Internet of Things (IoT). In Proceedings of the 2017 IEEE Global Humanitarian Technology Conference (GHTC), San Jose, CA, USA, 19–22 October 2017; pp. 1–6. [Google Scholar] [CrossRef]
  21. Khritish, S. The Impact of Study Environment on Students’ Academic Performance: An Experimental Research Study. TechRxiv 2023. [Google Scholar] [CrossRef]
  22. Aflaki, A.; Esfandiari, M.; Jarrahi, A. Multi-Criteria Evaluation of a Library’s Indoor Environmental Quality in the Tropics. Buildings 2023, 13, 1233. [Google Scholar] [CrossRef]
  23. Akanmu, W.P.; Nunayon, S.S.; Eboson, U.C. Indoor Environmental Quality (IEQ) Assessment of Nigerian University Libraries: A Pilot Study. Energy Built Environ. 2021, 2, 302–314. [Google Scholar] [CrossRef]
  24. Twardella, D.; Matzen, W.; Lahrz, T.; Burghardt, R.; Spegel, H.; Hendrowarsito, L.; Frenzel, A.C.; Fromme, H. Effect of Classroom Air Quality on Students’ Concentration: Results of a Cluster-Randomized Cross-over Experimental Study. Indoor Air Int. J. Indoor Environ. Health 2012, 22, 378–387. [Google Scholar] [CrossRef]
  25. Sadick, A.M.; Kpamma, Z.E.; Agyefi-Mensah, S. Impact of Indoor Environmental Quality on Job Satisfaction and Self-Reported Productivity of University Employees in a Tropical African Climate. Build. Environ. 2020, 181, 107102. [Google Scholar] [CrossRef]
  26. Peng, L.; Wei, W.; Fan, W.; Jin, S.; Liu, Y. Student Experience and Satisfaction in Academic Libraries: A Comparative Study among Three Universities in Wuhan. Buildings 2022, 12, 682. [Google Scholar] [CrossRef]
  27. Shah, S.K.; Tariq, Z.; Lee, J.; Lee, Y. Real-Time Machine Learning for Air Quality and Environmental Noise Detection. In Proceedings of the 2020 IEEE International Conference on Big Data (Big Data), Atlanta, GA, USA, 10–13 December 2020; pp. 3506–3515. [Google Scholar] [CrossRef]
  28. Lee, Y.S. Collaborative Activities and Library Indoor Environmental Quality Affecting Performance, Health, and Well-Being of Different Library User Groups in Higher Education. Facilities 2014, 32, 88–103. [Google Scholar] [CrossRef]
  29. Brink, H.W.; Lechner, S.C.M.; Loomans, M.G.L.C.; Mobach, M.P.; Kort, H.S.M. Understanding How Indoor Environmental Classroom Conditions Influence Academic Performance in Higher Education. Facilities 2024, 42, 185–200. [Google Scholar] [CrossRef]
  30. Xiong, L.; Huang, X.; Li, J.; Mao, P.; Wang, X.; Wang, R.; Tang, M. Impact of Indoor Physical Environment on Learning Efficiency in Different Types of Tasks: A 3 × 4 × 3 Full Factorial Design Analysis. Int. J. Environ. Res. Public. Health 2018, 15, 1256. [Google Scholar] [CrossRef]
  31. Hong, S.; Kim, Y.; Yang, E. Indoor Environment and Student Productivity for Individual and Collaborative Work in Learning Commons: A Case Study. Libr. Manag. 2022, 43, 15–34. [Google Scholar] [CrossRef]
  32. Khan, A.U.; Zhang, Z.; Chohan, S.R.; Rafique, W. Factors Fostering the Success of IoT Services in Academic Libraries: A Study Built to Enhance the Library Performance. Libr. Hi Tech. 2022, 40, 1976–1995. [Google Scholar] [CrossRef]
  33. Salamone, F.; Bellazzi, A.; Belussi, L.; Damato, G.; Danza, L.; Dell’aquila, F.; Ghellere, M.; Megale, V.; Meroni, I.; Vitaletti, W. Evaluation of the Visual Stimuli on Personal Thermal Comfort Perception in Real and Virtual Environments Using Machine Learning Approaches. Sensors 2020, 20, 1627. [Google Scholar] [CrossRef]
  34. Marzouk, M.; Atef, M. Assessment of Indoor Air Quality in Academic Buildings Using IoT and Deep Learning. Sustainability 2022, 14, 7015. [Google Scholar] [CrossRef]
  35. Dumitrezcu, M.V.; Voicu, I.; Vasılıca, A.F.; Panaitescu, F.V. High-Performance Techniques and Technologies for Monitoring and Controlling Environmental Factors. Hidraulica 2024, 1, 48–55. [Google Scholar]
  36. Zareb, M.; Bakhti, B.; Bouzid, Y.; Batista, C.E.; Ternifi, I.; Abdenour, M. An Intelligent IoT Fuzzy Based Approach for Automated Indoor Air Quality Monitoring. In Proceedings of the 29th Mediterranean Conference on Control and Automation (MED), Puglia, Italy, 22–25 June 2021; pp. 770–775. [Google Scholar] [CrossRef]
  37. Ullo, S.L.; Sinha, G.R. Advances in Smart Environment Monitoring Systems Using IoT and Sensors. Sensors 2020, 20, 3113. [Google Scholar] [CrossRef] [PubMed]
  38. Mohammadi, M.; Yeganə, M. IOT: Applied New Technology in Academic Libraries. In Proceedings of the International Conference on Distributed Computing and High Performance Computing (DCHP 2018), Qom, Iran, 25–27 November 2018; pp. 1–12. [Google Scholar]
  39. Bi, S.; Wang, C.; Zhang, J.; Huang, W.; Wu, B.; Gong, Y.; Ni, W. A Survey on Artificial Intelligence Aided Internet-of-Things Technologies in Emerging Smart Libraries. Sensors 2022, 22, 2991. [Google Scholar] [CrossRef] [PubMed]
  40. Maashi, M.; Alabdulkreem, E.; Maray, M.; Shankar, K.; Darem, A.A.; Alzahrani, A.; Yaseen, I. Elevating Survivability in Next-Gen IoT-Fog-Cloud Networks: Scheduling Optimization with the Metaheuristic Mountain Gazelle Algorithm. IEEE Trans. Consum. Electron. 2024, 70, 3802–3809. [Google Scholar] [CrossRef]
  41. Mahapatra, A.; Majhi, S.K.; Mishra, K.; Pradhan, R.; Rao, D.C.; Panda, S.K. An Energy-Aware Task Offloading and Load Balancing for Latency-Sensitive IoT Applications in the Fog-Cloud Continuum. IEEE Access 2024, 12, 14334–14349. [Google Scholar] [CrossRef]
  42. Khezri, E.; Yahya, R.O.; Hassanzadeh, H.; Mohaidat, M.; Ahmadi, S.; Trik, M. DLJSF: Data-Locality Aware Job Scheduling IoT Tasks in Fog-Cloud Computing Environments. Results Eng. 2024, 21, 101780. [Google Scholar] [CrossRef]
  43. Bharathi, P.D.; Velu, A.N.; Palaniappan, B.S. Design and Enhancement of a Fog-Enabled Air Quality Monitoring and Prediction System: An Optimized Lightweight Deep Learning Model for a Smart Fog Environmental Gateway. Sensors 2024, 24, 5069. [Google Scholar] [CrossRef]
  44. Moreno-Rodenas, A.M.; Duinmeijer, A.; Clemens, F.H.L.R. Deep-Learning Based Monitoring of FOG Layer Dynamics in Wastewater Pumping Stations. Water Res. 2021, 202, 117482. [Google Scholar] [CrossRef]
  45. Bhargavi, P.; Jyothi, S. Object Detection in Fog Computing Using Machine Learning Algorithms. In Research Anthology on Machine Learning Techniques, Methods, and Applications; IGI Global: Hershey, PA, USA, 2022; pp. 472–485. ISBN 9781668462928. [Google Scholar]
  46. Verma, P.; Tiwari, R.; Hong, W.C.; Upadhyay, S.; Yeh, Y.H. FETCH: A Deep Learning-Based Fog Computing and IoT Integrated Environment for Healthcare Monitoring and Diagnosis. IEEE Access 2022, 10, 12548–12563. [Google Scholar] [CrossRef]
  47. Dahouda, M.K.; Joe, I. A Deep-Learned Embedding Technique for Categorical Features Encoding. IEEE Access 2021, 9, 114381–114391. [Google Scholar] [CrossRef]
  48. Huawei Technologies Co., Ltd. (Ed.) Artificial Intelligence Technology; Official Textbooks for Huawei ICT Academy; Huawei ICT Academy: Hangzhou, China; Springer: Singapore, 2021; ISBN 978-981-19-2878-9. [Google Scholar]
  49. Elreedy, D.; Atiya, A.F.; Kamalov, F. A Theoretical Distribution Analysis of Synthetic Minority Oversampling Technique (SMOTE) for Imbalanced Learning. Mach. Learn. 2024, 113, 4903–4923. [Google Scholar] [CrossRef]
  50. Wei, W.; Xu, X.; Hu, G.; Shao, Y.; Wang, Q. Deep Learning and Histogram-Based Grain Size Analysis of Images. Sensors 2024, 24, 4923. [Google Scholar] [CrossRef] [PubMed]
  51. Gong, H.; Li, Y.; Zhang, J.; Zhang, B.; Wang, X. A New Filter Feature Selection Algorithm for Classification Task by Ensembling Pearson Correlation Coefficient and Mutual Information. Eng. Appl. Artif. Intell. 2024, 131, 107865. [Google Scholar] [CrossRef]
  52. Talukdar, W.; Biswas, A. Synergizing Unsupervised and Supervised Learning: A Hybrid Approach for Accurate Natural Language Task Modeling. Int. J. Innov. Sci. Res. Technol. (IJISRT) 2024, 9, 1499–1508. [Google Scholar] [CrossRef]
  53. Sarker, I.H. Machine Learning: Algorithms, Real-World Applications and Research Directions. SN Comput. Sci. 2021, 2, 160. [Google Scholar]
  54. Sun, D.; Xu, J.; Wen, H.; Wang, D. Assessment of Landslide Susceptibility Mapping Based on Bayesian Hyperparameter Optimization: A Comparison between Logistic Regression and Random Forest. Eng. Geol. 2021, 281, 105972. [Google Scholar] [CrossRef]
  55. Zou, X.; Hu, Y.; Tian, Z.; Shen, K. Logistic Regression Model Optimization and Case Analysis. In Proceedings of the IEEE 7th International Conference on Computer Science and Network Technology, ICCSNT 2019, Dalian, China, 19–20 October 2019; pp. 135–139. [Google Scholar] [CrossRef]
  56. Wickramasinghe, I.; Kalutarage, H. Naive Bayes: Applications, Variations and Vulnerabilities: A Review of Literature with Code Snippets for Implementation. Soft Comput 2021, 25, 2277–2293. [Google Scholar] [CrossRef]
  57. Dilki, G.; Deniz Başar, Ö. Istanbul Commerce University Journal of Science-Comparison Study of Distance Measures Using K-Nearest Neighbor Algorithm on Bankruptcy Prediction. Istanb. Commer. Univ. J. Sci. 2020, 19, 224–233. [Google Scholar]
  58. Kemalbay, G.; Alkış, B.N. Prediction of Stock Market Index Movement Direction Using Multinomial Logistic Regression and K-Nearest Neighbor Algorithm. Pamukkale Univ. J. Eng. Sci. 2021, 27, 556–569. [Google Scholar] [CrossRef]
  59. Mailagaha Kumbure, M.; Luukka, P. A Generalized Fuzzy K-Nearest Neighbor Regression Model Based on Minkowski Distance. Granul. Comput. 2022, 7, 657–671. [Google Scholar]
  60. Lubis, A.R.; Prayudani, S.; Al-Khowarizmi; Lase, Y.Y.; Fatmi, Y. Similarity Normalized Euclidean Distance on KNN Method to Classify Image of Skin Cancer. In Proceedings of the 2021 4th International Seminar on Research of Information Technology and Intelligent Systems, ISRITI 2021, Yogyakarta, Indonesia, 16–17 December 2021; pp. 68–73. [Google Scholar] [CrossRef]
  61. Ehsani, R.; Drabløs, F. Robust Distance Measures for KNN Classification of Cancer Data. Cancer Inform. 2020, 19, 1–9. [Google Scholar] [CrossRef]
  62. Mahesh, B. Machine Learning AlgorithmsA Review. Int. J. Sci. Res. (IJSR) 2020, 9, 381–386. [Google Scholar] [CrossRef]
  63. Özlüer Başer, B.; Yangin, M.; Selin Saridaş, E. Classification of Diabetes Disease Using Machine Learning Techniques. J. Inst. Sci. Suleyman Demirel Univ. 2021, 25, 112–120. [Google Scholar] [CrossRef]
  64. Rastogi, V. Machine Learning Algorithms: Overview. Int. J. Adv. Res. Eng. Technol. 2020, 11, 512–517. [Google Scholar]
  65. Tangirala, S. Evaluating the Impact of GINI Index and Information Gain on Classification Using Decision Tree Classifier Algorithm. Int. J. Adv. Comput. Sci. Appl. 2020, 11, 612–619. [Google Scholar] [CrossRef]
  66. Song, Y.Y.; Lu, Y. Decision Tree Methods: Applications for Classification and Prediction. Shanghai Arch. Psychiatry 2015, 27, 130. [Google Scholar] [CrossRef]
  67. Rigatti, S.J. Random Forest. J. Insur. Med. 2017, 47, 31–39. [Google Scholar] [CrossRef]
  68. Yaşlı, G.S. Prediction Study in Healthcare System Using Machine Learning Algorithms. Master’s Thesis, Sakarya University, Ankara, Turkey, 2024. [Google Scholar]
  69. Sathish Kumar, L.; Pandimurugan, V.; Usha, D.; Nageswara Guptha, M.; Hema, M.S. Random Forest Tree Classification Algorithm for Predicating Loan. Mater. Today Proc. 2022, 57, 2216–2222. [Google Scholar] [CrossRef]
  70. Bansal, M.; Goyal, A.; Choudhary, A. A Comparative Analysis of K-Nearest Neighbor, Genetic, Support Vector Machine, Decision Tree, and Long Short Term Memory Algorithms in Machine Learning. Decis. Anal. J. 2022, 3, 100071. [Google Scholar] [CrossRef]
  71. Roy, A.; Chakraborty, S. Support Vector Machine in Structural Reliability Analysis: A Review. Reliab. Eng. Syst. Saf. 2023, 233, 109126. [Google Scholar] [CrossRef]
  72. Liu, Q.J.; Jing, L.H.; Wang, L.M. The Development and Application of Support Vector Machine. J. Phys. Conf. Ser. 2021, 1748, 052006. [Google Scholar] [CrossRef]
  73. Rochim, A.F.; Widyaningrum, K.; Eridani, D. Performance Comparison of Support Vector Machine Kernel Functions in Classifying COVID-19 Sentiment. In Proceedings of the 2021 4th International Seminar on Research of Information Technology and Intelligent Systems, ISRITI 2021, Yogyakarta, Indonesia, 16–17 December 2021; pp. 224–228. [Google Scholar] [CrossRef]
  74. Dhaliwal, S.S.; Al Nahid, A.; Abbas, R. Effective Intrusion Detection System Using XGBoost. Information 2018, 9, 149. [Google Scholar] [CrossRef]
  75. Chen, T.; Guestrin, C. XGBoost: A Scalable Tree Boosting System. In Proceedings of the 22nd ACM SIGKDD International Conference on Knowledge Discovery and Data Mining, San Francisco, CA, USA, 13–17 August 2016; pp. 785–794. [Google Scholar] [CrossRef]
  76. Liew, X.Y.; Hameed, N.; Clos, J. An Investigation of XGBoost-Based Algorithm for Breast Cancer Classification. Mach. Learn. Appl. 2021, 6, 100154. [Google Scholar] [CrossRef]
  77. Sathyanarayanan, S. Confusion Matrix-Based Performance Evaluation Metrics. Afr. J. Biomed. Res. 2024, 27, 4023–4031. [Google Scholar] [CrossRef]
  78. Hoo, Z.H.; Candlish, J.; Teare, D. What Is an ROC Curve? Emerg. Med. J. 2017, 34, 357–359. [Google Scholar] [CrossRef]
  79. Narkhede, S. Understanding AUCROC Curve. Towards Data Sci. 2018, 1, 220–227. [Google Scholar]
  80. Rimal, Y.; Sharma, N.; Alsadoon, A. The Accuracy of Machine Learning Models Relies on Hyperparameter Tuning: Student Result Classification Using Random Forest, Randomized Search, Grid Search, Bayesian, Genetic, and Optuna Algorithms. Multimed. Tools Appl. 2024, 83, 74349–74364. [Google Scholar] [CrossRef]
  81. Zhang, X.; Liu, C.A. Model Averaging Prediction by K-Fold Cross-Validation. J. Econom. 2023, 235, 280–301. [Google Scholar] [CrossRef]
  82. Preuveneers, D.; Tsingenopoulos, I.; Joosen, W. Resource Usage and Performance Trade-Offs for Machine Learning Models in Smart Environments. Sensors 2020, 20, 1176. [Google Scholar] [CrossRef]
  83. Al-Shareeda, M.A.; Alsadhan, A.A.; Qasim, H.H.; Manickam, S. The Fog Computing for Internet of Things: Review, Characteristics and Challenges, and Open Issues. Bull. Electr. Eng. Inform. 2024, 13, 1080–1089. [Google Scholar] [CrossRef]
  84. Sarkohaki, F.; Sharifi, M. Service Placement in Fog–Cloud Computing Environments: A Comprehensive Literature Review. J. Supercomput. 2024, 80, 17790–17822. [Google Scholar] [CrossRef]
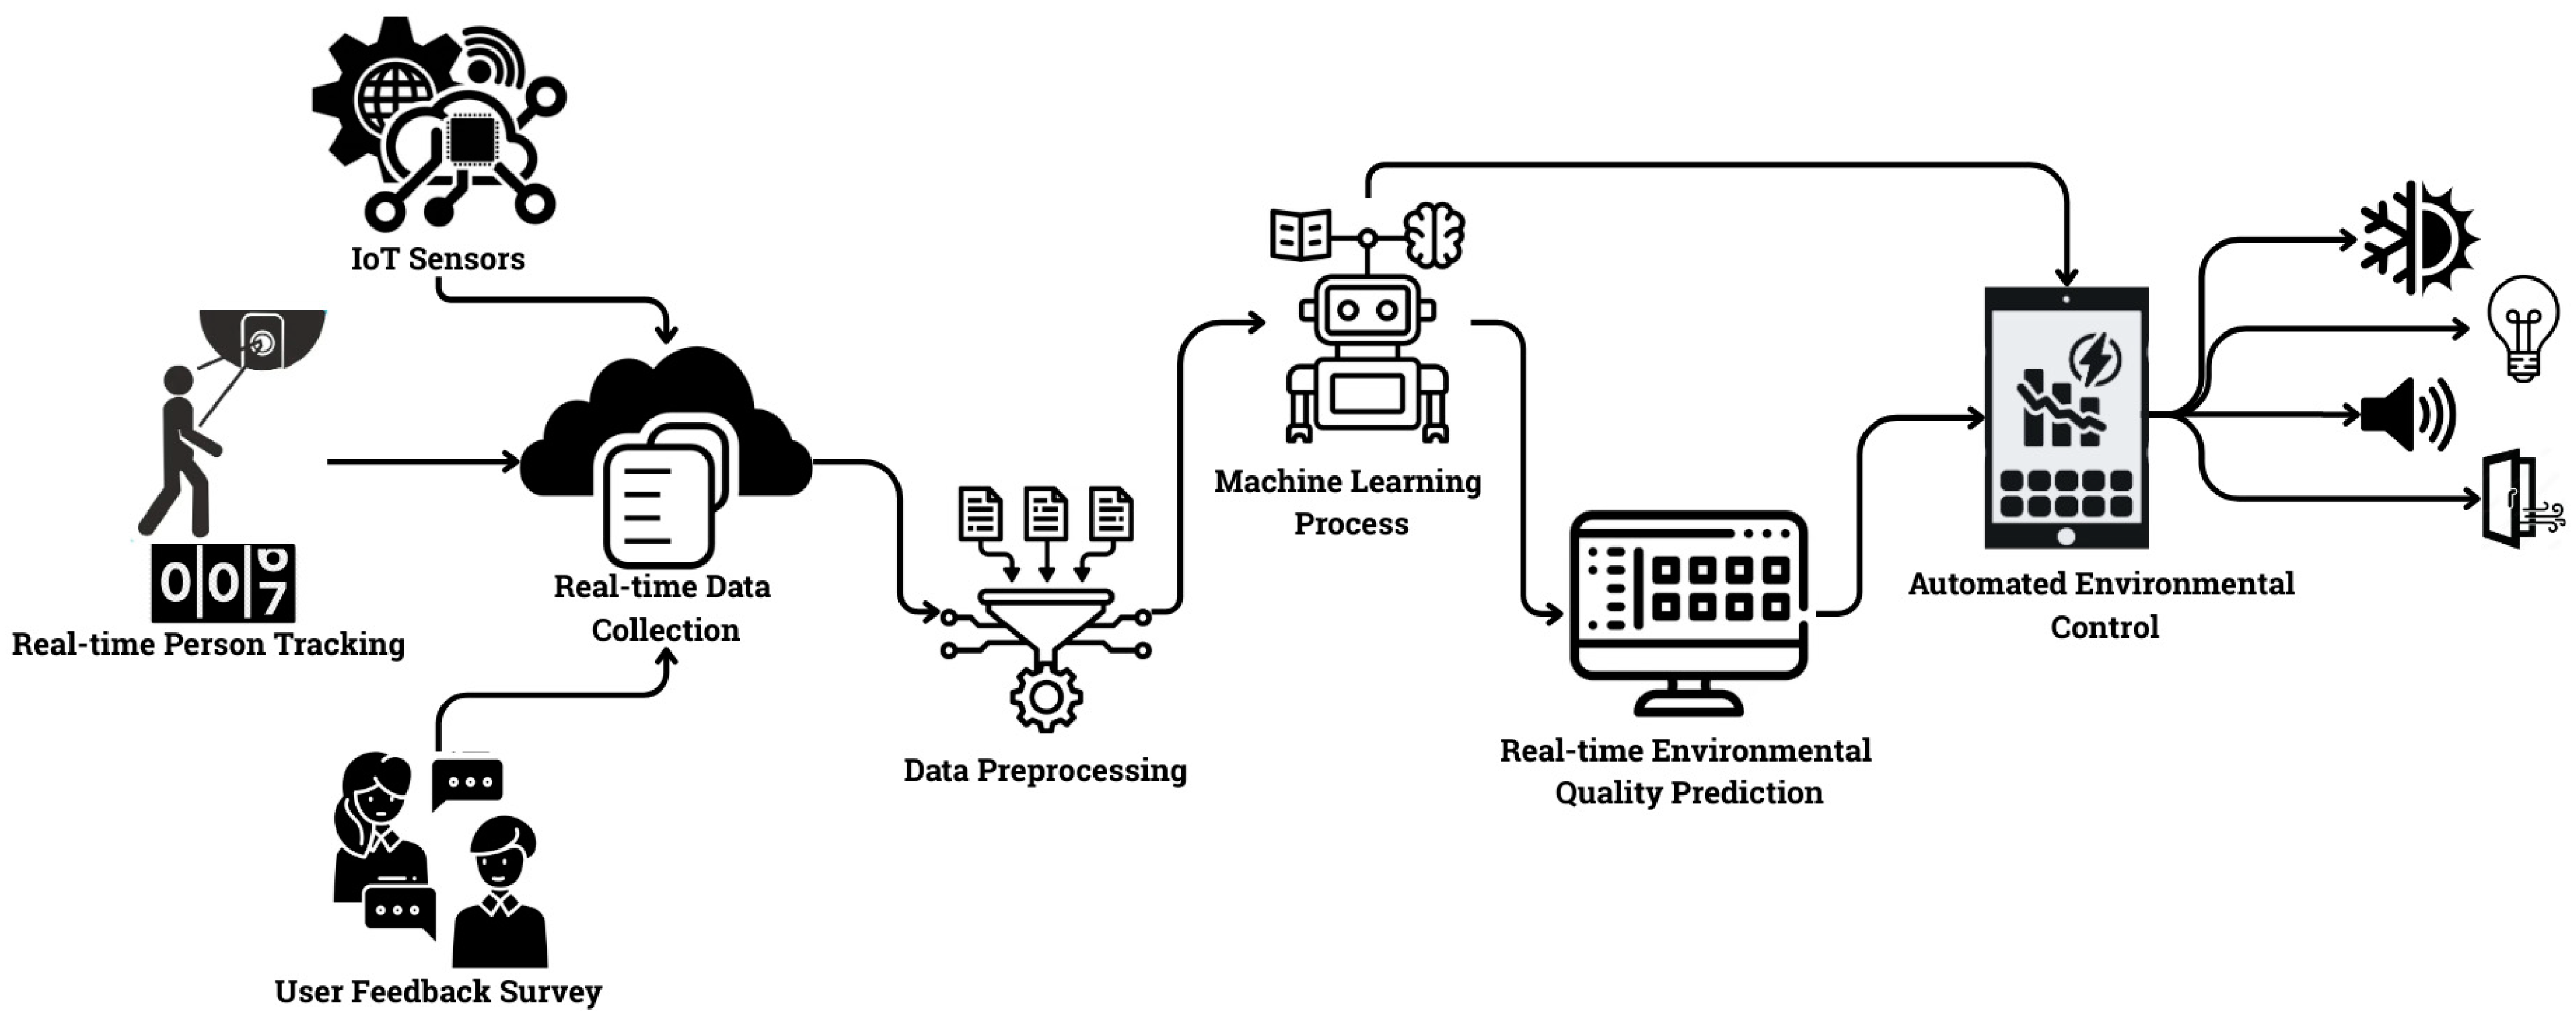
Figure 1. Visual representation of environmental data collection, processing, and analysis process.
Applsci 15 03792 g001
Figure 2. Visual process of dataset preparation by integrating environmental sensor data and user feedback.
Applsci 15 03792 g002
Figure 3. Environmental-parameter-based general environmental quality assessment interface.
Applsci 15 03792 g003
Figure 4. Proposed fog–cloud architecture for smart campus services in a multi-campus and multi-building environment.
Applsci 15 03792 g004
Figure 5. Class distribution of the original dataset.
Applsci 15 03792 g005
Figure 6. Class distribution of the dataset augmented with the SMOTE method.
Applsci 15 03792 g006
Figure 7. ROC curve performance obtained with all sensor data for the KNN algorithm.
Applsci 15 03792 g007
Figure 8. Visualization of the confusion matrix obtained with all sensor data for the KNNs algorithm.
Applsci 15 03792 g008
Table 1. Comparison of environmental factors and methods in related studies.
StudyEnvironmental Factors UsedData Collection
Methods
Machine Learning/
Analysis Methods
Contributions and InnovationsWhat is the Added
Value of Our Paper?
[21]NoiseSurveys and observations-Highlights the negative effects of noise on academic performance.By analyzing noise and other environmental factors together, more comprehensive results are presented.
[19]IAQ (indoor air quality), light, and acousticsPhysical measurements and surveys-Examined the impact of environmental factors in the library on user experience.Combines environmental factors in the library with user feedback and allows more efficient monitoring through IoT sensors.
[22]Temperature, humidity, CO2, noise, and lightEnvironmental sensors and portable devices-Provides suggestions for monitoring and optimizing various environmental factors.This study analyzes sensor data with machine learning algorithms and improves environmental factors through more detailed decision support systems.
[23]Acoustic, visual, and thermal comfortPortable devices-Proposes improvements to comfort levels in library environments.More personalized environmental improvements are achieved using IoT-enabled sensors and user feedback.
[24]IAQ (indoor air quality)Environmental sensors-Investigated the impact of the IAQ on student concentration.IAQ optimization can be conducted dynamically and instantaneously with sensor data and machine learning.
[25]IAQ, light, and acousticsSurveys and physical measurements-Evaluated the experiences of students and academic staff regarding the indoor environmental quality (IEQ) in library environments.In this study, more precise environmental control is provided, optimized through student and staff feedback.
[26]Service accessibility, interior design, and environmental factorsSurveys and observationsRegression analysisInvestigated the effect of environmental factors in libraries on user satisfaction.With IoT- and AI-based solutions, the continuous monitoring of environmental factors and data-driven decision support systems are proposed.
[27]Air quality and noiseSensors and AI-based dataAISuggested ways to optimize air quality and noise levels.Real-time data analysis enables more effective improvement in environmental conditions.
[28]IAQ, temperature, and acousticsSurveys and sensors-Investigated the priorities of library users regarding environmental factors.This study offers more flexible and dynamic environmental optimization through user feedback.
[29]Temperature, light, acoustics, and IAQSurveys and observations-Analyzed the impact of poor environmental conditions on education and learning.Continuous monitoring with IoT sensors allows faster and more targeted environmental improvements.
[30]Temperature, noise, and lightSensors and observations-Tested the environmental factors affecting learning efficiency.Sensor data and machine learning facilitate rapid adaptation to environmental conditions.
[31]IAQ and noiseIoT sensors-Proposed IoT-based solutions for IAQ and noise management.Real-time feedback is provided with IoT- and AI-based environmental monitoring systems.
[32]IAQ and thermal comfortSurveys and sensors-Investigated how IoT technologies can be more effectively utilized in library environments.In this study, the continuous optimization of environmental data is ensured with IoT and AI integration.
[33]Thermal comfortSensors and AIMachine learning (Extra Trees classifier)Used IoT and machine learning for personal thermal comfort modeling.Environmental factors are dynamically optimized according to personal preferences.
[34]IAQSensors and microcontrollersAIDeveloped an IAQ assessment system.Integration of IAQ data with user feedback and environmental factors provides more comprehensive monitoring.
[35]IAQBiometric data and IoT sensorsAIConducted IAQ analysis with biometric data.This study enables real-time environmental monitoring using a broader sensor network integrated with IoT.
[36]CO2, PM, NOx, VOCs, and water qualityIoT sensorsMachine learningDeveloped IoT-based environmental monitoring systems.Real-time data analysis and machine learning enable more efficient management of environmental data.
[37]Environmental factorsIoT devices-Proposed IoT solutions for library infrastructure and security.More detailed data analysis focused on infrastructure management and user satisfaction is achieved with IoT.
[38]Environmental factorsIoT devices-Increased user satisfaction by integrating IoT into library infrastructure.By combining IoT-enabled environmental optimization and security solutions, more secure and efficient library environments are provided.
[39]Environmental factorsIoT devices-Introduced IoT and AI solutions for “smart libraries”.Continuous optimization of environmental factors is achieved with AI and IoT integration, enhancing the user experience.
[40]Environmental factorsSensors and IoT devices-Ensured local data processing with cloud and fog computing integration.In this study, environmental data are processed and optimized more quickly through IoT and fog computing integration.
[41]Environmental factorsIoT devices-Local data processing was enabled using fog computing.Machine learning- and AI-based solutions are provided for faster processing of environmental factors.
[42]Environmental factorsIoT devices-Overcame data transfer bottlenecks in IoT devices with fog computing.This study ensures faster data flow through IoT devices and AI-based solutions for optimizing environmental data.
[43]Air quality (AQI), temperature, humidity, and Gas SensorsIoT sensors and data transmission via LPWAN (LoRa)Seq2Seq GRU Attention, Post-Training Quantization (PTQ) Model OptimizationProvides optimized real-time air quality prediction with fog computing, with model reduction for operation on low-cost devices.This study integrates not only air quality but also light, sound, temperature, and user feedback to achieve a more comprehensive optimization. Additionally, it provides actionable, user-experience-oriented recommendations rather than relying solely on predictive models.
[44]Wastewater Pumping (Fat, Grease, Solid Waste Accumulation), Water Level, Flow Rate, and Surface VorticesCamera-based Imaging System and local processing via edge AIDeep learning-based Computer Vision Algorithms (Image Analysis, Shape Change, Flow Dynamics)Optimizes maintenance planning for wastewater stations, offering low-cost and long-term data collection.This study combines multiple environmental factors (light, sound, temperature, humidity, air quality, user feedback) for real-time optimization and a decision support system that enhances user experience. Additionally, the fog–cloud architecture ensures data security and efficient data transfer.
[45]IoT devices, Network Load Reduction, and Resource-Intensive FunctionsIoT devices, sensor data, and data communicationMachine learning (object detection, text detection, algorithms)Reduces network load with fog computing, enabling advanced tasks like object and text detection via machine learning.It not only reduces network load but also combines a wide range of environmental factors with user feedback to provide deeper, real-time optimizations. The system dynamically improves both the physical environment and user experience, offering real-time recommendations for more effective decision support.
[46]Health data (e.g., Heart Disease)Edge Computing Devices and Deep Learning TechnologyAutomated monitoring and deep learning-based analysisFocuses on solving device latency and high-data-volume issues in health systems.Unlike this study, this study goes beyond health data by integrating various environmental factors such as air quality, light, sound, temperature, humidity, and user feedback. This offers real-time, dynamic, and multi-dimensional data analysis, enhancing not only system performance but also personalized recommendations to actively improve user experience, especially in complex environments like libraries with dynamic user interactions.
Table 2. Distribution of sensor data by class.
Class 1Class 2Class 3Class 4Class 5Total
Sound sensor value (dB)141817881504216614388314
Light sensor value (lux)124516971660229617418639
Temperature sensor value (°C)105414691465166214047054
Humidity sensor value (%)105414691465166214047054
CO2 sensor value (ppm)150217551730253417139234
eCO2 sensor value (ppm)150217551730253417139234
TVOC sensor value (ppb)150217551730253417139234
Crowd sensor value (Count)1942217516972974154610,334
Table 3. Hyperparameters of the machine learning algorithms used and the values determined by GridSearch.
AlgorithmP1P2P3P4P5P6Combinations
Logistic
Regression
ParameterCclass_weightmax_
iterations
SolverTolerance 40
Value3Balanced5000liblinear0.0001
Naive BayesParameterPriorsVar_
smoothing
450
ValueAuto20
Random
Forest
ParameterCriterionn_estimatorsMax_depthMin_
samples_leaf
Min_samples
split
1600
ValueGini3003012
Decision TreesParameterCriterionClass_weightMax_depthMin_samples leafMin_samples
split
Splitter640
ValueGiniBalanced3012Best
KNNsParameterAlgorithmLead_sizeMetricN_neighborsPWeights2592
ValueAuto20Manhattan31Distance
SVMParameterCGammaKernelDegree 56
Value1000010Rbf2
XGBoostParameterLearning rateMax_depthN_estimatorSubsampleGammaReg_alpha729
Value0.0871300.90.150.7
Table 4. Comparison of performance metrics of sound training algorithms.
Sound Training ModelsF1 Score ↑Precision ↑Recall ↑Training Time (s) ↓Test Time
(s) ↓
Memory Usage (MB) ↓
KNNs0.9610.9620.961109.1870.1492.621
SVM0.6620.6620.664323.3644.8502.168
Random Forest0.9560.9570.9554125.980.13745.102
Decision Trees0.9570.9570.9572777.850.00532.883
XGBoost0.6820.6950.67710.2120.05466.902
Naive Bayes0.6180.6280.6159.8980.0175.297
Logistic Regression0.6580.6560.667307.7330.3507.000
Table 5. Comparison of performance metrics of light training algorithms.
Light Training ModelsF1 Score ↑Precision ↑Recall ↑Training Time (s) ↓Test Time
(s) ↓
Memory Usage (MB) ↓
KNNs0.74520.7430.74914,327.10.06169.664
SVM0.6160.6280.62619,487.86.81581.918
Random Forest0.74570.7440.7485263.30.22539.305
Decision Trees0.7430.6670.75130.6470.00614.043
XGBoost0.6640.6670.6712.5840.03815.465
Naive Bayes0.6130.6260.61512.9550.0102.891
Logistic Regression0.6220.6260.63524.6230.1621.945
Table 6. Comparison of performance metrics of temperature training algorithms.
Temperature Training ModelsF1 Score ↑Precision ↑Recall ↑Training Time (s) ↓Test Time
(s) ↓
Memory Usage (MB) ↓
KNNs0.9810.9820.9813696.60.06731.711
SVM0.5940.5950.605249.2404.5451.820
Random Forest0.9810.9810.98013,725.80.11346.973
Decision Trees0.9790.9790.979507.1940.01612.316
XGBoost0.6070.6080.61230.6150.04967.668
Naive Bayes0.4150.4590.44219.2170.0082.609
Logistic Regression0.5520.5640.563125.520.1503.871
Table 7. Comparison of performance metrics of ventilation training algorithms.
Ventilation Training ModelsF1 Score ↑Precision ↑Recall ↑Training Time (s) ↓Test Time
(s) ↓
Memory Usage (MB) ↓
KNNs0.8940.8950.894758.950.06311.820
SVM0.6590.6650.668452.186.9903.238
Random Forest0.8990.9010.89910,182.20.28118.160
Decision Trees0.8950.8970.897737.320.00510.730
XGBoost0.7230.7270.72130.6250.06870.602
Naive Bayes0.4240.4470.44936.7780.0055.902
Logistic Regression0.5600.5690.57579.8240.1563.160
Table 8. Comparison of performance metrics of crowd training algorithms.
Crowd Training ModelsF1 Score ↑Precision ↑Recall ↑Training Time (s) ↓Test Time
(s) ↓
Memory Usage (MB) ↓
KNNs0.4020.4020.41194.9800.0155.629
SVM0.2680.3210.326725.27111.5955.352
Random Forest0.4060.4120.4221143.80.1879.668
Decision Trees0.3960.4120.435141.590.0056.629
XGBoost0.3880.4200.400279.930.11186.316
Naive Bayes0.2430.2330.31653.5520.0132.004
Logistic Regression0.2760.2560.31169.5520.2145.297
Table 9. Comparison of performance metrics of general evaluation training algorithms.
General Evaluation Training ModelsF1 Score ↑Precision ↑Recall ↑Training Time (s) ↓Test Time
(s) ↓
Memory Usage (MB) ↓
KNNs0.99040.99060.99011360.90.07112.332
SVM0.9450.9510.9413146.96.5102.902
Random Forest0.99020.99050.99067309.20.42221.762
Decision Trees0.9840.9840.984330.4700.0058.785
XGBoost0.7410.7500.74320.6020.15271.059
Naive Bayes0.4290.4340.45036.1600.0045.992
Logistic Regression0.4930.4910.515300.320.1551.215
Disclaimer/Publisher’s Note: The statements, opinions and data contained in all publications are solely those of the individual author(s) and contributor(s) and not of MDPI and/or the editor(s). MDPI and/or the editor(s) disclaim responsibility for any injury to people or property resulting from any ideas, methods, instructions or products referred to in the content.