Abstract
In this study, Fe3O4@SiO2@TiO2 (FS-FT (0 g)) photocatalysts, featuring a magnetic core–shell structure, and Fe-doped Fe3O4@SiO2@Fe-TiO2 (FS-FT (x g)) photocatalysts, were fabricated via the sol–gel method. Structural and compositional analyses of the processed samples were systematically conducted through X-ray diffraction (XRD), transmission electron microscopy (TEM) with selected area electron diffraction (SAED), surface-sensitive X-ray photoelectron spectroscopy (XPS), and optical property assessment via UV-Vis diffuse reflectance spectroscopy (UV-DRS). The results show that TiO2 on the outer layer of FS-FT (0 g) and FS-FT (x g) has an anatase structure, and that Fe is doped into FS-FT (x g). The photodegradation of methyl orange (MO) using FS-FT (0 g) and FS-FT (x g) with various Fe doping levels was evaluated in both pure MO (C0 = 10 mg/L) and MO-Na2SO4-blended solutions. Under irradiation with high-pressure mercury lamps, the removal rates of MO using FS-FT (0 g) and FS-FT (0.36 g) in pure MO solution reached 90.25% and 99% at 25 min, respectively, which indicates that FS-FT (0.36 g) can enhance photocatalytic performance. The removal rates of MO using FS-FT (0 g) and FS-FT (0.36 g) in MO-Na2SO4-blended solution (C0 = 10 mg/L, CNa2SO4 = 12.5 g/L) reached 92.38% and 97.16% at 25 min, respectively. The removal rate of MO using FS-FT (0.36 g) decreased in MO-Na2SO4-blended solution in the previous 25 min, which indicates that Na2SO4 can inhibit degradation using FS-FT (0.36 g). The degradation experiments of MO-Na2SO4-blended solutions with different concentrations of Na2SO4 using FS-FT (0.36 g) showed that as the concentration of Na2SO4 increases, the inhibitory effect becomes more pronounced. Recovery and recycling experiments confirmed that the photocatalyst exhibited robust degradation performance over multiple cycles. Kinetic analysis of the photocatalytic data, based on a first-order model, was conducted to explore the underlying degradation principles.
1. Introduction
The fast-paced development of scientific and industrial innovations has led to an increased environmental discharge of wastewater and hazardous materials from industrial facilities [1,2]. Particularly, dye wastewater poses significant treatment challenges due to its persistent chromaticity and complex chemical composition, resulting in elevated treatment costs. This necessitates the development of cost-effective treatment technologies to address these challenges effectively [3,4]. To address these challenges, researchers have proposed strategies encompassing physical, chemical, and semiconductor-based photocatalytic approaches. Semiconductor photocatalytic technology offers distinct advantages over physical and chemical methods, including simple fabrication and the absence of secondary pollutants during the reaction process [5,6]. A. Fujishima and K. Honda initially suggested the concept of photocatalysis. Under illumination, the TiO2 and Pt electrodes immersed in an aqueous medium induced photocatalytic water splitting, resulting in the successful generation of oxygen and hydrogen gases [7]. Craey et al. demonstrated the photodegradation of polychlorinated biphenyls and haloalkanes using TiO2 as a photocatalyst [8]. Purden et al. investigated the use of TiO2 for the removal of trichloroethylene [9]. The proven effectiveness of photocatalytic processes in pollutant degradation establishes this technology as a strategic focus area, with ongoing research being imperative to advance its real-world applicability [10]. Among various semiconductor-based photocatalysts, TiO2 has emerged as the most extensively studied material, because of its unique combination of advantageous properties, including exceptional structural stability, non-harmfulness, cost-effectiveness, and remarkable photocatalytic activity [11,12]. However, TiO2 photocatalysis is fundamentally limited by three major technical challenges. The primary limitation stems from its high energy gap (3.2 eV), which restricts photoactivation to ultraviolet wavelengths (λ < 387 nm) [13]. A secondary limitation involves the quick recombination of light-generated electron–hole pairs, resulting in a diminished quantum yield and consequently reduced photocatalytic efficiency [14]. Furthermore, practical applications are hindered by the technical difficulties associated with post-treatment separation and the recovery of TiO2 particulate matter from aqueous systems [15]. Two predominant approaches for augmenting TiO2 photocatalysis emerge: lattice modification through controlled dopant incorporation and interfacial engineering by constructing hybrid composites with complementary semiconductor materials. The strategic incorporation of doped metal ions into the TiO2 crystal structure induces the formation of charge carrier traps, thereby promoting electron mobility. Simultaneously, these dopants create crystalline lattice distortions that generate oxygen vacancy defects, which act as recombination barriers to prolong charge carrier lifetimes. This dual mechanism synergistically increases reactive oxygen species production, ultimately elevating the quantum yield of photocatalytic reactions. To achieve the aim of recovery and prevent secondary pollution, a photocatalyst with magnetic nanoparticles (Fe3O4) as the magnetic nucleus, SiO2 as the protective layer, and the core–shell structure of TiO2 on the surface can be prepared.
In this study, multilayer core–shell photocatalysts with Fe-doped TiO2 were designed, and the magnetic FS-FT (0 g) and FS-FT (x g) composites were synthesized and characterized using XRD, TEM, UV-VIS-NIR spectroscopy, DRS, and XPS. Photocatalytic degradation experiments were implemented using pure methyl orange (MO) and MO-Na2SO4-blended solutions as model pollutants, and the underlying principles of photodegradation were investigated.
2. Experimental
2.1. Materials and Methods
All chemical reagents, including anhydrous ethanol (AR), FeCl3·6H2O (AR), sodium acetate (AR), ammonia (NH4OH, 25–28%, AR), tetraethyl orthosilicate (AR), Na2SO4 (AR), and methyl orange (MO, AR), were sourced from Sinopharm Chemical Reagent Co., Ltd., Beijing, China. Tetrabutyl titanate (TBOT, AR) and polyethylene glycol-4000 (AR) were sourced from McLean Biochemical Technology Co., Ltd., Shanghai, China. The high-pressure Hg lamp (GGZ300, Shanghai Jiguang, Shanghai, China) had a power rating of 300 W.
2.2. Preparation of Nanocomposites
Fe3O4 was fabricated using a solvothermal approach. First, 2.7 g of FeCl3·6H2O was dissolved in 80 mL of ethylene glycol within a beaker, and stirred magnetically until completely dissolved. Subsequently, polyethylene glycol-4000 (2 g) was added to the solution, followed by continuous magnetic stirring until complete dissolution. Finally, sodium acetate (7.2 g) was added to the beaker and magnetically stirred until complete dissolution. Once the solution was completely homogenized, it was transferred into the reaction kettle and maintained at a temperature of 180 °C for 10 h. Once the reaction was complete, the product was cleaned three times using ethanol and subsequently transferred to a vacuum desiccator, where it was maintained at 40 °C until fully dried [16].
Fe3O4@SiO2 was fabricated via the sol–gel method. Fe3O4 powder (0.2 g) was dispersed in anhydrous ethanol (80 mL) via 30 min ultrasonication to obtain a homogeneous suspension. Subsequently, 20 mL of ultrapure water was added to the aforementioned suspension, followed by the slow dropwise addition of 5 mL of ammonium hydroxide to the mixture. Ultrasonic treatment and mechanical stirring were performed on the suspension separately for 30 min. Thereafter, 4 mL of tetraethyl orthosilicate was gradually added to the suspension and mechanical stirring of the mixture continued for 6 h. Ultimately, the solution was subjected to magnetic separation using a permanent magnet, the supernatant was discarded, the magnetic solution was cleaned with absolute ethanol three times, and the washed product was transferred to a vacuum desiccator and heated at 40 °C until dry [16].
Fe3O4@SiO2@TiO2(FS-FT (0 g)) was fabricated using the sol–gel method. TBOT (7 mL) was added dropwise to anhydrous ethanol (120 mL) followed by 10 min ultrasonication to achieve dispersion. Subsequently, Fe3O4@SiO2 (0.2 g) was added to the suspension, followed by 20 min of additional ultrasonication. Then, the beaker containing the suspension was placed into a water bath that had been pre-warmed to 40 °C and the suspension was mixed using mechanical stirring for 8 h. Upon the completion of the reaction, the powder was magnetically separated from the solution using a magnet. The isolated powder was cleaned three times with ethanol and subsequently dried in a vacuum desiccator at 40 °C for 10 h. The dried FS-FT (0 g) was subjected to argon-protected annealing at 450 °C for 3 h in a tube furnace [16].
Fe3O4@SiO2@Fe-TiO2(FS-FT (0.18–0.45 g)), where ‘0.18–0.45 g’ represents the amount of Fe source FeCl3·6H2O, which is 0.18, 0.27, 0.36, and 0.45 g, was fabricated using the sol–gel method. The FS-FT samples with different Fe contents (0.18–0.45 g) can be prepared by simply adjusting the mass of FeCl3·6H2O added, and the sample preparation process remains unchanged, taking the doping amount of 0.36 g as an illustration. Firstly, the mixed solution A (TBOT (7 mL) was added dropwise to absolute ethanol (120 mL) and dispersed via ultrasonication for 10 min. Subsequently, Fe3O4@SiO2 (0.27 g) was introduced into the resulting solution and further dispersed via ultrasonication for 15 min, and solution B (FeCl3·6H2O (0.36 g) and ultrapure water (2 mL) were incorporated into anhydrous ethanol (20 mL). Solution B was combined drop by drop with solution A. The mixed solution was mechanically stirred for 7 h. Magnetic nanocomposites were separated via magnet-assisted separation. The harvested gray–black pellets were cleaned three times using absolute ethanol and dried for 10 h in a vacuum desiccator at 60 °C. Finally, they were annealed in an annealing furnace with argon as the shielding gas, and at 450 °C for 3 h.
2.3. Characterization
The concentration of methyl orange (MO) solution was measured using TU-1950, Beijing China. The maximum absorption wavelength of MO is at 464 nm. XRD could be used to analyze the crystal structures of the samples (XRD: Empyrean, Panaco, Almelo, The Netherlands). Then, 2θ scans were performed over a range from 20° to 80°, at intervals of 0.06 and a scanning speed of 4°/min. The optical absorption properties were characterized through DRS using a Shimadzu UV-2600, Shimadzu, Japan spectrophotometer fitted with an integrating sphere assembly. Spectral acquisition was performed from 200 to 800 nm under ambient conditions, with the spectral resolution set at 1 nm. All measurements were calibrated against the barium sulfate reference standard, employing Kubelka–Munk transformation for subsequent Tauc plot analysis. The XPS data were analyzed with reference to the C 1s binding energy (284.8 eV) (Thermo SCIENTIFIC ESCALAB 250Xi, Waltham, MA, USA).
2.4. Photodynamic Activity Test
The concentration of MO solution was 10 mg/L (C0 = 10 mg/L). The concentration of MO in MO-Na2SO4-blended solution was 10 mg/L (C0 = 10 mg/L), and the concentration of Na2SO4 in MO-Na2SO4-blended solution was 10.0, 12.5, 15.0, and 17.5 g/L, respectively (CNa2SO4 = 10.0 g/L, CNa2SO4 = 12.5 g/L, CNa2SO4 = 15.0 g/L, and CNa2SO4 = 17.5 g/L). The photocatalyst (20 mg) was dispersed into either MO solution (10 mL) or MO-Na2SO4-blended solution (10 mL). The system was then placed in the dark chamber of the photocatalytic reactor for 20 min, in order to build adsorption–desorption equalization for photocatalytic testing. The dye degradation rate η was calculated as follows:
where C0 (mg L−1) represents the original concentration and Ct (mg L−1) represents MO concentration at time t (min).
3. Results and Discussion
The XRD patterns of Fe3O4, TiO2, Fe3O4@SiO2, and FS-FT (0 g) are displayed in Figure 1a. The diffraction peak position of TiO2 on the outer layer of FS-FT (0 g) is the same as that of TiO2. According to JCPDS 65-3369, the peaks of FS-FT (0 g) are observed at 25.2°, 38.7°, 48°, 54°, and 55.14°, which are attributed to the (101), (004), (200), (105), (211), and (204) crystal planes of TiO2, respectively. The findings reveal that TiO2 displays an anatase structure [17]. According to JCPDS 02-0387, the peaks of Fe3O4 are observed at 30.1°, 35.5°, 43.1°, 53.4°, 56.9°, and 62.5°. These peaks are attributed to the (220), (311), (400), (422), (511), and (440) planes of the magnetite phase, respectively [18]. The XRD pattern of Fe3O4@SiO2 exhibits diffraction peaks identical to those of Fe3O4. In Figure 1a, the peak absorption of Fe3O4 in FS-FT (0 g) and Fe3O4@SiO2 is lower than that of Fe3O4, due to Fe3O4 being coated in the inner layer of FS-FT (0 g) and Fe3O4@SiO2. Figure 1b shows the XRD patterns of FS-FT (0.18–0.45 g). The peaks of TiO2 appear at 25.3°, 39.2°, 48.5°, and 55.3°, which relate to the (101), (004), (200), and (211) crystal planes, respectively (JCPDS No. 65-3369). In comparison with the peak intensity and the FWHM of FS-FT (0 g), the intensity of FS-FT (0.18–0.45 g) decreases and the FWHM increases; especially at 25.3°, the change is very obvious. The characteristic peaks of the XRD represent the number of crystal faces aligned along the same direction, and Fe atoms enter into the lattice arrangement of TiO2. The substitution of part of Ti4+ by Fe3+ caused a change in the crystal morphology and resulted in a reduction in the number of crystal planes [19]. It is also apparent that the peaks of TiO2 (101) move to the right; the observed structural modification originates from the ionic radius discrepancy between Fe3+ (0.055 nm) and Ti4+ (0.061 nm), where smaller Fe3+ ions induce lattice contraction through substitutional doping in the TiO2 matrix [19]. The substitution of Fe3+ ions introduces defect states within the bandgap of TiO2, thus affecting the peak intensity. The characteristic diffraction peaks of the (311), (440), and (533) crystal planes of Fe3O4 in the core of Fe3O4@SiO2@Fe-TiO2 appear, thus indicating that Fe3O4@SiO2@Fe-TiO2 can provide magnetic solid responsiveness for subsequent cycling experiments [20].
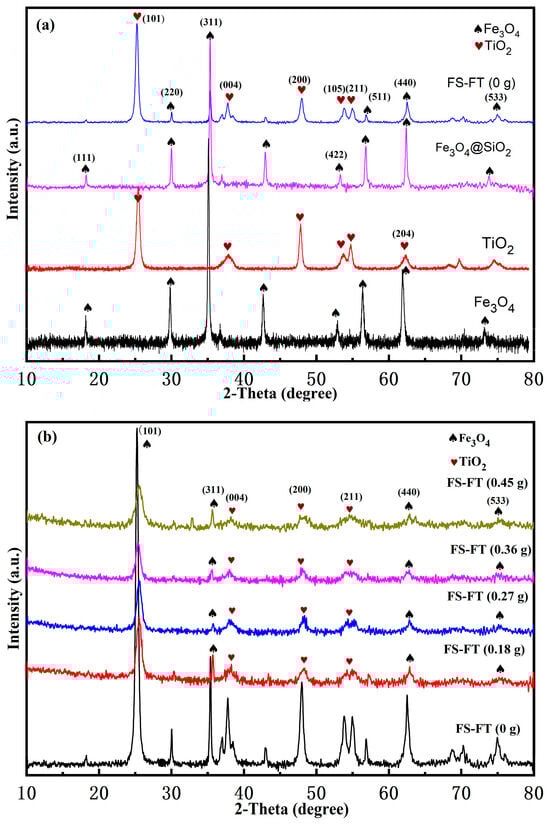
Figure 1.
XRD patterns of (a) FS-FT (0 g), Fe3O4@SiO2, TiO2, and Fe3O4; (b) FS-FT (0–0.45 g).
The TEM of FS-FT (0 g) and FS-FT (0.36 g) are shown in Figure 2a,b. It is evident that the samples exhibit a distinct core–shell morphology. As illustrated in Figure 2c, the HRTEM image of FS-FT (0 g) reveals the interplanar distance of 0.355 nm, attributable to the (101) plane of TiO2, and the distance between the crystal planes is 0.176 nm, related to the (422) plane of Fe3O4 [21]. Figure 2d shows the HRTEM image of FS-FT (0.36 g), where the crystal plane distance is 0.354 nm. It can be attributed to the (101) plane of TiO2, and 0.253 nm can be attributed to the (311) plane of Fe3O4. The interplanar distance of the (101) plane of TiO2 in FS-FT (0.36 g) is slightly smaller than that in FS-FT (0 g); the reason for this may be that the scale of Fe3+ in the lattice arrangement is more minor than that of Ti4+, or it may be caused by a measurement error. Figure 2e,f show the SAED patterns, the (200) distances between the crystal planes of FS-FT (0 g) and FS-FT (0.36 g) are 0.186 nm and 0.179 nm, respectively. The (200) interplanar spacing of FS-FT (0.36 g) is smaller than that of FS-FT (0 g), the reason for this being that the ionic radius of Fe3+ within the lattice frame is smaller than that of Ti4+ [22]. These findings align with the XRD data.
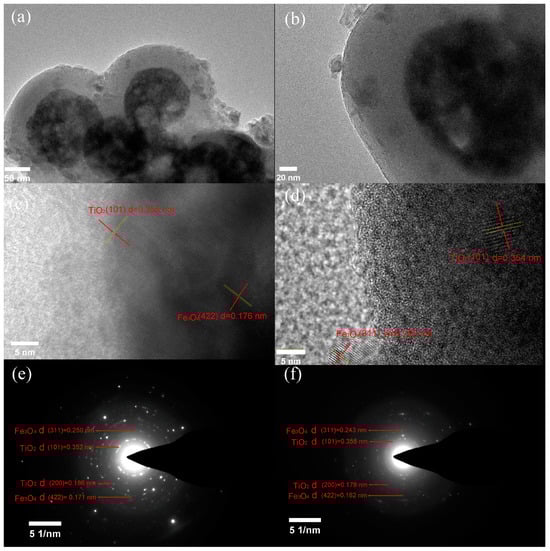
Figure 2.
TEM images: (a) FS-FT (0 g), (b) FS-FT (0.36 g); HRTEM images: (c) FS-FT (0 g), (d) FS-FT (0.36 g); and SAED images: (e) FS-FT (0 g), (f) FS-FT (0.36 g).
The UV-VIS DRS of FS-FT is depicted in Figure 3a. The samples exhibit high absorption in visible and ultraviolet regions. The optical band gap (Eg) of the samples was derived from the Tauc plot (F(R)hv)2 versus hv, as outlined in Equation (2).
where α represents the absorption coefficient, C is a constant, h denotes the photon energy, and Eg refers to the band gap.
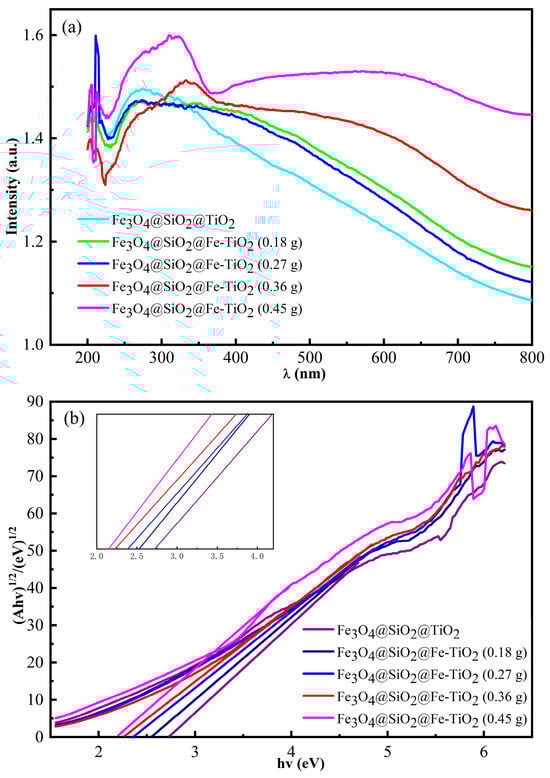
Figure 3.
UV-VIS DRS of (a) FS-FT (0–0.45 g); Tauc plots for (b) FS-FT (0–0.45 g).
In Figure 3b, the Eg of FS-FT (0 g), FS-FT (0.18 g), FS-FT (0.27 g), FS-FT (0.36 g), and FS-FT (0.45 g) is 2.73, 2.53, 2.39, 2.24, and 2.18 eV, respectively. The data show that the doping of Fe3+ can change the energy band gap to varying degrees, and the reason for this may be that the doping of Fe3+ leads to hybridization between the d-orbitals of Ti4+ and Fe3+ in the nano-TiO2, thereby reducing the energy band gap [23,24,25].
In photocatalytic experiments under the same conditions, the photocatalytic performance of the photocatalyst was analyzed by monitoring the degradation of the MO solution. First, 0.02 g of FS-FT with different levels of iron doping was placed in 10 mL of MO solution (C0 = 10 mg/L) in a dark room until it reached the absorption–desorption equilibrium. The snap values of MO using FS-FT (0, 0.18, 0.27, 0.36, and 0.45 g) were 12.12%, 11.81%, 12.12%, 12.65%, and 11.83%, respectively. Figure 4a displays the UV-VIS spectra of MO prior to and after photodegradation in pure MO solution with FS-FT (0, 0.18, 0.27, 0.36, and 0.45 g). The photodegradation rates were 90.25%, 81.37%, 88.67%, 99%, and 79.36%, respectively. The results indicated that FS-FT (0.36 g) exhibited the highest photodegradation efficiency. Figure 4b illustrates the UV-VIS spectra of C0 = 10 mg/L MO at different irradiation times during the photodegradation of MO using FS-FT (0.36 g). Figure 4c shows the degradation rates of MO solution using FS-FT (0–0.45 g). The data demonstrate that the degradation rate of MO solution using FS-FT (0.36 g) can reach 99% in 25 min. The results indicate that appropriate metal doping can boost the photocatalytic performance of TiO2. When the concentration of doped Fe3+ is too much, it will transform Fe3+ from a capturing center into a recombination center, enhancing the re-association of charge carriers and suppressing the photodegradation of acid dyes, leading to a decreased degradation efficiency [17].
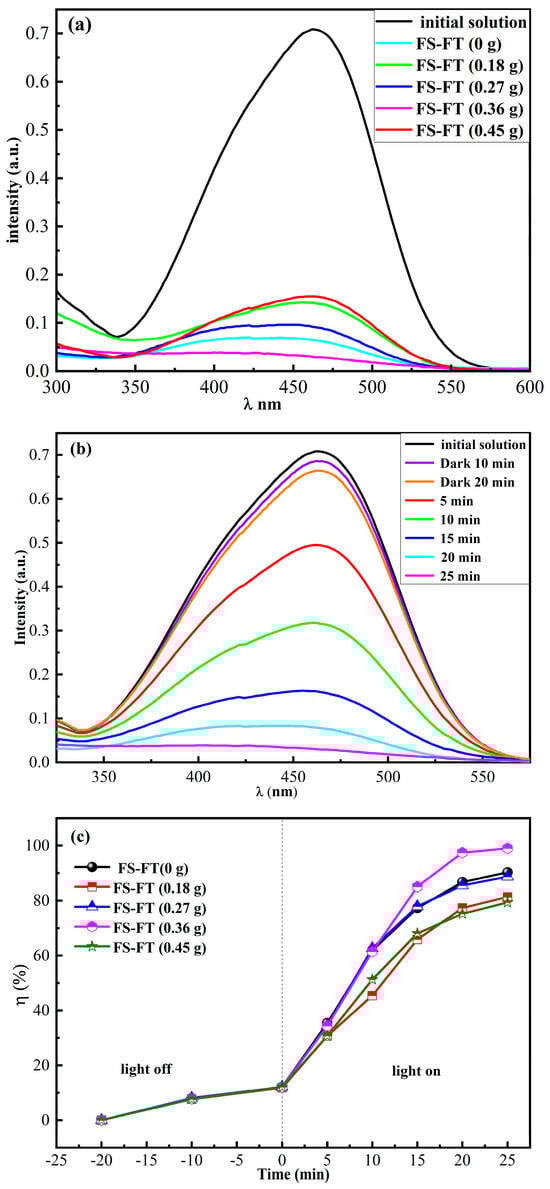
Figure 4.
(a) UV-VIS spectra of MO in pure MO solution prior to and after photodegradation using FS-FT (0–0.45 g); (b) time evolution of UV-VIS spectra for MO degradation using FS-FT (0.36 g); and (c) degradation speed of MO degraded using FS-FT (0–0.45 g) in pure MO solution.
Under identical experimental conditions, the recovered FS-FT (0 g, 0.36 g) was utilized for cyclic degradation experiments of the MO solution. Figure 5a shows the photodegradation efficiency of MO using the recovered FS-FT (0 g) for five cycles. The abscissa of the five-cycle data corresponds to the horizontal coordinates of 0–25, 25–50, 50–75, 75–100, and 100–125 min, respectively. The degradation efficiency of FS-FT (0 g) in five cycles was 90.25%, 89.18%, 77.31%, 88.66%, and 85.03%, respectively, and the average degradation rate was 86.08%. In Figure 5b, the degradation rates of MO using FS-FT (0.36 g) were 99%, 97.18%, 95.09%, 96.68%, and 95.21%, respectively, and the average degradation rate was 96.63%. The findings show that the moderate amount of metal doping can improve degradation performance. The cause of the gradual decrease in the degradation efficiency in the first three cycles is that during the degradation process, a water-insoluble intermediate product is adsorbed at the photocatalyst surface. This reduction in the catalyst–dye interfacial contact area limits surface light absorption, consequently lowering the photocatalytic efficiency [17].
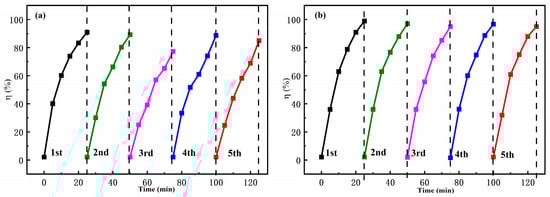
Figure 5.
The degradation rates of MO in pure MO solution using (a) FS-FT (0 g); (b) FS-FT (0.36 g) for five cycles.
Figure 6 illustrates the photodegradation of MO in MO-Na2SO4-blended solution (CMO = 10 mg/L, CNa2SO4 = 12.5 g/L). First, 0.02 g of FS-FT with different levels of iron doping was placed into 10 mL of MO-Na2SO4-blended solution in a dark room until it reached the absorption–desorption equilibrium. The adsorption rates of MO-Na2SO4 using FS-FT (0, 0.18, 0.27, 0.36, and 0.45 g) were 12.25%, 11.11%, 11.86%, 12.23%, and 10.96%, respectively. Figure 6a illustrates the UV-VIS spectra of MO degradation in MO-Na2SO4-blended solution using FS-FT (0, 0.18, 0.27, 0.36, and 0.45 g). Figure 6b illustrates the absorption spectra of MO in the UV-VIS range using FS-FT (0.36 g) in MO-Na2SO4 at various degradation time intervals. Figure 6c shows the degradation efficiency using FS-FT (0, 0.18, 0.27, 0.36, and 0.45 g) in MO-Na2SO4. The photodegradation rates were 92.38%, 80.37%, 85.32%, 97.16%, and 77.54%, respectively. The findings demonstrate that the FS-FT (0.36 g) photocatalyst exhibits optimal degradation efficiency in the MO-Na2SO4, but its photocatalytic efficiency is inhibited compared to its performance in degrading pure MO solution. When FS-FT is doped with an appropriate amount of Fe, the addition of Na2SO4 suppresses the degradation of MO. The possible explanation for this phenomenon is that SO42− competes for the surface-active sites of the photocatalyst, inducing competitive adsorption and thus reducing the photocatalytic performance [24,25]. The relevant photocatalytic efficiency data of the produced materials for MO and MO-Na2SO4 degradation are summarized in Table 1 [26,27,28]. Comparative analysis reveals that the FS-FT (0.36 g) composite exhibits superior photodegradation efficiency. Furthermore, it demonstrates a recyclability rate of up to 90%, highlighting its potential for sustainable applications in photocatalytic systems.
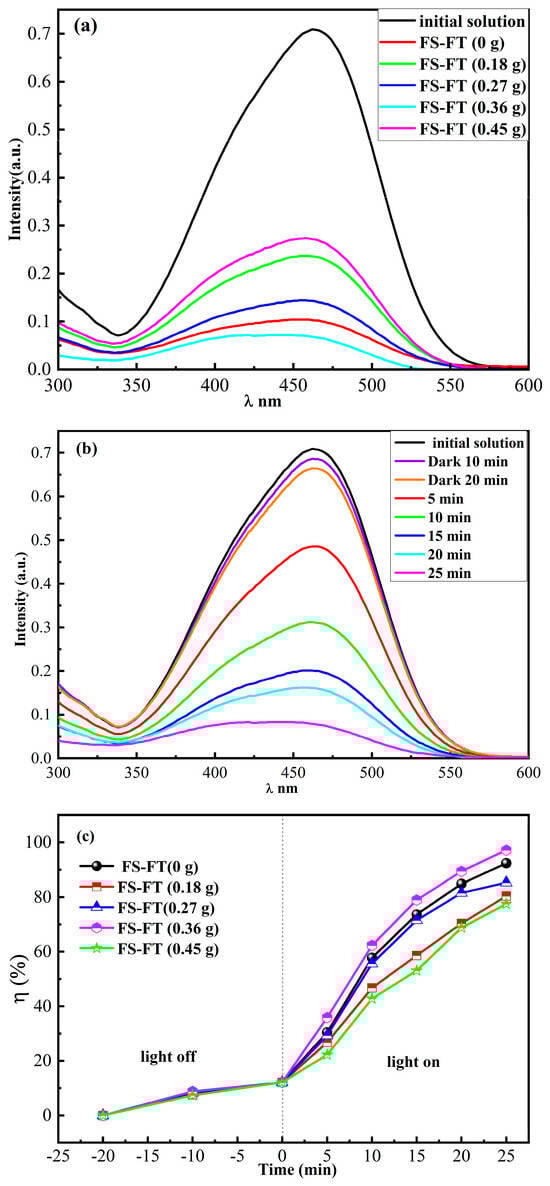
Figure 6.
(a) UV-VIS spectra of MO in MO-Na2SO4-blended solution prior to and after photodegradation using FS-FT (0–0.45 g); (b) time evolution of UV-VIS spectra of MO degraded using FS-FT (0.36 g) in MO-Na2SO4 during photocatalytic degradation process; and (c) degradation rates of MO degraded using FS-FT (0–0.45 g) in MO-Na2SO4-blended solution.

Table 1.
The photocatalytic effectiveness of the materials.
The recovered FS-FT (0 g, 0.36 g) was used to degrade MO in MO-Na2SO4-blended solution in the same environment (CMO = 10 mg/L, CNa2SO4 = 12.5 g/L). Figure 7a illustrates the photocatalytic performance of the recovered FS-FT (0 g). The degradation efficiency of MO using recovered FS-FT (0 g) for five cycles was 92.38%, 90.41%, 82.61%, 90.48%, and 85.48%, respectively, and the average degradation rate was 88.27%. In Figure 7b, the degradation efficiency of MO using recovered FS-FT (0.36 g) over five cycles was 97.16%, 96.71%, 93.50%, 96.07%, and 94.71%, respectively, and the overall degradation rate was 95.63%. After three cycles of the experiment, the recovered samples underwent a self-cleaning treatment. Subsequently, the photocatalytic efficacy experienced a resurgence in the fourth cycle. It was found that although the addition of Na2SO4 inhibited the efficiency of FS-FT (0.36 g) in degrading MO, the inhibitory effect was not very significant; it still had strong photocatalytic activity.
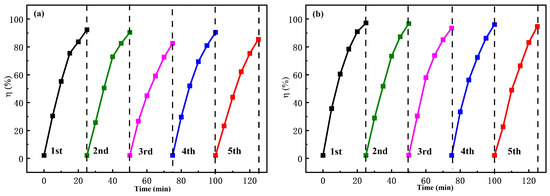
Figure 7.
The degradation efficiency in MO-Na2SO4-blended solution using (a) FS-FT (0 g); (b) FS-FT (0.36 g) for five cycles.
XPS spectra were used to research the photocatalyst electronic characteristics and elemental composition in Figure 8. All core-level XPS spectra were calibrated using the adventitious carbon C 1s peak at 284.8 eV for charge correction.
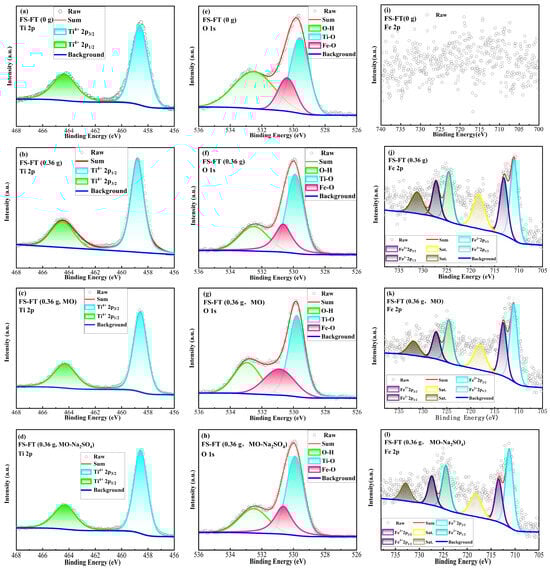
Figure 8.
XPS spectra: (a–d) FS-FT (0 g), FS-FT (0.36 g), FS-FT (0.36 g, MO), FS-FT (0.36 g, MO-Na2SO4)—Ti 2p; (e–h) FS-FT (0 g), FS-FT (0.36 g), FS-FT (0.36 g, MO), FS-FT (0.36 g, MO-Na2SO4)—O 1s; and (i–l) FS-FT (0 g), FS-FT (0.36 g), FS-FT (0.36 g, MO), FS-FT (0.36 g, MO-Na2SO4)—Fe 2p.
Ti 2p: Figure 8a,b show the XPS spectra of FS-FT (0 g) and FS-FT (0.36 g) before photodegradation, respectively. Figure 8c,d show the high-resolution XPS spectra of FS-FT (0.36 g, MO) after photodegradation in pure MO solution and FS-FT (0.36 g, MO-Na2SO4) after photodegradation in MO-Na2SO4-blended solution, respectively. In Figure 8a, the spin–orbit splitting of Ti4+ results in two peaks: Ti4+ 2p3/2 (458.6 eV) and Ti4+ 2p1/2 (464.3 eV) [28]. Figure 8b–d show Ti 2p XPS spectra of samples doped with Fe3+ with two peaks, respectively. The Ti 2p doublet was observed at binding energies of 458.7 eV (2p3/2) and 464.4 eV (2p1/2), exhibiting a spin–orbit splitting of 5.7 eV. This finding aligns with previously reported data in the literature [29]. The Ti 2p peaks exhibited a shift toward a higher binding energy, signifying the successful integration of Fe3+ ions into the TiO2 lattice [29,30].
O 1s: Figure 8e–h show the XPS spectra of O 1s for FS-FT (0 g), FS-FT (0.36 g), FS-FT (0.36 g, MO), and FS-FT (0.36 g, MO-Na2SO4), respectively. There are three peaks for both undoped and Fe-doped samples. O1s is in Ti-O at 529.6 eV for FS-FT (0 g) in Figure 8e, 529.8 eV for FS-FT (0.36 g) in Figure 8f, 529.8 eV for FT (0.36 g, MO) in Figure 8g, and 529.8 eV for FS-FT (0.36 g, MO-Na2SO4) in Figure 8h, respectively. O1s is in Fe-O at 530.4 eV for FS-FT (0 g) in Figure 8e, 530.64 eV for FS-FT (0.36 g) in Figure 8f, 530.64 eV for FT (0.36 g, MO) in Figure 8g, and 530.64 eV for FS-FT (0.36 g, MO-Na2SO4) in Figure 8h, respectively. This is because some Fe3+ ions replace Ti4+ ions, leading to a shift in the peak. Peaks at 532.5 eV (Figure 8e–h) are linked to oxygen atoms bound to O in O-H [29,31].
Fe 2p: In Figure 8i, the XPS spectrum of FS-FT (0 g) before photodegradation is due to the fact that the XPS instrument only scans the surface of the sample, the Fe element is located in the core of the core–shell structure, and the scanning data have poor signal and more noise. Figure 8j shows the XPS spectra of Fe 2p for FS-FT (0.36 g) before photodegradation. The Fe2+ 2p spin–orbit doublet was resolved at binding energies of 711.2 eV (2p3/2) and 724.6 eV (2p1/2), and the Fe3+ 2p spin–orbit doublet was resolved at binding energies of 713.4 eV (2p3/2) and 727.4 eV (2p1/2). Figure 8k presents the XPS spectra of Fe 2p for FS-FT (0.36 g, MO) after photodegradation. The Fe2+ 2p spin–orbit doublet was resolved at binding energies of 711.0 eV (2p3/2) and 724.4 eV (2p1/2), and the Fe3+ 2p spin–orbit doublet was resolved at binding energies of 713.3 eV (2p3/2) and 727.3 eV (2p1/2). Figure 8l presents the XPS spectra of Fe 2p for FS-FT (0.36 g, MO-Na2SO4) after photodegradation. The Fe2+ 2p spin–orbit doublet was resolved at binding energies of 711.0 eV (2p3/2) and 724.4 eV (2p1/2), and the Fe3+ 2p spin–orbit doublet was resolved at binding energies of 713.3 eV (2p3/2) and 727.3 eV (2p1/2) [32,33]. The Fe3+/Fe2+ ratio is 73:100 after iron doping. The reason for the occurrence of the Fe2+ peak may be that Fe3+ was reduced during the preparation process, or that Fe3O4 in the core may be detected. In Figure 8k, the Fe3+/Fe2+ ratio changes to 63:100 for FS-FT (0.36 g, MO) after degradation in MO solution; it was found that the proportion of Fe3+ decreased slightly, which could have led to a decline in photocatalytic performance [34,35]. In Figure 8l, the Fe3+/Fe2+ ratio is 51:100 for FS-FT (0.36 g, MO-Na2SO4) after the degradation of MO-Na2SO4-blended solution. The proportion of Fe3+ further decreases, indicating that Fe3+ was reduced to Fe2+ during the reaction process, leading to the decrease in Fe3+ and electron concentrations and in the photocatalytic activity [36,37,38].
Since the concentration of Na2SO4 used in the printing and dyeing process is approximately 12.5 g/L, the selected concentration range for further studying the impact caused by Na2SO4 is 10–17.5 g/L. Figure 9 shows an evaluation of the photodegradation rates of MO using FS-FT (0.36 g) in different MO-Na2SO4-blended solutions. The four sets of photocatalytic samples were placed in the dark chamber of the photocatalytic experimental setup for approximately 20 min to attain the adsorption–desorption equilibrium and subjected to irradiation with a HPML. The degradation rates of MO in different MO-Na2SO4-blended solutions were 99.21%, 97.16%, 90.12%, and 83.36% for CNa2SO4 = 10.0, 12.5, 15.0, and 17.5 g/L, respectively. These results indicate a decreasing trend in the degradation efficiency from increasing the concentration of Na2SO4 within the range of Na2SO4 concentration from 10 to 17.5 g/L. Firstly, protonation of the photocatalyst surface generates positively charged species, establishing a surface charge conducive to photocatalytic reactions, which makes the dye with negative charge compete with SO42− in the process of adsorption [39]. This competition reduces the chance of contact between the photocatalyst and dye. Secondly, the results of some researchers showed that in the process of the degradation of dyes using photocatalysts based on titanium dioxide, photogenerated electrons played a major role [24]. Fe3+ combines with photogenerated electrons that should have reacted with MO, which inhibits the reaction between photogenerated electrons and MO, and decreases the number of Fe3+-capturing electrons, thus reducing the degradation effect [25]. These findings are in agreement with those of XPS in Figure 8j–l. Thirdly, sulfate radicals (SO4•−) are generated via the interaction of photogenerated holes and SO42−. As the concentration of Na2SO4 increases, SO42− robs the active sites on the photocatalyst and reacts with h+, thus reducing the interaction between the dye and h+ and inhibiting photocatalytic efficiency. Although SO4•− can degrade dyes, photogenerated electrons play a key role [24]. Thus, the rate of photocatalytic removal of MO in MO-Na2SO4-blended solution decreases with the boost in the concentration of Na2SO4 [25].
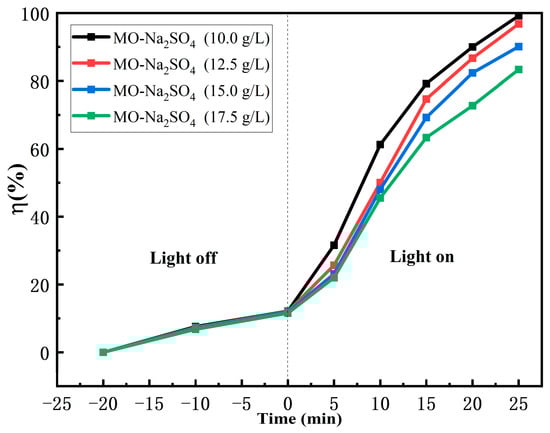
Figure 9.
Degradation rate in different concentrations of MO-Na2SO4 using FS-FT (0.36 g).
Figure 10 illustrates a linear fit of the first-order kinetics. The degradation reaction rate constant, k, is identified using Equation (3):
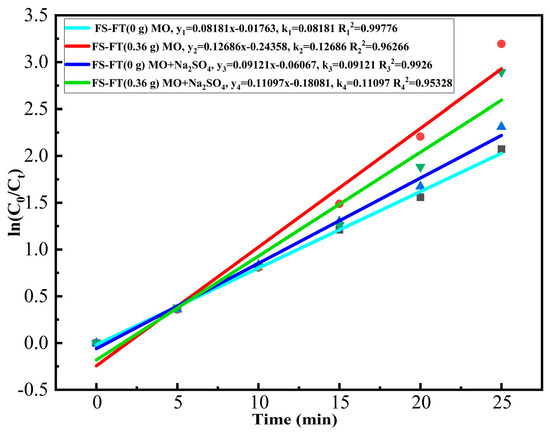
Figure 10.
First-order kinetics linear fitting.
In this equation, k signifies the degradation rate constant, t corresponds to the exposure time, C0 represents the initial concentration of MO, and Ct represents the concentration of MO at time t. The degradation efficiency constant k was calculated in relation to time t. Plotting in relation to time t in terms of ln(C0/Ct), and thus calculating the incline of the best-fit straight line, yields a rate constant for each sample, k [40]. Figure 10 illustrates that the kinetic curve is nearly linear, with a correlation coefficient (R2) approaching 1. This observation confirms that the photocatalytic process is governed by a first-order kinetic model. The first-order rate constants k for FS-FT (0 g) and FS-FT (0.36 g) in pure MO solution were determined as 0.08181 and 0.12686. A comparison of these k values clearly shows that Fe doping enhances photocatalytic activity. The first-order rate constants k for FS-FT (0 g) and FS-FT (0.36 g) in MO-Na2SO4-blended solution were determined as 0.09121 and 0.11097. This suggests that the inclusion of Na2SO4 suppresses the photocatalytic efficiency of FS-FT (0.36 g); however, FS-FT (0.36 g) still maintains good photocatalytic performance. According to the literature, the role of Fe3+ ions is twofold: firstly, the absorbed wave shifts towards longer wavelengths due to ionic doping; secondly, at appropriate concentrations, Fe3+ also serves as a carrier for hole and electron transport [41].
Figure 11 illustrates the photodegradation principle of MO using FS-FT (0.36 g). Photogenerated holes (h+) oxidize the adsorbed hydroxyl (OH) and water (H2O) molecules on the TiO2 surface, resulting in the production of hydroxyl radicals (•OH) and superoxide anions (O2−). Photoinduced electrons (e− react with dissolved oxygen in the aqueous medium via a single-electron transfer process, producing superoxide radical anions (•O2−) as intermediates. The introduction of an appropriate amount of Fe doping as an intermediary for the transport of photogenerated carriers effectively reduces their recombination and thereby enhances the degradation efficiency of the FS-FT (0 g) system in the degradation of MO [40].
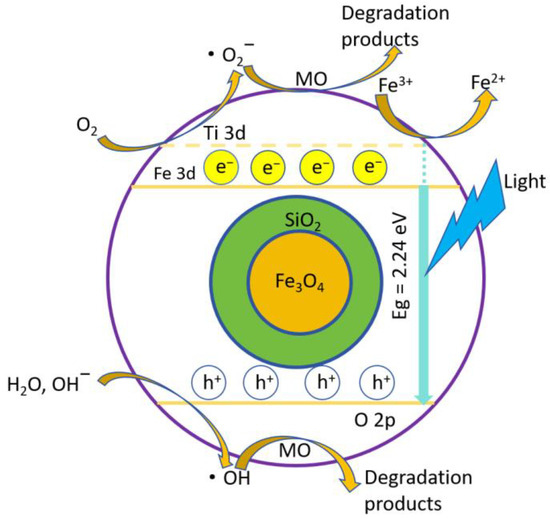
Figure 11.
Photodegradation principle of MO using FS-FT (0.36 g).
Figure 12 illustrates the photodegradation principle of MO-Na2SO4-blended solution using FS-FT (0.36 g). The introduction of Na2SO4 resulted in a significant increase in SO42−, which adsorbed onto the photocatalyst surface, functioning as a pore-trapping agent. This interaction facilitated the combination of sulfate ions with photogenerated holes to produce SO4−• [42]. Fe3+ ions reacted with free electrons to form Fe2+, and Fe3+ plays a crucial role in the photodegradation process. However, the decrease in Fe3+ and free electron concentration negatively affects the performance of photocatalysis. As the Na2SO4 concentration increases, SO42− competes for the active locations on the photocatalyst and associates with h+, thus reducing the binding of the dye to h+ and inhibiting the photocatalytic efficiency. The joint role of both led to a reduced rate of photocatalytic degradation, inhibiting the degradation of the MO-Na2SO4-blended solution. These findings were corroborated by XPS analysis of the MO-Na2SO4-blended solution and the photocatalytic degradation experiments conducted with varying concentrations of MO-Na2SO4 [42].
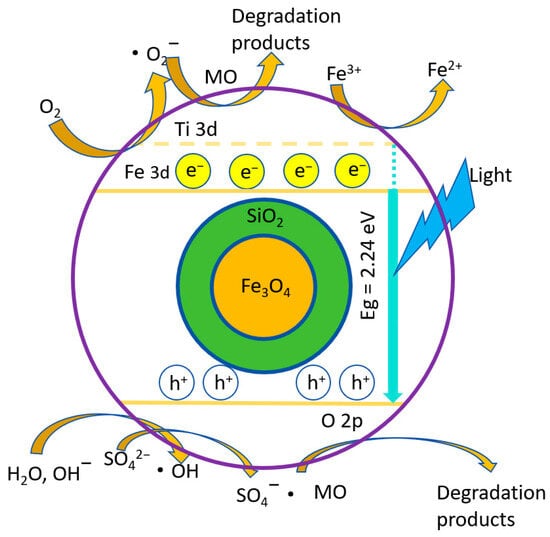
Figure 12.
Photodegradation principle of MO-Na2SO4 using FS-FT (0.36 g).
4. Conclusions
A batch of FS-FT (0 g) catalysts was synthesized using the hot solvent method for the fabrication of anatase-phase TiO2, utilizing TBOT as the titanium source, along with the sol–gel technique for the fabrication of FS-FT (0 g). The FS-FT (0.18–0.45 g) catalysts were obtained by controlling the amount of FeCl3·6H2O added.
The photocatalytic removal of MO was performed using FS-FT catalysts (0–0.45 g) with different iron concentrations. The experimental results indicated that FS-FT (0.36 g) achieved a 99% degradation rate of MO, outperforming other catalysts under identical conditions. In contrast, the FS-FT (0 g) exhibited a degradation rate of 90.25%, suggesting that appropriate iron doping enhances the catalytic performance of FS-FT. The recycling experiment showed that FS-FT (0.36 g) had good recyclability. However, excessive iron doping can transition Fe from a capturing center to a complex center, increasing the recombination rate of photogenerated carriers, thereby inhibiting the photocatalytic degradation of acid dyes and resulting in a decreased degradation rate.
Using a MO-Na2SO4-blended solution as a simulated pollutant, the experimental results demonstrated that FS-FT (0.36 g) effectively degraded methyl orange with a degradation rate of 97.16%, while the degradation rate of FS-FT (0 g) was slightly lower at 92.38%. The results demonstrate that FS-FT (0.36 g) still exhibits strong photocatalytic activity even in complex environments. The recycling experiment showed that FS-FT (0.36 g) had good recyclability. The degradation experiments of MO-Na2SO4-blended solutions with different concentrations using FS-FT (0.36 g) indicate that the inhibitory effect on FS-FT (0.36 g) becomes stronger as the Na2SO4 concentration increases. The observed decrease in photocatalytic degradation efficiency with MO can be attributed to the introduction of a significant amount of sulfate ions (SO42−) upon the addition of Na2SO4. These sulfate ions adsorbed onto the photocatalyst surface and combined with holes, acting as a pore-trapping agents to generate sulfate radicals (SO4•−). Fe3+ ions reacted with free electrons to form Fe2+, which is crucial in the photocatalytic degradation process. The reduction in the concentrations of Fe3+ and free electrons adversely affected the photocatalytic performance, leading to decreased photoelectric conversion efficiency and a lower degradation rate, ultimately inhibiting the degradation of the MO-Na2SO4-blended solution.
The results also indicated that the photocatalytic removal of MO using FS-FT (0 g) and FS-FT (0.36 g) followed first-order kinetic equations. The degradation rate of FS-FT (0.36 g) was found to be higher than that of FS-FT (0 g), suggesting that iron doping altered the lattice structure of TiO2, enhancing its photocatalytic degradation rate.
Author Contributions
Conceptualization, L.S. and Z.Y.; methodology, L.S. and Z.L.; software, Z.L. and X.O.; validation, L.S., Z.Y., and Z.L.; formal analysis, L.S., Z.L., and X.O.; investigation, S.M. and Z.C.; resources, L.S. and Z.Y.; data curation, L.S., Z.L., and X.O.; writing—original draft preparation, L.S. and Z.L.; writing—review and editing, L.S. and Z.C.; visualization, Y.L. and K.Z.; supervision, L.S. and Y.L.; project administration, F.M. and Y.X.; funding acquisition, L.S. and S.M. All authors have read and agreed to the published version of the manuscript.
Funding
This work has been subsidized by the National Natural Science Foundation of China (Grant No. 11904268) and Science and Technology Program of Hubei Province (CN) (Grant No. 2019CFB613).
Data Availability Statement
The data are contained within this article.
Conflicts of Interest
The authors declare no conflicts of interest.
References
- Aghazadeh, M.; Hassani, A.H.; Borghei, M. Application of photocatalytic proxone process for petrochemical wastewater treatment. Sci. Rep. 2023, 13, 12738. [Google Scholar] [CrossRef] [PubMed]
- Sonia; Kumari, H.; Monica; Sharma, S.; Reenu; Kumar, R.; Suman; Chahal, S.; Kumar, S.; Kumar, P.; et al. UV-Irradiated Photocatalytic Activity of α-Fe2O3/ZnO Nanocomposites for Wastewater Treatment. J. Electron. Mater. 2024, 53, 5990–6002. [Google Scholar]
- Kumari, H.; Sonia; Suman; Ranga, R.; Chahal, S.; Devi, S.; Sharma, S.; Kumar, S.; Kumar, P.; Kumar, S.; et al. A Review on Photocatalysis Used For Wastewater Treatment: Dye Degradation. Water Air Soil Pollut. 2023, 234, 349. [Google Scholar] [PubMed]
- Ahasan, T.; Xu, P.; Wang, H. Dual-Function Photocatalysis in the Visible Spectrum: Ag-G-TiO2 for Simultaneous Dye Wastewater Degradation and Hydrogen Production. Catalysts 2024, 14, 530. [Google Scholar] [CrossRef]
- Belver, C.; Bedia, J. Structured Semiconductors in Photocatalysis. Catalysts 2023, 13, 1111. [Google Scholar] [CrossRef]
- Qiu, J.; Li, M.; Ding, M.; Yao, J. Cellulose tailored semiconductors for advanced photocatalysis. Renew. Sustain. Energy Rev. 2022, 154, 111820. [Google Scholar]
- Fujishima, A.; Honda, K. Electrochemical photolysis of water at a semiconductor electrode. Nature 1972, 238, 37–38. [Google Scholar]
- Carey, J.H.; Lawrence, J.; Tosine, H.M. Advances in photolysis of persistent organic pollutants in water. Bull. Environ. Contam. Toxicol. 1976, 16, 697–701. [Google Scholar]
- Pruden, A.L.; Ollis, D.F. Photoassisted heterogeneous catalysis: The degradation of trichloroethylene in water. J. Catal. 1983, 82, 404–417. [Google Scholar]
- He, C.; He, J.; Cui, S.; Fan, X.; Li, S.; Yang, Y.; Tan, X.; Zhang, X.; Mao, J.; Zhang, L.; et al. Novel Effective Photocatalytic Self-Cleaning Coatings: TiO2-Polyfluoroalkoxy Coatings Prepared by Suspension Plasma Spraying. Nanomaterials 2023, 13, 3123. [Google Scholar] [CrossRef]
- Xia, J.; Dong, L.; Song, H.; Yang, J.; Zhu, X. Preparation of doped TiO2 nanomaterials and their applications in photocatalysis. Bull. Mater. Sci. 2023, 46, 13. [Google Scholar] [CrossRef]
- Zhu, B.; Long, Y.; Zhu, Z.; Xu, B. Photocatalysis and Phase-Transition of Ca2+-Doped TiO2. Catal. Lett. 2023, 153, 3761–3770. [Google Scholar] [CrossRef]
- Morales-Lopez, N.; Gallegos-Cerda, S.; Arredondo-Tamayo, B.; Hernández-Varela, J.; Cervantes-Sodi, F.; Chanona-Perez, J. SEM Characterization of GG-CaCO3-TiO2 Composite Film for Its Application in Photocatalysis. Microsc. Microanal. 2024, 30, ozae044.640. [Google Scholar] [CrossRef]
- Nosrati, P.; Rahimi, R.; Hosseini-Kharat, M. Investigation of antibacterial photodynamic inactivation in urea-doped TiO2 sensitized with porphyrin photocatalysis. J. Porphyr. Phthalocyanines 2023, 27, 873–886. [Google Scholar] [CrossRef]
- Saroha, J.; Rani, E.; Devi, M.; Pathi, P.; Kumar, M.; Sharma, S.N. Plasmon-Assisted Photocatalysis of Organic Pollutants by Au/Ag-TiO2 Nanocomposites: A Comparative Study. Mater. Today Sustain. 2023, 23, 100466. [Google Scholar] [CrossRef]
- Sun, L.; Ouyang, X.; Li, Z.; Yuan, Z.; Gong, W.; Chen, Z.; Mei, S.; Liu, Y.; Zhou, Q. Preparation of Fe3O4@SiO2@N-TiO2 and Its Application for Photocatalytic Degradation of Methyl Orange in Na2SO4 Solution. Appl. Sci. 2024, 14, 5205. [Google Scholar] [CrossRef]
- Sun, L.; Zhou, Q.; Mao, J.; Ouyang, X.; Yuan, Z.; Song, X.; Gong, W.; Mei, S.; Xu, W. Study on Photocatalytic Degradation of Acid Red 73 by Fe3O4@TiO2 Exposed (001) Facets. Appl. Sci. 2022, 12, 3574. [Google Scholar] [CrossRef]
- Xu, L.; Wang, J. Fenton-like degradation of 2,4-dichlorophenol using Fe3O4 magnetic nanoparticles. Appl. Catal. B Environ. 2012, 123–124, 117–126. [Google Scholar] [CrossRef]
- Shi, S. Structural and optical properties of Fe-doped TiO2 films by sol–gel method. Mod. Phys. Lett. B 2020, 34, 2050345. [Google Scholar] [CrossRef]
- Popa, A.; Stefan, M.; Toloman, D.; Pana, O.; Mesaros, A.; Leostean, C.; Macavei, S.; Marincas, O.; Suciu, R.; Barbu-Tudoran, L. Fe3O4-TiO2: Gd nanoparticles with enhanced photocatalytic activity and magnetic recyclability. Powder Technol. 2018, 325, 441–451. [Google Scholar] [CrossRef]
- Liu, W.; Wei, C.; Wang, G.; Cao, X.; Tan, Y.; Hu, S. In situ synthesis of plasmonic TiO2 nanocomposites with enhanced visible photocatalytic performance. Ceram. Int. 2019, 45, 17884–17889. [Google Scholar] [CrossRef]
- Ma, J.-Q.; Guo, S.-B.; Guo, X.-H.; Ge, H.-G. Liquid-phase deposition of TiO2 nanoparticles on core–shell Fe3O4@SiO2 spheres: Preparation, characterization, and photocatalytic activity. J. Nanopart. Res. 2015, 17, 307. [Google Scholar] [CrossRef]
- Chen, D.; Wei, L.; Meng, L.P.; Wang, D.; Chen, Y.X.; Tian, Y.F.; Yan, S.S.; Mei, L.M.; Jiao, J. Visible-blind quasi-solid-state UV detector based on SnO2-TiO2 nanoheterostructure arrays. J. Alloys Compd. 2018, 751, 56–61. [Google Scholar] [CrossRef]
- Griffith, M.J.; Sunahara, K.; Wagner, P.; Wagner, K.; Wallace, G.G.; Officer, D.L.; Furube, A.; Katoh, R.; Mori, S.; Mozer, A.J. Porphyrins for dye-sensitised solar cells: New insights into efficiency-determining electron transfer steps. Chem. Commun. 2012, 48, 4145–4162. [Google Scholar] [CrossRef]
- Douven, S.; Mahy, J.G.; Wolfs, C.; Reyserhove, C.; Poelman, D.; Devred, F.; Gaigneaux, E.M.; Lambert, S.D. Efficient N, Fe Co-Doped TiO2 Active under Cost-Effective Visible LED Light: From Powders to Films. Catalysts 2020, 10, 547. [Google Scholar] [CrossRef]
- Ge, M.; Guo, C.; Zhu, X.; Ma, L.; Han, Z.; Hu, W.; Wang, Y. Photocatalytic degradation of methyl orange using ZnO/TiO2 composites. Front. Environ. Sci. Eng. China 2009, 3, 271–280. [Google Scholar]
- Huang, M.; Xu, C.; Wu, Z.; Huang, Y.; Lin, J.; Wu, J. Photocatalytic discolorization of methyl orange solution by Pt modified TiO2 loaded on natural zeolite. Dye. Pigment. 2008, 77, 327–334. [Google Scholar] [CrossRef]
- Zhang, L.; Lv, F.; Zhang, W.; Li, R.; Zhong, H.; Zhao, Y.; Zhang, Y.; Wang, X. Photo degradation of methyl orange by attapulgite–SnO2–TiO2 nanocomposites. J. Hazard. Mater. 2009, 171, 294–300. [Google Scholar] [CrossRef]
- Mathews, N.R.; Corte Jacome, M.A.; Morales, E.R.; Toledo Antonio, J.A. Structural and Spectroscopic Study of the Fe Doped TiO₂ Thin Films for Applications in Photocatalysis. Phys. Status Solidi C 2009, 6, S219–S223. [Google Scholar]
- Esfandiari, N.; Kashefi, M.; Mirjalili, M.; Afsharnezhad, S. Role of silica mid-layer in thermal and chemical stability of hierarchical Fe3O4-SiO2-TiO2 nanoparticles for improvement of lead adsorption: Kinetics, thermodynamic and deep XPS investigation. Mater. Sci. Eng. B 2020, 262, 114690. [Google Scholar] [CrossRef]
- Nosaka, Y.; Nosaka, A. Understanding Hydroxyl Radical (•OH) Generation Processes in Photocatalysis. ACS Energy Lett. 2016, 1, 356–359. [Google Scholar]
- Sun, P.; Han, S.; Liu, J.; Zhang, J.; Yang, S.; Wang, F.; Liu, W.; Yin, S.; Ning, Z.; Cao, W. Introducing Oxygen Vacancies in TiO2 Lattice Through Trivalent Iron to Enhance the Photocatalytic Removal of Indoor NO. Int. J. Miner. Metall. Mater. 2023, 30, 2025–2035. [Google Scholar]
- Wang, F.; Li, M.; Yu, L.; Sun, F.; Wang, Z.; Zhang, L.; Zeng, H.; Xu, X. Corn-like, Recoverable γ-Fe2O3@SiO2@TiO2 Photocatalyst Induced by Magnetic Dipole Interactions. Sci. Rep. 2017, 7, 6960. [Google Scholar]
- Sobczyk-Guzenda, A.; Owczarek, S.; Batory, D.; Balcerzak, J.; Gazicki-Lipman, M.; Szymanowski, H. The effect of thermal annealing on Fe/TiO2 coatings deposited with the help of RF PECVD method. Part I. Chemical and phase composition. Ceram. Int. 2017, 43, 3993–4004. [Google Scholar]
- Bapna, K.; Phase, D.M.; Choudhary, R.J. Study of valence band structure of Fe doped anatase TiO2 thin films. J. Appl. Phys. 2011, 110, 043910. [Google Scholar]
- V Zhu, Y. Enhanced photoelectrochemical properties of Fe-TiO2 nanotube films: A combined experimental and theoretical study. Int. J. Electrochem. Sci. 2021, 16, 210662. [Google Scholar]
- Elghniji, K.; Ksibi, M.; Elaloui, E. Sol-gel reverse micelle preparation and characterization of n-doped TiO2: Efficient photocatalytic degradation of methylene blue in water under visible light. J. Ind. Eng. Chem. 2012, 18, 178–182. [Google Scholar]
- Haryński, Ł.; Grochowska, K.; Kupracz, P.; Karczewski, J.; Coy, E.; Siuzdak, K. The in-depth studies of pulsed UV laser-modified TiO2 nanotubes: The influence of geometry, crystallinity, and processing parameters. Nanomaterials 2020, 10, 430. [Google Scholar] [CrossRef]
- Al-Rasheed, R.; Cardin, D.J. Photocatalytic degradation of humic acid in saline waters. Part 1: Artificial sea-water—Influence of TiO2, temperature, pH, and air-flow. Chemosphere 2003, 51, 925–933. [Google Scholar]
- Xia, R.; Wang, L.; Xiao, B.; Lei, L.; Zhu, J.; Liu, Z.; Xi, X.; Feng, G.; Li, R.; Feng, J. Effective removal of methylene blue on EuVO4/g-C3N4 mesoporous nanosheets via coupling adsorption and photocatalysis. Int. J. Mol. Sci. 2022, 23, 10003. [Google Scholar] [CrossRef]
- Rani, A.; Dhiman, R.L.; Kumar, S.; Kundu, V.S.; Kumar, S. Photocatalytic Degradation of Congo Red and Methyl Orange Dye Under Visible Light Using Silver and Iron Co-doped TiO2 Nanoparticles. Indian J. Pure Appl. Phys. 2022, 60, 325–334. [Google Scholar]
- Rafieezadeh, M.; Kianfar, A.H. Fabrication of heterojunction ternary Fe3O4/TiO2/CoMoO4 as a magnetic photocatalyst for organic dyes degradation under sunlight irradiation. J. Photochem. Photobiol. A Chem. 2022, 423, 113596. [Google Scholar]
Disclaimer/Publisher’s Note: The statements, opinions and data contained in all publications are solely those of the individual author(s) and contributor(s) and not of MDPI and/or the editor(s). MDPI and/or the editor(s) disclaim responsibility for any injury to people or property resulting from any ideas, methods, instructions or products referred to in the content. |
© 2025 by the authors. Licensee MDPI, Basel, Switzerland. This article is an open access article distributed under the terms and conditions of the Creative Commons Attribution (CC BY) license (https://creativecommons.org/licenses/by/4.0/).