1. Introduction
Current telecommunication systems must meet the demand for high data rates, enabling end-user devices to access services such as multimedia, streaming, internet browsing, video calls, and many others. To achieve this, one of the most viable options is to optimize channel capacity, either by increasing bandwidth or by improving the signal-to-noise ratio (SNR). For the former, due to the saturation of the radio spectrum below 10 GHz, millimeter-wave bands are required. However, this leads to higher transmission losses and adverse propagation effects, necessitating the deployment of base stations within distances of around 100 m, which would significantly increase costs for operators. On the other hand, increasing the SNR is not a straightforward solution, as it requires increasing signal power, which also raises system costs. Nevertheless, to enhance SNR, antenna arrays are proposed to shape the radiation pattern and exploit multipath propagation as an advantage rather than a disadvantage. Multiple proposals have been made for this purpose, with multiple-input multiple-output (MIMO) antenna arrays gaining significant traction. In the case of a base station MIMO array, the limitations are fewer compared to personal devices due to the available space.
In handsets, MIMO arrays must be placed in close proximity due to spatial constraints. This close arrangement leads to performance degradation of the array. As a result, these devices must meet specific requirements such as low electric field correlation, high isolation among radiators, and suitable bandwidths for the intended application.
There is a wide variety of radiators that can be employed in MIMO arrays, ranging from the most basic, such as a monopole, to more sophisticated structures. However, many of these structures exhibit high-quality factors, which may limit their bandwidth for specific applications. Consequently, various approaches have been proposed to enhance this parameter, for example, ref. [
1] introduces the use of a mushroom-type Electronic Band-Gap Structure (EBG) array at the backplane of a patch antenna to improve bandwidth. Ref. [
2] presents a method that combines reactive impedance surfaces with metasurfaces to reduce the size and simultaneously increase the bandwidth of a microstrip antenna. In [
3], the authors also employ a low-profile metasurface to enhance the bandwidth of a reflectarray antenna. Nevertheless, bandwidth enhancement techniques for radiators are not limited to the use of metasurfaces; reactive loads can also be applied. For instance, ref. [
4] utilizes short-circuited pins in the zero-voltage region of the patch for the TM
30 propagation mode, thus improving the distribution of the dominant TM
10 mode and achieving a fractional bandwidth of 7.5%. In [
5], a multi-layer dielectric is proposed to enhance the bandwidth of a patch antenna by modifying the feed structure of the radiator. In [
6], the goal is to excite different modes using the same electrical length of the radiator. Under this assumption, the antenna is not limited to operating at a single frequency but can perform at multiple frequencies, thus increasing the bandwidth. Ref. [
7] exploits the principle of overlapping multiple resonances, achieved by an array of multiple patches that behave as the main radiator. In [
8], a novel combination of fractal geometry and CPW feeding structure is presented to obtain a UWB MIMO antenna, resulting in a highly efficient and reduced-size configuration. In [
9], using a two-embedded ring monopole configuration, an mm-wave applications antenna is presented. In this work, the authors obtained a high-efficiency, high-gain, 4-port MIMO antenna, which was very small.
On the other hand, in this paper, a compact, easy-to-implement, and built strip-monopole antenna with a significantly widened impedance bandwidth and small size is introduced. The antenna’s performance is improved by the inclusion of a T-shaped reactive stub, which stabilizes the impedance and effectively reduces the electrical length. Experimental results demonstrate the effectiveness of the proposed design. Beyond its compact size and straightforward implementation, this 4-port MIMO array exhibits exceptional electromagnetic isolation, even with closely spaced radiators. This observation suggests that both the axial configuration and the integrated stubs effectively minimize electromagnetic interaction between the radiating elements.
2. Case of Study: Effect of T-Shaped Stub-Loading
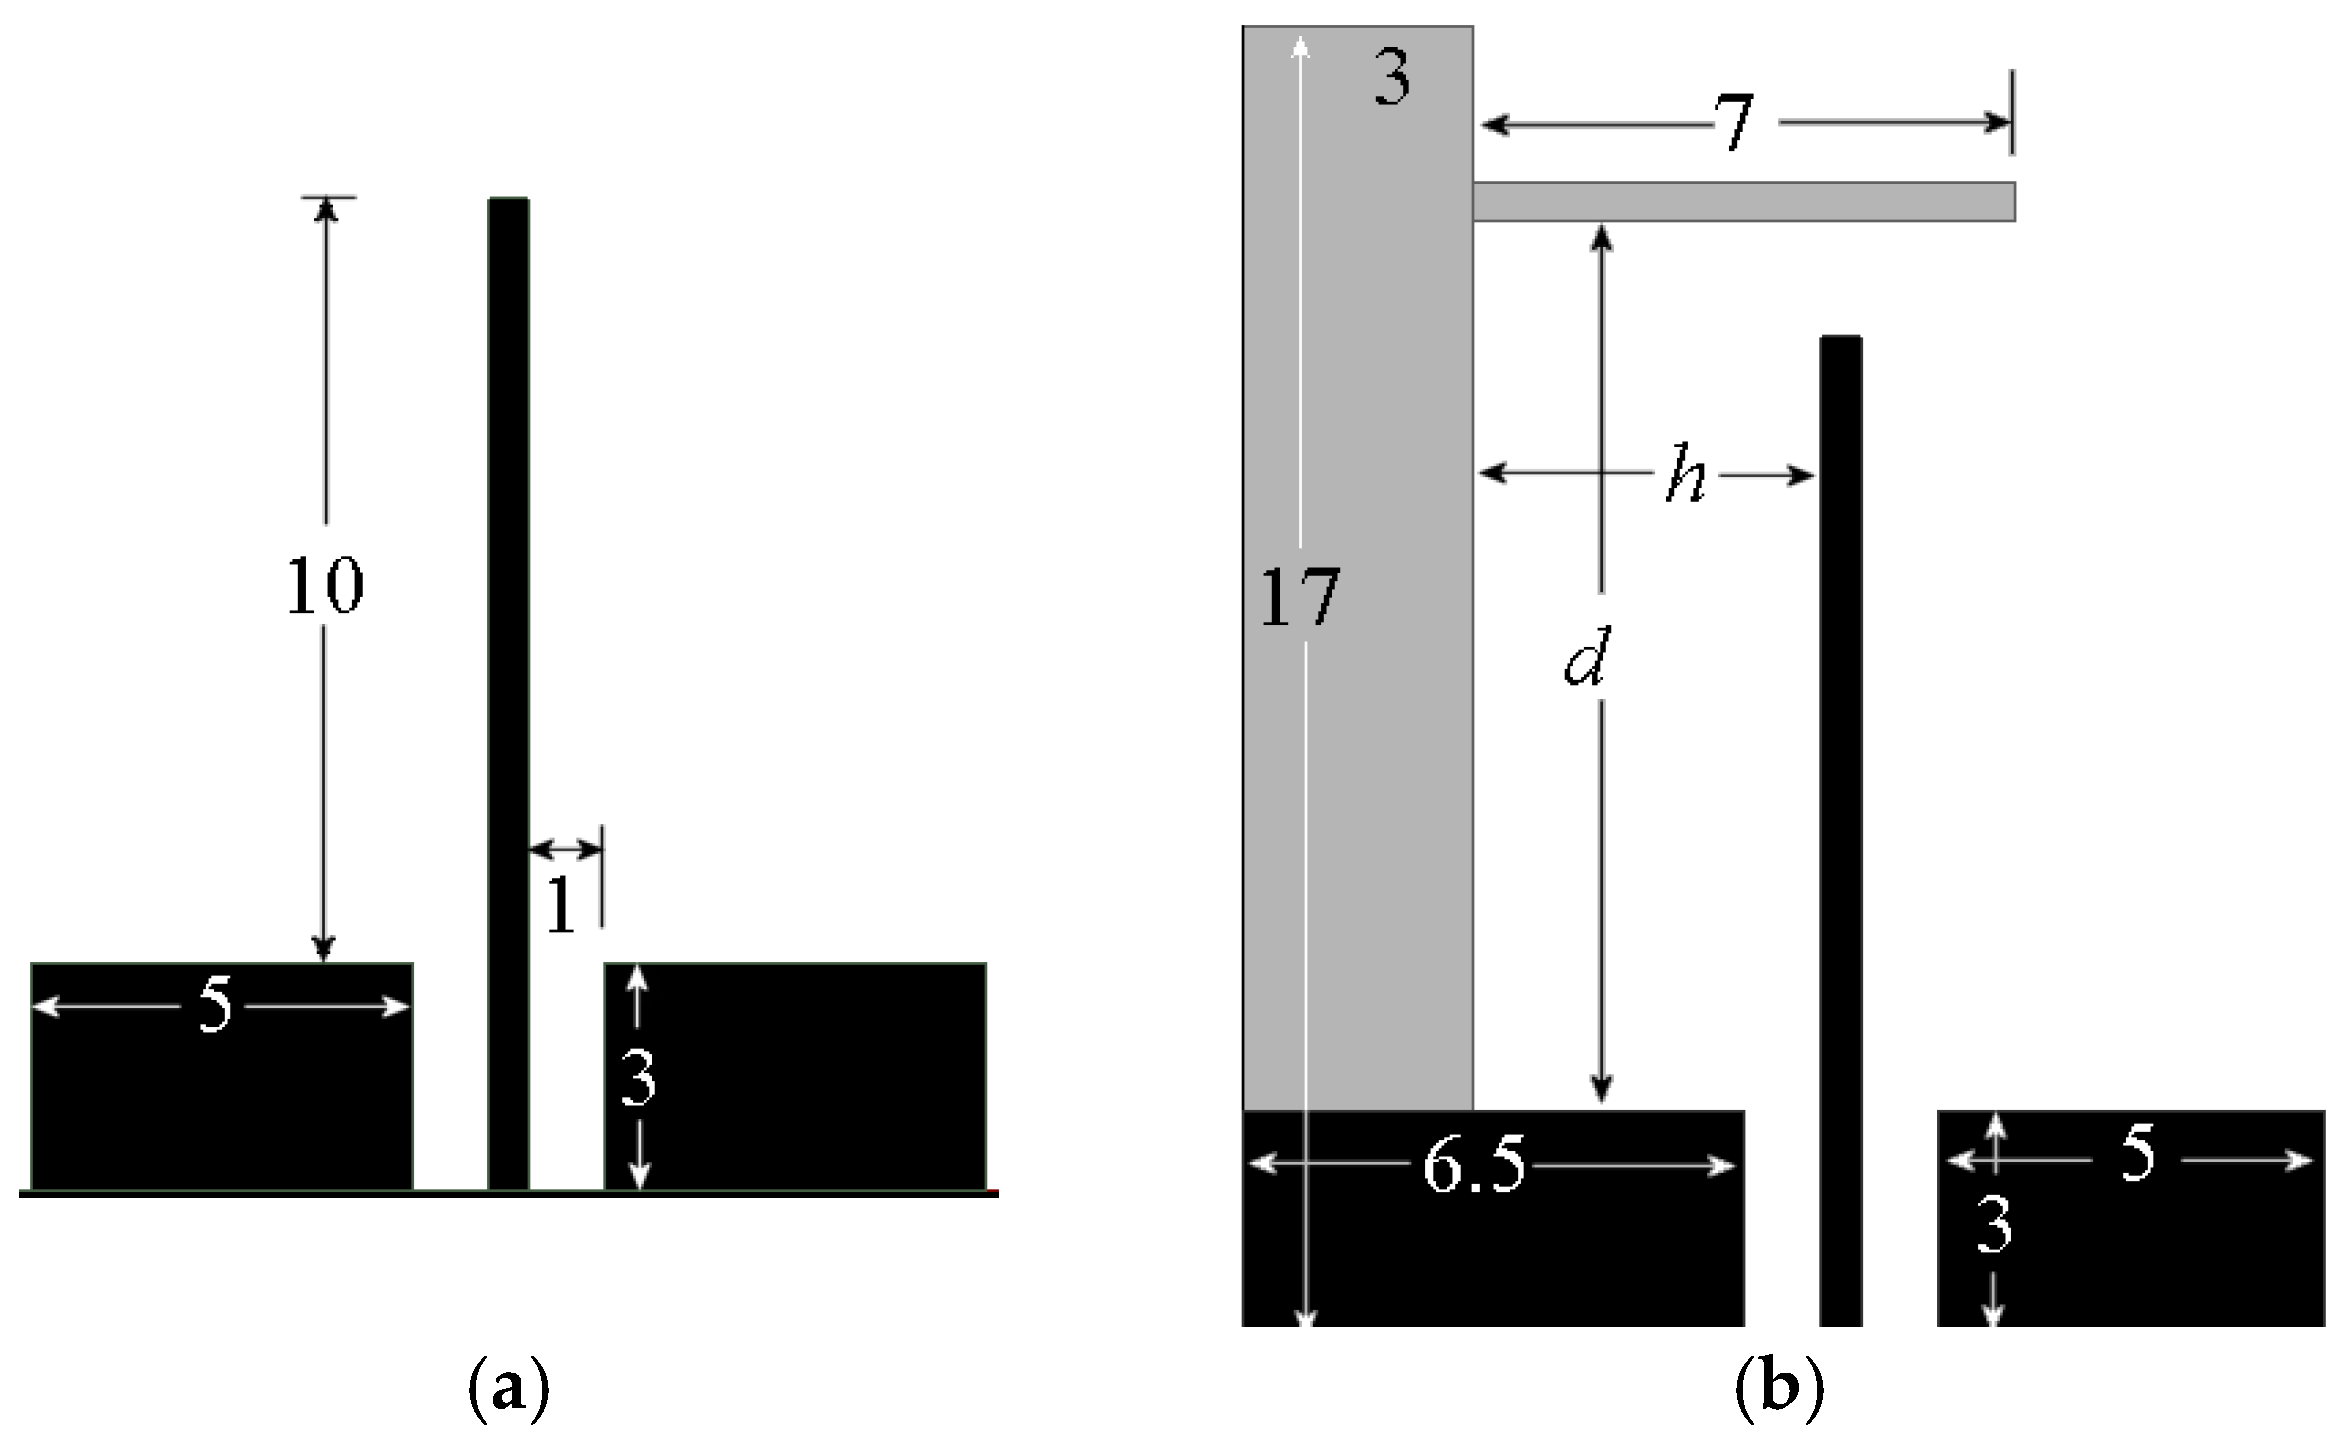
When two radiating structures are placed in close proximity, even if they have different resonant frequencies, mutual electromagnetic coupling occurs. This coupling can be direct through space, through scattering from nearby objects, or even through the excitation network feeding the elements, such as the feed port and ground plane. In a structure like the one proposed in
Figure 1b, which can be considered as an array of two antennas separated by a distance d, it can be treated as a two-port network. The mutual impedance between both antennas can be determined by (1).
where
is the voltage at antenna 1 and
is the current on radiator 2. However, mutual impedance is difficult to calculate numerically [
10] but can be determined using numerical methods or electromagnetic simulation software. Due to mutual coupling, antenna impedance varies depending on several factors, such as element spacing, excitation point, radiator geometry, and operating frequency. Assuming an isolated antenna, as shown in
Figure 1a, its input impedance is given by (2)
when a second radiating structure is positioned at a distance
h from the first, the radiation of this induces a field in the second one, which in turn generates its own radiated field. This mutual interaction influences both structures, resulting in a change in the impedance of the first radiator, as expressed in Equation (3a).
Similarly, the voltage in radiator 2 is influenced by the interaction with current
, as shown in (3b).
Assuming that antenna 2 has a load impedance determined by the interaction with antenna 1, which can be expressed as
, then the voltage at its terminals can be expressed as
. Therefore, Equation (3b) can be rewritten as (4).
From Equation (4),
is obtained and substituted into Equation (3a), yielding
(5a) can be rewritten as (5b)
where
represents the loaded impedance of the primary radiator. Notably,
is a function of the mutual impedance and loaded impedance of the secondary radiator. Therefore, the positional relationship, geometric configuration, and dimensional properties of the secondary radiator exert a direct influence on the characteristic impedance of the primary radiator.
As mentioned above, the calculation of mutual impedance is not easy to achieve; then, a simulation using Finite Element Method (FEM) was performed to investigate the impact of the stub-loading. To initiate, assuming a substrate with a relative permittivity of 10 and a thickness of 0.635 mm, a conventional strip monopole 10 mm in length from the ground plane and fed by a 50 Ohm coplanar line, was considered as a baseline, as shown in
Figure 1a. The ground plane’s (GND) dimensions are 5 mm by 3 mm. To introduce the reactive load, a T-shaped stub was added to the monopole, as depicted in
Figure 1b. The black-colored geometries in
Figure 1b are placed on one side of the substrate, and the T-stub, colored gray, is placed on the backside of the substrate. The monopole’s length and width are kept for this configuration.
To investigate the impact of these relationships and to achieve impedance stabilization over an extended bandwidth, a parametric analysis of the thinner part of the stub’s position relative to the monopole’s GND was undertaken utilizing Ansys® Electronics simulation software 2024.
The monopole width and its gap from the GND were determined based on a 50 Ohm coplanar line design, resulting in a width of 0.5 mm and a gap of 1 mm.
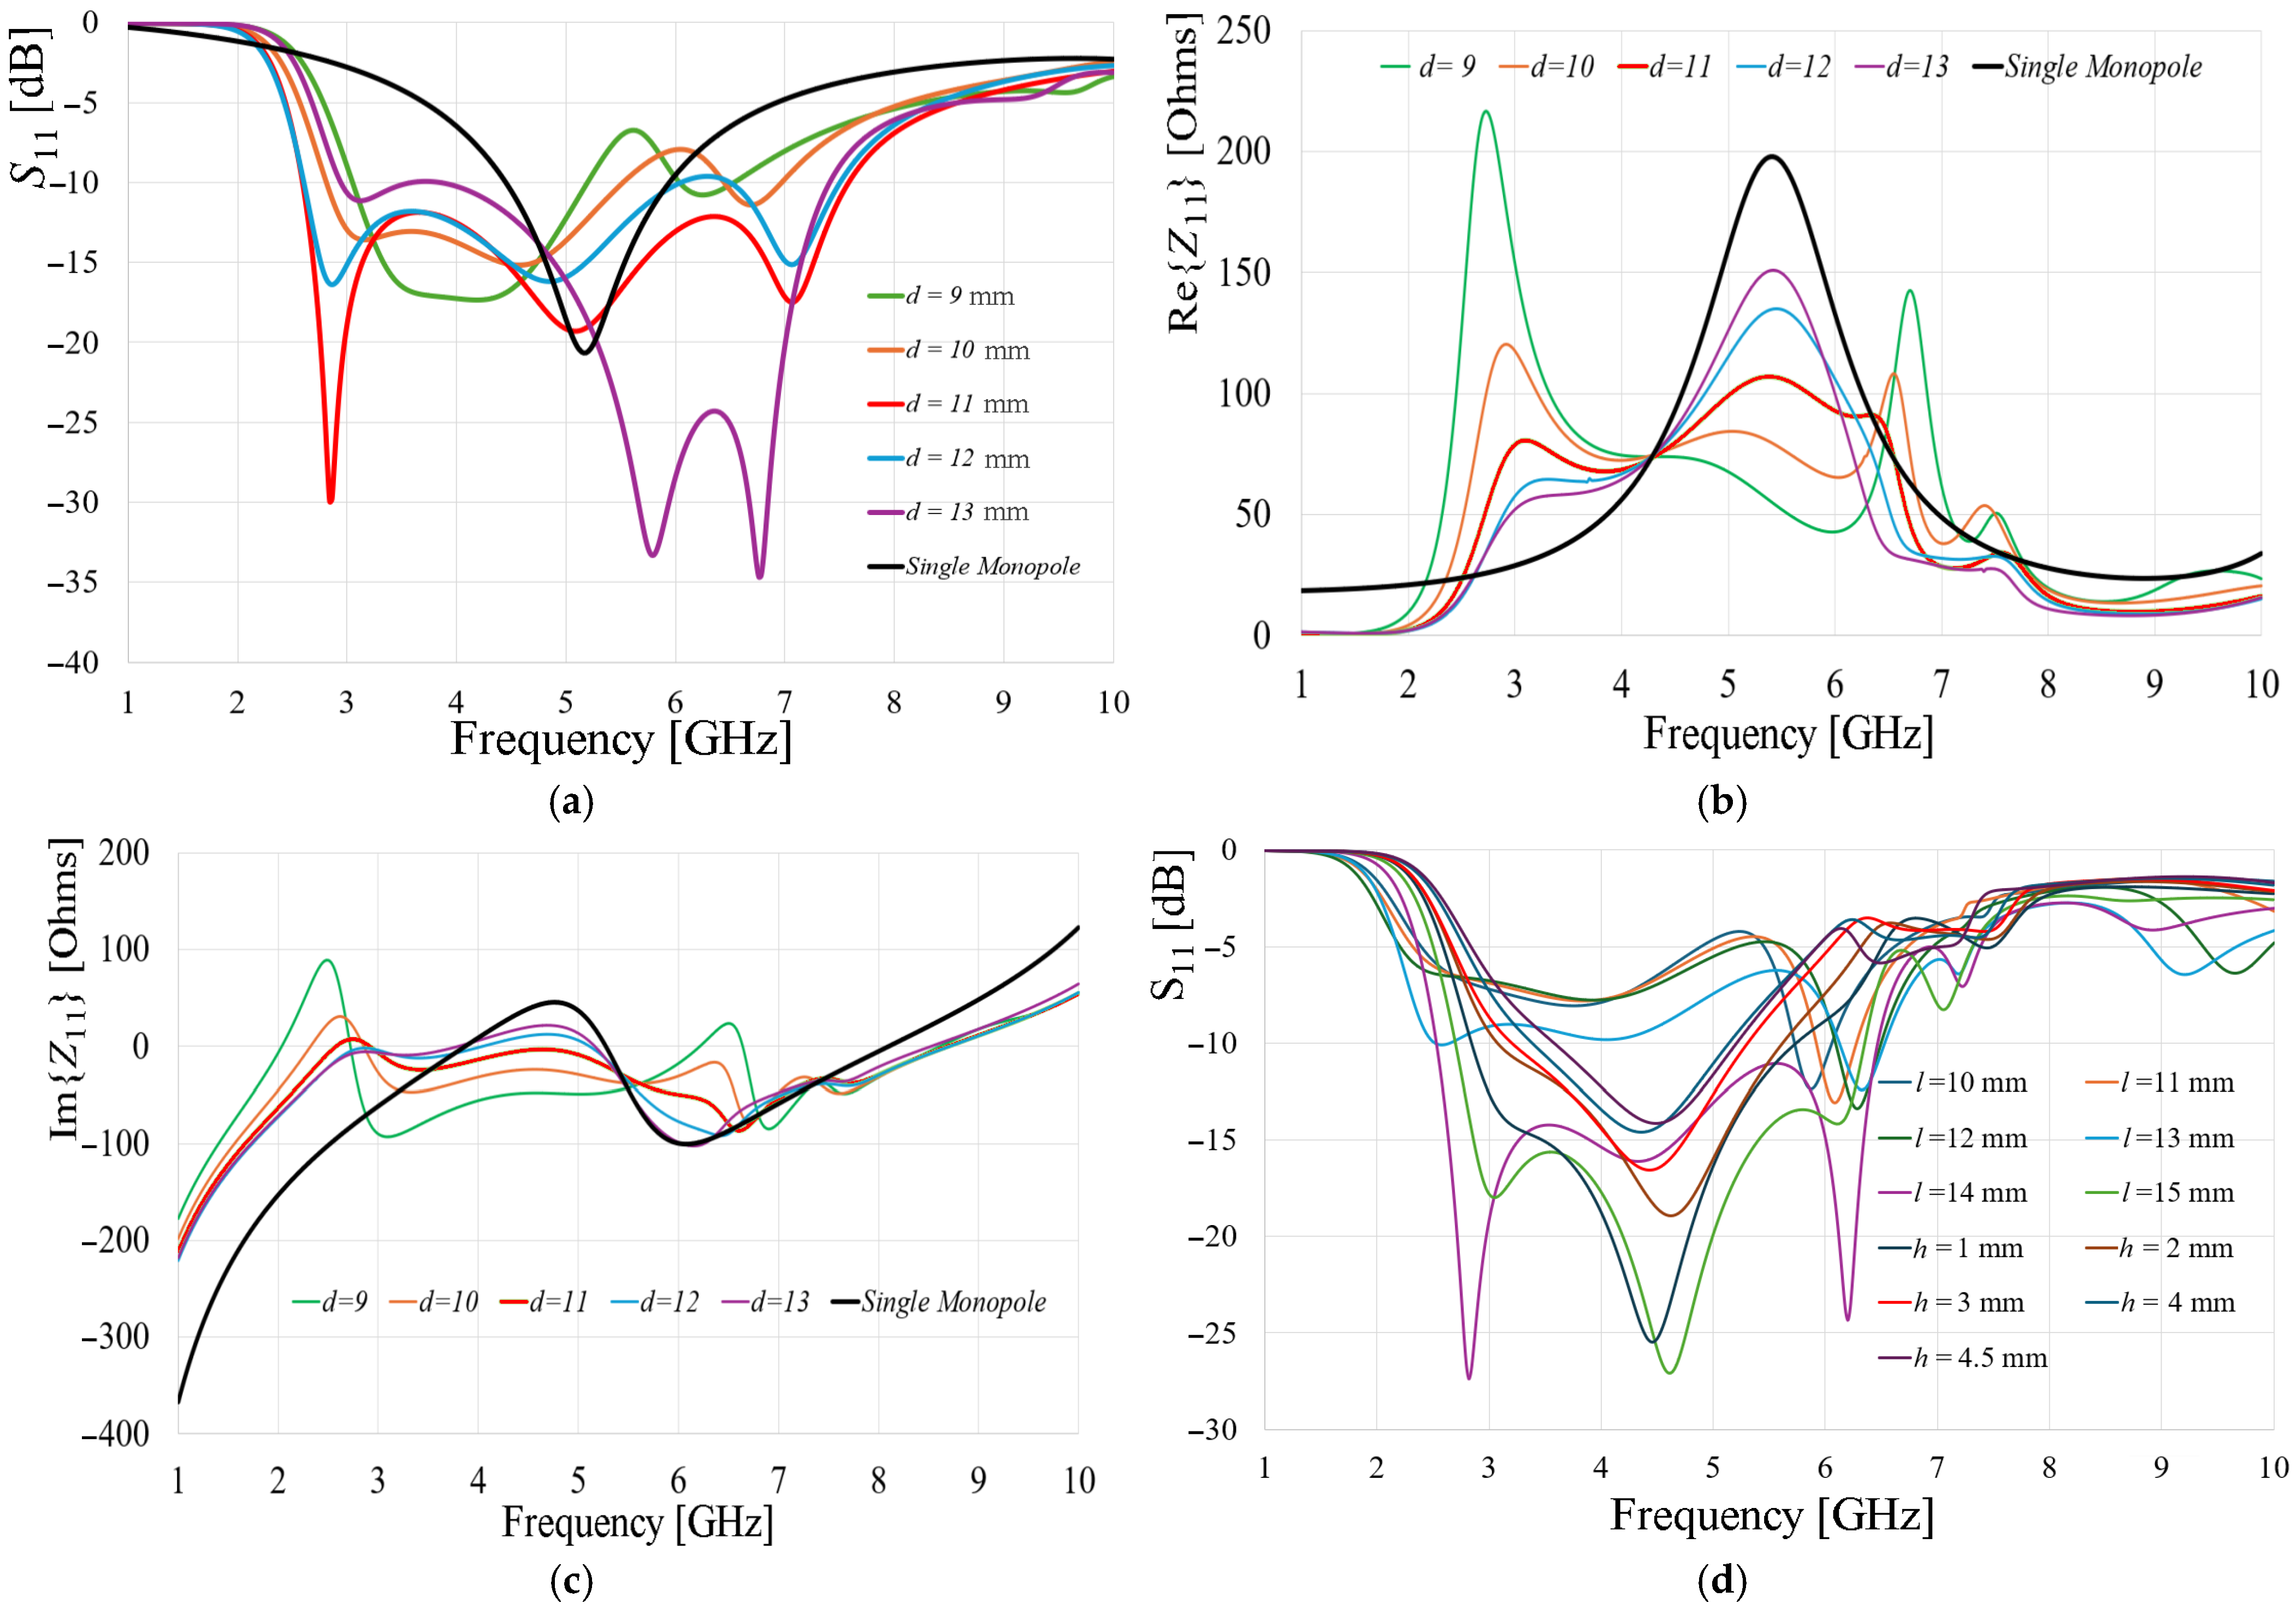
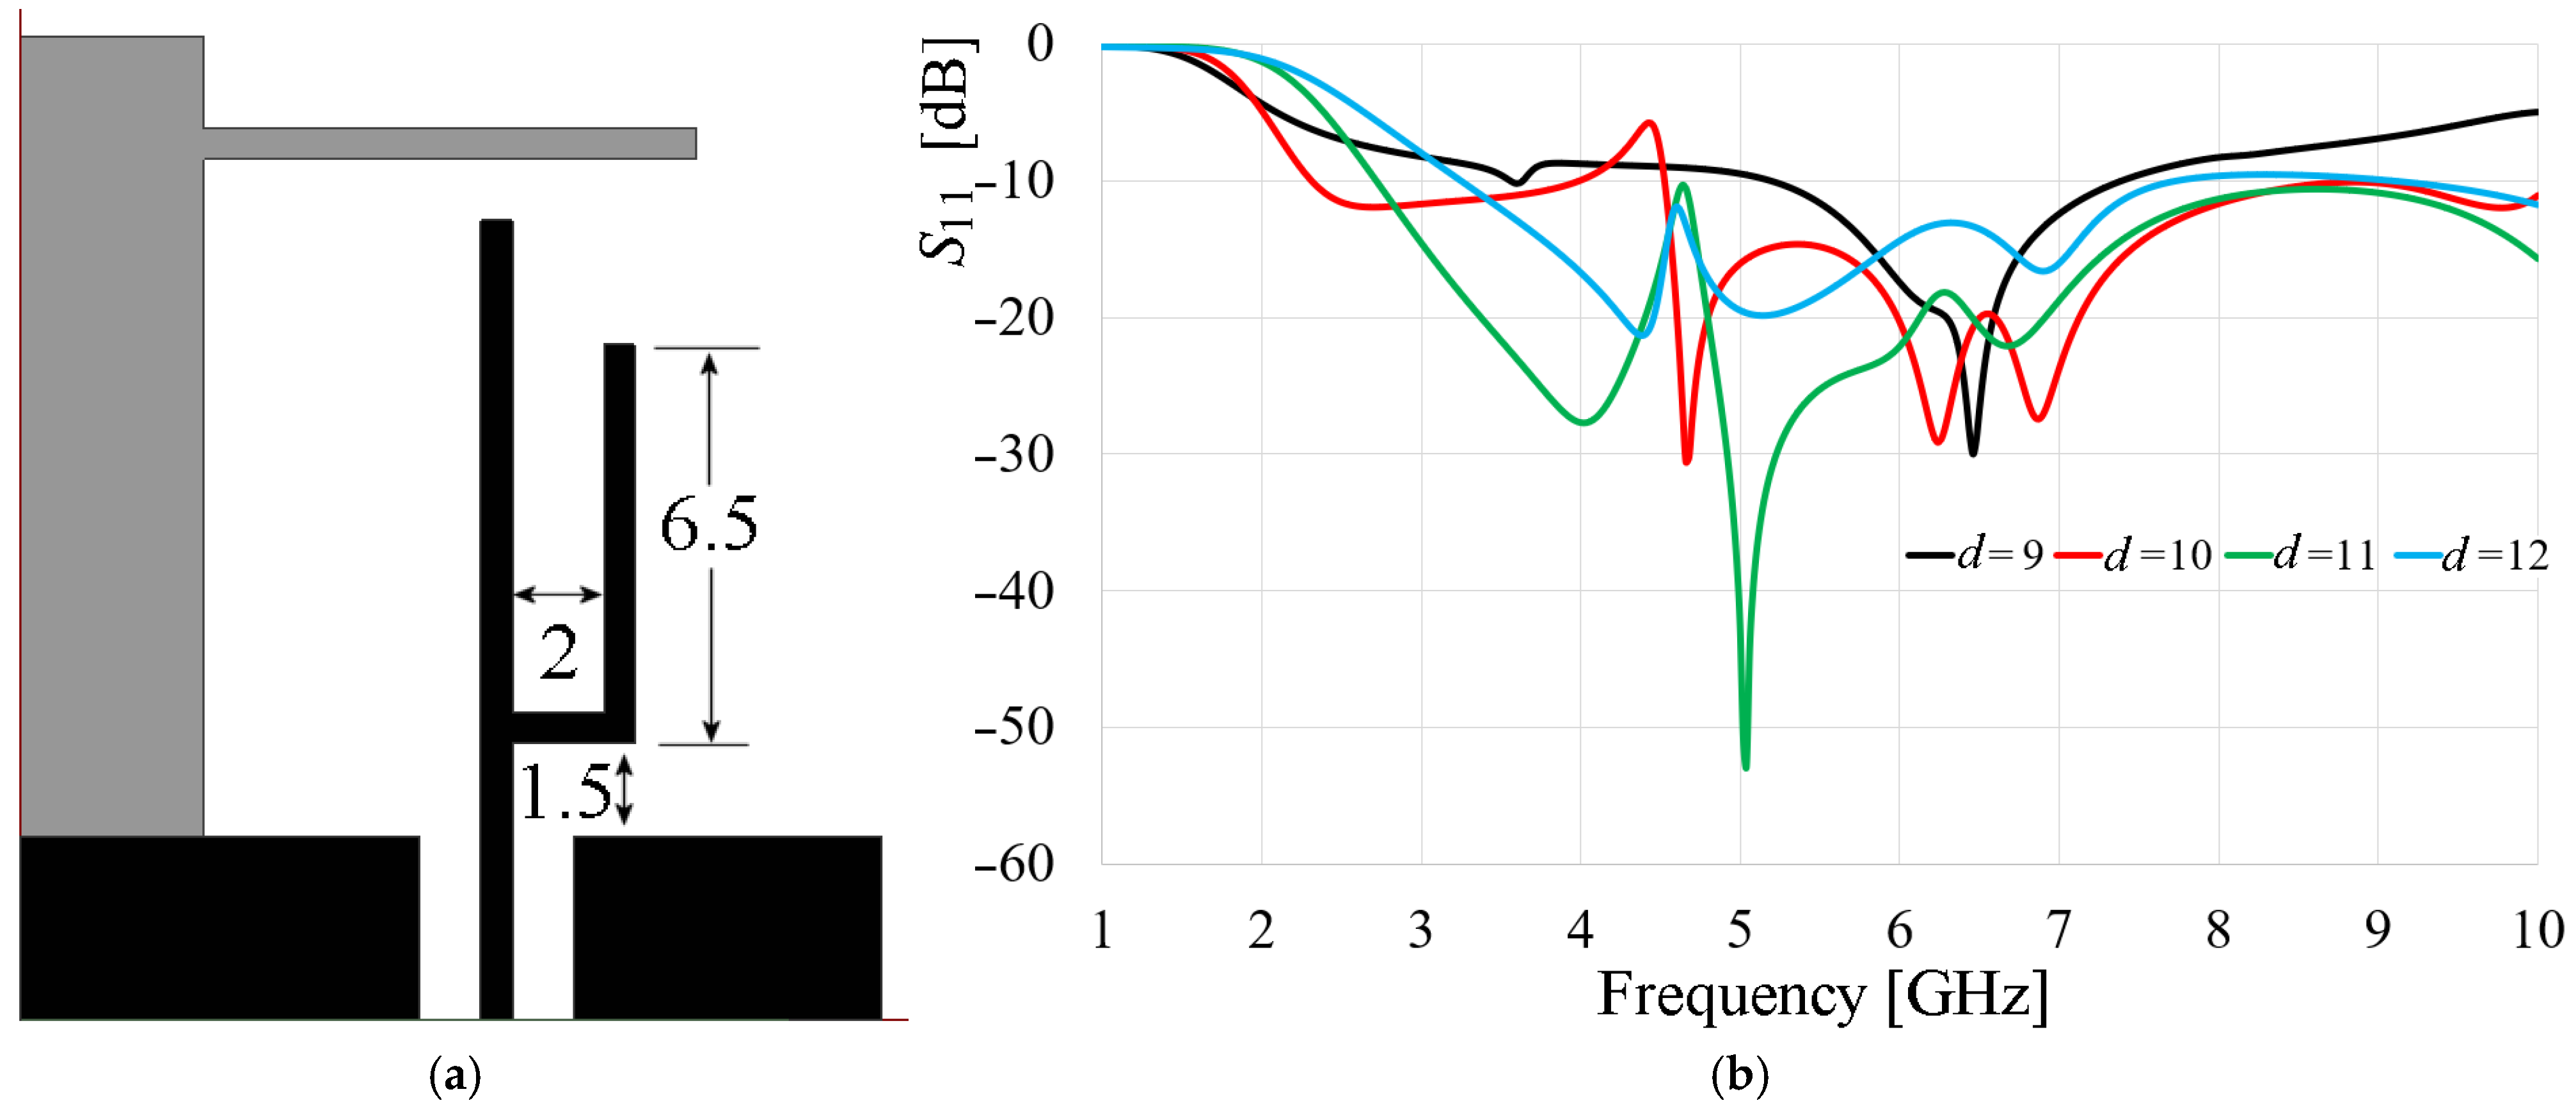
By adjusting the distance,
d, between the thinner arm of the stub and the GND from 9 mm to 13 mm, the simulated frequency responses are presented in
Figure 2. It is observed that the best performance, in terms of −10 dB bandwidth and port matching magnitude, was achieved with
d = 11 mm.
As shown in
Figure 2a, the frequency response of the monopole is modified as expected due to the interaction with the loading by the T-shaped stub, resulting in a broadened operating bandwidth. While the conventional monopole operates from 4.5 GHz to 5.9 GHz (black line) with a resonance frequency of 5.2 GHz, the monopole with the T-shaped stub exhibits an operating range of 2.7 GHz to 7.3 GHz when
d is set to 11 mm.
Analysis of the results depicted in
Figure 2b,c, for the case where
d = 11 mm, reveals that the real and imaginary components of the conventional monopole’s impedance can be stabilized through the use of the T-shaped stub. For the conventional strip-monopole, the real component of its impedance varies from approximately 90 Ohms to nearly 200 Ohms within the −10 dB impedance bandwidth. In contrast, the configuration with the stub exhibits variations from 65 Ohms to a maximum of 105 Ohms over a broader bandwidth. Regarding the imaginary component of the input impedance, the reactance of the conventional monopole varies from 40 Ohms to a value of −100 Ohms. However, for the stub-loaded monopole, the reactive component maintains a capacitive behavior with values close to zero Ohms, with a threshold from −10 Ohms to 0 Ohms within the operating bandwidth. A similar effect was demonstrated in [
11], where the imaginary part of the mutual impedance of two dipoles approached zero according to their position and separation. As a complementary analysis, variations of the position of the stub from the monopole, as well as its length, are presented in
Figure 2d, in which it is observed that the port matching and bandwidth are also dependent on these dimensions. Observing that for a stub length of 14 and 15 mm, a good match and bandwidth are also obtained.
As a result of the presence of the stub, hither can be concluded that the monopole impedance is stabilized over a wider bandwidth, exhibiting minimal variations and compensating for the reactive component, bringing it closer to zero Ohms. On the other hand, considering the −10 dB reflection coefficient, the unloaded monopole presents a 1.4 GHz bandwidth, while the loaded monopole shows a 4.9 GHz bandwidth; besides, the lower cutoff frequency for the latter was shifted from 4.5 GHz to 2.7 GHz. Therefore, it can be assured that the use of the proposed technique elongates the antenna’s electric length.
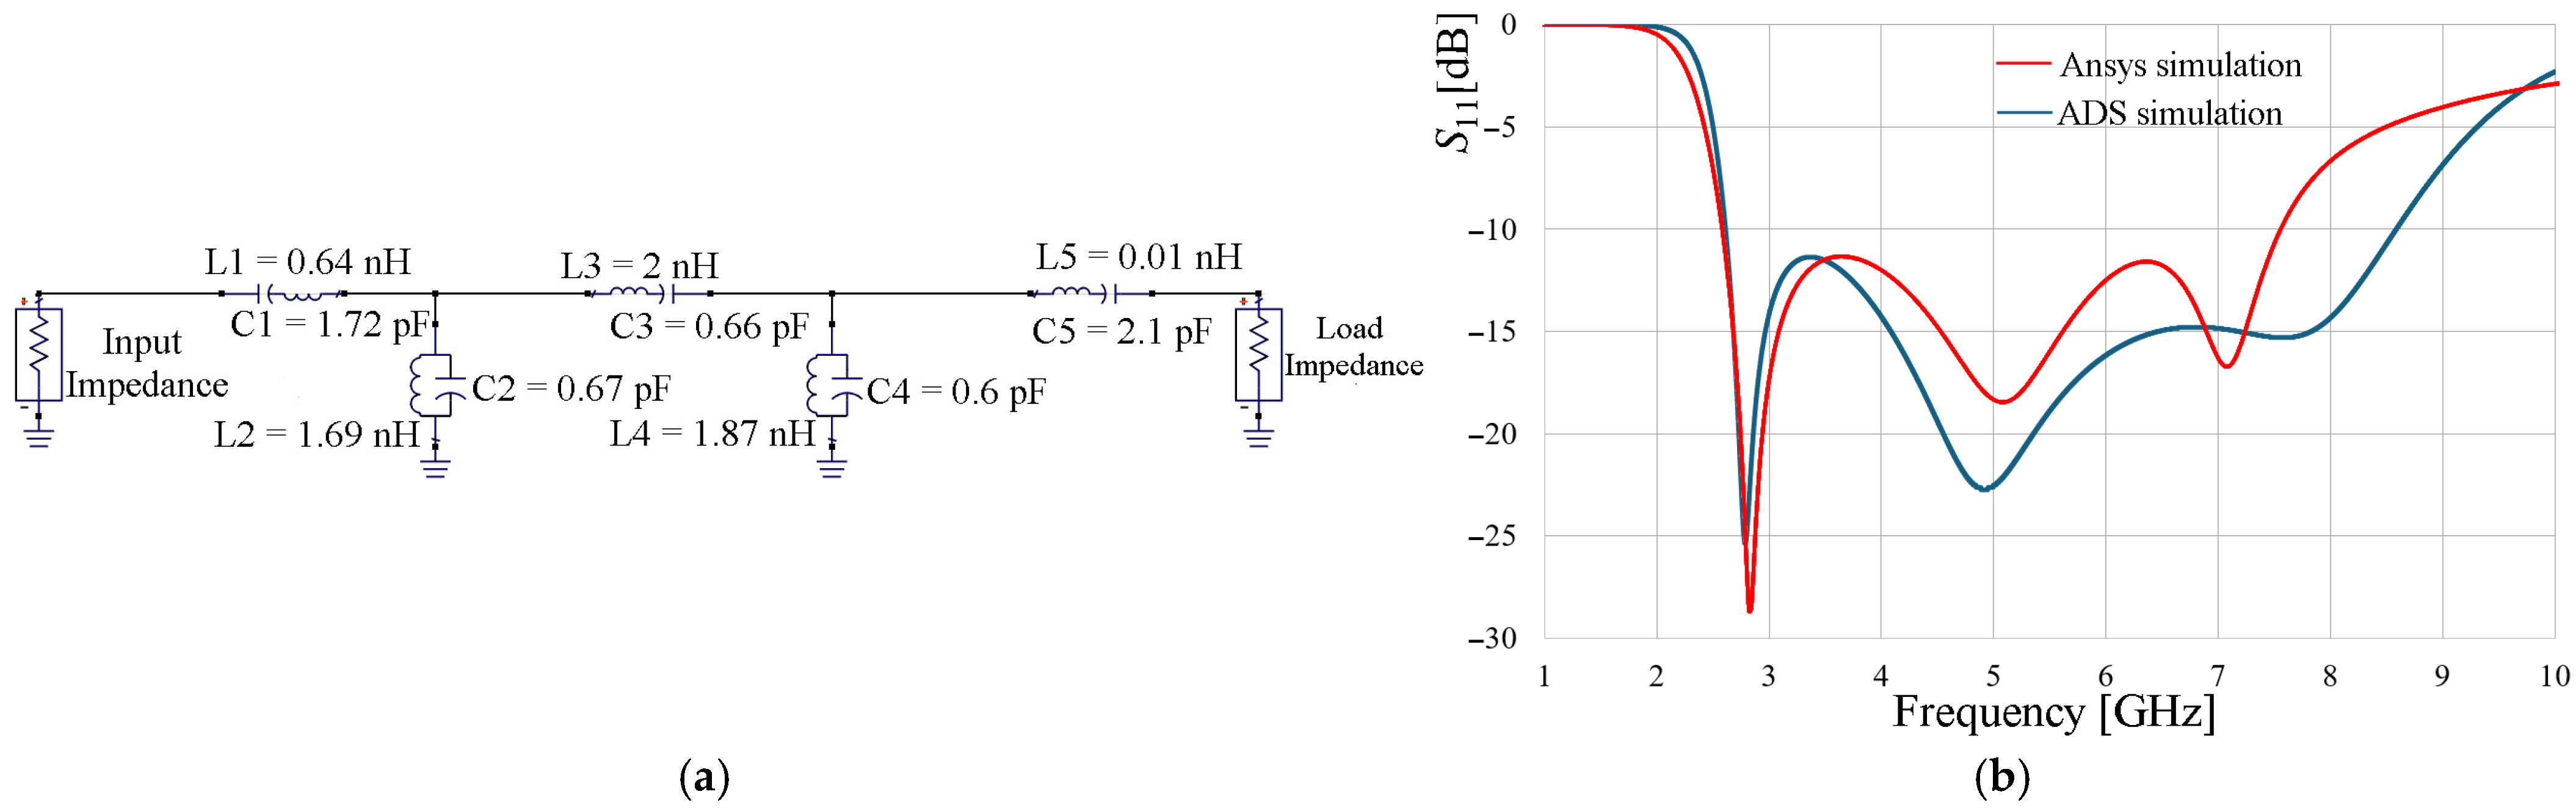
The mutual coupling and modification of the antenna input impedance of the loaded monopole can be modeled with an equivalent electric circuit response. To model the antenna through the electrical circuit shown in
Figure 3a, the theoretical current distribution of a quarter-wavelength monopole is considered [
10]. For this reason, the circuit represents the antenna’s behavior in three sections: the feed section near the ground plane, where the current intensity is the highest; the central part of the monopole, where the current intensity possesses a medium value; and the end of the radiator near the thin part of the stub, where theoretically, the current intensity should be zero. However, due to the stub loading, these characteristics change. The first section is composed of C1, L1, C2, and L2. The second section is determined by L3, C3, L4, and C4, while the third section is modeled by L5 and C5.
C1 represents the equivalent capacitance between the ground plane of the coplanar line and the thick part of the stub, while L1 emulates the behavior of the inductance associated with the section of the stub closest to the ground plane. L2 models the extra inductance associated with the magnetic coupling between the monopole and the thick part of the stub near the ground plane. C2 is the associated capacitance formed between the monopole and the thick part of the stub near the ground plane. For the second part, L3 represents the inductance associated with the section of the stub in the middle part until the junction with the narrow part, while C3 emulates the behavior of the capacitance generated depending on the width of the stub line. While L4 and C4 represent the extra inductance due to the magnetic coupling between the monopole and the stub and the associated capacitance between both structures in this part of the arrangement, respectively. Finally, for the third part, L5 emulates the behavior of the inductive nature of the thinner section of the stub, orthogonal to the thicker section, and C5 is the capacitance presented between the monopole and the thin section of the stub.
The values of the elements were determined based on the wideband coupling response obtained from the electromagnetic simulation, with initial values based on the reflection coefficient of a Butterworth filter prototype, and the final values were obtained through a parameterization process using Advanced Design System
® (ADS 2025 Update 2.0). The comparison of the response obtained using electromagnetic simulation (Ansys) and the circuit model (ADS) is presented in
Figure 3b.
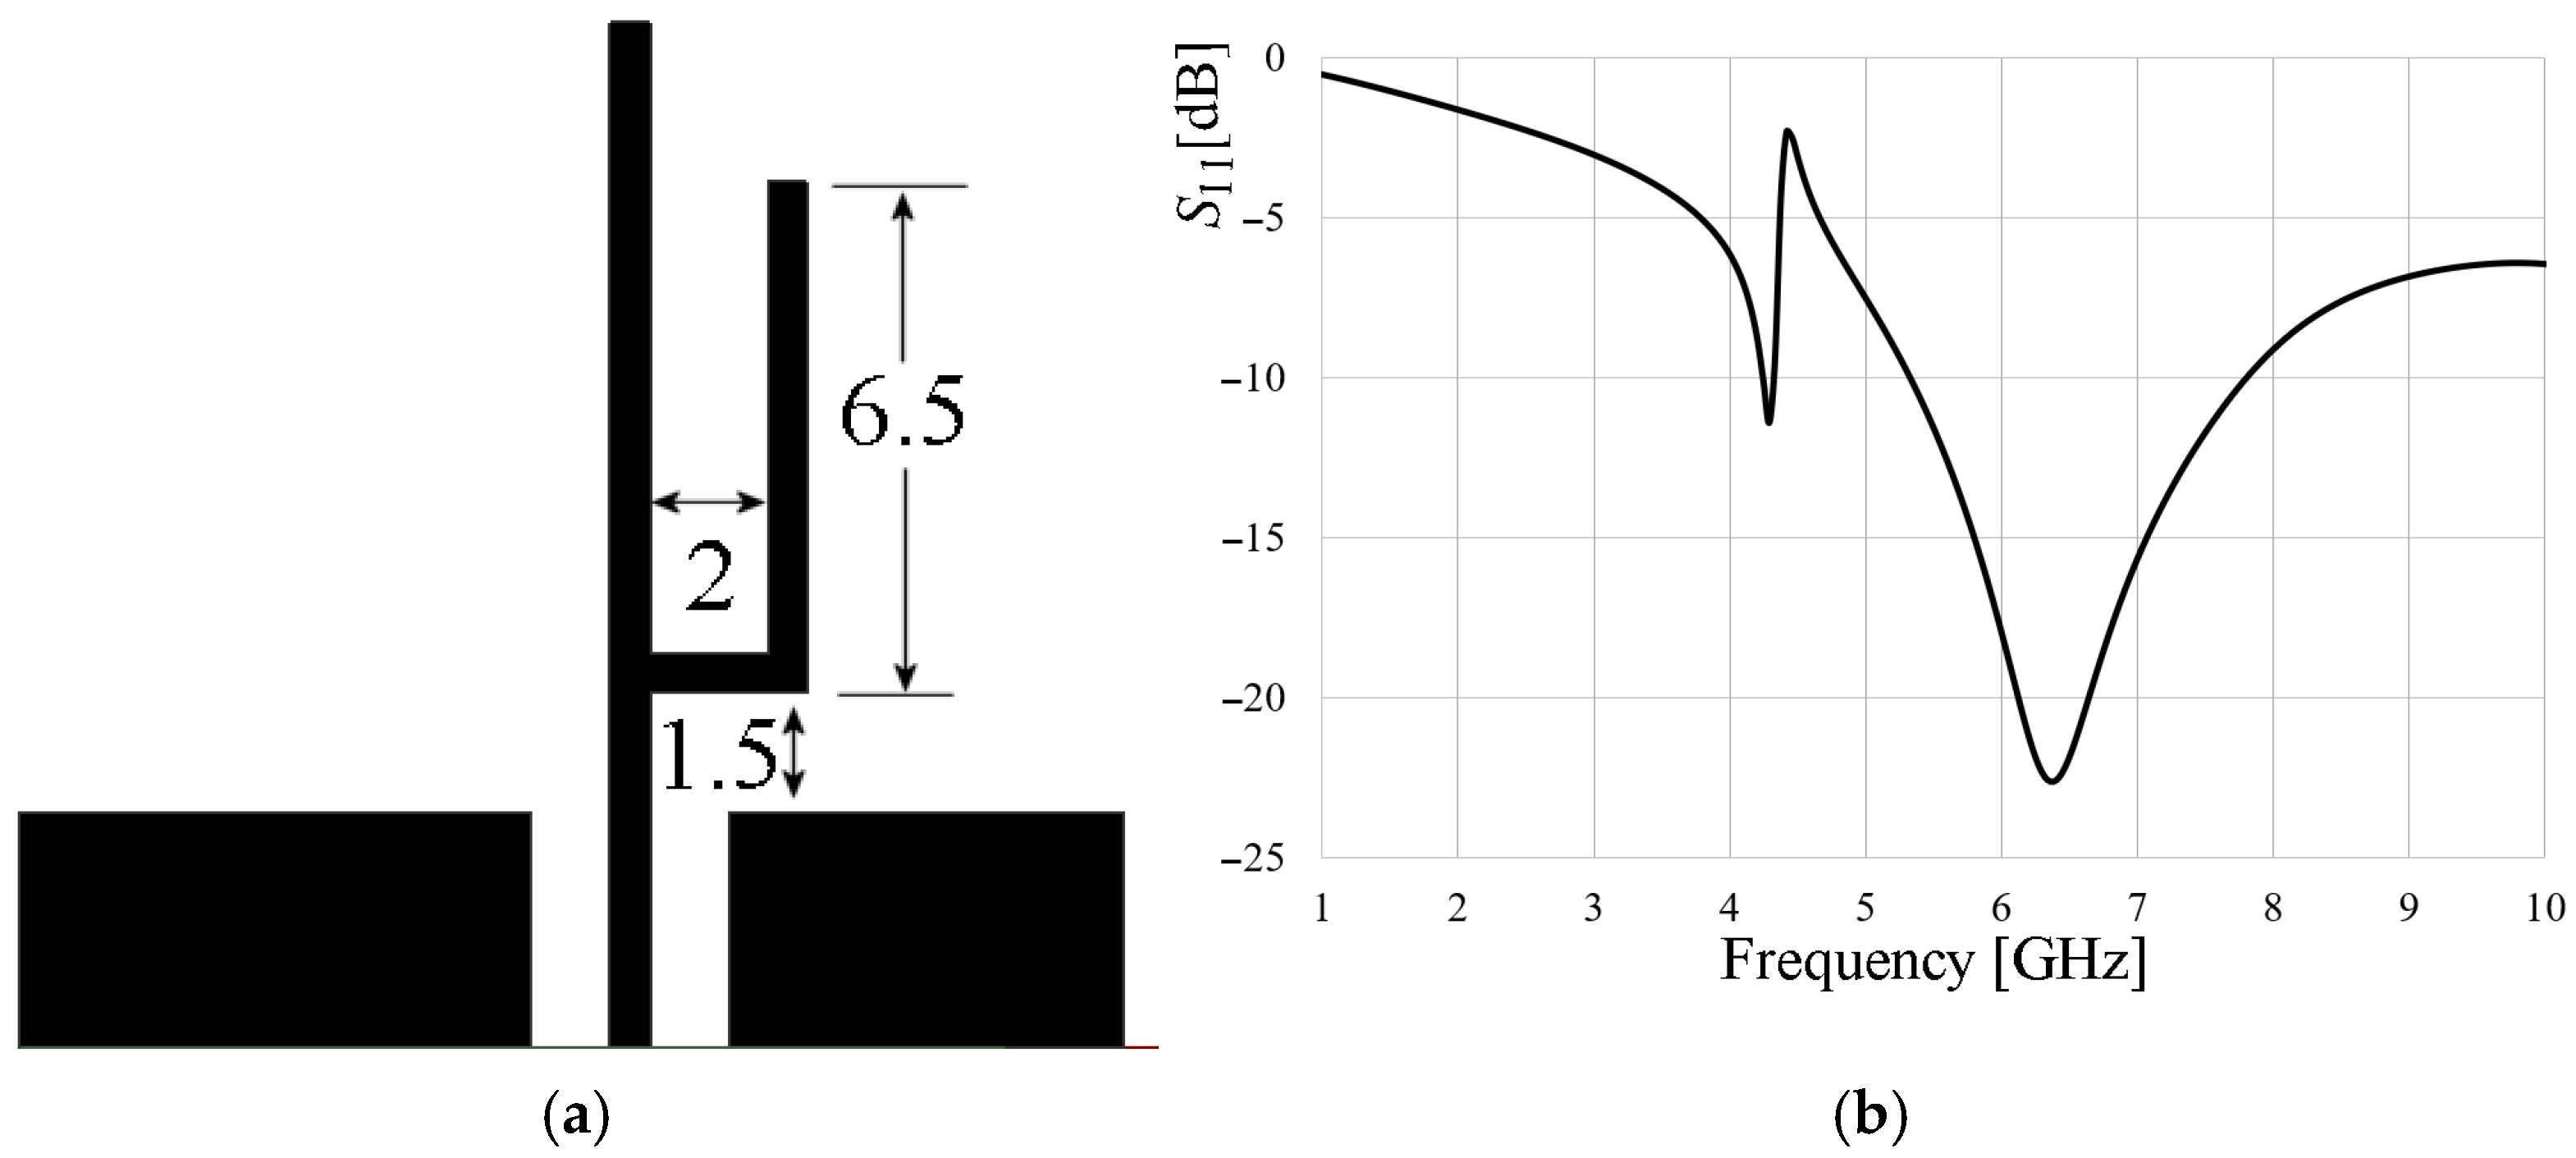
In order to expand, even more, the bandwidth of the antenna loaded with the T-shaped stub, an additional monopole with a shorter length is introduced. This shorter monopole creates a higher resonance, which overlaps with the resonance of the longer monopole, leading to a wider operating bandwidth. This approach is commonly used in antenna design and has been implemented in various structures, including logarithmic antennas [
10] and fractal antennas [
12]. The proposed configuration is displayed in
Figure 4a, and its frequency response is presented in
Figure 4b.
In
Figure 4a, the second arm of the monopole was sized to have a resonance close to that of the main arm, resulting in overlapping resonances. For this configuration, the ground plane dimensions were maintained, as shown in
Figure 1b. As seen in
Figure 4b, the two-arm monopole exhibits two resonances, one near 4.3 GHz and another at 6.3 GHz. As expected, the resonance of the larger monopole was shifted due to the loading generated by the second arm. At the first resonance, the radiator is mismatched and exhibits a high
Q, while at the second resonance, a bandwidth of approximately 2.5 GHz is obtained with a port coupling of around −23 dB. This response was left unoptimized to allow for better performance when integrating the tuning with the stub. The results of this integration are presented in the following section.
3. MIMO Configuration
The proposed two-branches monopole antenna, loaded with the stub configuration is illustrated in
Figure 5a, and its frequency response for varying values of
d is depicted in
Figure 5b.
For different
d values, as observed in
Figure 5b, a stub separation of
d = 11 mm was chosen as a compromise between bandwidth and port matching level. The resulting frequency response, depicted by the green curve in
Figure 5b, exhibits a broader bandwidth extending from approximately 2.68 GHz to beyond 10 GHz. Critical coupling points occur at 4.64 GHz and 8.62 GHz, corresponding to
S11 values of −10.34 dB and −10.64 dB, respectively. This straightforward design, which employs the reactive load induced by the T-shaped stub, offers ultra-wideband operation without increasing the complexity of the overall geometry or calculations. The compact antenna footprint of 14 × 16 mm² is significantly smaller compared to a conventional strip monopole. Considering the free-space wavelength at the lower cutoff frequency, these dimensions correspond to 0.11
λ0 × 0.13
λ0, respectively.
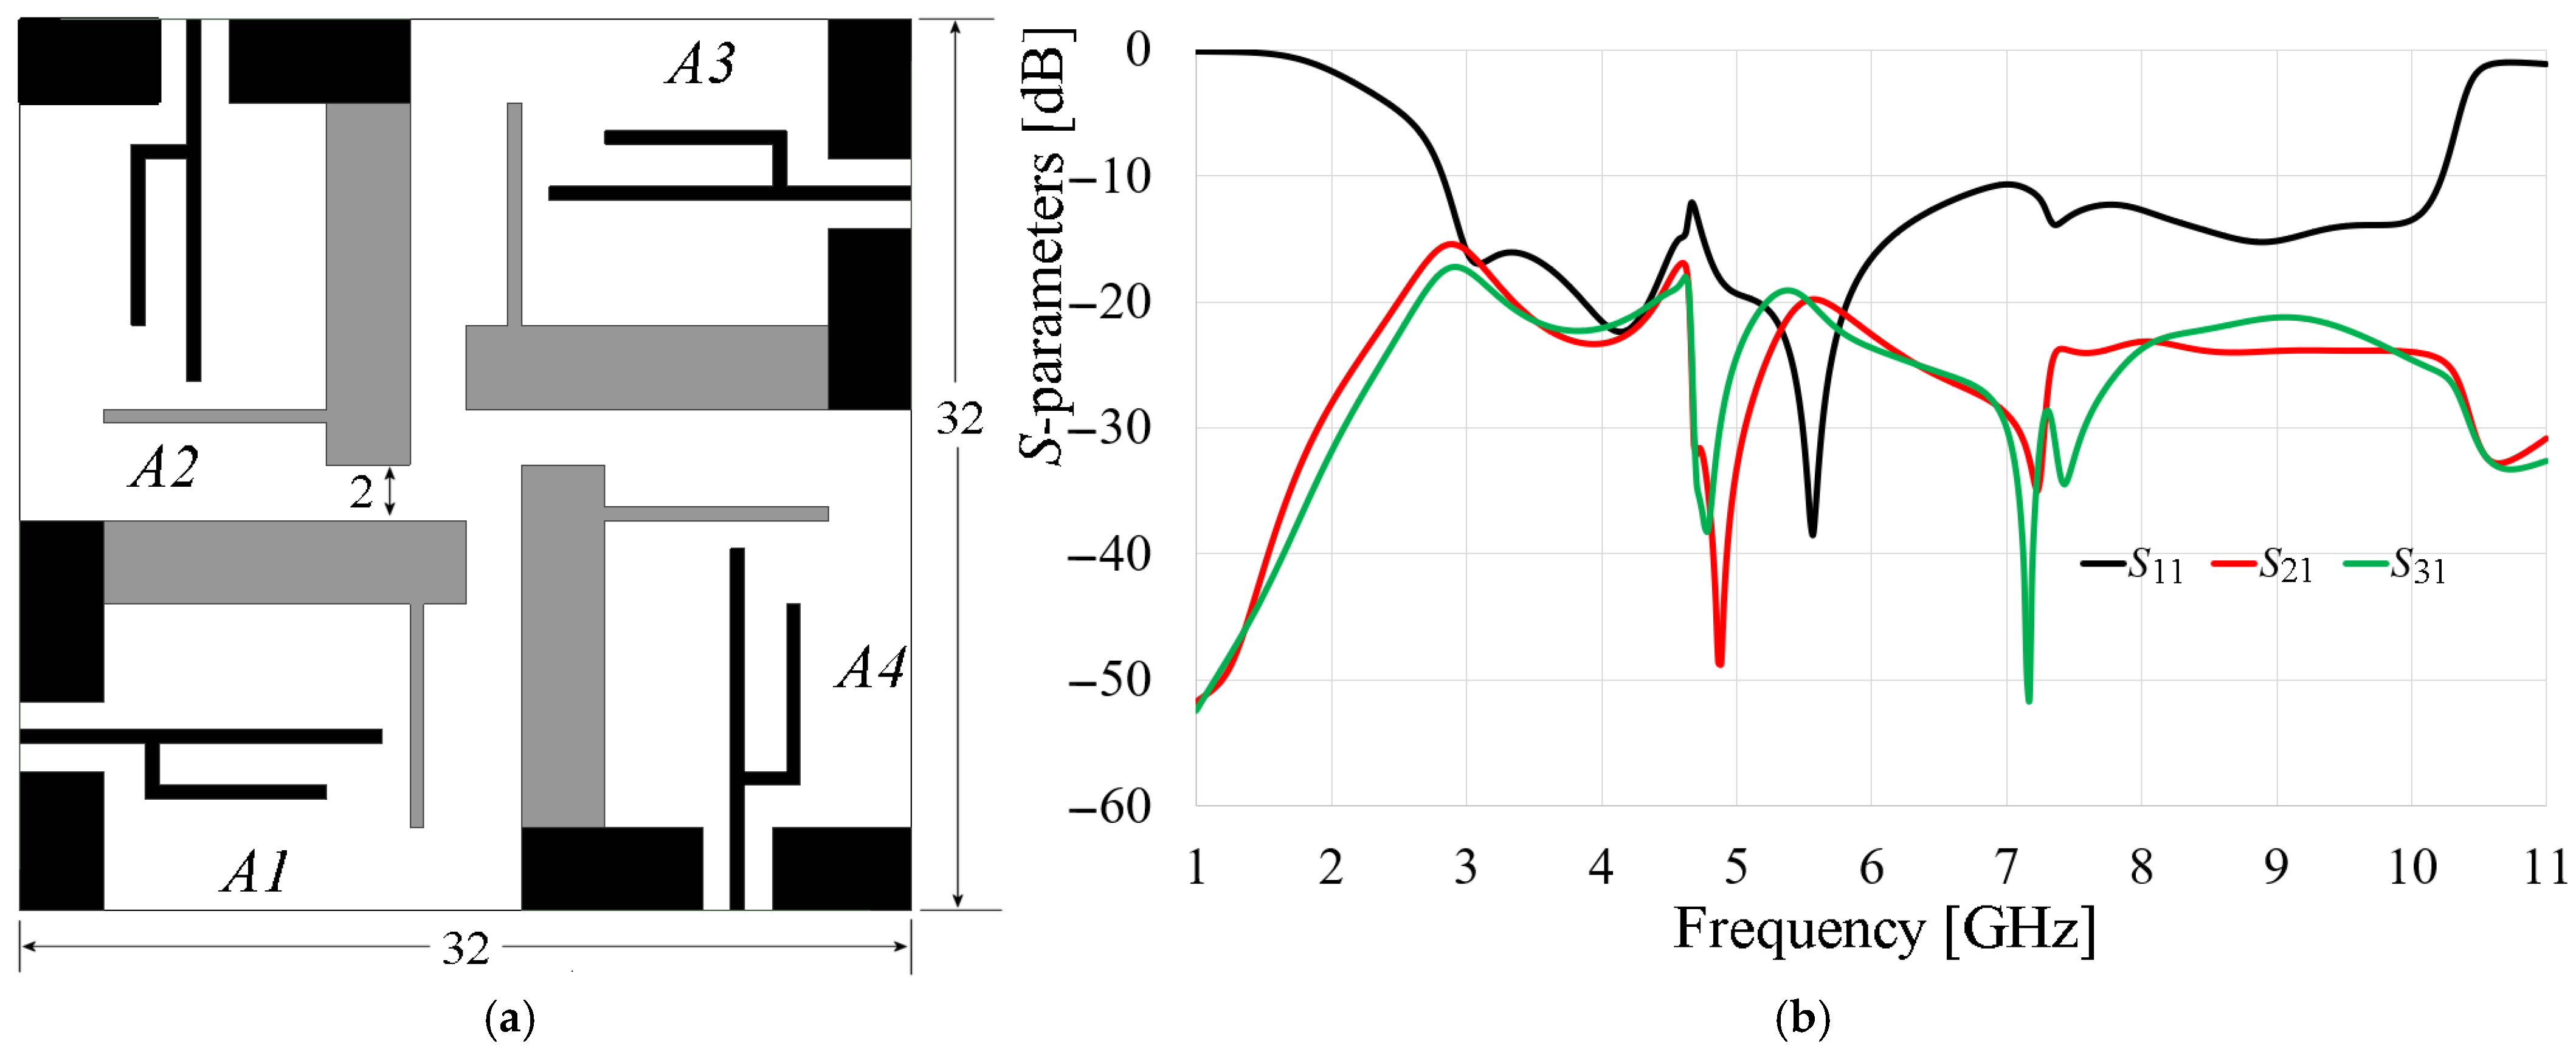
Based on the previous results, a four-element MIMO array is proposed which is illustrated in
Figure 6a. An axial symmetry configuration was selected for the MIMO antenna design to maximize isolation among the radiated electric fields of the individual elements. Consequently, for a clearer representation of results, it is sufficient to illustrate the magnitude in dB of the
S11,
S21, and
S31 parameters, as any other parameter combination would exhibit analogous behavior. The simulated
S-parameter results are depicted in
Figure 6b.
The array footprint is 32 mm × 32 mm, with the closest element spacing being 2 mm, as indicated in
Figure 6a. The impedance bandwidth of the array, depicted in
Figure 6b, extends from 2.8 GHz to 10.3 GHz, considering
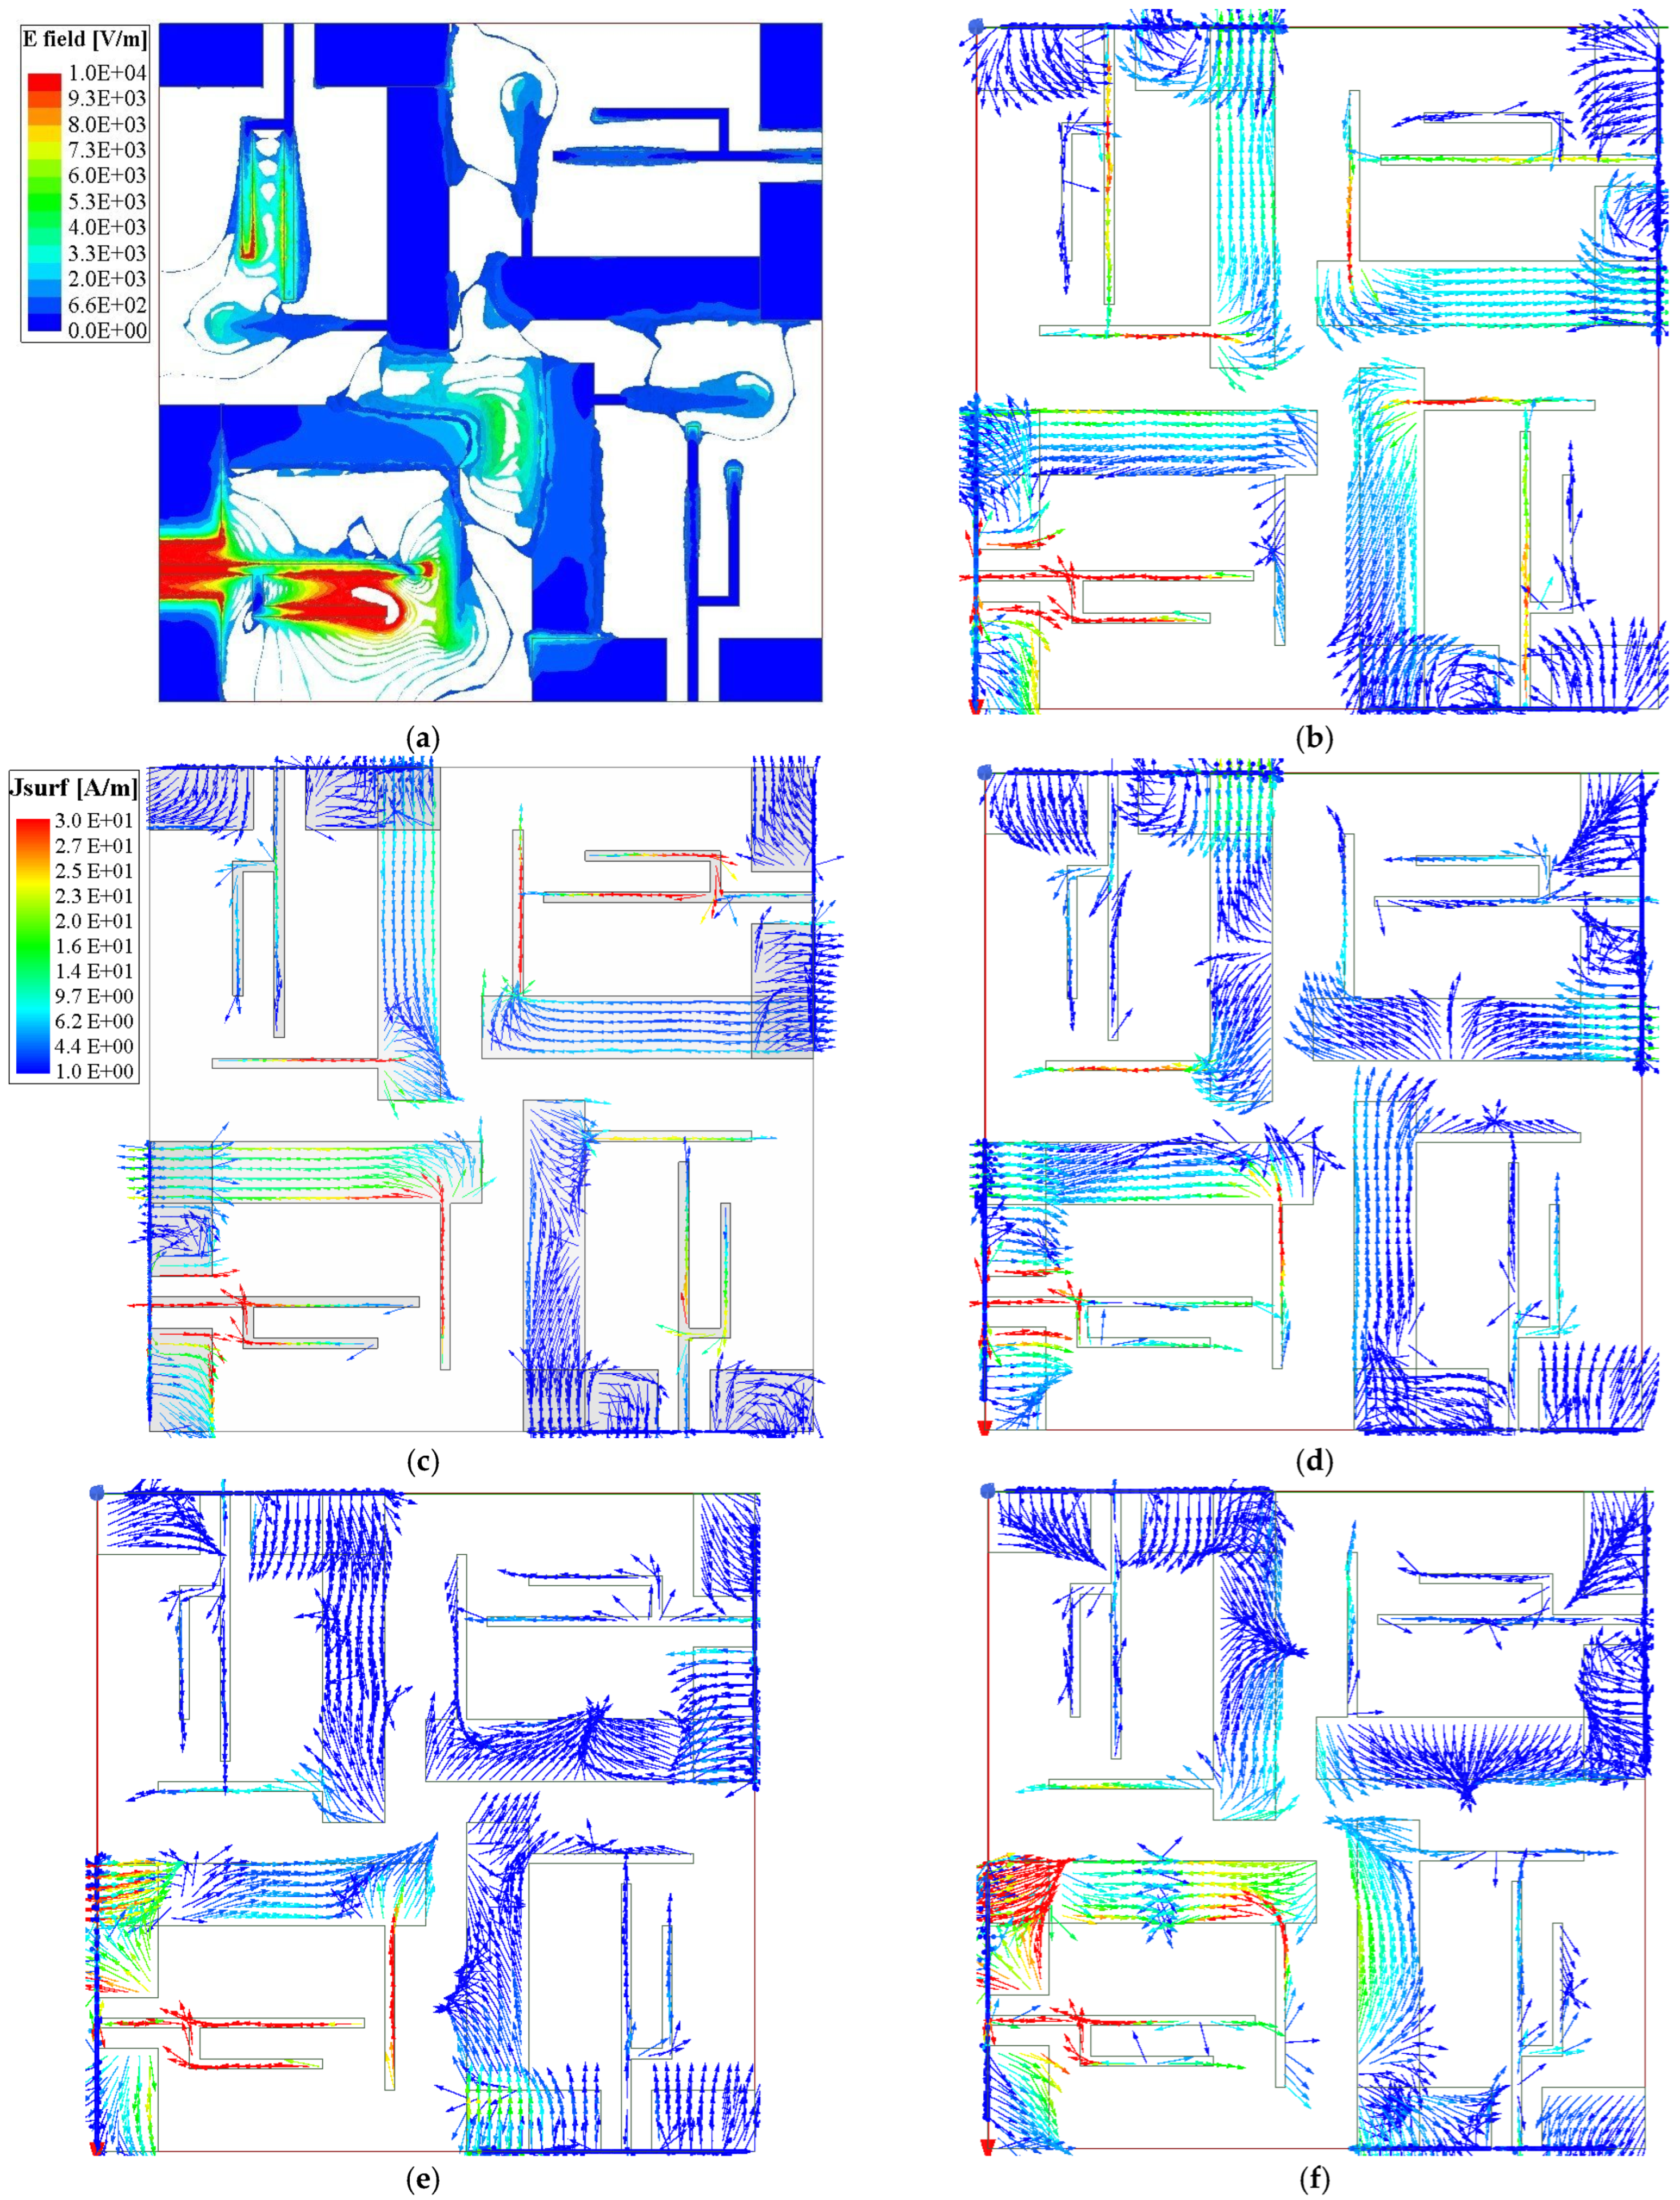
S11 = −10 dB. Moreover, the electromagnetic isolation among the elements consistently is more than 18 dB, which is exceptional given the tight element spacing. This high level of isolation can be attributed not only to the orthogonal polarization of the elements but also to the stubs that act as an effective electromagnetic barrier. To demonstrate this hypothesis, a surface current analysis is carried out. The surface current distribution at different frequencies is illustrated in
Figure 7, which clearly shows the reduced current induction among elements when antenna 1 (
A1) is excited and also demonstrates how the electric length is increased since the surface current is coupled from the strip-monopoles to the thinner arm of the stub and fed back to the ground plane, making the trajectory longer, and therefore, obtaining a smaller lower-cutoff frequency. Also,
Figure 7a shows the shielding of the electric field distribution and how its magnitude is reduced to other antennas when radiator 1 is excited.
In this case, the analysis is shown at the middle band; however, the behavior is similar over the bandwidth, as depicted in
Figure 7b–f.
Once the simulated frequency response of the array, encompassing both bandwidth and isolation has been validated, the MIMO performance was evaluated. Then, the prototype based on the configuration of
Figure 6a is built and its photograph is displayed in
Figure 8.
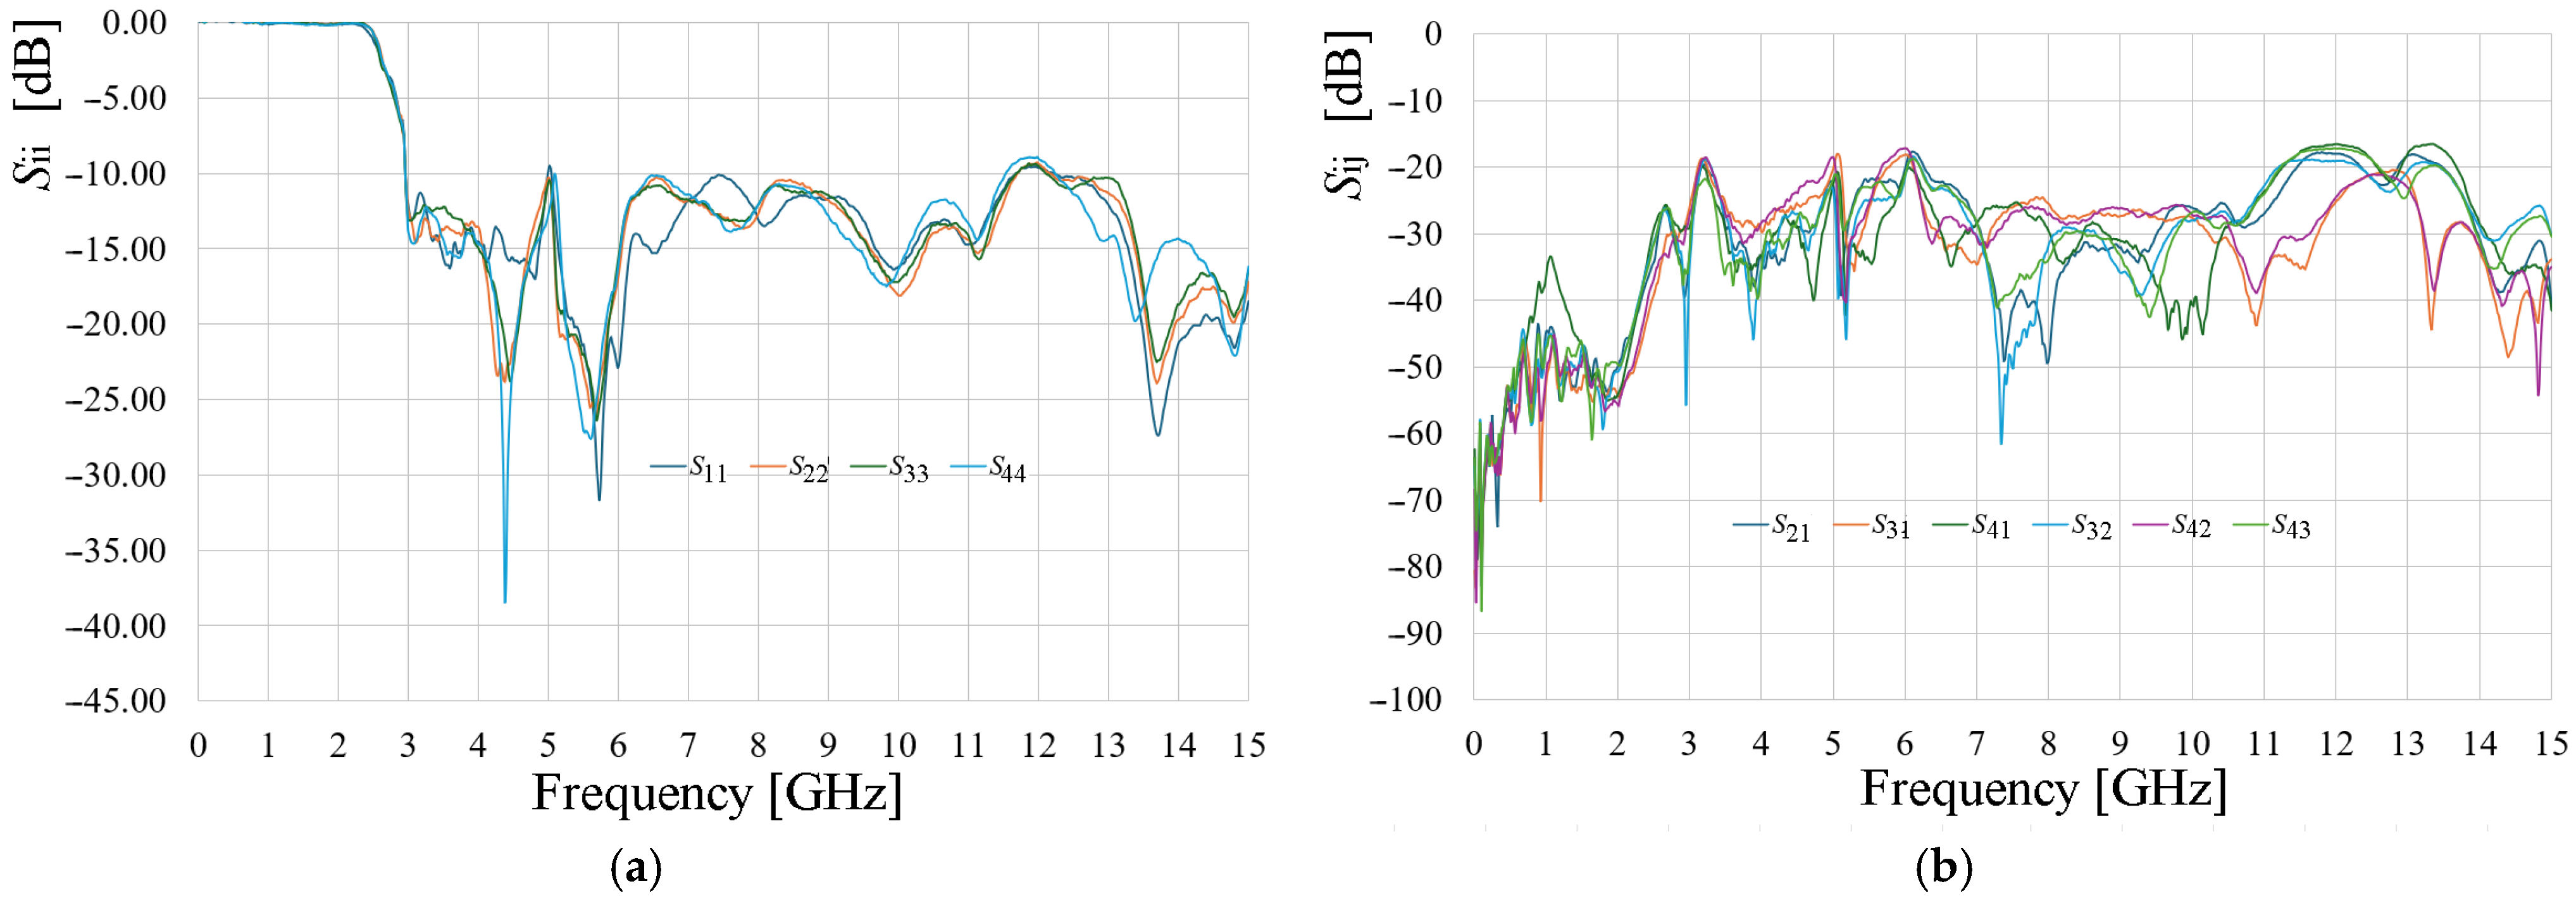
Figure 9 presents the measured
S-parameters of the array, which show a bandwidth ranging from approximately 2.89 GHz to well around 12 GHz. Showing a small mismatching in the
S44 parameter at 5 GHz; however, this result can be due to the construction process, since the other port matching parameters are below −10 dB at this frequency. The isolation among the array elements is notably high, achieving values bigger than 18 dB in the lower frequency band and reaching values greater than 30 dB in the higher frequency band. These results indicate excellent electromagnetic isolation, even though the radiating elements are closely spaced.
On the other hand, a crucial metric for assessing MIMO performance is the Envelope Correlation Coefficient (
), which quantifies the similarity between the fields radiated by slightly spaced antennas. To obtain an optimized performance of the MIMO system, the
should be close to zero. (6) provides a means of calculating this metric based on the
S-parameters.
Another widely employed metric for characterizing the performance of MIMO antennas is the Total Active Reflection Coefficient (
). It provides a comprehensive assessment of the signal reflection from the entire array relative to the incident wave, taking into account the phase relationships among the received signals. This phase information is influenced by multipath propagation and offers a more realistic representation of the antenna’s behavior in practical environments. By considering the array as a whole, rather than individual elements,
enables the determination of the system bandwidth. The bandwidth is typically defined as the frequency range where the
values are below −10 dB. (7) presents the general expression for calculating this metric in an
N-element array, while (8) specifically addresses the case of
N = 4 elements.
Given that a MIMO antenna array leverages spatial diversity, it is imperative to quantify the effectiveness of this technique. The diversity gain (
) serves this purpose. Specifically,
is a metric that quantifies the enhancement in the quality of a received signal resulting from the employment of multiple antennas in a communication system.
values are typically bounded between 0 and 10, with 10 indicating the maximum attainable improvement in signal quality. The
can be obtained with (9).
Another important metric in MIMO systems is the Mean Effective Gain (MEG), which is defined as the mean received power to the main incident power and can be determined as [
13]
where
is the total efficiency of the ith antenna, and this is calculated as
and
is the antenna mismatch efficiency, and
is the radiation efficiency, where
To evaluate the performance of the MIMO array, the
was calculated using (6), and the results are illustrated in
Figure 10a using the
S-parameters method, while in
Figure 10b, the results are given by using the E-filed method. The simulated and measured data reveal that the
values generally remain below 0.002 throughout the operating frequency band, with a peak of approximately 0.016 occurring at 4.5 GHz. On the other hand, using the E-filed approximation, the ECC reaches values of no more than 0.004. Nevertheless, these values are significantly lower than the 0.5 threshold commonly required for MIMO applications. These results guarantee the low correlation between the electric fields of the radiators.
The
analysis, presented in
Figure 10c, compares the simulated and measured curves obtained from (8) for different values of
θ1. In this case, for
N = 4, the
is influenced by three random phase angles,
θ1,
θ2, and
θ3, which vary continuously within the range of 0° to 360°. To simplify the analysis, both
θ2 and
θ3 were fixed at 0°, while
θ1 was varied. Both simulation and measurement results demonstrate that the
remains below −10 dB from 2.7 GHz to 10.5 GHz and up to 11.7 GHz, respectively, confirming the wideband characteristics of the system. While both measured and simulated
TARC curves align at the lowest cutoff frequency, indicating accurate initial design parameters, discrepancies within the specified bandwidth are likely attributed to fabrication tolerances. Minor variations in substrate thickness, dielectric constant, and conductor dimensions, inherent in the manufacturing process, can significantly impact high-frequency performance. These variations, which are not always perfectly modeled in simulations, lead to deviations in the measured results.
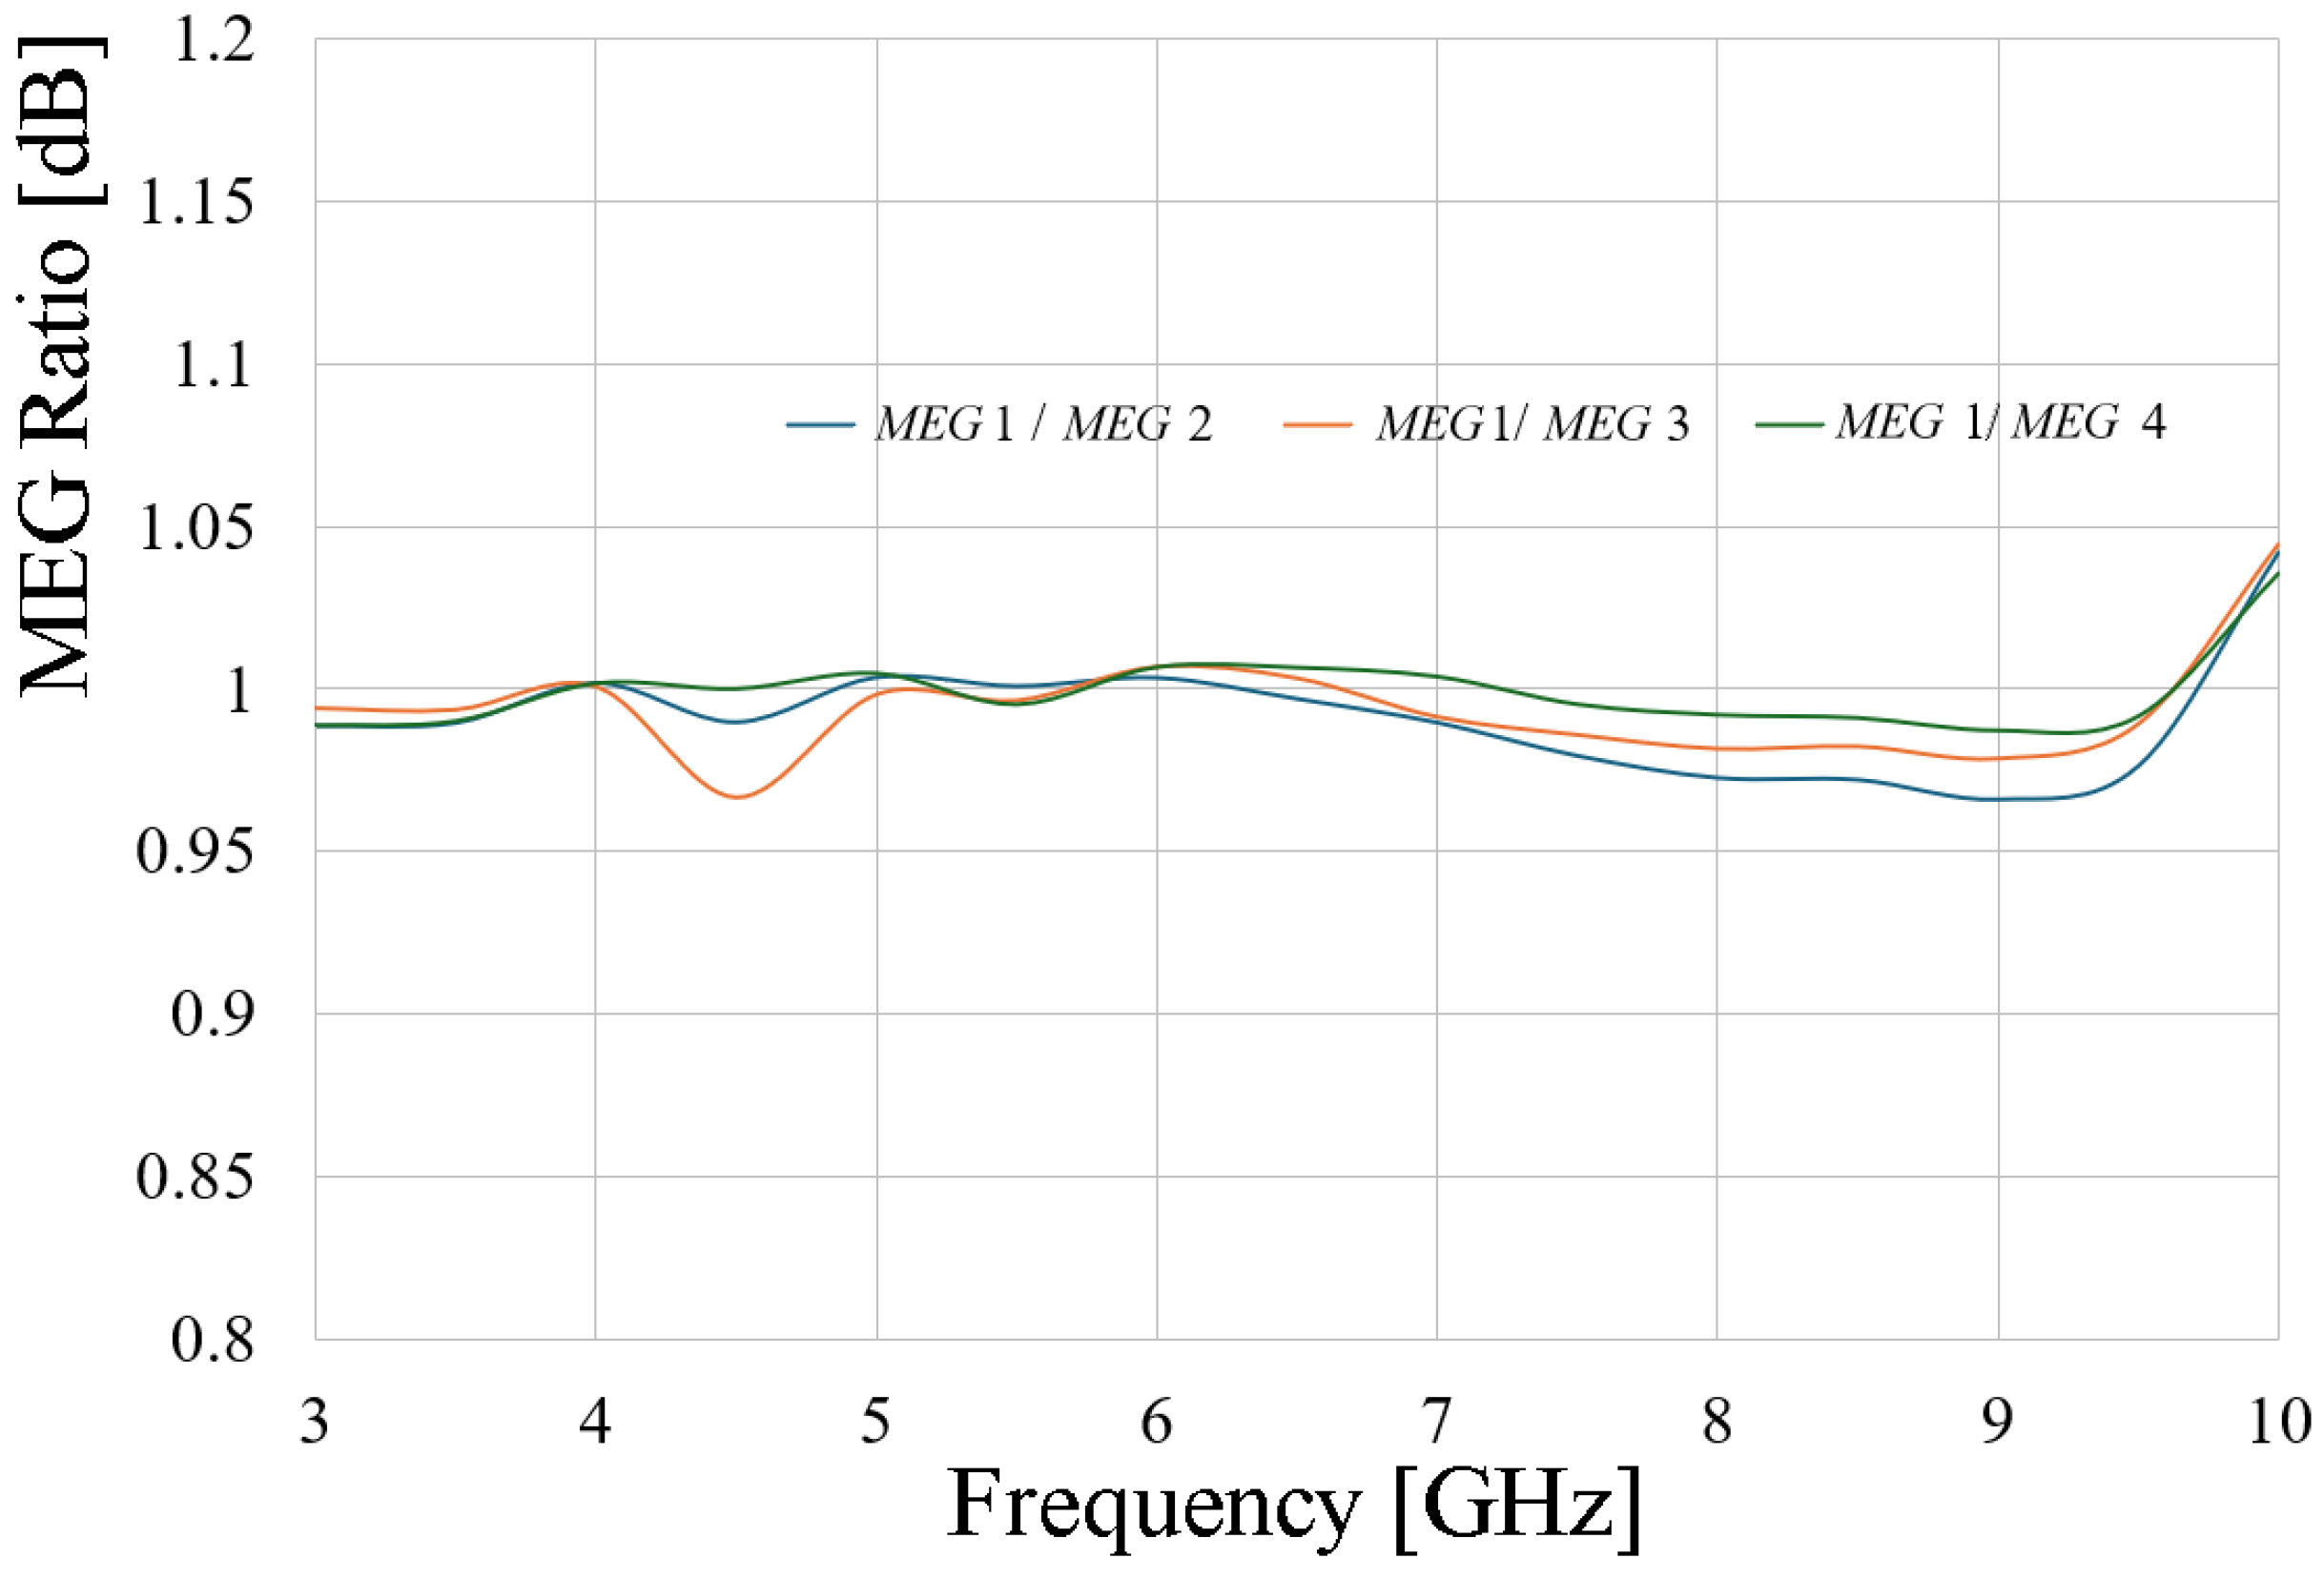
Finally, considering the MIMO metrics, the MEG ratio is calculated following (10) to (12), and the results are presented in
Figure 11. According to [
13], values of the MEG ratio around 1 dB are acceptable for MIMO applications, which threshold is valid for ±3 dB.
Regarding the radiation characteristics,
Figure 12a,b provide a comparison of the simulated and measured gain patterns in the E- and H-planes at frequencies of 3 GHz, 5 GHz, and 10 GHz.
The gain pattern plots reveal a quasi-omnidirectional radiation characteristic in the H-plane, while the E-plane exhibits pronounced peaks at 0° and 270°. The T-shaped stub functions as a reflector, causing a reduction in the gain at 270° relative to 90°. Specifically, peak gains of −2.3 dB, −0.2 dB, and 2.6 dB are attained at 3 GHz, 5 GHz, and 10 GHz, respectively. These findings are consistent with the general trend that miniaturization often entails trade-offs in terms of efficiency, gain, and bandwidth. However, in this design, while efficiency and bandwidth remain relatively unaffected, the reduction in size at lower frequencies results in a decrease in gain. On the other hand, applying (9) to calculate the , the average value for this metric is around 9.9999, which implies that the spatial diversity gain employed in the array is very effective.
Finally,
Table 1 presents a comparison with other four-port ultra-wideband MIMO antenna structures.
The complexity * column in
Table 1 is a subjective evaluation based on the authors’ judgment of the radiator geometry and design intricacies. For example, the antenna in reference [
15], inspired by the SARS-CoV-2 virus, is deemed complex due to its irregular structure and the numerous variables requiring optimization. Conversely, the design in reference [
14] features simpler, replicable geometries. Based on these assumptions, the proposed antenna in this work exhibits very low complexity due to its regular and easily reproducible shapes based on conventional strip monopoles fed by a coplanar line.
Table 1 also reveals that the proposed antenna has considerably smaller dimensions than the reported structures, occupying a much smaller portion of the wavelength, considering the lower cutoff frequency. Moreover, the proposed design demonstrates comparable or improved
,
, and
performance compared to other configurations. Notably, the isolation among elements reaches values from 20 dB to close to 40 dB.


 ,
, 


