Article

Enhancing Geothermal Anomaly Detection with Multi-Source Thermal Infrared Data: A Case of the Yangbajing–Yangyi Basin, Tibet

1
College of Earth and Planetary Sciences, Chengdu University of Technology, Chengdu 610059, China
2
Geomathematics Key Laboratory of Sichuan Province, Chengdu University of Technology, Chengdu 610059, China
3
College of Engineering, Tibet University, Lhasa 850000, China
*
Author to whom correspondence should be addressed.
Appl. Sci. 2025, 15(7), 3740; https://doi.org/10.3390/app15073740
Submission received: 27 January 2025 / Revised: 26 March 2025 / Accepted: 26 March 2025 / Published: 28 March 2025

Abstract

:
Geothermal resources are crucial for sustainable energy development, yet accurately detecting geothermal anomalies in complex terrains remains a significant challenge. This study develops a multi-source thermal infrared approach to enhance geothermal anomaly detection using Landsat 8 and ASTER land surface temperature (LST) data. The Yangbajing–Yangyi Basin in Tibet, characterized by high altitude and rugged topography, serves as the study area. Landsat 8 winter time-series data from 2013 to 2023 were processed on the Google Earth Engine (GEE) platform to generate multi-year average LST images. After water body removal and altitude correction, a local block thresholding method was applied to extract daytime geothermal anomalies. For nighttime data, ASTER LST products were analyzed using global, local block, elevation zoning, and fault buffer strategies to extract anomalies, which were then fused using Dempster–Shafer (D–S) evidence theory. A joint daytime–nighttime analysis identified stable geothermal anomaly regions, with results closely aligning with known geothermal fields and borehole distributions while predicting new potential anomaly zones. Additionally, a 21-year time-series analysis of MODIS nighttime LST data identified four significant thermal anomaly areas, interpreted as potential magma chambers, whose spatial distributions align with the identified anomalies. This multi-source approach highlights the potential of integrating thermal infrared data for geothermal anomaly detection, providing valuable insights for exploration in geologically complex regions.

1. Introduction

Geothermal resources, as a key form of renewable and clean energy, are receiving growing attention amid the global energy transition and the pursuit of carbon neutrality [1,2]. Geothermal energy is not only environmentally friendly and sustainable, but also plays a vital role in reducing reliance on fossil fuels and mitigating climate change [3]. Although highly reliable, traditional geothermal exploration methods—including geological [4,5,6], geophysical [7,8,9], and geochemical approaches [10,11,12,13]—often require substantial human, material, and financial resources. This is particularly true in regions with complex natural conditions, such as the Tibetan Plateau, where these methods face high implementation costs and technical challenges [14].
With the advancement of remote sensing technology, thermal infrared remote sensing (TIRS) has emerged as an innovative solution for geothermal anomaly detection, offering wide coverage, low cost, and adaptability to complex terrains [15,16]. TIRS technology detects surface temperature variations to effectively identify areas of underground thermal activity. It has been widely applied in numerous regions abundant in high-temperature geothermal resources, including Dandong, Liaoning [17,18], Tengchong and Ruili, Yunnan [16,19,20], Kangding, Sichuan [21], Rizhao, Shandong [22], as well as internationally in the Tulu Moye region of Ethiopia’s Main Rift [23], the Kenya Rift [24], the Thrace Basin of Turkey [25], and Mount Ungaran in Indonesia [26]. Among these, the inversion method based on land surface temperature (LST) has become a key tool for identifying geothermal anomaly zones [19,27,28,29,30]. However, single-phase thermal infrared data are often influenced by various natural factors, including solar radiation and surface properties, leading to random errors and uncertainties in the extraction results [16]. In recent years, multi-temporal long-term LST data have been widely applied to improve the accuracy of geothermal anomaly detection. By identifying stable high-temperature areas, they effectively eliminate false anomalies and significantly enhance the reliability of the results [23].
Compared to daytime data, nighttime LST is less affected by solar radiation and more effectively captures thermal exchange between the surface and subsurface, making it a valuable tool for geothermal exploration [17,31,32]. However, the low acquisition frequency and limited temporal resolution of nighttime thermal infrared imagery remain significant limitations. As a result, effectively leveraging existing data resources to overcome spatial and temporal resolution constraints has become a key research focus. To address this challenge, researchers have proposed a joint daytime–nighttime analysis strategy that integrates both datasets to reduce the influence of surface property differences and improve the reliability of geothermal anomaly detection [19,23,33,34].
Furthermore, the spatiotemporal discontinuity of remote sensing data and the uncertainty associated with localized anomalies remain major challenges in current research [35]. Google Earth Engine (GEE) [36], a cloud-based geospatial data processing platform, provides technical support to address discontinuities in LST time-series data and significantly enhances the efficiency of large-scale processing through its robust computational and analytical capabilities [37,38]. Meanwhile, Dempster–Shafer (D–S) evidence theory serves as an effective framework for integrating multi-source, multi-perspective data. By fusing geothermal anomaly evidence from different sources, it reduces the errors associated with single-method approaches and improves the accuracy of nighttime anomaly detection [30,39].
Building on the aforementioned context, this study focuses on geothermal anomaly detection in complex geological settings and proposes a novel detection framework that integrates multi-source and multi-temporal thermal infrared remote sensing data. Centered on the Yangbajing–Yangyi Basin in Tibet, the study leverages the Google Earth Engine (GEE) platform to process long-term Landsat 8 daytime LST data and optimize their spatial and temporal representation. Additionally, ASTER nighttime LST data are used in a multi-perspective strategy that integrates global, local, elevation-based, and fault buffer zone analyses. These results are then fused using Dempster–Shafer (D–S) evidence theory to effectively overcome the limitations of individual datasets. Building on this, stable geothermal anomaly zones are identified through combined day–night analysis, further demonstrating the potential of multi-source data in complex geological environments. The method is validated in known geothermal fields and preliminarily identifies several potential geothermal anomaly zones, providing a scientific basis for the development of high-temperature geothermal resources and offering new perspectives for exploration in the Tibetan Plateau and similar regions.
The following sections provide a comprehensive overview of the research process and findings. Section 2 outlines the geological setting of the study area. Section 3 describes the acquisition and preprocessing procedures for multi-source data. Section 4 presents the results of geothermal anomaly extraction using Landsat 8 daytime, ASTER nighttime, and combined daytime–nighttime analyses. It also discusses the use of MODIS data to infer deep-seated heat sources. Section 5 evaluates the effectiveness of data processing improvements and summarizes the study’s limitations and directions for future research. Section 6 concludes the study by highlighting its key findings.

2. Geological Setting

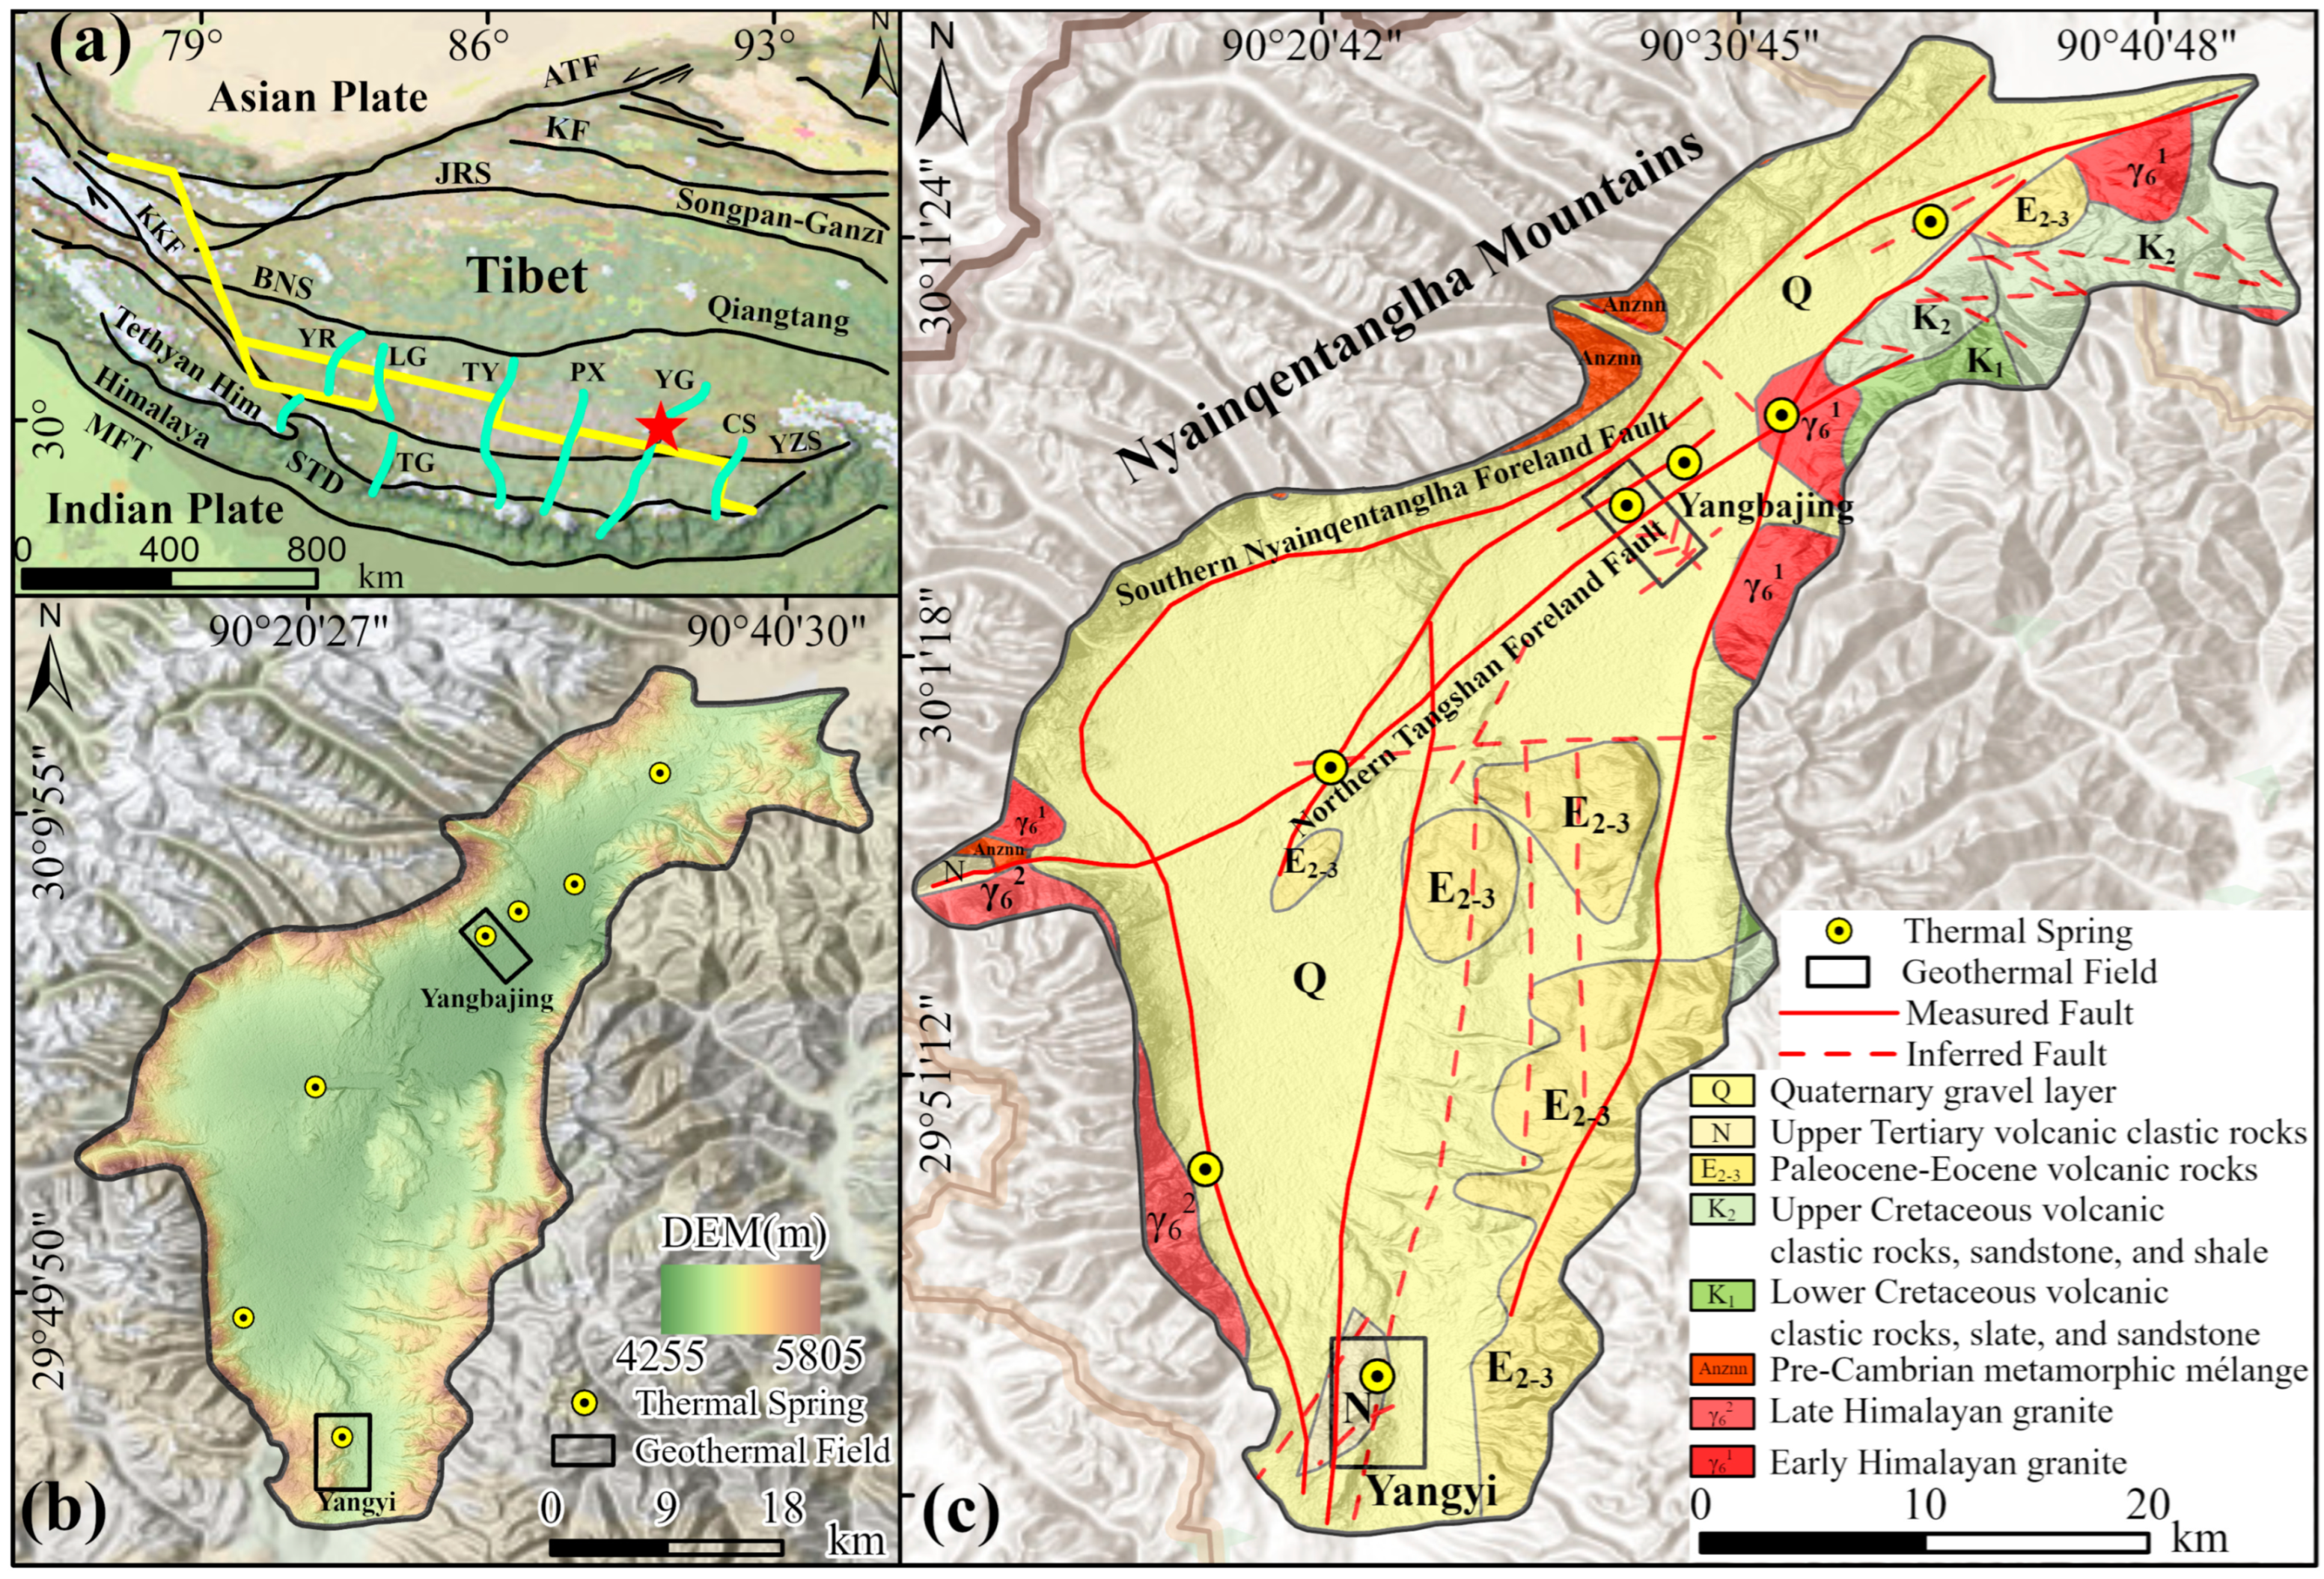
The Yangbajing–Yangyi Basin is located in Dangxiong County, in the south–central Tibetan Plateau, north of the Yarlung Zangbo and Mantle Suture Zones, and lies within the central graben of the Yadong–Gulu Rift [40] (Figure 1a). The basin ranges in elevation from 4200 to 5800 m (Figure 1b), with topography sloping from the northwestern highlands to the southeastern lowlands. The Nyainqêntanglha Mountains lie to the west, and the Tangshan Range lies to the southeast [6,41]. The basin is primarily composed of granites, metamorphic complexes, volcanic clastic rocks, and Quaternary sediments, along with localized Cenozoic igneous rocks (Figure 1c).
The periphery of the basin is characterized by NE, near N–S, and NW trending fault systems, with the Nyainqêntanglha South Foreland Fault and the Tangshan North Foreland Fault acting as the primary regional structures governing basin evolution [6,41]. These faults function as major conduits for geothermal fluid migration and magmatic activity, closely associated with deep regional thermal processes. Geophysical surveys have revealed partially molten magma chambers at depths of 5–15 km beneath the basin, which serve as the primary heat sources in the study area [42,43].
The Yangbajing geothermal field contains three heat reservoirs with temperatures ranging from 150 °C to 320 °C, extending to depths of up to 8 km. In contrast, the Yangyi geothermal field is characterized by shallower reservoirs, with temperatures reaching up to 100 °C [6,44]. Surface thermal manifestations, including hot springs and boiling springs, are primarily distributed along fault zones. Springs in the Yangbajing and Yangyi areas reach a maximum temperature of 93 °C, clearly indicating the presence of deep thermal activity.
The study area demonstrates significant potential for geothermal development. The Yangbajing Geothermal Power Station (established in 1977) and the Yangyi Geothermal Power Station (completed in 2018) are China’s earliest and only commercially operational geothermal power plants. Together, they have a combined installed capacity of 25.15 MW and a cumulative power generation exceeding 500 million kWh, further underscoring the substantial geothermal potential of the study area.
Figure 1. (a) Tectonic Map of the Tibetan Plateau [45]. Suture zones/major faults (black lines): MFT (Main Himalayan Thrust), STD (South Tibet Detachment), YZS (Yarlung Zangbo), BNS (Bangonghu-Nujiang), JRS (Jinsha River), ATF (Altyn Tagh), KF (Kunlun), KKF (Karakoram). Rift valleys/grabens (green lines): YR (Yalong), TG (Takola), LG (Longger), TY (Dangre Yongcuo), PX (Pengqu–Shenza), YG (Yadong–Gulu), CS (Cuona–Sangri). Yellow line: mantle suture zone; Red star marks the study area; (b) Elevation Map of the Study Area; (c) Geological Map of the Study Area, modified from [46,47,48].
Applsci 15 03740 g001

3. Materials and Methods

This study develops a multi-view, multi-temporal geothermal anomaly detection framework based on multi-source LST data, including Landsat-8, ASTER, and MODIS. To provide a clear overview of the data processing and analysis workflow, Figure 2 outlines the key steps of the study: data acquisition, preprocessing, multi-source data fusion, and final analysis and validation. Table 1 provides detailed information on the various remote sensing land surface temperature datasets. The following sections will provide a detailed explanation based on this framework.

3.1. Landsat 8 LST Data Products and Time-Series Processing

This study utilized Landsat 8 thermal infrared data to identify daytime geothermal anomalies, owing to its high spatial resolution and accessibility, making it ideal for monitoring large-scale surface temperature variations. To eliminate reliance on atmospheric profile parameters in traditional Landsat data inversion (since NASA no longer provides these parameters), this study employs the Landsat Collection-2 L2 surface temperature product from USGS [49]. The product has undergone radiometric calibration, atmospheric correction, and geometric correction, utilizing a single-channel algorithm to achieve temperature inversion accuracy within 0.5 K to 1 K [50]. Moreover, the default image registration in the GEE platform ensures spatial consistency across the study area, eliminating the need for additional manual alignment. The temperature conversion formula is as follows:
ST = DN × 0.00341802 + 149 − 273.15
where ST denotes the surface temperature in Celsius (°C), DN is the digital number, 0.00341802 is the scaling factor provided by the USGS for Landsat Collection 2 Level 2 Surface Temperature products, and 149 is the offset value defined by the United States Geological Survey (USGS). To convert ST from Kelvin to Celsius, 273.15 is subtracted [49].
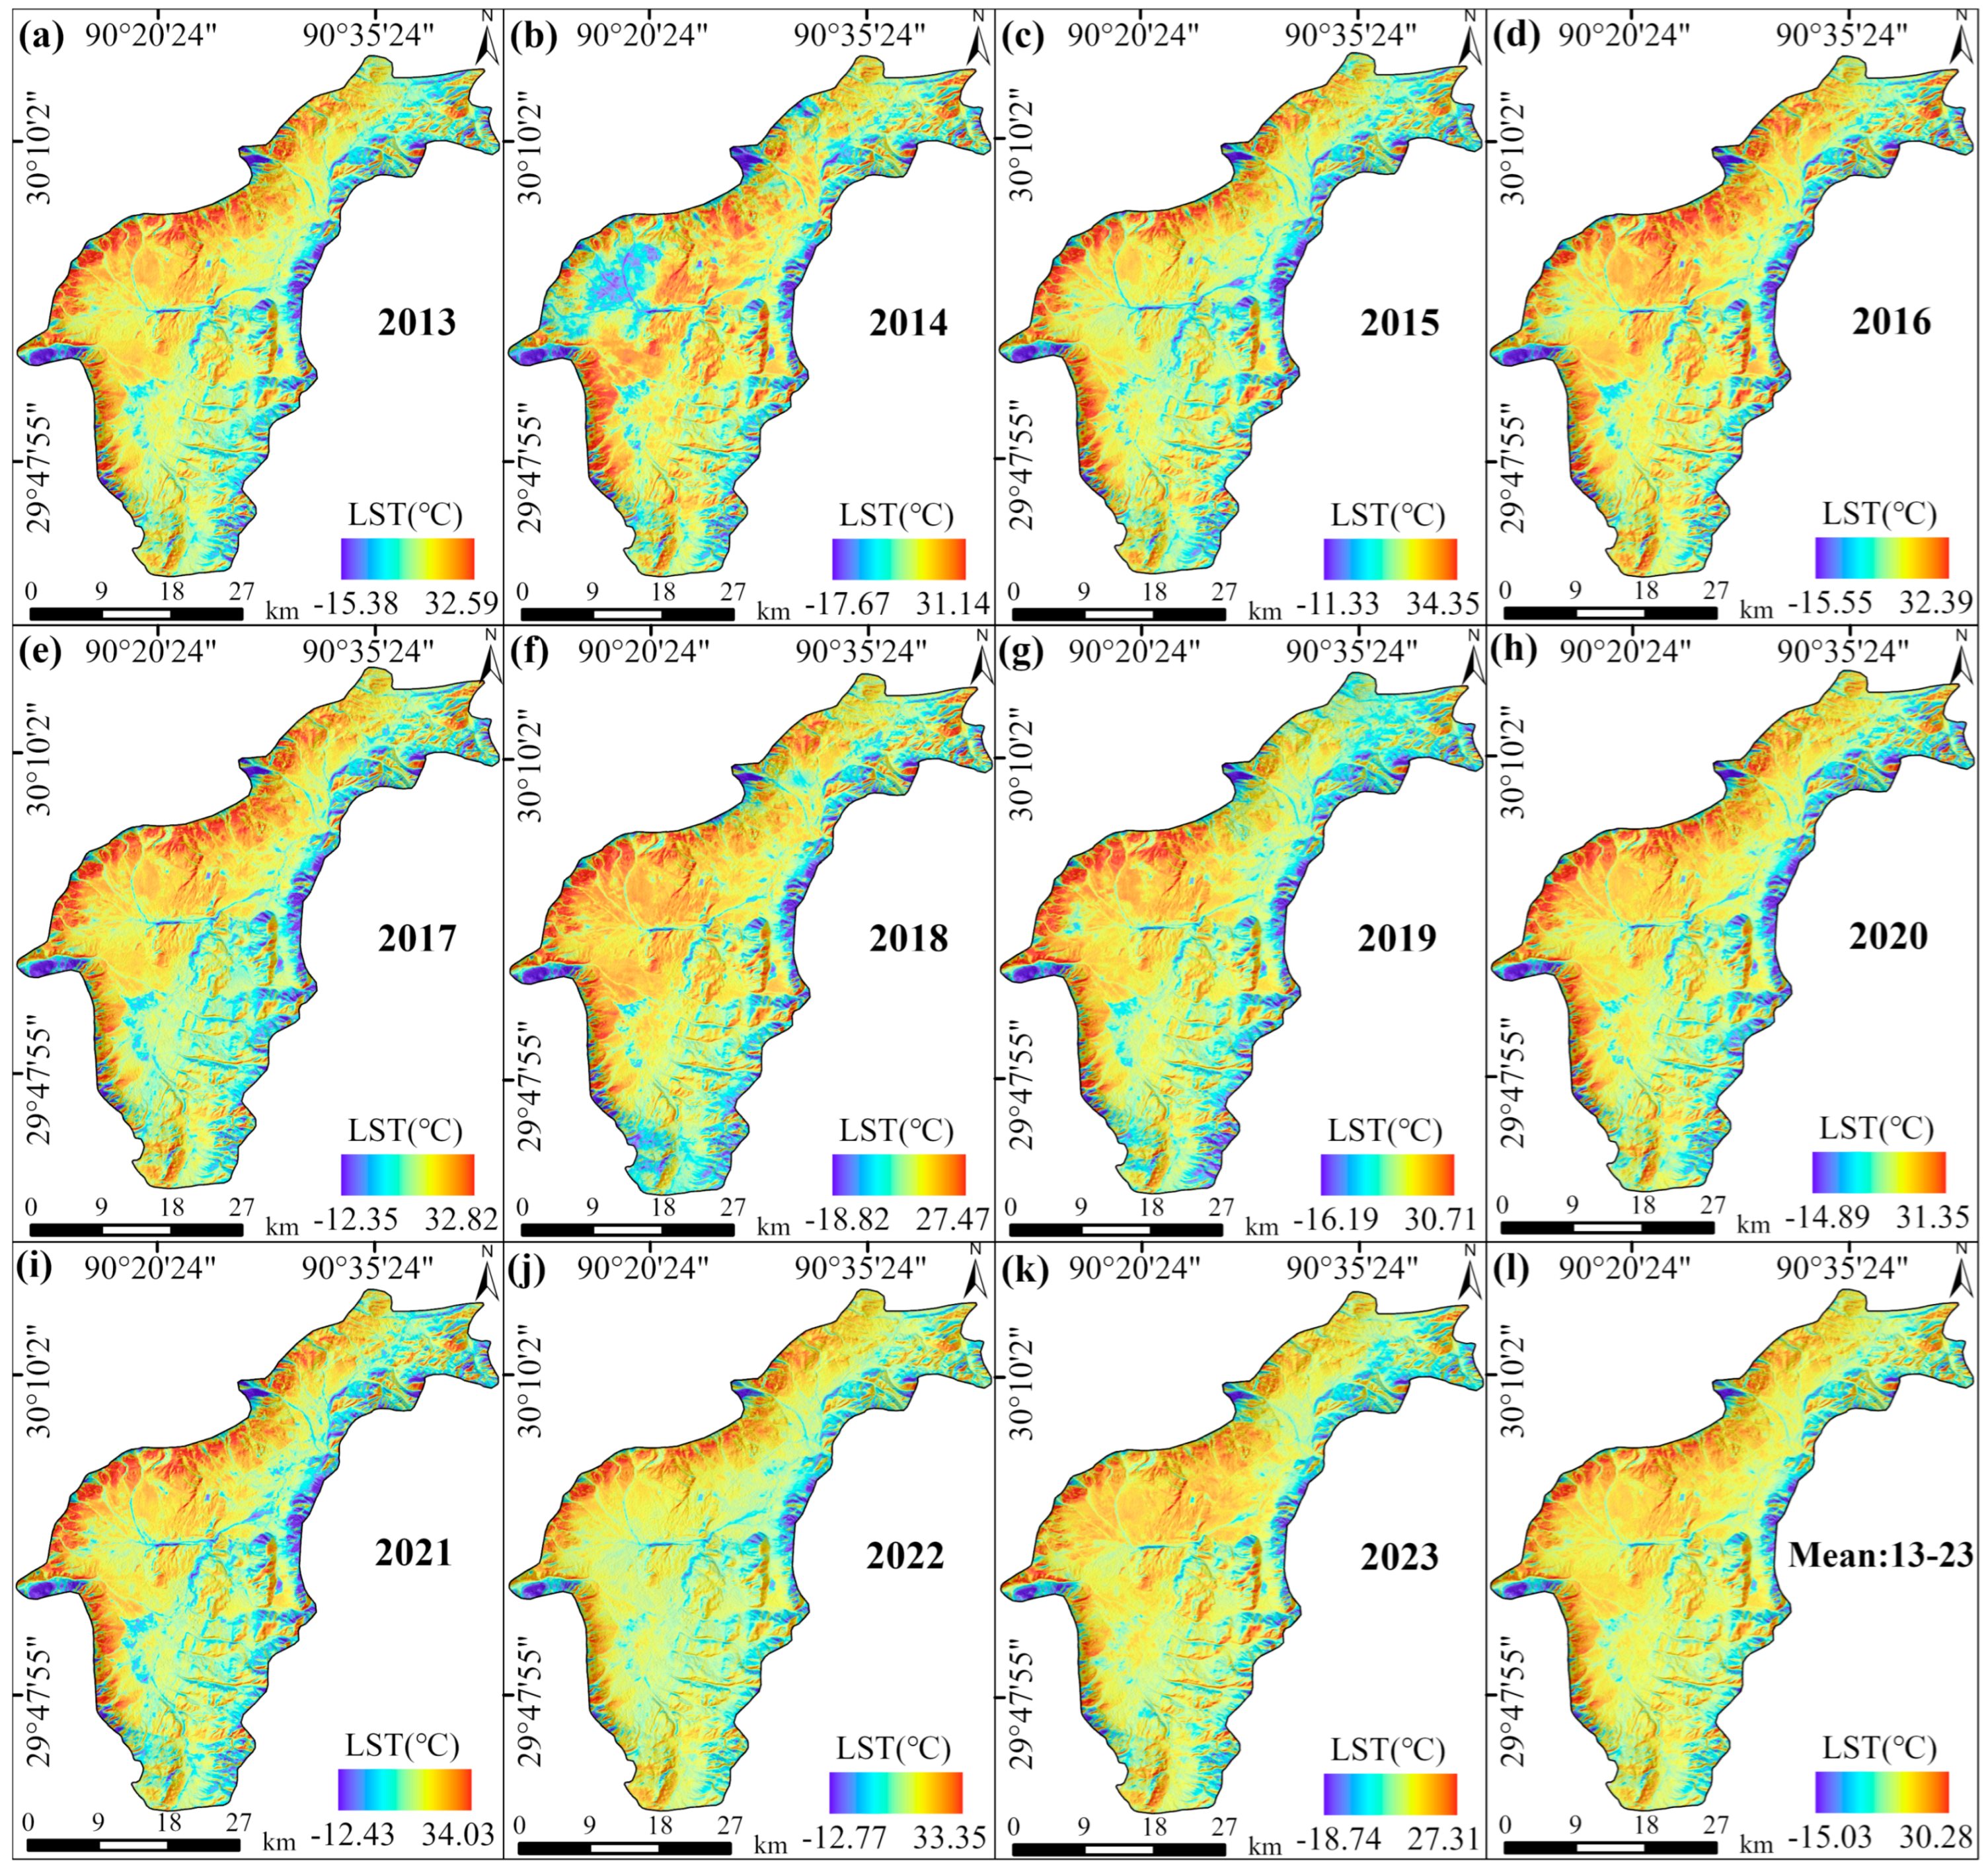
To accurately capture geothermal signals, a long-term LST time series for winter seasons (November to the following March) from 2013 to 2023 was generated, and the average LST for each winter was calculated using the GEE platform [37]. In addition, the multi-year average winter LST for 2013–2023 was computed. The data processing steps are as follows:
1. Water body removal: Lakes, rivers, and other water bodies were identified using Sentinel-2A data with a Normalized Difference Vegetation Index (NDVI) threshold of less than 0. Pixels dominated by clouds, water, or snow were excluded to minimize their influence on temperature data and to improve the spatial accuracy of LST distribution.
2. Altitude correction: To minimize the impact of elevation differences on LST, the study area was divided into 30 elevation intervals, and the temperature distribution within each interval was analyzed. A regression equation was derived by analyzing the relationship between elevation and LST:
Landsat LST = 92.12 − 0.0168 × Altitude
Here, Landsat LST refers to land surface temperature derived from Landsat 8 data (°C), while Altitude indicates elevation from the SRTM DEM, measured in meters above sea level. The regression model yields a coefficient of determination (R2) of 0.86. Based on this relationship, an altitude correction formula was developed to normalize LST values to a reference elevation of 4300 m [25,51]:
Landsat LST corrected = Landsat LST + 0.0168 × (4300 − Altitude)
The calibration formula effectively removes the altitude effect, resulting in a clearer geothermal anomaly signal.
3. Local Block Threshold Method: After removing water bodies and applying altitude correction, the study area was divided into 12 × 9 subregions based on the multi-year average LST image. The high-temperature threshold for each subregion was defined as the mean temperature plus one standard deviation, enabling independent identification of thermal anomalies in each area.

3.2. ASTER LST Data Product and D–S Evidence Theory Fusion Method

To minimize solar radiation interference in Landsat 8 daytime data, this study incorporated the ASTER L2 Surface Temperature V003 nighttime product (Table 1), generated using the Temperature/Emissivity Separation (TES) algorithm. This product provides high-precision nighttime LST data and eliminates the need for complex inversion procedures [52]. The nighttime LST (°C) is calculated using the following equation:
T = 0.1 × DN − 273.15
Here, T represents the nighttime LST in Celsius, DN is the pixel value, and 0.1 is the scaling factor for ASTER LST products. The constant 273.15 is used to convert Kelvin to Celsius. To ensure spatial consistency with Landsat 8 data, the ASTER image was geometrically registered to the Landsat 8 image and resampled to a 30 m resolution, allowing accurate alignment and direct comparison.
To overcome the limitations of nighttime data, this study adopts a multi-perspective extraction strategy to identify geothermal anomalies from four distinct perspectives: global, local, elevation, and fault structure buffer zones. These extracted results are used to construct four corresponding evidence layers (A1, A2, A3, and A4), each representing geothermal anomalies with different spatial scales and characteristics. The evidence layers are then integrated using D–S evidence theory to improve the accuracy of geothermal anomaly detection. The detailed methodology is as follows:
1. Global Threshold Method: After multiple tests and iterative adjustments, the threshold was finally set as the mean temperature plus one standard deviation. This threshold was selected based on comparative analysis with known geothermal hotspots to ensure effective differentiation between anomaly zones and background areas. The extracted results constitute evidence layer A1.
2. Local Block Threshold Method: The study area was divided into 11 rows and 8 columns of sub-regions, with a local threshold in each defined as the mean temperature plus one standard deviation. This method improves the sensitivity to detecting small-scale geothermal anomalies. The extracted results from all sub-regions were integrated to form evidence layer A2.
3. Elevation Partition Threshold Method: To reduce the influence of elevation on surface temperature distribution, the study area was divided into 18 sub-regions at 100-m elevation intervals, and temperature anomalies were extracted from each sub-region. The results were then combined to form evidence layer A3.
The cumulative distribution function (CDF) was used to determine the temperature threshold. The temperature distribution function F( T x ) represents the probability that the temperature is less than T x :
F T x = P T T x
As T x increases, the probability of higher temperatures rises accordingly, indicating a greater likelihood of thermal anomalies. The high-temperature threshold T h is defined according to the proportion of high-temperature anomalies, α h :
P T T h = α h
Based on the cumulative distribution characteristics of the temperature data, the quantile function F is used to determine the high-temperature threshold, expressed as
F T h M T σ T = 1 α h
Here, T h is the high-temperature anomaly threshold, where M T and σ T represent the mean temperature and standard deviation within each sub-region, respectively. After transformation, the high-temperature anomaly threshold T h can be expressed as
T h = M T + F ( 1 α h ) σ T
Here, F denotes the inverse cumulative distribution function, and F ( 1 α h ) corresponds to the quantile value at a cumulative probability of 1 α h . Based on multiple tests and analyses, α h = 0.2 was selected, corresponding to a quantile value of 0.842. Thus, the final threshold is defined as the mean temperature of each sub-region plus 1.282 times its standard deviation.
4. Fault Structure Buffer Zone Method: Geothermal drilling results indicate a strong correlation between fault structures and geothermal anomalies [48]. Regional geothermal temperature measurements show that the heat diffusion halo of deep fault zones extends approximately 1000 m [47]. Considering the fault characteristics in the study area, a 1 km buffer zone was defined to identify geothermal anomalies, forming evidence layer A4.
5. D–S Evidence Theory Fusion Method: D–S evidence theory provides a robust framework for integrating uncertain information, making it especially effective for combining data from diverse sources to improve anomaly detection [53]. In this study, D–S evidence theory was applied to integrate geothermal anomaly evidence extracted from the four criteria (A1–A4) mentioned above [39].
D–S evidence theory defines a frame of discernment Θ, representing a finite set of mutually exclusive and collectively exhaustive hypotheses. In this study, Θ = {anomaly, non-anomaly}, representing the two possible states of each pixel in geothermal anomaly detection. The set of all subsets of Θ is denoted as 2 Θ . The mass function m(A) defines the basic probability assignment (BPA) for each subset A 2 Θ , and satisfies the following conditions:
m ( A ) [ 0 , 1 ] ,   m ( ) = 0 ,   A 2 Θ m A = 1
Here, ∅ represents the empty set, and m(A) is the BPA assigned to set A.
In this study, BPA values were assigned based on local temperature gradients. A local window of size n × n was defined, with the central pixel temperature denoted as t(k). The temperature gradient g i is calculated as
g i = t i k t k ¯ , i = 1,2 , , n
Here, t k ¯ denotes the mean temperature of all pixels within the window, n represents the window size, and i indicates the position index of the temperature value. The probability of a geothermal anomaly at the center pixel is then calculated as
p k = g ( k ) i = 1 n g i ,   i = 1,2 , , n
A larger temperature gradient corresponds to a higher probability of geothermal anomaly, whereas a smaller gradient suggests a lower probability.
The D–S combination rule integrates multiple sources of evidence to derive a comprehensive probability distribution of geothermal anomalies. For four evidence sources m 1 , m 2 , m 3 and m 4 , the combination rule is expressed as
( m 1 m 2 m 3 m 4 ) ( A ) = 1 k A 1 A 2 A 3 A 4 = A m 1 A 1 · m 2 A 2 · m 3 A 3 · m 4 A 4
K = 1 A 1 A 2 A 3 A 4 = 0 m 1 A 1 · m 2 A 2 · m 3 A 3 · m 4 A 4
Here, K is the normalization constant that ensures the combined probability distribution sums to 1.
To enhance the reliability of anomaly detection, geothermal anomaly probabilities were directly assigned a value of 1 within the fault buffer zone and 0 outside it [30]. This strategy takes advantage of the strong spatial correlation between fault structures and geothermal anomalies. Finally, an empirical threshold was applied to extract the final geothermal anomaly distribution [54].

3.3. Combined Processing of Daytime and Nighttime LST Data

To improve the accuracy of geothermal anomaly detection, this study integrated daytime and nighttime LST data to identify areas with consistently high temperatures. This approach targets regions that show elevated LST values during both day and night, effectively reducing false anomalies and minimizing the effects of solar radiation and surface property variations, thereby improving the reliability of geothermal anomaly detection.

3.4. MODIS NLST Analysis and Magma Chamber Identification

This study employs MODIS nighttime LST data to investigate the spatial distribution and activity characteristics of potential magma chambers in the study area. To minimize the impact of random temperature fluctuations, long-term monthly average MODIS LST data from January 2003 to December 2023 (252 months) were used. These data were used to generate isotherm maps and detect geothermal anomalies through spatial analysis and density-based segmentation, thereby inferring the potential distribution of subsurface magma chambers [55]. MODIS data were reprojected and georeferenced using the Google Earth Engine (GEE) platform to ensure consistency with the study area’s coordinate system and maintain spatial alignment.
To further investigate the activity characteristics of potential magma chambers, this study analyzes annual and monthly variations in the multi-year average land surface temperature (LST) of geothermal anomaly zones from 2003 to 2023, aiming to reveal temporal patterns in geothermal dynamics. Monthly average air temperature (AT) data were also obtained from the National Earth System Science Data Center [56] and compared with LST data to analyze the causes of geothermal anomalies and further examine the temporal evolution and activity of subsurface magma chambers.
The raw MODIS nighttime LST data are provided in brightness temperature, and the conversion to Celsius is performed using the following formula [57]:
LST(°C) = DN × 0.02 − 273.15
Here, LST refers to the nighttime LST (°C), DN is the pixel value, and 0.02 is the scaling factor used to convert DN to Kelvin. The constant 273.15 is subtracted to convert the result from Kelvin to Celsius.

4. Result

4.1. Daytime LST Anomalies Extracted from Landsat 8 Data

Based on Landsat 8 daytime LST data from 2013 to 2023, average LST values for each winter season in the study area were extracted (Figure 3a–k). The results indicate that LST anomaly zones are primarily located in the central basin and western foothill regions, exhibiting a persistent high-temperature distribution pattern over multiple years. The average LST and standard deviation for each winter season (Figure 4b) reveal interannual temperature variation trends, with a peak of 17.53 °C in 2015 and a minimum of 9.33 °C in 2018, while the standard deviation remains generally stable. The multi-year average LST for all winter seasons from 2013 to 2023 (Figure 3l) ranges from −14.79 °C to 31.71 °C, with a mean value of 8.46 °C.
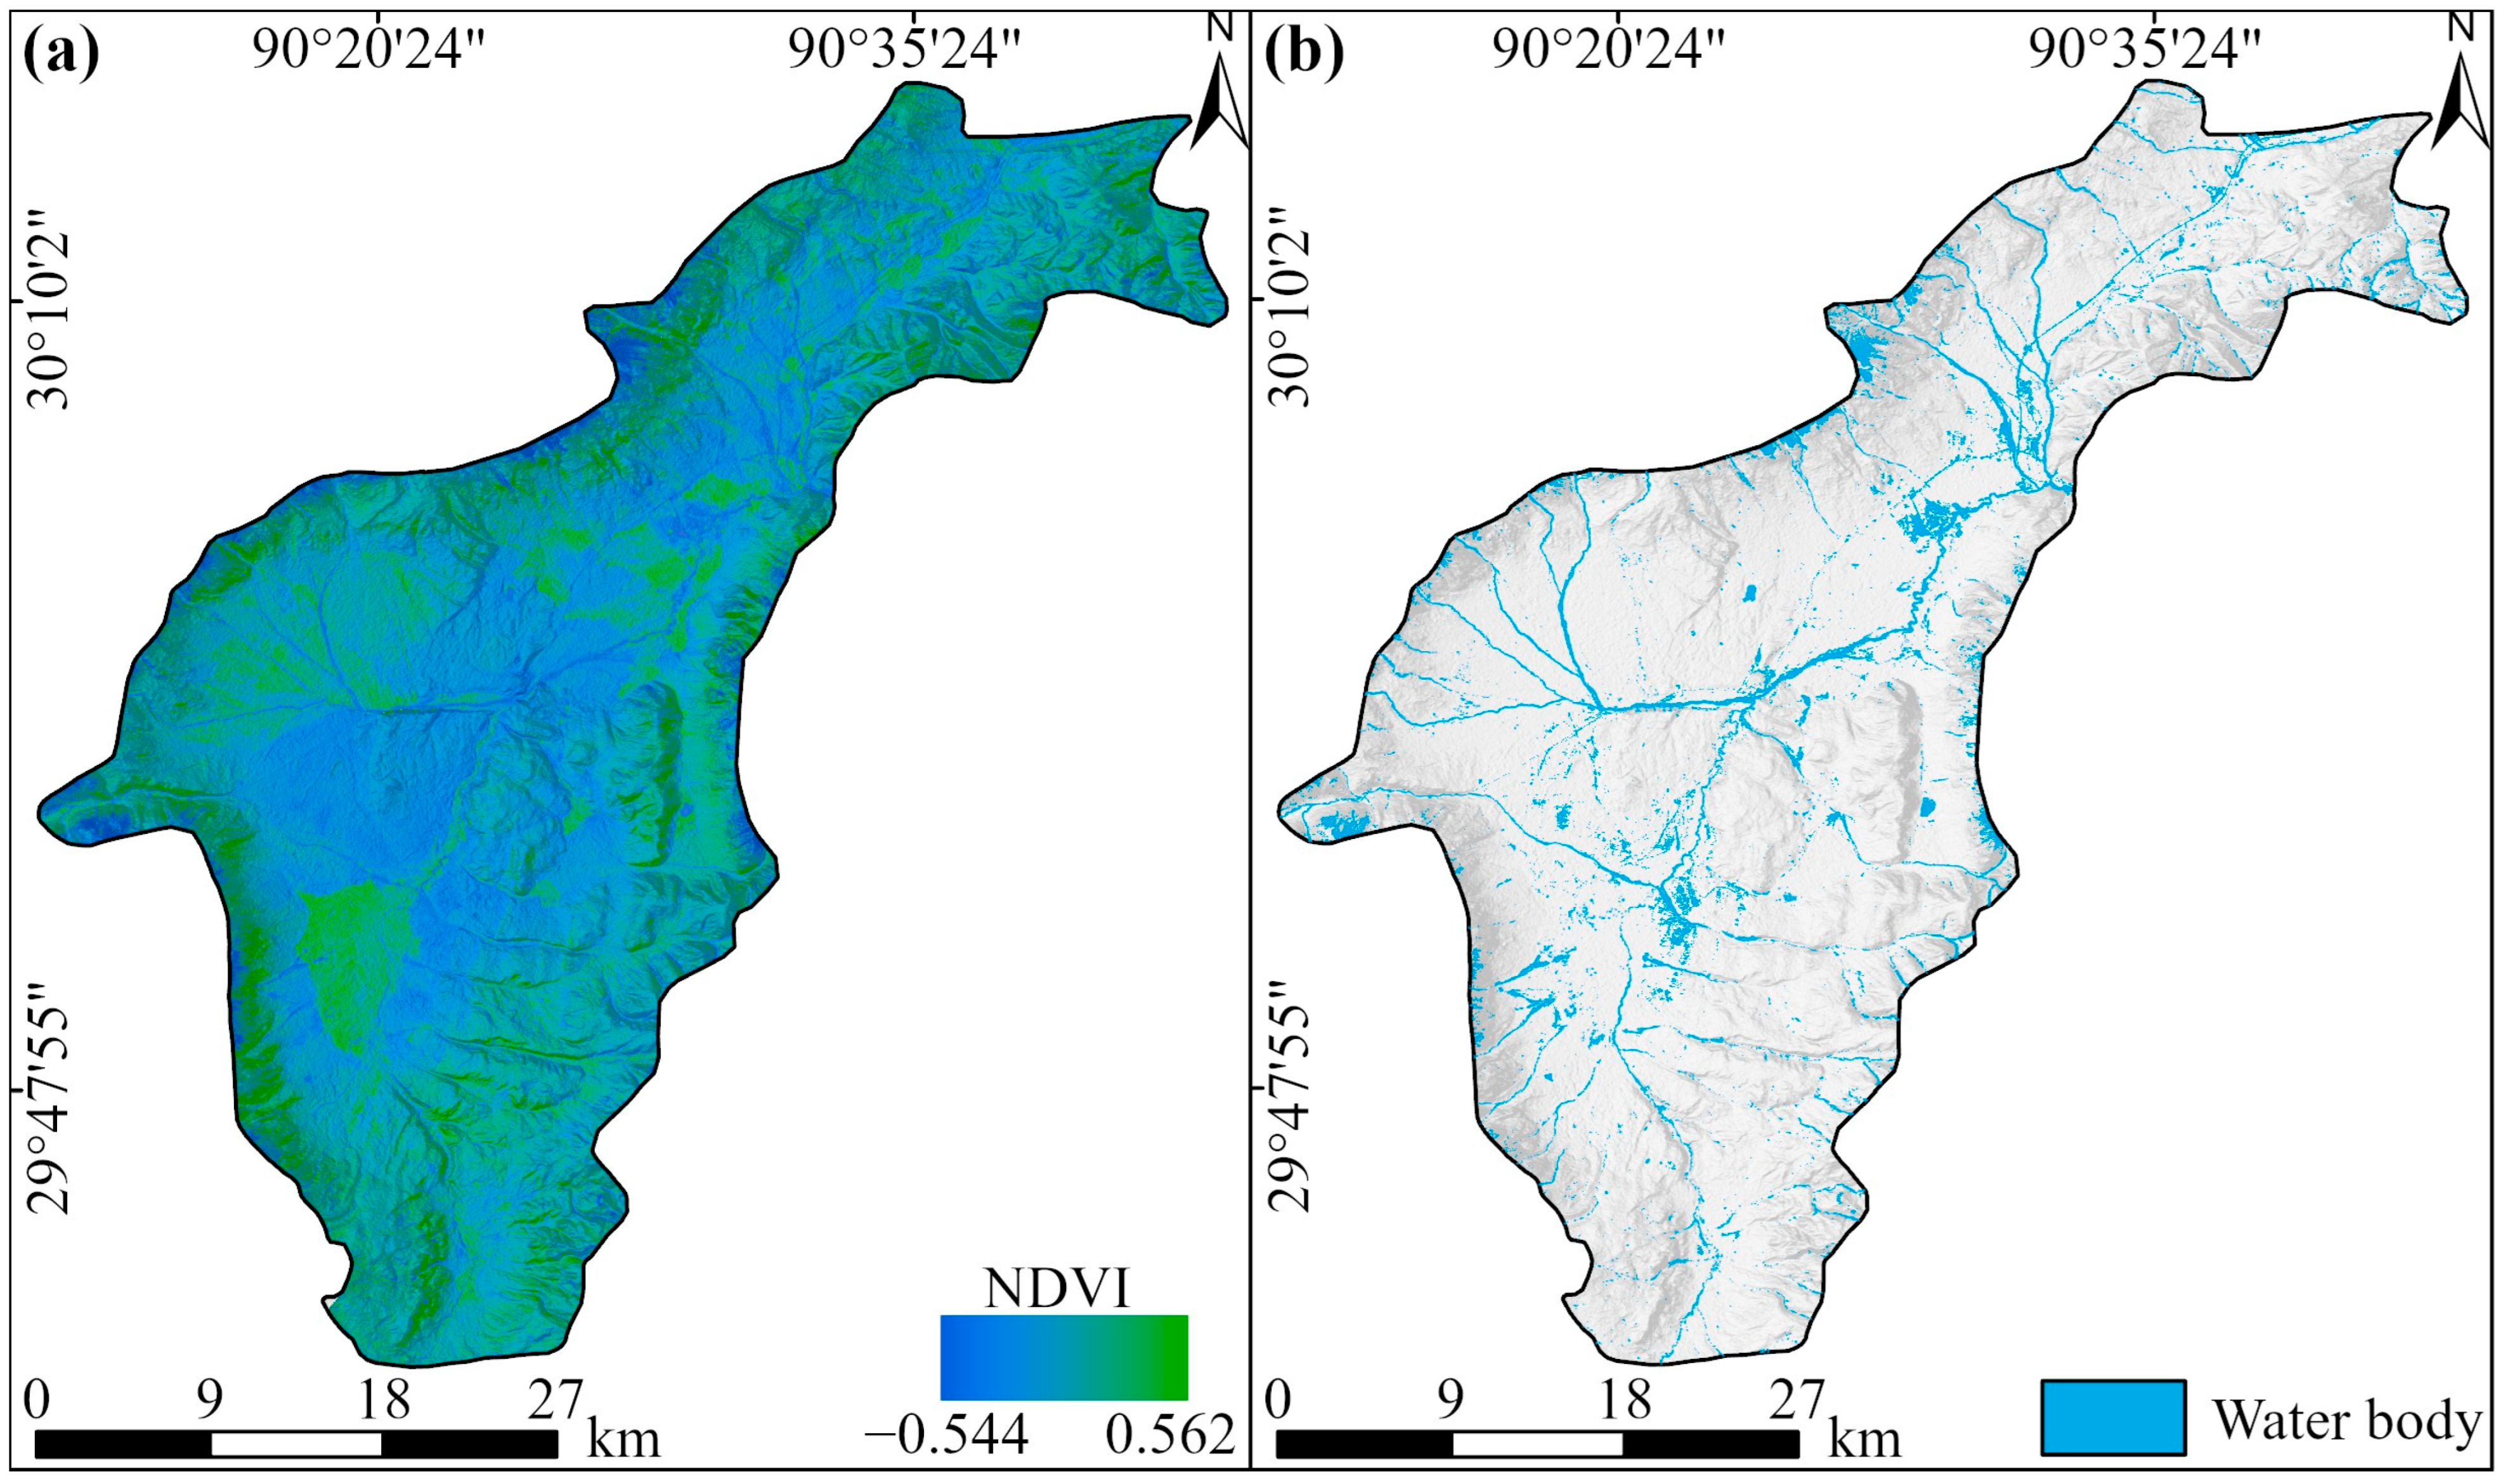
NDVI values in the study area range from –0.54 to 0.56, with an average of 0.17, indicating a gradual increase in vegetation coverage from the central region toward the surrounding areas (Figure 5a). Areas with NDVI < 0 are identified as water bodies (Figure 5b). The extracted water bodies are primarily concentrated in valley areas and surrounding mountainous regions, aligning with the known river network and providing support for surface temperature correction.
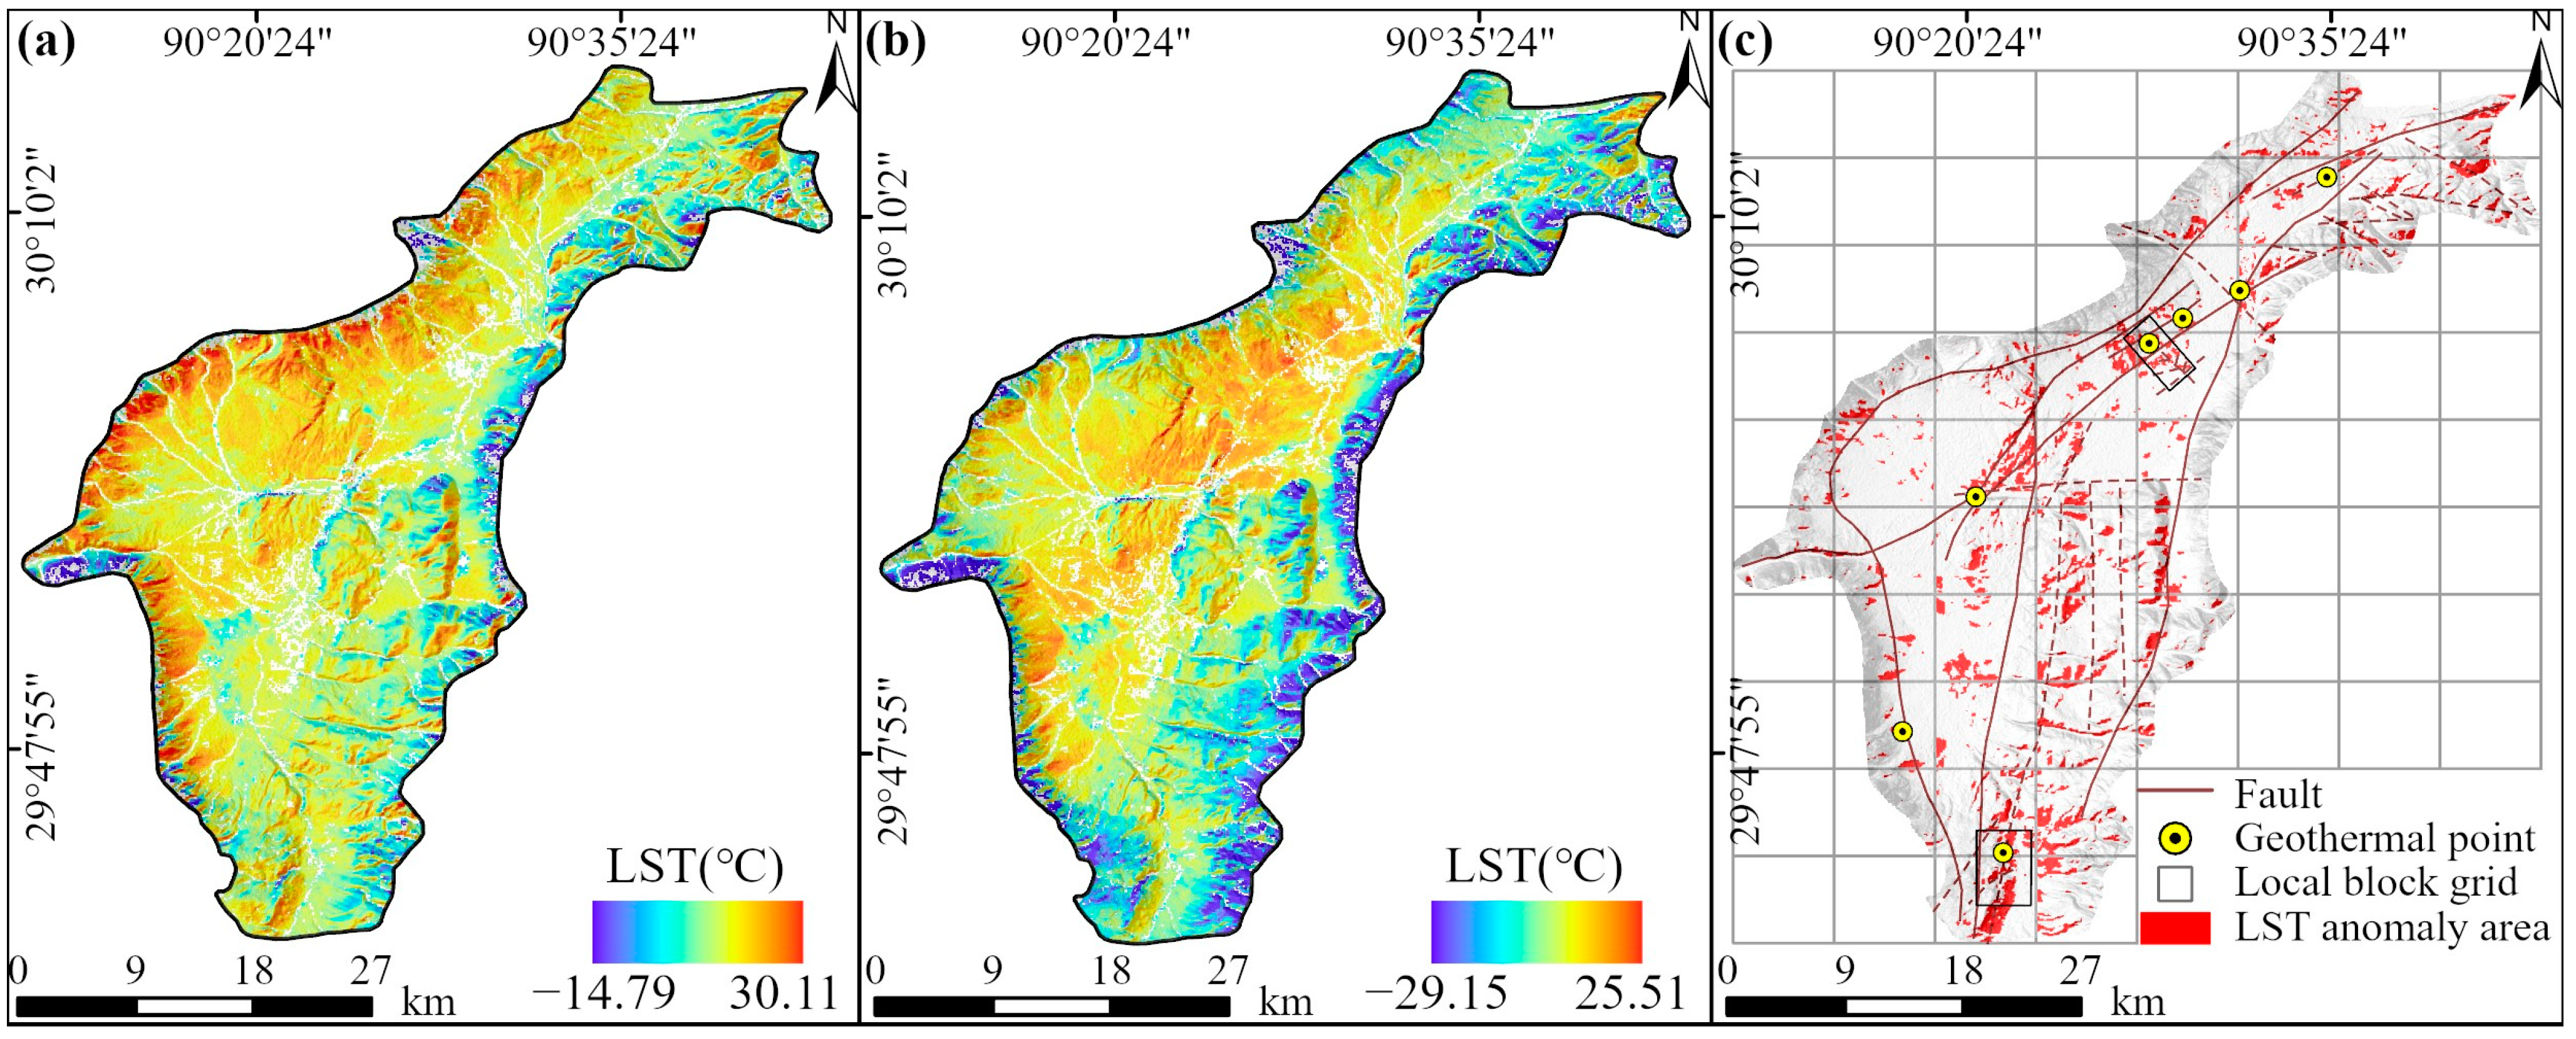
As shown in Figure 3a, LST decreases with elevation, with a temperature difference of approximately 20 °C between the highest and lowest elevation zones. The elevation-corrected image is presented in Figure 6b. After correction, the LST range was adjusted to −29.15 °C to 27.18 °C, with a mean of 6.2 °C and a standard deviation of 6.6 °C. Using the corrected data, the local block threshold method was applied to extract daytime high-temperature LST anomaly regions (Figure 6c). The identified anomalies are primarily distributed along fault zones and correspond well with known geothermal hotspot locations.

4.2. Nighttime LST Anomalies Extracted from ASTER LST Data

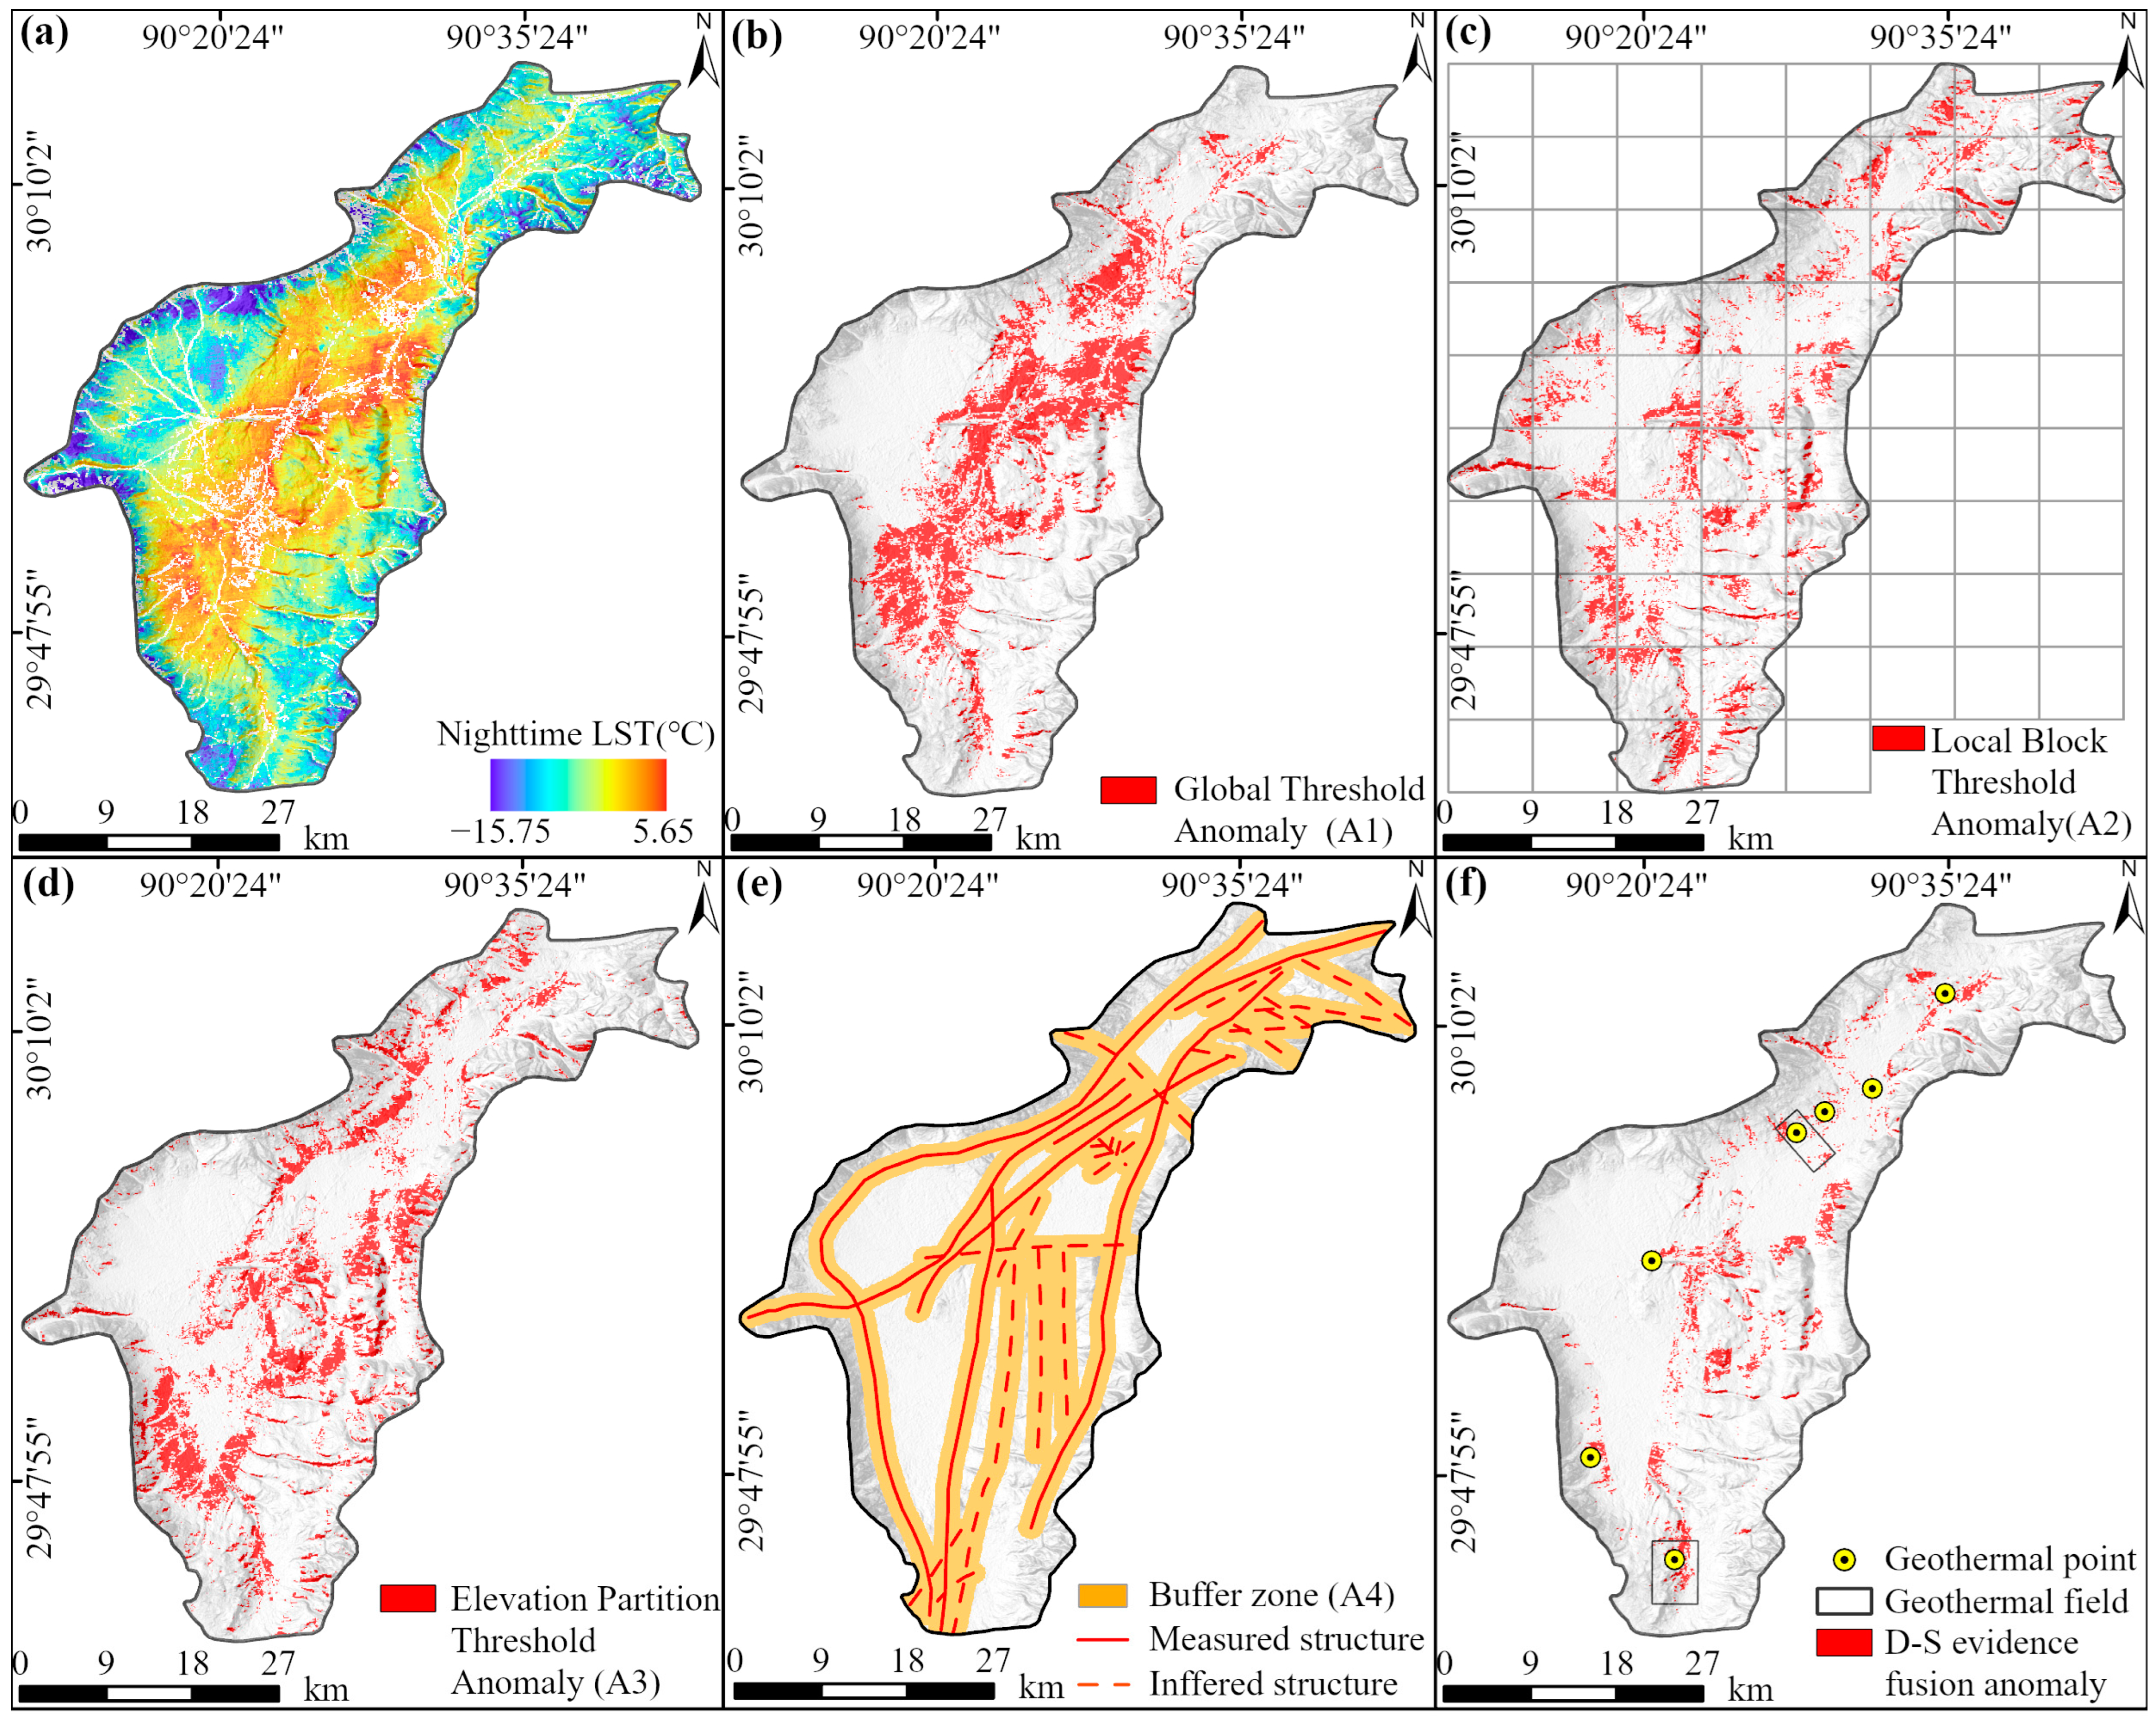
The nighttime LST ranges from -16.05 °C to 5.65 °C, with higher temperatures in the central basin and lower temperatures in the surrounding foothills (Figure 7a). Figure 7b shows geothermal anomalies extracted using the global threshold method. Figure 7c shows the results obtained using the local block threshold method. Figure 7d displays the results derived from the elevation-based partition threshold method. Figure 7e depicts the 1000-m fault structure buffer zone. Figure 7f shows the geothermal anomaly results obtained through multi-perspective data fusion using D–S evidence theory, which closely correspond to known geothermal field locations in the region.

4.3. Geothermal Anomalies from Combined Daytime and Nighttime LST

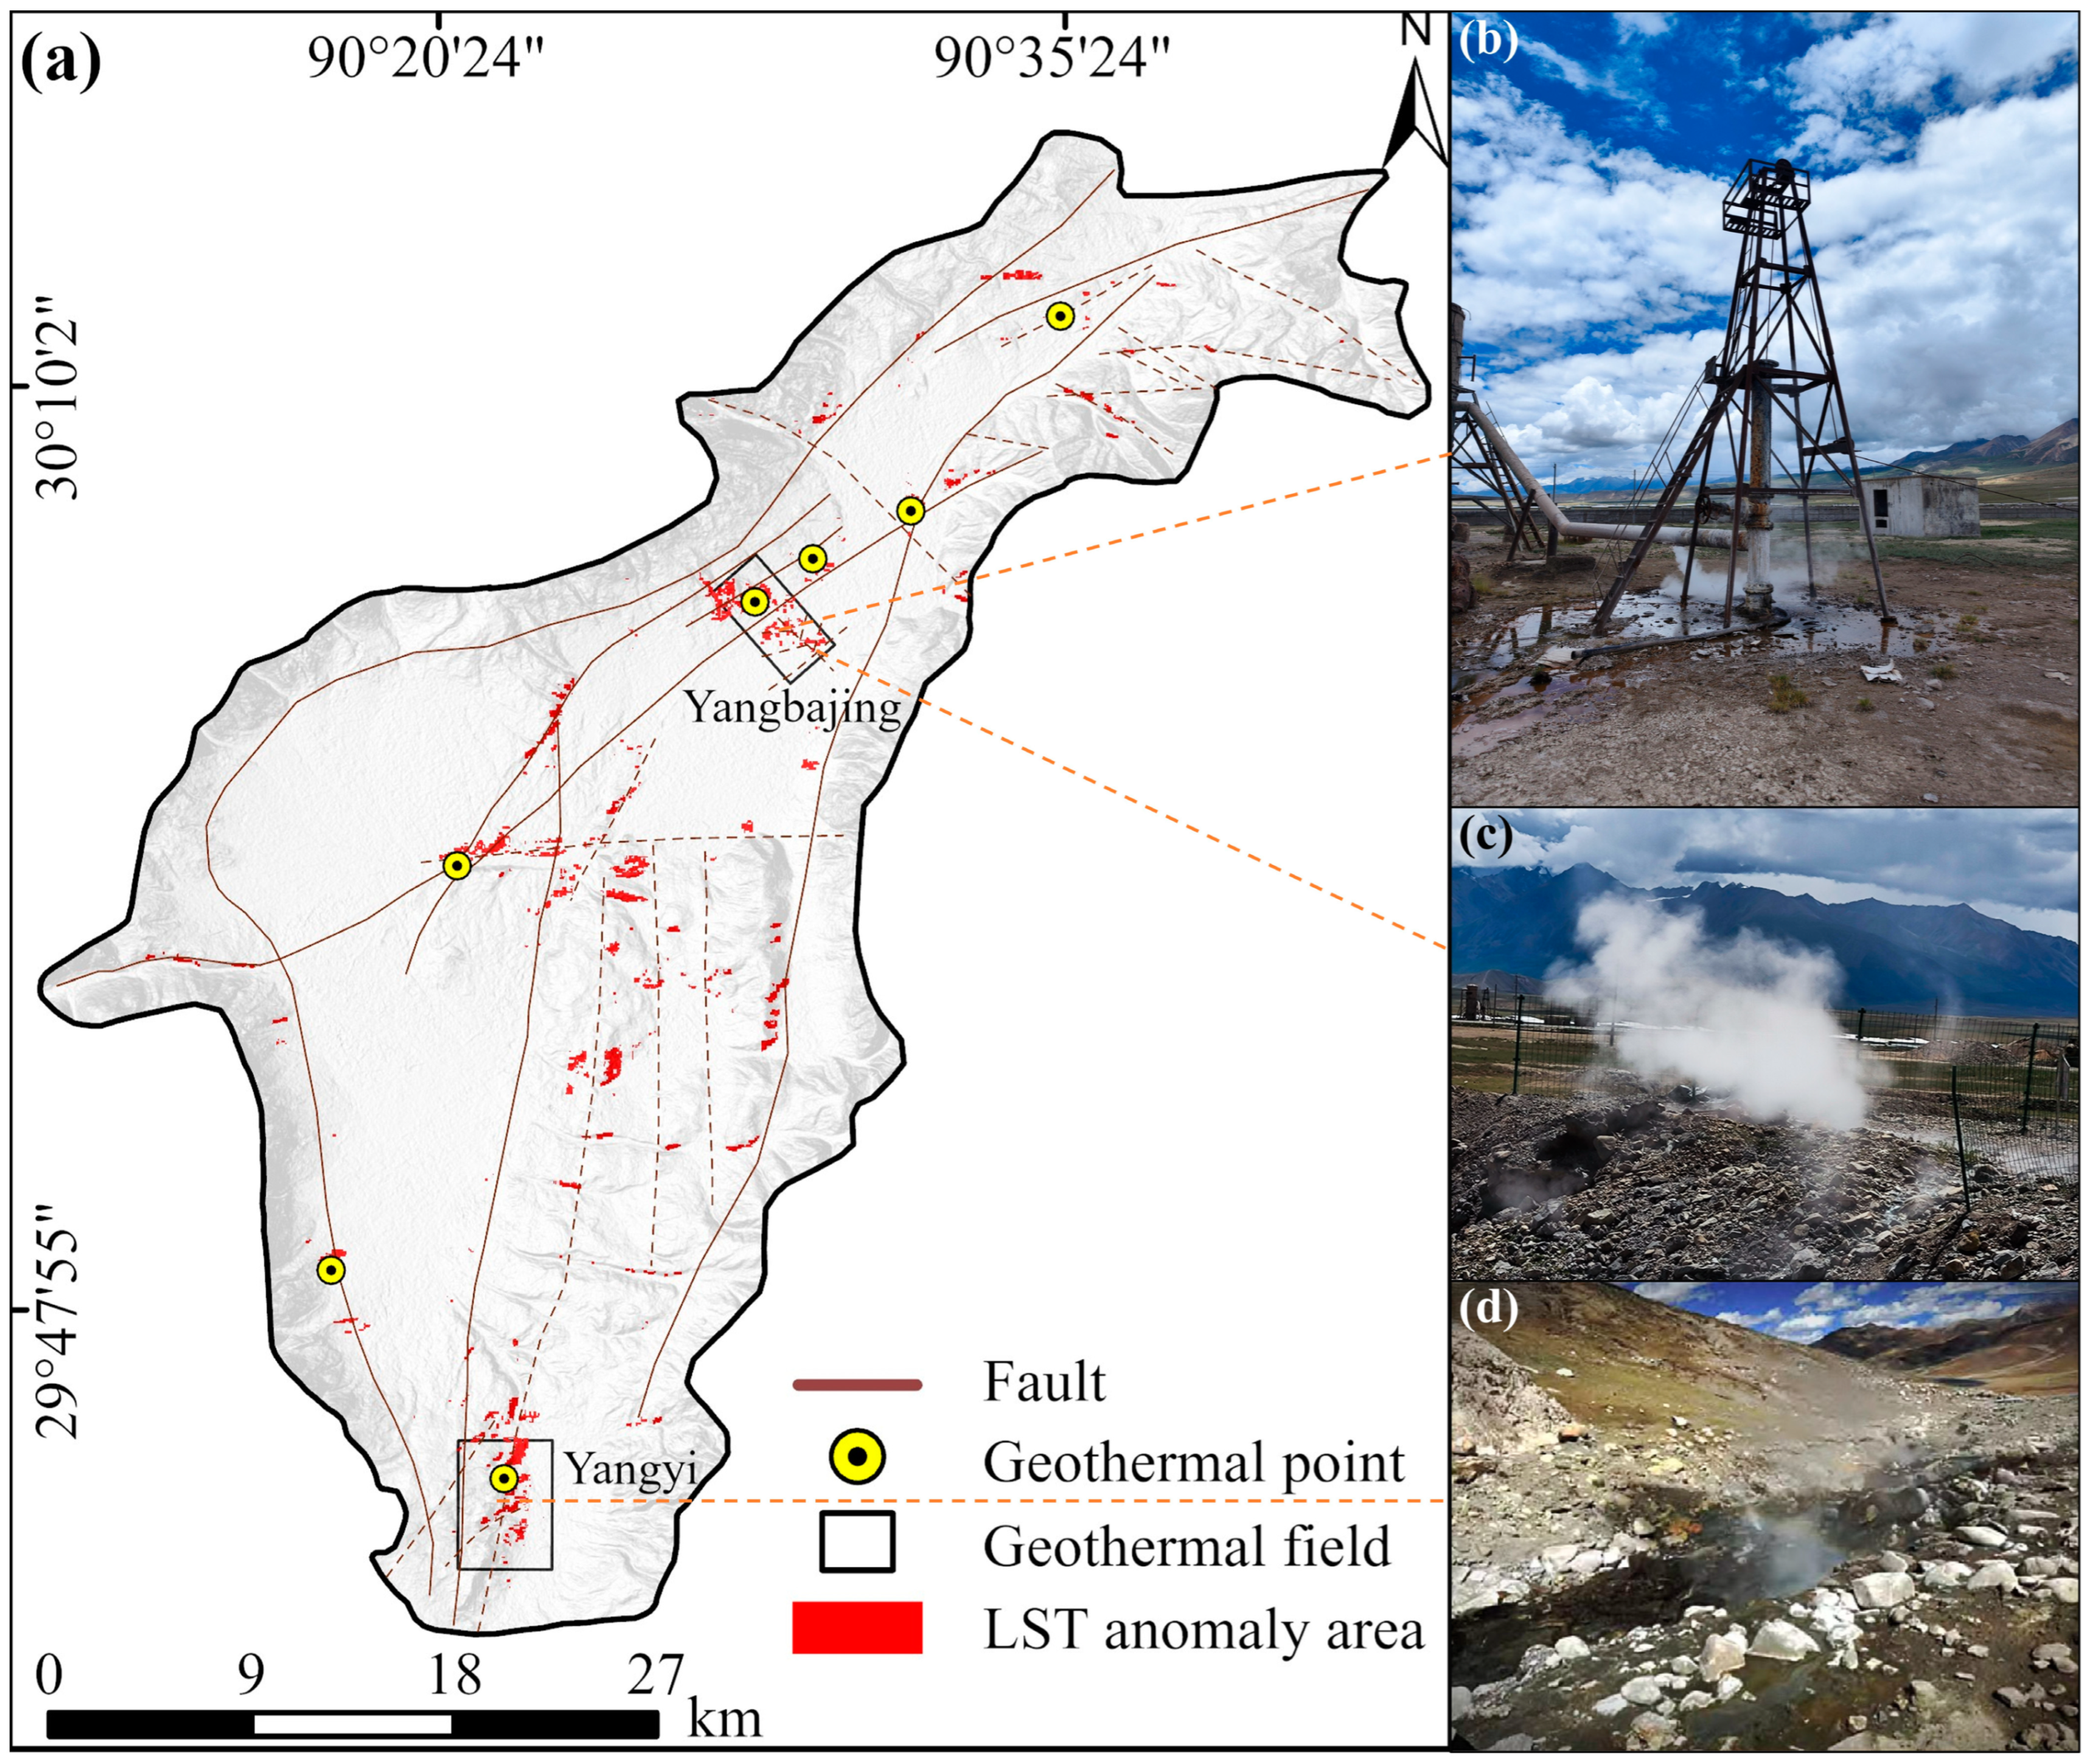
Figure 8a highlights regions that consistently exhibit high temperatures during both daytime and nighttime, considered as theoretical true geothermal anomalies. The results indicate that these anomaly zones align with major fault structures, demonstrating strong spatial consistency. They closely correspond to the locations of the Yangbajing and Yangyi geothermal fields, along with several known hot springs (Figure 8b–d), further confirming the role of fault structures in controlling geothermal anomaly distribution.

4.4. Distribution Characteristics of Geothermal Anomalies Detected by MODIS NLST

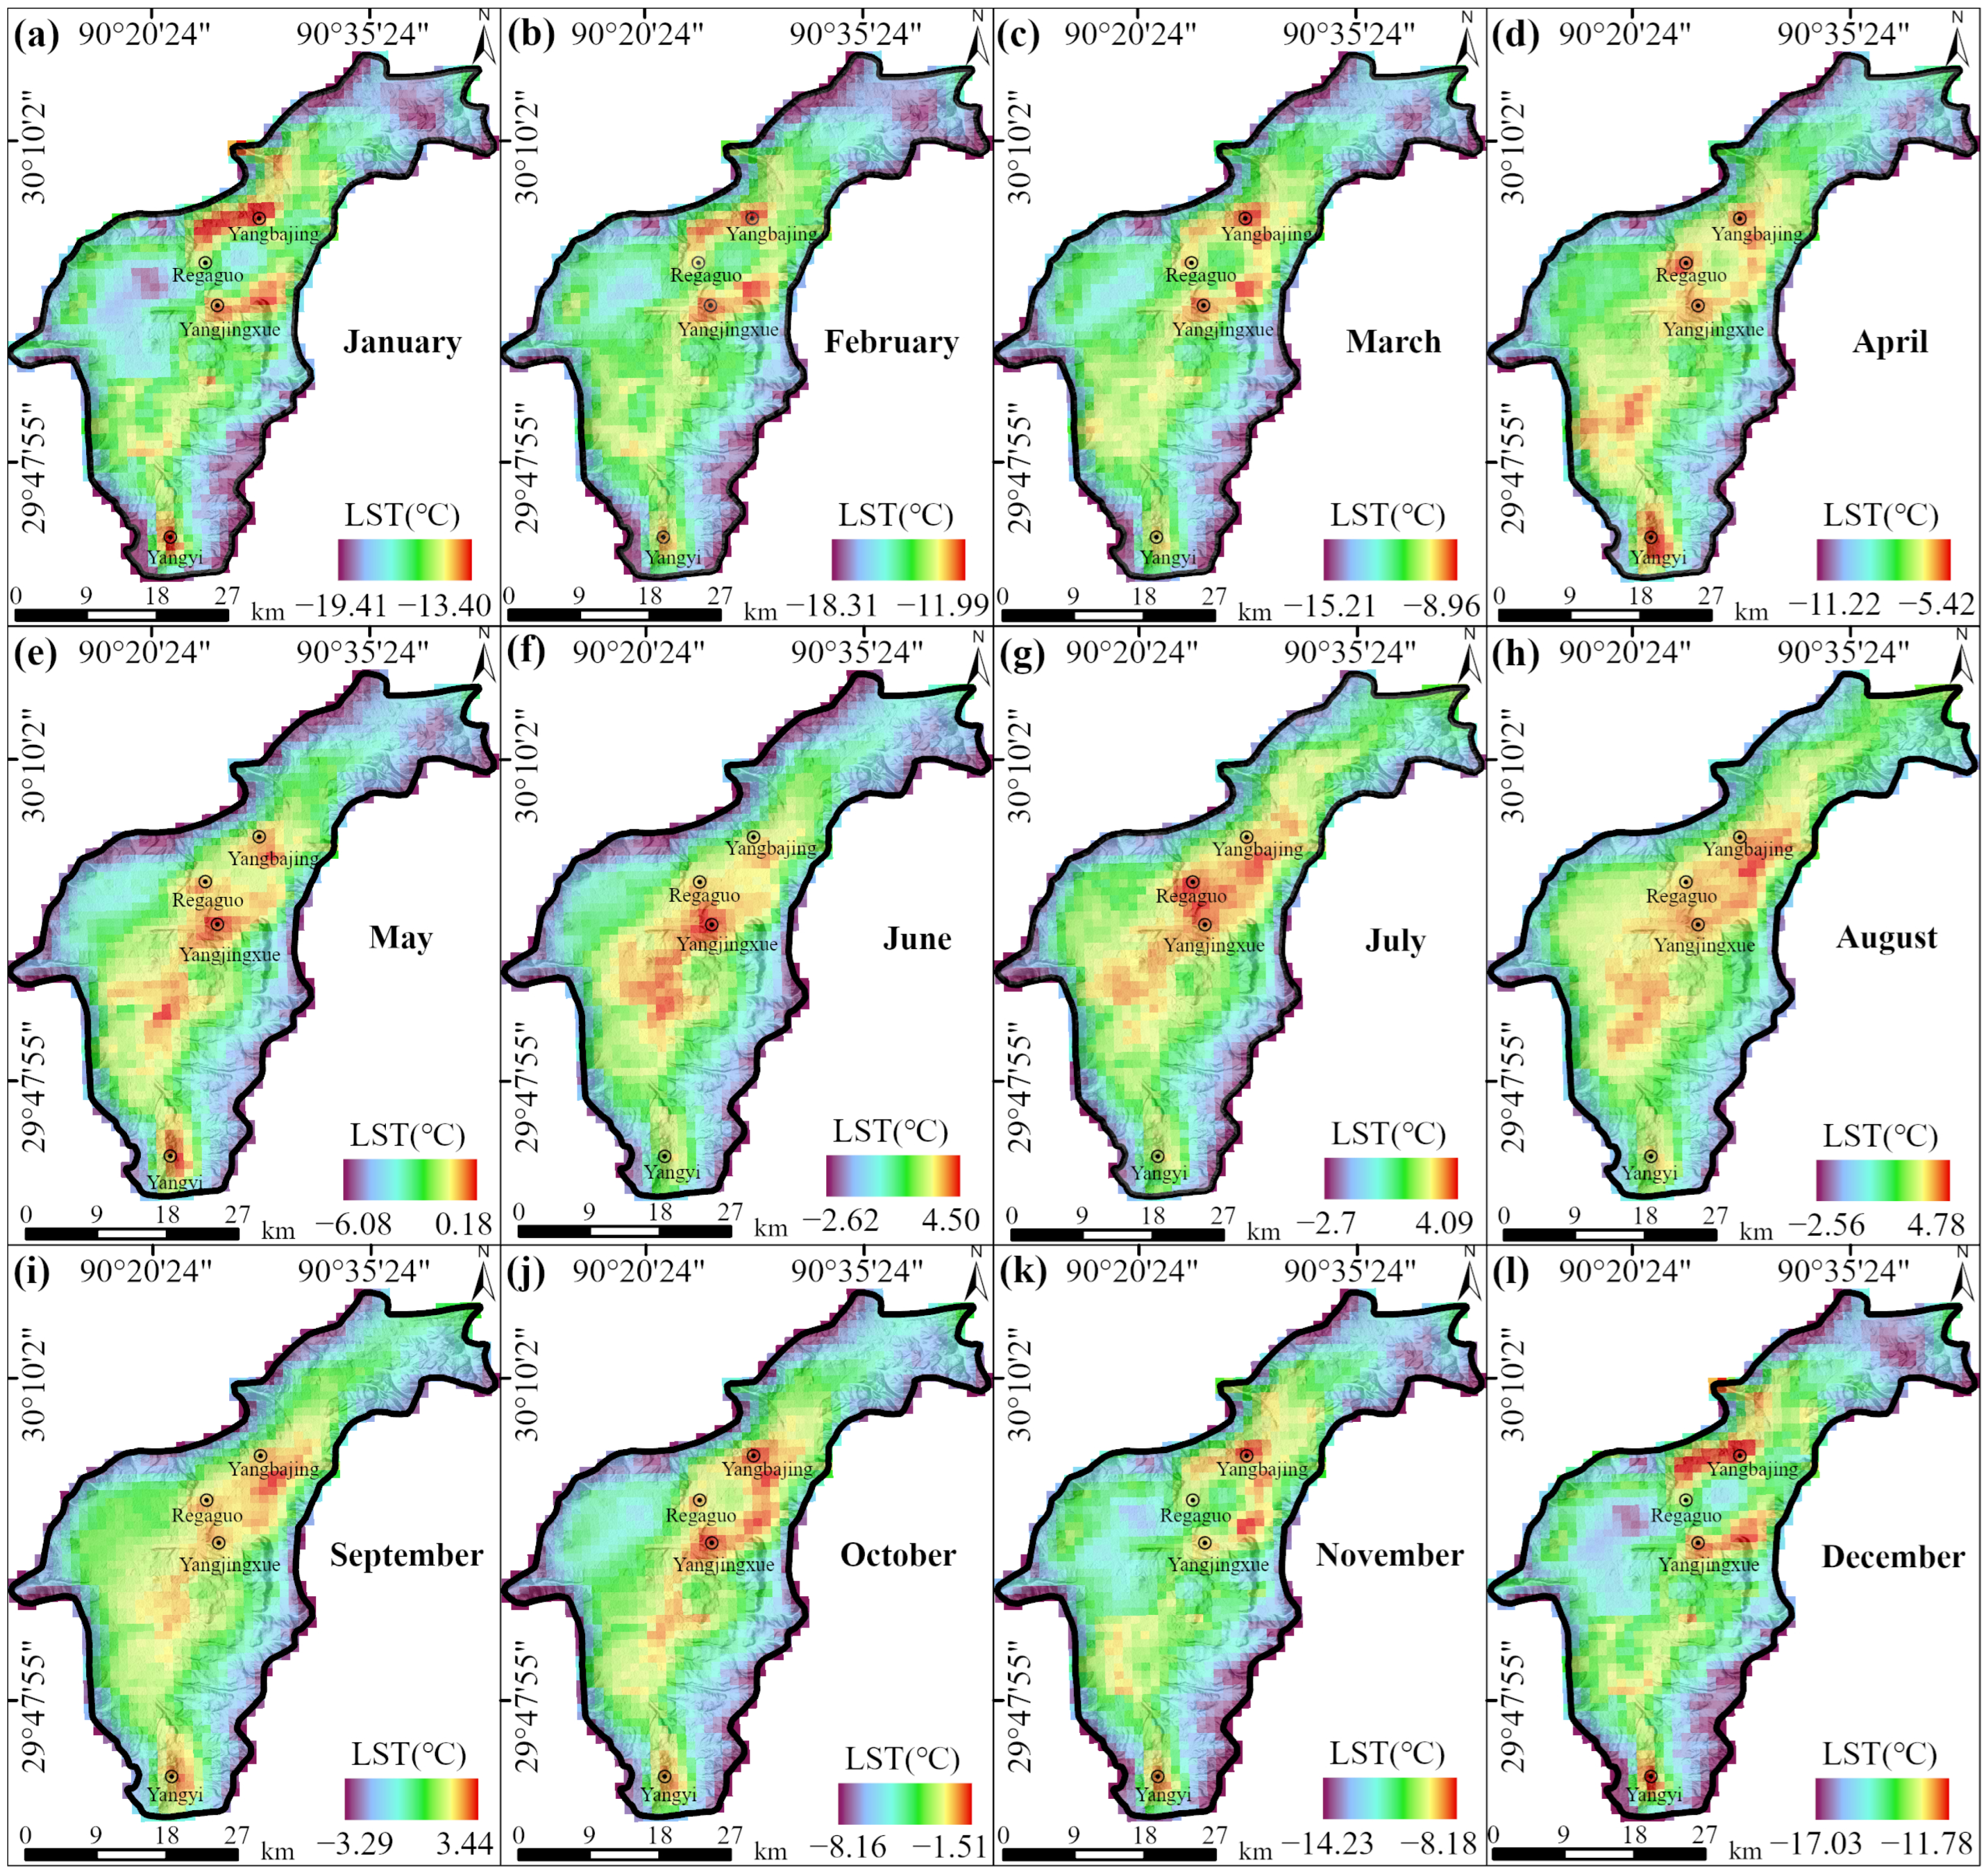
Figure 9 illustrates the spatial variation in monthly average LST across the study area from 2003 to 2023. Although the distribution of temperature anomalies varies slightly across months, they remain primarily concentrated in the Yangbajing and Yangyi geothermal fields, where monthly average temperatures are significantly higher than those in the surrounding areas.
Figure 10a presents the monthly average LST data over 252 months, revealing the general surface temperature distribution in the study area. The central region exhibits higher temperatures, while the surrounding areas show relatively lower values. The figure highlights four significant temperature anomaly zones: the Yangbajing Geothermal Field, the Yangjingxue area, the southern part of Regaguo, and the Yangyi Geothermal Field, with areas of 17.08, 26.19, 3.02, and 4.99 km2, respectively.
Figure 10b displays the shape and orientation of the isotherms. The first three anomaly zones are arranged in a U-shape along the NE–SW direction, aligning with the orientation of regional fault structures.

5. Discussion

5.1. Integration and Optimization of Multi-Source LST Data for Geothermal Anomaly Detection

5.1.1. Anomaly Extraction and Method Optimization of Landsat-8 LST Data

This study utilized the GEE platform for large-scale spatiotemporal data processing, successfully handling 134 scenes of long-term Landsat 8 daytime winter imagery. Compared to conventional methods, this approach significantly improved spatiotemporal coverage and data completeness for geothermal anomaly extraction.
The results indicate that the multi-year winter average LST map (Figure 3l) is more effective than single-year images in smoothing localized high-temperature anomalies, highlighting long-term thermal stability and overall distribution patterns in the region. This provides a more stable dataset for subsequent geothermal anomaly analyses.
During data preprocessing, key steps, such as water body removal and elevation correction, significantly improved the accuracy of the temperature distribution. The processed surface temperature distribution became more uniform, particularly in mountainous areas, where high-temperature anomalies were greatly reduced, effectively minimizing the impact of non-geothermal factors. These preprocessing optimizations substantially enhanced the accuracy of geothermal anomaly extraction.
Moreover, the local block threshold method, which assigns region-specific thresholds, addressed the global method’s limited sensitivity to localized anomalies and enhanced the extraction of small-scale thermal anomalies. The extracted anomaly regions closely matched known geothermal hotspots, further confirming the method’s reliability and effectiveness.

5.1.2. Multi-Perspective Integration and Extraction Analysis of ASTER NLST Data

Although ASTER data are less suitable for time-series analysis than Landsat data, this study adopted a multi-angle extraction strategy combined with the D–S evidence fusion method, achieving promising results in geothermal anomaly identification. The results show that, although the global threshold method (Figure 7b) can rapidly delineate large-scale geothermal anomalies, it tends to produce overly broad regions, reducing its effectiveness in identifying smaller-scale anomaly zones.
In contrast, the approach in Figure 7c, which applies regional segmentation with localized threshold settings, enhanced the extraction of small-scale anomaly regions. Notably, it was more effective in detecting moderate-to-low temperature anomalies, allowing for more comprehensive identification of localized geothermal signals.
Figure 7d further accounts for the influence of elevation on temperature variation, enhancing anomaly detection in high-altitude mountainous areas while significantly reducing false positives in low-altitude regions.
With the introduction of a fault structure buffer zone, areas located more than 1 km from faults were considered outside the influence of thermal diffusion halos. Even anomaly regions identified by all three preceding methods were excluded if located beyond this range, as they were considered unrelated to geothermal activity. Comparison with known geothermal hotspots confirmed that none of the excluded regions overlapped with known hotspots, further supporting the validity of the method.
Ultimately, the D–S evidence fusion method effectively integrated the strengths of multiple extraction approaches, improving anomaly concentration and significantly reducing noise and false positives. This method yielded more stable results and was better suited for integration with daytime Landsat anomaly data, providing a more reliable foundation for subsequent comprehensive analysis.

5.1.3. Geothermal Anomaly Stability from Joint Daytime and Nighttime LST Analysis

This study integrated daytime and nighttime LST data to improve the accuracy of geothermal anomaly identification. This approach effectively reduced the influence of daytime solar radiation and environmental factors on temperature distribution, minimizing the effects of natural surface features that cause cold or hot anomalies at different times of day. Incorporating the thermal diffusion effect of fault structures further enhanced the stability of geothermal anomaly detection.
Comparison between daytime and nighttime LST (Figure 6c and Figure 7f) reveals clear spatial differences in maximum temperature values. Different surface types, such as water bodies and bare land, exhibit contrasting temperature patterns between day and night. Due to their high specific heat capacity, water bodies warm slowly during the day, producing cold anomalies, and cool gradually at night, appearing relatively warm [59]. In contrast, bare land responds more quickly to solar radiation, heating rapidly during the day and cooling quickly at night, resulting in greater diurnal temperature variation [60].
These temperature fluctuations, driven by surface thermal property differences, indicate that single-period LST data may not accurately reflect the true distribution of geothermal anomalies. Specifically, high daytime temperatures may cause false identification of bare land as geothermal anomalies, while high nighttime temperatures may lead to overestimation of anomalies in water bodies [61].
Therefore, this study accounted for surface thermal property differences by retaining only regions that exhibited anomalies in both daytime and nighttime LST data. This approach effectively eliminated false anomaly signals, significantly reduced misidentifications, and improved the accuracy of geothermal anomaly mapping [62].

5.2. Magma Chamber Dynamics from MODIS NLST Data

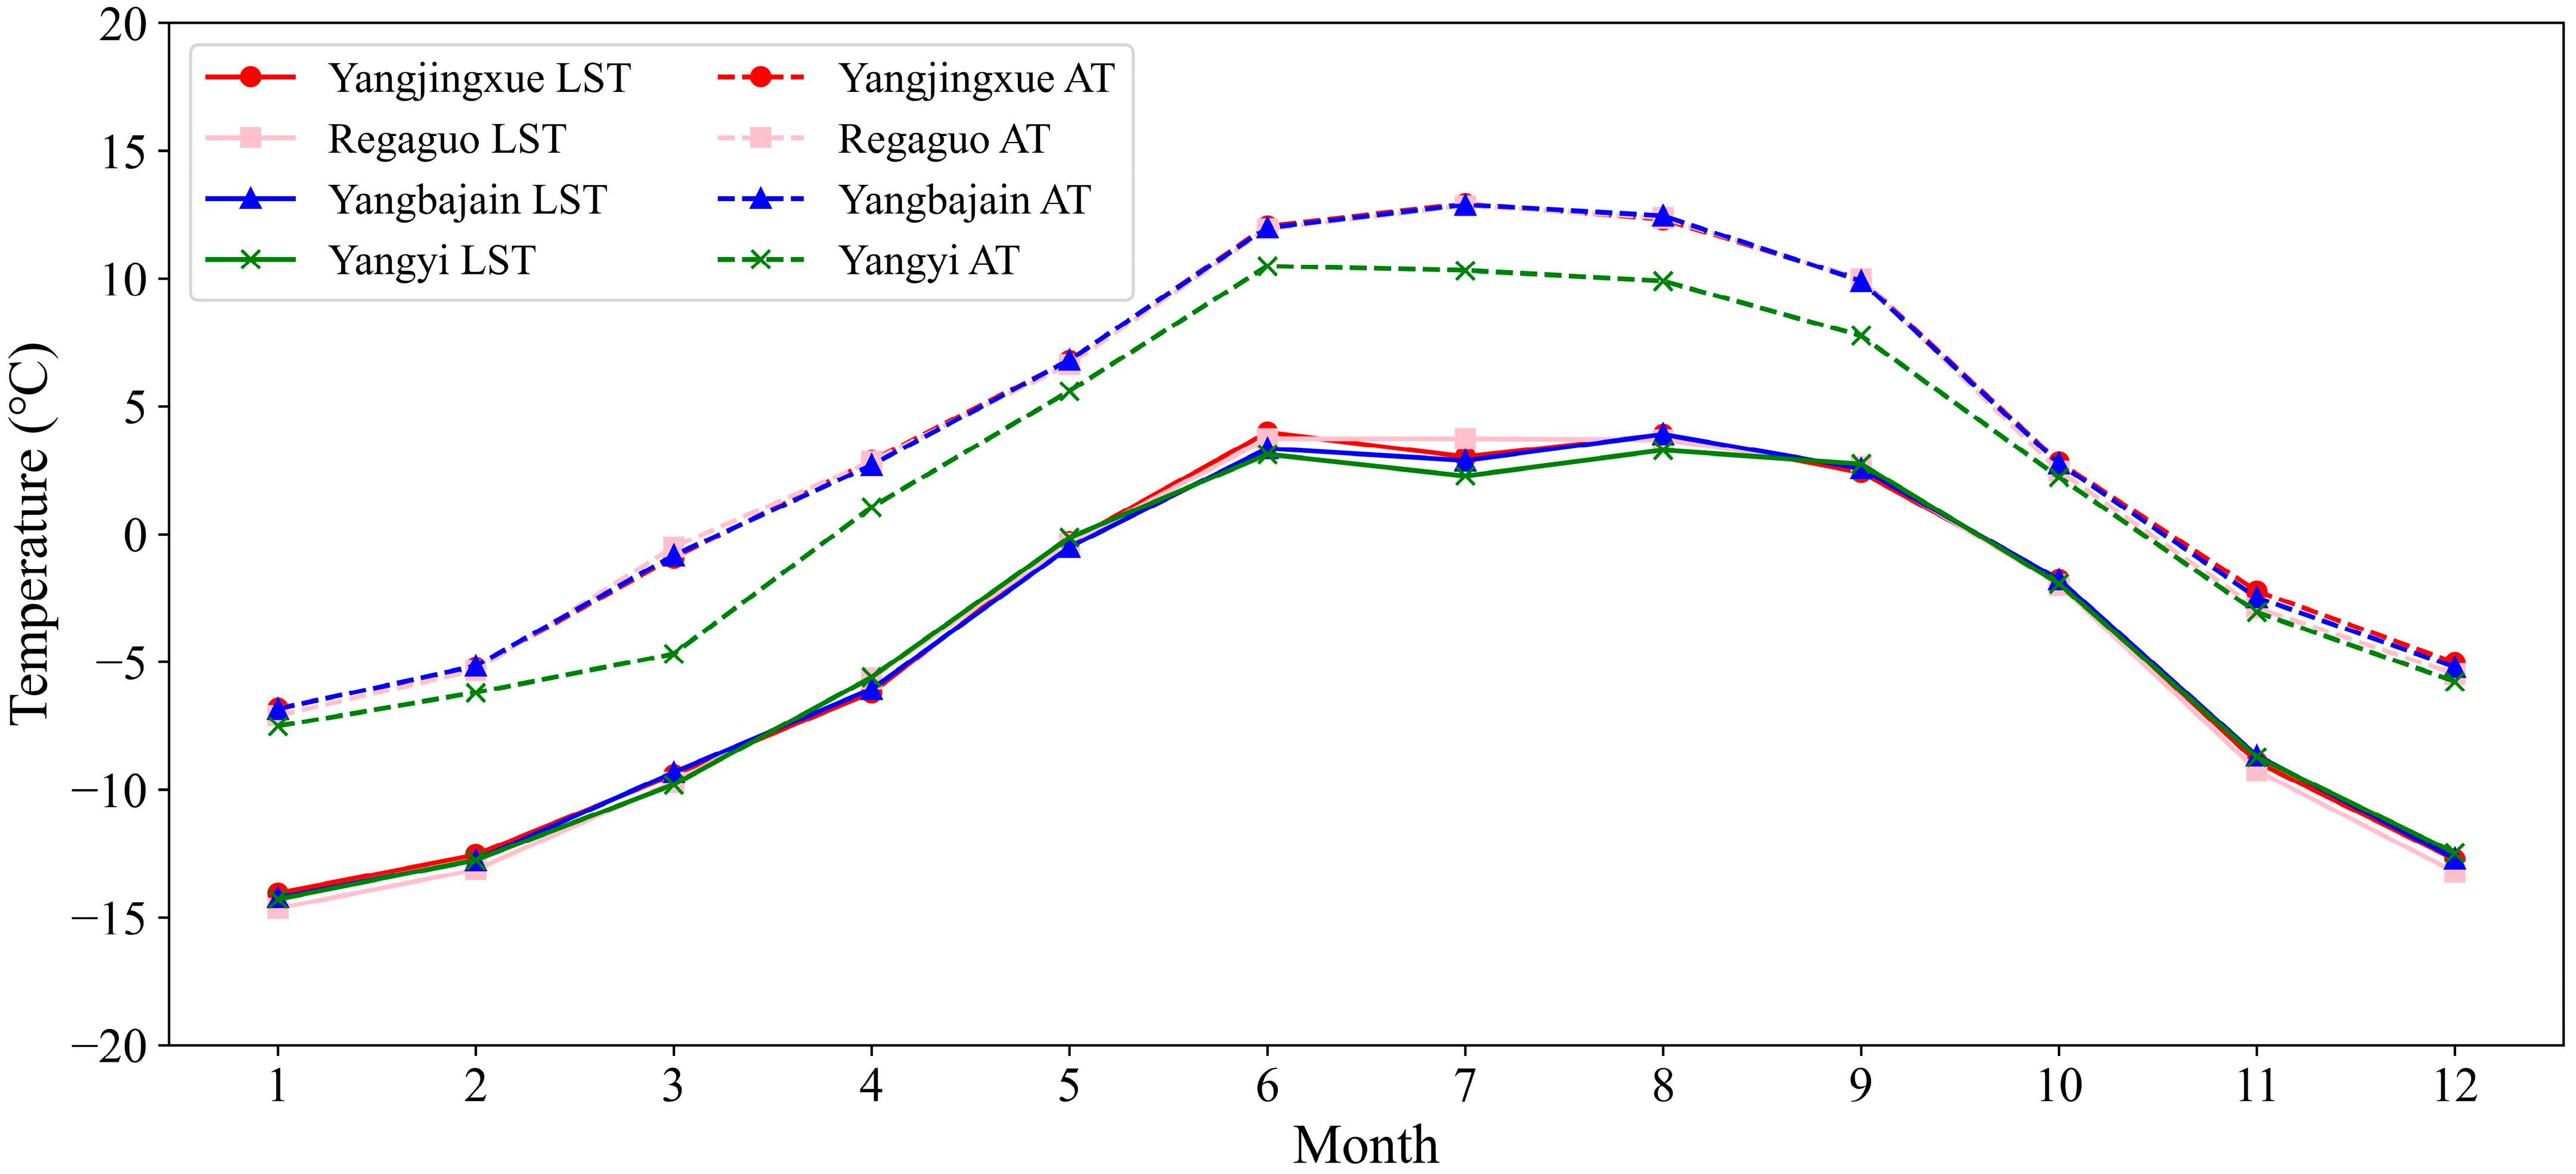
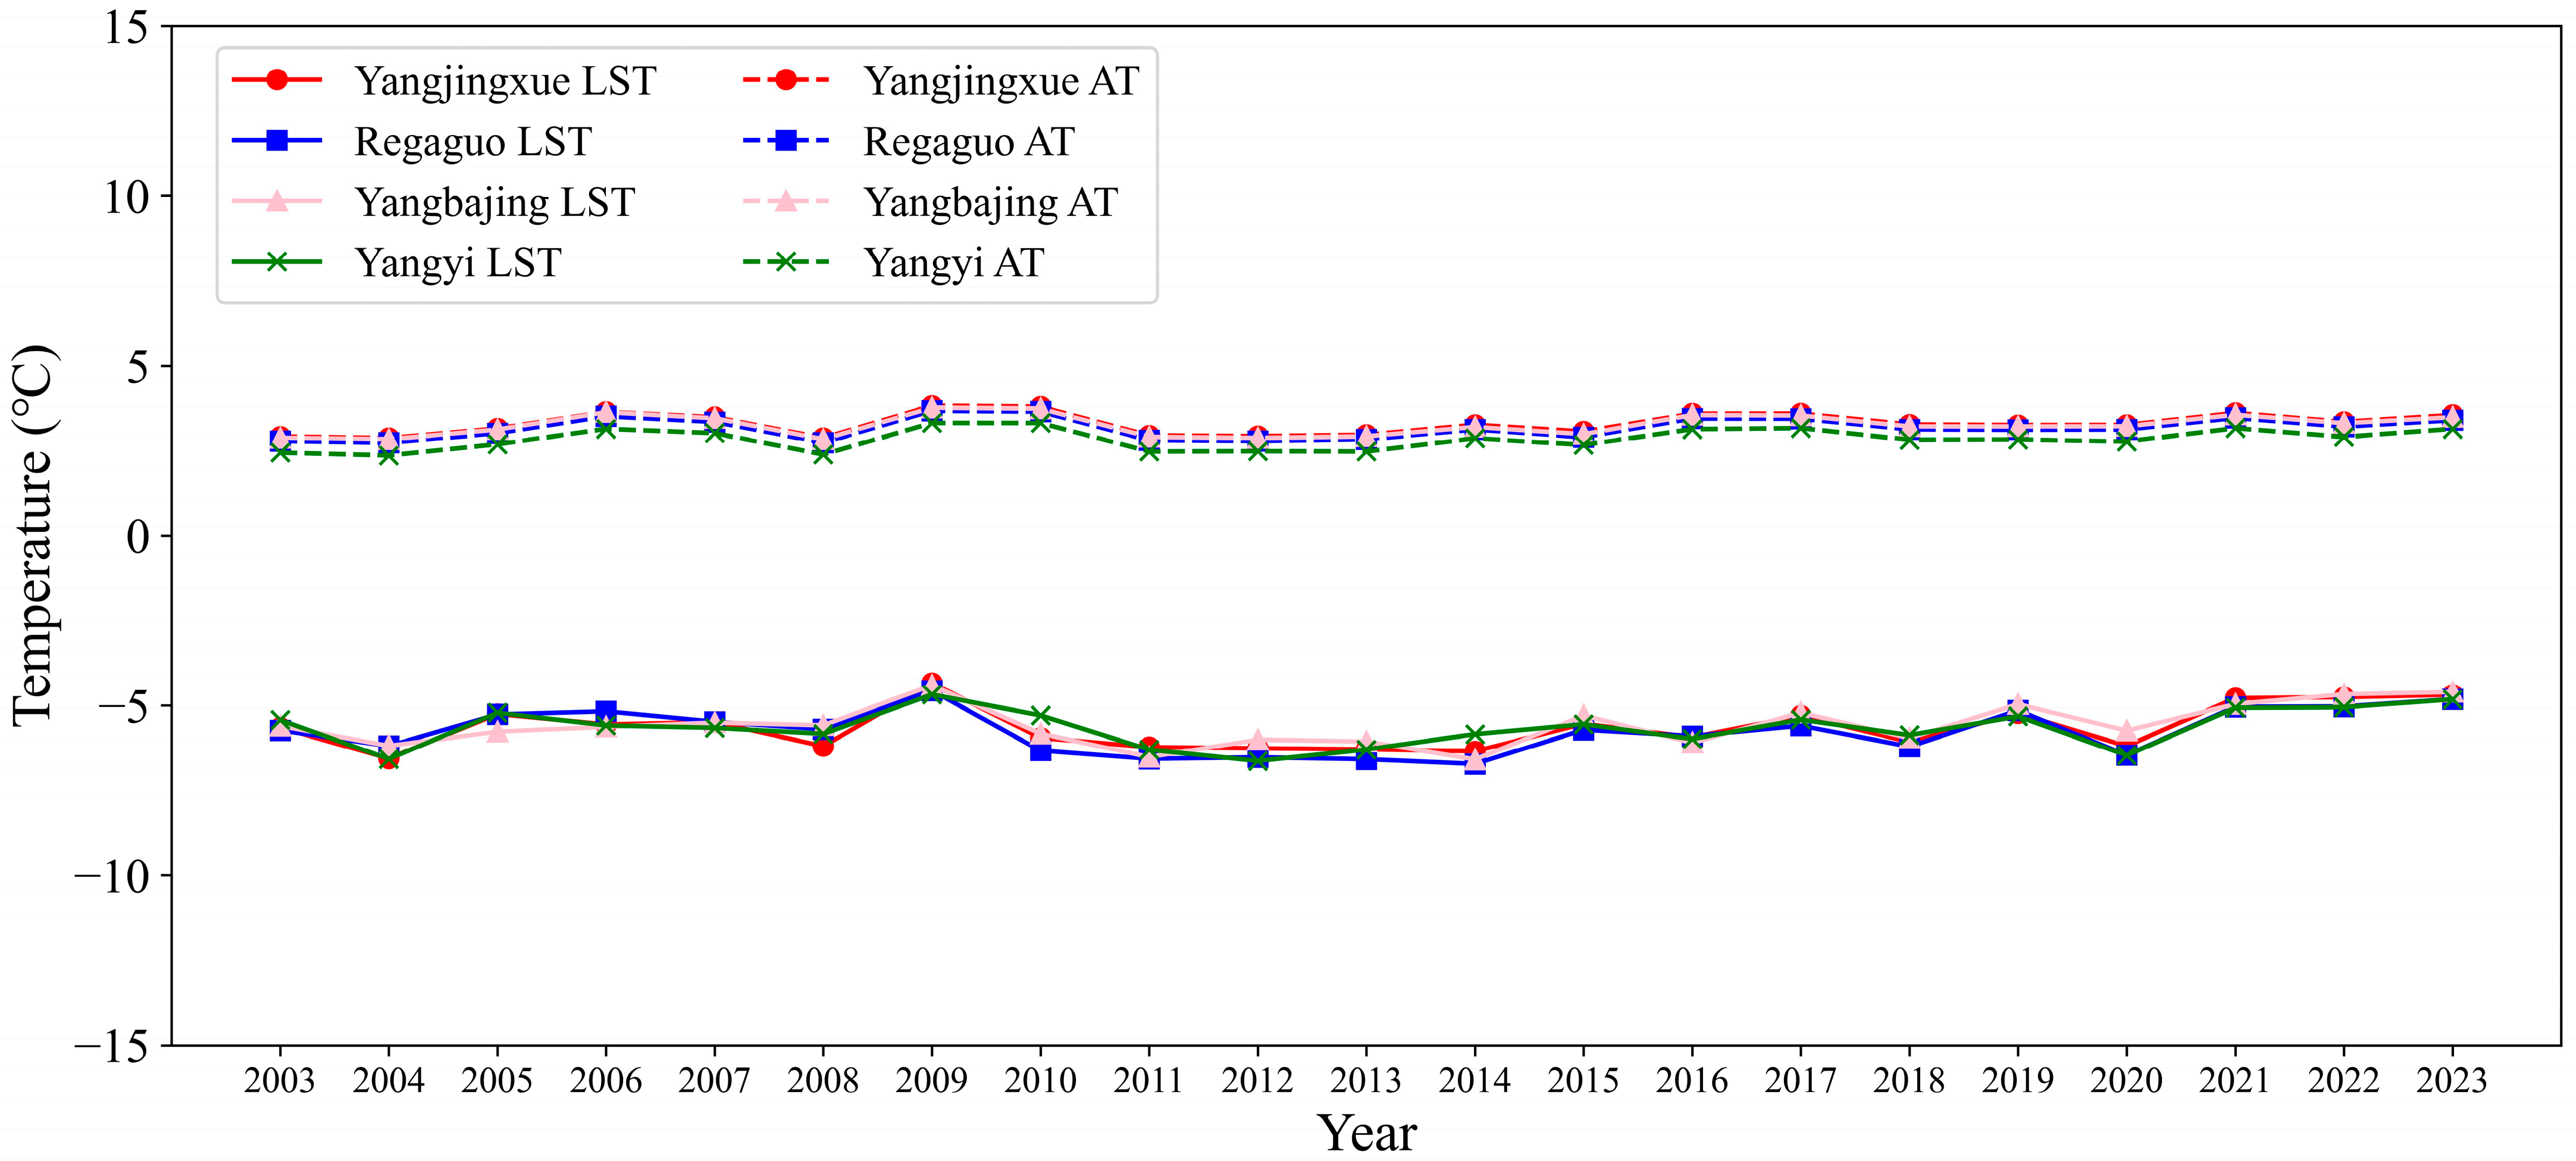
The four geothermal anomaly zones in the study area show significant fluctuations in both multi-year monthly average LST (Figure 11) and annual average LST over the past 21 years (Figure 12). The LST variation trends in these anomaly zones are generally consistent but display a bimodal pattern in June and August, whereas the corresponding average air temperature (AT) shows no similar features, and its monthly trend differs markedly from that of LST (Figure 11). Typically, regions north of the Tropic of Cancer experience only one solar radiation peak [63], thus, the bimodal pattern in LST may be attributed to non-solar factors. Based on this observation, the study hypothesizes that the bimodal pattern is closely associated with subsurface magma activity, potentially reflecting the influence of the underground magma system on geothermal anomalies.
This hypothesis is further supported by Figure 12. Interannual LST fluctuations significantly exceed those of AT over the same period, indicating that long-term average ground temperature in the anomaly zones is influenced not only by meteorological factors but also predominantly by subsurface magma activity [55]. Zones with greater LST variability may indicate more active and open underlying magma systems, accompanied by more pronounced variations in surface and groundwater recharge. Based on these observations, the study further proposes that geothermal anomalies in the region are primarily driven by magma activity, and infers the potential presence of magma chambers beneath the four anomaly zones.
This hypothesis is strongly supported by previous studies. Since the 1980s, multiple research teams—including Sino–French and Sino–Japanese collaborations, Geotermica Italiana, and the INDEPTH project—have identified low-resistivity layers or partially molten bodies at depths of 10–20 km in the Yangbajing geothermal field, proposing these as primary heat sources or magma chambers [6,42,64,65,66]. More recent studies have revealed the presence of a heat source at depths of 6–14 km beneath the Yangbajing area, which aligns with the hypothesis proposed in this study [43]. Additionally, Ren et al. [67] identified a low-resistivity, umbrella-shaped magma body at approximately 6 km depth beneath the Yangyi geothermal field using Audio-frequency Magnetotellurics (AMT), which serves as the primary heat source for the region’s geothermal system, further supporting the reliability of this hypothesis.
Although specific local survey data are lacking for the Yangjingxue and Regaguo areas, large-scale geophysical studies by Wang Gang et al. [68] and Lei Lulu [69] indicate that these areas lie within low-resistivity bodies, which may host partial melt bodies or magma chambers. Therefore, the four potential heat source areas identified in this study using LST data not only align with existing research on Yangbajing and Yangyi but also receive support from low-resistivity features in the newly hypothesized areas, further confirming the role of subsurface magma activity in driving geothermal anomalies.

5.3. Relationship Between Day–Night Anomalies and Magmatic Heat Sources

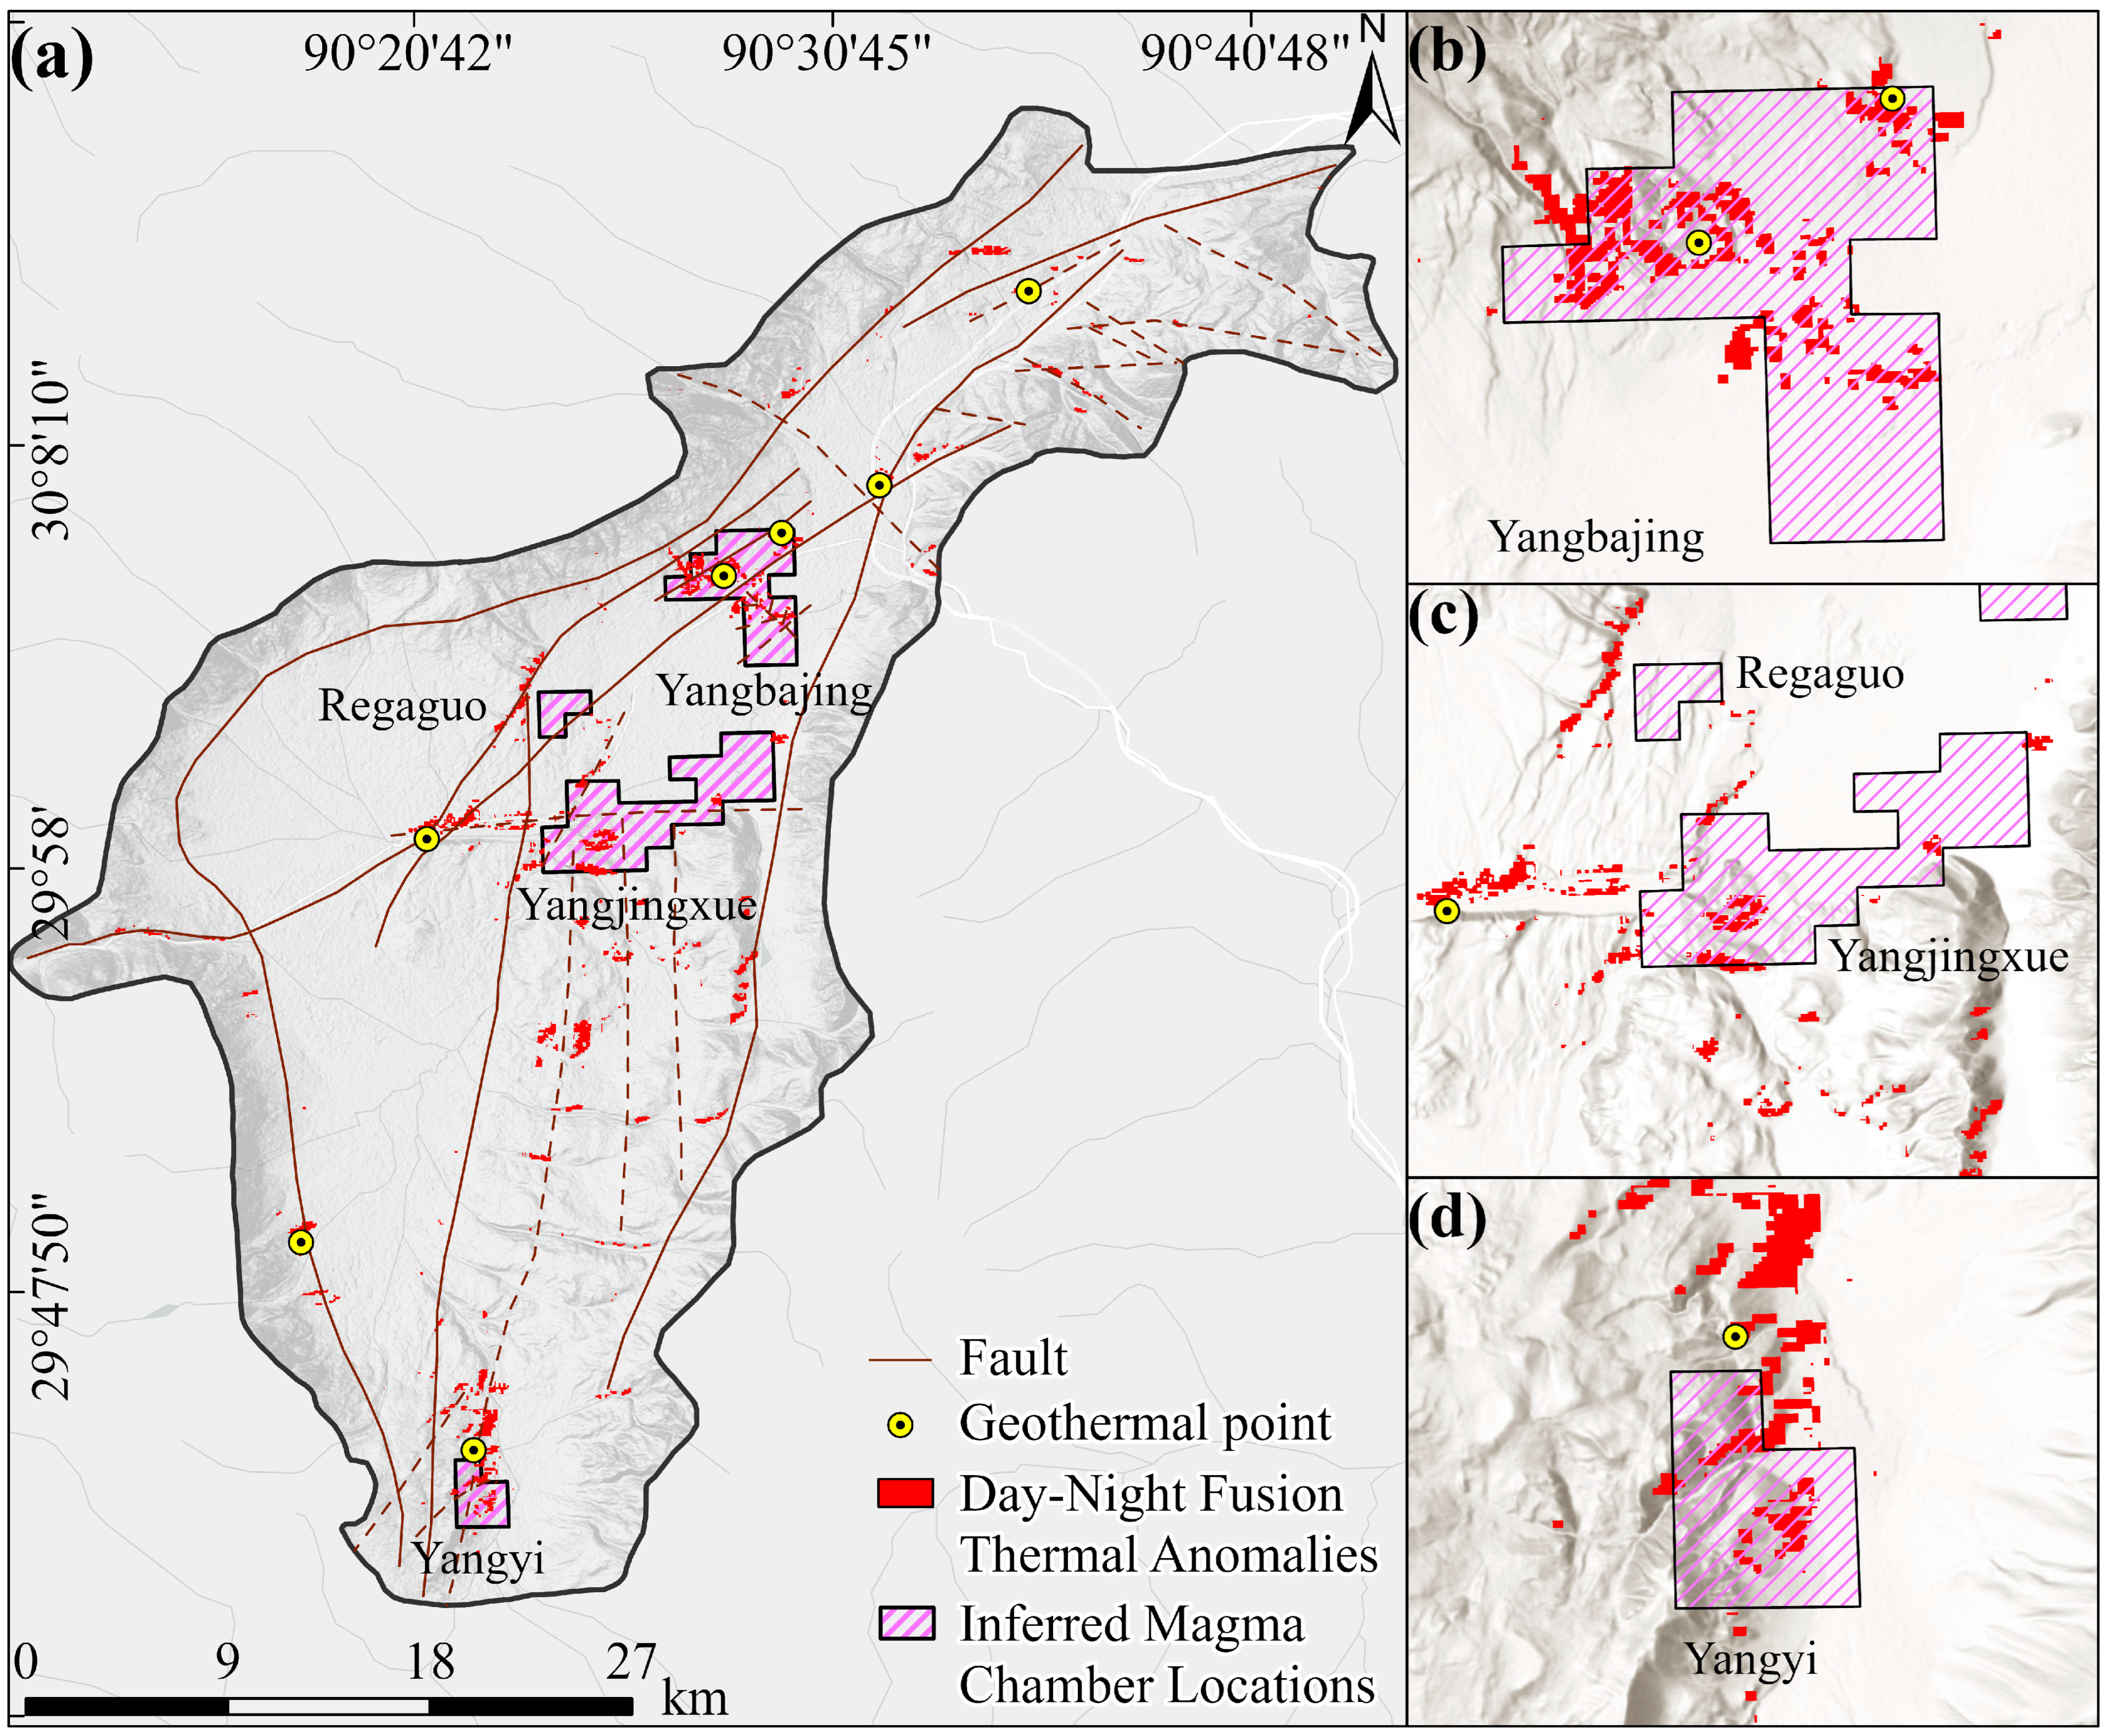
The geothermal anomaly areas identified through day–night joint analysis exhibit high spatial consistency with potential magma heat sources derived from MODIS, particularly in known geothermal fields, like Yangbajing and Yangyi (Figure 13a). These high LST areas are strongly correlated with known hotspot locations, especially concentrated in the central and southern parts of the basin, suggesting proximity to subsurface heat sources and showcasing significant geothermal exploration potential (Figure 13b–d). This consistency further reinforces the intrinsic link between geothermal anomalies and deep heat sources, while also highlighting the effectiveness of thermal infrared remote sensing data in capturing geothermal activity features [70].
However, some geothermal anomaly areas exhibit a spatial offset relative to deep heat source locations, likely due to differences in data types, processing methods, and research objectives [55]. Day–night joint analysis covers a wider area, emphasizing the overall distribution of surface temperature anomalies, whereas MODIS data focuses on the core areas with the highest temperatures, highlighting significant thermal anomalies in deep, high-heat zones. Moreover, the surface manifestations of hotspots, such as hot springs, are often offset from the locations of deep heat sources [71]. This may be due to the lateral migration of subsurface thermal fluids, controlled by fracture structures during vertical migration, causing geothermal anomaly areas not to be directly above deep heat sources [69].
The geothermal anomalies in the study area are primarily driven by subsurface geological processes. The subduction of the Indian Plate induces the upwelling of high-temperature materials from the asthenosphere along major deep fault zones, causing partial melting of the lower crust and generating strong heat flow [72,73,74]. Under compressive stress, partially molten magma intrudes into the upper crust, forming magma chambers that serve as the primary heat source for the geothermal system [75]. Fault structures act as pathways for heat flow migration, transmitting deep thermal energy to the surface, causing land surface temperature increases, which manifest as significant geothermal anomalies in thermal infrared remote sensing [76]. This mechanism further underscores the crucial application of LST remote sensing data in geothermal activity detection.

5.4. Limitations and Future Improvements

While this study successfully applies thermal infrared (TIR) remote sensing for geothermal anomaly detection, recognizing its limitations and identifying areas for future improvement are essential to enhance accuracy and reliability.
1. Limitations of Remote Sensing (RS) Data and the Need for Multi-Source Integration: RS data alone cannot fully capture the complexity of geothermal systems. Although TIR remote sensing effectively detects surface temperature anomalies, it cannot directly reveal subsurface features, such as fluid pathways, heat sources, or geological structures. Therefore, integrating remote sensing results with in situ validation methods—such as geophysical surveys, geochemical sampling, and borehole data—is crucial for improving interpretation accuracy and confirming geothermal targets [77,78,79].
2. Potential Benefits of Multiband Data: While TIR remote sensing is widely used in geothermal anomaly detection, its dependence on thermal infrared bands may lead to omission of key spectral indicators. For instance, incorporating shortwave infrared (SWIR) bands can enhance the identification of hydrothermal alteration minerals, such as alunite, kaolinite, and muscovite, which are closely associated with geothermal activity. Combining TIR and SWIR data can improve mineralogical interpretation and more effectively delineate geothermal anomaly zones [27,80,81,82,83,84,85,86].
3. Impact of Surface Thermal Property Differences: Variations in the thermal properties of different land-cover types can significantly affect heat retention, conductivity, and surface temperature patterns. These differences may lead to spatial inconsistencies in LST data. Future research should incorporate high-resolution land-cover data or apply advanced classification techniques to address these differences and improve anomaly detection accuracy [20].
4. Influence of Topographic Effects on LST Variations: Despite the use of winter data to minimize solar radiation interference, slope and aspect effects on LST in mountainous terrain remain a significant challenge. South-facing slopes typically receive more solar radiation and exhibit higher temperatures, while north-facing slopes remain cooler. Although elevation correction in this study partially mitigated these effects, developing more refined slope correction models is essential for improving temperature normalization and enhancing detection accuracy in rugged terrain [87,88].
5. Impact of Human Activities and Mitigation Strategies: Although anthropogenic heat islands have limited impact in this study area due to low population density, urban environments may exhibit elevated temperatures that obscure geothermal signals. Future studies could incorporate auxiliary datasets, such as nighttime light data, to identify and mask anthropogenic heat sources, thereby improving the precision of geothermal anomaly detection in densely populated regions.
Addressing these limitations through improved data integration, advanced spectral analysis, refined terrain correction, and mitigation of anthropogenic effects will substantially enhance the accuracy and reliability of TIR remote sensing in geothermal exploration.

6. Conclusions

This study employed Landsat 8 and ASTER LST data, integrating multi-temporal and multi-perspective surface temperature analysis methods. By incorporating D–S evidence theory and a combined daytime–nighttime analysis strategy, it effectively identified geothermal anomalies in the Yangbajing–Yangyi Basin under complex terrain conditions.
During daytime data processing, long-term winter Landsat 8 imagery was processed using the GEE platform. Key preprocessing steps, including water body removal and elevation correction, significantly reduced non-geothermal interference. The local block threshold method further enhanced the accuracy of small-scale anomaly detection, successfully identifying daytime geothermal anomaly zones.
During nighttime data processing, single-scene ASTER LST images were used to independently extract anomaly information from four perspectives: global, local, elevation-based, and fault buffer zones. The D–S evidence theory was subsequently applied to integrate the results from each perspective, further enhancing the accuracy of nighttime anomaly detection.
Building on this, the combined analysis of daytime and nighttime LST data successfully identified theoretically reliable geothermal anomaly zones. The results show that high-temperature regions identified in both datasets significantly reduced misidentifications caused by thermal differences between bare land and water bodies, thereby improving the reliability of geothermal anomaly detection. The jointly extracted anomaly zones closely matched known geothermal fields in Yangbajing and Yangyi, as well as several documented hot spring sites. Furthermore, the method successfully predicted potential geothermal anomaly zones, providing valuable guidance for future geothermal resource exploration.
Additionally, long-term time-series analysis of MODIS nighttime LST data identified four major geothermal anomaly zones: the Yangbajing, Yangjingxue, Regaguo, and Yangyi geothermal fields. The results suggest that these zones are closely associated with suspected subsurface magma chamber activity. Their spatial distribution further supports the reliability of geothermal anomaly detection using daytime and nighttime LST data and reveals the spatial configuration of the subsurface thermal system in the study area.
In conclusion, the findings suggest that geothermal anomalies in the study area are primarily driven by deep magma activity, with fault structures acting as key conduits for heat transfer. The multi-source data fusion method proposed in this study effectively captured geothermal activity characteristics and provided valuable insights for geothermal resource exploration and potential heat source identification. Future research will combine higher-resolution remote sensing data and geophysical exploration methods to further enhance geothermal anomaly identification accuracy and reveal the evolutionary characteristics of deep magma heat sources.

Author Contributions

Conceptualization, C.L.; methodology, C.L. and N.G.; formal analysis, C.L.; data curation, C.L.; writing—original draft preparation, C.L.; writing—review and editing, C.L., N.G., Y.L., H.L., Y.Z., S.D. and X.L.; visualization, C.L.; supervision, N.G.; funding acquisition, N.G. and Y.L. All authors have read and agreed to the published version of the manuscript.

Funding

This research was funded by the Science and Technology Department of Tibet Autonomous Region, grant number XZ202201ZD0004G. The APC was funded by XZ202201ZD0004G.

Institutional Review Board Statement

Not applicable.

Informed Consent Statement

Not applicable.

Data Availability Statement

The raw data supporting the conclusions of this article will be made available by the authors on request.

Acknowledgments

We sincerely acknowledge the administrative and technical support provided by the research team. The Landsat-8 Collection 2 Surface Temperature Product was generously provided by the U.S. Geological Survey, and we greatly appreciate the accessibility of MODIS NLST (MOD11A1 V061) and ASTER LST (AST_08 V003) data products from NASA’s LP DAAC. These data were essential for the successful implementation and validation of this study. We would also like to express our heartfelt gratitude to the reviewers for their insightful comments and constructive suggestions, which have significantly improved the quality and clarity of this manuscript.

Conflicts of Interest

The authors declare no conflicts of interest.

References

  1. Wang, G.; Lu, C. Progress of geothermal resources exploitation and utilization technology driven by carbon neutralization target. Geol. Resour. 2022, 31, 412. [Google Scholar]
  2. Huan, W.; Bing, M.; Lingxiao, J.; Yang, Y.; Jiaxiu, H.; Wei, W. The Role, Supply and Demand of Critical Minerals in the Clean Energy Transition under Carbon Neutrality Targets and Their Recommendations. Geol. China 2021, 48, 1720–1733. [Google Scholar]
  3. Li, J.; Gallego-Schmid, A.; Stamford, L. Integrated Sustainability Assessment of Repurposing Onshore Abandoned Wells for Geothermal Power Generation. Appl. Energy 2024, 359, 122670. [Google Scholar] [CrossRef]
  4. Tannock, L.; Wang, Y.; Li, J.F.; Liu, J.; Zhang, K.; Xu, L.; Regenauer-Lieb, K. A Preliminary Study on the Mechanics and Tectonic Relationship to the Geothermal Field of the Heyuan Fault Zone in Guangdong Province. J. Geomech. 2019, 25, 400–411. [Google Scholar]
  5. Zhao, P.; Dor, J.; Xie, E.J.; Jin, J. Strontium Isotope Data for Thermal Waters in Selected High-Temperature Geothermal Fields, China. Acta Petrol. Sin. 2003, 19, 569–576. [Google Scholar]
  6. Duo, J. The Basic Characteristics of the Yangbajing Geothermal Field—A Typical High Temperature Geothermal System. Eng. Sci. 2003, 5, 42–47. [Google Scholar]
  7. Chen, W.; Xue, G.; Zhao, P.; Ren, W.; He, Y.; Lü, P.; Lei, K.; Zhao, Y. SOTEM Exploration and Reservoir Structure Analysis of Yangbajain Geothermal Field, Xizang. Chin. J. Geophys. 2023, 66, 4805–4816. [Google Scholar]
  8. Yan, J. Study on the Resistivity Structure and Geothermal Genesis Mechanism of Gudui Geothermal Field in Tibet, China. Geothermics 2024, 119, 102929. [Google Scholar] [CrossRef]
  9. Maryadi, M.; Sari, E.K.; Zarkasyi, A.; Mizunaga, H. Three-Dimensional Magnetotelluric and Gravimetric Imaging of Mount Lawu Geothermal Prospect Area, Indonesia. Geothermics 2024, 118, 102917. [Google Scholar] [CrossRef]
  10. Lei, H.W.; Bai, B.; Cui, Y.X.; Xie, Y.C.; Li, J.; Hou, X.W. Quantitative Assessment of Calcite Scaling of a High Temperature Geothermal Production Well: Hydrogeochemistry—Application to the Yangbajing Geothermal Fields, Tibet. Earth Sci. 2023, 48, 935–945. [Google Scholar]
  11. Ayari, J.; Barbieri, M.; Boschetti, T.; Barhoumi, A.; Sellami, A.; Braham, A.; Manai, F.; Dhaha, F.; Charef, A. Major- and Trace-Element Geochemistry of Geothermal Water from the Nappe Zone, Northern Tunisia: Implications for Mineral Prospecting and Health Risk Assessment. Environments 2023, 10, 151. [Google Scholar] [CrossRef]
  12. Shang, J.; Liu, M.; Cao, Y.; Shi, H.; Wei, X. Trace Element Geochemistry of High-Temperature Geothermal Waters in the Yunnan-Tibet Geothermal Province, Southwest China. Appl. Geochem. 2024, 162, 105910. [Google Scholar] [CrossRef]
  13. Bozkaya, Ö.; Bozkaya, G.; Akın, T.; Atan, H. Mineralogical and Geochemical Characteristics of Alteration Minerals Related to Fossil Geothermal Activities in the Kızıldere Geothermal Field, Western Turkey. Geochemistry 2024, 84, 126082. [Google Scholar] [CrossRef]
  14. Mahboob, M.A.; Genc, B.; Celik, T.; Ali, S.; Atif, I. Mapping Hydrothermal Minerals Using Remotely Sensed Reflectance Spectroscopy Data from Landsat. J. S. Afr. I Min. Metall. 2019, 119, 279–289. [Google Scholar] [CrossRef]
  15. Chen, Z.; Dong, Q.; Chen, J.; Zhao, W.; Jiang, L.; Zhang, G.; Feng, T.; Wang, D.; Bi, X.; Bian, M. Research on Quantitative Prediction and Evaluation of Geothermal Anomaly Area in Qamdo-Nyingchi Section of Sichuan-Tibet Railway. Remote Sens. Technol. Appl. 2021, 36, 1368–1378. [Google Scholar]
  16. Jiangqin, C.; Zhao, Z.; Lai, Z.; Xu, S.; Liu, J.; Li, Z.; Zhang, X.; Chen, Q.; Yang, H.; Zhao, X. Detecting Geothermal Anomalies Using Landsat 8 Thermal Infrared Remote Sensing Data in the Ruili Basin, Southwest China. Environ. Sci. Pollut. Res. 2022, 30, 32065–32082. [Google Scholar] [CrossRef]
  17. Wang, K.; Jiang, Q.; Yu, D.; Yang, Q.; Wang, L.; Han, T.; Xu, X. Detecting Daytime and Nighttime Land Surface Temperature Anomalies Using Thermal Infrared Remote Sensing in Dandong Geothermal Prospect. Int. J. Appl. Earth Obs. 2019, 80, 196–205. [Google Scholar] [CrossRef]
  18. He, J.; Zheng, B.; Li, W.; Yang, L.; Sun, H. Land Surface Temperature Retrieval of the Geothermal Area in Eastern Liaoning, China, Based on Thermal Infrared Remotely Sensed Data of MODIS. J. Indian Soc. Remote Sens. 2018, 46, 1023–1034. [Google Scholar] [CrossRef]
  19. Chao, J.; Zhao, Z.; Xu, S.; Lai, Z.; Liu, J.; Zhao, F.; Yang, H.; Chen, Q. Geothermal Target Detection Integrating Multi-Source and Multi-Temporal Thermal Infrared Data. Ore Geol. Rev. 2024, 167, 105991. [Google Scholar] [CrossRef]
  20. Zhao, F.; Peng, Z.; Qian, J.; Chu, C.; Zhao, Z.; Chao, J.; Xu, S. Detection of Geothermal Potential Based on Land Surface Temperature Derived from Remotely Sensed and In-Situ Data. Geo-Spat. Inf. Sci. 2023, 27, 1237–1253. [Google Scholar] [CrossRef]
  21. Dong, B.; Dong, S.; Wang, Y.; Wen, F.; Yu, C.; Zhou, J.; Song, R. Detecting Geothermal Resources in a Plateau Area: Constraints From Land Surface Temperature Characteristics Using Landsat 8 Data. Front. Earth Sci.-Switz. 2022, 10, 785900. [Google Scholar] [CrossRef]
  22. Liu, S.; Ye, C.; Sun, Q.; Xu, M.; Duan, Z.; Sheng, H.; Wan, J. Detection of Geothermal Anomaly Areas With Spatio-Temporal Analysis Using Multitemporal Remote Sensing Data. IEEE J. Sel. Top. Appl. Earth Obs. Remote Sens. 2021, 14, 4866–4878. [Google Scholar] [CrossRef]
  23. Darge, Y.M.; Hailu, B.T.; Muluneh, A.; Kidane, T. Detection of Geothermal Anomalies Using Landsat 8 TIRS Data in Tulu Moye Geothermal Prospect, Main Ethiopian Rift. Int. J. Appl. Earth Obs. Geoinf. 2019, 74, 16–26. [Google Scholar] [CrossRef]
  24. Romaguera, M.; Vaughan, R.G.; Ettema, J.; Izquierdo-Verdiguier, E.; Hecker, C.A.; van der Meer, F.D. Detecting Geothermal Anomalies and Evaluating LST Geothermal Component by Combining Thermal Remote Sensing Time Series and Land Surface Model Data. Remote Sens. Environ. 2018, 204, 534–552. [Google Scholar] [CrossRef]
  25. Gemitzi, A.; Dalampakis, P.; Falalakis, G. Detecting Geothermal Anomalies Using Landsat 8 Thermal Infrared Remotely Sensed Data. Int. J. Appl. Earth Obs. 2021, 96, 102283. [Google Scholar] [CrossRef]
  26. Nugroho, U.C.; Domiri, D.D. Identification of land surface temperature distribution of geothermal area in ungaran mount by using landsat 8 imagery. Int. J. Remote Sens. Earth Sci. 2017, 12, 143. [Google Scholar] [CrossRef]
  27. Mahwa, J.; Li, D.; Ping, J.; Leng, W.; Tang, J.; Shao, D. Mapping the Spatial Distribution of Fossil Geothermal Manifestations and Assessment of Geothermal Potential of the Tangyin Rift, Southeast of Taihang Mountain in China. J. Mt. Sci.-Engl. 2022, 19, 2241–2259. [Google Scholar] [CrossRef]
  28. Arrofi, D.; Abu-Mahfouz, I.S. Delineating Reservoir Area Using Geologic Remote Sensing Analysis, Jizan (Saudi Arabia): Implications for Geothermal Exploration. Geoenergy Sci. Eng. 2023, 228, 212033. [Google Scholar] [CrossRef]
  29. Li, X.; Jiang, G.; Tang, X.; Zuo, Y.; Hu, S.; Zhang, C.; Wang, Y.; Wang, Y.; Zheng, L. Detecting Geothermal Anomalies Using Multi-Temporal Thermal Infrared Remote Sensing Data in the Damxung–Yangbajain Basin, Qinghai–Tibet Plateau. Remote Sens. 2023, 15, 4473. [Google Scholar] [CrossRef]
  30. Ming, H.; Wang, Q.; Yanyan, G.; Hua, Z.; Peng, H. Geothermal Anomaly Detection Based on Evidence Theory Integrating Multi-View Remote Sensing Information. Earth Sci. 2024, 49, 347–358. [Google Scholar] [CrossRef]
  31. Mia, M.B.; Fujimitsu, Y.; Nishijima, J. Monitoring of Thermal Activity at the Hatchobaru–Otake Geothermal Area in Japan Using Multi-Source Satellite Images—With Comparisons of Methods, and Solar and Seasonal Effects. Remote Sens. 2018, 10, 1430. [Google Scholar] [CrossRef]
  32. Coolbaugh, M.F.; Kratt, C.; Fallacaro, A.; Calvin, W.M.; Taranik, J.V. Detection of Geothermal Anomalies Using Advanced Spaceborne Thermal Emission and Reflection Radiometer (ASTER) Thermal Infrared Images at Bradys Hot Springs, Nevada, USA. Remote Sens. Environ. 2007, 106, 350–359. [Google Scholar] [CrossRef]
  33. Sekertekin, A.; Arslan, N. Monitoring Thermal Anomaly and Radiative Heat Flux Using Thermal Infrared Satellite Imagery—A Case Study at Tuzla Geothermal Region. Geothermics 2019, 78, 243–254. [Google Scholar] [CrossRef]
  34. Wang, L.; Lu, Y.; Yao, Y. Comparison of Three Algorithms for the Retrieval of Land Surface Temperature from Landsat 8 Images. Sensors 2019, 19, 5049. [Google Scholar] [CrossRef]
  35. Changjun, W.; Xiaodan, W.; Xingwen, L. Impact of Spatial and Temporal Scales of Remote Sensing Data on the Spatiotemporal Change in Geographic Elements. J. Remote Sens. 2019, 23, 1064–1077. [Google Scholar]
  36. Gorelick, N.; Hancher, M.; Dixon, M.; Ilyushchenko, S.; Thau, D.; Moore, R. Google Earth Engine: Planetary-Scale Geospatial Analysis for Everyone. Remote Sens. Environ. 2017, 202, 18–27. [Google Scholar] [CrossRef]
  37. Ermida, S.L.; Soares, P.; Mantas, V.; Göttsche, F.-M.; Trigo, I.F. Google Earth Engine Open-Source Code for Land Surface Temperature Estimation from the Landsat Series. Remote Sens. 2020, 12, 1471. [Google Scholar] [CrossRef]
  38. Xiaona, W.; Jinyan, T.; Xiaojuan, L.; Le, W.; Huili, G.; Beibei, C.; Xiangcai, L.I.; Jinghan, G.U.O. Benefits of Google Earth Engine in Remote Sensing. Natl. Remote Sens. Bull. 2022, 26, 299–309. [Google Scholar] [CrossRef]
  39. Dempster, A.P. Upper and Lower Probabilities Induced by a Multivalued Mapping. In Classic Works of the Dempster-Shafer Theory of Belief Functions; Yager, R.R., Liu, L., Eds.; Studies in Fuzziness and Soft Computing; Springer: Berlin/Heidelberg, Germany, 2008; Volume 219, pp. 57–72. ISBN 978-3-540-25381-5. [Google Scholar]
  40. Yang, Q.; Kuide, X. A brief introduction to the geothermal system of the yangbajain geothermal field. Geol. Rev. 1991, 37, 283–287. [Google Scholar] [CrossRef]
  41. Zhong-hai, W.U.; Xi-tao, Z.; Zhen-han, W.U.; Wan, J.; Dao-gong, H.U. Quaternary Geology and Faulting in the Damxung-Yangbajain Basin, Southern Tibet. J. Geomech. 2006, 12, 305–316. [Google Scholar]
  42. Qin, W. New achievements of geophysical exploration in the yangbajing geothermal field of tibet. Geophys. Geochem. Explor. 1996, 131–140. [Google Scholar]
  43. Xue, G.; Chen, W.; Zhao, P.; Ren, W.; He, Y.; Lv, P.; Lei, K.; Zhao, Y. Three-Dimensional Electrical Structure Model of the Yangbajain Geothermal Field in Tibet: Evidence Obtained from Magnetotelluric Data. Sci. China Earth Sci. 2023, 66, 1839–1852. [Google Scholar] [CrossRef]
  44. Kang, W.; Li, D.; Bai, J. Characteristics of the Structural Control and the Localization and Migration of Thermal Water of the Yangbajing Geothermal Field, Xizang (Tibet). Bull. Inst. Geomech. Chin. Acad. Geol. Sci. 1981, 1, 110–122. [Google Scholar]
  45. Klemperer, S.L.; Zhao, P.; Whyte, C.J.; Darrah, T.H.; Crossey, L.J.; Karlstrom, K.E.; Liu, T.; Winn, C.; Hilton, D.R.; Ding, L. Limited Underthrusting of India below Tibet: 3He/4He Analysis of Thermal Springs Locates the Mantle Suture in Continental Collision. Proc. Natl. Acad. Sci. USA 2022, 119, e2113877119. [Google Scholar] [CrossRef]
  46. Wu, Z.; Chunjing, Z. Explanation of Distribution Map of Active Faults in China and Its Adjacent Sea Area (1∶5,000,000) (Chinese and English Version with Enclose Map); Atlas Sets of Geological Environment of China; Aibing, H., Ruimin, L., Eds.; Geological Publishing House: Beijing, China, 2018. [Google Scholar]
  47. Dorji; Qingyuan, T.; Ping, Z. Study Report on the Formation Mechanism of Deep High-Temperature Geothermal Reservoir in Yangbajing Geothermal Field, Dangxiong County, Tibet; Geothermal Geological Team, Tibet Bureau of Geology and Mineral Resources Science Press: Beijing, China, 1997. [Google Scholar]
  48. Chinese Academy of Sciences, Qinghai-Tibet Plateau Comprehensive Scientific Expedition Team. Tibet Geothermal; Science Press: Beijing, China, 1981. [Google Scholar]
  49. Earth Resources Observation and Science (EROS) Center Landsat 8–9 Operational Land Imager/Thermal Infrared Sensor Level-2, Collection 2 2013. Available online: https://www.usgs.gov/centers/eros/science/usgs-eros-archive-landsat-archives-landsat-8-9-olitirs-collection-2-level-2 (accessed on 26 January 2025).
  50. Vermote, E.; Justice, C.; Claverie, M.; Franch, B. Preliminary Analysis of the Performance of the Landsat 8/OLI Land Surface Reflectance Product. Remote Sens. Environ. 2016, 185, 46–56. [Google Scholar] [CrossRef]
  51. Xiong, Y.; Chen, F.; Huang, S. Application of Remote Sensing Technique to the Identification of Geothermal Anomaly in Tengchong Area, Southwest China. J. Chengdu Univ. Technol. 2016, 43, 109–118. [Google Scholar] [CrossRef]
  52. NASA/METI/AIST/Japan Spacesystems and U.S./Japan ASTER Science Team. ASTER Level 2 Surface Temperature Product [Data set]. NASA EOSDIS Land Processes Distributed Active Archive Center. 2001. Available online: https://lpdaac.usgs.gov/products/ast_08v003/ (accessed on 26 January 2025).
  53. Papadopoulos, S.; Anastassopoulos, V.; Koukiou, G. Pixel-Level Decision Fusion for Land Cover Classification Using PolSAR Data and Local Pattern Differences. Electronics 2024, 13, 3846. [Google Scholar] [CrossRef]
  54. Cai, H.; Guo, H. Research on Fruit Recognition Based on Multi-Classifier DS Evidence Theory Fusion. Chin. J. Agric. Mech. 2019, 42, 184–189. [Google Scholar] [CrossRef]
  55. Hui, L.; SongBai, P.; WeiTao, Q.; MuSen, L.; ZhenSheng, W.; LiQiao, T. The Distribution and Activity of Cenozoic Magma Chamber in Tengchong Volcano Area Deduced from the MODIS Multi-Temporal Monthly Night LST Data. Acta Petrol. Sin. 2011, 27, 2873–2882. [Google Scholar]
  56. Peng, S.; Ding, Y.; Liu, W.; Li, Z. 1 Km Monthly Temperature and Precipitation Dataset for China from 1901 to 2017. Earth Syst. Sci. Data 2019, 11, 1931–1946. [Google Scholar] [CrossRef]
  57. Wan, Z.; Hook, S.; Hulley, G. Terra Land Surface Temperature/Emissivity Daily L3 Global 1km SIN Grid V061 [Data Set]. NASA EOSDIS Land Processes Distributed Active Archive Center. 2021. Available online: https://lpdaac.usgs.gov/products/mod11a1v061/ (accessed on 26 January 2025).
  58. Qiang, X.; WeiQiang, J.; YiMing, Y.; JiaLiang, L. Sources and Enrichment Mechanisms of Rare Metals in Hot Springs in South Tibet: A Case Study of the Yangyi Hot Spring. Acta Petrol. Sin. 2024, 40, 1669–1689. [Google Scholar] [CrossRef]
  59. Dong, R.; Wurm, M.; Taubenböck, H. Seasonal and Diurnal Variation of Land Surface Temperature Distribution and Its Relation to Land Use/Land Cover Patterns. Int. J. Environ. Res. Public Health 2022, 19, 12738. [Google Scholar] [CrossRef] [PubMed]
  60. Li, S.; Xue, L.; Wang, J.; Ren, H.; Yao, X.; Leng, X.; Wu, Z. The Dynamics of Bare Rock Surface Temperature, Air Temperature and Relative Humidity in Karst Rocky Desertification Area. Chin. J. Ecol. 2019, 38, 436. [Google Scholar]
  61. Kang, W. Thermal Infrared Remote Sensing Technology for Geothermal Resources Detection Based on Multi-Source & Multi-Temporal Data in Dandong, Liaoning. Ph.D. Thesis, Jilin University, Changchun, China, 2020. [Google Scholar]
  62. Chen, X.-L. Remote Sensing Image-Based Analysis of the Relationship between Urban Heat Island and Land Use/Cover Changes. Remote Sens. Environ. 2006, 104, 133–146. [Google Scholar] [CrossRef]
  63. Shunyun, C. A Study on the Normal Annual Variation Field of Land Surface Temperature in China. Chin. J. Geophys. 2009, 52, 962–971. [Google Scholar] [CrossRef]
  64. Yi, Z.; Yong, J.; Miyazaki, S. The Present Status of Utilization of Geothermal Energy and Resources Research by the Aid of Japanese Government in Yangbajing Geothermal Field, Tibet, China. In Proceedings of the World Geothermal Congress, Antalya, Turkey, 24–29 April 2005. [Google Scholar]
  65. Brown, L.D.; Zhao, W.; Nelson, K.D.; Hauck, M.; Alsdorf, D.; Ross, A.; Cogan, M.; Clark, M.; Liu, X.; Che, J. Bright Spots, Structure, and Magmatism in Southern Tibet from INDEPTH Seismic Reflection Profiling. Science 1996, 274, 1688–1690. [Google Scholar] [CrossRef]
  66. Kang, W.; Delu, L.; Bai, J. Geothermal geology of the yangbajing geothermal field in Tibet. Bull. Inst. Geomech. Cags 1985, 6, 17–78. [Google Scholar]
  67. Ren, W.; Ren, Z.; Xue, G.; Chen, W.; Zhao, P.; Liu, J. Three-Dimensional Audio Magnetotelluric Imaging of the Yangyi Geothermal Field in Tibet, China. J. Appl. Geophys. 2023, 211, 104966. [Google Scholar] [CrossRef]
  68. Wang, G.; Wei, W.-B.; Jin, S.; Zhang, L.-T.; Dong, H.; Xie, C.-L.; Guo, Z.-Q. A Study on the Electrical Structure of Eastern Gangdese Metallogenic Belt. Chin. J. Geophys. 2017, 60, 2993–3003. [Google Scholar]
  69. Lulu, L. The Study on the Deep Material State of Yangbajing Area in Tibet Based on the Three-Dimensional Electrical Structure Model of Lithosphere. China Univ. Geosci. 2021. [Google Scholar] [CrossRef]
  70. Haselwimmer, C.; Prakash, A. Thermal Infrared Remote Sensing of Geothermal Systems. In Thermal Infrared Remote Sensing; Kuenzer, C., Dech, S., Eds.; Springer: Dordrecht, The Netherlands, 2013; pp. 453–473. ISBN 978-94-007-6638-9. [Google Scholar]
  71. He, Z.; Feng, J.; Zhang, Y.; Li, P. A Tentative Discussion on an Evaluation System of Geothermal Unit Ranking and Classification in China. Earth Sci. Front. 2017, 24, 168–179. [Google Scholar] [CrossRef]
  72. Wu, C.; Tian, X.; Xu, T.; Liang, X.; Chen, Y.; Taylor, M.; Badal, J.; Bai, Z.; Duan, Y.; Yu, G.; et al. Deformation of Crust and Upper Mantle in Central Tibet Caused by the Northward Subduction and Slab Tearing of the Indian Lithosphere: New Evidence Based on Shear Wave Splitting Measurements. Earth Planet. Sci. Lett. 2019, 514, 75–83. [Google Scholar] [CrossRef]
  73. He, X.; Zhao, L.-F.; Xie, X.-B.; Tian, X.; Yao, Z.-X. Weak Crust in Southeast Tibetan Plateau Revealed by Lg-Wave Attenuation Tomography: Implications for Crustal Material Escape. J. Geophys. Res. Solid Earth 2021, 126, e2020JB020748. [Google Scholar] [CrossRef]
  74. Wu, C.; Tian, X.; Xu, T.; Liang, X.; Chen, Y.; Zhu, G.; Badal, J.; Bai, Z.; Yu, G.; Teng, J. Upper-Crustal Anisotropy of the Conjugate Strike-Slip Fault Zone in Central Tibet Analyzed Using Local Earthquakes and Shear-Wave Splitting. Bull. Seismol. Soc. Am. 2019, 109, 1968–1984. [Google Scholar] [CrossRef]
  75. Pan, F.; Zhang, H.; He, X.; Harris, N.; Dai, H.-K.; Xiong, Q.; Luo, B.; Liu, D.; Kusky, T.; Sadiq, I. Lithosphere Tearing and Foundering during Continental Subduction: Insights from Oligocene–Miocene Magmatism in Southern Tibet. Geol. Soc. Am. Bull. 2023, 136, 583–596. [Google Scholar] [CrossRef]
  76. Shan-long, L.U.; Xiao-hua, S.; Le-jun, Z.O.U. Subsection Mean Method for Relation Analysis of the Land Surface Temperature Field and the Fault: A Case Study of the Jiangshan–Shaoxing Fault between Jinhua and Quzhou of Zhejiang Province. Acta Geol. Sin. 2009, 83, 239–246. [Google Scholar]
  77. Chen, H.; Xie, X.; Liu, E.; Zhou, L.; Yan, L. Application of Infrared Remote Sensing and Magnetotelluric Technology in Geothermal Resource Exploration: A Case Study of the Wuerhe Area, Xinjiang. Remote Sens. 2021, 13, 4989. [Google Scholar] [CrossRef]
  78. Abuzied, S.M.; Kaiser, M.F.; Shendi, E.-A.H.; Abdel-Fattah, M.I. Multi-Criteria Decision Support for Geothermal Resources Exploration Based on Remote Sensing, GIS and Geophysical Techniques along the Gulf of Suez Coastal Area, Egypt. Geothermics 2020, 88, 101893. [Google Scholar] [CrossRef]
  79. Zhang, X.; Zhang, Y.; Li, Y.; Huang, Y.; Zhao, J.; Yi, Y.; Li, J.; Zhang, J.; Zhang, D. Geothermal Spatial Potential and Distribution Assessment Using a Hierarchical Structure Model Combining GIS, Remote Sensing, and Geophysical Techniques—A Case Study of Dali’s Eryuan Area. Energies 2023, 16, 6530. [Google Scholar] [CrossRef]
  80. Rodriguez-Gomez, C.; Kereszturi, G.; Reeves, R.; Rae, A.; Pullanagari, R.; Jeyakumar, P.; Procter, J. Lithological Mapping of Waiotapu Geothermal Field (New Zealand) Using Hyperspectral and Thermal Remote Sensing and Ground Exploration Techniques. Geothermics 2021, 96, 102195. [Google Scholar] [CrossRef]
  81. Hewson, R.; Mshiu, E.; Hecker, C.; van der Werff, H.; van Ruitenbeek, F.; Alkema, D.; van der Meer, F. The Application of Day and Night Time ASTER Satellite Imagery for Geothermal and Mineral Mapping in East Africa. Int. J. Appl. Earth Obs. Geoinf. 2020, 85, 101991. [Google Scholar] [CrossRef]
  82. Abubakar, A.J.; Hashim, M.; Pour, A.B. Identification of Hydrothermal Alteration Minerals Associated with Geothermal System Using ASTER and Hyperion Satellite Data: A Case Study from Yankari Park, NE Nigeria. Geocarto Int. 2018, 34, 597–625. [Google Scholar] [CrossRef]
  83. Littlefield, E.F.; Calvin, W.M. Geothermal Exploration Using Imaging Spectrometer Data over Fish Lake Valley, Nevada. Remote Sens. Environ. 2014, 140, 509–518. [Google Scholar] [CrossRef]
  84. Kratt, C.; Calvin, W.M.; Coolbaugh, M.F. Mineral Mapping in the Pyramid Lake Basin: Hydrothermal Alteration, Chemical Precipitates and Geothermal Energy Potential. Remote Sens. Environ. 2010, 114, 2297–2304. [Google Scholar] [CrossRef]
  85. Maswi, M.S.; Mshiu, E.E. Remote Sensing Mapping of Geothermal Systems around Lake Natron in the East Africa Rift System, Northeastern Tanzania. Geothermics 2024, 119, 102930. [Google Scholar] [CrossRef]
  86. Maarifa, E.J.; Kariuki, P.C.; Mshiu, E.E. Mapping of Surface Hydrothermal Mineral Alterations and Geological Structures Related to Geothermal Systems in the Songwe Region, SW Tanzania. Geosystem. Eng. 2024, 27, 45–59. [Google Scholar] [CrossRef]
  87. Zewei, Q.; Xiao, L.; Yazhao, H. Detection of Geothermal Resources in Litang Basin Based on Multi-Temporal Thermal Infrared Remote Sensing. Fault-Block Oil Gas Field 2024, 4, 652–660. [Google Scholar]
  88. Zhou, T.; Wang, Z.; Qin, H.; Zeng, Y. Remote Sensing Extraction of Geothermal Anomaly Based on Terrain Effect Correction. Natl. Remote Sens. Bull. 2020, 24, 265–276. [Google Scholar]
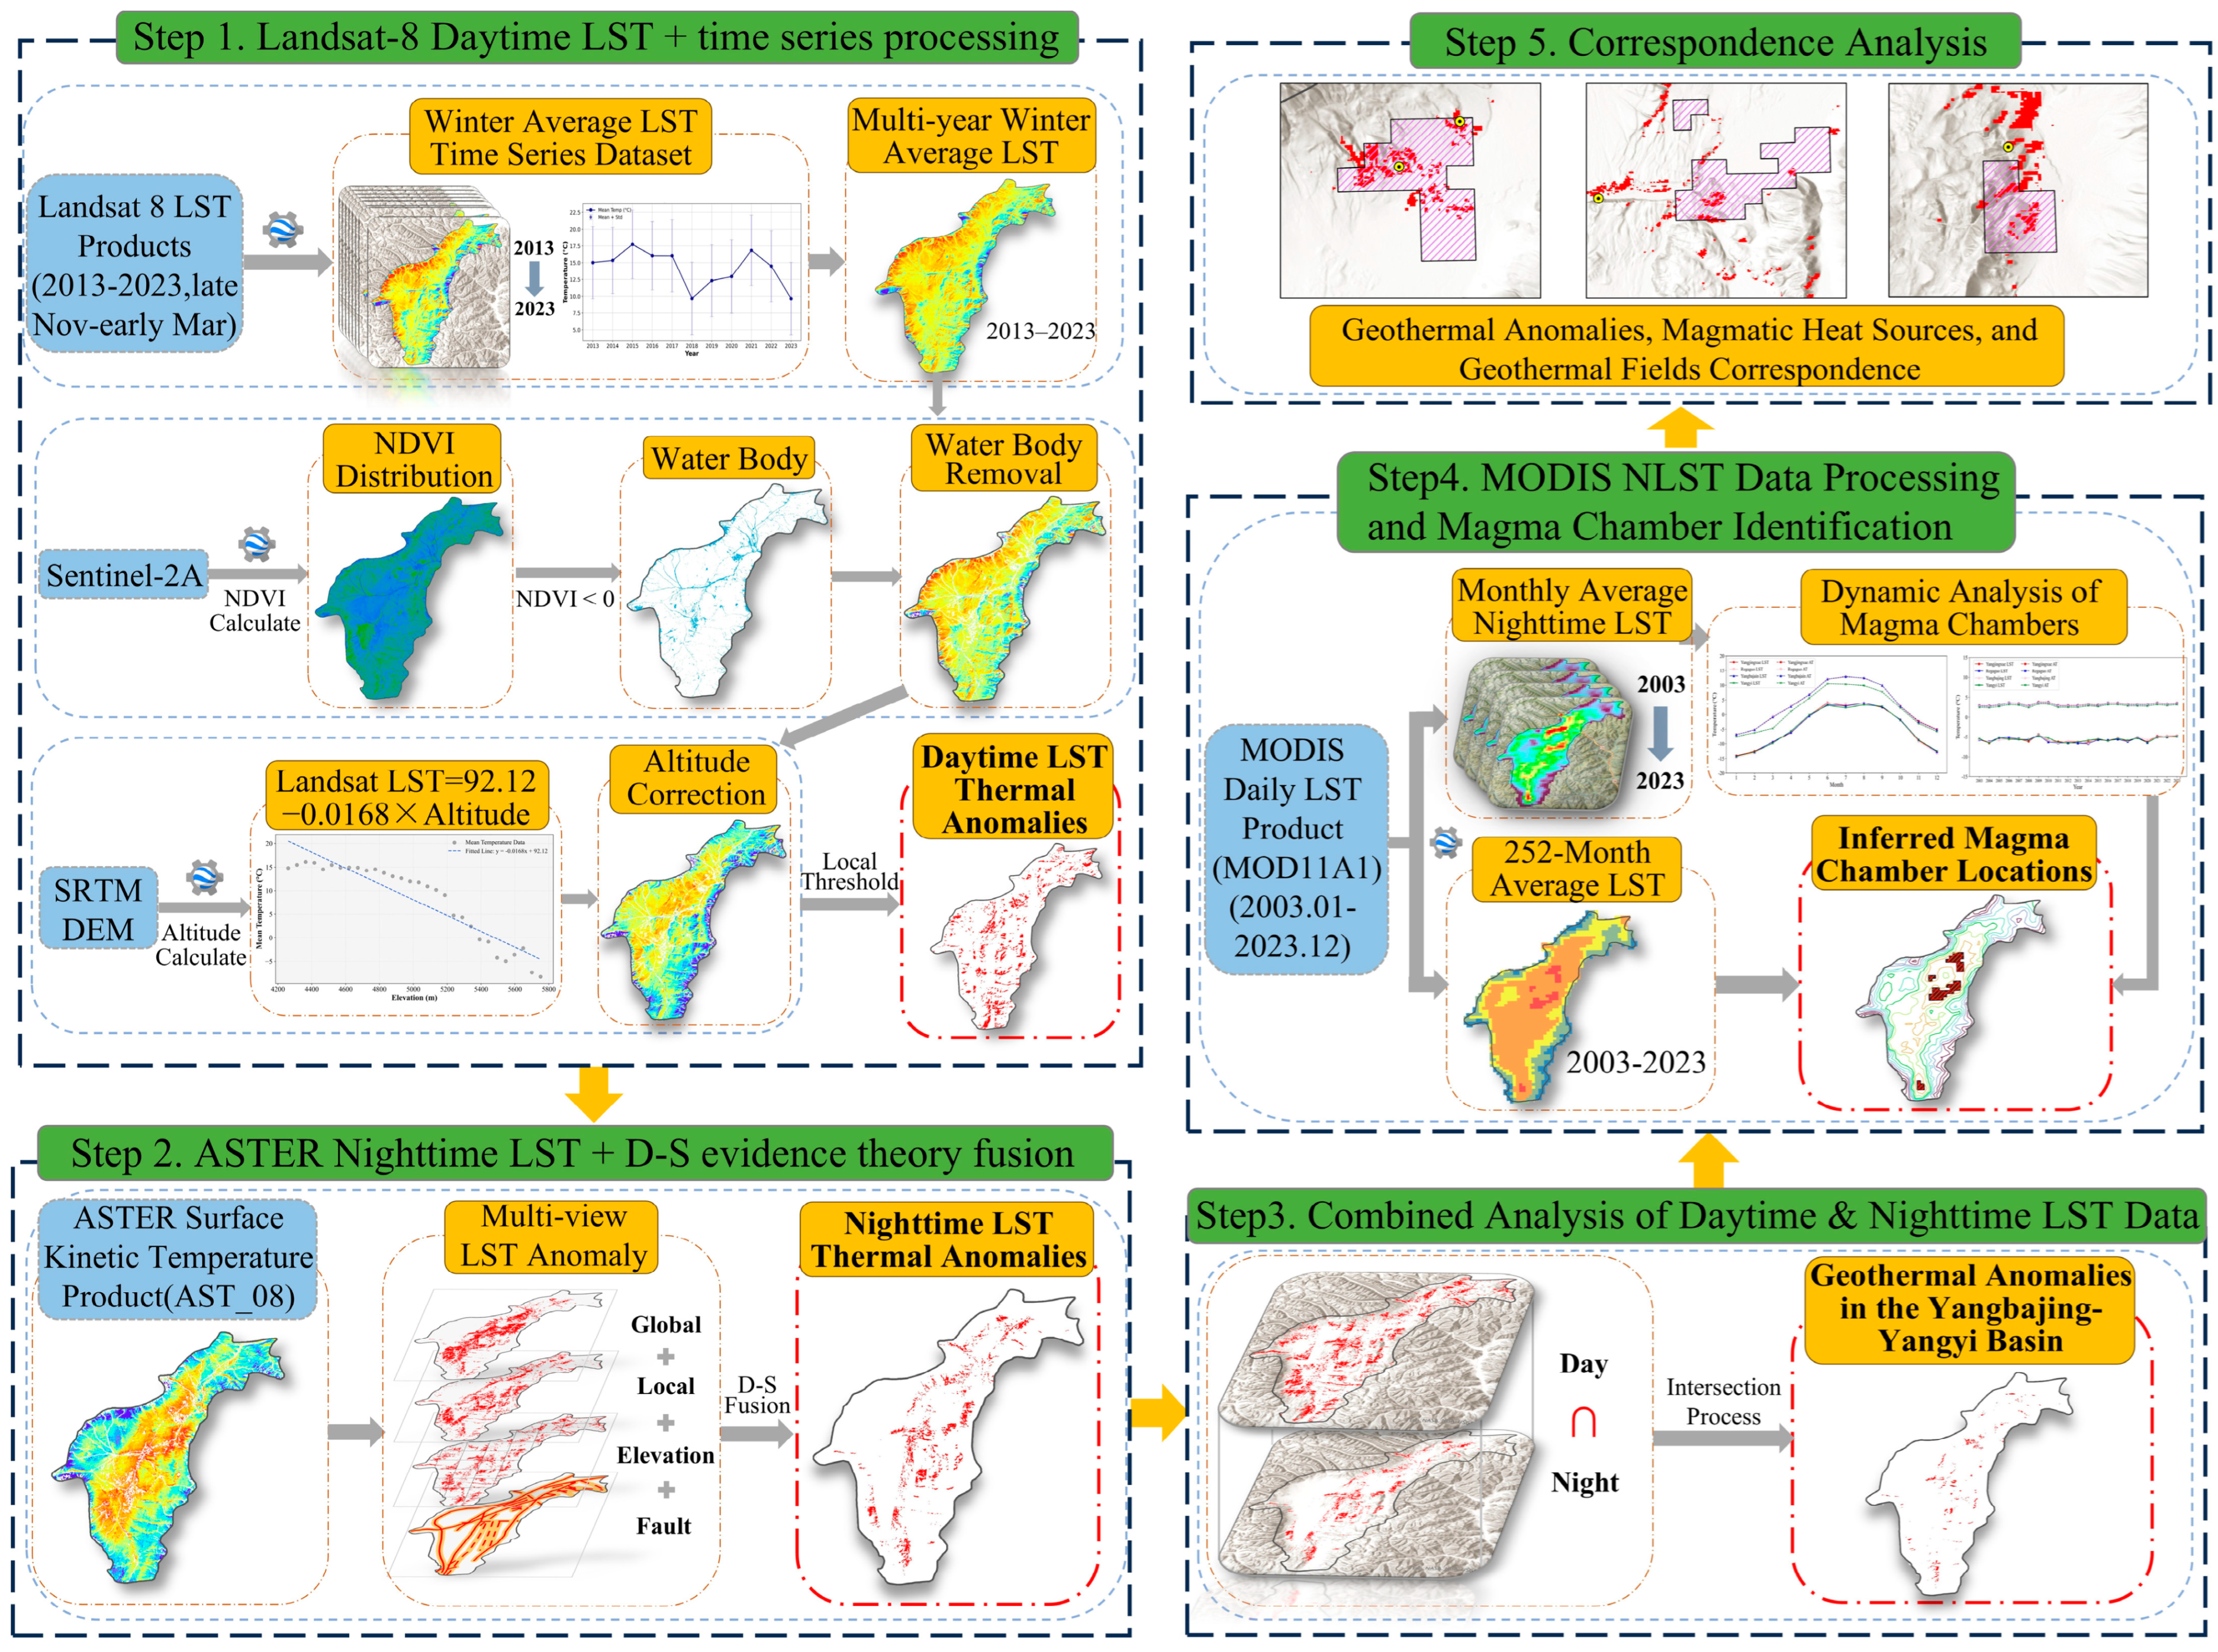
Figure 2. Schematic diagram of the geothermal anomaly detection workflow using multi-source LST data. The workflow involves the following steps: (1) Processing of Landsat-8 daytime LST time series data; (2) Multi-view extraction of ASTER nighttime LST data combined with Dempster–Shafer (D–S) evidence fusion; (3) Integrated analysis of the intersection between daytime and nighttime LST data; (4) MODIS long-term LST data are utilized to infer magmatic activity and heat source distribution; (5) Correlation analysis and result validation using geological information.
Applsci 15 03740 g002
Figure 3. Time series of daytime winter average LST in the Yangbajing–Yangyi Basin from 2013 to 2023, based on Landsat-8 data acquired between November and March. Subfigures (ak) show the average LST for each winter season from 2013 to 2023, while subfigure (l) presents the multi-year average LST across all winters. LST values are represented using a blue-to-red color gradient, where blue indicates lower temperatures and red indicates higher temperatures. Units are in degrees Celsius.
Applsci 15 03740 g003
Figure 4. (a) Relationship between Altitude and Surface Temperature in the Study Area; (b) Changes in Winter Average Surface Temperature and Standard Deviation from 2013 to 2023.
Applsci 15 03740 g004
Figure 5. (a) NDVI distribution map of the study area derived from Sentinel-2A data; (b) Water body distribution map extracted using the condition NDVI < 0.
Applsci 15 03740 g005
Figure 6. (a) Annual Average Winter LST with Water Bodies Removed; (b) Annual Average Winter LST with Water Bodies Removed and Elevation Correction; (c) High-temperature anomaly areas in daytime LST extracted using the local block threshold method.
Applsci 15 03740 g006
Figure 7. (a) Nighttime LST product; (b) Geothermal anomaly results obtained using the global threshold method (A1); (c) Geothermal anomaly results using the local block threshold method (A2); (d) Geothermal anomaly results derived from the elevation partition threshold method (A3); (e) Fault structural buffer zone (A4); (f) Geothermal anomaly results obtained from D–S evidence fusion.
Applsci 15 03740 g007
Figure 8. (a) Geothermal anomaly results obtained through the combined analysis of daytime and nighttime LST data; (b) Boreholes emitting boiling geothermal water. Latitude: 30.06° N, Longitude: 90.48° E; (c) Boiling Spring. Latitude: 30.07°N, Longitude: 90.49°E; (d) Boiling spring, Cited from [58].
Applsci 15 03740 g008
Figure 9. Spatial distribution of monthly mean nighttime land surface temperature (LST) in the Yangbajing–Yangyi Basin from 2003 to 2023, derived from MODIS data. (al) show the average nighttime LST for each month (January to December) across the 21-year period. For example, (a) depicts the mean LST for all Januarys during the study period. LST values are represented using a blue-to-red gradient, where blue indicates lower temperatures and red indicates higher temperatures. Units are in degrees Celsius.
Applsci 15 03740 g009
Figure 10. (a) Mean temperature distribution map generated using density segmentation of MODIS nighttime monthly mean LST data from 2003 to 2023 (21 years, 252 months). Colors range from blue (low) to red (high), representing temperature in degrees Celsius; (b) Isothermal map based on the same dataset, with isotherms shown in a color scale from purple (low) to red (high), indicating a gradual temperature increase. The high-temperature zones in (a) are interpreted as potential deep magma chamber regions.
Applsci 15 03740 g010
Figure 11. Monthly Variations in Multi-Year Average Land Surface Temperature at the Inferred Heat Source Locations.
Applsci 15 03740 g011
Figure 12. Interannual Variations in Multi-Year Average Land Surface Temperature at the Inferred Heat Source Locations (2003–2023).
Applsci 15 03740 g012
Figure 13. Spatial Relationship Between Day–Night Combined Geothermal Anomalies and Inferred Magmatic Chamber Locations in the Study Area; (a) Overall distribution in the study area; (b) Yangbajing region; (c) Regaguo and Yangjingxue regions (d) Yangyi region.
Applsci 15 03740 g013
Table 1. Overview of Multi-Source Thermal Infrared Remote Sensing Data.
DatasetResolutionTemporal ScopeData SourceTotal ScenesProcessing StepsResearch Role
Landsat-8 TIRS100 m2013–2023 (Winter: November–March)USGS Landsat Collection 2 Surface Temperature Product1341. Calculate annual winter mean LST and multi-year mean LST (2013–2023) using GEE.
2. Remove water bodies based on NDVI threshold.
3. Perform altitude correction on LST data.
4. Extract thermal anomalies using local threshold segmentation.
Detection of daytime geothermal anomalies through multi-year LST analysis.
ASTER LST90 m3 November 2023, 9 December 2023NASA LP DAAC, ASTER Surface Temperature Product (AST_08 V003)21. Extract thermal anomalies using a multi-view approach (global, local, elevation, and structural thresholds).
2. Integrate multi-view data using D–S evidence theory.
Identification of nighttime geothermal anomalies from multiple perspectives.
MODIS NLST1000 m2003–2023 (21 years, 252 months)NASA LP DAAC, MODIS Land Surface Temperature Daily Product (MOD11A1 V061) 76401. Construct a 252-month long-term LST time series.
2. Calculate the 21-year monthly mean LST.
3. Analyze interannual and monthly LST variation trends (2003–2023).
Analysis of magmatic chamber activity and long-term geothermal dynamic evolution.
Disclaimer/Publisher’s Note: The statements, opinions and data contained in all publications are solely those of the individual author(s) and contributor(s) and not of MDPI and/or the editor(s). MDPI and/or the editor(s) disclaim responsibility for any injury to people or property resulting from any ideas, methods, instructions or products referred to in the content.