Spatiotemporal Variation and Driving Mechanisms of Carbon Budgets in Territorial Space for Typical Lake-Intensive Regions in China: A Case Study of the Dongting Lake Region


Abstract
1. Introduction
2. Materials and Methods
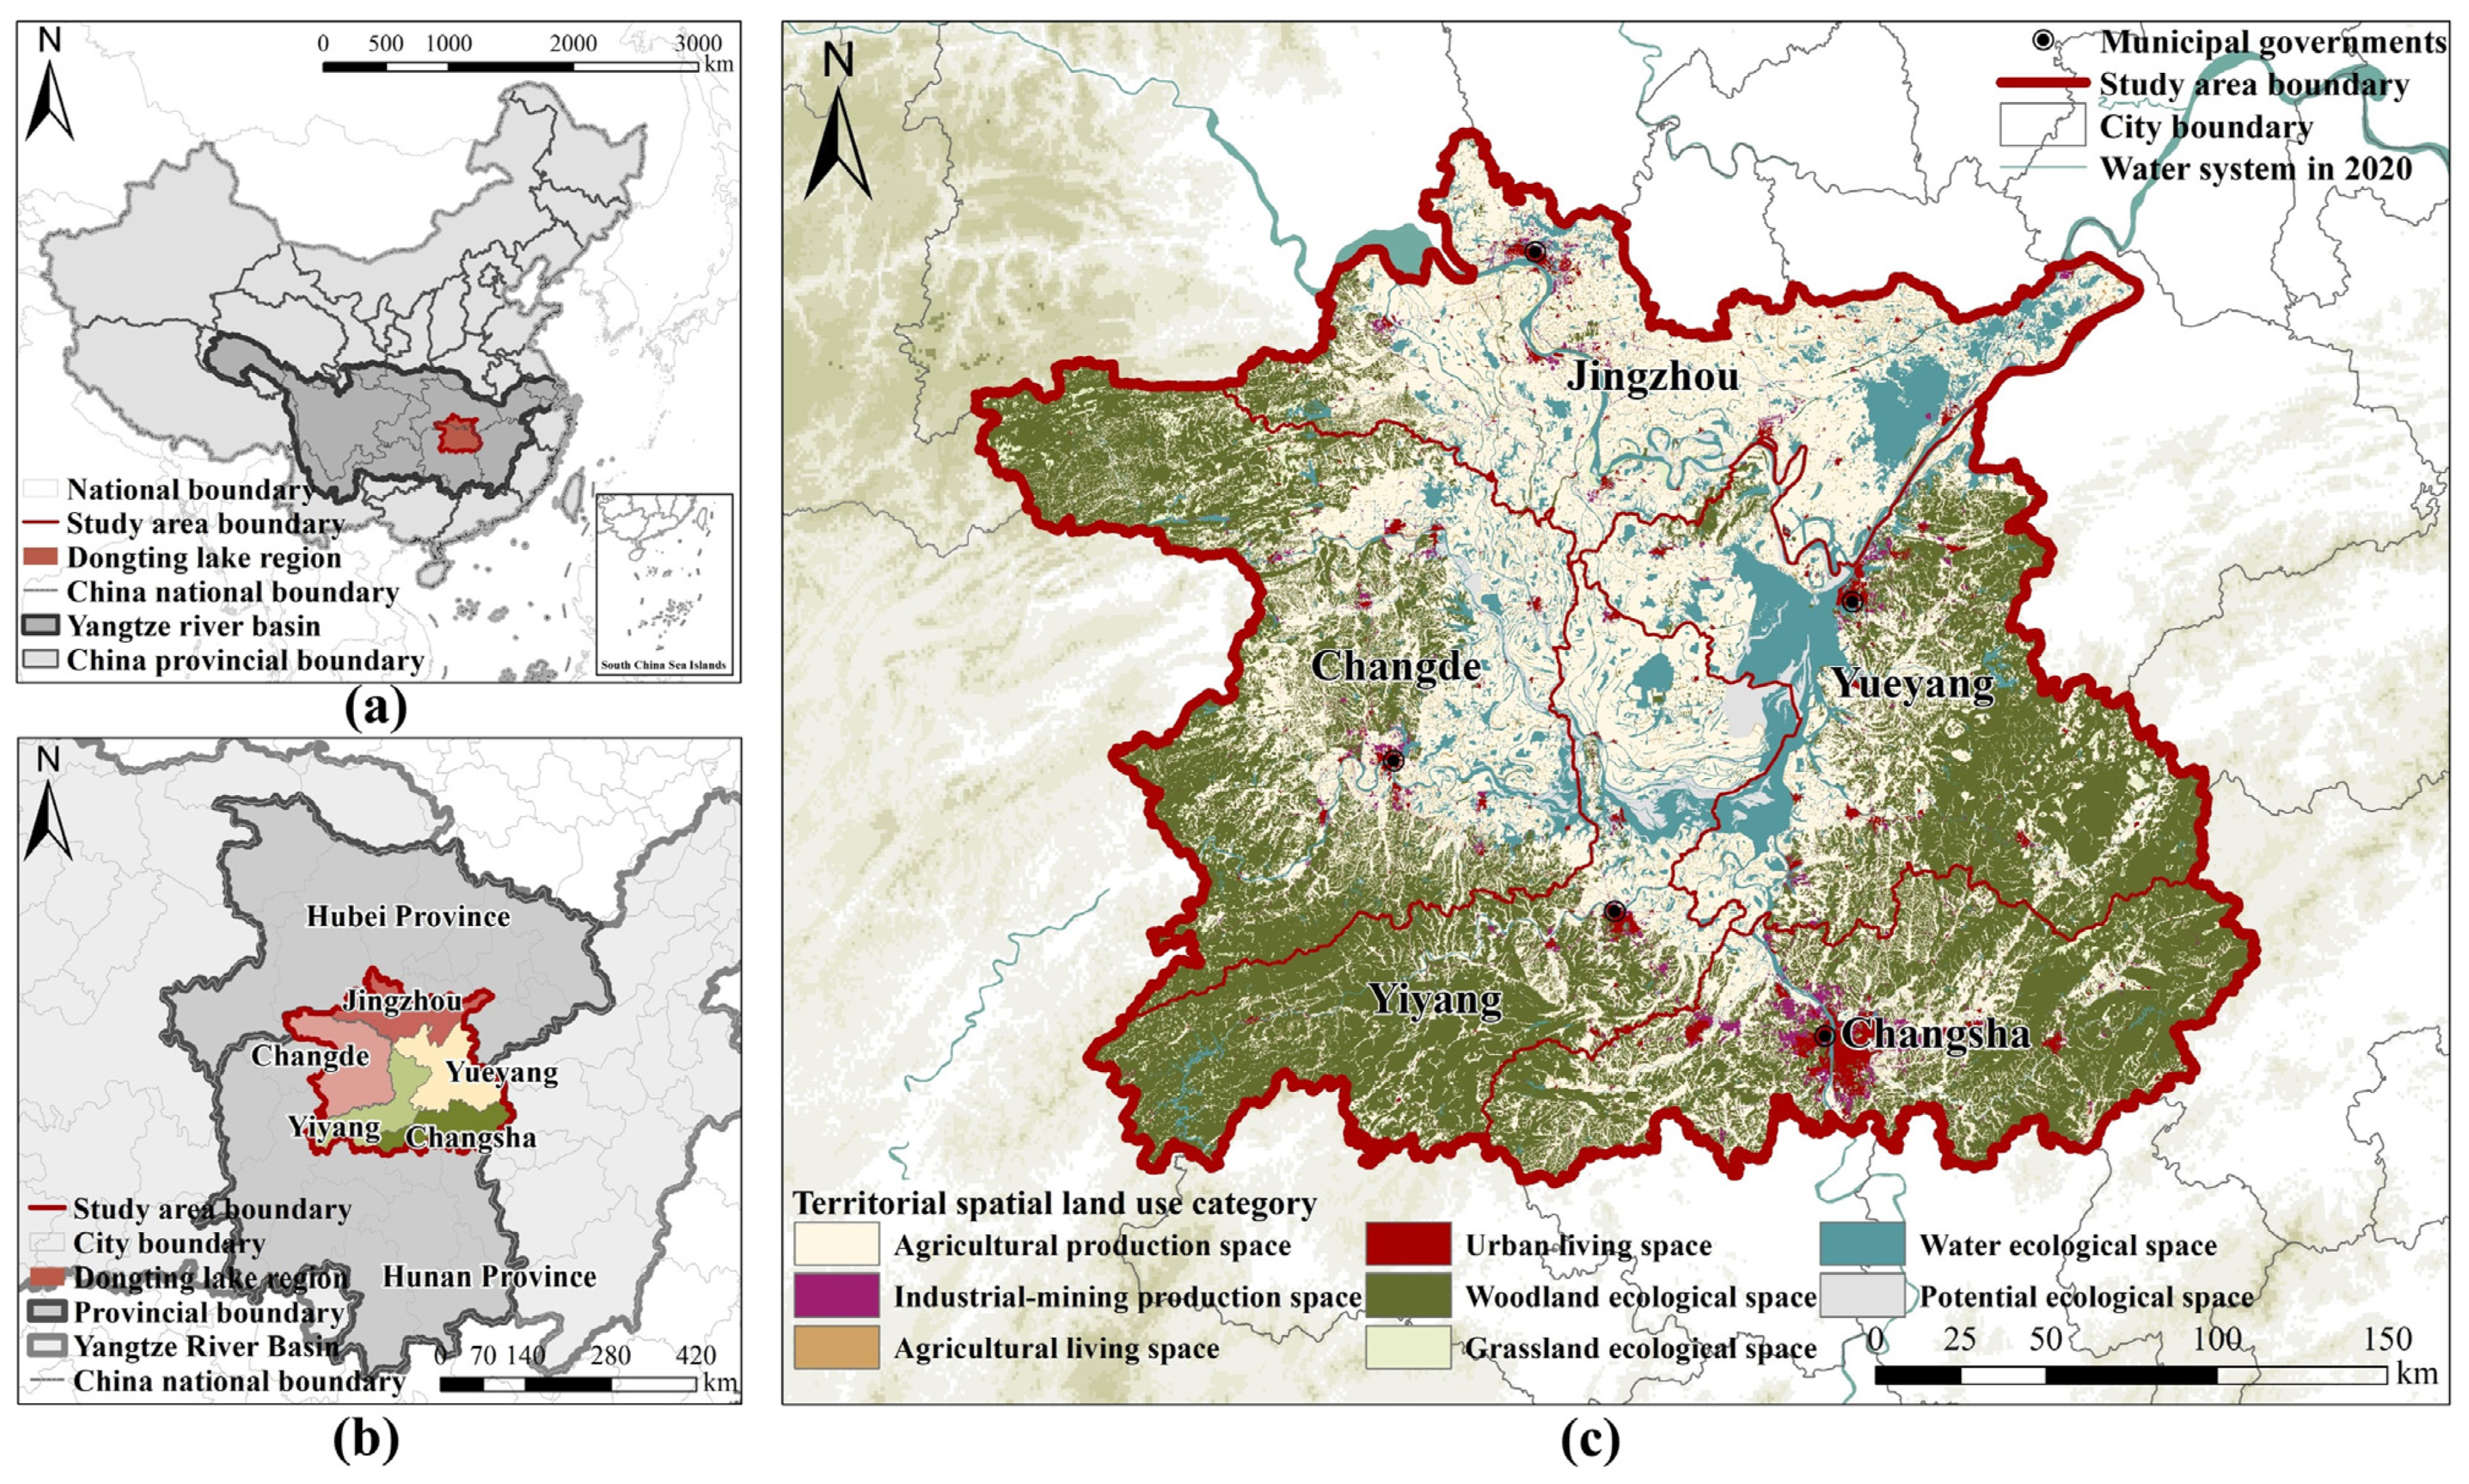
2.1. Study Area
2.2. Data Source and Processing
2.3. Methodology
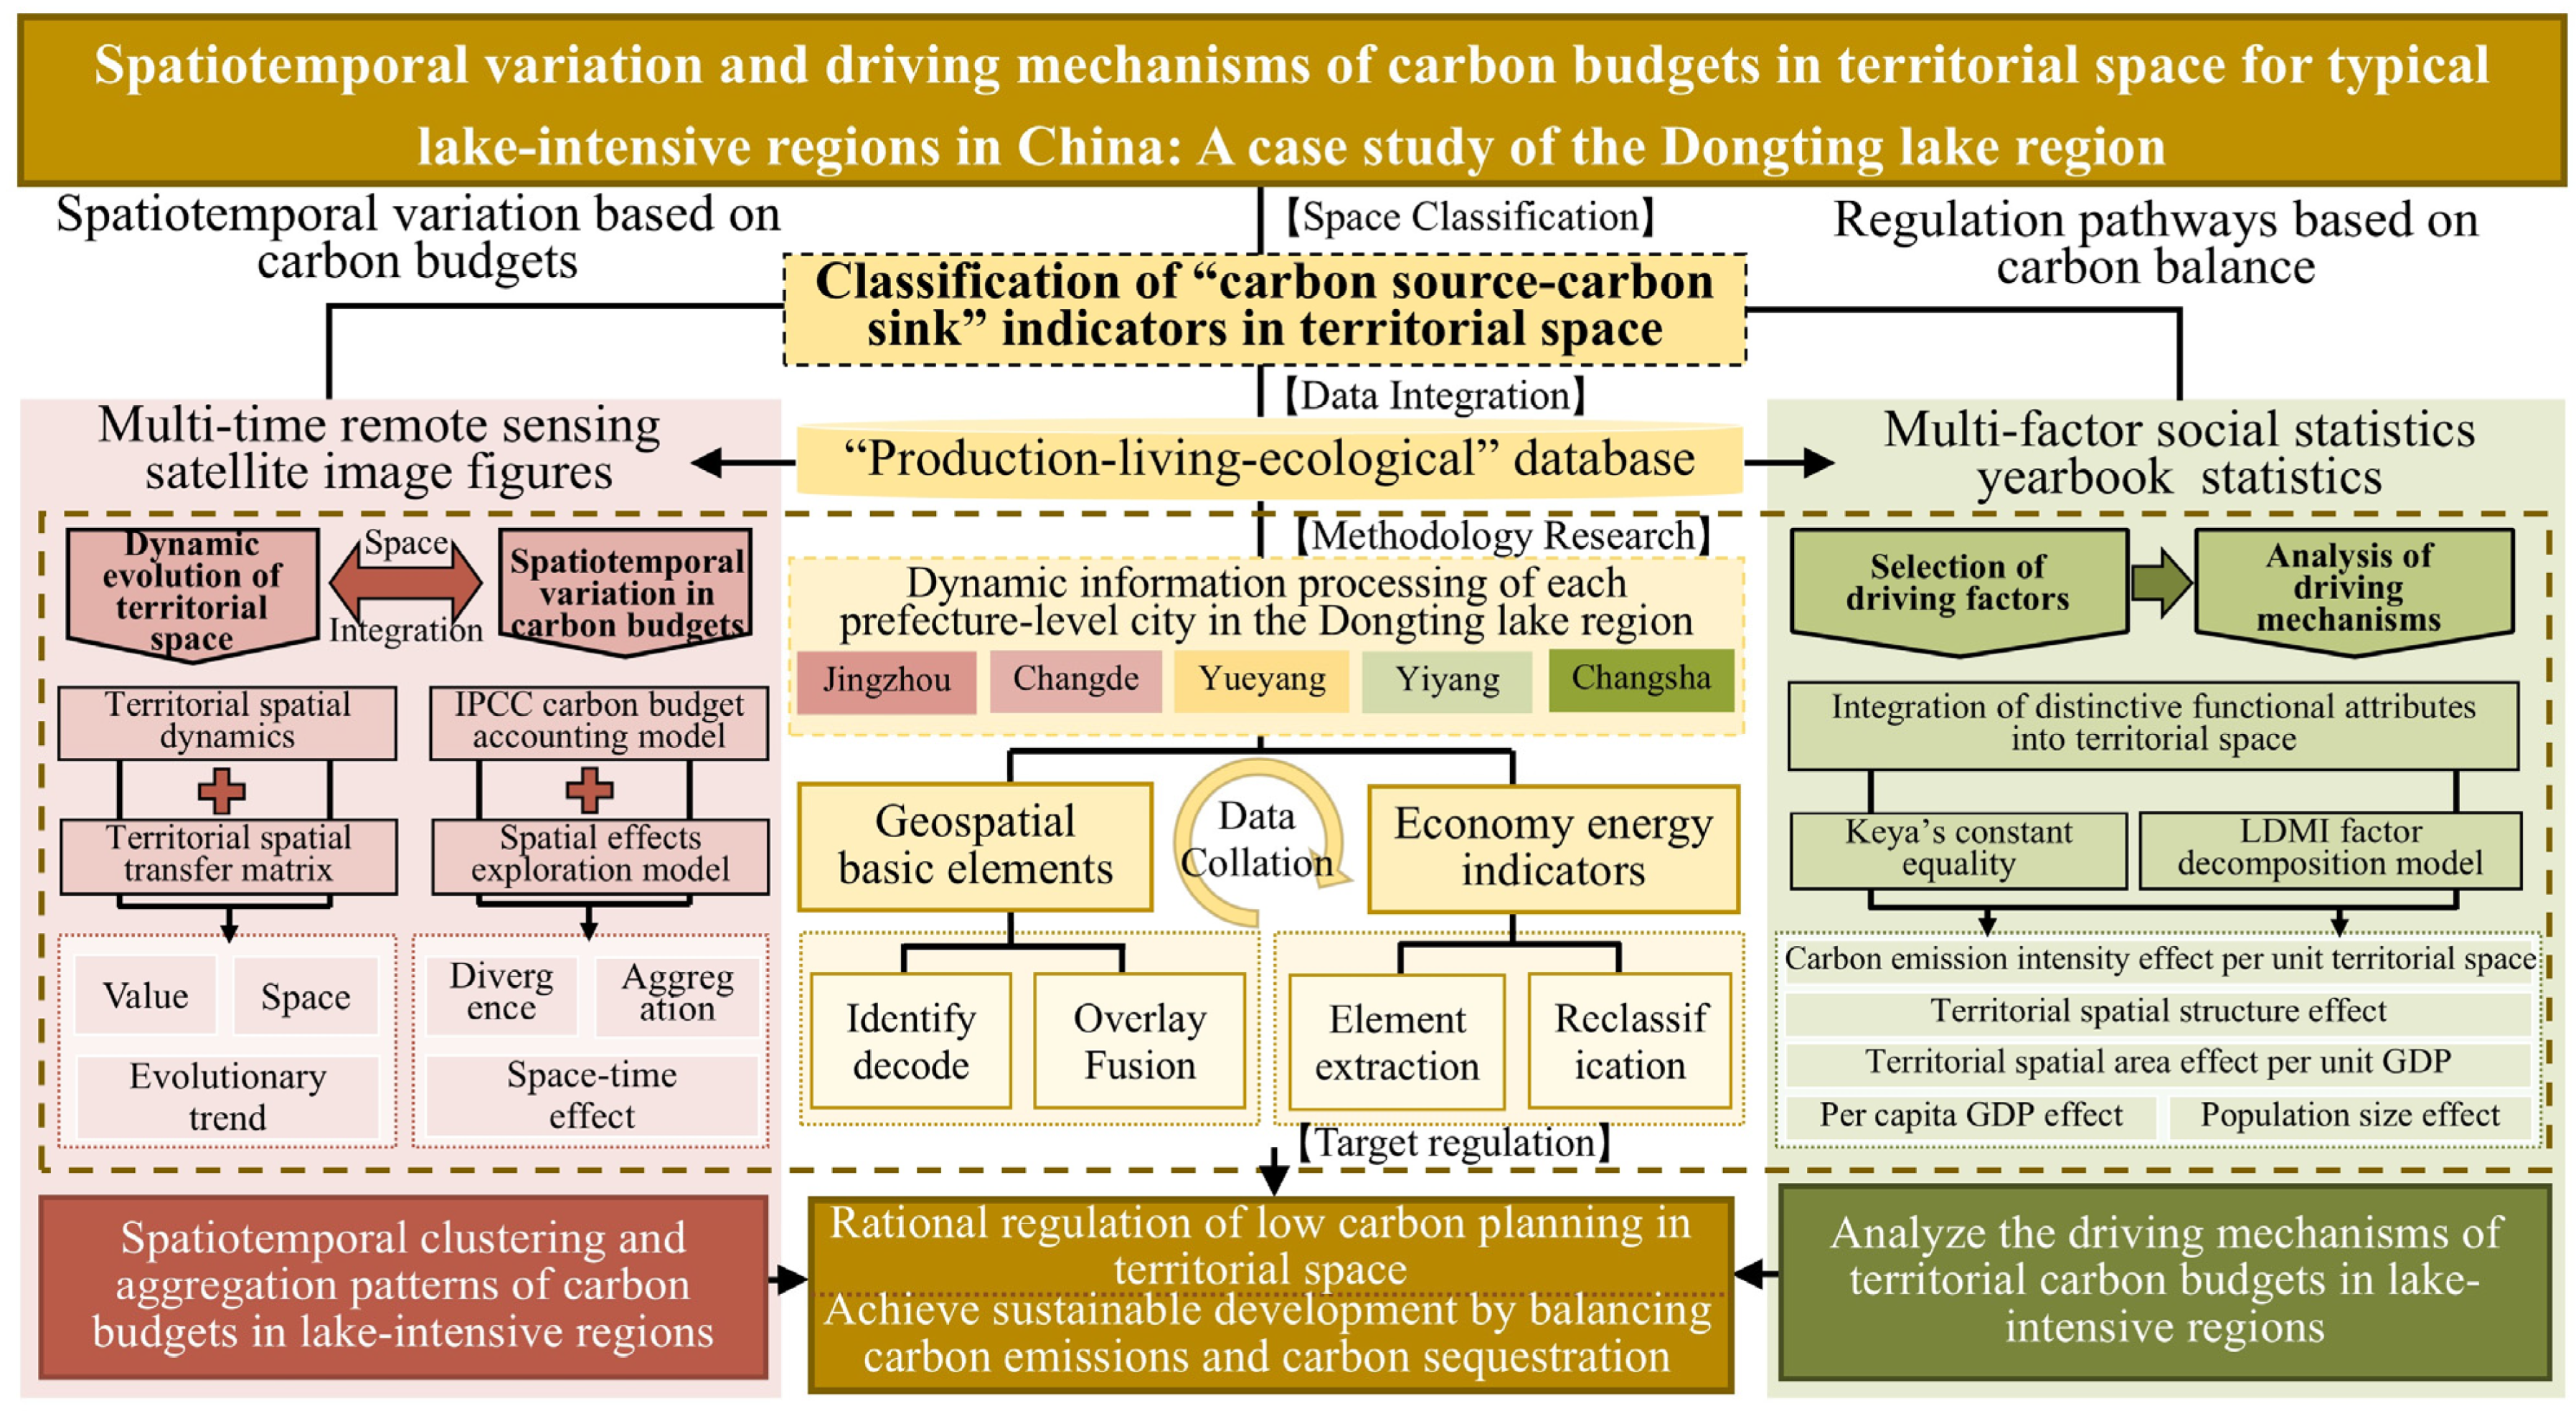
- (1)
- By combining multi-period remote sensing imagery with statistical yearbook data, this study classifies land-use categories within the territorial space of the Dongting Lake region and establishes a carbon source–sink indicator database.
- (2)
- The dynamic degree and transfer matrix models are applied to investigate the spatiotemporal evolution of the territorial space in the Dongting Lake region, identifying transition patterns across production, living, and ecological land-use categories.
- (3)
- Total carbon emissions and sequestration in the Dongting Lake region are estimated using the IPCC inventory’s direct and indirect estimation methods alongside the energy coefficient. The study examines carbon budget patterns at both “grid” and “city” scales, analyzing their spatiotemporal trends, spatial differentiation, and clustering effects.
- (4)
- The Kaya identity is utilized to decompose carbon emissions in territorial space into five influencing factors: carbon emission intensity, land-use structure, land-use efficiency, economic development, and population size. Using the additive model of the LMDI decomposition method, the cumulative contributions of each factor to carbon emissions are quantified, providing insights into the intrinsic relationships between land-use functions and carbon budgets.
2.3.1. Territorial Space Carbon Source–Sink Indicator Classification System
2.3.2. Territorial Space Dynamic Degree and Transfer Matrix
2.3.3. Total Accounting of Carbon Budgets in Territorial Space
2.3.4. Exploring Spatiotemporal Variation Patterns of Carbon Budgets
2.3.5. Decomposition of Driving Factors of Carbon Budgets in Territorial Space
3. Results
3.1. Spatiotemporal Dynamics of Territorial Space
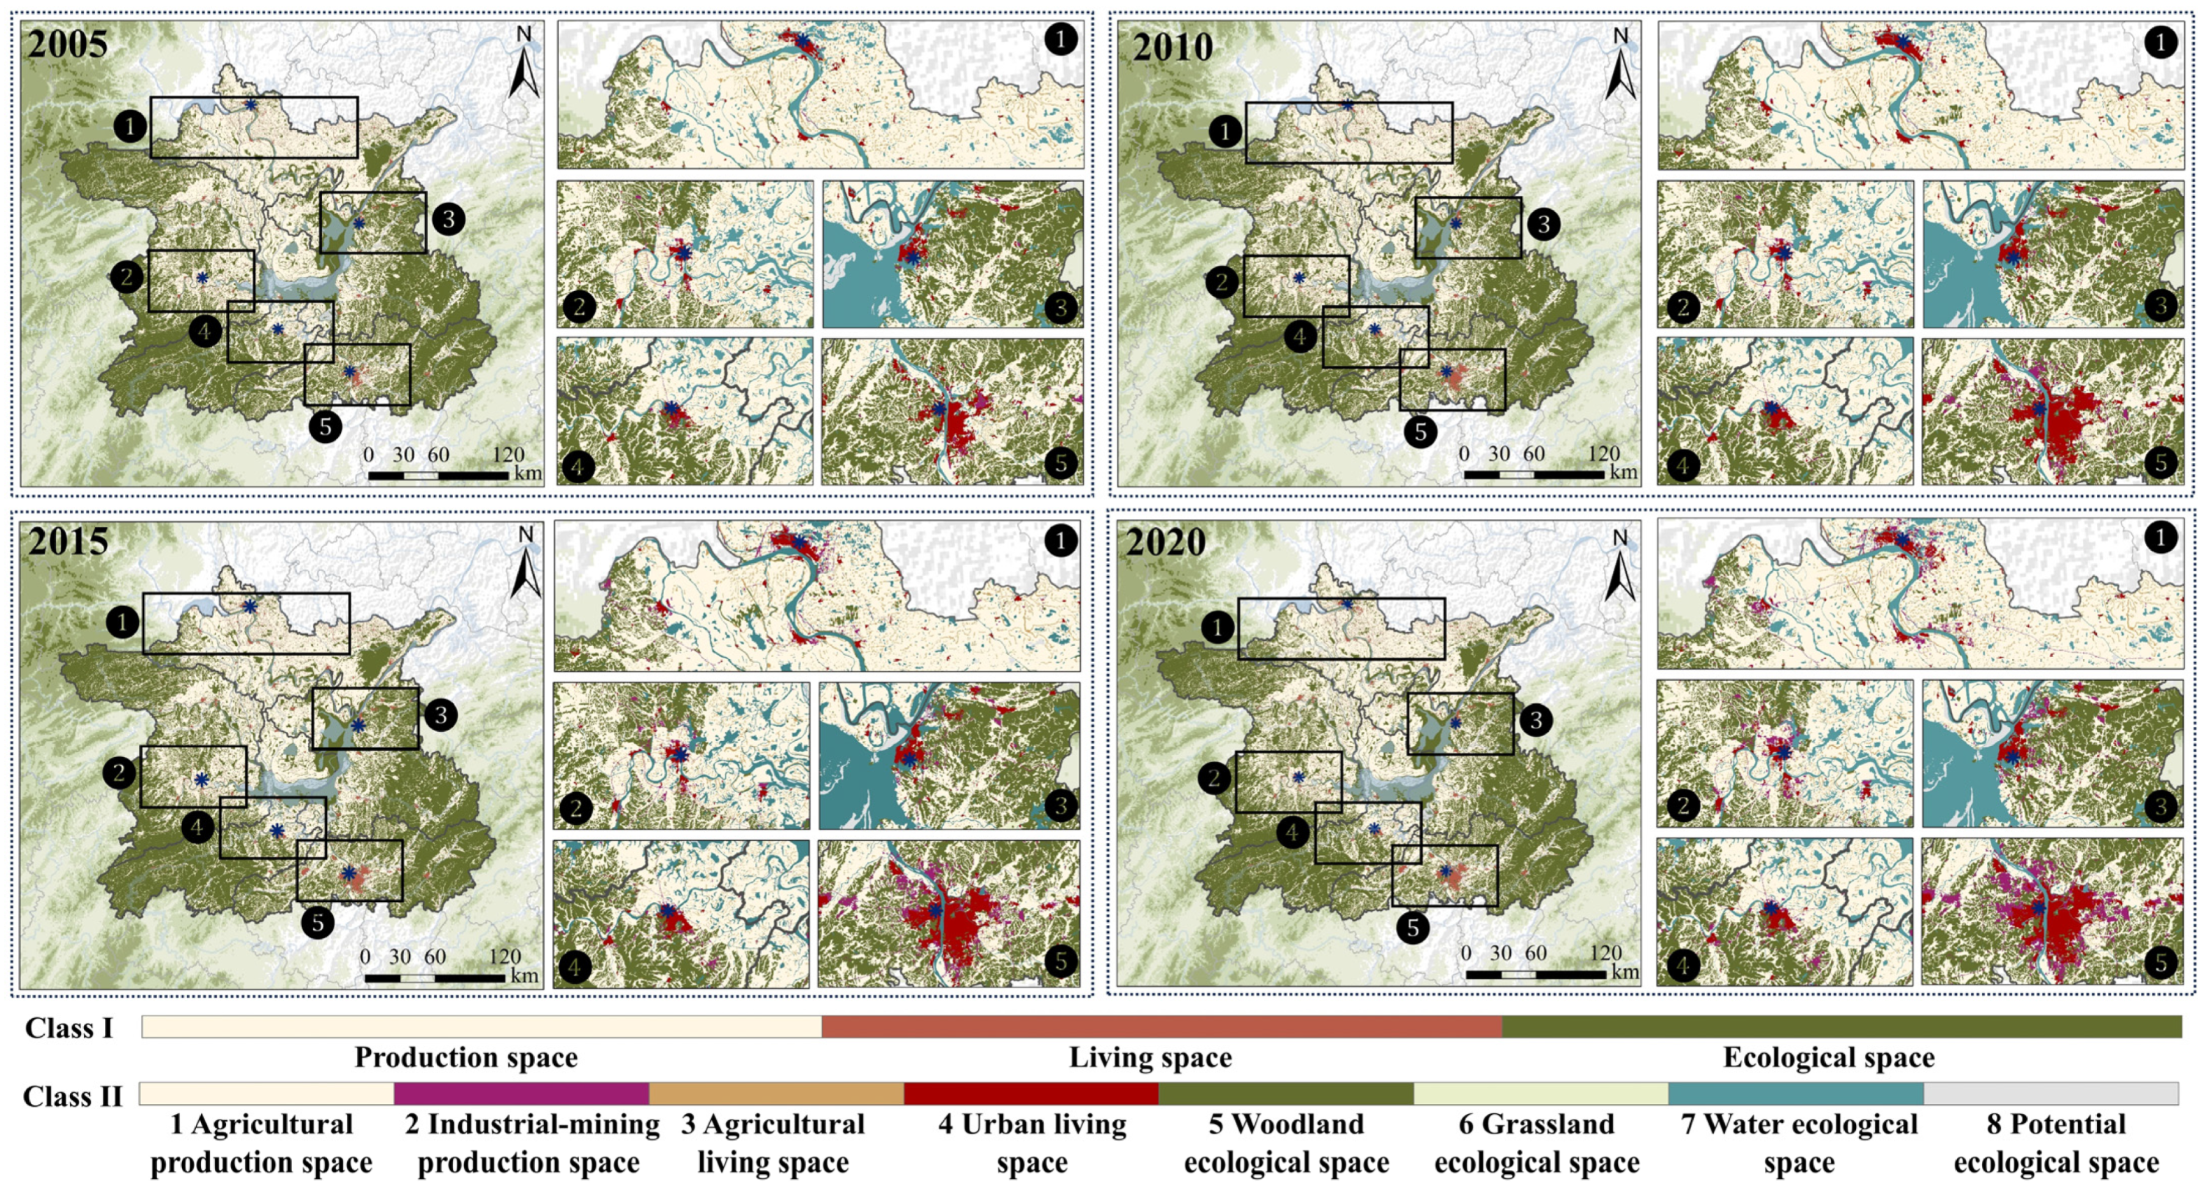
3.1.1. Spatiotemporal Evolution of Territorial Space
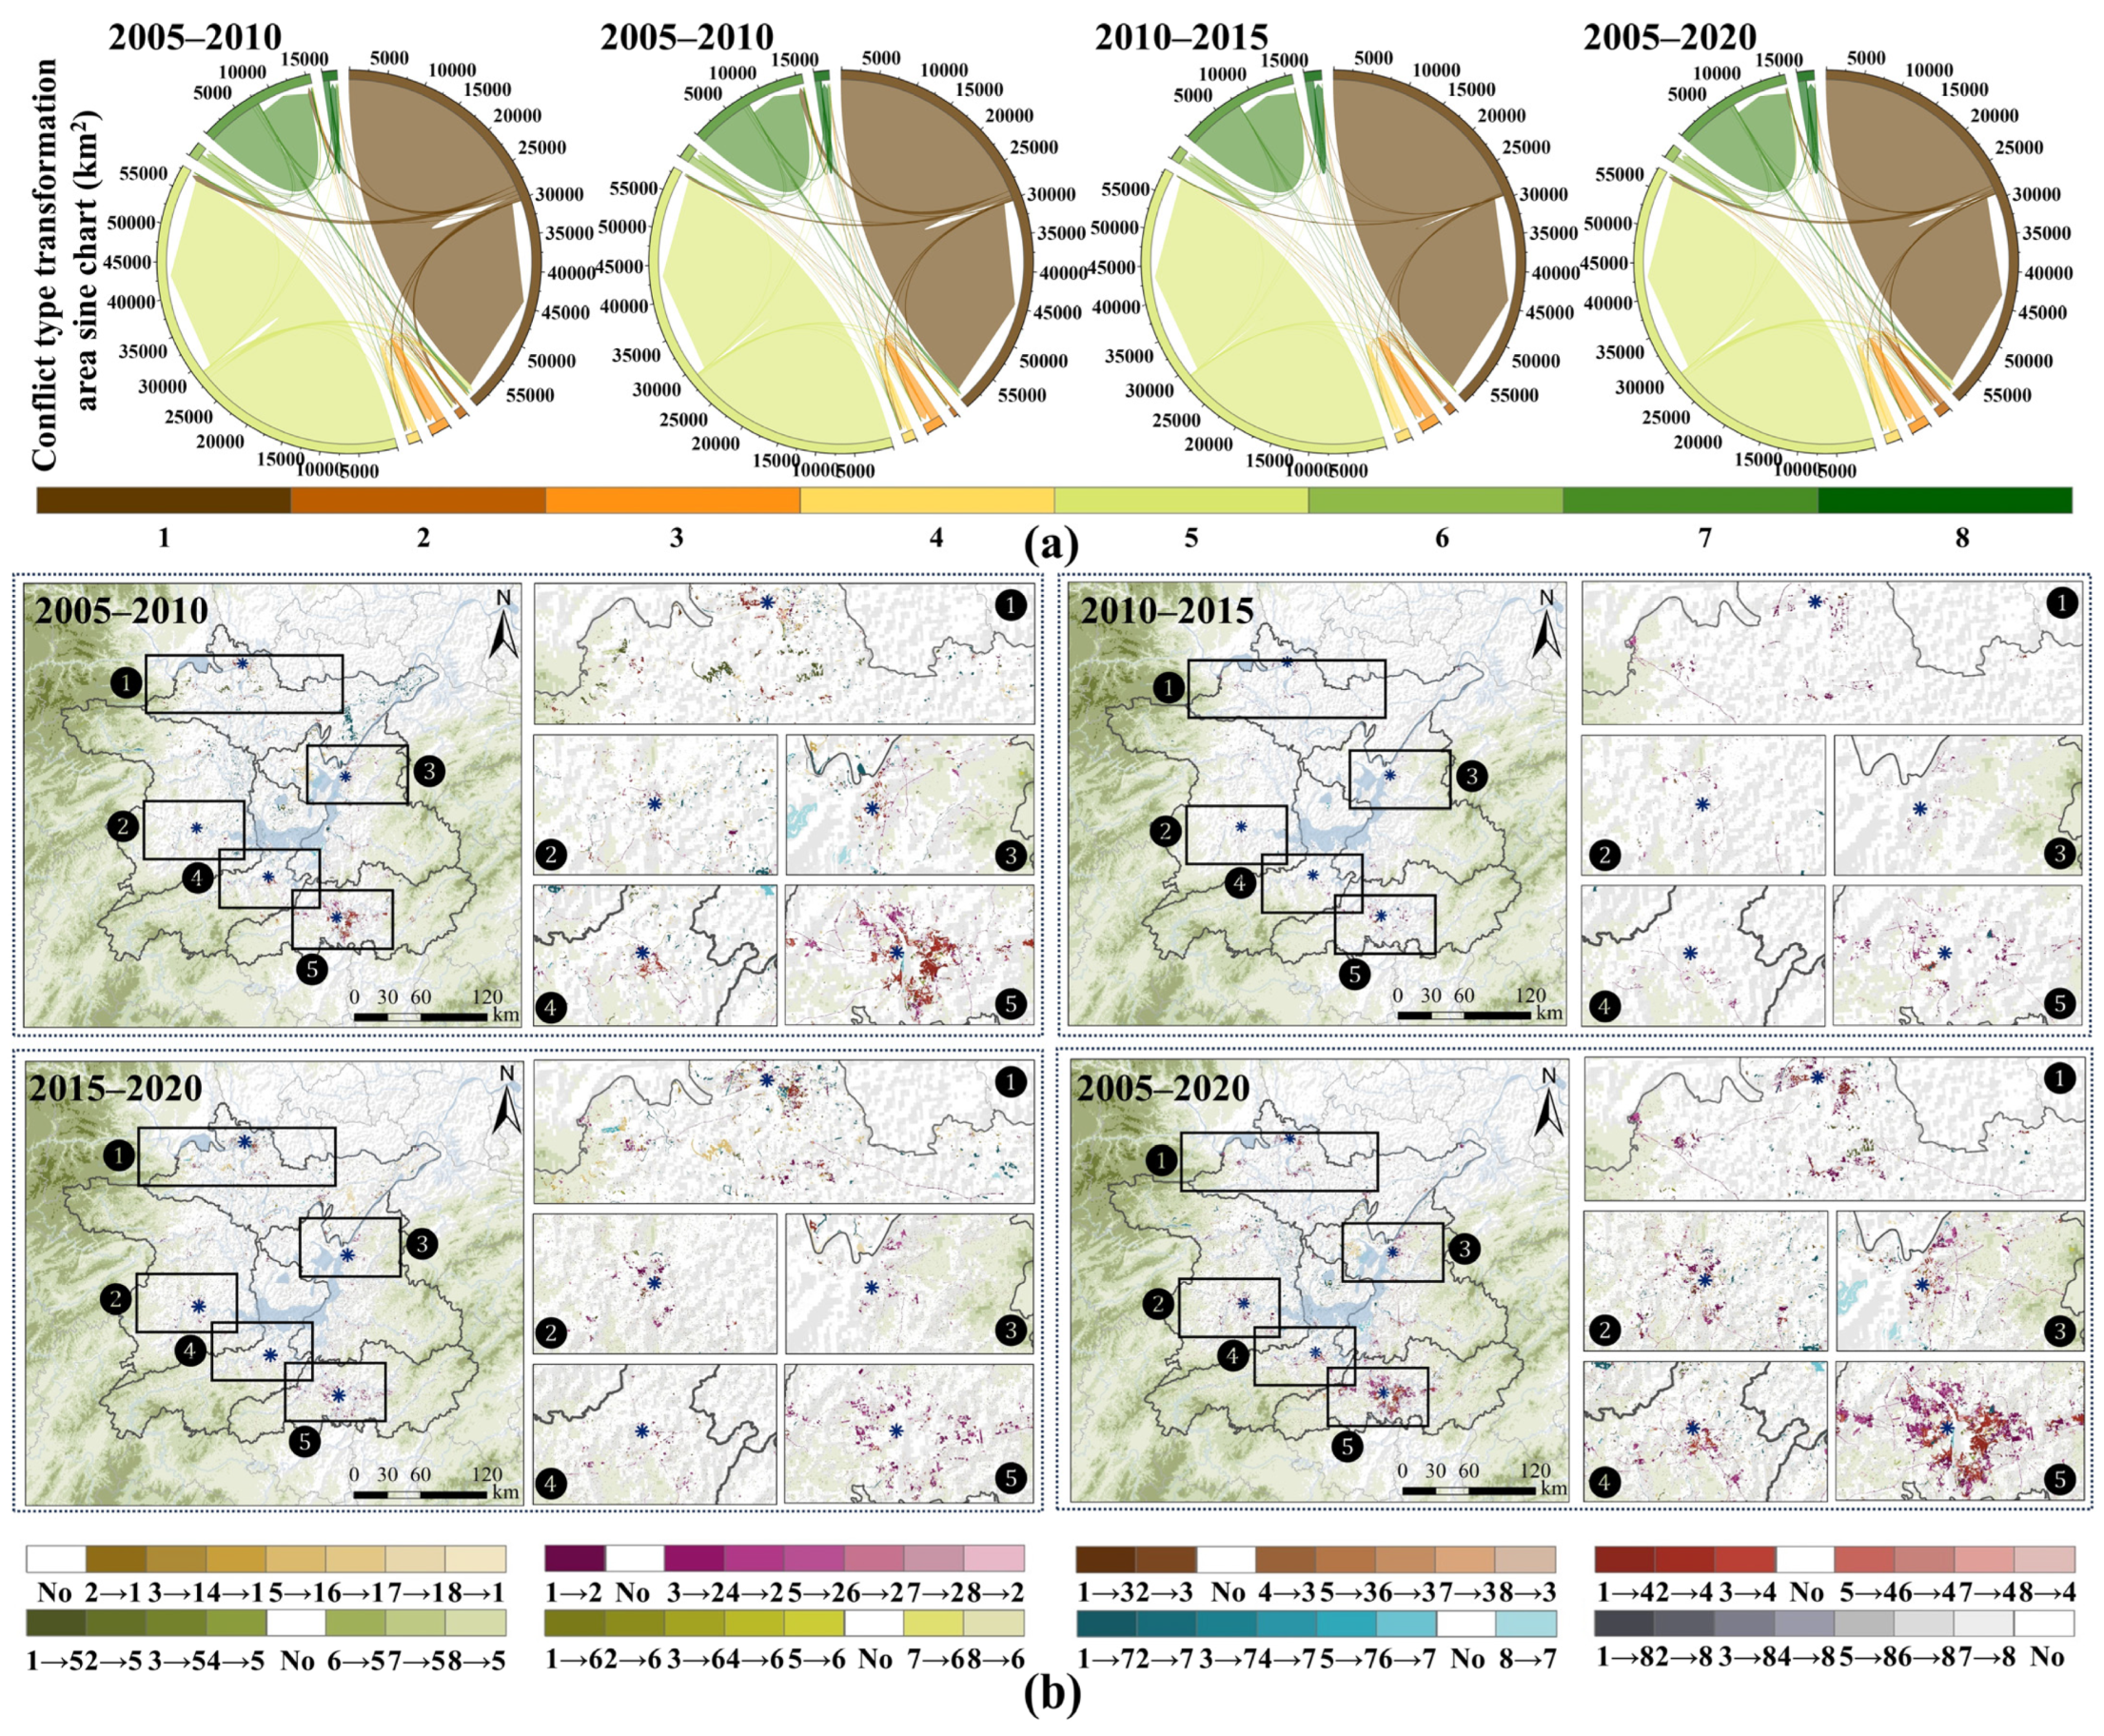
3.1.2. Land-Use Category Conversion in Territorial Space
3.2. Spatiotemporal Variation of Carbon Budgets in Territorial Space
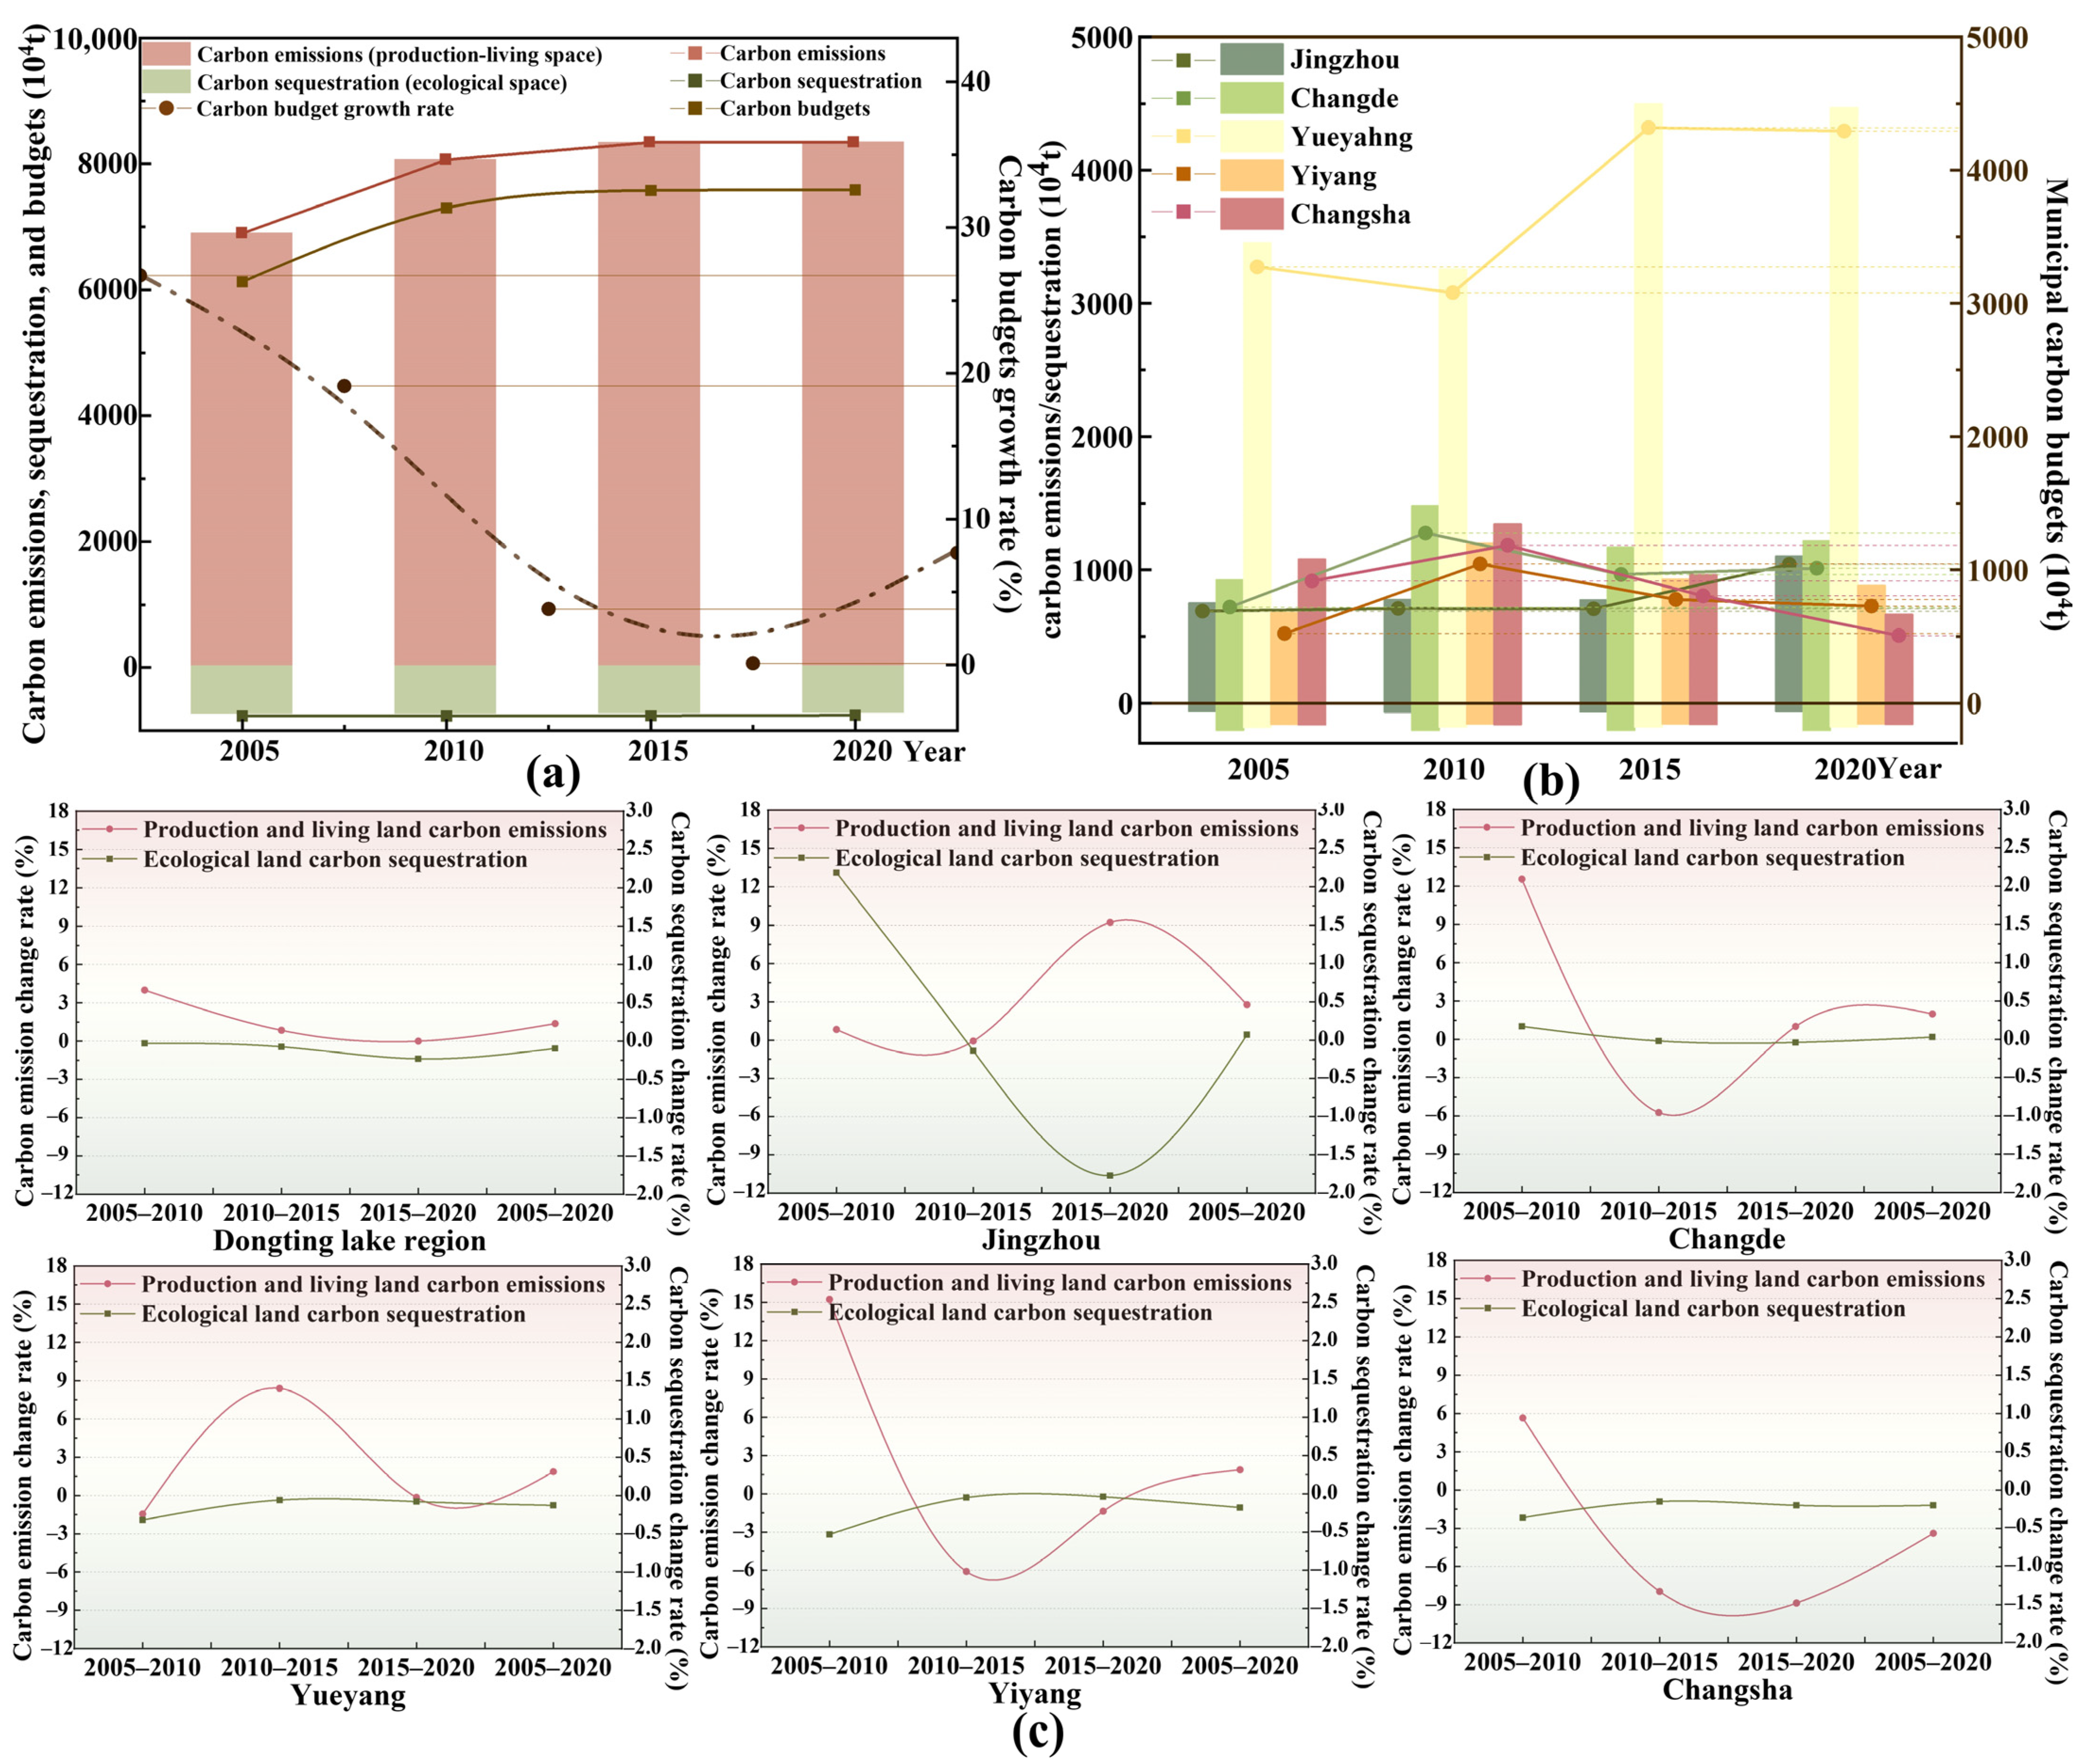
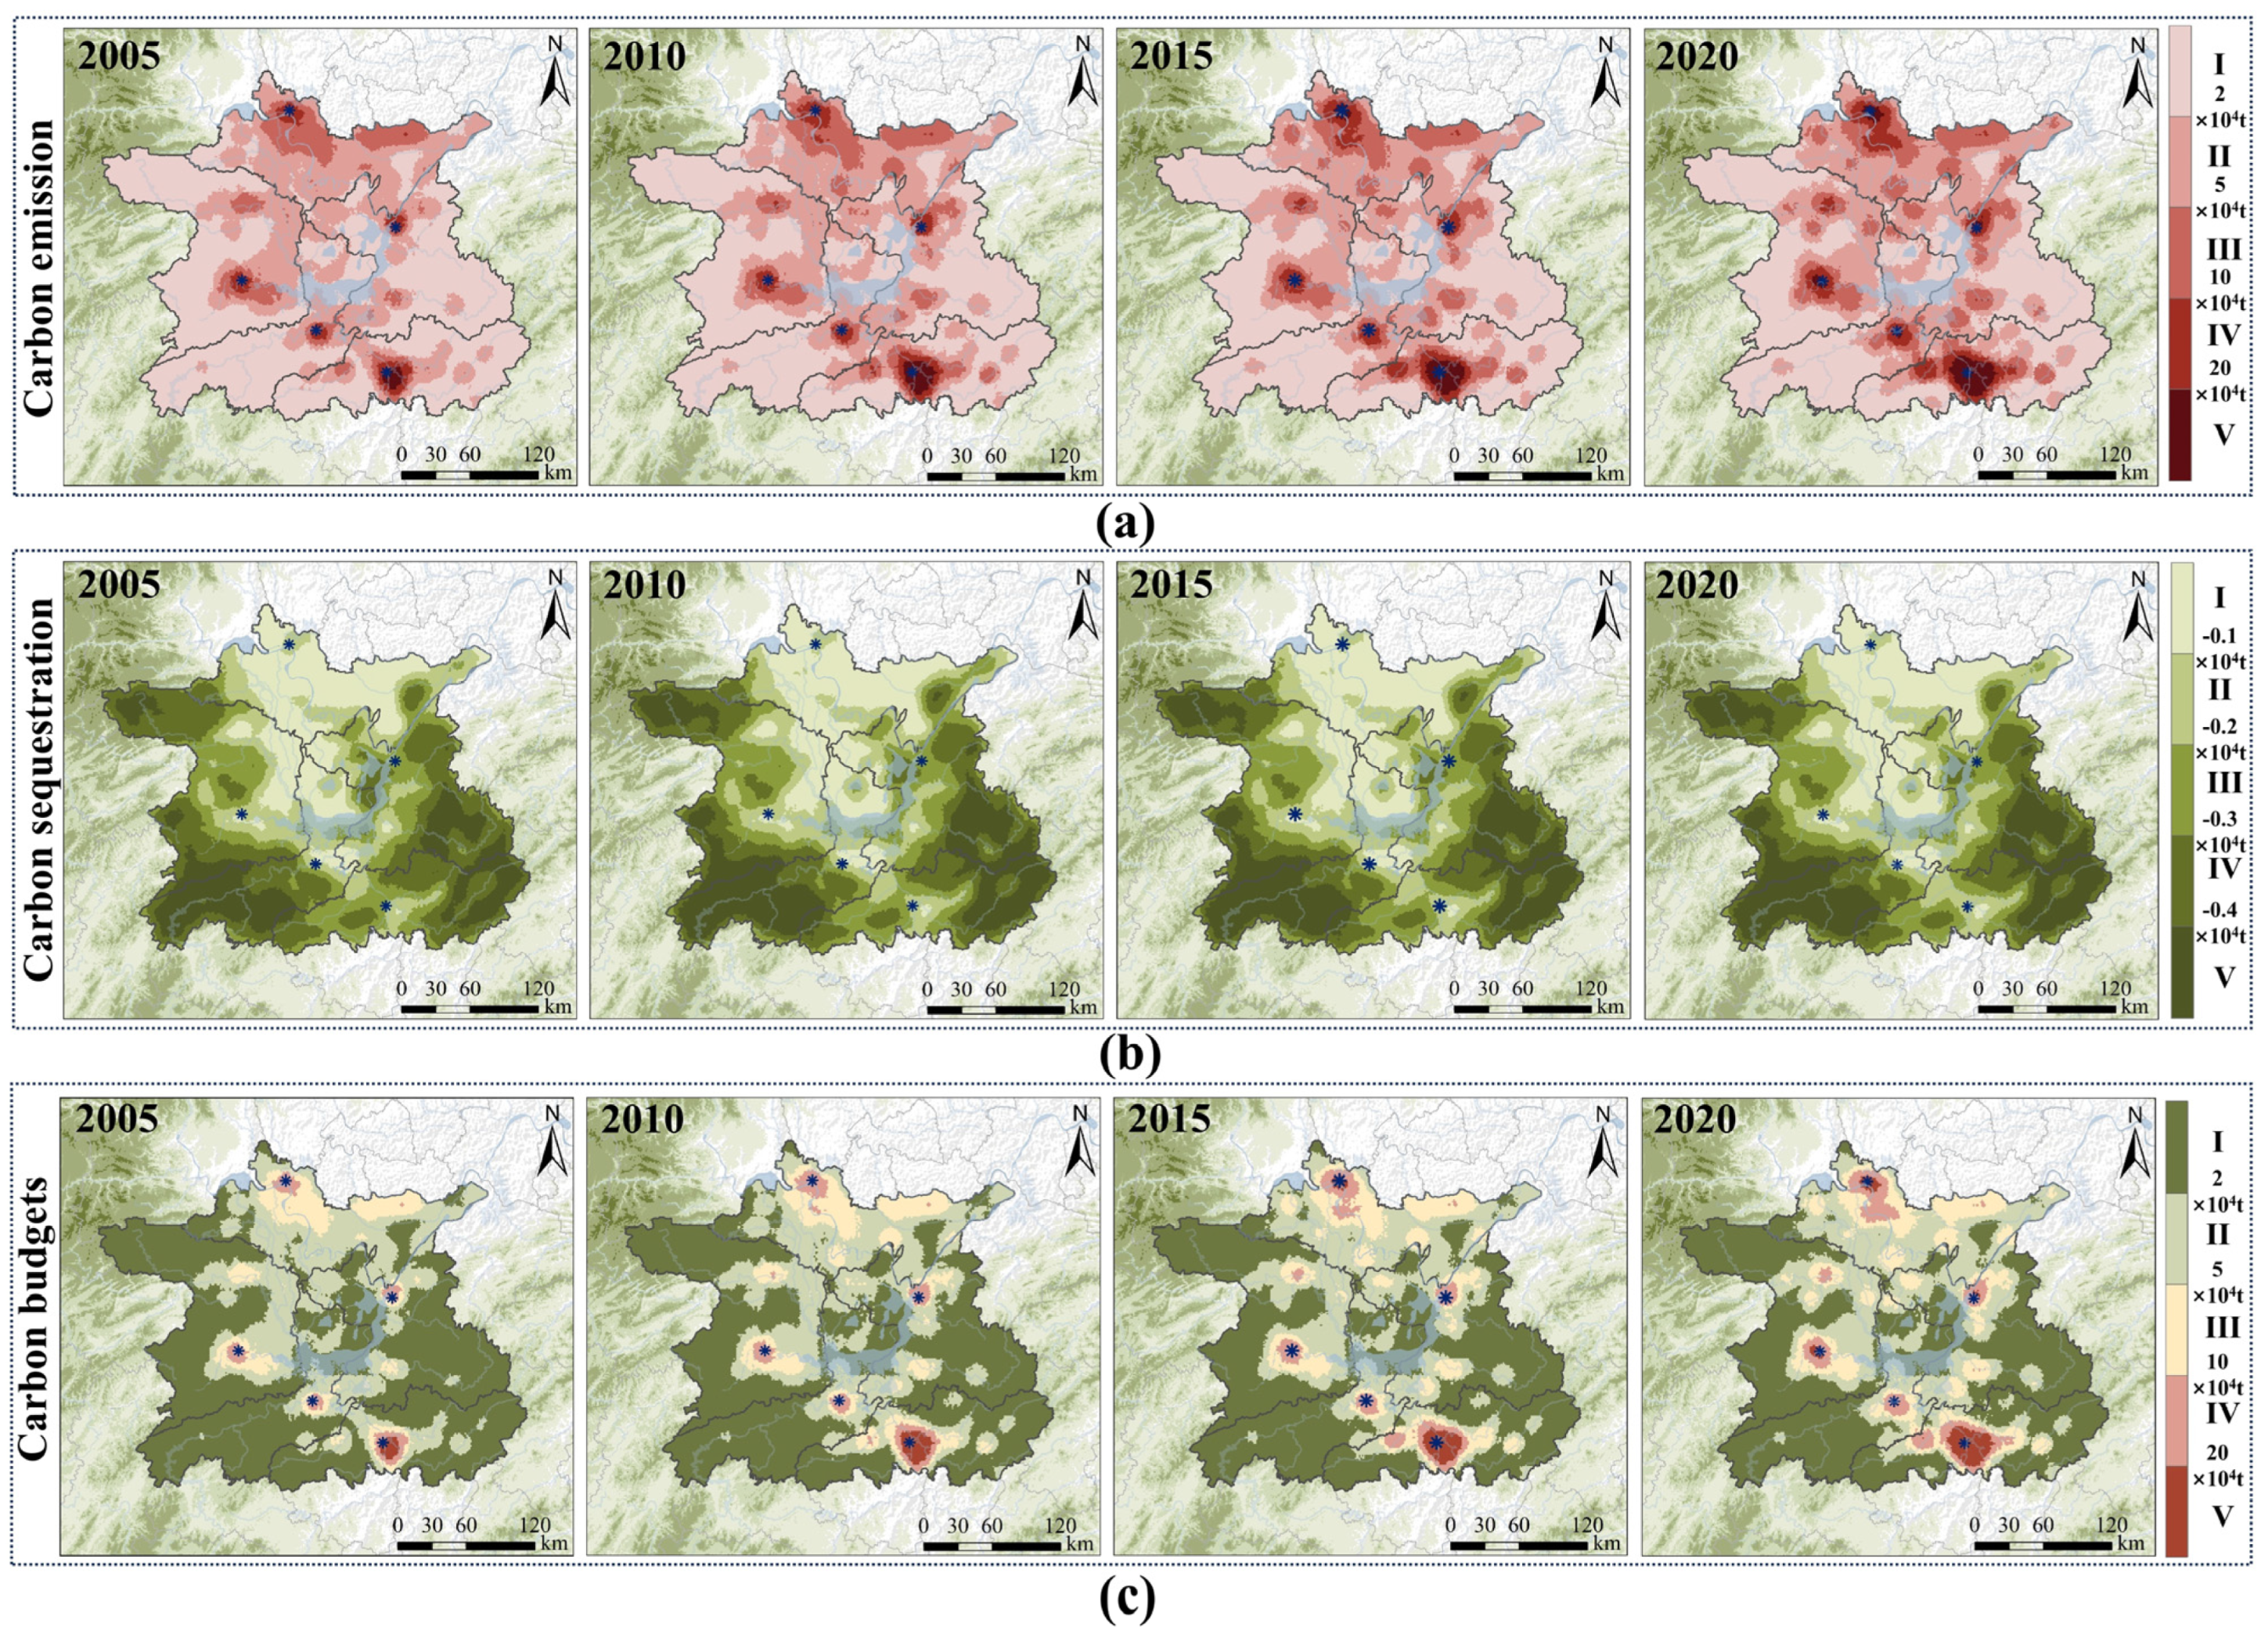
3.2.1. Spatiotemporal Evolution of Carbon Budgets in Territorial Space
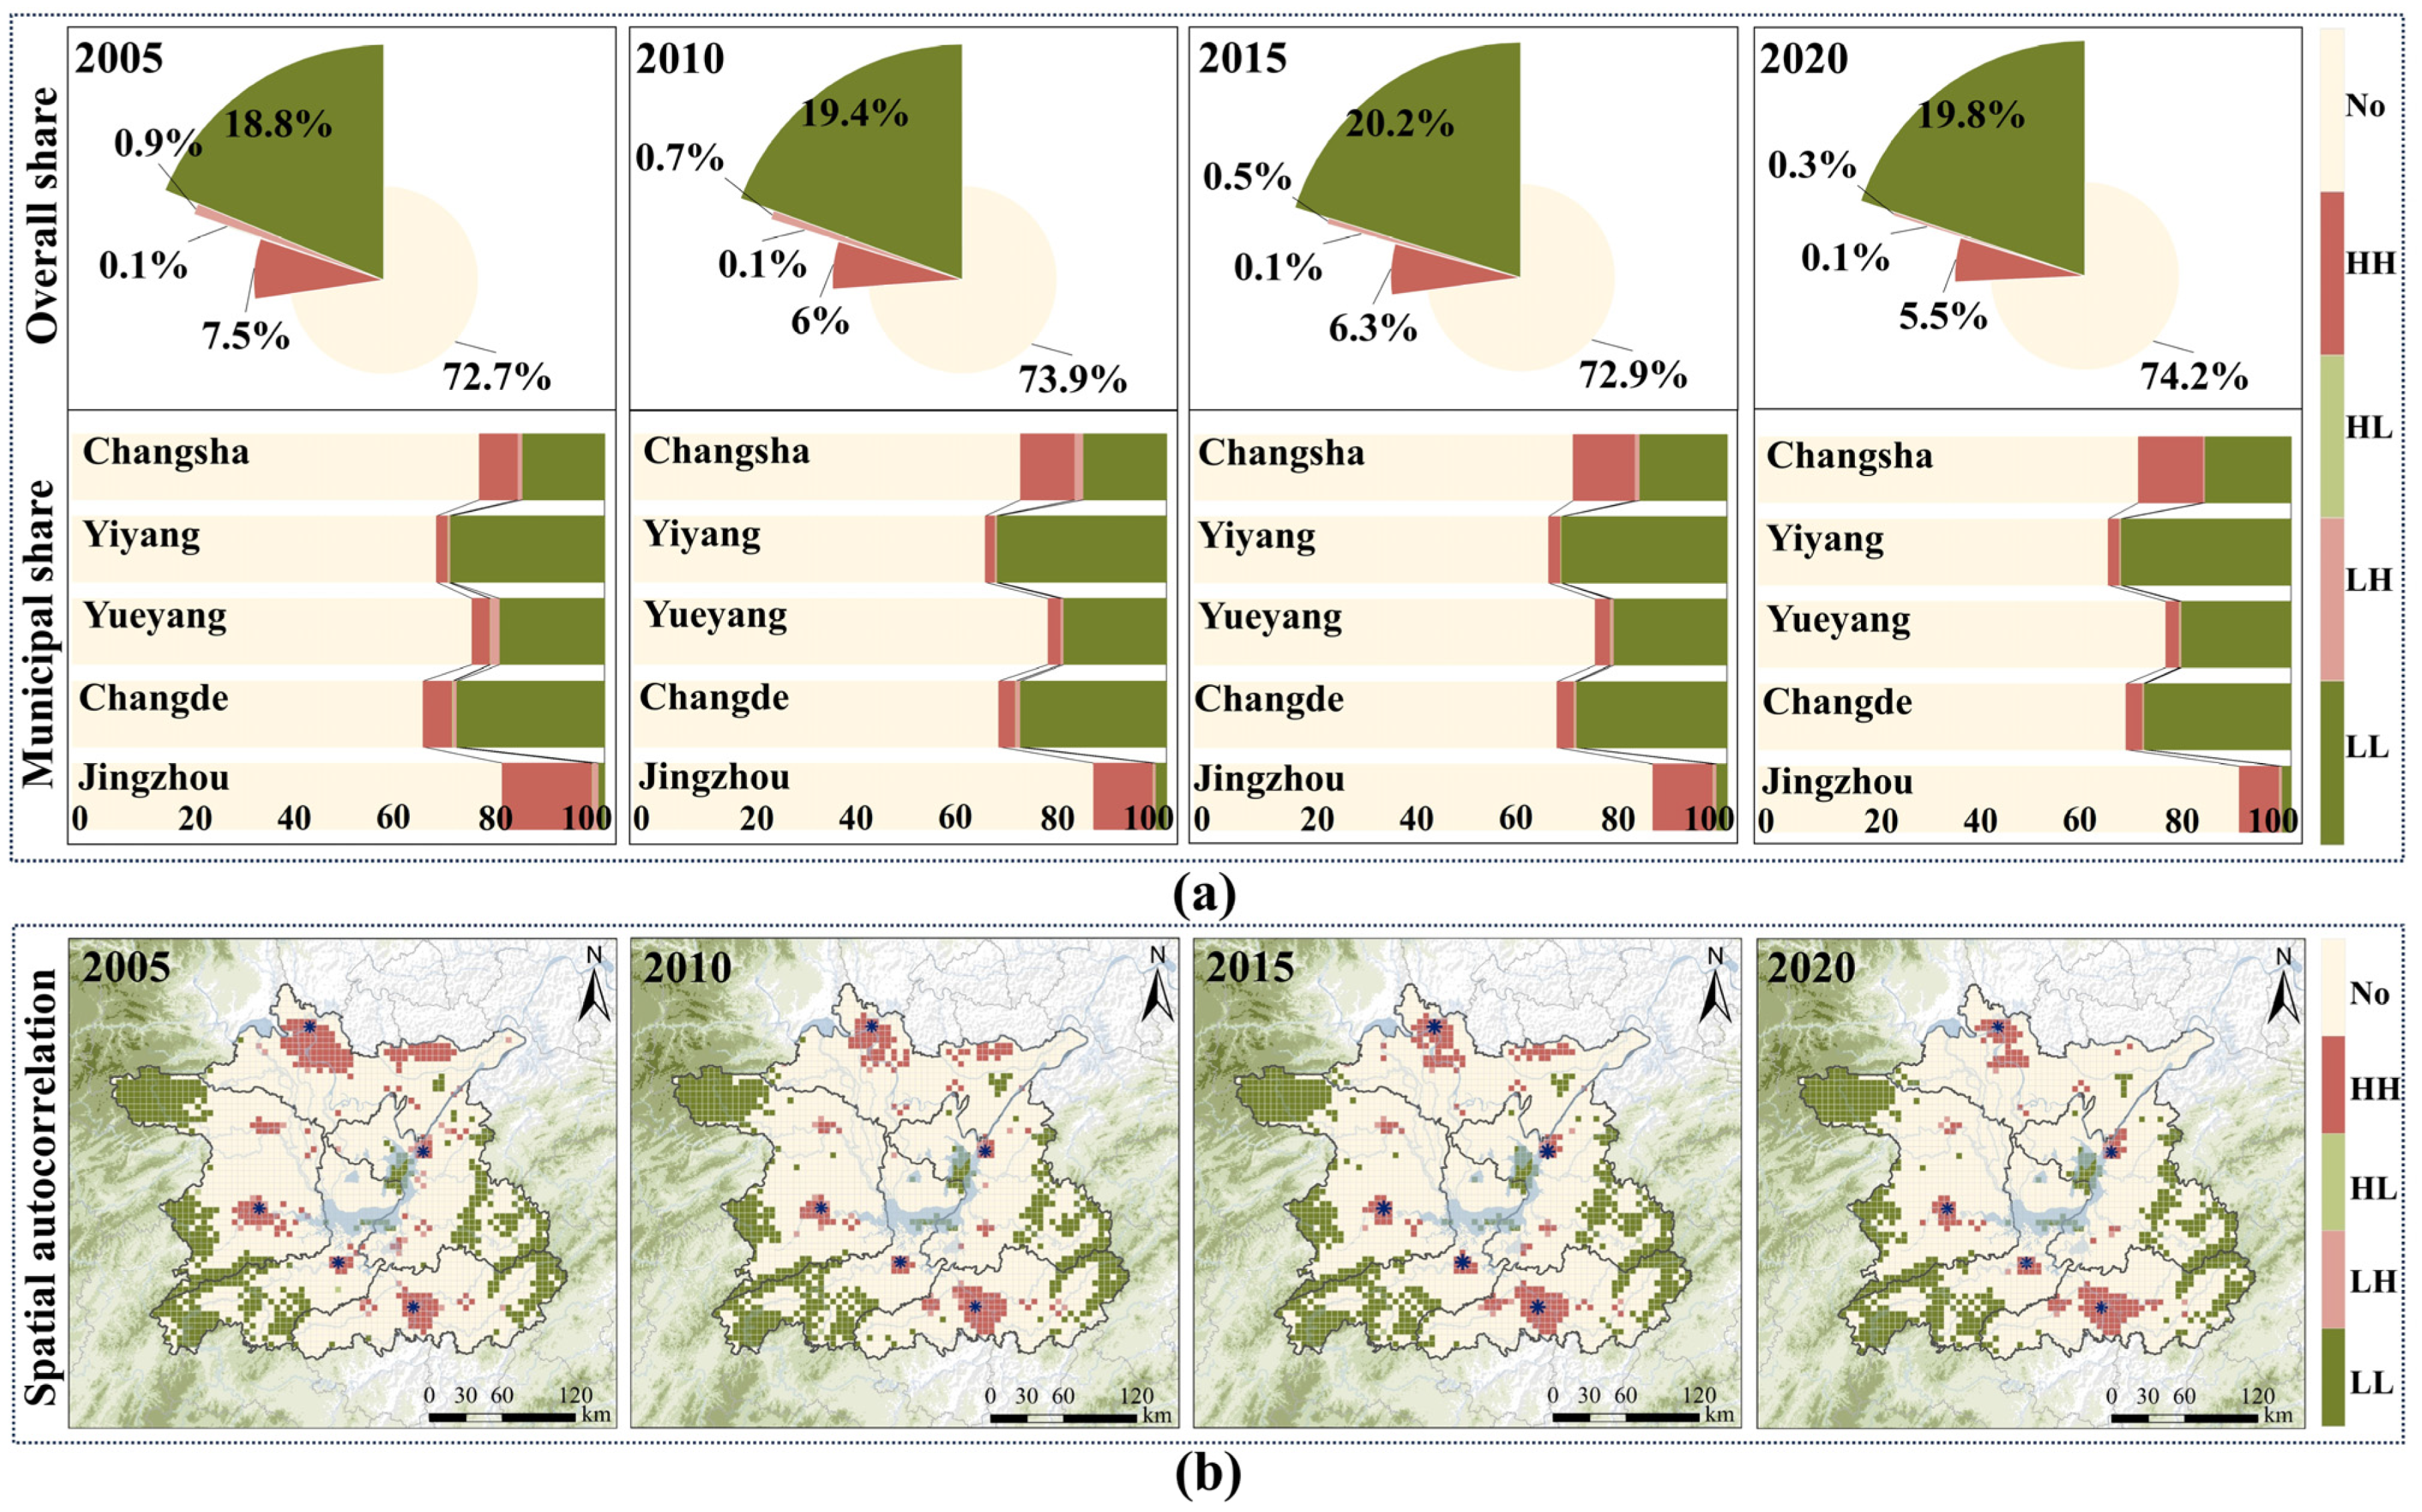
3.2.2. Spatiotemporal Differentiation and Clustering Effects of Carbon Budgets in Territorial Space
3.3. Driving Mechanisms of Carbon Budgets in Territorial Space
3.3.1. Carbon Emission Intensity Effect of Territorial Space
3.3.2. Land Use Structure Effect of Territorial Space
3.3.3. Land Use Efficiency Effect of Territorial Space
3.3.4. Economic Development Effect
3.3.5. Population Scale Effect
4. Discussion
4.1. Multidimensional Validation of the Robustness of the Territorial Carbon Budgets Accounting Framework in Lake-Intensive Regions
4.2. Spatiotemporal Variation Patterns of Territorial Space Carbon Budgets in Lake-Intensive Regions
4.3. Analysis of Factors Influencing Territorial Space Carbon Budgets in Lake-Intensive Regions
4.4. Policy Interventions and Planning Pathways for Carbon Balance in Lake-Intensive Regions
4.5. Limitations and Future Prospects
5. Conclusions
Author Contributions
Funding
Institutional Review Board Statement
Informed Consent Statement
Data Availability Statement
Acknowledgments
Conflicts of Interest
References
- Cai, Y.; Feng, J.; Wang, Y.; Ding, Y.; Hu, Y.; Fang, H. The Optuna–LightGBM–XGBoost Model: A Novel Approach for Estimating Carbon Emissions Based on the Electricity–Carbon Nexus. Appl. Sci. 2024, 14, 4632. [Google Scholar] [CrossRef]
- Yang, Y.; Xie, B.; Lyu, J.; Liang, X.; Ding, D.; Zhong, Y.; Song, T.; Chen, Q.; Guan, Q. Optimizing urban functional land towards “dual carbon” target: A coupling structural and spatial scales approach. Cities 2024, 148, 104860. [Google Scholar] [CrossRef]
- Wang, S.; Gao, Y.; Jia, J.; Lu, Y.; Wang, J.; Ha, X.; Li, Z.; Sun, K. Determining whether hydrological processes drive carbon source and sink conversion shifts in a large floodplain-lake system in China. Water Res. 2022, 224, 119105. [Google Scholar] [CrossRef] [PubMed]
- Morsy, S.; Shaker, A.; El-Rabbany, A. Using Multispectral Airborne LiDAR Data for Land/Water Discrimination: A Case Study at Lake Ontario, Canada. Appl. Sci. 2018, 8, 349. [Google Scholar] [CrossRef]
- Al-Qubati, A.; Zhang, L.; Forkel, M. Urban and peri-urban agriculture under climate change: A review on carbon emissions and sequestration. Sustain. Cities Soc. 2024, 115, 105830. [Google Scholar] [CrossRef]
- Yin, L.; Sharifi, A.; Liqiao, H.; Jinyu, C. Urban carbon accounting: An overview. Urban Clim. 2022, 44, 101195. [Google Scholar] [CrossRef]
- Zhao, J.; Cohen, J.B.; Chen, Y.; Cui, W.; Cao, Q.; Yang, T.; Li, G. High-resolution spatiotemporal patterns of China’s FFCO2 emissions under the impact of LUCC from 2000 to 2015. Environ. Res. Lett. 2020, 15, 044007. [Google Scholar] [CrossRef]
- Macicasan, V.; Ocrain, A.; Balc, R.; Dicu, T.; Bodmer, M.D.V.; Roba, C. How Can Land Use Management in Traditional Cultural Landscapes Become a Policy Instrument for Soil Organic Carbon Sequestration and Climate Change Mitigation? A Transylvanian Case Study. Appl. Sci. 2024, 14, 9851. [Google Scholar] [CrossRef]
- Wang, W.; Wang, X.; Wang, L.; Zhang, Z.; Lyu, D. Spatio-Temporal Variation and Drivers of Land-Use Net Carbon Emissions in Chengyu Urban Agglomeration, China. Land 2024, 13, 2160. [Google Scholar] [CrossRef]
- Cao, M.; Prince, S.D.; Li, K.; Tao, B.O.; Small, J.; Shao, X. Response of terrestrial carbon uptake to climate interannual variability in China. Glob. Change Biol. 2003, 9, 536–546. [Google Scholar] [CrossRef]
- Xi, N.; Zhang, T.; Zhao, W.; Jia, Y.; Fan, J.; Li, R.; Li, J.; Pu, J. Metabolic processes drive spatio-temporal variations of carbon sink/source in a karst river. Environ. Res. 2024, 262, 119970. [Google Scholar] [CrossRef] [PubMed]
- Liu, L.; Tang, Y.; Chen, Y.; Zhou, X.; Bedra, K.B. Urban Sprawl and Carbon Emissions Effects in City Areas Based on System Dynamics: A Case Study of Changsha City. Appl. Sci. 2022, 12, 3244. [Google Scholar] [CrossRef]
- Zhang, B.; Yin, J.; Jiang, H.; Chen, S.; Ding, Y.; Xia, R.; Wei, D.; Luo, X. Multi-source data assessment and multi-factor analysis of urban carbon emissions: A case study of the Pearl River Basin, China. Urban Clim. 2023, 51, 101653. [Google Scholar] [CrossRef]
- Han, F.; Kasimu, A.; Wei, B.; Zhang, X.; Aizizi, Y.; Chen, J. Spatial and temporal patterns and risk assessment of carbon source and sink balance of land use in watersheds of arid zones in China—A case study of Bosten Lake basin. Ecol. Indic. 2023, 157, 111308. [Google Scholar] [CrossRef]
- Dai, F.; Zhan, M.; Chen, X.; Yang, X.; Ouyang, P. Spatiotemporal Evolution and Driving Factors of Land Use Carbon Emissions in Jiangxi Province, China. Forests 2024, 15, 1825. [Google Scholar] [CrossRef]
- Li, L.; Li, J.; Peng, L.; Wang, X.; Sun, S. Spatiotemporal evolution and influencing factors of land-use emissions in the Guangdong-Hong Kong-Macao Greater Bay Area using integrated nighttime light datasets. Sci. Total Environ. 2023, 893, 164723. [Google Scholar] [CrossRef]
- Jin, Y.; Zhang, K.; Li, D.; Wang, S.; Liu, W. Analysis of the spatial–temporal evolution and driving factors of carbon emission efficiency in the Yangtze River economic Belt. Ecol. Indic. 2024, 165, 112092. [Google Scholar] [CrossRef]
- Yuan, D.; Zhang, L.; Fan, Y.; Yang, R. Investigating spatio-temporal variations and contributing factors of land use-related carbon emissions in the Beijing-Tianjin-Hebei Region, China. Sci. Rep. 2024, 14, 18976. [Google Scholar] [CrossRef]
- Zhang, Y.; Li, J.; Liu, S.; Zhou, J. Spatiotemporal Effects and Optimization Strategies of Land-Use Carbon Emissions at the County Scale: A Case Study of Shaanxi Province, China. Sustainability 2024, 16, 4104. [Google Scholar] [CrossRef]
- Meng, Q.; Zheng, Y.; Liu, Q.; Li, B.; Wei, H. Analysis of Spatiotemporal Variation and Influencing Factors of Land-Use Carbon Emissions in Nine Provinces of the Yellow River Basin Based on the LMDI Model. Land 2023, 12, 437. [Google Scholar] [CrossRef]
- An, Y.; Zhou, D.; Yu, J.; Shi, X.; Wang, Q. Carbon emission reduction characteristics for China’s manufacturing firms: Implications for formulating carbon policies. J. Environ. Manag. 2021, 284, 112055. [Google Scholar] [CrossRef] [PubMed]
- Liu, H.; Yin, W.; Yan, F.; Cai, W.; Du, Y.; Wu, Y. A coupled STIRPAT-SD model method for land-use carbon emission prediction and scenario simulation at the county level. Environ. Impact Assess. Rev. 2024, 108, 107595. [Google Scholar] [CrossRef]
- Zhai, L.; Cheng, S.; Sang, H.; Xie, W.; Gan, L.; Wang, T. Remote sensing evaluation of ecological restoration engineering effect: A case study of the Yongding River Watershed, China. Ecol. Eng. 2022, 182, 106724. [Google Scholar] [CrossRef]
- Liu, L.; Xun, L.; Wang, Z.; Liu, H.; Huang, Y.; Bedra, K.B. Peak Carbon Dioxide Emissions Strategy Based on the Gray Model between Carbon Emissions and Urban Spatial Expansion for a Built-Up Area. Appl. Sci. 2022, 13, 187. [Google Scholar] [CrossRef]
- Zheng, F.; Gan, Y.; Yang, L.; Wu, J. Impact of Climate Change on the Major Eco-Hydrological Parameters in the Dongting Lake Basin. Appl. Sci. 2023, 13, 9515. [Google Scholar] [CrossRef]
- Zhao, J.; Liu, S.; Wang, Z.; Gao, H.; Feng, S.; Wei, B.; Hou, Z.; Xiao, F.; Jing, L.; Liao, X. The Impact of Land Use and Landscape Pattern on Ecosystem Services in the Dongting Lake Region, China. Remote Sens. 2023, 15, 2228. [Google Scholar] [CrossRef]
- Fu, F.; Deng, S.; Wu, D.; Liu, W.; Bai, Z. Research on the spatiotemporal evolution of land use landscape pattern in a county area based on CA-Markov model. Sustain. Cities Soc. 2022, 80, 103760. [Google Scholar] [CrossRef]
- Wang, J.; Wang, J.; Zhang, M.; Zhang, J. Optimization of land use structure based on an improved multi-objective genetic algorithm: A case study in a large-scale opencast coal mine area, China. Environ. Dev. Sustain. 2024. [Google Scholar] [CrossRef]
- Yu, Z.; Chen, L.; Tong, H.; Chen, L.; Zhang, T.; Li, L.; Yuan, L.; Xiao, J.; Wu, R.; Bai, L.; et al. Spatial correlations of land-use carbon emissions in the Yangtze River Delta region: A perspective from social network analysis. Ecol. Indic. 2022, 142, 109147. [Google Scholar] [CrossRef]
- Alajmi, R.G. Factors that impact greenhouse gas emissions in Saudi Arabia: Decomposition analysis using LMDI. Energy Policy 2021, 156, 112454. [Google Scholar] [CrossRef]
- Yang, Y.; Li, H. Monitoring spatiotemporal characteristics of land-use carbon emissions and their driving mechanisms in the Yellow River Delta: A grid-scale analysis. Environ. Res. 2022, 214, 114151. [Google Scholar] [CrossRef] [PubMed]
- IPCC. IPCC Guidelines for National Greenhouse Gas Inventories. 2006. Available online: https://www.ipcc-nggip.iges.or.jp/public/2006gl/ (accessed on 12 March 2024).
- Fan, M.; Lal, R.; Zhang, H.; Margenot, A.J.; Wu, J.; Wu, P.; Zhang, L.; Yao, J.; Chen, F.; Gao, C. Variability and determinants of soil organic matter under different land uses and soil types in eastern China. Soil. Tillage Res. 2020, 198, 104544. [Google Scholar] [CrossRef]
- Lefever, D.W. Measuring Geographic Concentration by Means of the Standard Deviational Ellipse. Am. J. Sociol. 1926, 32, 88–94. [Google Scholar] [CrossRef]
- Kumari, M.; Sarma, K.; Sharma, R. Using Moran’s I and GIS to study the spatial pattern of land surface temperature in relation to land use/cover around a thermal power plant in Singrauli district, Madhya Pradesh, India. Remote Sens. Appl. Soc. Environ. 2019, 15, 100239. [Google Scholar] [CrossRef]
- Wang, S.; Huang, Y.; Zhou, Y. Spatial spillover effect and driving forces of carbon emission intensity at the city level in China. J. Geogr. Sci. 2019, 29, 231–252. [Google Scholar] [CrossRef]
- He, Y.; Xing, Y.; Zeng, X.; Ji, Y.; Hou, H.; Zhang, Y.; Zhu, Z. Factors influencing carbon emissions from China’s electricity industry: Analysis using the combination of LMDI and K-means clustering. Environ. Impact Assess. Rev. 2022, 93, 106724. [Google Scholar] [CrossRef]
- Tan, J.; Liu, Q.; Tang, X.; Tan, X.; Liu, P. Spatial and Temporal Evolution of Carbon Emissions from Land Use and Its Influencing Factors Based on LMDI Model: A Case Study of the Dongting Lake Area. Areal Res. Dev. 2024, 43, 160–166. [Google Scholar]
- Xiong, S.; Yang, F.; Li, J.; Xu, Z.; Ou, J. Temporal-spatial variation and regulatory mechanism of carbon budgets in territorial space through the lens of carbon balance: A case of the middle reaches of the Yangtze River urban agglomerations, China. Ecol. Indic. 2023, 154, 110885. [Google Scholar] [CrossRef]
- Xu, Q.; Li, K. Land Use Carbon Emission Estimation and Simulation of Carbon-Neutral Scenarios Based on System Dynamics in Coastal City: A Case Study of Nantong, China. Land 2024, 13, 1083. [Google Scholar] [CrossRef]
- Wang, Q.; Yang, C.; Wang, M.; Zhao, L.; Zhao, Y.; Zhang, Q.; Zhang, C. Decoupling analysis to assess the impact of land use patterns on carbon emissions: A case study in the Yellow River Delta efficient eco-economic zone, China. J. Clean. Prod. 2023, 412, 137415. [Google Scholar] [CrossRef]
- Xiong, S.; Yang, F. Ecological resilience in water-land transition zones: A case study of the Dongting Lake region, China. Ecol. Indic. 2024, 166, 112284. [Google Scholar] [CrossRef]
- An, X.; Jin, W.; Long, X.; Chen, S.; Qi, S.; Zhang, M. Spatial and temporal evolution of carbon stocks in Dongting Lake wetlands based on remote sensing data. Geocarto Int. 2022, 37, 14983–15009. [Google Scholar] [CrossRef]
- Cox, P.M.; Williamson, M.S.; Friedlingstein, P.; Jones, C.D.; Raoult, N.; Rogelj, J.; Varney, R.M. Emergent constraints on carbon budgets as a function of global warming. Nat. Commun. 2024, 15, 1885. [Google Scholar] [CrossRef]
- Liu, J.; Shi, T.; Huang, L. A Study on the Impact of Industrial Restructuring on Carbon Dioxide Emissions and Scenario Simulation in the Yellow River Basin. Water 2022, 14, 3833. [Google Scholar] [CrossRef]
- Fan, Y.; Wang, Y.; Han, R.; Li, X. Spatial-Temporal Dynamics of Carbon Budgets and Carbon Balance Zoning: A Case Study of the Middle Reaches of the Yangtze River Urban Agglomerations, China. Land 2024, 13, 297. [Google Scholar] [CrossRef]
- Naz, F.; Tanveer, A.; Karim, S.; Dowling, M. The decoupling dilemma: Examining economic growth and carbon emissions in emerging economic blocs. Energy Econ. 2024, 138, 107848. [Google Scholar] [CrossRef]
- Zheng, X.; Wang, R.; He, Q. A city-scale decomposition and decoupling analysis of carbon dioxide emissions: A case study of China. J. Clean. Prod. 2019, 238, 117824. [Google Scholar] [CrossRef]
- Li, S.; Yao, L.; Zhang, Y.; Zhao, Y.; Sun, L. China’s provincial carbon emission driving factors analysis and scenario forecasting. Environ. Sustain. Indic. 2024, 22, 100390. [Google Scholar] [CrossRef]
- Zeng, S.; Jin, G.; Tan, K.; Liu, X. Can low-carbon city construction reduce carbon intensity? Empirical evidence from low-carbon city pilot policy in China. J. Environ. Manag. 2023, 332, 117363. [Google Scholar] [CrossRef]
- Wu, X.; Zhong, S.; Chen, G.; Wu, C.; Han, J.; Qian, Z. Influence of land use intensity on urban carbon efficiency under a carbon neutrality target: Evidence from the Yangtze River Delta urban agglomeration, China. Environ. Impact Assess. Rev. 2025, 110, 107689. [Google Scholar] [CrossRef]
- Dong, L. Spatio-temporal evolution and prediction of carbon balance in the Yellow River Basin and zoning for low-carbon economic development. Sci. Rep. 2024, 14, 14385. [Google Scholar] [CrossRef] [PubMed]
- Wang, X.; Li, Z.; Kee, T. Spatial and temporal correlation between green space landscape pattern and carbon emission—Three major coastal urban agglomerations in China. Urban Clim. 2024, 58, 102222. [Google Scholar] [CrossRef]


| Territorial Space Carbon Source–Sink Indicator Classification System | Corresponding Territorial Space Carbon Emission–Carbon Sequestration Activities | ||
|---|---|---|---|
| Territorial Space Carbon Source–Sink Categories | Land Use Type (LUCC Secondary Classification Standard) | ||
| Carbon sources: production–living space | Agricultural production space | Paddy fields, dry farmland | Carbon emissions from agricultural production processes |
| Industrial-mining production space | Industrial-mining construction land | Carbon emissions from energy consumption | |
| Agricultural living space | Rural residential areas | ||
| Urban living space | Urban construction land | ||
| Carbon sinks: ecological space | Forest ecological space | Forest land, shrubland, sparse forest land, other forest land | Carbon sequestration from forests |
| Grassland ecological space | High-coverage grassland, medium-coverage grassland, low-coverage grassland | Carbon sequestration from grasslands | |
| Water ecological space | Rivers, lakes, reservoirs, ponds, tidal flats, beach land | Carbon sequestration from water bodies | |
| Potential ecological space | Wetlands, bare land, bare rock areas | Carbon sequestration from unused land | |
| Energy Type | Carbon Emission Factor (tC/tce·a) |
|---|---|
| Raw coal | 0.5127 |
| Washed coal | 0.6292 |
| Coke | 0.7801 |
| Natural gas | 0.5390 |
| Crude oil | 0.8237 |
| Gasoline | 0.7977 |
| Kerosene | 0.8273 |
| Diesel | 0.8443 |
| Fuel oil | 0.8647 |
| Liquefied petroleum gas | 0.8458 |
| Territorial Space Carbon Sink Type | Carbon Sequestration Coefficient (tC/hm2·a) |
|---|---|
| Forest ecological land | −0.0586 |
| Grassland ecological land | −0.0210 |
| Water ecological land | −0.0459 |
| Potential ecological land | −0.0005 |
| Driving Factor | Formula | Unit |
|---|---|---|
| Carbon emission intensity per unit of territorial space () | Ci/Li (carbon emissions per unit of land) | t/ha |
| Land-use structure () | Li/L (proportion of land use) | ha/ha |
| Land area per unit GDP () | L/G (land area per unit GDP) | ha/10,000 yuan |
| Per capita GDP () | G/P (per capita GDP) | yuan/person |
| Population size (P) | - | 10,000 people |
| Year (km2) Period (%) | Production Space | Living Space | Ecological Space | |||||
|---|---|---|---|---|---|---|---|---|
| Agricultural Production Space | Industrial-Mining Production Space | Agricultural Living Space | Urban Living Space | Forest Ecological Space | Grassland Ecological Space | Water Ecological Space | Potential Ecological Space | |
| 2005 | 30266.89 | 177.09 | 1270.95 | 643.76 | 29126.38 | 1036.56 | 7873.81 | 848.46 |
| 2010 | 29527.30 | 389.29 | 1259.85 | 958.77 | 29065.38 | 980.12 | 7919.43 | 1143.94 |
| 2015 | 29312.07 | 687.47 | 1259.92 | 984.43 | 28961.47 | 975.65 | 7919.17 | 1143.36 |
| 2020 | 29320.22 | 1034.54 | 1289.27 | 994.39 | 28793.33 | 974.60 | 7711.35 | 1120.79 |
| 2005–2010 | −0.49 | 23.97 | −0.17 | 9.79 | −0.04 | −1.09 | 0.12 | 6.97 |
| 2010–2015 | −0.15 | 15.32 | 0.00 | 0.54 | −0.07 | −0.09 | 0.00 | −0.01 |
| 2015–2020 | 0.01 | 10.10 | 0.47 | 0.20 | −0.12 | −0.02 | −0.52 | −0.39 |
| 2005–2020 | −0.21 | 32.28 | 0.10 | 3.63 | −0.08 | −0.40 | −0.14 | 2.14 |
| Year | 2005 | 2010 | 2015 | 2020 |
|---|---|---|---|---|
| Moran’s I | 0.60 | 0.65 | 0.66 | 0.66 |
| Z value | 45.20 | 49.00 | 49.69 | 50.09 |
| p value | 0.00 | 0.00 | 0.00 | 0.00 |
Disclaimer/Publisher’s Note: The statements, opinions and data contained in all publications are solely those of the individual author(s) and contributor(s) and not of MDPI and/or the editor(s). MDPI and/or the editor(s) disclaim responsibility for any injury to people or property resulting from any ideas, methods, instructions or products referred to in the content. |
© 2025 by the authors. Licensee MDPI, Basel, Switzerland. This article is an open access article distributed under the terms and conditions of the Creative Commons Attribution (CC BY) license (https://creativecommons.org/licenses/by/4.0/).
Share and Cite
Xiong, S.; Xu, Z.; Yang, F.; Gu, C. Spatiotemporal Variation and Driving Mechanisms of Carbon Budgets in Territorial Space for Typical Lake-Intensive Regions in China: A Case Study of the Dongting Lake Region. Appl. Sci. 2025, 15, 3733. https://doi.org/10.3390/app15073733
Xiong S, Xu Z, Yang F, Gu C. Spatiotemporal Variation and Driving Mechanisms of Carbon Budgets in Territorial Space for Typical Lake-Intensive Regions in China: A Case Study of the Dongting Lake Region. Applied Sciences. 2025; 15(7):3733. https://doi.org/10.3390/app15073733
Chicago/Turabian StyleXiong, Suwen, Zhenni Xu, Fan Yang, and Chuntian Gu. 2025. "Spatiotemporal Variation and Driving Mechanisms of Carbon Budgets in Territorial Space for Typical Lake-Intensive Regions in China: A Case Study of the Dongting Lake Region" Applied Sciences 15, no. 7: 3733. https://doi.org/10.3390/app15073733
APA StyleXiong, S., Xu, Z., Yang, F., & Gu, C. (2025). Spatiotemporal Variation and Driving Mechanisms of Carbon Budgets in Territorial Space for Typical Lake-Intensive Regions in China: A Case Study of the Dongting Lake Region. Applied Sciences, 15(7), 3733. https://doi.org/10.3390/app15073733