Article

Effects of Structural Dynamic Characteristics on Soil–Structure Interaction (SSI) Analysis of High-Frequency-Dominant Seismic Excitation

Department of Civil and Environmental Engineering, Dankook University, Yongin-si 16890, Republic of Korea
*
Author to whom correspondence should be addressed.
Appl. Sci. 2025, 15(7), 3679; https://doi.org/10.3390/app15073679
Submission received: 28 February 2025 / Revised: 22 March 2025 / Accepted: 24 March 2025 / Published: 27 March 2025

Abstract

:
This study investigates how structural dynamic characteristics affect the response to high-frequency dominant seismic excitations, using a 3D numerical analysis considering soil–structure interaction (SSI). For this purpose, an SSI analysis was conducted using the finite element analysis software LS-DYNA, incorporating four representative Korean geotechnical characteristics and the 2016 Gyeongju earthquake, characterized by dominant high-frequency components. A comparison was conducted between a fixed-end model without considering SSI and an embedded model with SSI for a high-rise structure (40 stories) with low natural frequencies, and a low-rise structure (5 stories) with high natural frequencies. The analysis focused on key dynamic responses, including the natural frequency, frequency of maximum response, and maximum relative displacement of the structures, to identify differences in the SSI effect based on the structures’ dynamic characteristics and the soil types. The analysis generally revealed that the SSI effect lowers the natural frequencies of structures and increases the damping effect. It was also found that depending on the match between the dominant frequency range of the seismic excitations and the range of the structure’s natural frequencies, larger dynamic responses were calculated when SSI was considered, suggesting that it may be necessary to consider SSI for conservative design results.

1. Introduction

The increasing frequency of earthquakes worldwide has brought significant attention to the importance of soil–structure interaction (SSI) in seismic design. SSI is described as a dynamic interaction where the inertial forces of a structure affect the surrounding soil, and the deformed soil, in turn, influences the structural behavior [1]. This interaction modifies the structure’s natural frequencies and damping ratios, making predicting its dynamic responses more complicated. Depending on the frequency components of seismic waves, this can also result in resonance, requiring careful analysis to consider these effects [2,3].
Many countries’ current seismic design standards recommend using fixed-end models, based on multiple previous research studies showing that ignoring SSI produces conservative design results, ensuring safer structural systems. Internationally, only a few design codes require the use of an SSI analysis. Moreover, differences in application criteria and analysis methods across the design codes also create challenges in achieving consistency within the design process [4,5].
Previous studies have attempted to overcome the limitations of fixed-end models by incorporating SSI; however, most analyses have been limited to two-dimensional approaches or simplified the foundation soil using spring elements, failing to fully capture the complex interactions between the superstructure, basement, and soil [6,7,8,9]. A two-dimensional analysis cannot capture three-dimensional dynamic effects, such as torsional displacement caused by the mismatch between the structural centroid and the center of stiffness. Previous studies have demonstrated that 2D models are inadequate for asymmetric 3D conditions, highlighting the necessity of a 3D finite element analysis [10].
In this study, three-dimensional numerical analyses were performed using LS-DYNA R12.0.0, a general-purpose finite element analysis software, to overcome the limitations of previous studies. The input ground excitation was the 2016 Gyeongju earthquake in Korea, dominated by high-frequency components [11]. Four typical types of soil in Korea, Fill (FI), Alluvial Soil (AS), Weathered Soil (WS), and Weathered Rock (WR), were considered. The target structures were selected as a high-rise structure with 40 stories and a low-rise structure with 5 stories, and the effects of SSI on the dynamic response of structures with high natural frequencies (low-rise structures) and low natural frequencies (high-rise structures) were comparatively analyzed.

2. FE Modeling and SSI Analysis Method

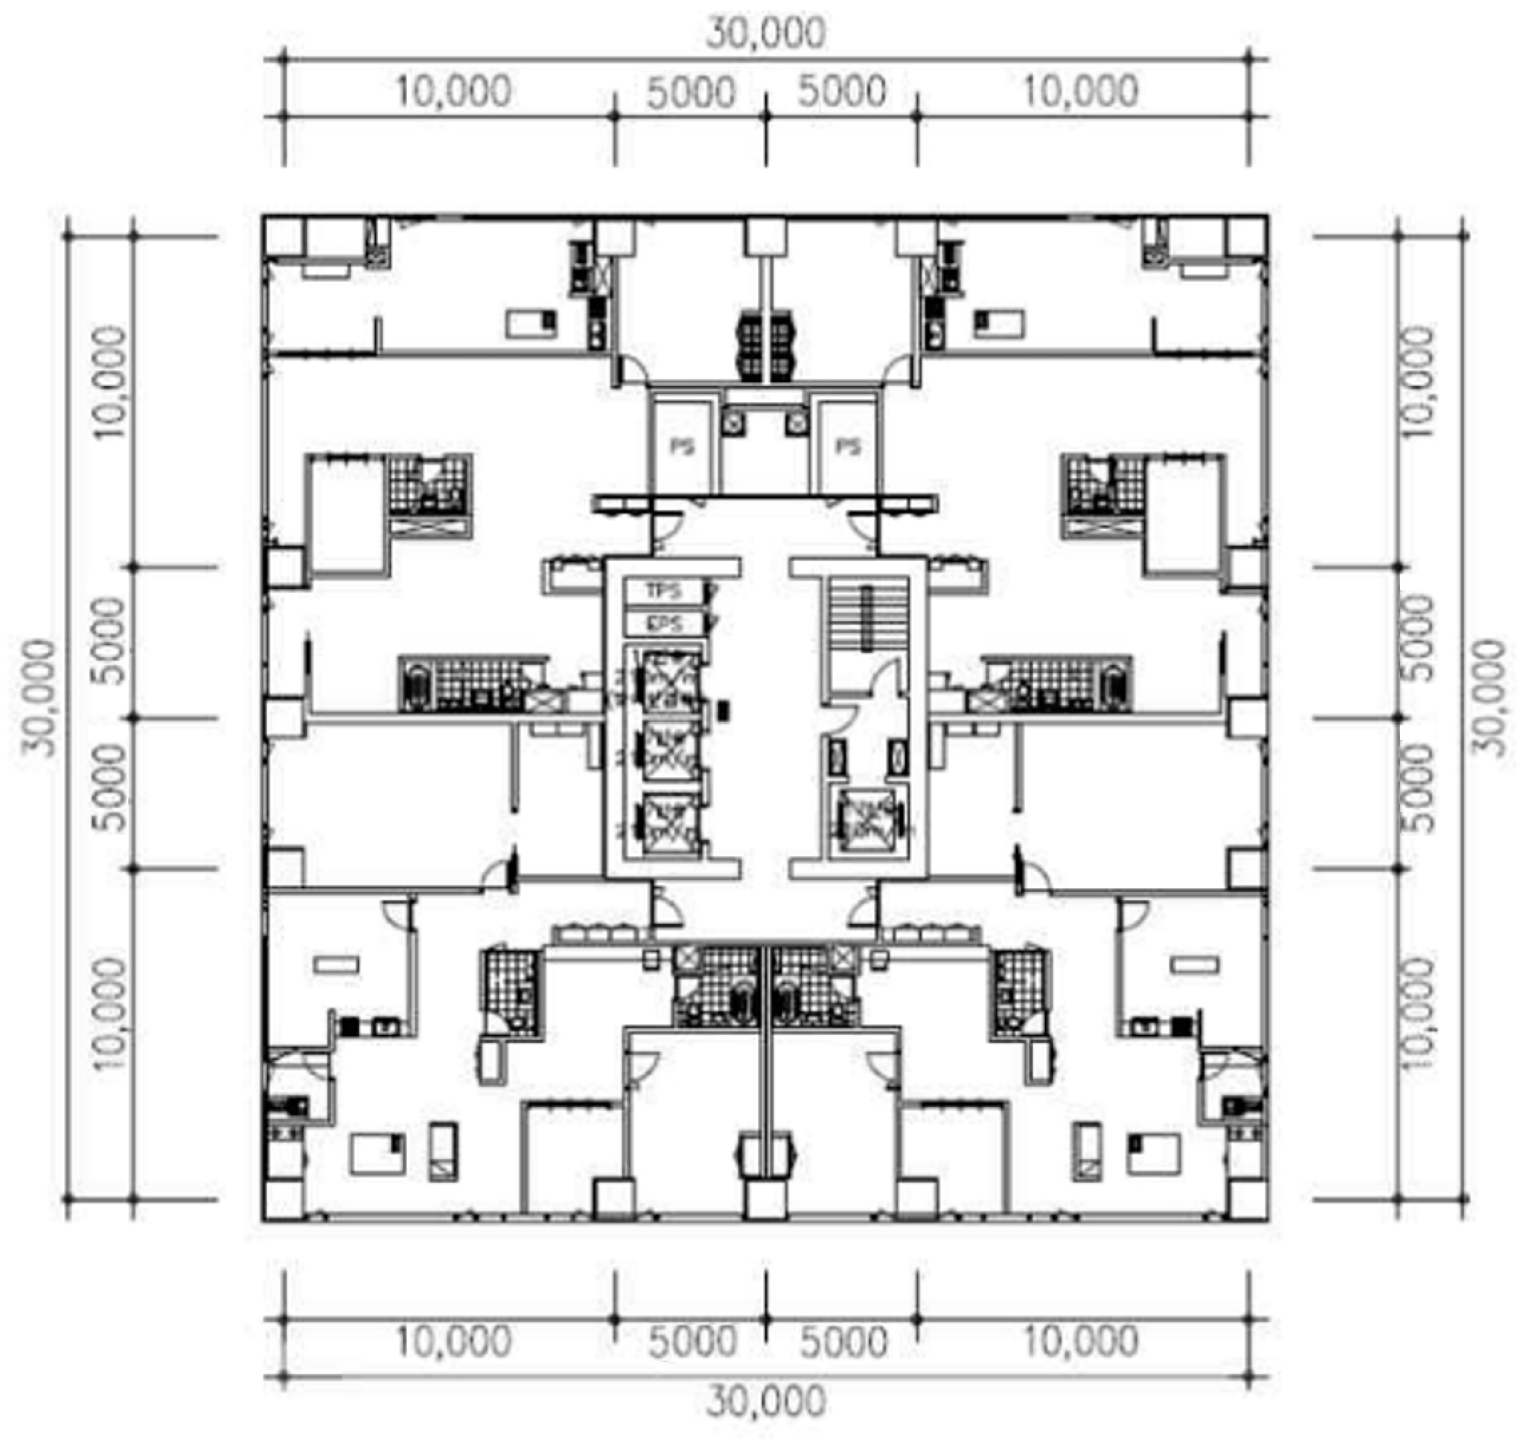
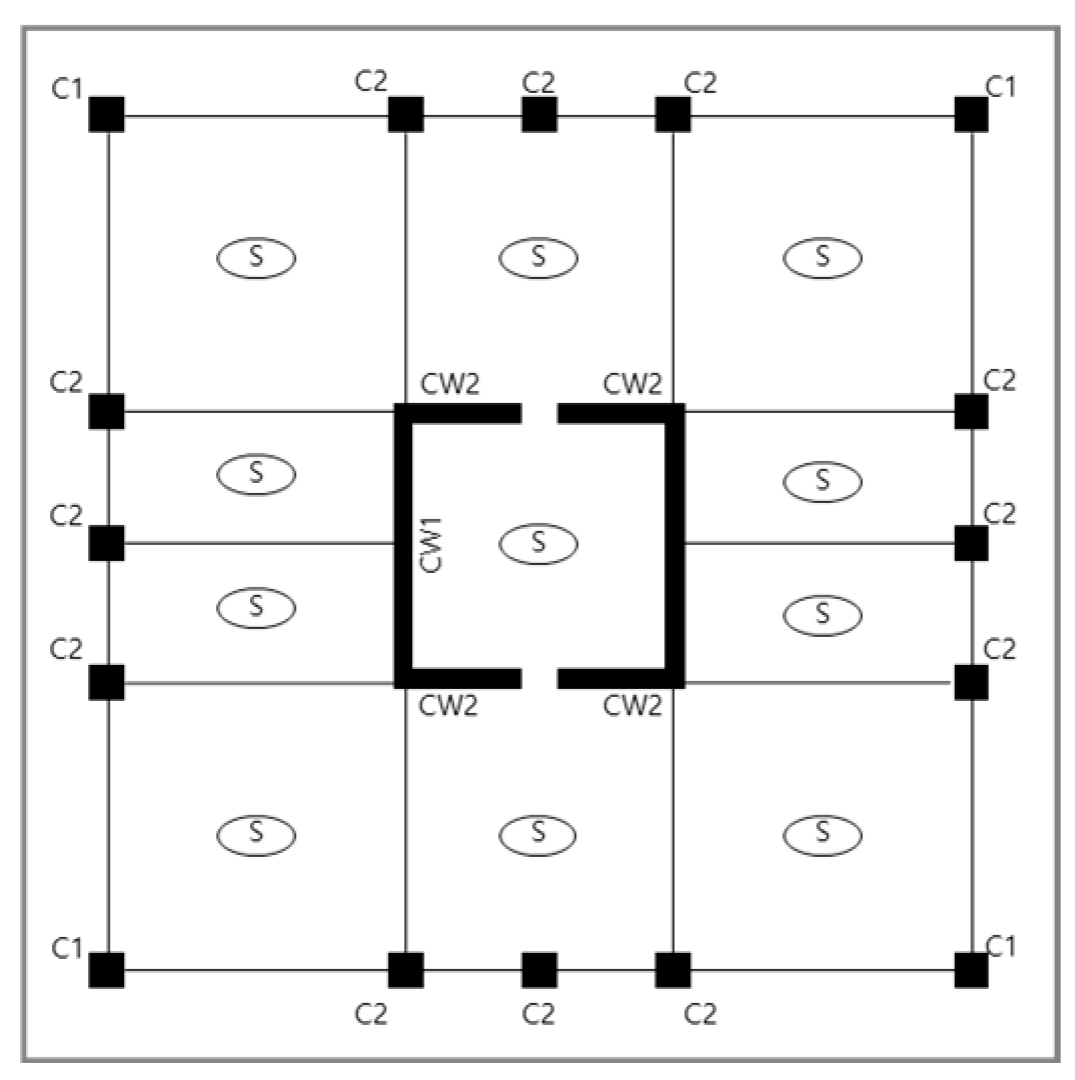
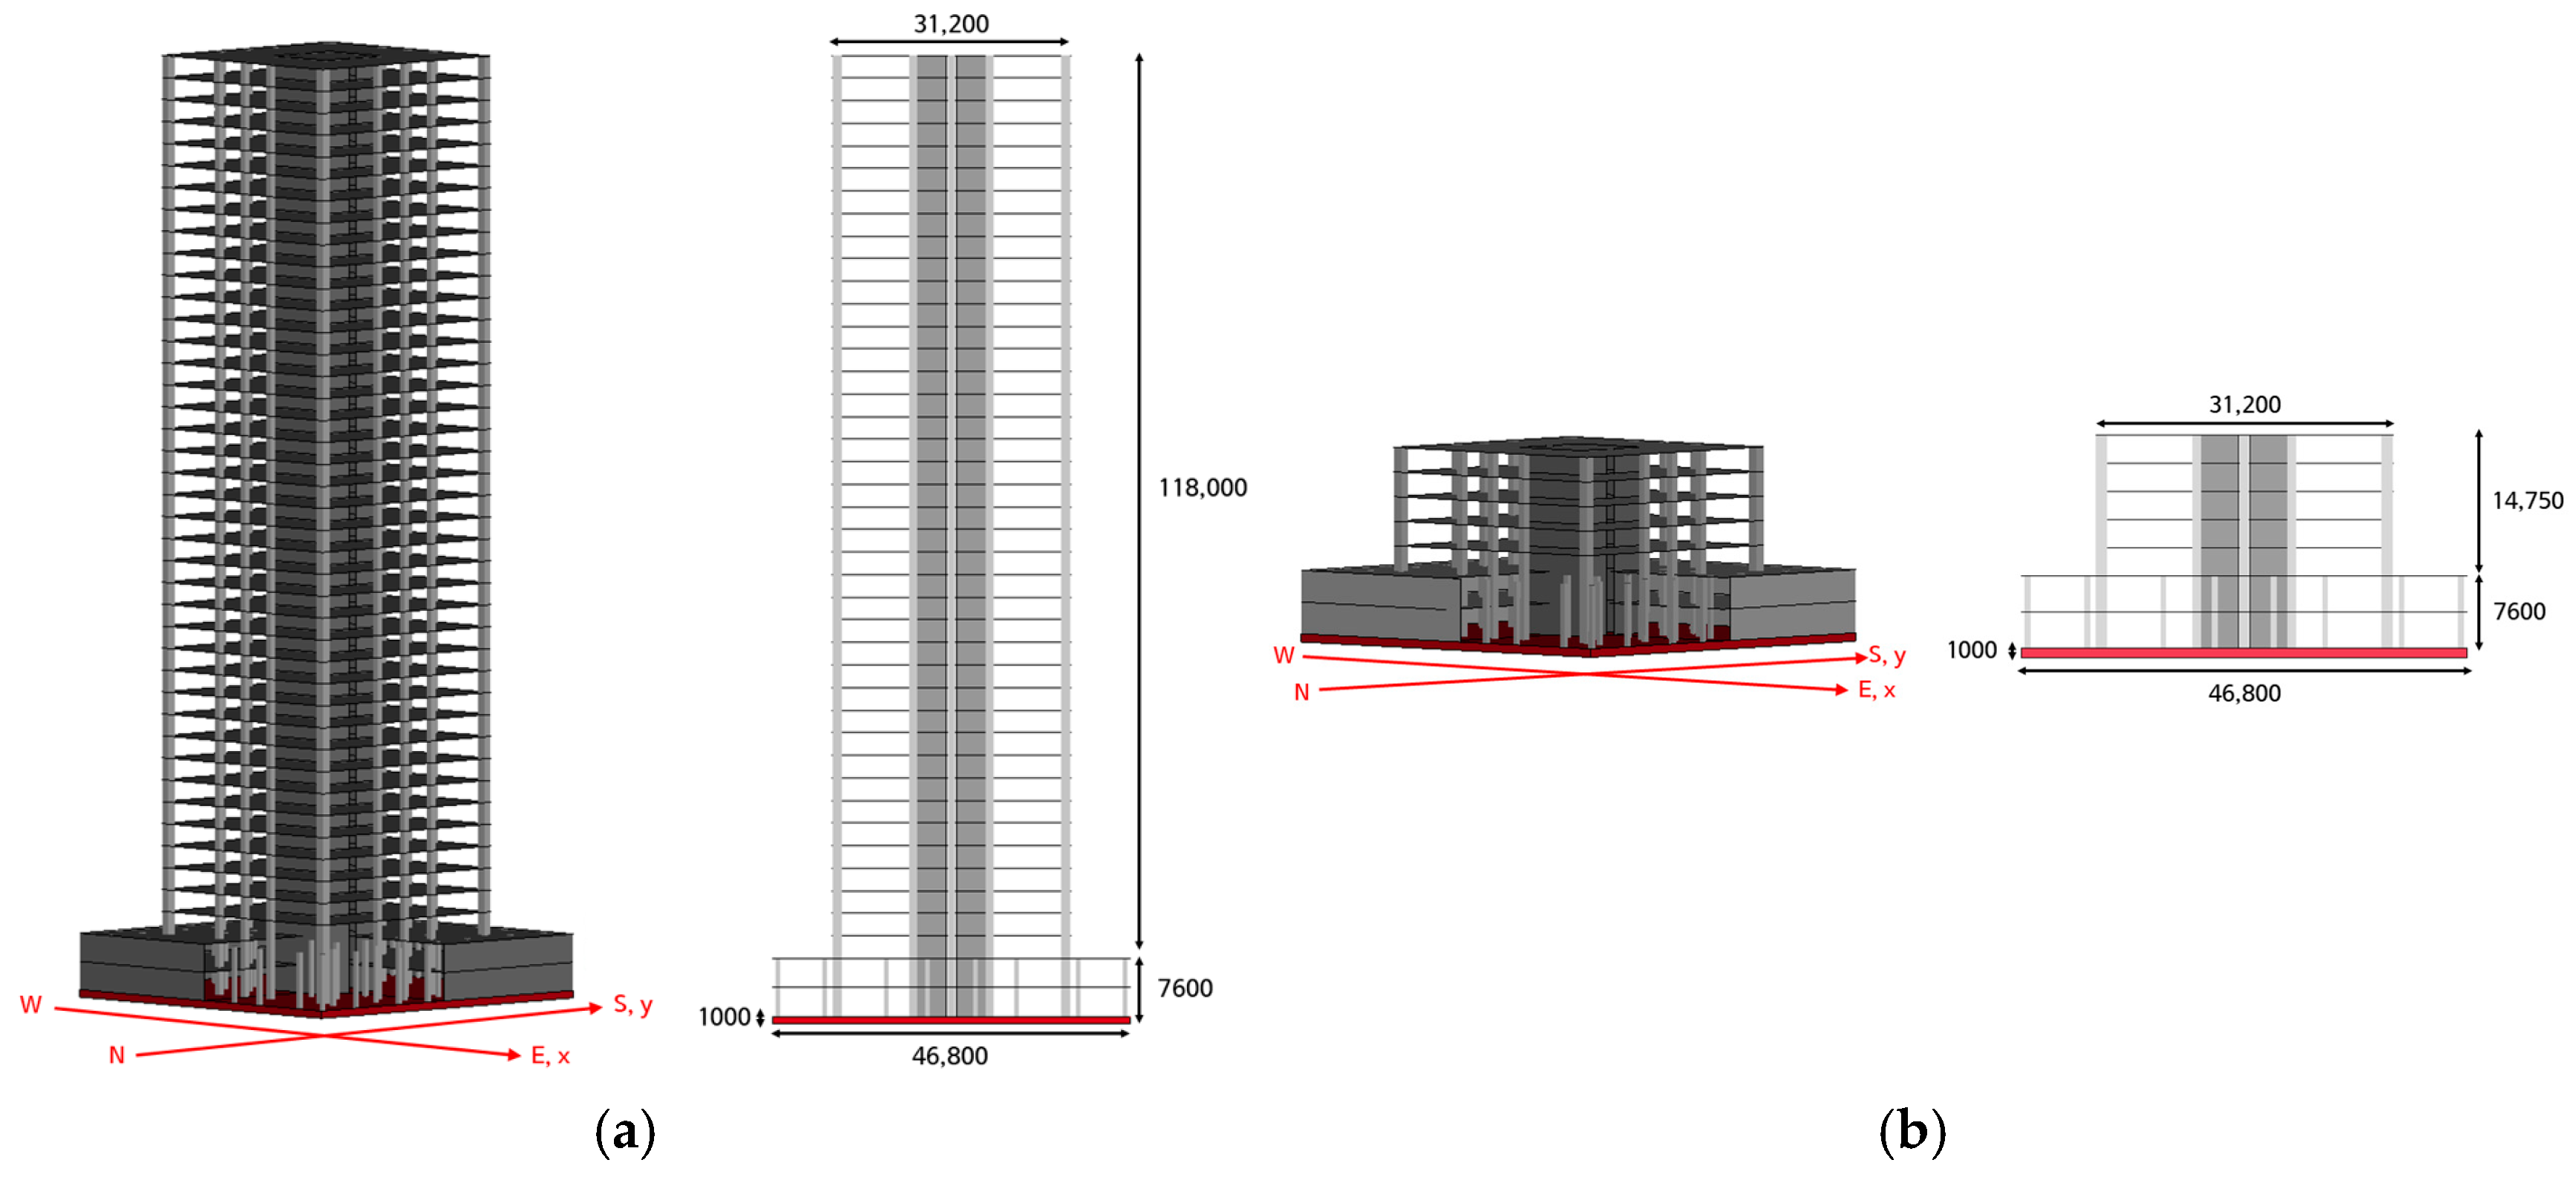
2.1. Modeling of the Structure

Finite element (FE) models of 5-story and 40-story buildings were constructed. The geometry of the superstructures is shown in Figure 1 and Figure 2, and those RC flat slab structures were based on the drawings provided by Ahn [12]. The structural configuration was commonly applied to both low-rise and high-rise structures. The dimensions and the strength of the main members are listed in Table 1. The substructure of both the low-rise and high-rise structures consists of two basement levels (Figure 3), and Table 2 shows the dimensions and strength of the substructure.
An SSI analysis using the direct method, a method that integrates the ground, foundation, and structure into a single system and directly analyzes the interaction between each component through continuum modeling, requires a long computation time due to the large number of interaction nodes [13]. To reduce computation costs, the simplified modeling technique using equivalent beam elements proposed by Jang et al. [14] was applied for the modeling of columns (Equation (1)), and the rule of mixtures (RoM) concept proposed by Zulkefli et al. [15] was applied for the modeling of the slabs and walls with shell elements (Equation (2)). Finally, the equivalent material properties of the target structures were calculated based on the values presented in Table 1 and Table 2. The calculation results in Table 3 and Table 4, respectively, show the material properties for columns (*MAT_CONCRETE_BEAM) and slabs and walls (*MAT_ELASTIC). Table 5 provides the sectional properties of the columns.
E m = E c c 1 + c × n A s A g
E n e w   a p p r o a c h = E c o n c r e t e V c o n c r e t e V t o t a l + E s t e e l V s t e e l V t o t a l
The 3D-FE models were constructed, as shown in Figure 4, using the drawings of Figure 2 and Figure 3. The eigenvalue analysis results acquired from the fixed-end model are presented in Table 6, where the foundation was assumed to be a 1000 mm thick rigid foundation.

2.2. Modeling of the Soil for SSI Analysis

Shear wave velocity is an important input parameter for calculating soil and structures’ seismic responses. The process of identifying different geotechnical material properties for each soil layer and simplifying the spatial inhomogeneity of shear wave velocity that varies with depth within each layer to a single value requires geotechnical expertise. Additionally, it is necessary to calculate quantitative values based on data that reflect the topographical and geological characteristics of the target area. Considering these complexities, numerical evaluation and prediction are more efficient when using a single stiffness value for each type of geotechnical layer rather than directly applying the shear wave velocity of the soil. Sun et al. [16] analyzed field-measured seismic wave data from 183 sites in Korea, and reclassified subsurface soils and rocks into five geotechnical types: Fill (FI), Alluvial Soil (AS), Weathered Soil (WS), Weathered Rock (WR), and bedrock (BR). Also, they proposed standard values of shear wave velocity for each soil type.
This study adopted four representative soil types (FI, AS, WS, and WR), excluding bedrock for SSI analyses. The target soils were simplified as a single soil layer for modeling convenience, and the material properties proposed by Kim et al. [17] were applied as the input parameters of *MAT_MOHR_COULOMB (Table 7). The Mohr–Coulomb model is a constitutive model widely used in earthquake engineering to simulate dynamic soil behavior under seismic loading conditions. In this study, the selection of the Mohr–Coulomb model for soil modeling was based on its recognized application in previous seismic analyses and SSI studies [18,19].
The soil model was constructed for a finite domain, and perfectly matched layer (PML) elements were applied around the soil boundaries to reduce computational costs. PML is a boundary condition that absorbs waves of all frequencies incident at all angles and is useful for modeling infinite domains by reducing the size to a finite region [20,21,22]. The material constants of the PML elements were set identically to those of the boundary-adjacent soil material (*MAT_MOHR_COULOMB) to satisfy the requirements. Additionally, to ensure the proper implementation of the PML, the following conditions were applied: (1) The PML material should form a parallelepiped box around the bounded domain, and the box should be aligned with the coordinate axes; (2) the outer boundary of the PML should be fixed; (3) the PML layer may typically have 5–8 elements through its depth; and (4) the PML material should not be subjected to any static load [23]. The size of the soil domain was set to twice the width of the foundation slab, with PML elements surrounding the soil region. Figure 5 shows the embedded FE models with finite domain soil and PML boundaries, and the natural frequencies calculated from the embedded model are listed in Table 8. As shown in Table 8, it is confirmed that considering the stiffness of the ground results in lower natural frequencies compared to the values calculated using the fixed-end models.

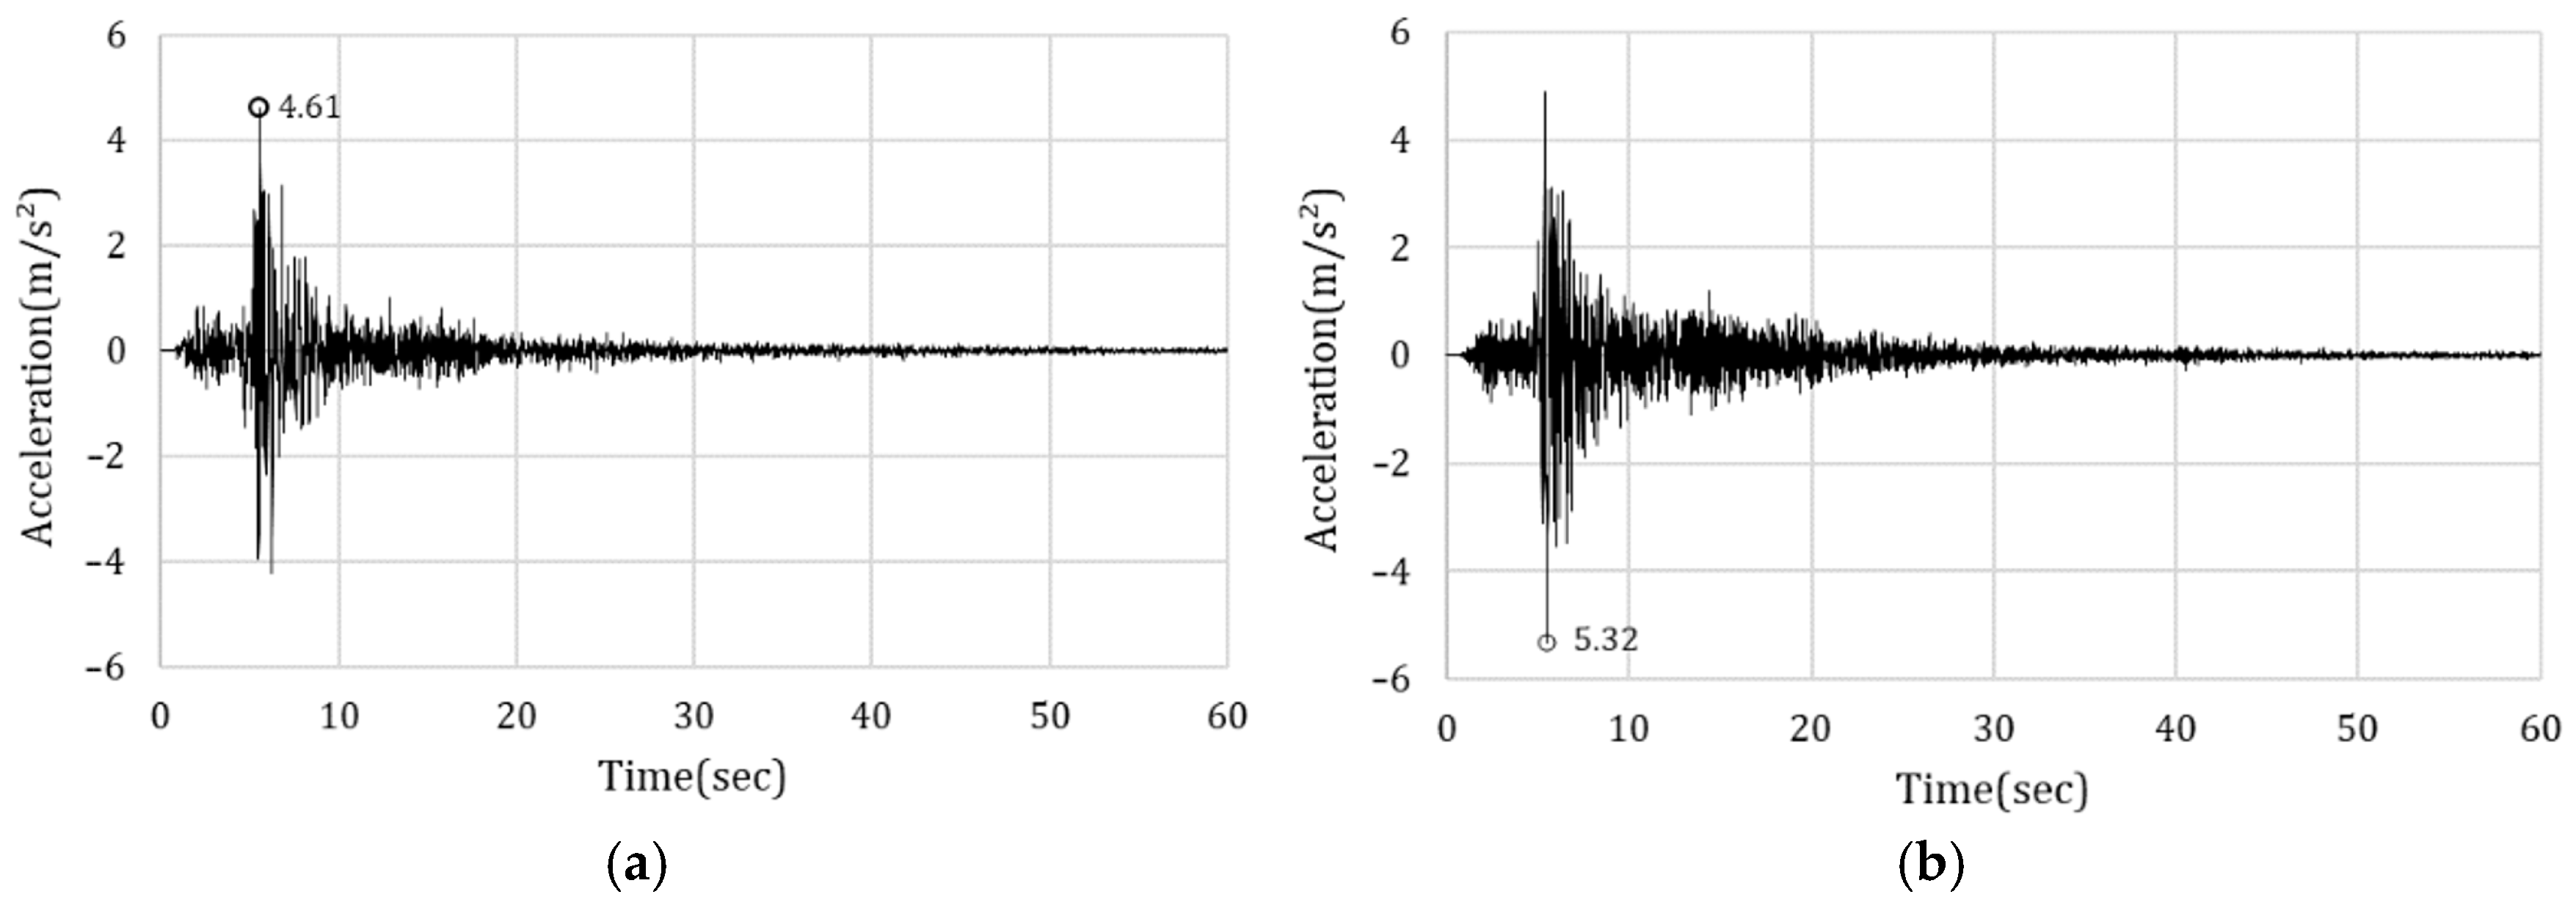
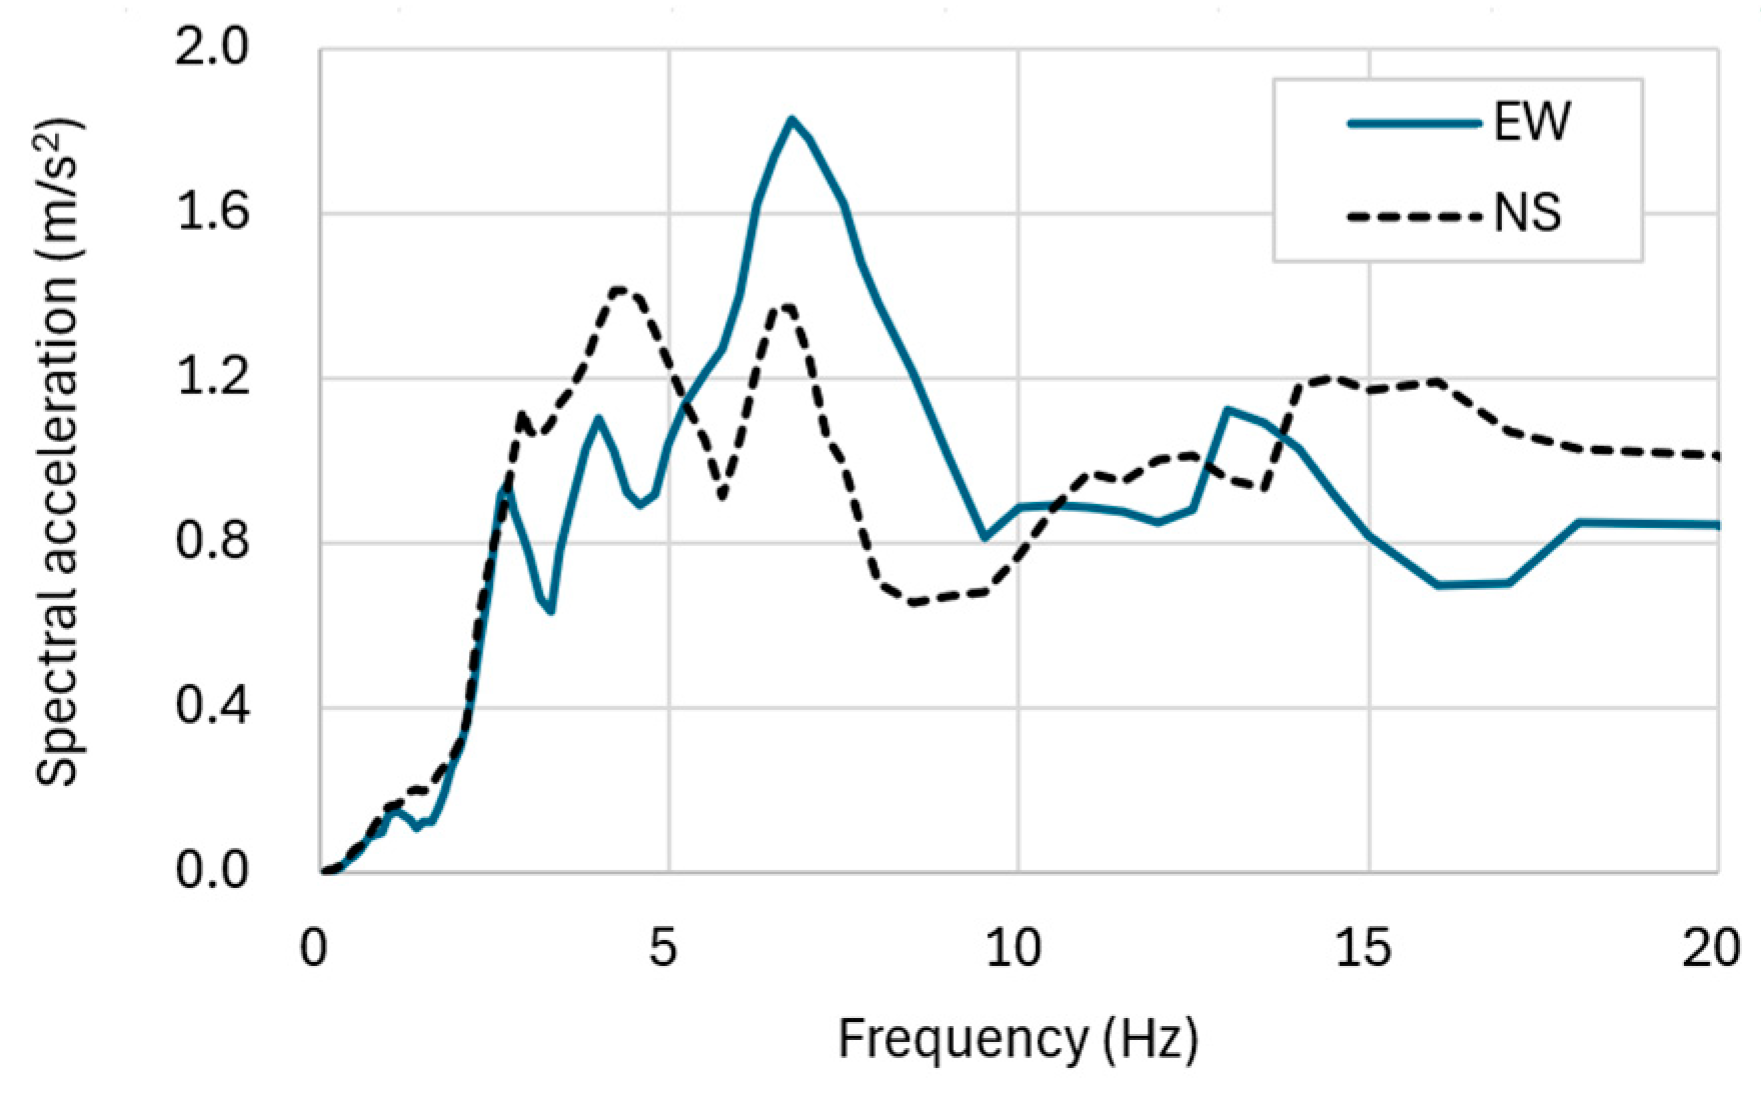
2.3. Characteristics of the Input Seismic Motion and SSI Analysis Procedure

In this study, the Gyeongju earthquake, which occurred on 12 September 2016, in South Korea, with a magnitude of 5.8, was utilized. This is the largest earthquake observed in South Korea since full-scale seismic instrumentation began in 1978. The seismic waves were recorded at the DAG2 (Daegu) station, the observation point closest to the epicenter, and Figure 6 shows the acceleration time history. The peak acceleration of this earthquake was approximately 4.61 m/s2 in the east–west direction and 5.32 m/s2 in the north–south direction [24].
The shallow soil layers in Korea, with bedrock depths of 15 to 30 m, exhibit characteristics that amplify seismic responses in the high-frequency range. In particular, the Gyeongju earthquake used in this study is dominated by high-frequency components, as shown in Figure 7, resulting in a high seismic response in the 2.5 Hz to 10 Hz range [1].
The Gyeongju earthquake wave was used to conduct free-field and SSI analyses following the procedure outlined below. First, the seismic waves presented in Figure 6 were assumed to be the response at the bedrock. For the free-field analysis, the seismic waves were applied at the base of the four soil types (FI, AS, WS, and WR) to calculate the free-field response at the center of the exposed foundation level of the structure. The calculated free-field response was applied to the fixed-end model (Figure 4) and the embedded model (Figure 5).

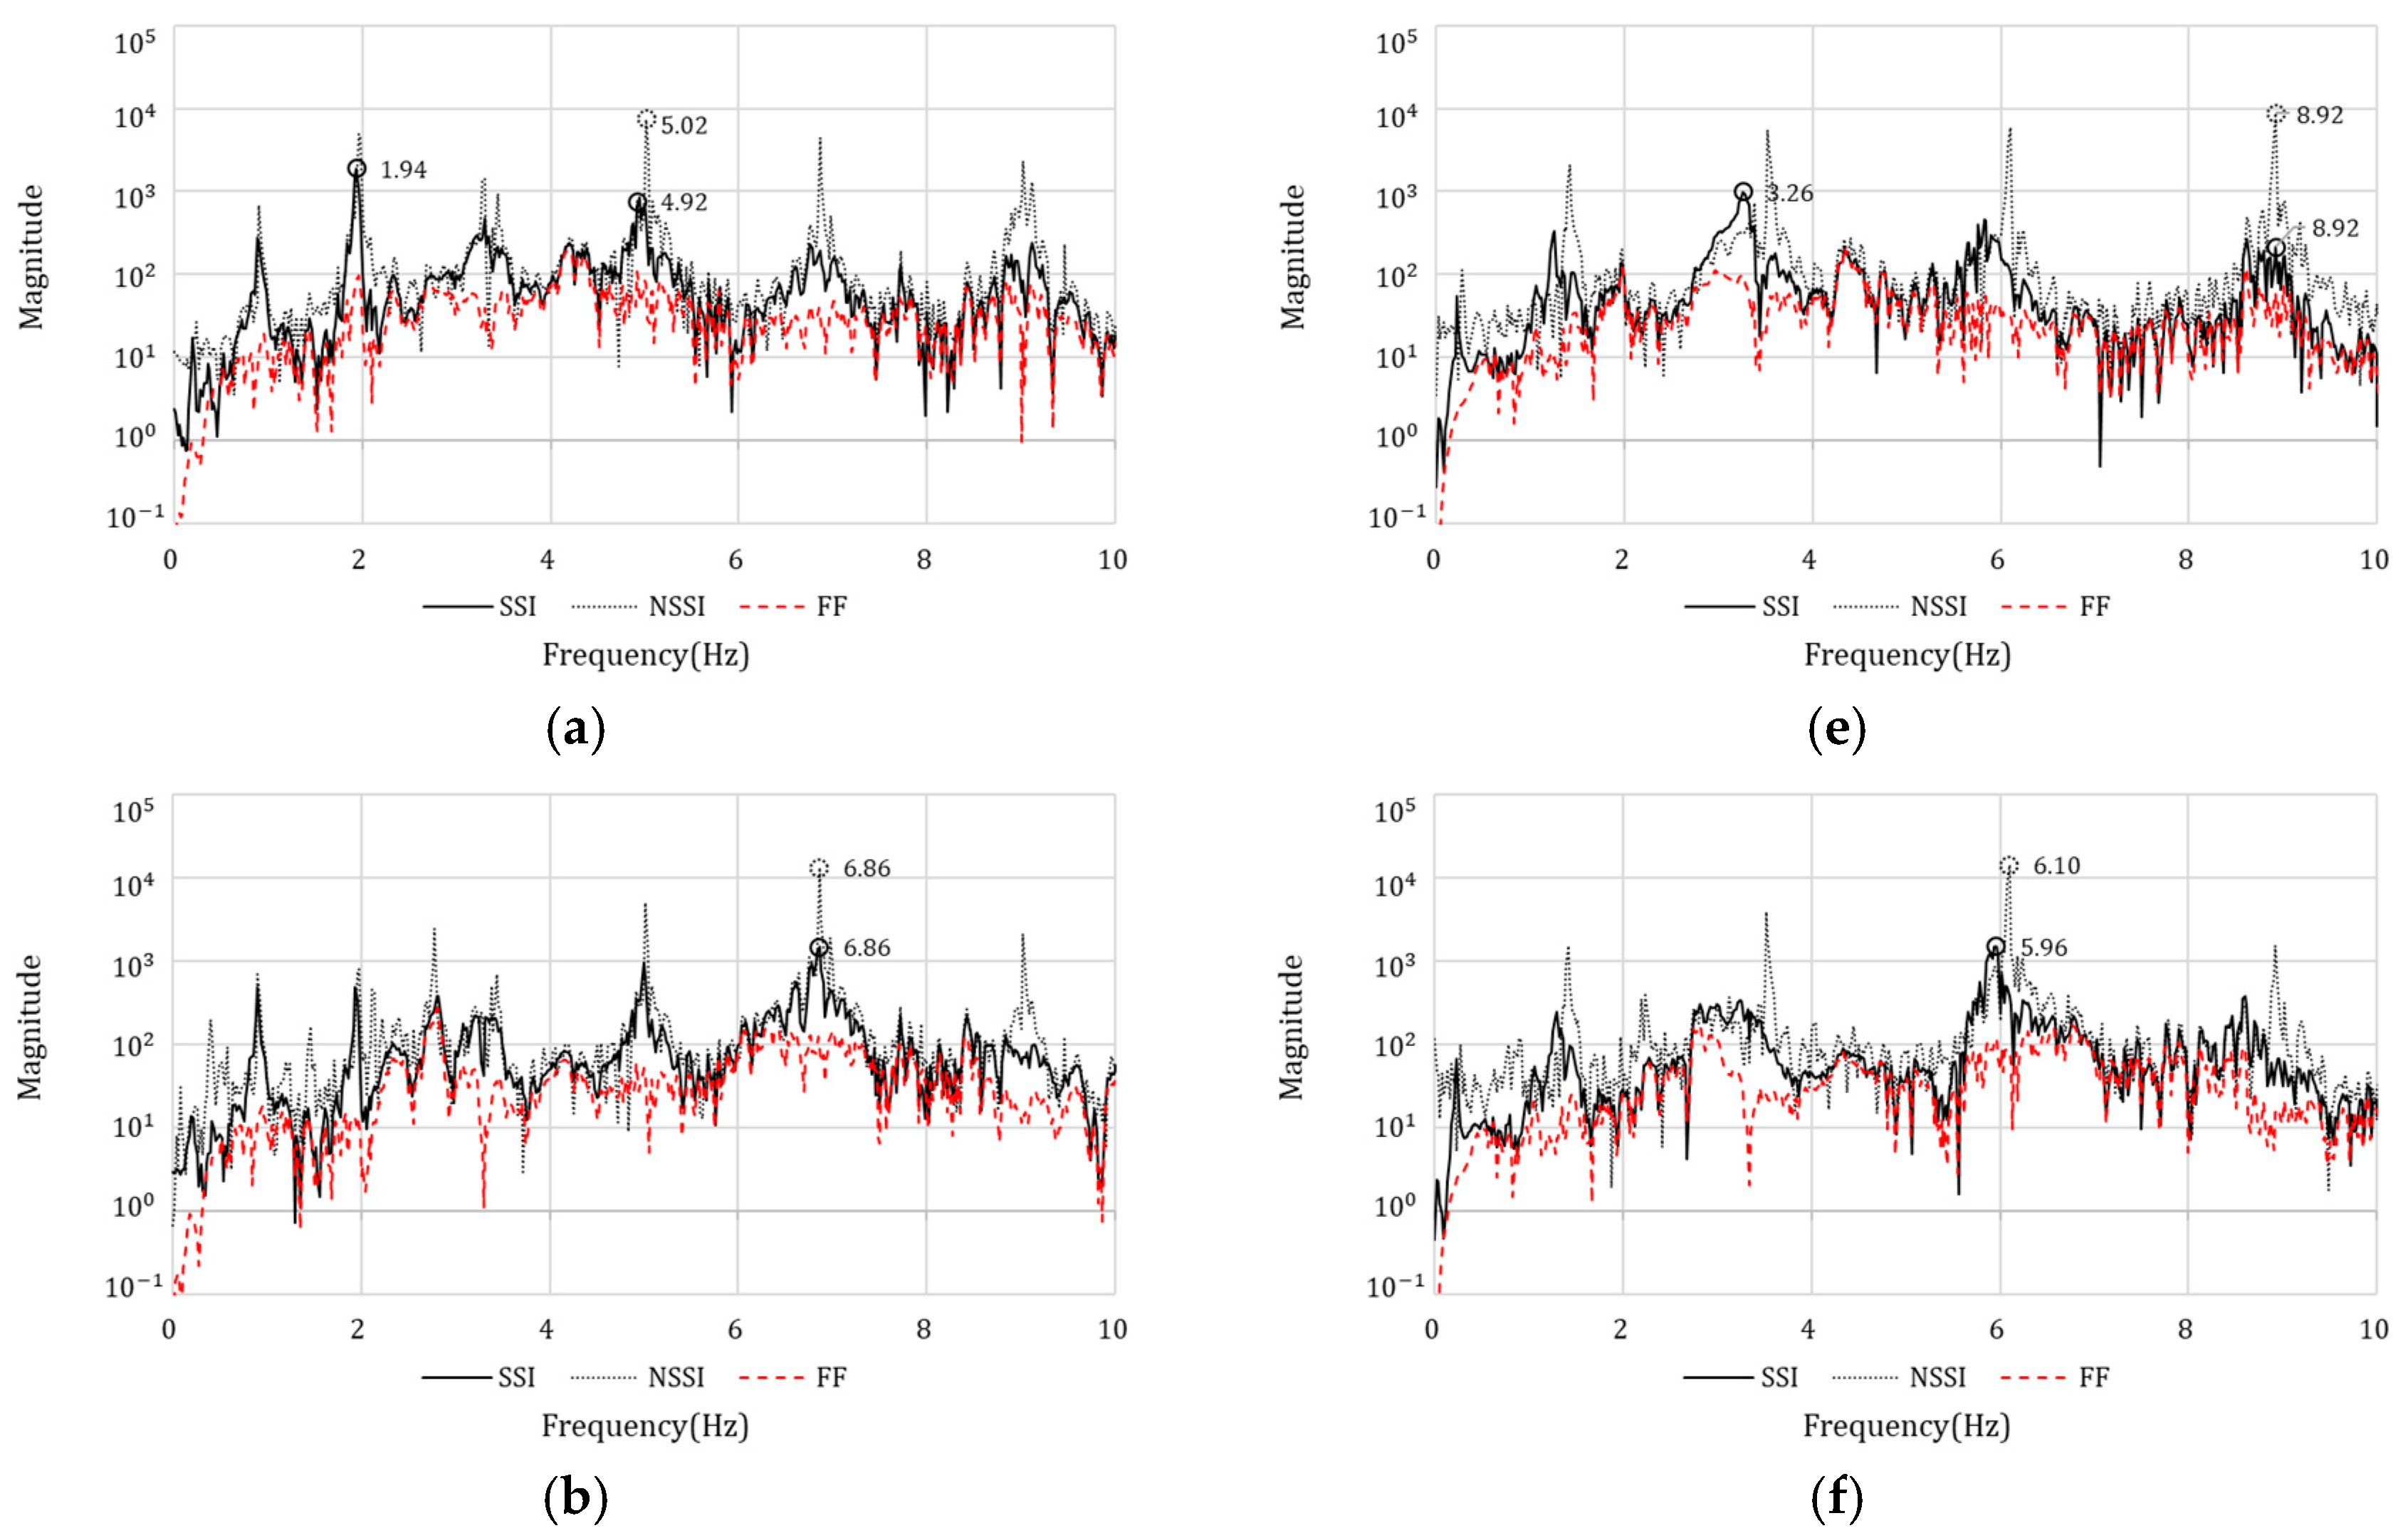
3. Analysis Results and Discussion

3.1. Effect of SSI on the Low-Frequency Structure

First, the SSI effect on the low-frequency (high-rise) structure was analyzed. Figure 8 presents graphs of the FFT spectrum obtained using the acceleration responses at the foundation base from the free-field analysis (FF) and the top of the structure for cases considering SSI (SSI) and without considering SSI (NSSI), categorized by soil type and response direction.
A comparison of the responses with and without SSI shows that the maximum response generally decreases due to the SSI effect. As shown in Figure 8, the critical frequencies, the frequency of the largest amplitude decrease, were found near the natural frequencies of the structure (Table 9). Additionally, in the weakest soil type, FI, the reduction in the peak responses is more significant than in other soil types (Figure 8a,e). This phenomenon can be explained by the fact that the damping effect caused by the kinematic interaction between the structure and the ground is greater for weaker ground stiffness.
In Figure 8a,d,e,g, the response peaks at the critical frequencies decrease significantly due to the SSI effect; consequently, the maximum response is observed at other frequencies where the decrease in response is relatively small. For example, in the EW direction of the FI soil type (Figure 8a), the maximum response occurs at 5.02 Hz when the SSI effect is not considered and at 1.94 Hz when the SSI is considered. Consequently, when SSI effects are considered, the maximum responses may occur at frequencies other than the natural frequencies obtained from the fixed-end model.
Figure 9 presents graphs of the maximum relative displacement between the top of the structure and the basement floor, categorized by soil type and response direction. As shown in the figure, considering the SSI effect reduces the maximum relative displacement of the structure across all soil types and response directions.
In a fixed-end model, the foundation supports the structure with infinite stiffness, but when the stiffness of the ground is included in the modeling (embedded model), a part of the inertial forces generated by the mass of the structure is transmitted to the ground, which causes the vibration energy to be absorbed or dissipated by the ground, reducing the response of the structure. The greater the difference in stiffness between the structure and the ground, the greater the effect of this phenomenon.
The reduction in the maximum relative displacement with and without SSI effects was largest in the weakest soil type, FI, with a reduction of 35.6% from 114 mm to 73.4 mm in the EW direction and 16.4% from 128 mm to 107 mm in the NS direction.
SSI effects similar to those obtained from this numerical analysis were also experimentally observed in previous studies. According to dynamic centrifuge model tests [25,26], the rocking behavior of shallow foundation systems induced by SSI effects resulted in reduced seismic responses. In addition, shaking table model tests performed by Zhang et al. [27] confirmed that SSI significantly alters the natural frequency and dynamic responses of the structure. These findings show similar trends to those observed in the numerical analysis conducted in this study.

3.2. Comparative Analysis Between Low-Frequency and High-Frequency Structures

The SSI effect of the high-frequency structure was compared with that of the low-frequency structure to evaluate how structural dynamic characteristics influence the seismic responses of the high-frequency-dominant earthquake.
Figure 10 is a graph of the maximum relative displacement between the top of the structure and the bottom of the basement floor, categorized by soil type and response direction. After considering the SSI effect, the maximum relative displacement decreased in all soil types for the low-frequency structure (Figure 9), but increased by 22.8% from 52.3 mm to 64.2 mm for the EW direction of the WS soil type (Figure 10a) and by 55.1% from 38.1 mm to 59.1 mm for the NS direction of the FI soil type (Figure 10b) for the high-frequency structure, indicating that a larger response may occur when SSI is considered.
To determine the cause of the larger response when SSI effects are considered for a particular soil condition in a short-period structure, the acceleration response with and without SSI effects at the top of the structure was analyzed. Figure 11 shows the FFT spectrum for the EW direction of WS soil and the NS direction of FI soil, where the response at the maximum relative displacement increased when considering the SSI effect.
In Figure 11a,b, the critical frequency at which the response peak value decreases the most is 3.72 Hz and 5.96 Hz, respectively, which occurs near the natural frequency of the fixed-end model (Table 6). However, when the SSI effect is considered, the natural frequencies of the structure change to 3.46 Hz (WS) and 3.25 Hz (FI) (Table 8), and it can be explained that the natural frequencies have shifted to the frequency range of larger amplitude of the free-field response, resulting in a larger maximum relative displacement compared to the case without SSI.

4. Conclusions

In this study, the effect of soil–structure interaction (SSI) on the dynamic behavior of low-frequency and high-frequency structures experiencing a high-frequency-dominant earthquake is analyzed. For this purpose, a fixed-end model without considering SSI and an embedded model with SSI were constructed, and the numerical analysis results of the two models were compared to quantitatively analyzing the effect of SSI on the major dynamic responses of the structure, such as natural frequency, peak response frequency, and maximum relative displacement. The conclusions from this study are as follows:
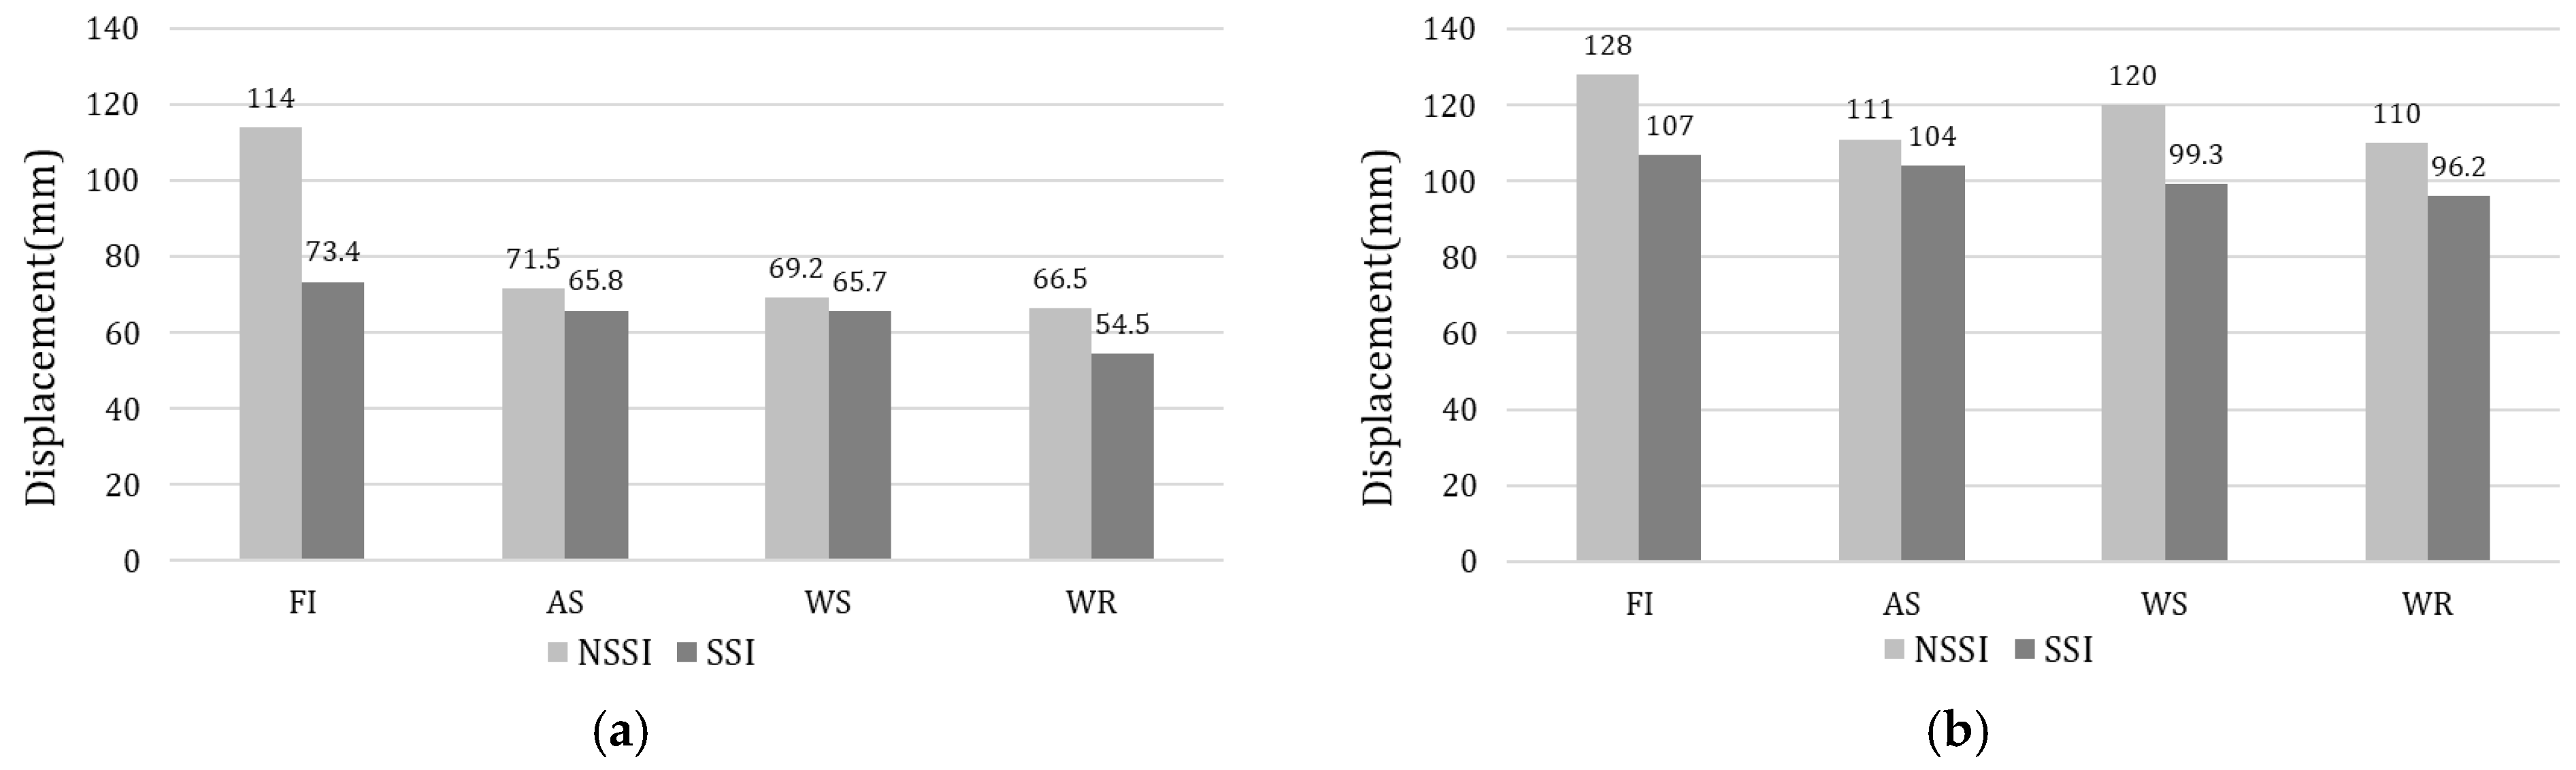
  • In the analysis results of the low-frequency structure, it was found that the peak acceleration amplitude decreases when SSI is considered for all four soil types considered. This is known to be due to the change in support conditions and the energy dissipation effect of the ground;
  • The maximum relative displacement of the low-frequency structure also decreased across all soil conditions when considering the SSI effect, with the most significant reduction observed on FI soil: 35.6% in the EW direction and 16.4% in the NS direction;
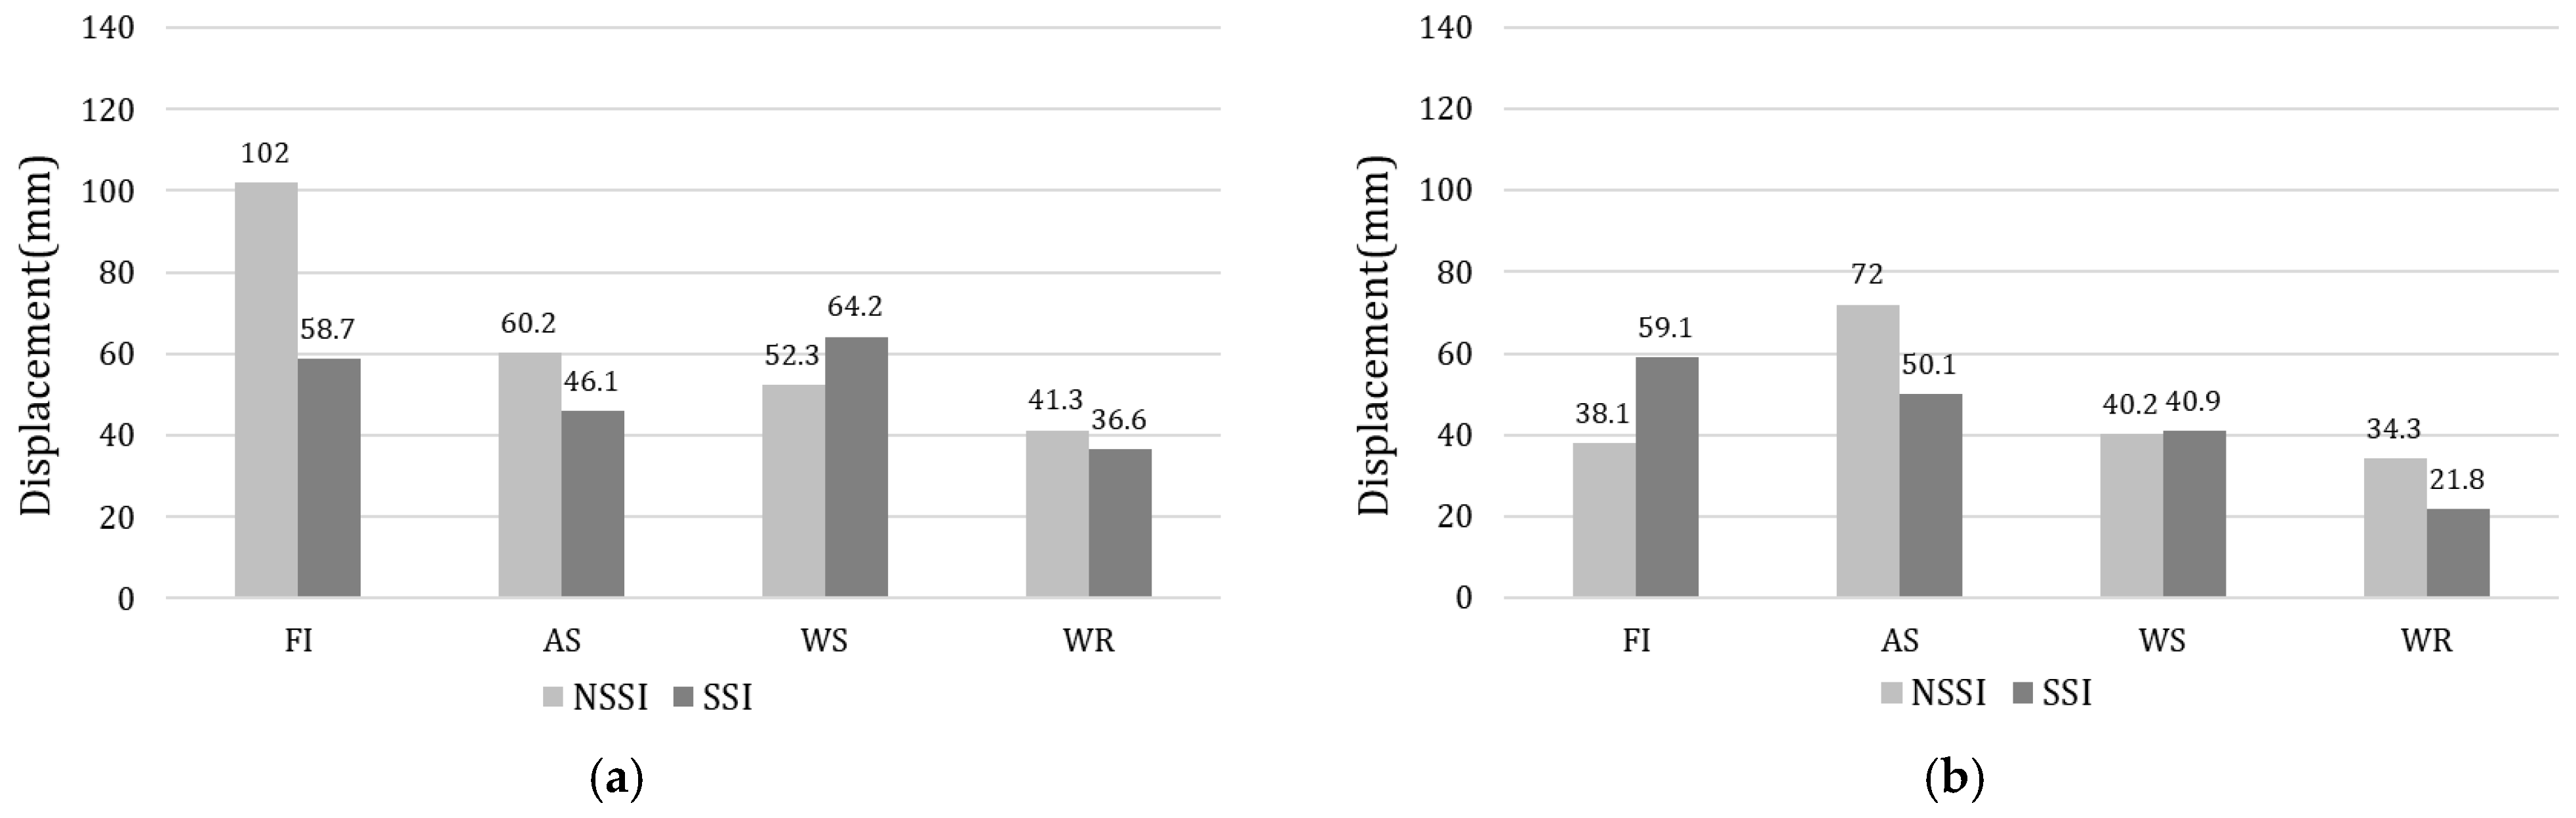
  • The maximum relative displacement of the short-period structure also decreased generally when the SSI was considered but increased by 22.8% and 55.1% for the EW direction of WS soil and NS direction of FI soil, respectively. From these results, it is observed that a larger response can be obtained when SSI is considered. The reason for this result is that the natural frequencies of the structure calculated considering the stiffness of the ground are in the frequency region where the amplitude of the free-field response is larger than otherwise;
  • For both low-frequency and high-frequency structures, considering the SSI results in additional damping as the energy dissipation of the ground is reflected in the analysis, which reduces the dynamic response. However, when SSI is considered, the support conditions of the structure change, resulting in the lower natural frequency of the structure and a change in the dynamic response. Therefore, depending on the overlap between the dominant frequency range of the input seismic wave and the natural frequency range of the structure, SSI consideration may be necessary for conservative design results.

Author Contributions

Conceptualization, W.C. and J.L.; methodology, J.L.; software, H.J. and J.Y.; supervision, W.C. and J.L.; writing—original draft, H.J.; writing—review and editing, J.L. All authors have read and agreed to the published version of the manuscript.

Funding

This research was supported by the Basic Science Research Program through the National Research Foundation of Korea (NRF2018R1A6A1A0702581921).

Institutional Review Board Statement

Not applicable.

Informed Consent Statement

Not applicable.

Data Availability Statement

Data are contained within the article.

Conflicts of Interest

The authors declare no conflicts of interest.

References

  1. Kim, Y.S. Structure-Soil Interaction and Earthquake Analysis; Goomi-Seogwan: Seoul, Republic of Korea, 2010. [Google Scholar]
  2. Kim, Y.S. SSI effects on the dynamic response of structures. J. Comput. Struct. Eng. Inst. Korea 1993, 6, 87–93. [Google Scholar]
  3. Kim, J.M. Soil-structure dynamic interaction. J. KSNVE 2002, 12, 316–321. [Google Scholar]
  4. KDS 41 17 00; Standard for Seismic Design of Buildings. Korean Design Standard. Ministry of Land, Infrastructure and Transport: Seoul, Republic of Korea, 2022. Available online: https://www.kcsc.re.kr (accessed on 6 September 2024).
  5. Bapir, B.; Abrahamczyk, L.; Wichtmann, T.; Prada-Sarmiento, L.F. Soil-structure interaction: A state-of-the-art review of modeling techniques and studies on seismic response of building structures. Front. Built Environ. 2023, 9, 1120351. [Google Scholar]
  6. Tadesse, Z.L.; Padavala, H.K.; Koteswara, V.R.P. Effect of subterranean levels on the dynamic response of RC-MRF buildings. IOP Conf. Ser. Mater. Sci. Eng. 2023, 1273, 012014. [Google Scholar]
  7. Ansari, T.A.; Jamle, S. Performance-based analysis of RC buildings with underground storey considering soil-structure interaction. Int. J. Adv. Eng. Res. Sci. 2019, 6, 767–771. [Google Scholar] [CrossRef]
  8. Bhojegowda, V.T.; Subramanya, K.G. Soil structure interaction of framed structure supported on different types of foundation. Int. Res. J. Eng. Technol. 2015, 2, 651–660. [Google Scholar]
  9. Pulikanti, S.; Ramancharla, P.K. SSI analysis of framed structure supported on pile foundations-with and without interface elements. Front. Geotech. Eng. 2014, 1, 10–16. [Google Scholar]
  10. Alonge, J.L. Modeling the effects of soil-structure interaction on a tall building bearing on a mat foundation. Civ. Eng. Pract. 2005, 20, 51–68. [Google Scholar]
  11. Kim, J.W.; Kim, D.K.; Kim, H.S. Spectrum shape considering seismic characteristics in Korea. Proc. Annu. Conf. Archit. Inst. Korea 2019, 39, 414–417. [Google Scholar]
  12. Ahn, J.H. Analysis of lateral force resistance performance according to the core area ratio of tower-type flat slab system apartments. J. Archit. Inst. Korea 2012, 28, 65–72. [Google Scholar]
  13. Lee, E.H.; Kim, J.M.; Seo, C.G. Large-scale 3D SSI analysis using KIESSI-3D program. J. Comput. Struct. Eng. Inst. Korea 2013, 26, 439–445. [Google Scholar] [CrossRef]
  14. Jang, H.; Yoon, J.; Kim, Y.; Lee, J. SSI (Soil-Structure Interaction) analysis using simplified modeling of RC columns and PML element. J. Comput. Struct. Eng. Inst. Korea 2025, 38. in press. [Google Scholar]
  15. Zulkefli, Z.F.; Zawawi, M.H.; Hassan, N.H.; Zainol, M.R.R.M.A.; Abas, M.A.; Mazlan, A.Z.A. Calculating the moduli elasticity for reinforced concrete using new rule of mixtures approach for the dam structure. MATEC Web Conf. 2018, 217, 04003. [Google Scholar] [CrossRef]
  16. Sun, S.C.; Han, J.T.; Cho, W.J. Proposal of representative shear wave velocity for domestic geological layers through synthesis of in-situ seismic test data. Korean Soc. Eng. Geol. 2012, 22, 293–307. [Google Scholar]
  17. Kim, S.D.; Yoon, J.; Cho, W.; Lee, J. Evaluation of seismic performance and soil-structure interaction (SSI) for piloti-type buildings considering Korean geotechnical conditions. Adv. Civ. Eng. 2021, 2021, 7876389. [Google Scholar] [CrossRef]
  18. Jin, Y.; Jeong, S.; Moon, M.; Kim, D. Analysis of the dynamic behavior of multi-layered soil grounds. Appl. Sci. 2024, 14, 5256. [Google Scholar] [CrossRef]
  19. Katuwal, S.; Pandit, A.; Shilpakar, A. Soil deformation behavior and SSI study by varying Poisson’s ratio of granular soil. SSRN Electron. J. 2022, 12, 1302–1309. Available online: https://kcc.edu.np/wp-content/uploads/2022/11/Final_Manuscript.pdf (accessed on 18 March 2025).
  20. Basu, U. Explicit finite element perfectly matched layer for transient three-dimensional elastic waves. Int. J. Numer. Methods Eng. 2009, 77, 151–176. [Google Scholar] [CrossRef]
  21. Kim, J.M.; Lee, G.H.; Hong, K.Y.; Lee, E.H. Verification of linear FE model for nonlinear SSI analysis by boundary reaction method. J. Comput. Struct. Eng. Inst. Korea 2014, 27, 95–102. [Google Scholar]
  22. Genç, A.; Kuvat, A.; Sesli, H. A study on efficiency of perfectly matched layer (PML) for seismic soil-structure interaction. Bursa Uludağ Univ. J. Fac. Eng. 2022, 27, 467–486. [Google Scholar] [CrossRef]
  23. LSTC. LS-DYNA Keyword User’s Manual Volume II: Material Models; LSTC Co.: Livermore, CA, USA, 2024. [Google Scholar]
  24. NECIS (National Earthquake Comprehensive Information System). Korea Meteorological Administration. 2019. Available online: https://necis.kma.go.kr (accessed on 31 December 2024).
  25. Ha, J.G.; Jo, S.G.; Park, H.J.; Kim, D.S. Evaluation of Rocking Behaviors During Earthquake for the Shallow Foundation System on the Weathered Soil Using Dynamic Centrifuge Test. J. Earthq. Eng. Soc. Korea 2016, 20, 285–293. [Google Scholar] [CrossRef]
  26. Ko, K.W.; Ha, J.G.; Park, H.J.; Kim, D.S. Evaluation of Rocking Mechanism for Embedded Shallow Foundation via Horizontal Slow Cyclic Tests. J. Earthq. Eng. Soc. Korea 2016, 20, 413–425. [Google Scholar]
  27. Zhang, W.; Han, L.; Feng, L.; Ding, X.; Wang, L.; Chen, Z.; Liu, H.; Aljarmouzi, A.; Sun, W. Study on seismic behaviors of a double box utility tunnel with joint connections using shaking table model tests. Soil Dyn. Earthq. Eng. 2020, 136, 106118. [Google Scholar] [CrossRef]
Figure 1. Floor plan of typical section (unit: mm).
Applsci 15 03679 g001
Figure 2. Structural drawing of the superstructure.
Applsci 15 03679 g002
Figure 3. Structural drawing of the substructure.
Applsci 15 03679 g003
Figure 4. Fixed-end FE models: (a) High-rise structure; (b) low-rise structure.
Applsci 15 03679 g004
Figure 5. Embedded FE models: (a) High-rise structure; (b) low-rise structure.
Applsci 15 03679 g005
Figure 6. Acceleration time history of Gyeoungju earthquake recorded at DAG2 station. (a) peak acceleration in the east–west direction; (b) peak acceleration in the north–south direction.
Applsci 15 03679 g006
Figure 7. Acceleration response spectrum of Gyeoungju earthquake.
Applsci 15 03679 g007
Figure 8. FFT spectrum of acceleration responses of low-frequency structure: (a) FI-EW; (b) AS-EW; (c) WS-EW; (d) WR-EW; (e) FI-NS; (f) AS-NS; (g) WS-NS; (h) WR-NS.
Applsci 15 03679 g008aApplsci 15 03679 g008b
Figure 9. Maximum relative displacement of the low-frequency structure considering SSI effects: (a) EW direction; (b) NS direction.
Applsci 15 03679 g009
Figure 10. Maximum relative displacement of the high-frequency structure considering SSI effects: (a) EW direction; (b) NS direction.
Applsci 15 03679 g010
Figure 11. FFT spectrum of acceleration responses at the top of the high-frequency structure for different soil types considering SSI effects: (a) WS-EW; (b) FI-NS.
Applsci 15 03679 g011
Table 1. Dimensions and strength of the superstructure.
TypeIDDimension
(mm)
Strength of Concrete (MPa)
1F–15F16F–30F31F–40F
ColumnC11200 × 1200504030
C2900 × 900504030
WallCW1THK 600504030
CW2THK 600504030
SlabSTHK 250403024
Table 2. Dimensions and strength of the substructure.
TypeIDDimension
(mm)
Strength of Concrete (MPa)
B1–B2
ColumnC3600 × 60050
WallBWTHK 45050
SlabBSTHK 40040
Table 3. Equivalent material properties of columns.
IDFloorUnit Mass
(t/mm3)
Elastic Modulus
(GPa)
Yield Stress
(MPa)
Tangent Modulus
(GPa)
C11F–15F2.46 × 10−936.7956.334.091
16F–30F34.4445.454.091
31F–40F31.9534.464.091
C21F–15F2.46 × 10−936.4956.103.942
16F–30F34.1645.263.942
31F–40F31.6734.303.942
C3B1–B22.45 × 10−936.8956.033.899
Table 4. Equivalent material properties of walls and slabs.
TypeIDFloorUnit Mass
(t/mm3)
Elastic Modulus
(GPa)
Yield Stress
(MPa)
WallCW1F–15F2.58 × 10−936.9150
16F–30F34.6640
31F–40F32.2530
BWB1–B22.37 × 10−933.4250
SlabS1F–15F2.60 × 10−934.3740
16F–30F31.9030
31F–40F30.2224
BSB1–B22.35 × 10−930.7640
Table 5. Sectional properties of columns.
TypeB
(mm)
D
(mm)
A
(mm2)
Ix
(mm4)
Iy
(mm4)
J
(mm4)
As
(mm2)
C1120012001.440 × 1061.728 × 10111.728 × 10112.920 × 10111.200 × 106
C29009008.100 × 1055.468 × 10105.468 × 10109.240 × 10106.750 × 105
C36006003.600 × 1051.080 × 10101.080 × 10101.825 × 10103.000 × 105
Table 6. Natural frequencies of the fixed-end models (unit: Hz).
High-Rise StructureLow-Rise Structure
Mode1st2nd1st
x-bending0.230.903.70
y-bending0.271.405.94
Table 7. Material properties of the four soil types.
Soil TypeFIASWSWR
Density   ( ρ s o i l )   ( t / mm 3 )1.70 × 10−91.84 × 10−91.90 × 10−91.99 × 10−9
Unit   weight   ( γ s o i l )   ( N / m 3 )16,67018,00018,64019,510
Shear   modulus   ( G )   ( MPa )58.813136.151211.835720.461
Young s   modulus   ( E s o i l )   ( MPa )158.796353.993550.7721801.154
Bulk   modulus   ( K )   ( MPa )176.440294.994458.9761200.769
Poisson s   ratio   ( υ )0.350.300.300.25
Shear   wave   velocity   ( V S )   ( m / s )186283353651
Compressional   wave   velocity   ( V P )   ( m / s )3875296601128
Friction   angle   ( ϕ ) (°)30303133
Cohesion   value   ( C )   ( MPa )00.010.020.10
Table 8. Natural frequencies of the embedded models (unit: Hz).
High-Rise StructureLow-Rise Structure
ModeSoil Type1st2nd1st
x-bendingFI0.200.881.97
AS0.200.892.81
WS0.210.893.27
WR0.220.903.66
y-bendingFI0.211.243.25
AS0.231.273.43
WS0.231.293.46
WR0.251.355.11
Table 9. Natural frequencies of the low-frequency structure from fixed-end model (unit: Hz).
Mode1st2nd3rd4th5th6th7th
x-bending0.230.901.973.325.016.869.03
y-bending0.271.403.506.078.86--
Disclaimer/Publisher’s Note: The statements, opinions and data contained in all publications are solely those of the individual author(s) and contributor(s) and not of MDPI and/or the editor(s). MDPI and/or the editor(s) disclaim responsibility for any injury to people or property resulting from any ideas, methods, instructions or products referred to in the content.

