1. Introduction
The supercritical CO
2 (sCO
2) Brayton cycle first proposed by Angelino and Feher [
1,
2] has, in recent years, been a research hotspot due to its higher efficiency than power cycles using conventional fluid as working fluid above 600 °C [
3,
4,
5,
6]. Additionally, a higher density of sCO
2 allows for compact power devices, all of which can be incorporated into a turbine-alternator-compressor (TAC) unit for the sCO
2 Brayton cycle of output power below 1 MW [
7,
8,
9], reducing cycle costs and enabling modular construction technology [
10].
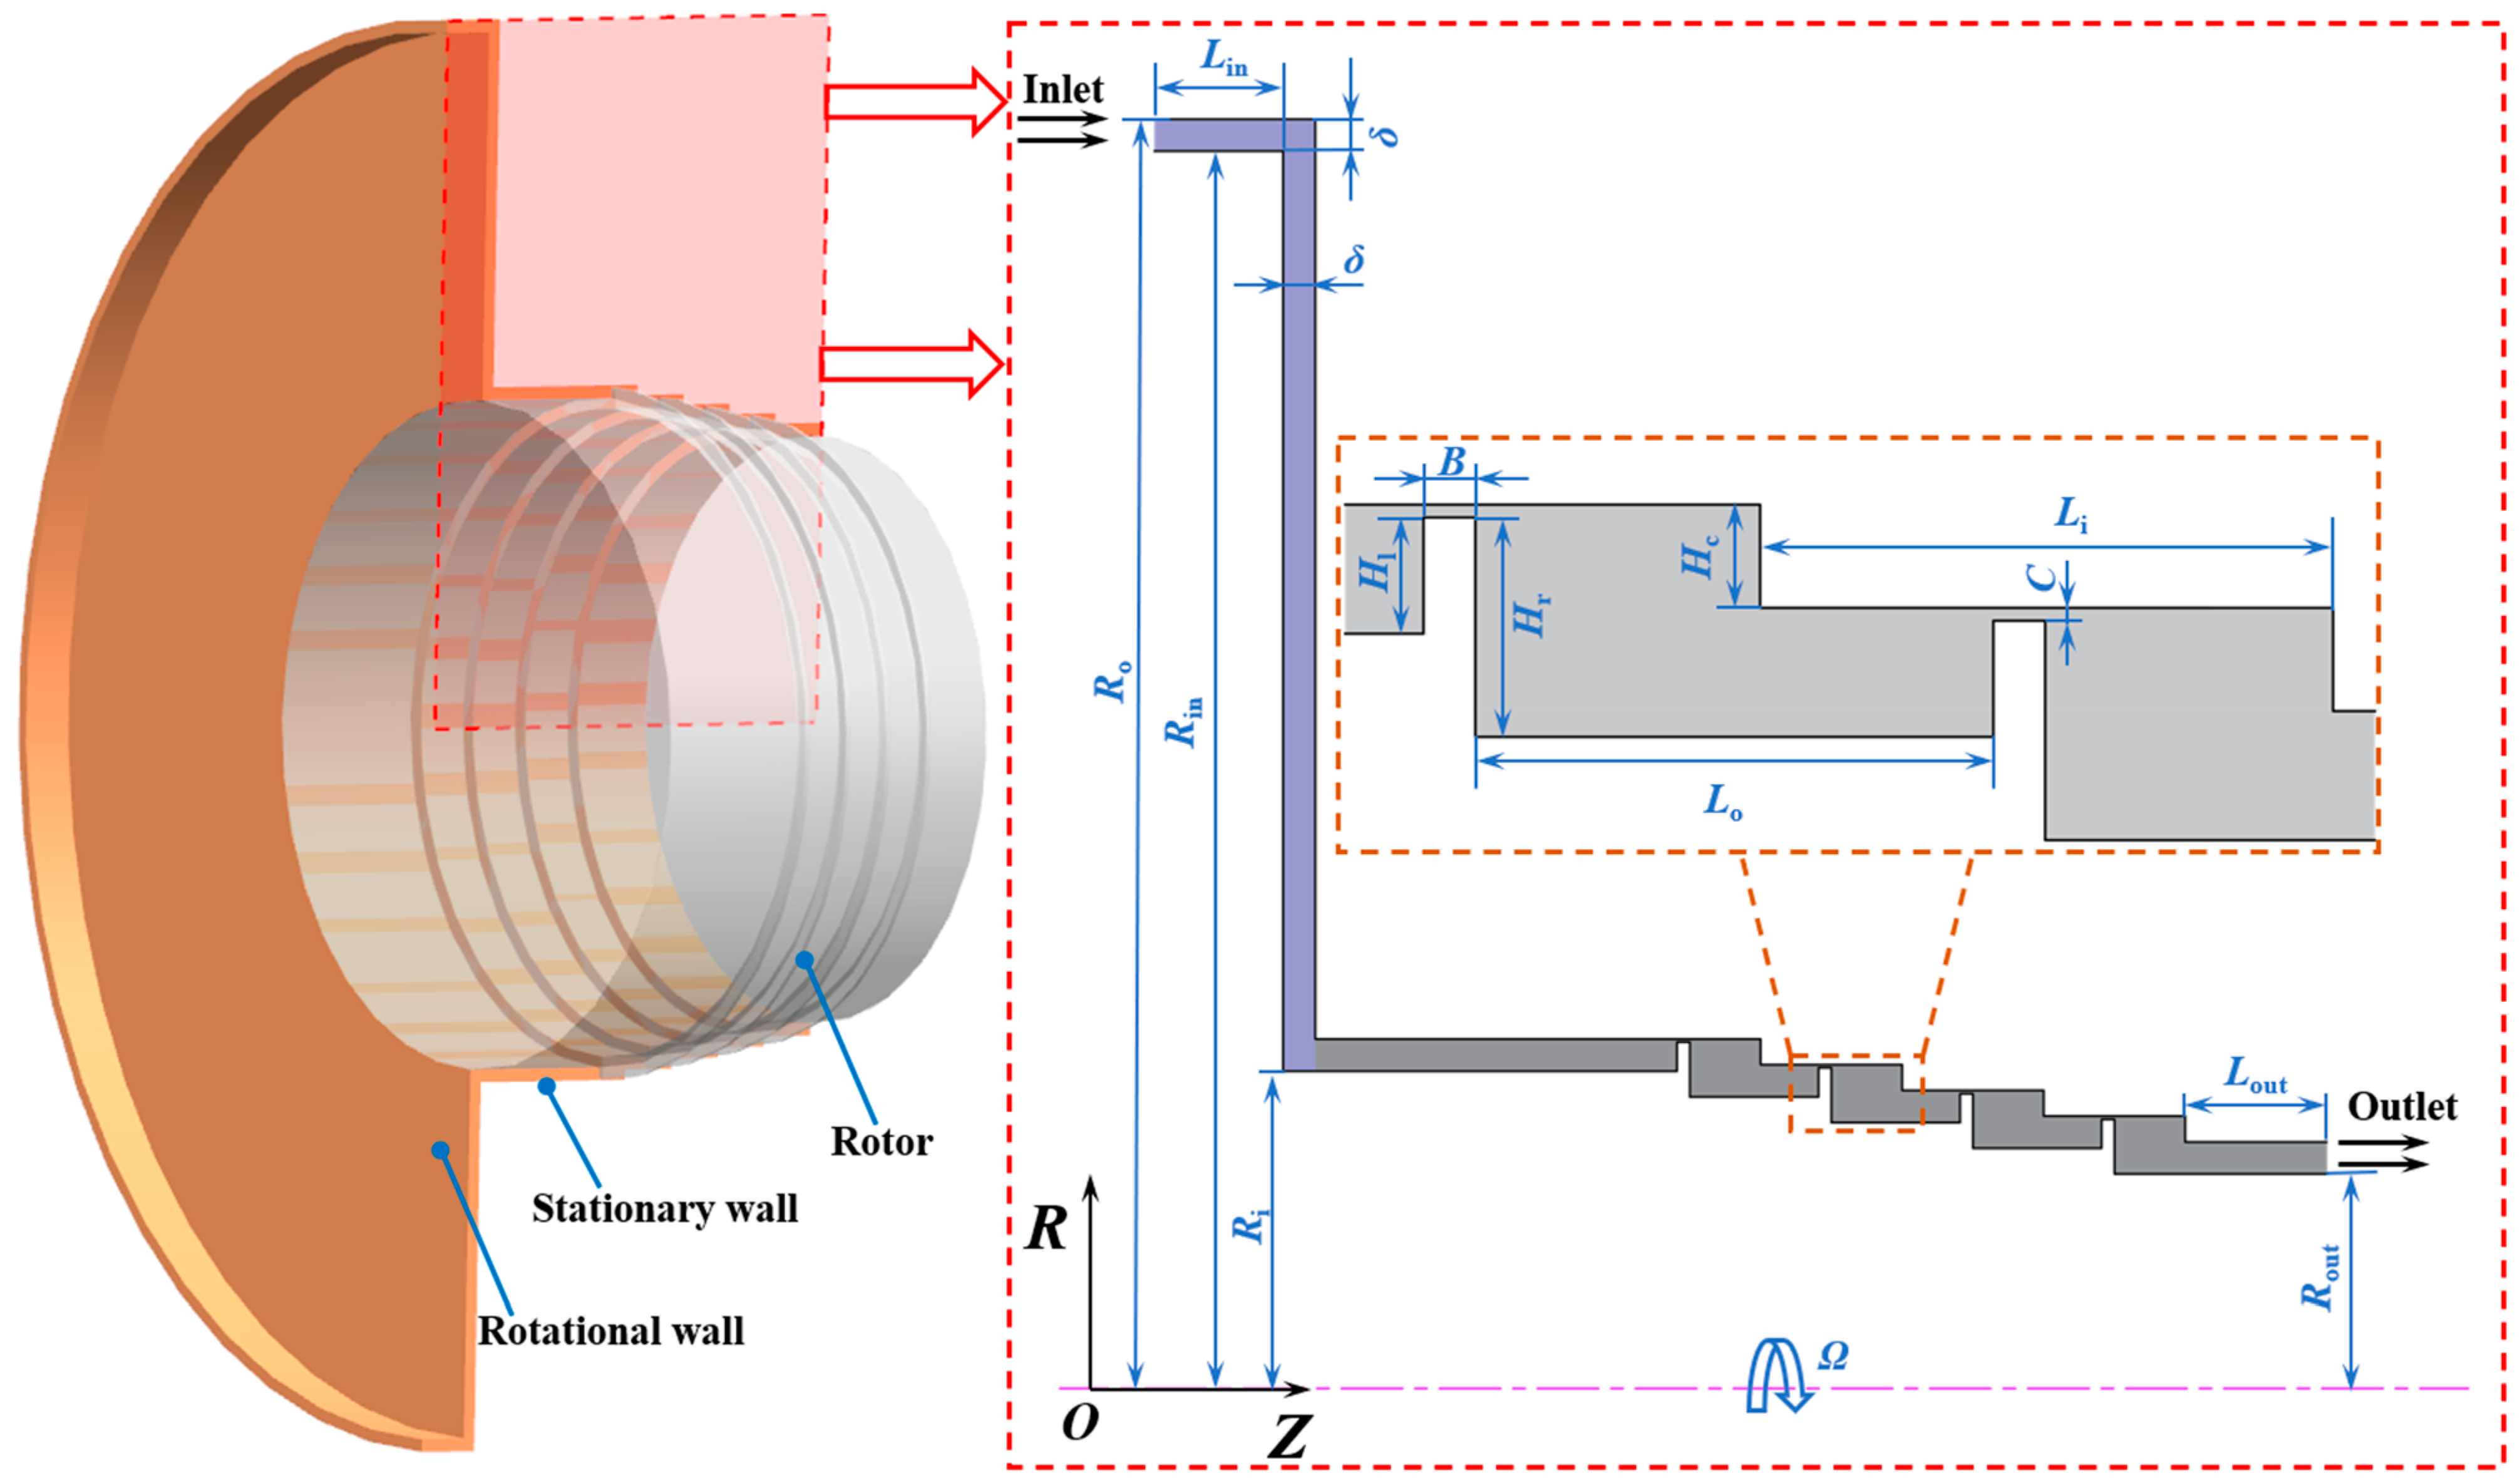
Figure 1 depicts the structure of a sCO
2 (TAC) unit, in which the fluid leakage from the compressor into the impeller back gap and labyrinth seal cavities can also be seen. According to Refs. [
11,
12,
13], it is pointed out that the leakage flow in the gap and cavity generates windage losses due to friction when the rotor rotates and a cubic relationship between the windage losses and the rotational speed, indicating that the windage losses increase rapidly with the increase of rotational speed. Conboy found that the windage loss accounts for up to 37.5% of the total loss in a sCO
2 TAC unit because the rotational speed is undoubtedly higher for smaller power devices [
14], reducing the output power and potentially leading to rotor overheating [
15].
The research conducted thus far has revealed that the windage loss in the impeller back gap and labyrinth seal cavities, which corresponds to the blue and red regions in
Figure 1, respectively, significantly impacts the aerodynamic performances of sCO
2 centrifugal compressors and even TAC units [
16,
17]. Thus, it is essential to research windage loss, flow, and the model of
Cf in the regions. Moreover, the impeller back gap is considered a disk-type gap, commonly regard as a rotor-stator disk system [
14]. The labyrinth seal is similar to the shaft-type gap, which can be assumed to be a concentric cylinder system [
18]. In response to the difference in loss mechanisms in the two gap types, their windage losses need to be studied separately.
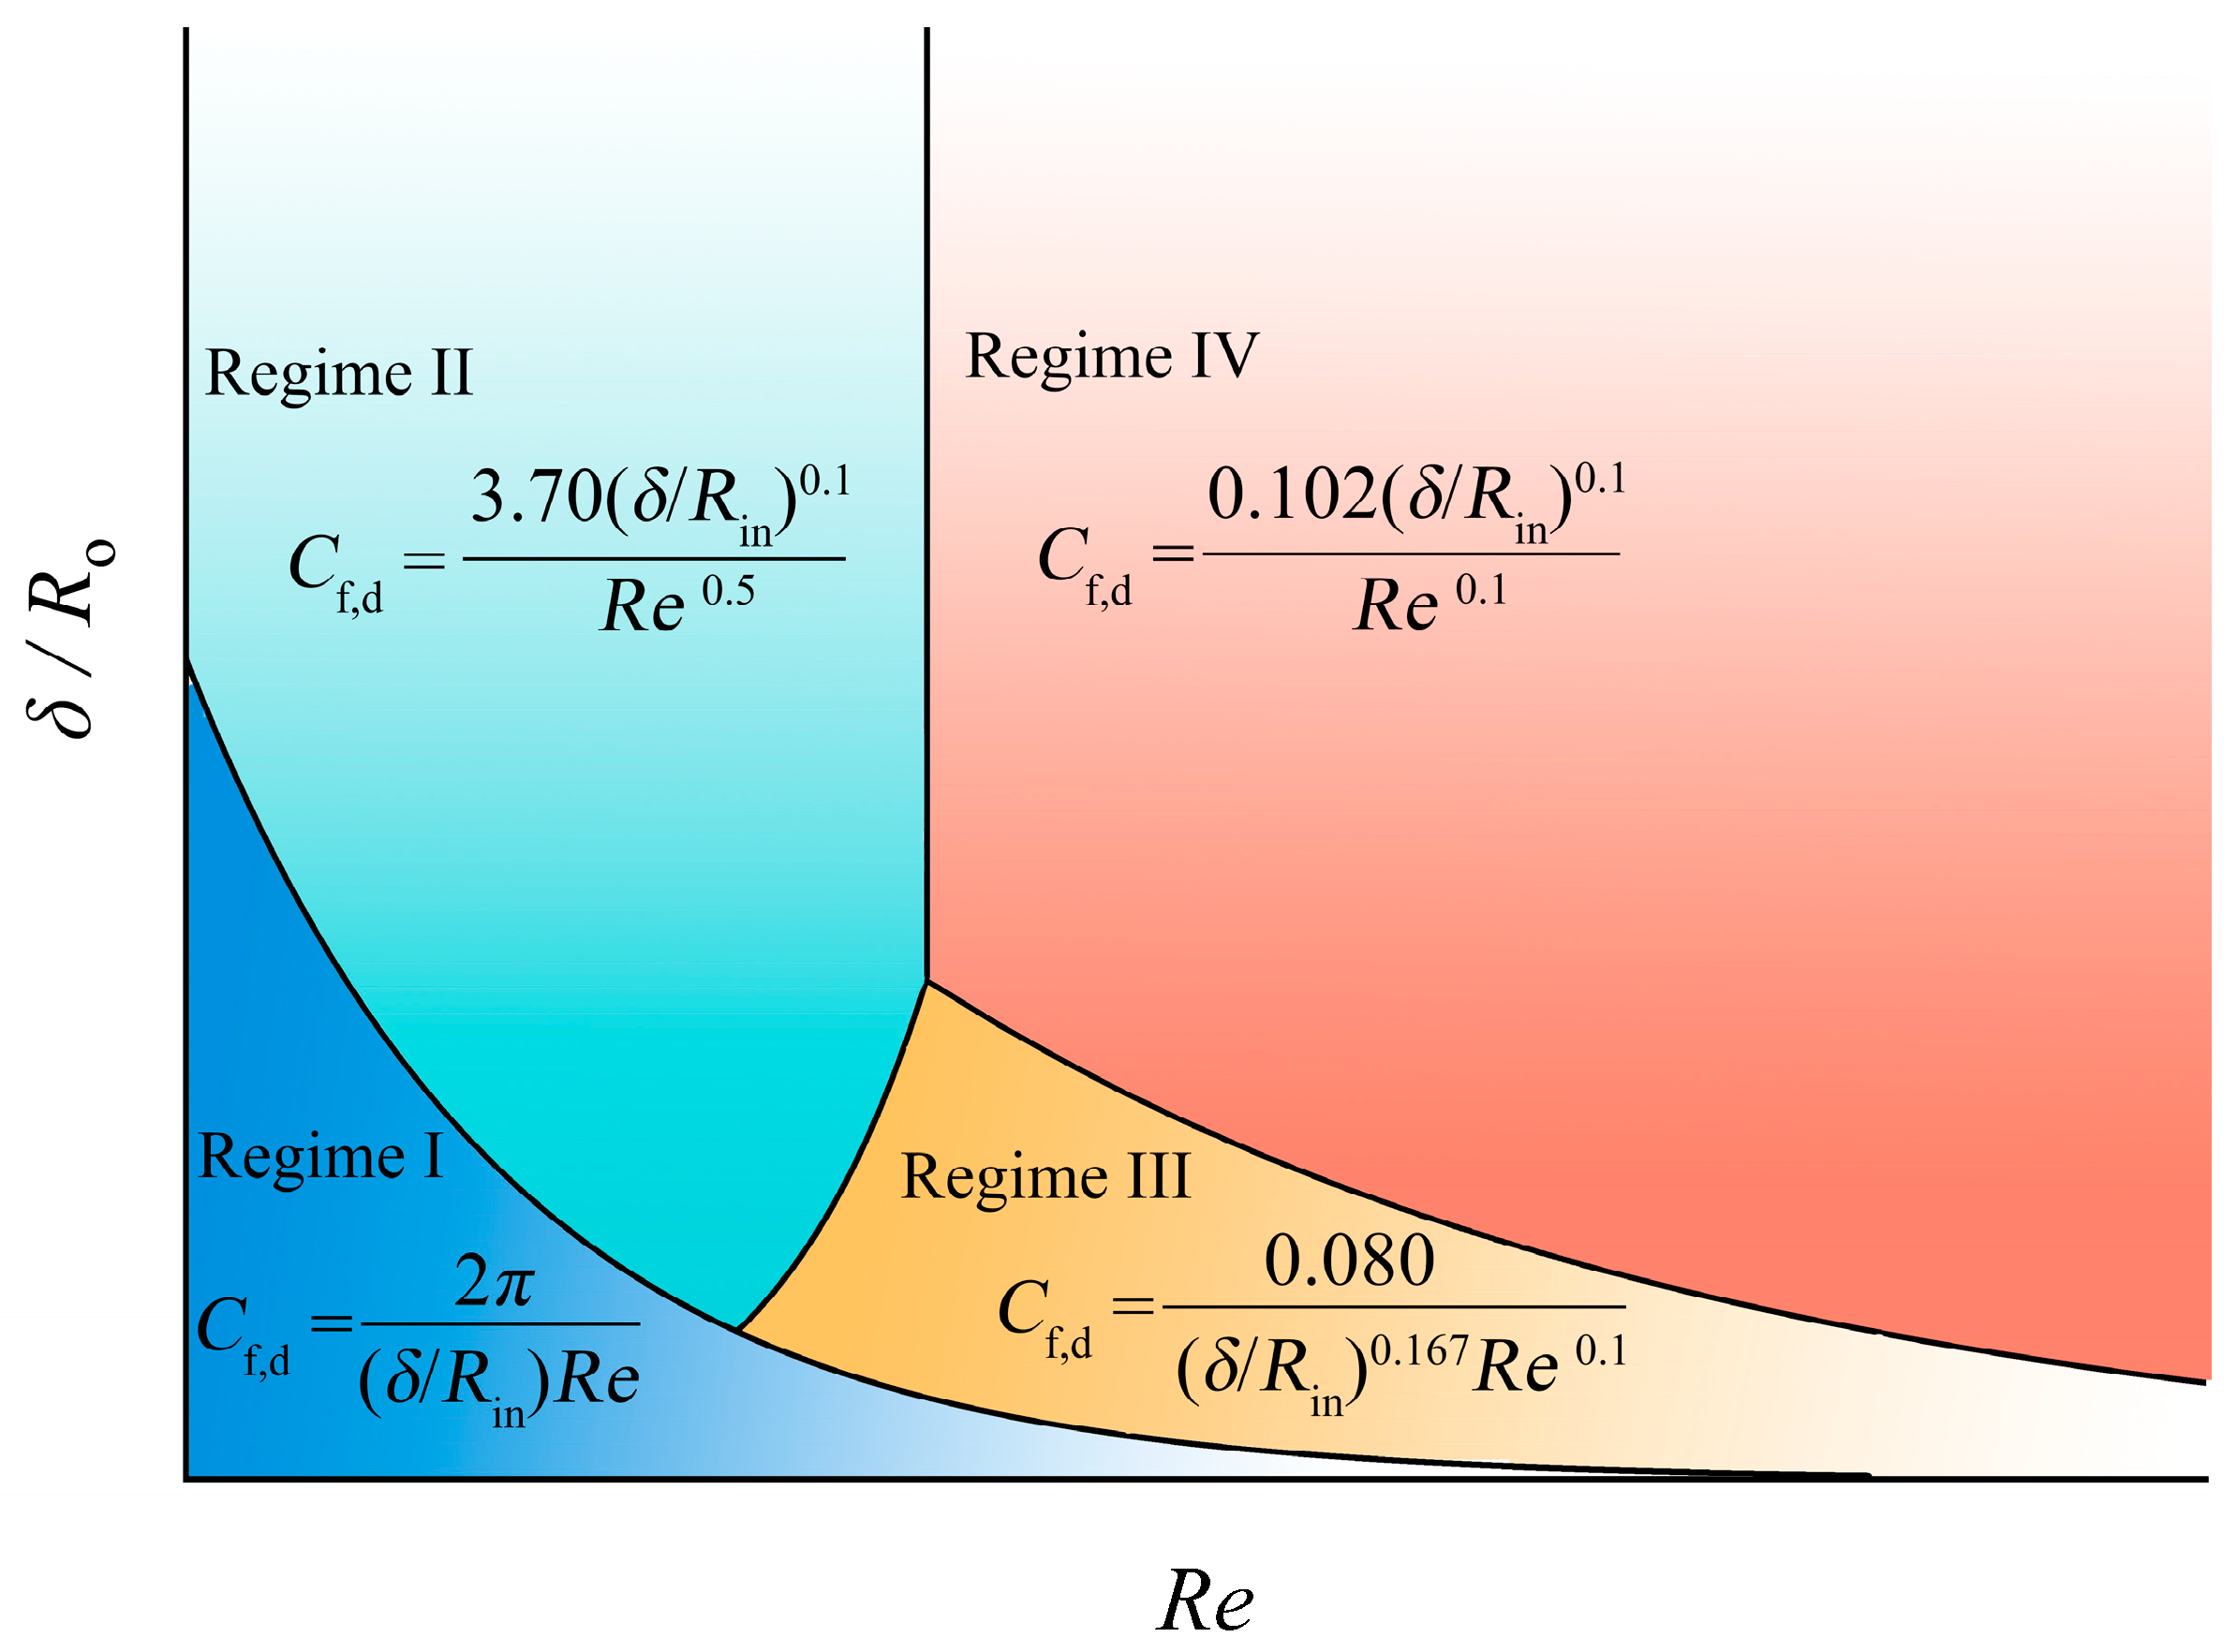
For disk-type gaps, Daily et al. first identified the four flow regimes in enclosed disk-type gaps under smooth wall conditions, based on Reynolds number
Re and radius ratio
δ/Ro, as highlighted in
Figure 2 [
19]. Models for calculating the skin friction coefficient
Cf, a parameter that is influenced by several key variables related to windage loss, were proposed for each of the four regimes. Nowadays, the models have been widely used to predict disk-type windage loss [
20]. However, Poullikkas et al. confirmed that the
Cf grows with surface roughness, and they imply that Daily’s model is inapplicable to rough walls [
21]. The evaluation of windage losses for disk-type gaps was conducted by Etemad et al., and the results show that windage loss is proportional to the square of throughflow and a dependency on throughflow direction [
22]. In addition, further research on flow characteristics in disk-type gaps has revealed new insights. A variety of vortex structures, such as primary and secondary vortices and the vortex in turbulent boundary layers, were observed by Zhao et al. [
23]. At higher
Re, vortex cores are denser in the boundary layer and vortex intensity decreases, consistent with the conclusion that the streamline instability becomes dominant in the transition boundary layer [
24]. Gu et al. developed a one-dimensional pressure model and a design tool for solving the flow in pump side chambers by investigating leakage and pressure distribution in disk-type gaps of centrifugal pumps with water as working fluid [
25].
For shaft-type gaps, there has been extensive research on windage loss and flow in enclosed shaft-type gaps and labyrinth seals. Hu et al. initially validated Bilgen models and discovered that the Bilgen model is not applicable to predict
Cf when
Re falls between 7 × 10
3 and 3 × 10
4 or exceeds 3 × 10
4, and an improved model of
Cf incorporating CO
2 as working fluid was built based on numerical results [
26]. Berghout et al. analyzed Taylor-Couette flow, which provides insight into the causes of windage loss [
27,
28,
29]. Cao et al. reported that the leakage flow in labyrinth seal causes a drop of 1.1% in isentropic efficiency of the sCO
2 centrifugal compressor [
30]. It reduces the diffuser inlet radial velocity, increases the flow angle, and reduces the pressure drop, particularly for high flow coefficients. Yuan et al. studied the impact of operating conditions on the performance of the labyrinth seal when sCO
2 flows through with the method of experiment investigation [
31]. Guidotti et al. studied a compressor, including a cavity structure, both numerically and experimentally, and found that numerical simulations predicted the overall compressor performance and details of the flow characteristics very effectively [
32]. The effect of leakage flow on the aerodynamic performance of centrifugal compressors was investigated using numerical methods by Mischo et al. The results show that the direction and location of leakage re-entry affect aerodynamic performance and efficiency [
33].
Despite the continuous research on windage loss and
Cf in enclosed disk-type and shaft-type gaps, little attention has been paid to windage loss and
Cf models in open gaps. Leakage flow in open gaps complicates the formation of flow fields and windage losses compared to closed gaps. For example, different vortices will form in an open gap compared to a closed gap. Most of the current studies are focused on windage loss influencing factors [
34], and have not modeled windage losses by combining the three key parameters of
Re,
π, and
η. Furthermore, while the aerodynamic performance of compressors and leakage flow in labyrinth seals have been the focus of attention, less attention has been paid to windage losses in the impeller back gap and labyrinth seal cavities, and few studies have been conducted on the losses with the sCO
2 medium.
Therefore, the skin friction coefficients Cf,d and Cf,s are studied to predict windage loss in the impeller back gap and labyrinth seal cavities. Above all, the effects of Reynolds number Re of 102~108, pressure ratio π of 4.5~6.0 and radius ratio η of 0.018~0.054 are investigated. The three key parameters are intended to enable the exploration of the relationship between the role of physical properties and rotational speed, leakage flow rate, and geometric features on the skin friction coefficient. Subsequently, the action mechanisms are explored in the form of analyzing flow characteristics. Finally, the models of Cf, are proposed in different Re ranges, and the models are adapted to different key parameters. The conclusions of this paper help to use a more accurate form of predicting windage loss when designing sCO2 compressors.
4. Results and Discussion
In this section, the influence rules of the Reynolds number Re of 102~108, pressure ratio π of 4.5~6.0, and radius ratio η of 0.018~0.054 on the skin friction coefficients Cf,d and Cf,s and the flow characteristics are analyzed, and the models of Cf in the impeller back gap and labyrinth seal cavities are proposed and validated.
4.1. Effects of Reynolds Number and Pressure Ratio
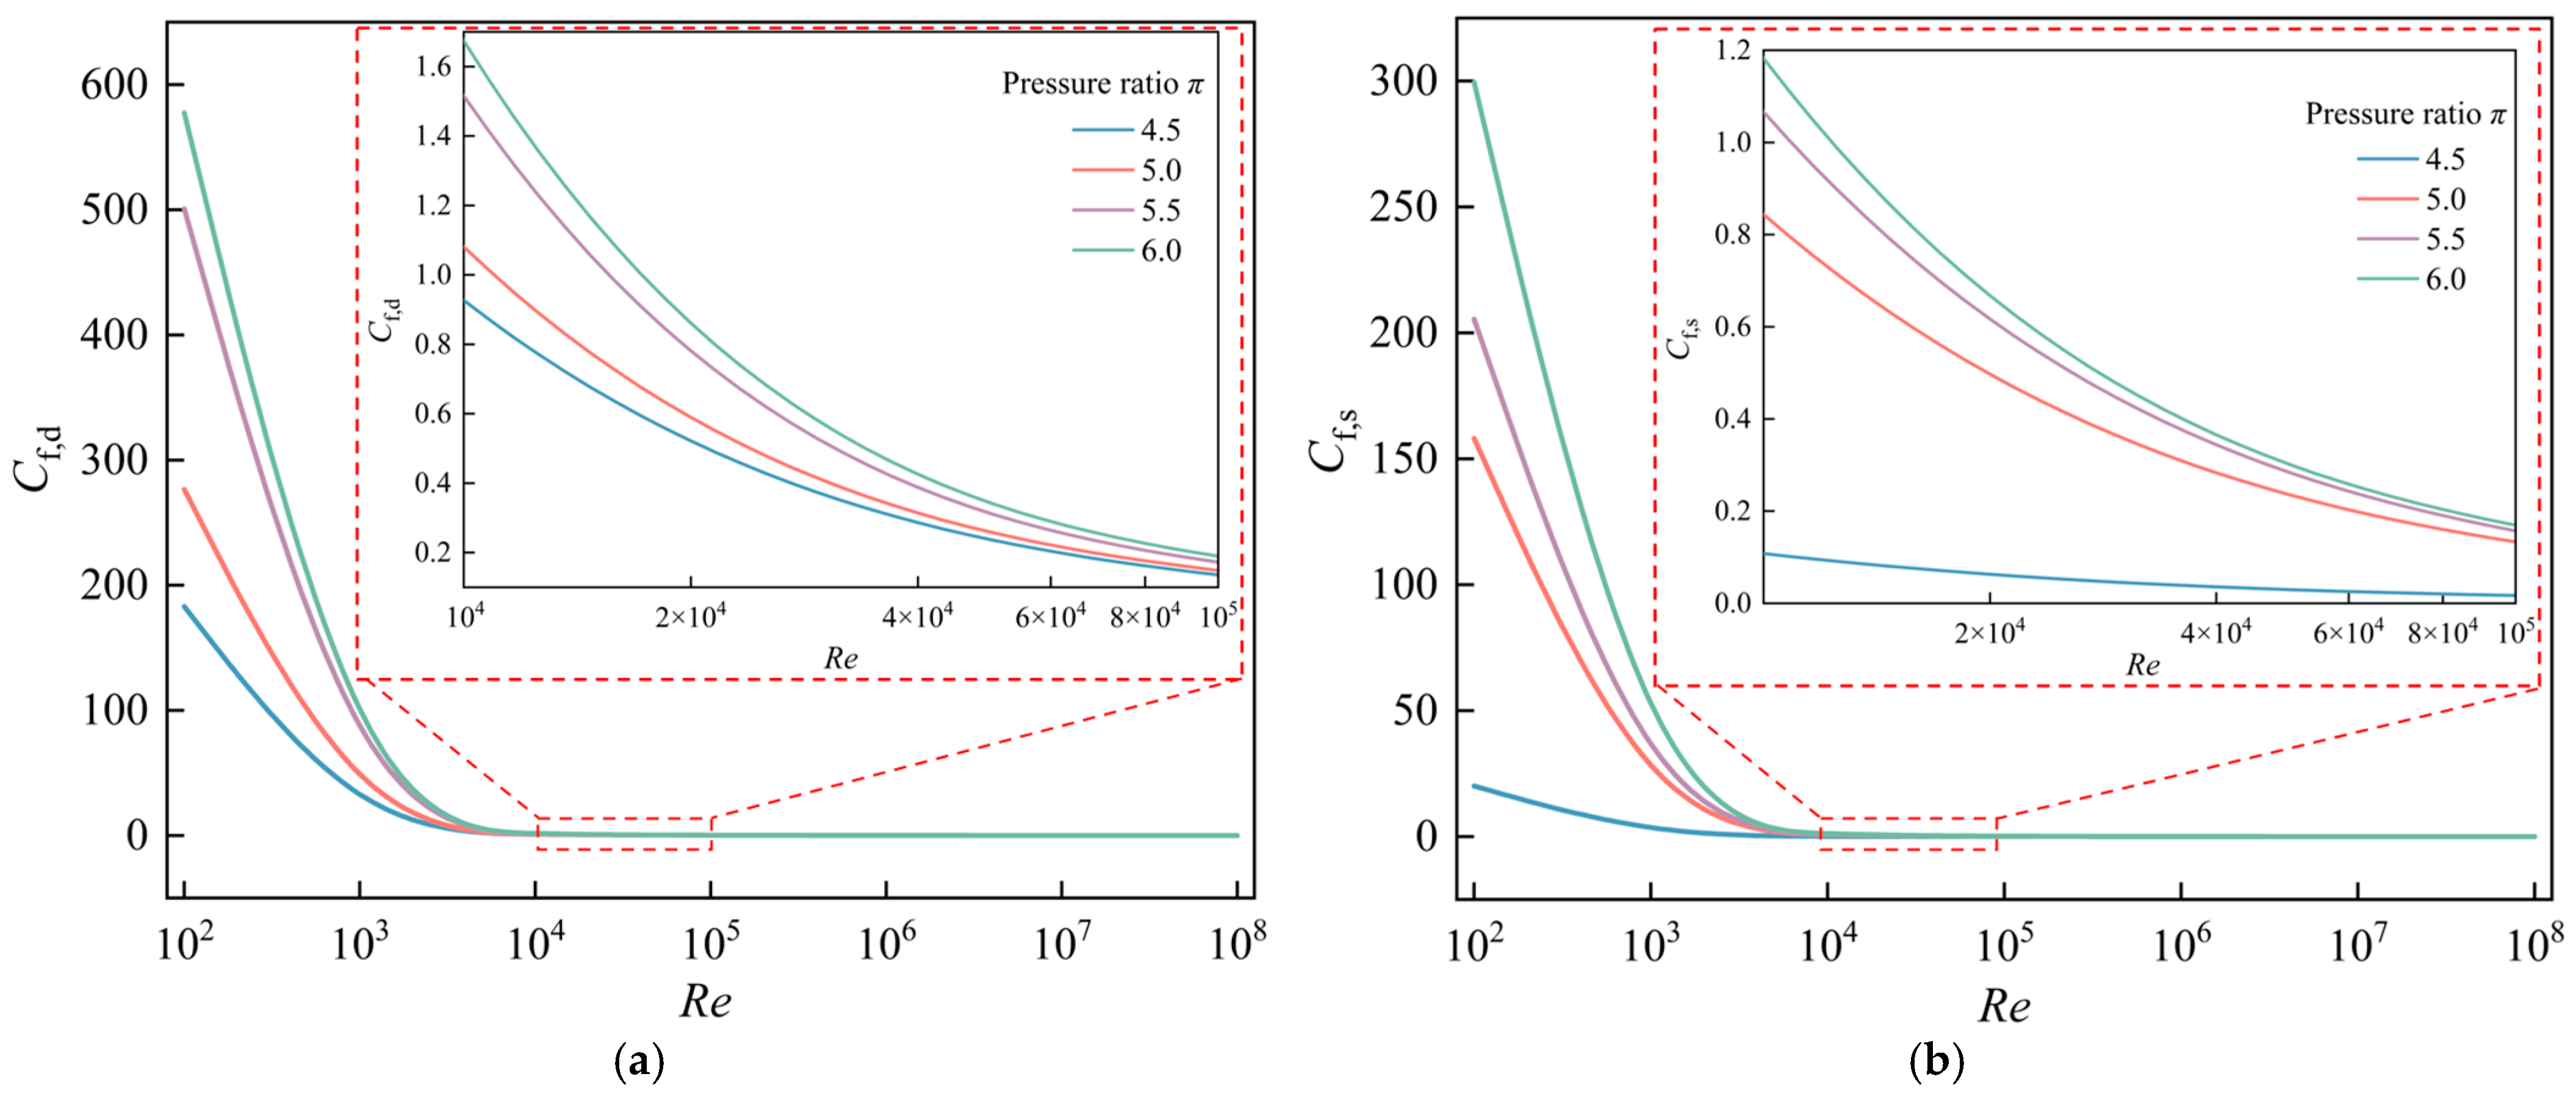
Figure 9 illustrates the behavior of
Cf,d and
Cf,s versus
Re for Case I, with a different
π ranging from 4.5 to 6.0, respectively. The results reveal that both
Cf,d and
Cf,s decrease with increasing
Re, and the decreasing rate remains unchanged when
Re ≤ 10
3 and gradually decreases to 0 for
Re ranging from 10
4 to 10
8. Consequently,
Cf,d and
Cf,s become independent of
Re while
Re exceeds 10
5. Given the variability in the rates at which
Cf,d and
Cf,s decrease with respect to
Re, the models of
Cf,d and
Cf,s in
Section 4.4 need to be segmented, with
Re being 10
3 and 10
5 as the demarcation point.
It is also observed that
Cf,d and
Cf,s increase with
π from 4.5 to 6.0 under the conditions of the same
Re since a larger
π corresponds to a higher fluid density, and thus windage loss and
Cf,d and
Cf,s are larger as known from Equations (1) and (5). Moreover, the comparison between
Figure 9a,b reveals that the
Cf,d is larger than
Cf,s, which is because disk-type windage loss is significantly greater than shaft-type.
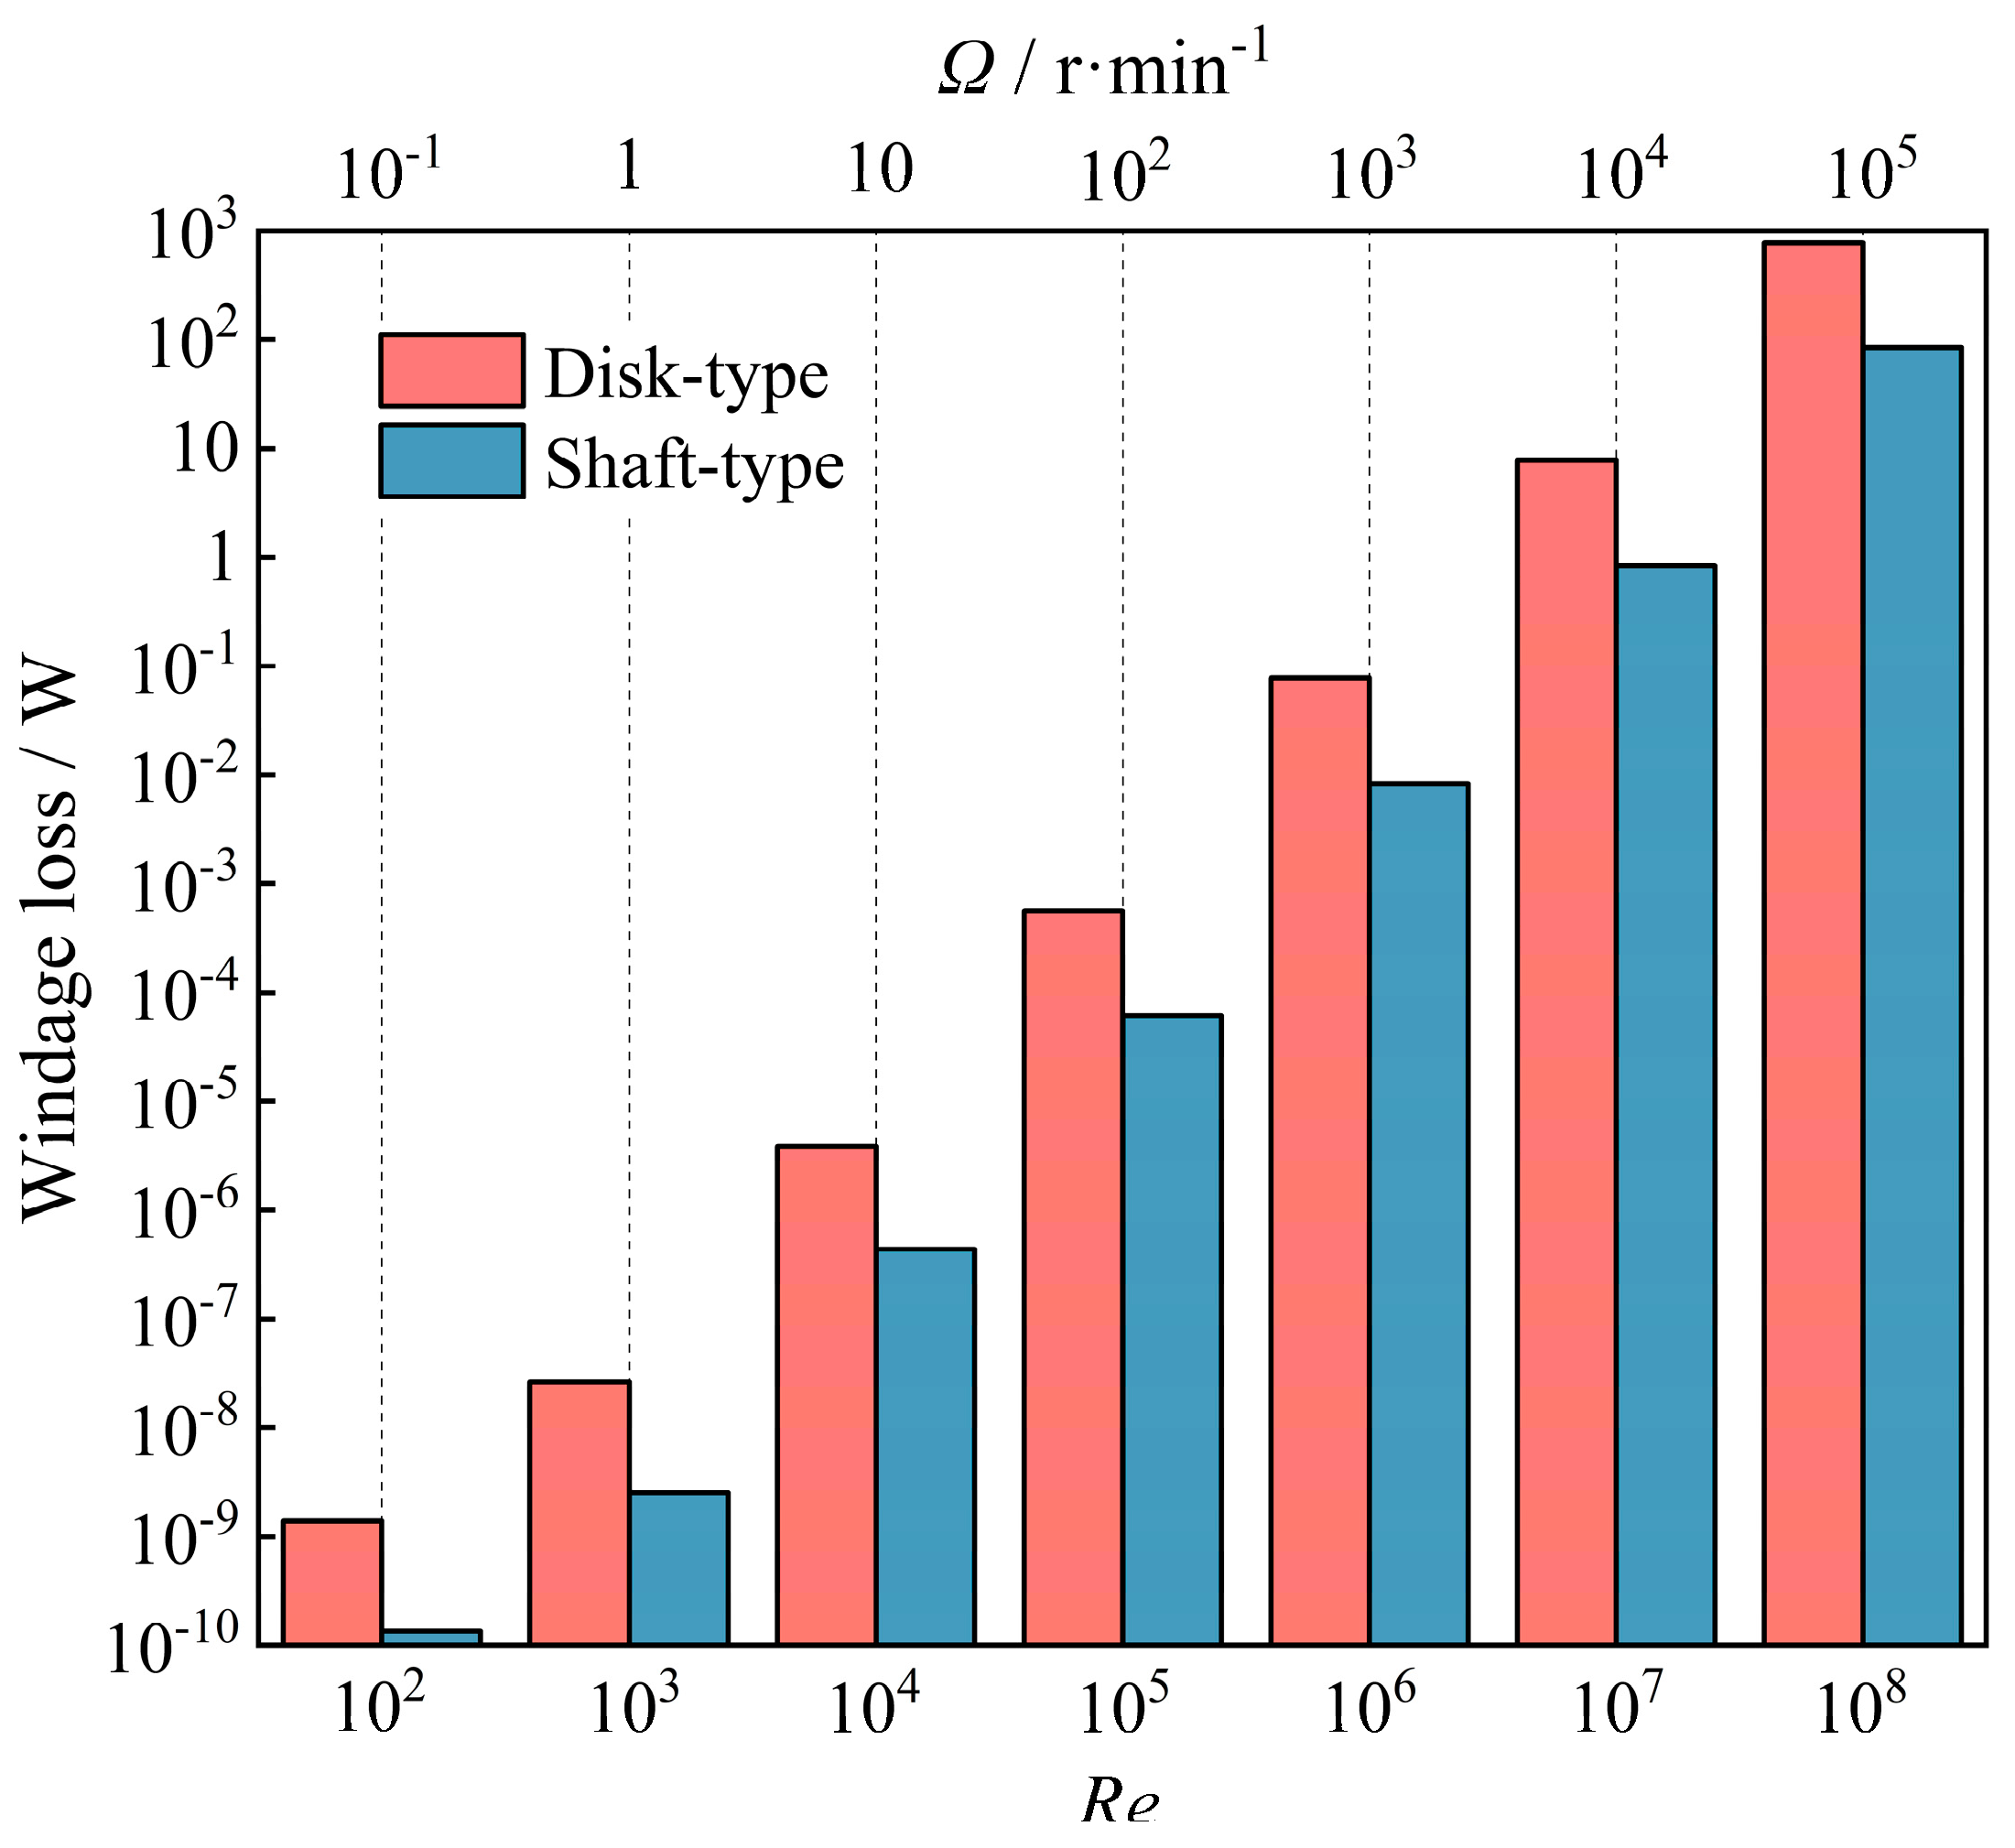
In
Figure 10, disk-type and shaft-type windage losses for
Re from 10
2 to 10
8, corresponding to rotational speed
Ω being 10
−1~10
5 r/min under
π = 4.5 conditions are presented. It is observed that windage losses rapidly increase with
Re and are much larger in disk-type gaps than in shaft-type gaps. For example, at
Re = 10
6 and
Ω = 10
3 r/min, disk-type and shaft-type windage losses are 0.08 W and 0.008 W, and at
Re = 10
8 and
Ω = 10
5 r/min, they are 780 W and 84.250 W, respectively, which is basically consistent with the findings reported by Ponceta et al. [
39].
This observation is because the impeller back gap is the primary region compared to the labyrinth seal, according to
Figure 1 and
Figure 3, leading to much larger disk-type windage loss than shaft-type, as confirmed in
Figure 10, which further supports the previous conclusions that
Cf,d is larger than
Cf,s in
Figure 9.
Figure 11 describes the proportion of disk-type and shaft-type windage losses. The proportion of shaft-type windage loss increases with
Re, while it decreases with
π. On the contrary, the proportion of disk-type windage loss exhibits the opposite trend to that of shaft-type, falling as
Re increases and rising with
π. Notably, the proportion of disk-type windage loss is consistently far larger than that of shaft-type loss under various
Re and
π conditions, with its minimum reaching 90%, which indicates that windage loss in the impeller back gap significantly contributes to total windage loss. Nonetheless, it is still necessary to consider the influences of shaft-type windage loss in the preliminary design and operation of sCO
2 compressors and TAC units.
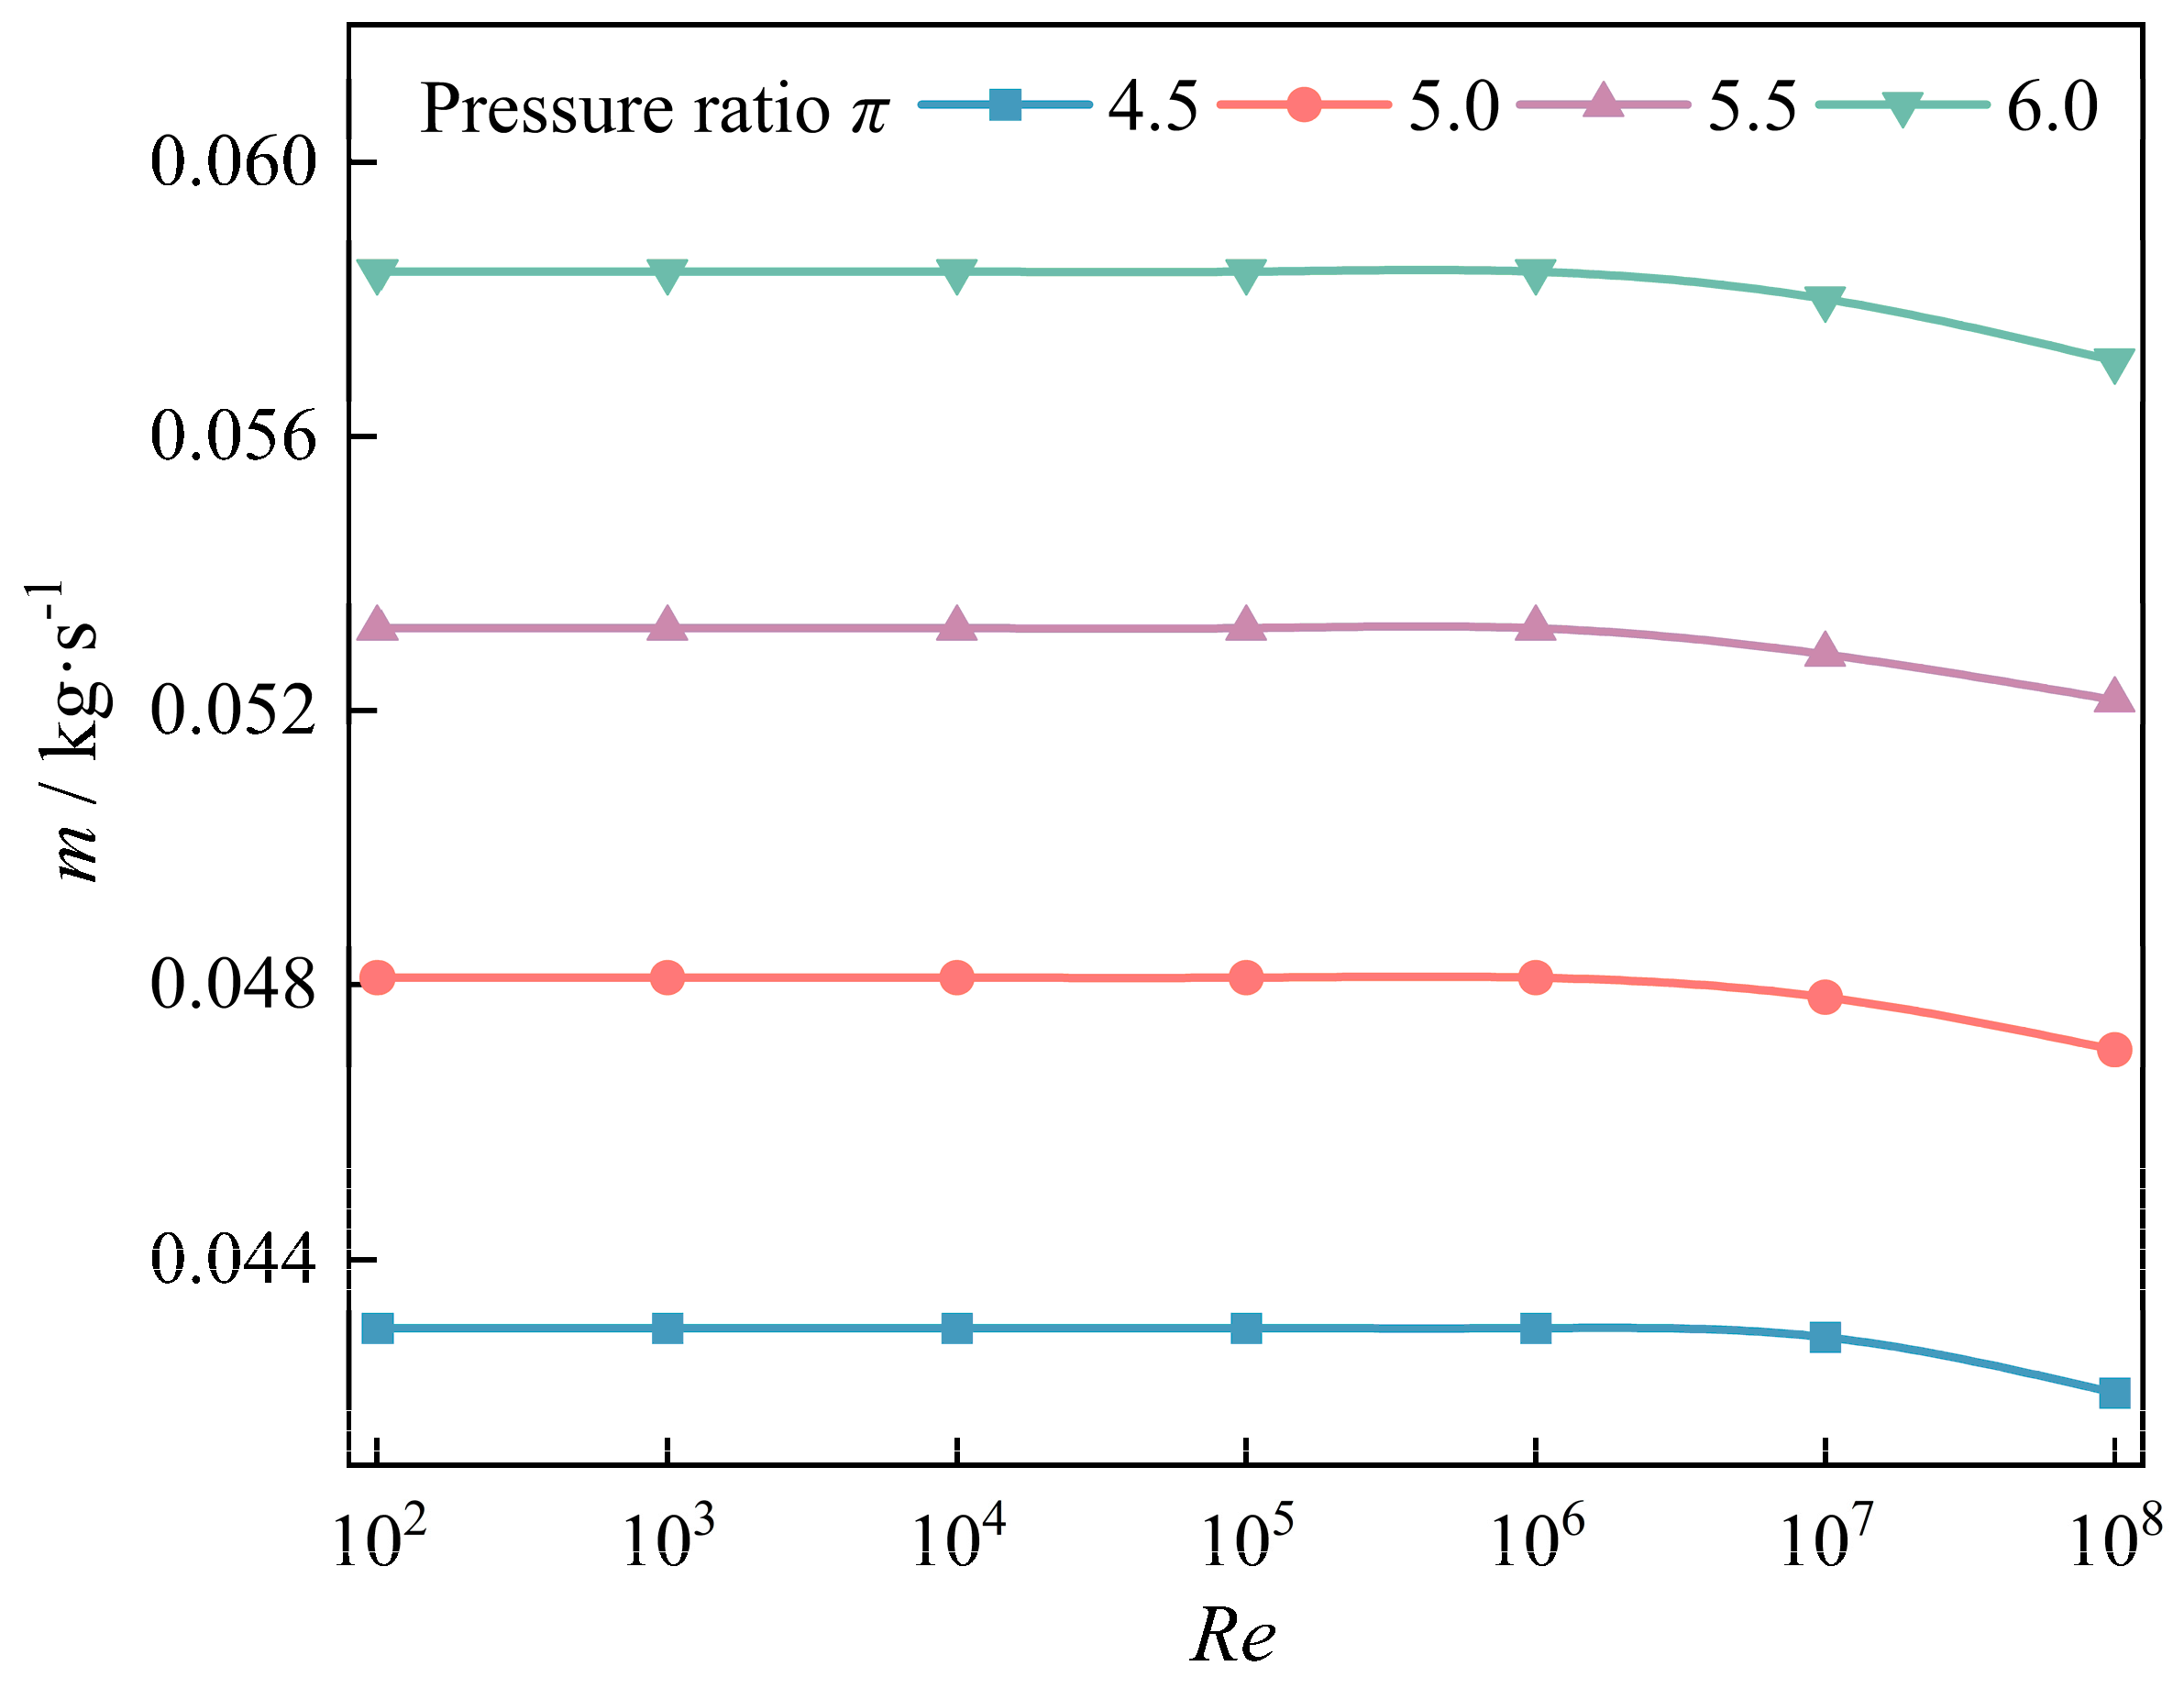
In order to evaluate the flow characteristics in the impeller back gap and labyrinth seal cavities, the leakage flow rate
m is a crucial parameter. The
m versus
Re for
π ranging from 4.5 to 6.0 is presented in
Figure 12. As the velocity of fluid in gaps is higher as
π increases, the
m gradually grows when the area at the inlet and outlet is same. Moreover, with the increment of
Re, the
m is unchanged for
Re < 10
6 and decreases for
Re ≥ 10
6. It also was found that when
Re ranges from 10
2 to 10
6, the
m is 0.0584 kg/s, and it drops to 0.0571 kg/s for
Re = 10
8 when
π = 6.0. When the Reynolds number is high, on the one hand, due to the centrifugal force of the fluid slowing down the radial flow, and on the other hand, due to the complexity of turbulence, the vortex in the gap impedes the flow of the fluid along the pressure gradient. The vortices in computational domain are fewer, and the inhibition effect on leakage flow is small due to the significantly minor influences of the centrifugal force on fluid at a low
Re, leading to unchanged
m when
Re < 10
6. However, the number of vortices increases because of enhanced flow instability when the influences of centrifugal force are more primary than that of viscous force at high
Re, which makes leakage flow in gap and labyrinth seal inhibited, thus causing
m to decrease with increasing
Re when
Re ≥ 10
6.
4.2. Flow Characteristic Analysis
To analyze the influences of
Re and
π on
Cf,s,
Cf,d, and
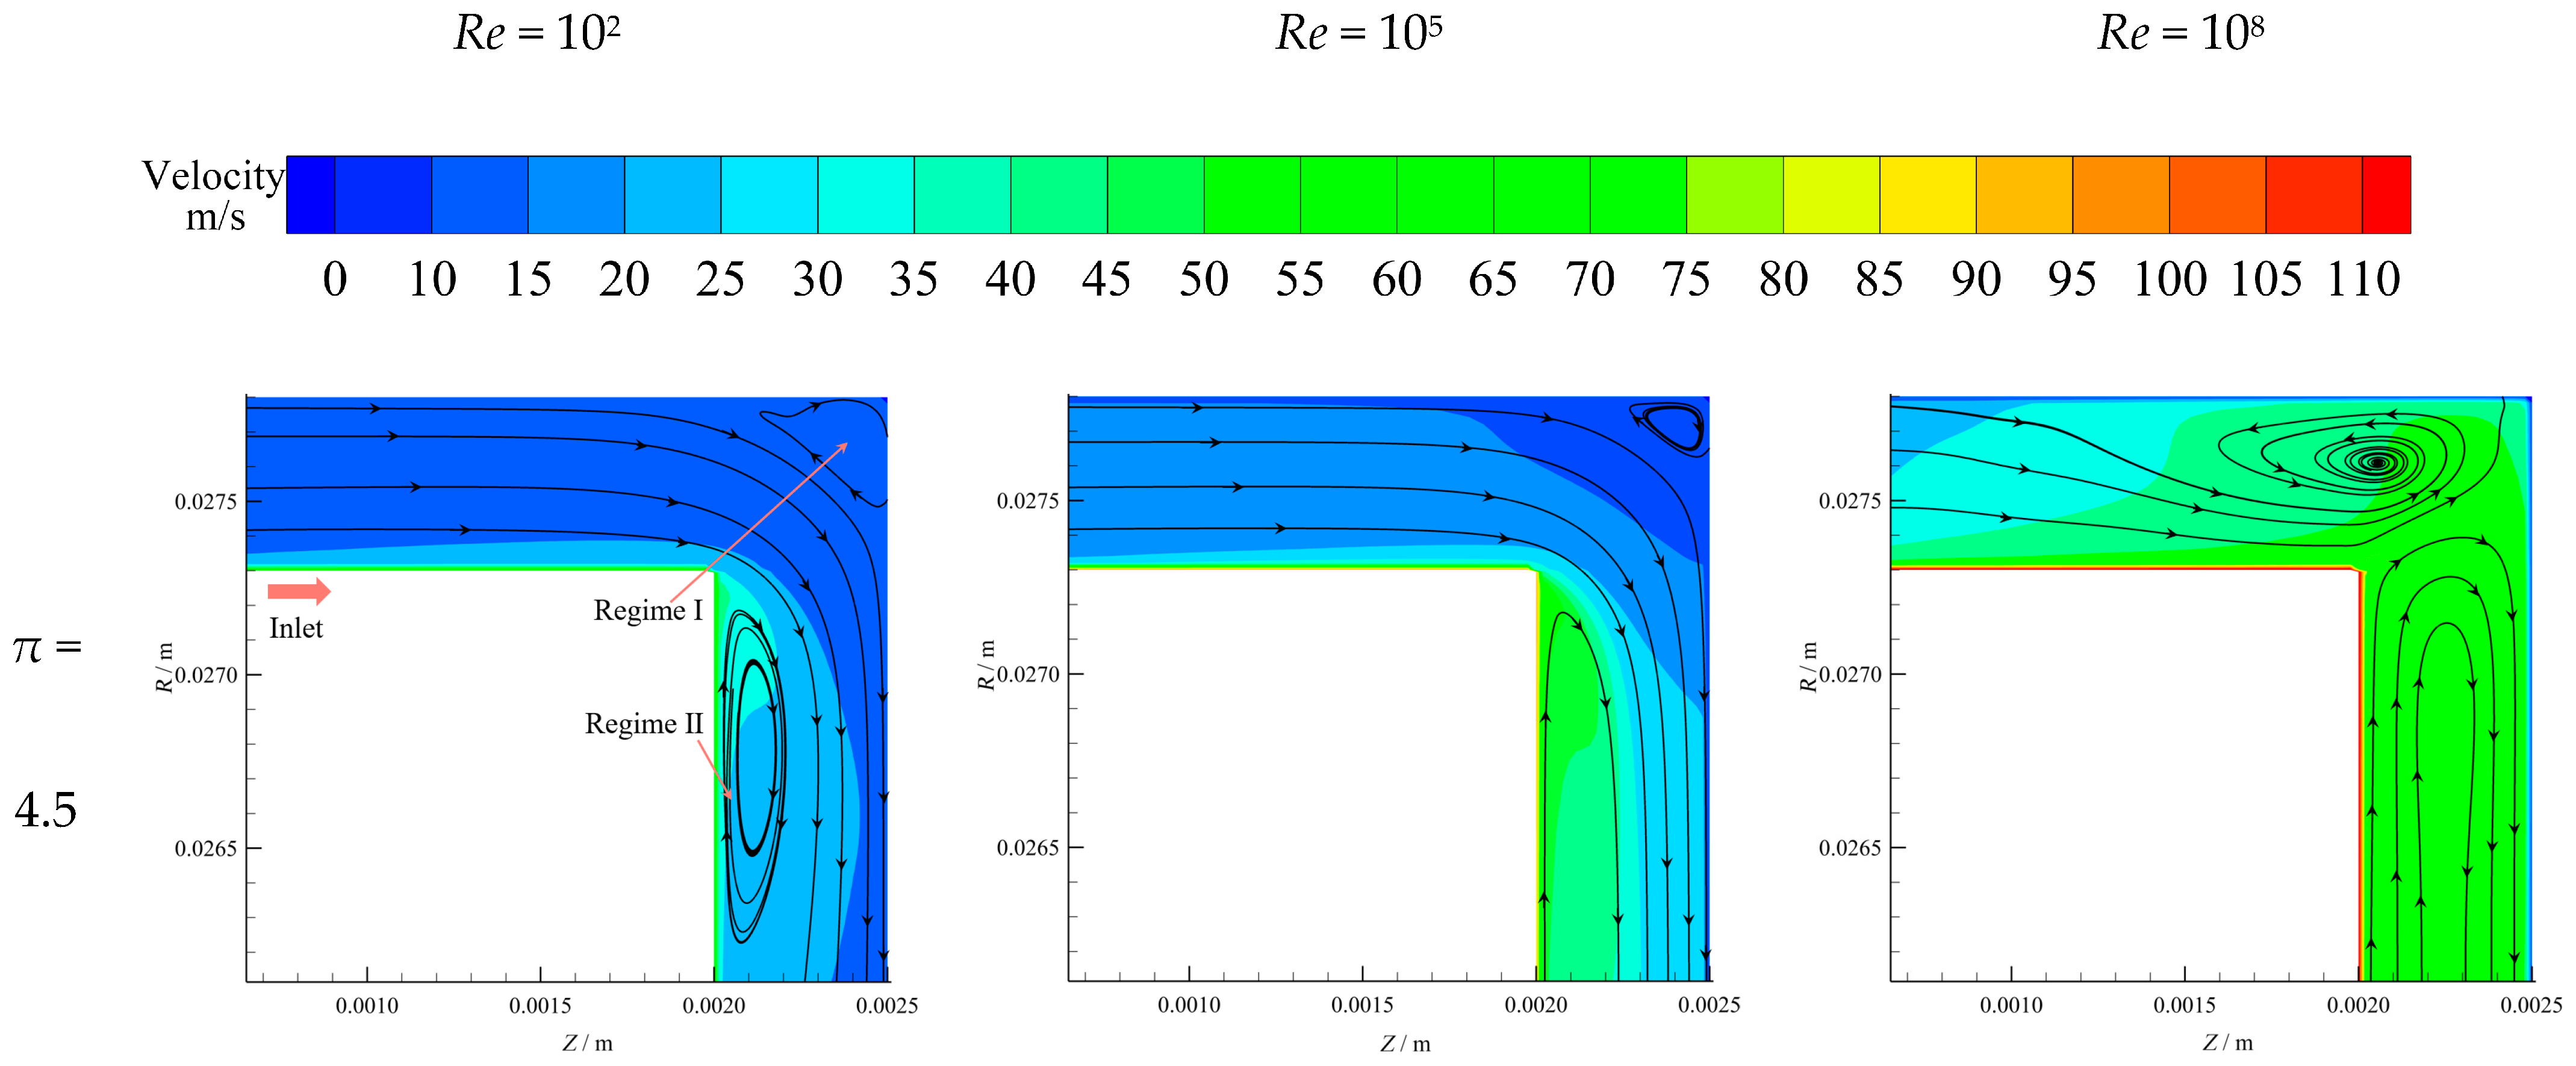
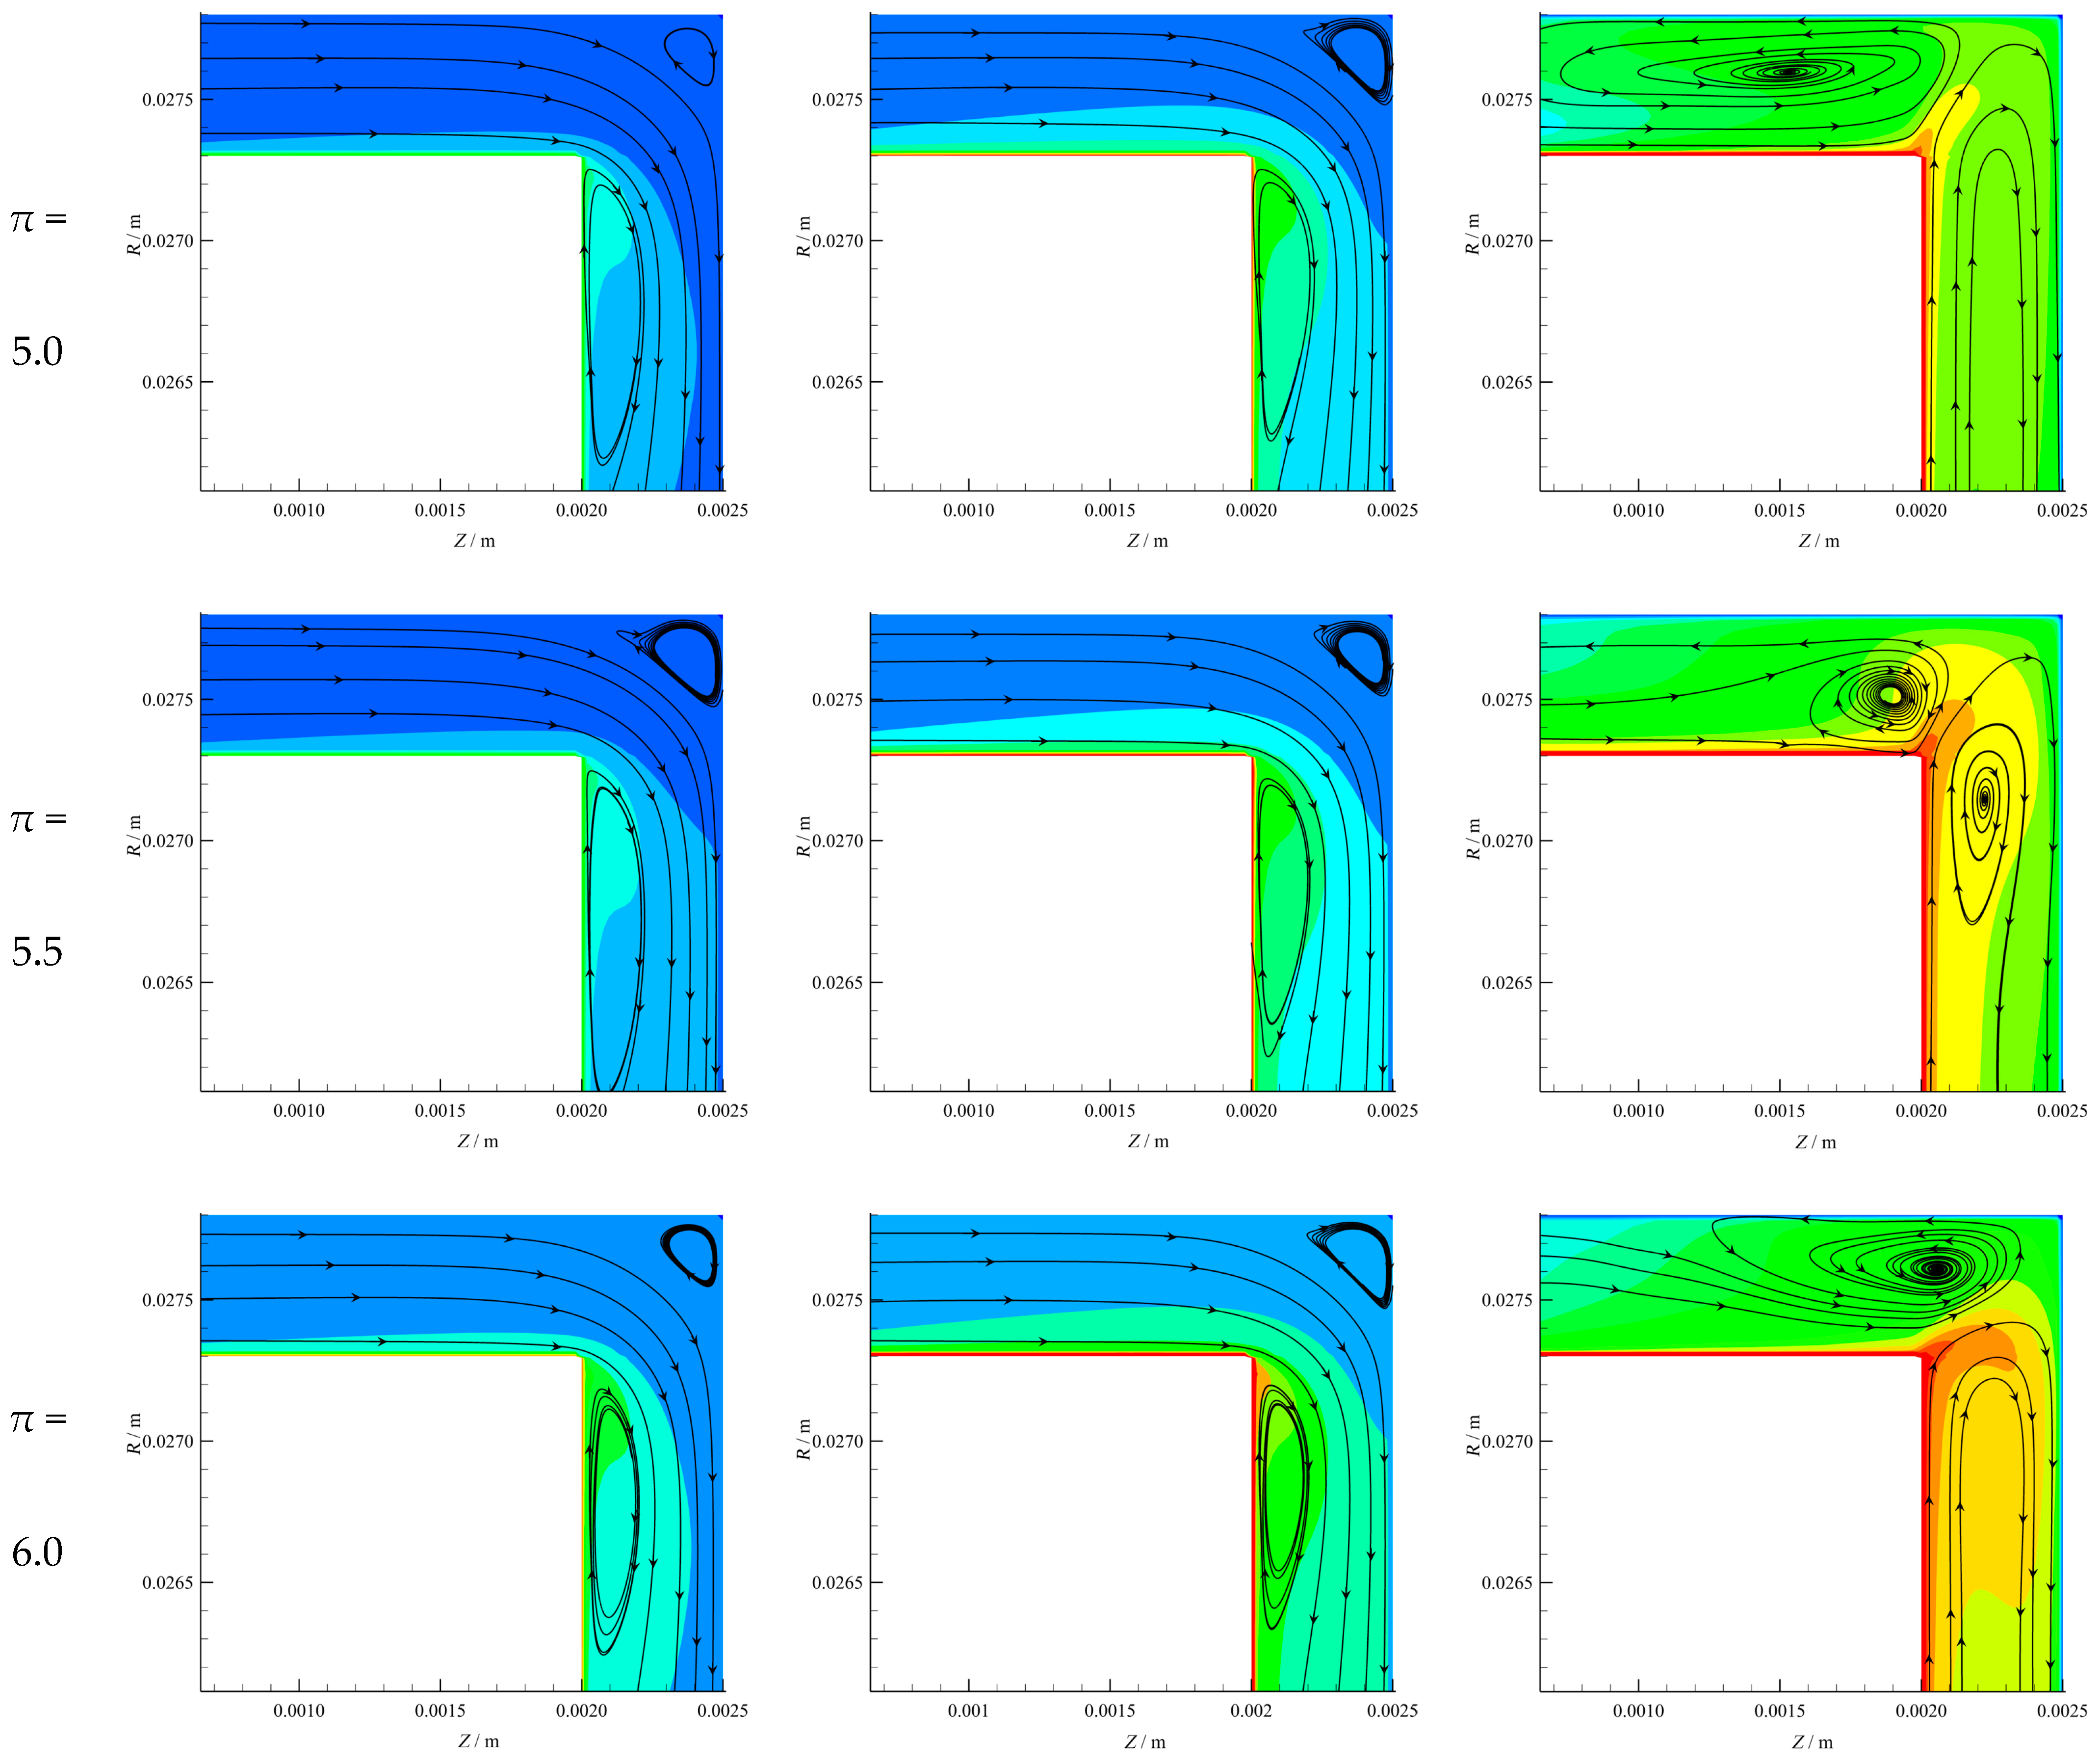
m from flow characteristics’ point of view,
Figure 13 depicts the streamlines and velocity at the inlet regions for Case I, where
Re = 10
2, 10
5, and 10
8 and
π = 4.5, 5.0, 5.5, and 6.0. It can be seen that the streamlines exhibit similar flow patterns and indicate that fluid can flow smoothly into the impeller back gap as a whole when
Re = 10
2 and 10
5. However, there are a small number of vortices in the transition regions between the inlet and impeller back gap, such as Regime I near the stationary walls and Regime II near the rotational walls. The reason for this is that the velocity direction of fluid in transition regions suddenly changes, resulting in a dramatic decrease in the velocity magnitude and generation of vortices.
As
Re increases, the centrifugal force becomes more prominent, leading to increased flow instability and the formation of vortices that fill the whole inlet region. As a result, the
m decreases with increasing
Re under
Re ≥ 10
6 conditions, as depicted in
Figure 12. Furthermore, it is also worth noting that the size of the vortices in the impeller back gap, which makes disk-type windage loss generated, increases when the
π rises from 4.5 to 6.0 under the same
Re conditions. The vortex shape at the inlet of the disk-type gap changes when the
Re increases. It shifts from being attached to the rotor wall (Regime II) to filling the entire inlet region. This is attributed to the fact that, at this point, the influence of leakage flow is weakened and the centrifugal force acts as the main role to enhance the vortex formation. The phenomenon can be attributed to the higher inlet velocity under a larger
π, which leads to the larger decreasing rate of velocity when the fluid in Regime I and Regime II change velocity direction.
The contours reveal that the velocity increases with Re and π due to a larger centrifugal force that depends on Re and the pressure difference related to π. However, the velocity diversity under different Re conditions is more pronounced than that of different π, suggesting that the centrifugal force has a more significant influence on velocity distribution than the pressure difference because its variation is smaller. Additionally, the velocity gradually decreases from the rotational walls, where fluid velocity equals the linear velocity of the rotor, to the stationary walls, where the fluid velocity is 0 due to the non-slip wall. It is further observed that as Re and π rise, the high-velocity regions near the rotational walls expand, while the low-velocity regions near the stationary walls shrink. This trend indicates that the high-velocity regions become dominant for a larger Re and π.
In addition, the streamlines and velocity contours in the cavities of the seal for Case I, with a different
Re of 10
2, 10
5, and 10
8 and a
π of 4.5, 5.0, 5.5, and 6.0 are shown in
Figure 14.
The velocity in the cavities is observed to be higher than that at inlet regions described in
Figure 13, which is due to the dramatic decrease in the through-flow area when the fluid passes through the labyrinth seal. Similarly, the velocity increases with
Re and
π, and the effects of
Re on velocity are still more prominent than
π, as previously analyzed.
Moreover, it is worth noting that there are high-velocity regions near the rotational and stationary walls and low-velocity regions at the center of the cavities. As
Re increases, the high-velocity regions grow, and the low-pressure regions decrease. On the other hand, with an increase in
π, the high-velocity regions gradually intensify, but the low-pressure regions remain primarily unaffected, which suggests that the influences of centrifugal force are more primary than those of pressure difference. Regardless of the
Re and
π values, vortices are generated within the cavities due to the velocity gradient between the walls and center, as presented in the streamlines in
Figure 14, which is a primary reason for windage loss. Nevertheless, as discussed in
Section 4.3, the windage loss in the labyrinth seal is considerably lower than that occurring in the impeller back gap, which is attributed to the fewer number of teeth and cavities presented in
Figure 14, resulting in the impeller back gap being the primary contributor to windage loss.
The pressure contour and streamlines at the outlet region for Case I when
Re = 10
4 and
π = 4.5 is illustrated in
Figure 15a. It is apparent that the pressure is unchanged in the impeller back gap and it gradually decreases from the inlet of the labyrinth seal to the outlet. This behavior indicates that the increase in velocity in the impeller back gap is relatively small compared to that in the labyrinth seal, which is similar to the conclusions drawn in
Figure 13 and
Figure 14.
At the outlet region, the pressure decreases to a minimum value of 2 MPa, which matches the boundary condition specified in
Table 3. In the last cavity of the labyrinth seal, high-pressure regions near the walls and low-pressure regions at the center are observed, which is the opposite of the velocity contour presented in
Figure 14. The reason for the discrepancy is the conservative conversion between pressure energy and kinetic energy. Furthermore, it is observed that the whole outlet region is filled with vortices because of the influences of shear stress generated by the rotational walls, which results in the leakage flow rate being inhibited.
Figure 15b illustrates the distribution of streamlines in the labyrinth seal. The vortices formed in the seal can be clearly visualized, consistent with those in
Figure 14. And a high velocity region appears at the top. After the fluid passes through the seal, a large cavity is formed between the two seals, resulting in a sudden increase in fluid volume and the formation of a strong vortex. Pressure recovery in this area is limited.
4.3. Effects of Radius Ratio
Figure 16 presents the variation of
Cf,d and
Cf,s with respect to the radius ratio
η for
Re ranging from 10
2 to 10
8 when
π is 4.5 and 6.0, respectively. It is found that both
Cf,d and
Cf,s slightly rise as
η increases, regardless of whether the value of
π is 4.5 or 6.0 under different
Re conditions. This increase is attributed to the increased flow instability and vortex generation in gaps as the value of
η becomes larger, resulting in larger disk-type and shaft-type windage losses. Further evidence supporting this conclusion will be provided later. In addition,
Cf,d is a great deal larger than
Cf,s for the same
Re and
π values, as well as
Cf,d and
Cf,s being larger at higher
π values, which is consistent with the conclusions drawn from
Figure 9. However, the impacts of
η on
Cf,d and
Cf,s have a negligible effect relative to
Re and
π, since the growing rate in
Cf,d and
Cf,s with
η is minimal.
The
m versus
η for
Re =10
2 for
π ranging from 4.5 to 6.0 is presented in
Figure 17. When
π = 4.5, the
m increases from 0.0430 kg/s at
η = 0.018 to 0.2145 kg/s at
η = 0.054, and similarly to the conditions of
π = 6.0, the
m grows from 0.0584 kg/s at
η = 0.018 to 0.3021 kg/s at
η = 0.054 due to larger through-flow area. The rate of the increase in
m is constant for different
η, indicating that the influencing degree of different
η on
m is identical. Moreover, regardless of the values of
η, the
m grows when
π grows from 4.5 to 6.0, which is consistent with the observations in
Figure 12.
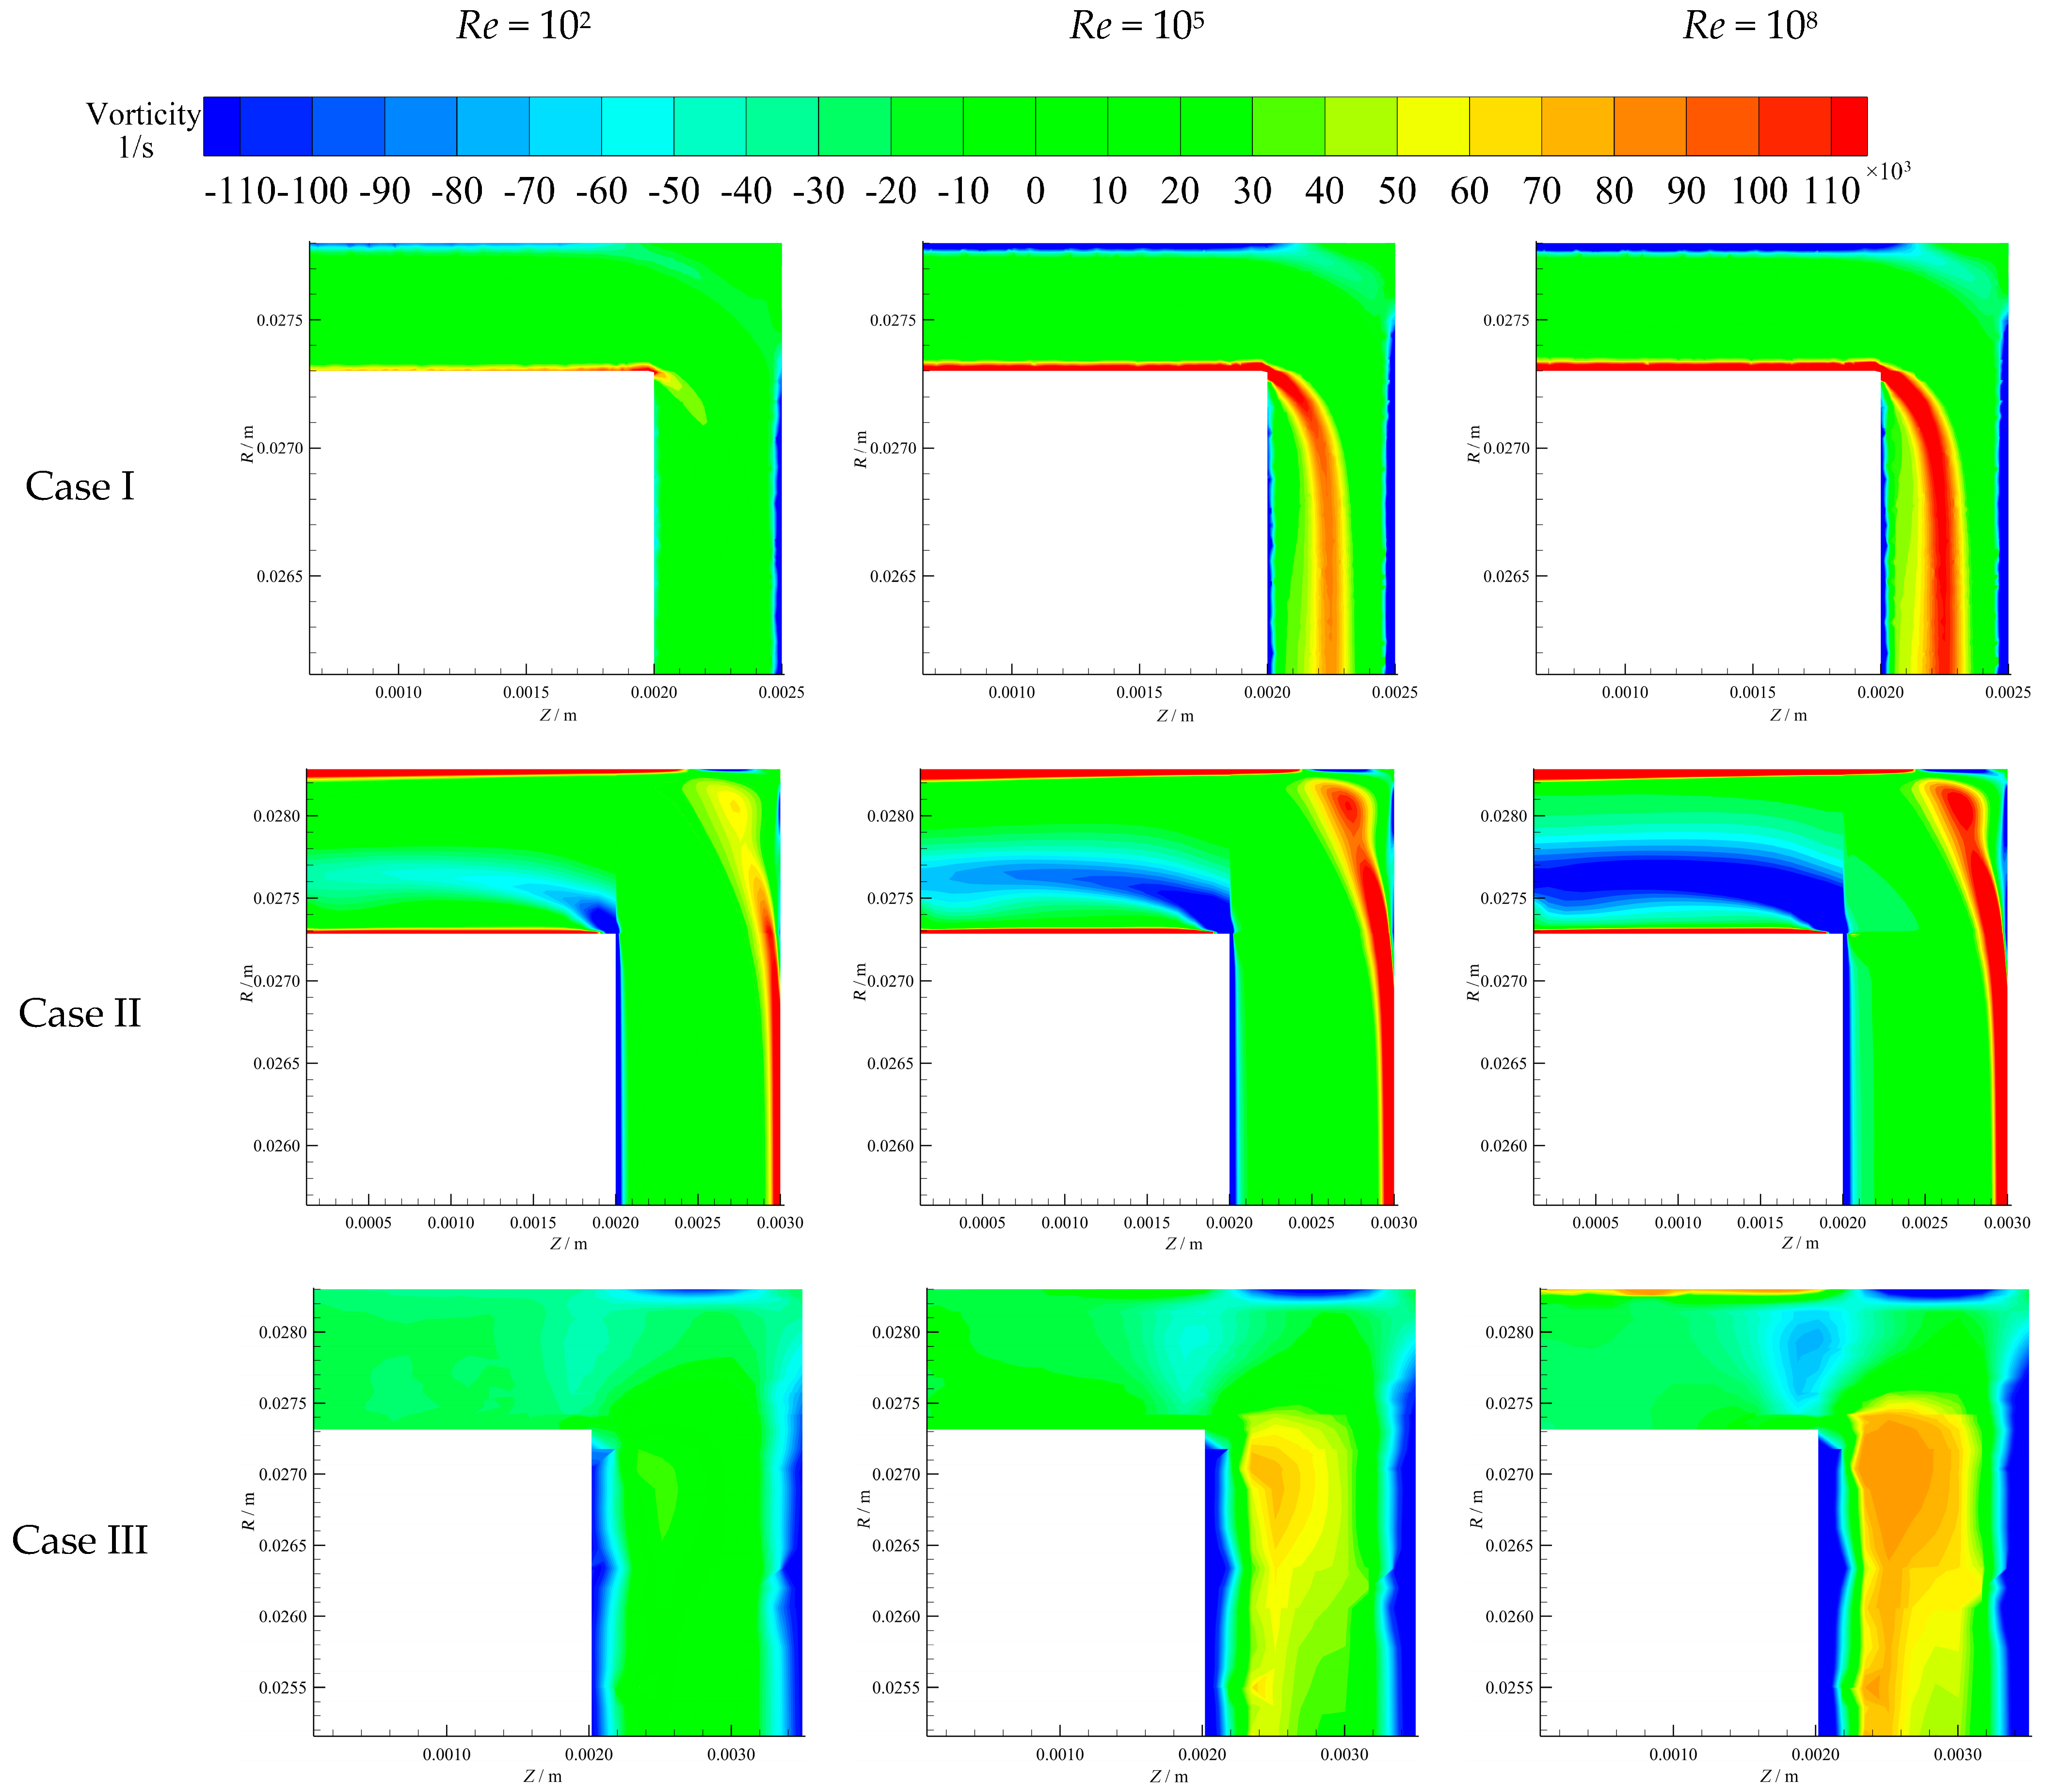
Moreover,
Figure 18 depicts the vorticity at inlet regions with
Re of 10
2, 10
5, and 10
8 and
η of 0.018, 0.036, and 0.054 under
π = 4.5 conditions in order to analyze the flow characteristics for different
η. It is noted that the red and blue regions indicate the opposite rotational direction of the vortices, but both represent larger vorticity in all contours, and the green regions mean that the vorticity is 0. From all contours, it can be seen that the high-vorticity regions expand with increasing
Re and
η, which reveals that a larger
Re, corresponding to larger centrifugal force, results in enhanced flow instability, and a larger
η makes the size of vortices increases, which indicates that the effects of vortex dissipation is the main reason for an increase in
Cf,d and
Cf,s with
η, as presented in
Figure 16. Furthermore, it is observed that the vorticity in the vicinity of the walls is considerably higher than that at the center due to the effect of the boundary layer attached to the wall, as evident in all contours. As
Re becomes larger, the boundary layer effect becomes more pronounced.
4.4. Models of Skin Friction Coefficients in Shaft-Type and Disk-Type Gaps
Based on the previous discussion presented in
Section 4.1,
Section 4.2 and
Section 4.3, it is found that the windage loss and flow characteristics in the impeller back gap and labyrinth seal cavities are relatively essential, which indicates that they cannot be neglected during the primary design and operation of sCO
2 compressors. However, the lack of corresponding models of
Cf,d and
Cf,s makes it challenging to accurately predict windage loss. Therefore, it is significantly urgent to propose models of
Cf,d and
Cf,s based on previous CFD results.
The results in
Figure 9 reveal that the decreasing rates of
Cf,d and
Cf,s vary for different
Re ranges; hence, it is necessary to segment the models of
Cf,d and
Cf,s with an
Re of 10
3 and 10
5 as the demarcation point. According to the previous analysis, the
Cf is related to
Re,
π, and
η. Thus, the models can be expressed as:
In addition, following the approach of Daily [
19] and Bilgen and Boulos [
27], the
Cf is to be written as follows:
Adopting the Least-Square Method, the models of
Cf,d and
Cf,s are listed in
Table 6. It needs to be noted that the models are only applicable to the conditions where
Re is 10
2~10
8,
π ranges from 4.5 to 6.0, and
η is 0.018~0.054.
According to the Least-Square Method, the higher fitting accuracy for the models is indicated by SSE and R2 values approaching 0 and 1, respectively. In this paper, the maximum SSE and minimal R2 are 5.62 × 10⁻⁷ and 0.940 for models of Cf,d, and 2.43 × 10⁻⁶ and 0.917 for models of Cf,s, demonstrating that the fitting accuracy of models is remarkably high.
CFD simulations are used to calculate the values of
Cf,d and
Cf,s for the different
Re in the impeller back gap, based on the dimensions and boundary conditions presented in
Table 7, which are applicable to the sCO
2 compressor designed by Cao et al. [
30] to assess the reliability of models. It needs to be pointed out that the dimensions of the labyrinth seal are consistent with those listed in
Table 1.
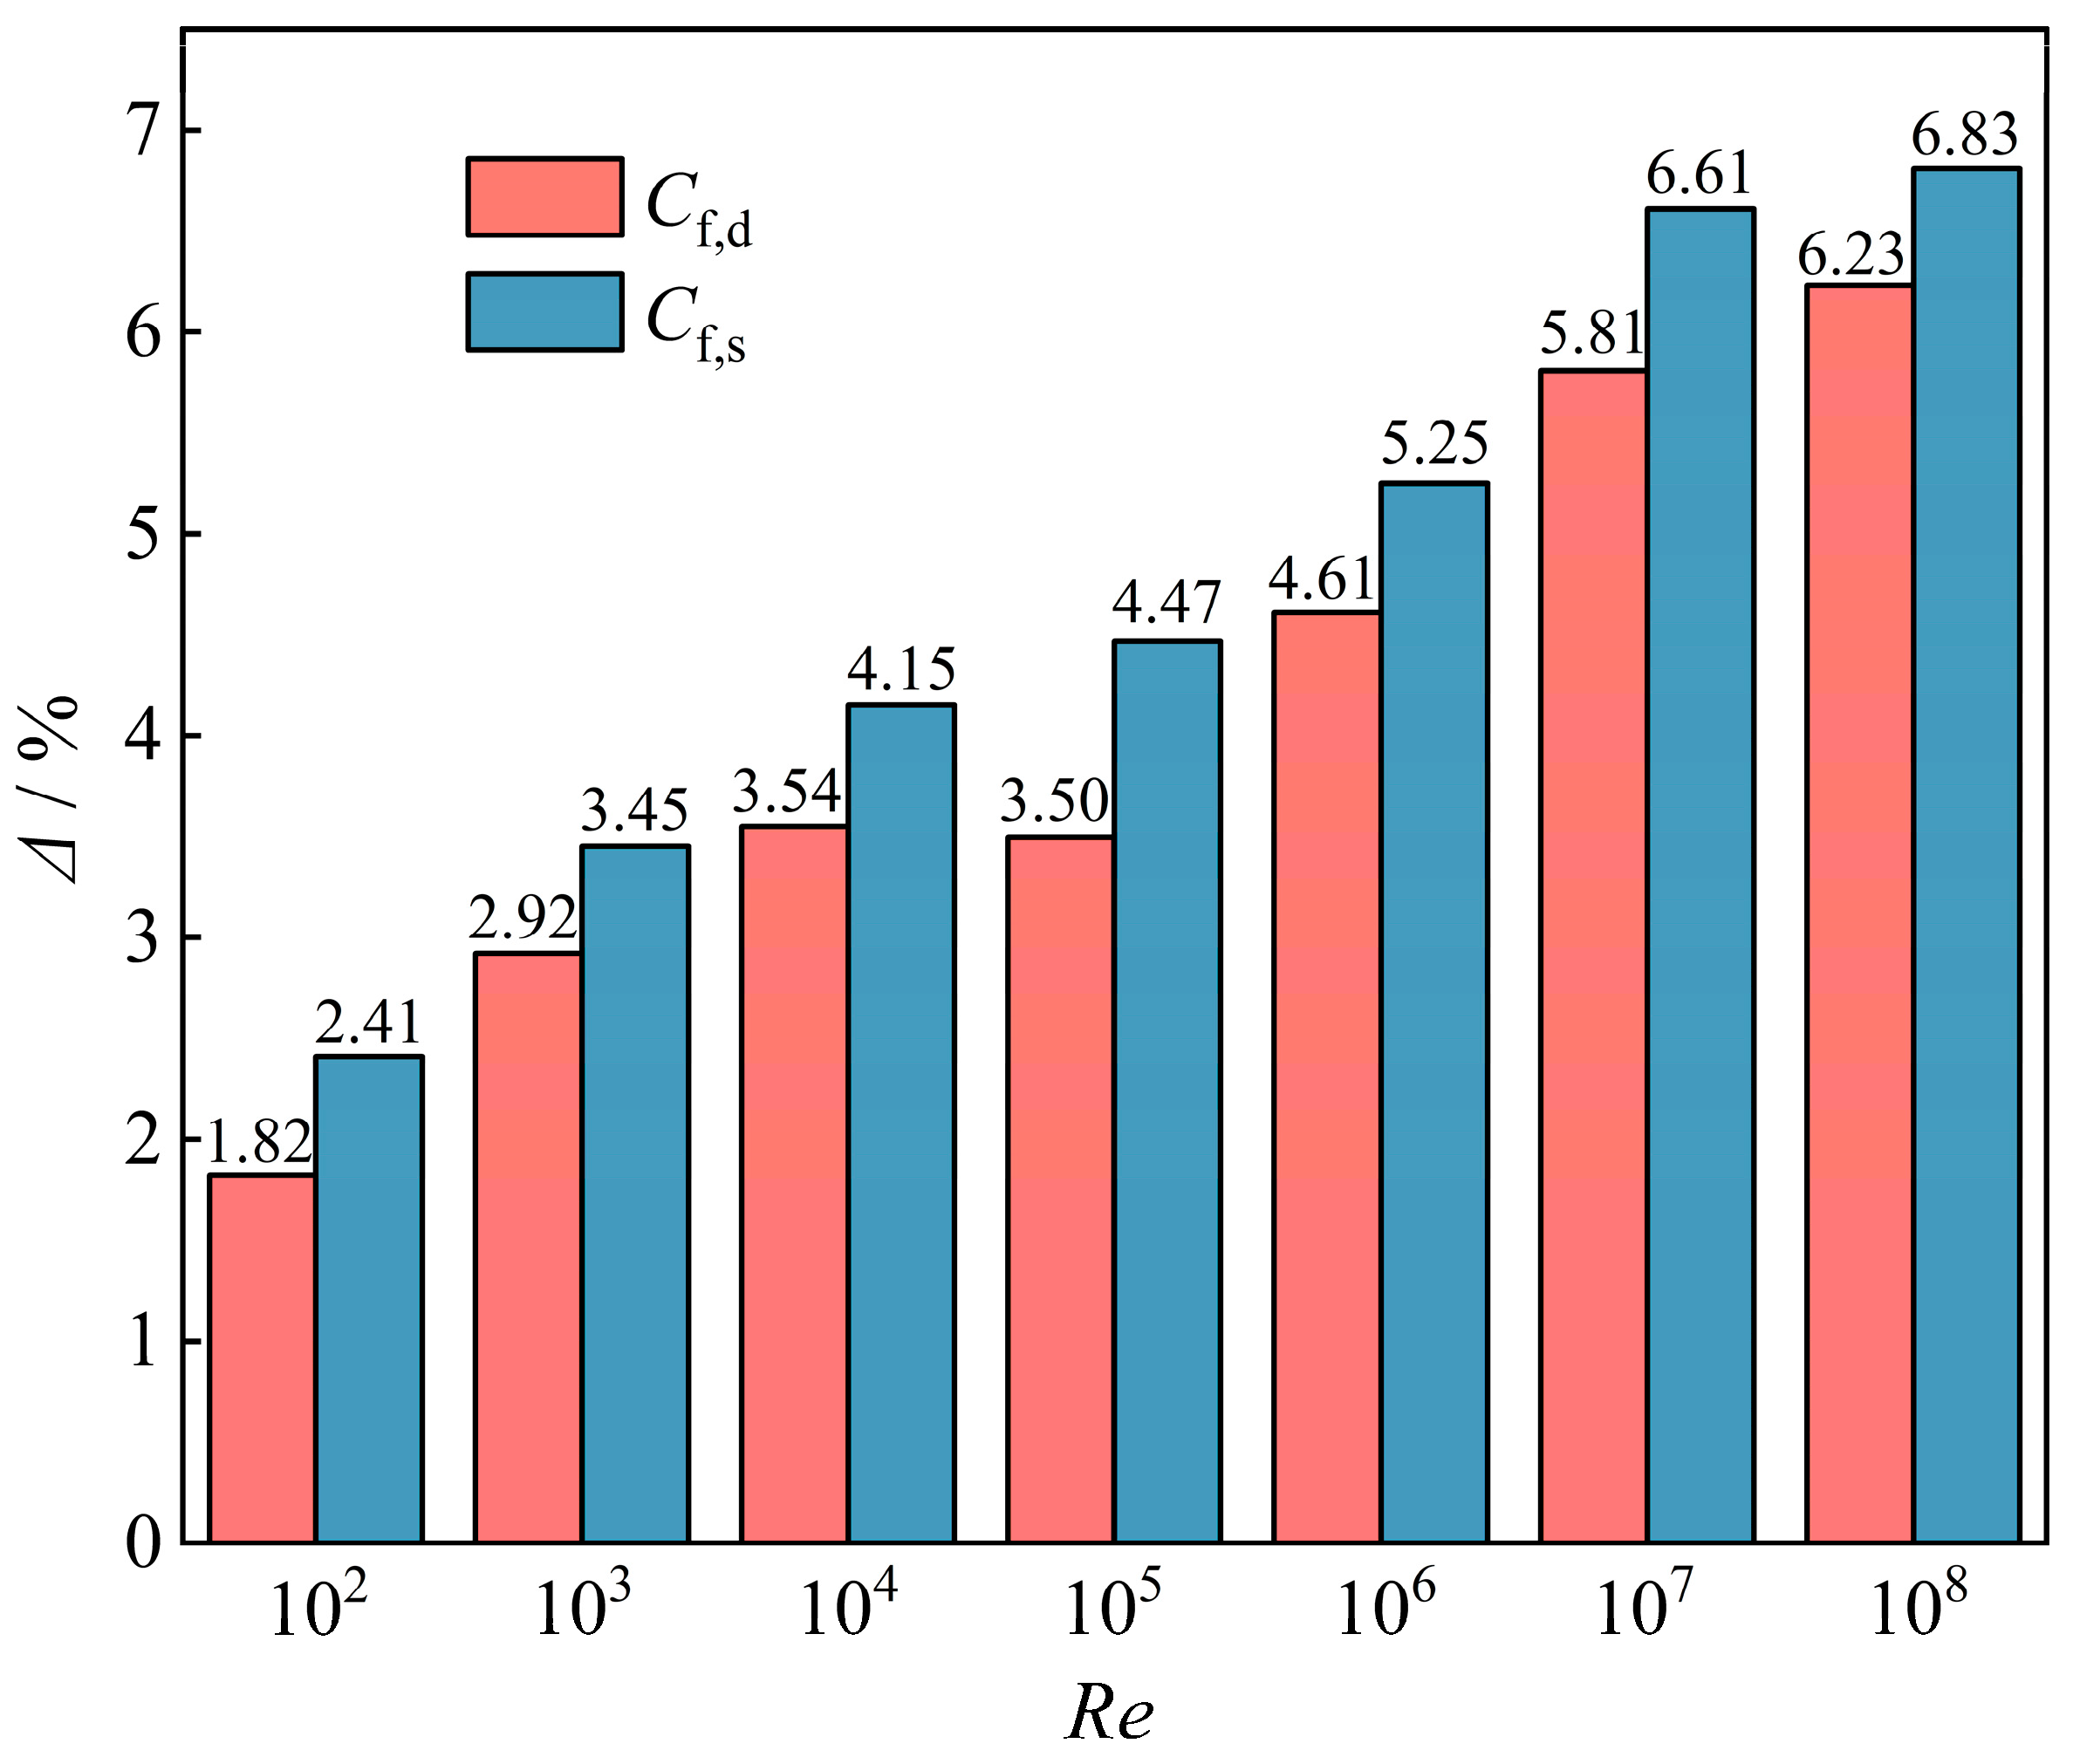
To quantitatively assess the predictive accuracy of the models, the relative deviation
Δ is defined, and
Figure 19 illustrates the relative deviations
Δ of
Cf,d and
Cf,s for
Re ranging from 10
2 to 10
8.
It is noteworthy that the Δ is small, with maximum values of 6.23% and 6.83% for Cf,d and Cf,s. These results demonstrate the excellent agreement between the predicted values and CFD simulations, indicating that the proposed models can predict windage loss in the impeller back gap and labyrinth seal cavities.
The design of the sCO
2 compressor in engineering practice can refer to the windage loss models in
Table 6 and Equations (2) and (7). In order to reduce windage losses and increase the compressor efficiency, the following suggestions are given. Firstly, the rotational speed and windage loss present a cubic relationship; it is very effective to reduce the rotational speed in a reasonable range. Secondly, reduce the radius ratio under the condition of axial-thrust compliance. Finally, increase the sealing outlet pressure to reduce the pressure ratio, which can effectively reduce the windage loss.


