1. Introduction
The tire is a crucial component of vehicle dynamics but also presents significant environmental challenges. Through its contact patch, it transmits all forces and moments—such as those from acceleration, braking, cornering, and rolling—to the ground. In recent decades, tire development for passenger cars has focused on improving overall vehicle performance while maintaining a balance with factors like wear and durability. A key advancement has been the shift from viewing tires as passive components to integrating them into active vehicle control systems, leading to the concept of the intelligent tire [
1,
2,
3,
4,
5,
6,
7,
8,
9]. However, this approach relies on additional sensors and components, which increase the tire’s environmental impact. Given that tires are already a major source of microplastics and other harmful emissions, this creates a dilemma between enhancing vehicle safety and reducing ecological harm. To resolve this, it is essential to rethink tire design, explore new structural concepts, and evaluate alternative materials. In addition to their critical role in vehicle dynamics, tires have a significant environmental impact throughout their lifecycle. Their production emits large amounts of greenhouse gases [
10], while tire wear releases microplastics into the environment [
11]. Furthermore, vulcanized rubber presents significant limitations for reuse in the manufacture of new tires, or other applications, which makes recycling a major challenge [
12,
13,
14,
15]. Annually, over three billion tires are manufactured and sold globally, with approximately 310 million units within the European Union alone [
16]. With millions of tires in use worldwide, advancements in this field are crucial. These efforts align with several Sustainable Development Goals (SDGs) set by the United Nations in the SDG2030 framework.
The design of eco-friendly tires presents several challenges and has led to various lines of research. Recently, improvements have been proposed in the use of different materials, such as oil palm fiber [
17] and silica [
18], to reinforce rubber compounds or as ecological fillers in synthetic rubber [
19]. Green super elastomeric materials have also been proposed [
20], as well as specific techniques to test and evaluate the properties of new green tires [
21]. These studies show that properties such as tensile strength, elastic modulus, strain at break, wear resistance, and hardness depend on the casing–tread joint systems used. Therefore, developing materials for eco-friendly tires requires a deep understanding of these joining systems, making them a key factor in the design of future sustainable tires.
Furthermore, tire end-of-life management remains an unresolved challenge [
22]. Some studies examine the strategies used in different countries and their impact on the sustainable development of smart cities [
23]. In terms of technical solutions, a promising research project has explored the use of shredded tire rubber as a low-cost reinforcement in materials like rigid polyurethane foam [
24]. Other studies focus on incorporating new materials into rubber compounds and using tire waste as sustainable fill [
25], while many propose repurposing tire waste for pavements [
26,
27] or, more broadly, for construction materials [
28]. All these solutions, and others in the future, make more sense if the amount of material to be recycled is reduced. Given that more than 80% of the material used in a tire is in the casing, increasing its life would mean a reduction in the waste generated and would make it easier for these recycling strategies to be sufficient to address the problem.
From this perspective, in addition to maintaining or improving the current performance of tires, it is essential to reduce the environmental and health impacts associated with their entire life cycle. However, the current need to use rubber matrix-based materials in both the casing and the tread for a proper bonding between them, greatly limits the possibility of introducing materials with a lower environmental impact [
29,
30]. For this reason, it is essential to develop new strategies for introducing biocompatible materials in the manufacture of treads, since this element is subject to wear and is the primary contributor to the generation of microplastics in tires. The ability to design the tire casing and tread independently is essential, and to this aim it is proposed to separate these two components and optimize both their design and material selection to better meet their specific requirements. This approach marks a turning point compared to current re-treaded tires.
In this context, a new tire concept called “ECOTIRE” has been proposed, signaling a promising direction for further study and development, based on:
2. Intelligent Tire Requirements for the New Concept
Key parameters such as rotation speed, inflation pressure, and supported load are essential for evaluating a tire’s ability to transmit forces to the pavement in both longitudinal and lateral directions [
31]. These forces are closely tied to the balance between required and available grip in various conditions. In the development of intelligent tires, grip estimation has been a fundamental aspect, with strain measurements serving as a primary tool. To explore this further, the research team developed two intelligent tire prototypes based on existing models, as shown in
Figure 1. The results demonstrate the promising capabilities of instrumented tires.
Various studies have successfully extracted valuable insights from tire deformation data, leading to improved estimates of parameters such as pressure, angular velocity, tire load [
32], slip angle, and lateral force [
33], requested lateral grip [
34], camber angle [
35], effective radius, and contact patch length [
36]. More recently, this research has focused on the combined grip in both longitudinal and lateral directions [
37,
38,
39]. These advancements have enabled the development of slip detection systems that provide critical data to driving assistance systems, helping to anticipate slippage and support functions like stability control, traction, and braking assistance.
While these results emphasize the potential of instrumented tires, their broader adoption requires reducing both the cost and complexity of the instrumentation. Additionally, it is essential to integrate these components into more durable tires, allowing the electronic systems to function over longer distances or, ideally, throughout the vehicle’s entire lifespan.
A conventional rubber-based casing, when paired with an appropriate protective coating, could offer a viable solution for enhancing service life and supporting the necessary instrumentation. Promising research suggests that coatings made from polyurethanes and silicones, when properly applied, can effectively shield rubber from degradation caused by ultraviolet radiation, humidity, and temperature [
40,
41,
42]. Since the casing experiences significantly less wear than the tread, its lifespan can be extended by three to five times if properly protected from environmental factors. Given that this component makes up more than 80% of the tire’s weight, it plays a crucial role in reducing overall waste generation.
To address the distinct challenges posed by both the casing and tread, it is essential to explore alternatives to the current tire structure. In collaboration with the technological company Advantaria, the ECOTIRE research initiative focused on removable tread was launched. Advantaria brings expertise in similar tire structures, originally developed for military vehicles to enhance their durability and even incorporate armor [
43,
44,
45].
3. Design Requirements for Casing–Tread Mechanical Connections
One of the most critical aspects in designing this new tire concept is the connection between the casing and the tread. This connection should allow for easy assembly and disassembly, ideally without vertical load on the tire. The process should involve deflating the tire, replacing the tread, and then inflating it again. Therefore, when considering potential connection designs, the following objectives are outlined:
The materials used to manufacture the tread must contribute to reducing its environmental impact (being biodegradable in the best case), although its composition does not allow it to adhere to the casing.
The manufactured tread, in addition to reducing its impact on the environment, must allow it to adapt to different rolling conditions (asphalt, mud, snow, etc.). In this way, if its replacement is simple and quick, the one that best adapts to the use intended could be installed for each situation.
The tread must stay securely attached to the casing under all dynamic conditions. To achieve this, while maintaining ease of replacement, it appears suitable to connect both surfaces solely through the tire’s inflation pressure. This necessitates a detailed study of the geometry to create an effective joint based on friction and form fit.
The transmission of longitudinal and lateral forces with this new tire concept, ECOTIRE, must satisfy the same requirements that current tires meet, without separation of its elements and achieving equivalent values of maximum grip.
Considering that the materials of both parts of the tire must be developed in parallel to the design of the connection mechanism, it is not possible to accurately know the coefficient of friction between both surfaces. In these first phases of the design, the geometry of the surfaces to be joined is studied to meet all the stated requirements.
3.1. Study Based on Dynamic Boundary Conditions
The first step to design the appropriate joint geometry to optimally transmit the forces from the tire to the pavement was to carry out simulations of a vehicle in complex maneuvers and analyze the evolution of the transmitted forces. For this, a standard D-segment car was selected, with a mass of 1600 kg, a total length of 4500, and a wheelbase of 2800 mm. The test maneuver selected was the double lane change (DLC) [
46].
This maneuver was performed at various speeds, all of which exceeded the grip limit at some point during the maneuver, as illustrated in
Figure 2, where the vehicle passes the test at 50 km/h, but at 55 km/h it no longer passes, thus determining the limit of the vehicle in this test and distinguishing between controlled and uncontrolled sliding conditions. The pavement selected for the tests is a conventional asphalt surface, dry and well-maintained, with longitudinal grip values ranging between 0.8 and 1.
The analysis of the longitudinal and lateral forces achieved in these simulations allows the calculation of the resulting tangential force, F
t, the total requested grip, μ
t, and the angle, θ, between the resulting tangential force and the longitudinal direction of displacement, or direction of advance, OX, as indicated by Equation (1).
Figure 3 illustrates these three parameters for the left front tire (where the maximum forces are registered) under the previously mentioned simulation conditions. From these curves, a more accurate analysis of the forces that the tire must transmit can be carried out, studying their evolution both in magnitude and direction. This dynamic analysis will allow the identification of the maximum force vectors that the joint between casing and tread must support and transmit, allowing the establishment of an appropriate initial geometry to effectively transmit these mechanical stresses.
Although this is a dynamic reference test with the possibility of numerous other tests to enhance the study, the analysis leads to the following conclusions:
For a general-purpose tire, there is no preferred direction in which the tangential force is transmitted. There is an equal probability of transmitting force in any direction contained in the contact plane.
The grip constrains the maximum transmitted force, and in the same way, the force that the casing–tread mechanical joint must withstand is determined by the maximum tire–pavement grip.
As is well known, the tire–pavement grip is different for the OX and OY directions, with the usual values in conventional tires being close to 1 and 0.8, respectively. In the case of combined efforts, the total combined grip approaches the greater of both values.
Based on the vertical force that a tire must withstand in dynamic conditions, Fz, and the maximum available grip based on that load, it is possible to estimate the maximum force that can be transmitted for each type of tire and, therefore, it must withstand any geometric connection that is designed between casing and tread.
3.2. Analysis of Parameter to Determine the Geometry of the Casing–Tread Mechanical Connection
The preliminary dynamic study allowed us to propose various geometries that could be suitable, including grooved, chevron, pyramidal shapes, etc.
Of this last proposal, the pyramidal geometry with a rhomboidal (diamond) base provides several notable benefits. Firstly, during the assembly and disassembly of the tread, this geometry offers enhanced stability and alignment, making the process more efficient and reliable. Additionally, the unique shape of the rhomboidal base facilitates a secure fit, reducing the likelihood of slippage or misalignment over time. Moreover, in terms of force transmission during operation, this geometry excels due to its ability to evenly distribute mechanical stresses across the tread surface. The pyramidal structure effectively distributes forces, minimizing tire wear and improving overall performance and longevity. Overall, the combination of stability, alignment, and efficient force transmission makes the pyramidal geometry with a rhomboidal base an attractive choice for the mechanical connection. More specifically, the geometry depicted in
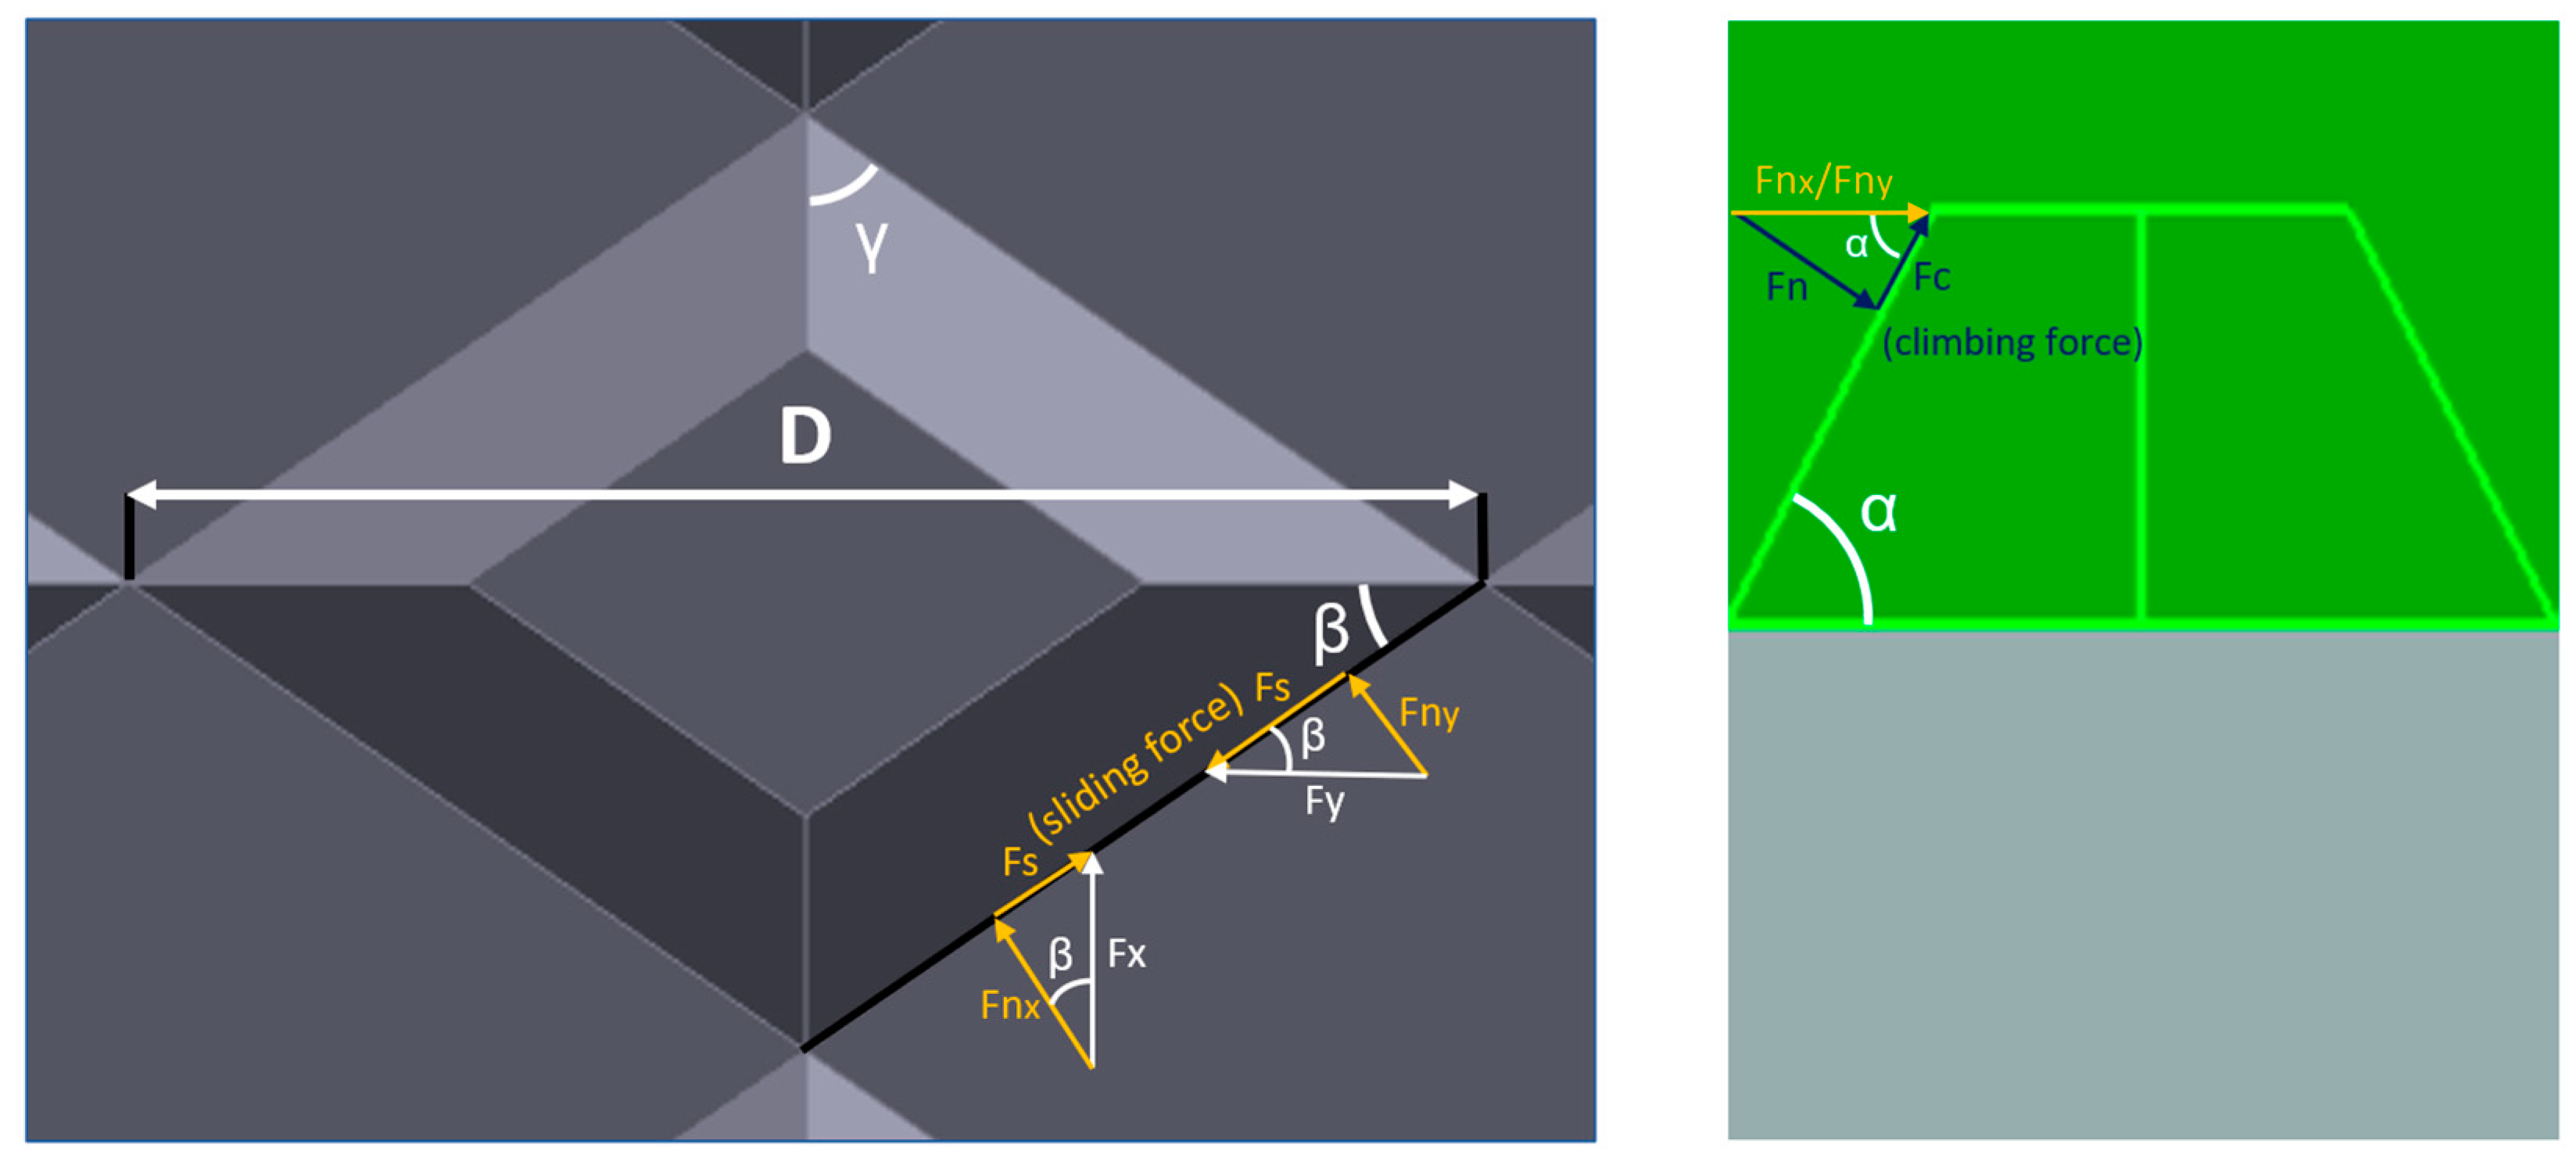
Figure 4 was thoroughly analyzed. This figure showcases the characteristic dimensions and angles currently under study to optimize the union. By closely examining these dimensions and angles, the goal is to refine the design further and maximize its effectiveness in enhancing tread assembly, disassembly, and force transmission.
Figure 4 presents top view and a side view of the truncated pyramid, which is defined based on the major diagonal length D, and two characteristic angles, β and γ. For its part, the slope of the walls of the truncated pyramid has been characterized with an angle α, as can also be seen in
Figure 4. Considering the general use of the tire being designed, no reason has been identified to propose asymmetric geometries, so the geometries have been created symmetrical with respect to the OX and OY axes. From this symmetry and knowing that the sum of the four angles of the rhombus must be 360°, to define it geometrically, it is enough to determine the major diagonal and only one of the angles of the base of the pyramid, β and γ. The proposed final geometry only depends on D, β, and α.
Additionally, it can be observed in
Figure 4 that by applying longitudinal forces, Fx, and lateral forces, Fy, through this geometry, a component is obtained in the direction of sliding and another normal to the face of the pyramid. To maximize the transmitted force, the objective is to maximize the normal force, Fnx and Fny, and minimize the sliding force, Fs, as indicated in Equation (2).
From Equation (2), it is possible to consider the longitudinal and lateral grip values that apply to the tire and obtain a value of the angles β and γ optimized for said grip values, as expressed in Equations (3) and (4).
Following the same reasoning, the normal force, whether Fnx or Fny, that reaches the wall of the truncated pyramid generates a normal component, Fn, that keeps both surfaces together, and another perpendicular to this that causes the tread to tend to separate from the casing (climbing force between both surfaces in contact), Fc. In simple terms, it can be seen that an angle alpha close to 90° minimizes the climbing force. However, this angle makes assembly and disassembly of the treads considerably more difficult. Therefore, various simulations have been carried out to achieve an optimal balance, resulting in an angle value of around 80°.
4. Experimental Study of the Casing–Tread Mechanical Joint
This method addresses both the joining and separation of the two surfaces while ensuring self-centering. It focuses on determining the minimum normal force required to hold both parts together and maximize force transfer from the casing to the tread and, ultimately, to the road.
For this reason, a universal testing machine is used, which allows us to apply a normal load (normal direction to the contact surface, representing the radial or vertical load on the tire) and simultaneously set an allowable displacement in tangential direction while measuring the tangential tensile force (representing the longitudinal/lateral force on the contact surface).
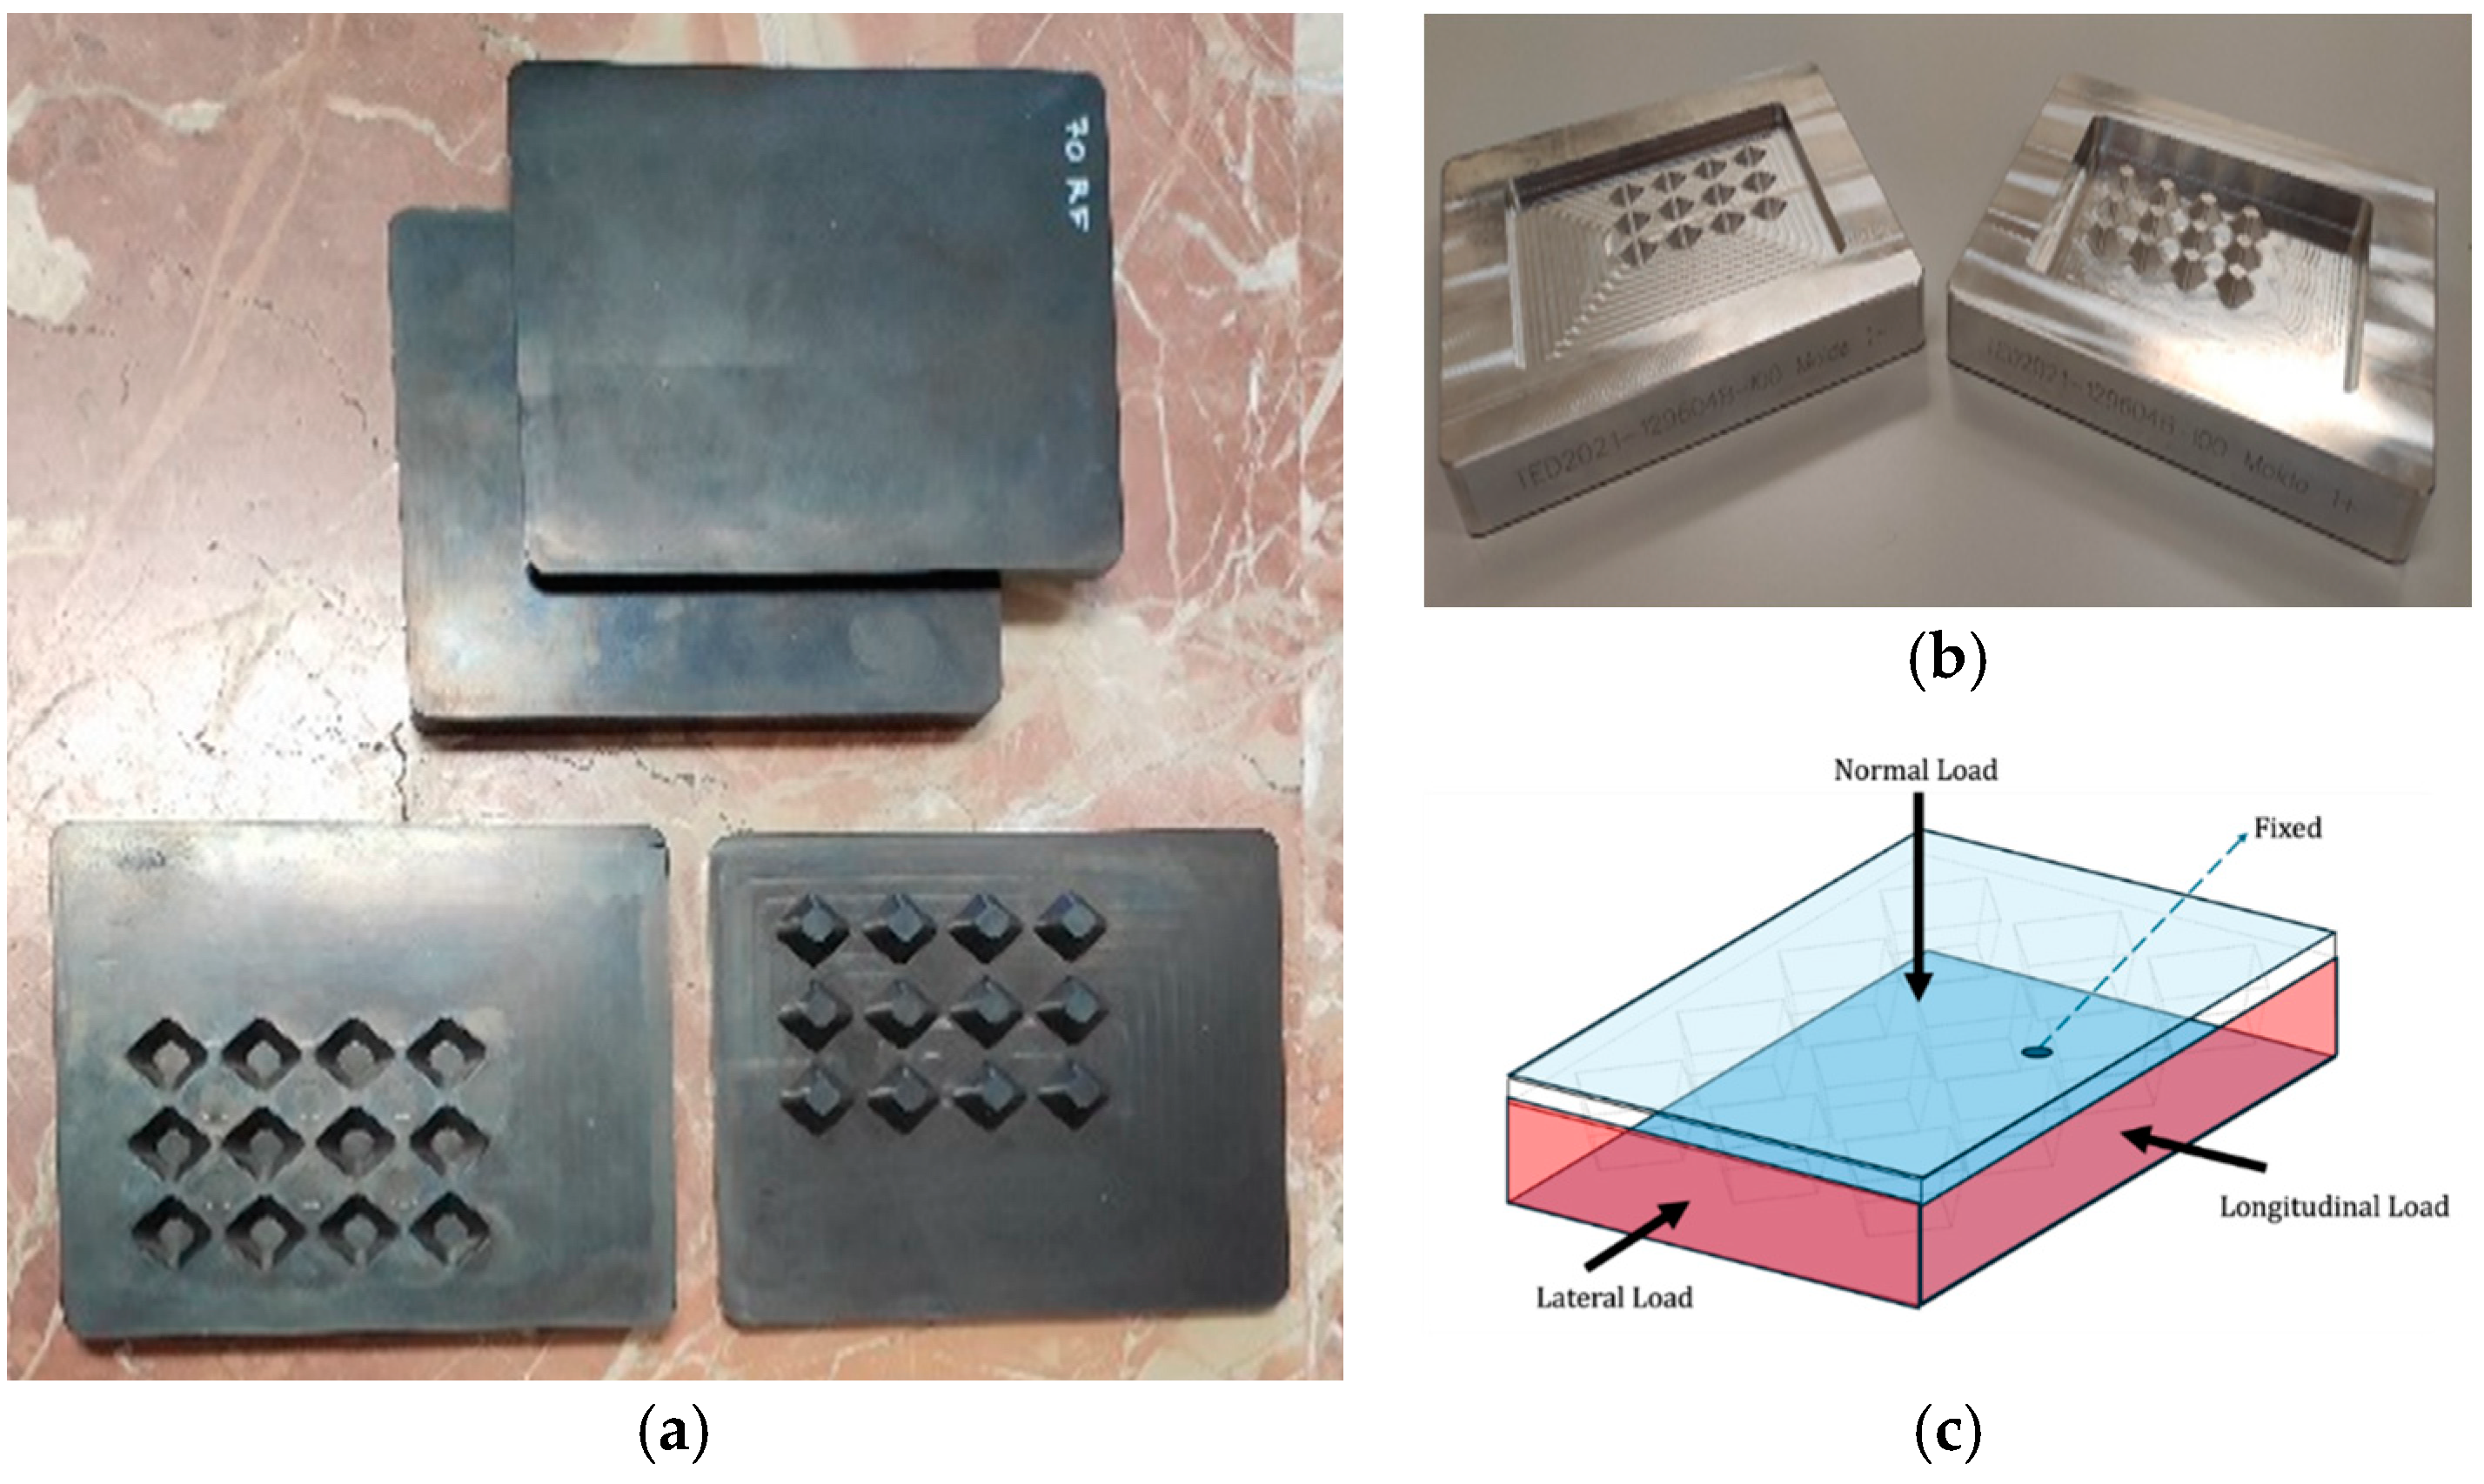
Figure 5 shows one tested rubber sample (
Figure 5a), the metallic mold used to manufacture the specimen (
Figure 5b), and one tested sample representation with the detail of the boundary conditions (
Figure 5c).
4.1. Methodology
As mentioned, a sample of rubber with the suggested arrangement and dimensions undergoes testing under several conditions. To accomplish the goal of optimizing force transmission, a specialized testing machine illustrated in
Figure 6, is employed. This device, designed and manufactured specifically for this purpose, facilitates measurements by integrating two load cells, one dedicated to measuring the normal load (vertical force and inflation pressure) and the other tasked with measuring the tangential tensile force (longitudinal or lateral force). The testing protocol begins with the application of an initial normal load onto the tire tread assembly. Following this, the tensile force is increased until it reaches the predetermined allowable displacement in tangential direction, this being 15 mm, at a speed of 5 mm/min. This progressive increase in force allows for a comprehensive assessment of the sample behavior under different initial normal force conditions. By monitoring and analyzing the data collected from the load cells throughout the testing procedure, it is possible to understand the behavior of the tire tread assembly. The aim of this testing and analysis is to refine the design, improving the geometric models and validating the simulations performed with these models, thereby enhancing their efficiency in transmitting forces and improving overall performance.
The specialized testing machine (including the “virtual contact patch” test device) has been designed to apply normal load without constraining the tangential displacement of the samples, being a fundamental condition to evaluate the behavior of the joint including displacements and free deformations both in longitudinal and lateral directions. It is also essential not to keep the normal force/load constant in order to study its evolution when applying tangential force. This provides fundamental information on how the mechanical link behaves and whether the surfaces are well connected or trying to separate from each other. Additionally, it is important to note that during testing, longitudinal and lateral forces are not simultaneously applied and measured; rather, they are tested individually, one at a time.
4.2. Identification of Contact Conditions
As shown in
Figure 5, the mechanical contact between two parts of the rubber is influenced by external forces. These forces include the normal load (representing tire pressure and/or supported vertical load), longitudinal force (indicating the tensile force on the tire), and lateral force (indicating the cornering forces on the tire).
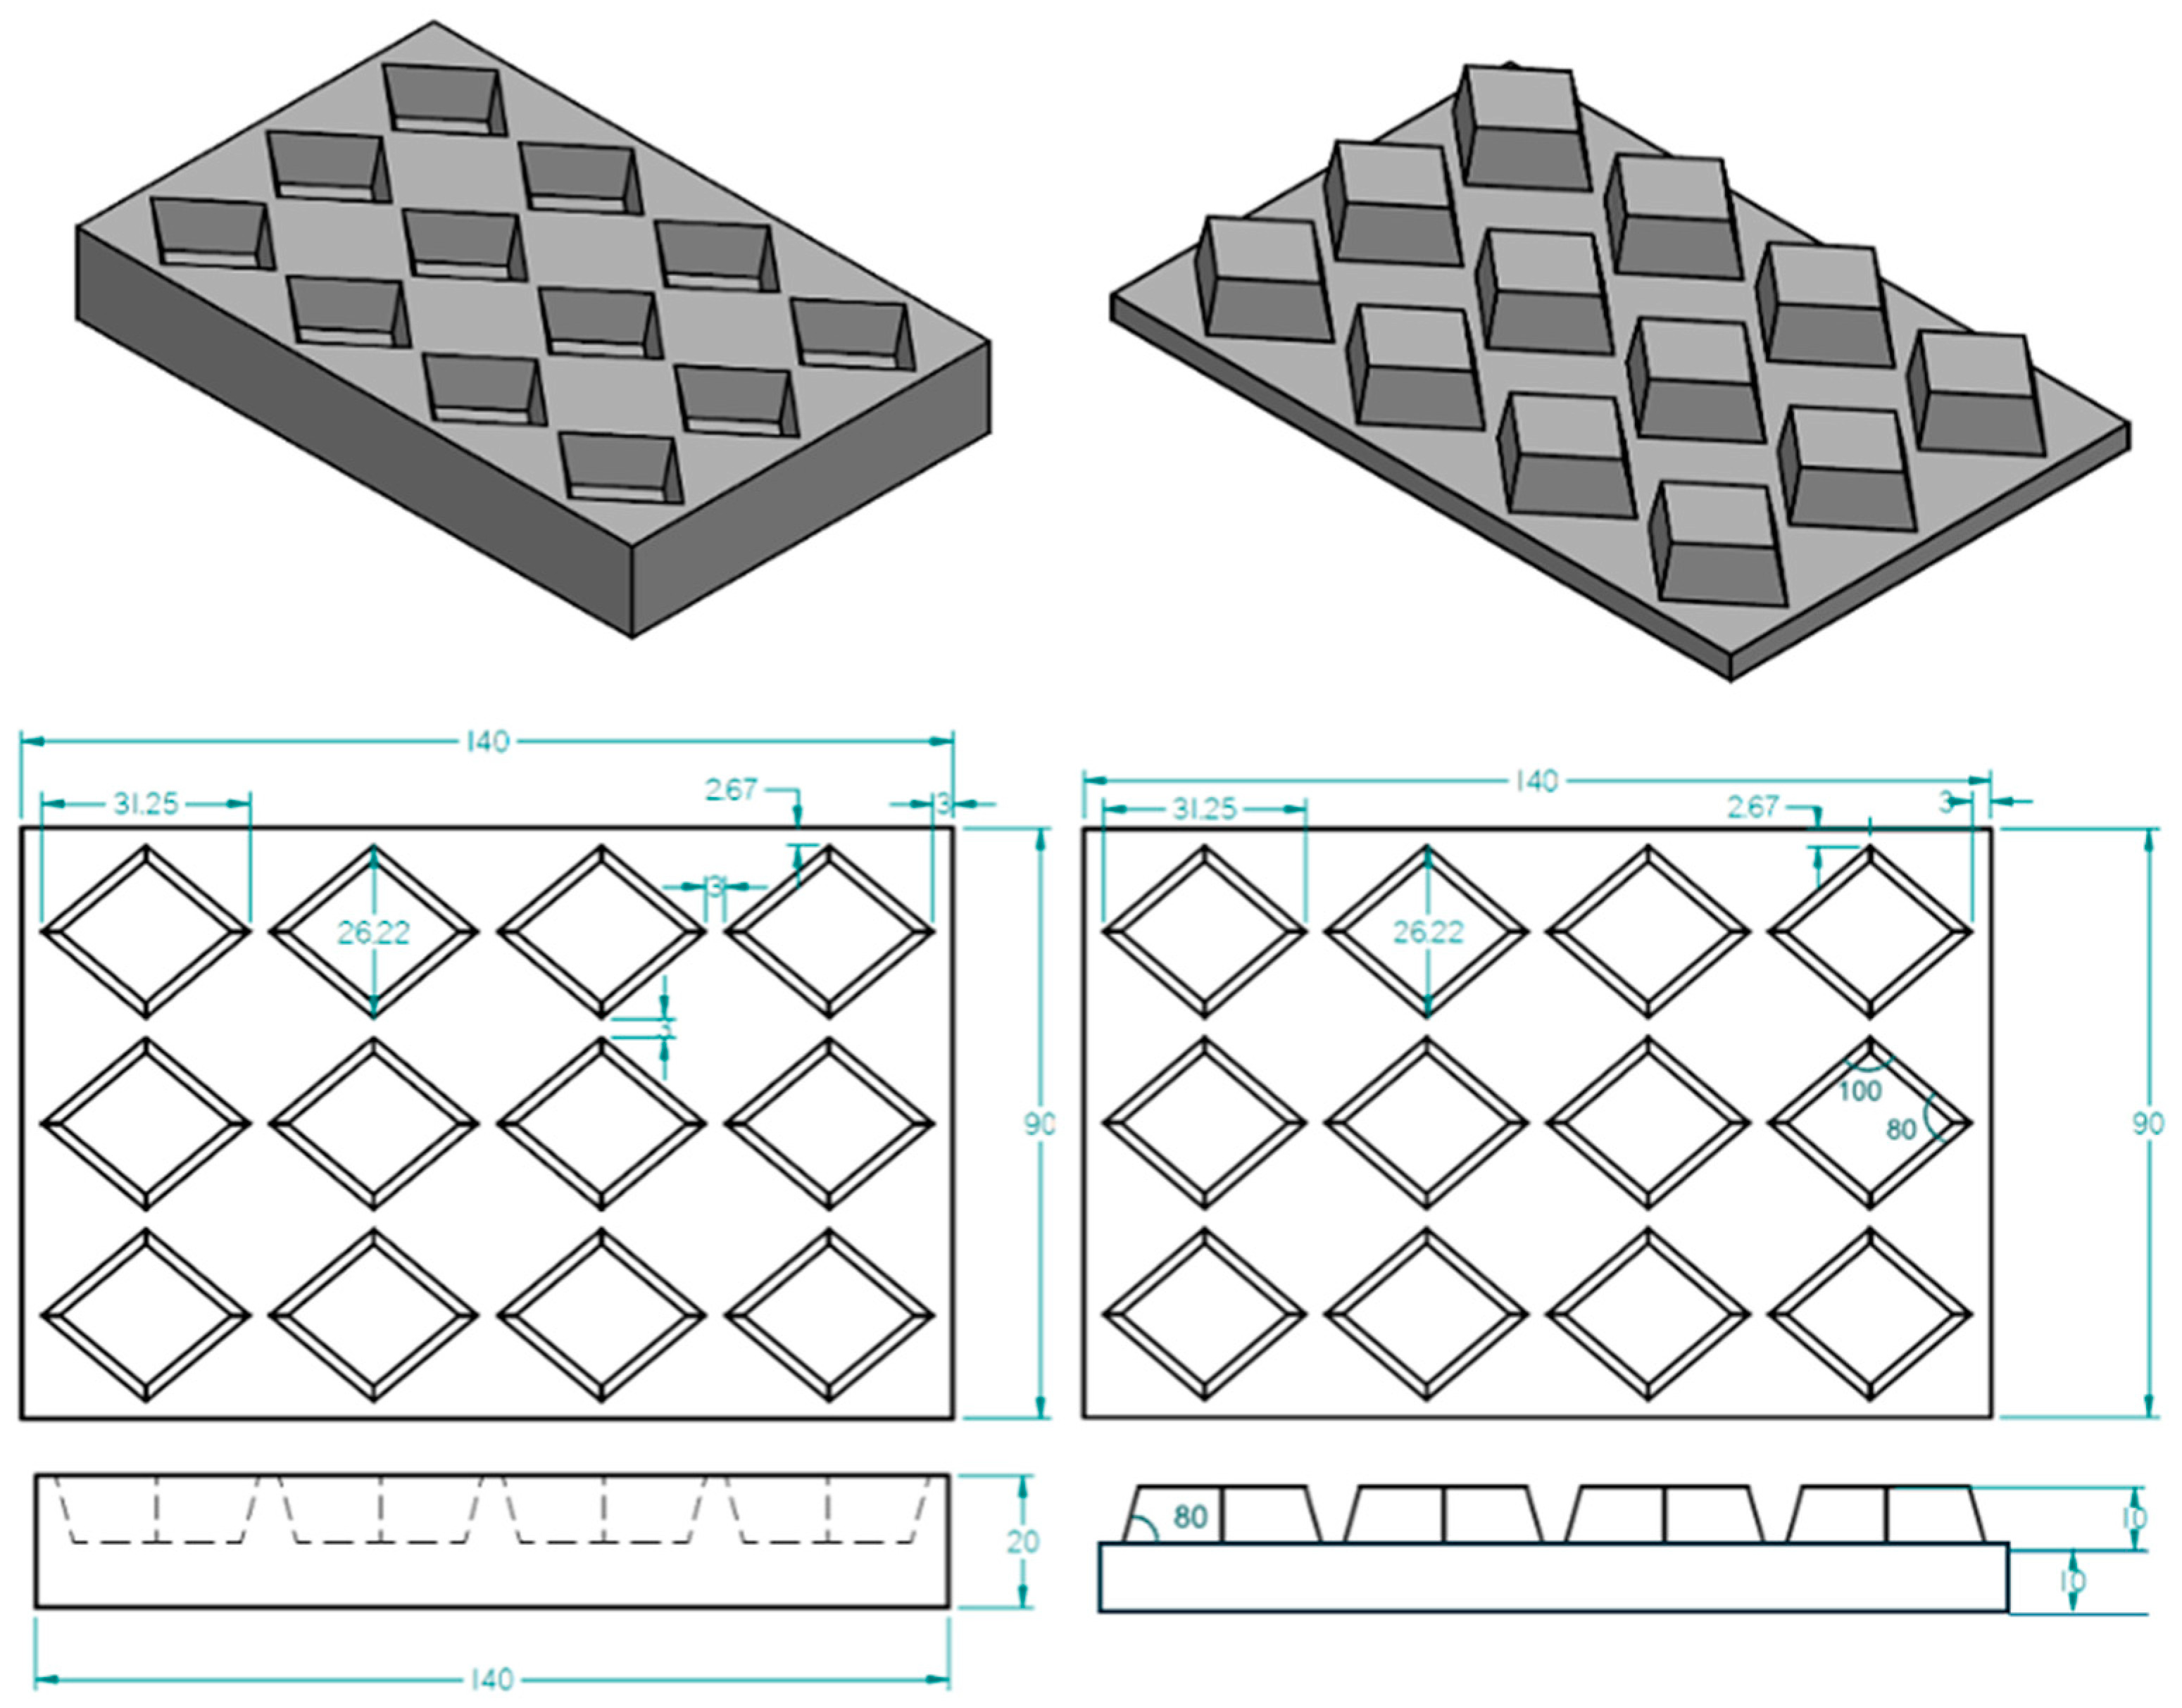
As a first approach, and considering the dynamic boundary conditions, the arrangement of truncated pyramids shown in
Figure 5 is chosen on a rubber plate approximately matching the real contact patch dimensions between the tire and the road surface, which is a plate with a length of 140 mm and a width of 90 mm (from test vehicle used in previous simulations). To use the maximum available area, keep symmetry, and accommodate the 3 mm space needed for metallic molds manufacturing and machinery requirements, along with the angles derived from Equations (3) and (4), the dimensions and all parameters of the treads and contact patch are defined. It should be noted that the height of the joint geometry has been set at 10 mm, ensuring geometric compatibility with the dimensions of a conventional passenger car, and the angle of the truncated pyramid wall is 80 degrees, as explained previously. With these values defined, the value of parameter “D” is set.
Figure 7 shows the dimensions of the virtual contact patch.
5. Experimental Test
Based on the information provided so far, the experimental test is conducted under the conditions described in the following section.
5.1. Test Condition
The test results are segmented into two main categories: longitudinal and lateral forces, in order to represent traction/braking and cornering conditions, respectively. Within each category, a range of initial normal force levels is applied, taking 500, 1000, and 1500 Newtons as significant values. Considering the selected contact patch area, this normal force represents 0.5, 1, and 1.5 bars of inflation pressure, respectively, values lower than the nominal pressure for a passenger car tire. The tests thus make it possible to evaluate the mechanical bond under unfavorable conditions to analyze its behavior when relative movement begins to occur between the two surfaces.
Additionally, a displacement allowance of 15 mm is provided in longitudinal and lateral directions, respectively, with a test speed of 5 mm/min. To change the test condition from longitudinal to lateral, the sample is just rotated, and all other conditions remain constant.
5.2. The Rubber Sample’s Material
The rubber sample material used is a mixture of ethylene propylene (EPDM), seeking a shore hardness of 65: EPDM Code 65.
It is considered that these mixtures can replicate the elastic behavior and mechanical properties of the elastomers of the tire casing and tread. However, contaminants with toxic characteristics, such as carbon black, which may have carcinogenic properties, could be present in these blends. For this reason, these materials have been considered initial components while proceeding to search for a material with a higher degree of environmental sustainability and a lower influence on people’s health. In relation to the physical properties of these specimens, and since they are mixtures designed for testing purposes, the objective was to study materials with a mechanical behavior equivalent to that of a real tire.
Unlike some hyperplastic materials that maintain a non-linearity in the recovery of the original form, our materials do recover their shape and characteristics for moderate efforts, facilitating, through this linear behavior, the simplification of the boundary conditions.
At the same time, the conservation of the internal energy of the system, defined as the sum of the potential energy and the heat energy (kinetic energy of the particles), it can be assumed that there is practically no dissipation in the form of heat and that this dissipation comes from the work used to carry out the experiment, which together with the recovery of the shape and properties of the material, after ceasing the application of force, allows to apply the contour conditions exclusively to the conservation of potential energy plus the work of the applied force.
In this sense, given the similarity in elastic behavior of the commercial tire rubber with polybutadiene and SBR rubber (of equivalent shore hardness), in the absence of experimental validation for transverse and longitudinal deformations, the test piece can be used to estimate the variable modulus of elasticity in the new material, assuming that the conservation of the total volume of the elastomer against unconfined deformations occurs.
5.3. Test Results
5.3.1. Initial Test: 500 N
The test results were obtained under a 500 N initial normal load with a 15 mm allowable displacement for both longitudinal and lateral applied forces. It should be noted that displacement changes directly and linearly in relation to time, 5 mm/min, so the evolution of the force can be expressed depending on time or displacement in an equivalent way.
Figure 8 illustrates the results and behavior of the sample under a 500 N initial normal load with a 15 mm allowable displacement in the longitudinal direction. In this figure, the Force vs. Displacement graph for the longitudinal condition shows that as the tensile force increases, the normal load initially decreases. However, after a while, the normal load begins to increase gradually, indicating that the contact patch starts to slide and tends to separate. Additionally, in
Figure 8, the point at which the behavior of the sample changes to a linear one is indicated, which indicates the stabilization in the evolution of normal and tangential forces. The two dotted vertical lines represent when linearity of the lower limit proportionality occurs for both normal and tangential curves [
47]. The limits were estimated using the procedure described in Section Identification of the Linear Contact Zone. For this condition, the normal load graph starts exhibiting linear behavior after 10.41 mm of displacement at a normal load of 0.25 kN, while the tensile force graph starts being linear after 7.70 mm of displacement at a tensile load of 0.42 kN. This linearity, along with the absence of separation, is crucial for checking the proper functioning of the new tire concept.
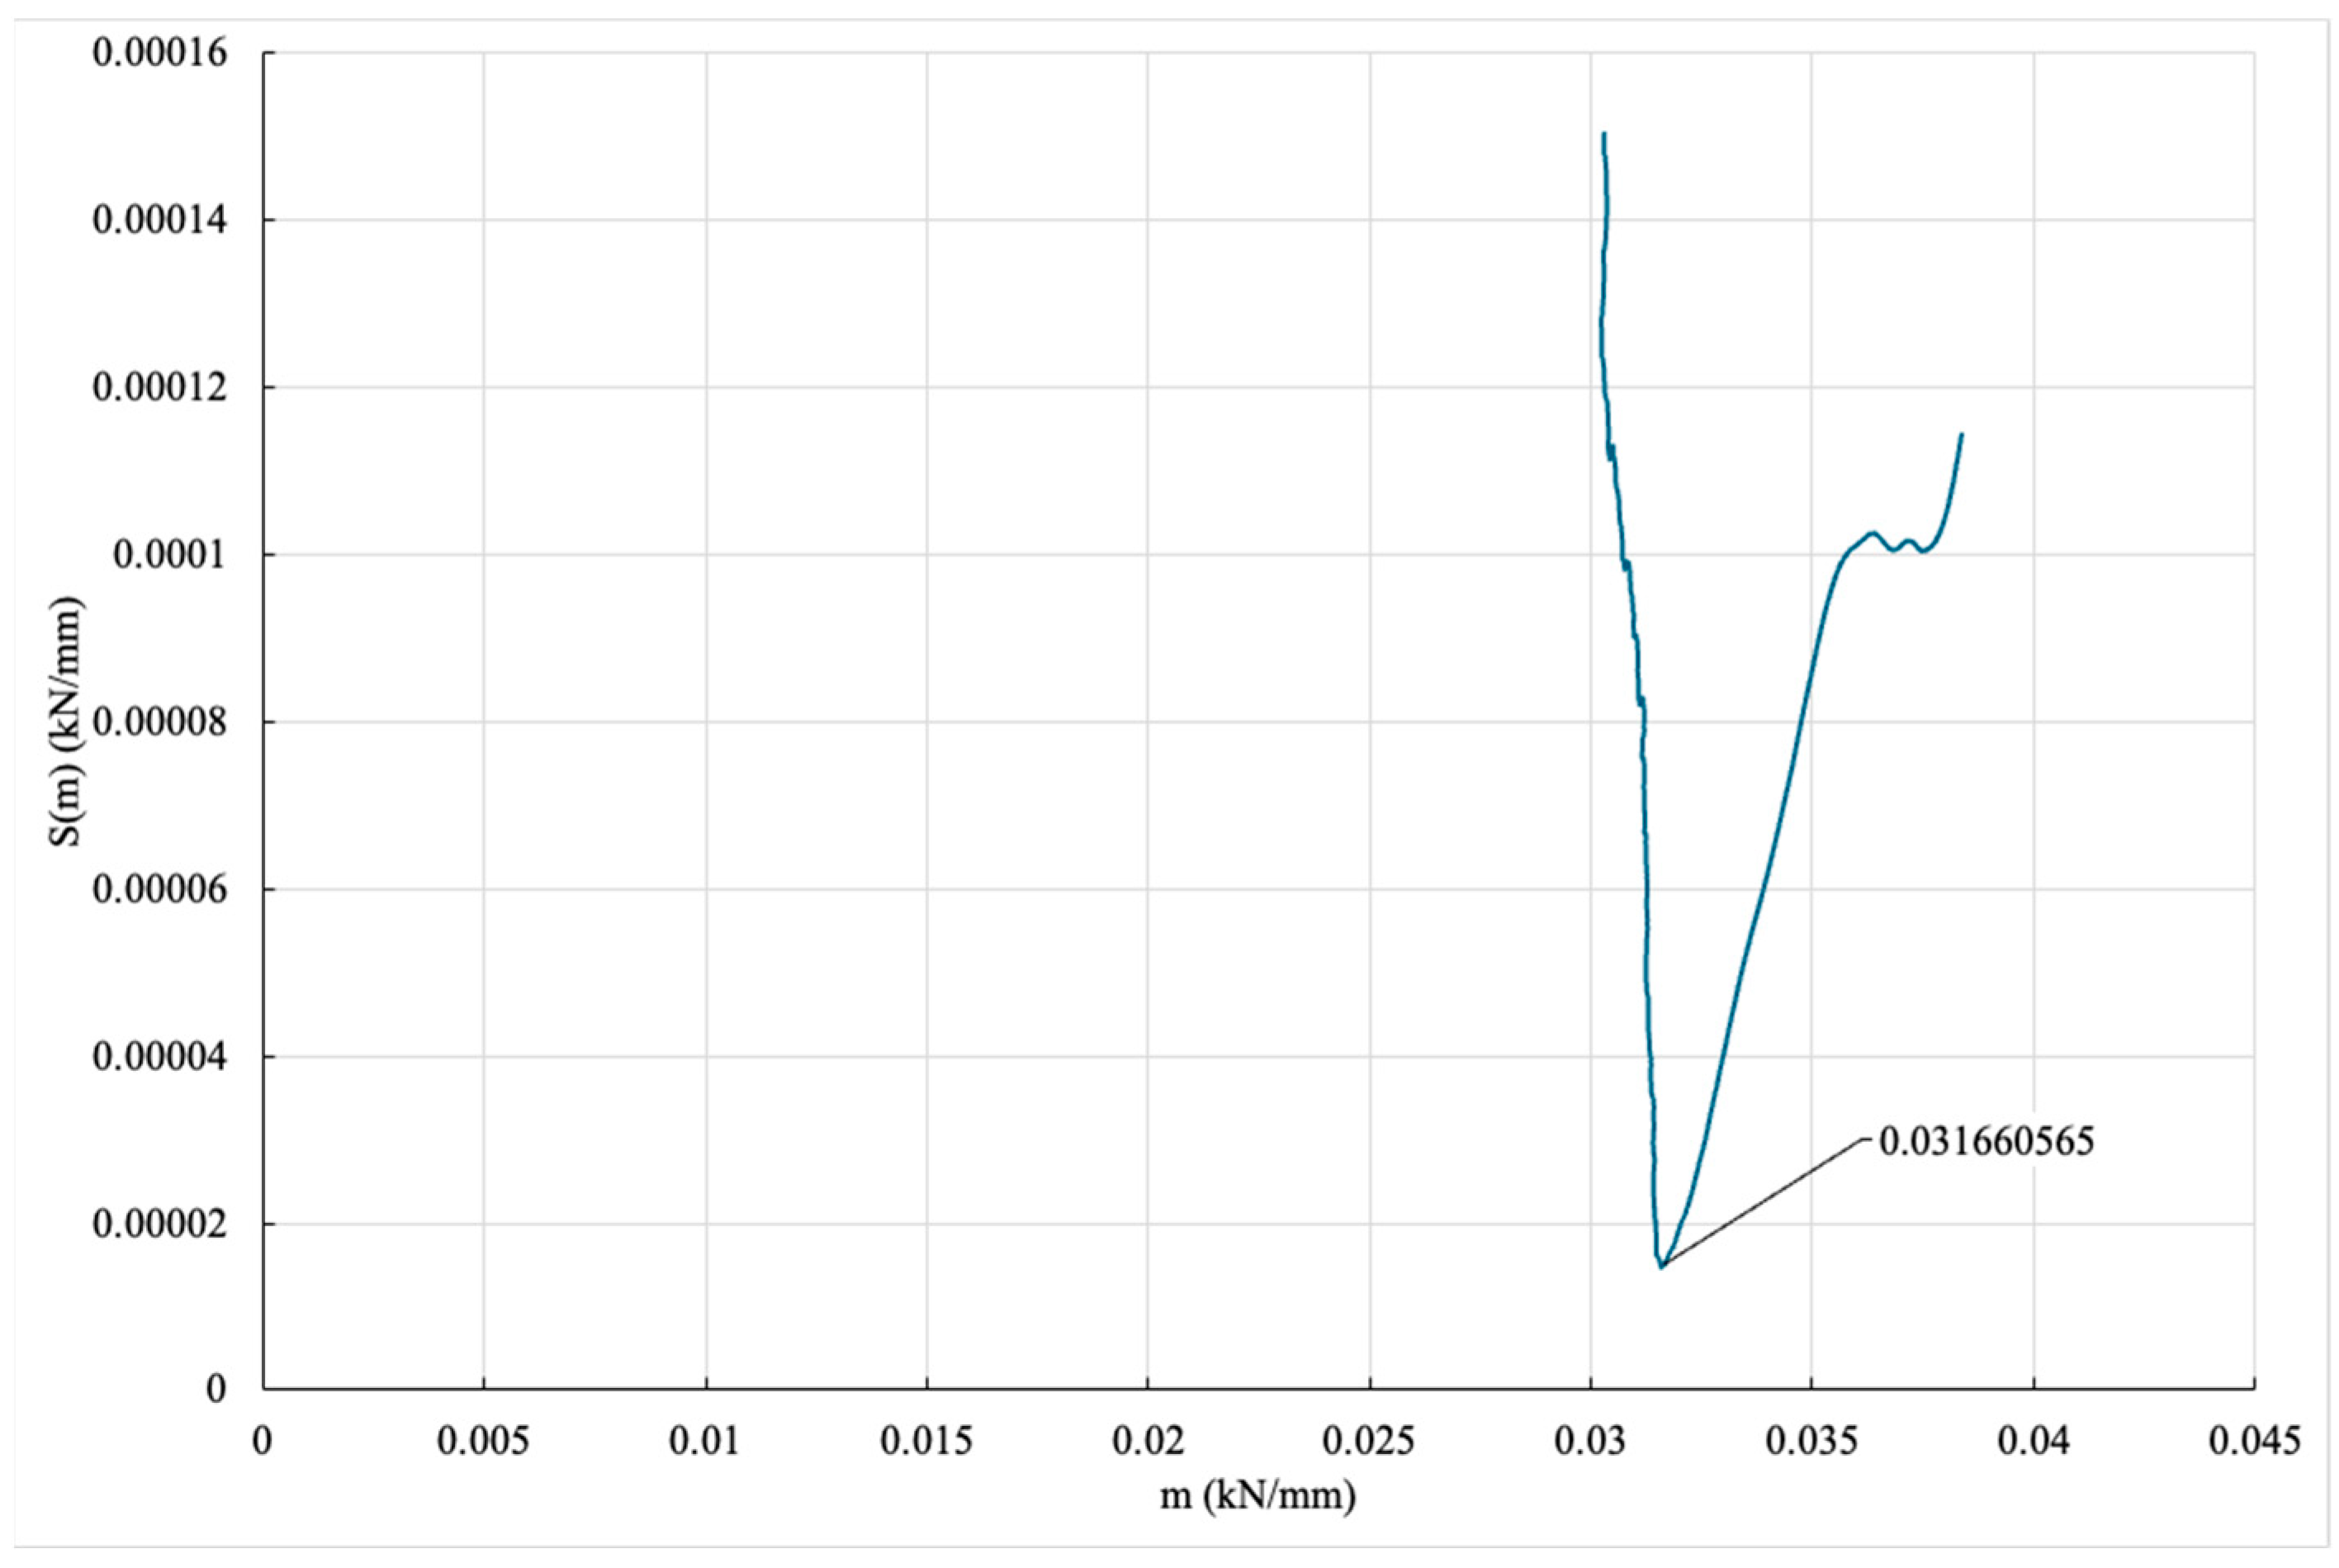
Using Equations (6) and (12), the graph of Standard Deviation vs. Slope is depicted in
Figure 9, which can be used to find the minimum point where the behavior of the sample starts to show linearity for the tensile force. It can be noted that in
Figure 9, given the small deviation (very reduced changes in m (kN/mm)), it can be assumed that the indicated point is the lowest point where the graph starts to behave linearly.
In
Table 1, the values of the slopes of the linear parts of the graph shown in
Figure 9 can be found. This table shows that the slope of the normal force curve changes by 0.01345431 kN·mm/kN·mm in the linear part, while the slope of the longitudinal force curve changes by 0.03158349 kN·mm/kN·mm.
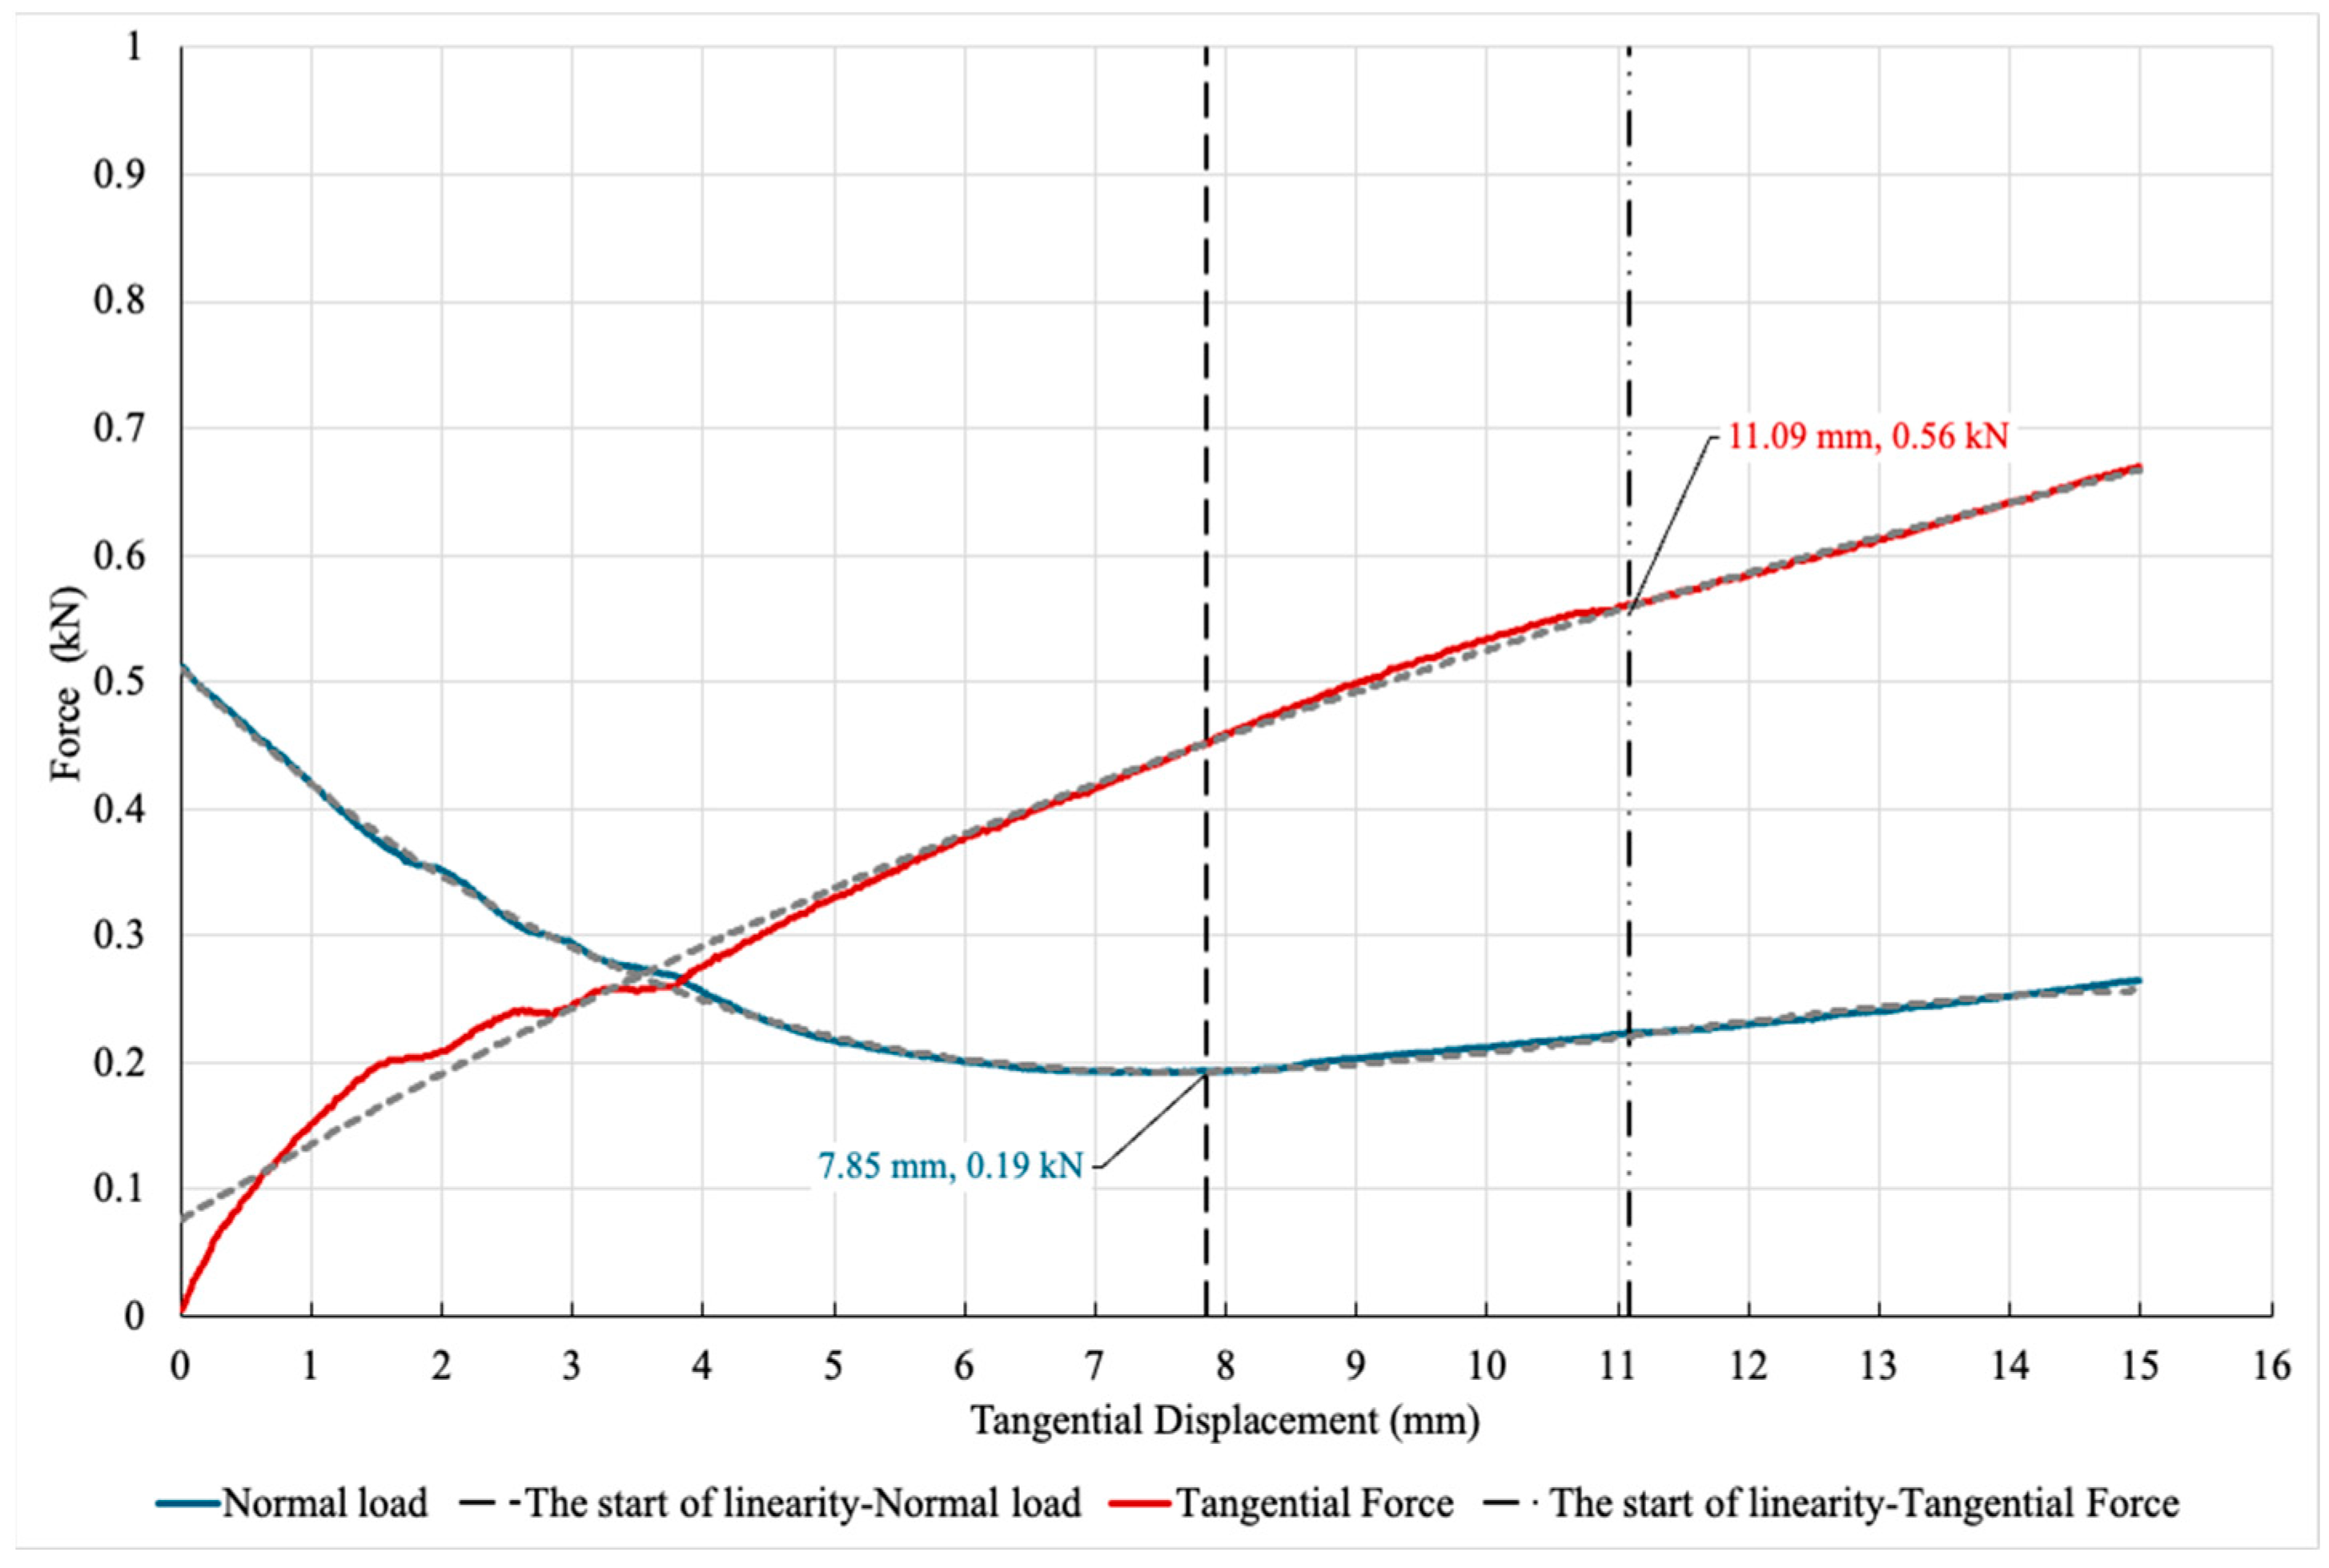
Figure 10 illustrates the results and behavior of the sample under a 500 N initial normal load with a 15 mm allowable displacement in the lateral direction. As can be seen, the Force vs. Displacement graph for the lateral condition shows that as the tensile force increases, the normal force initially decreases but starts to increase gradually after that initial stage, indicating that the contact patch starts to slide and tends to separate. Additionally, the figure indicates the point at which the behavior of the sample changes to a linear one. For this condition, the normal load graph starts exhibiting linear behavior after 7.85 mm of displacement at a normal load of 0.19 kN, while the tensile force graph starts being linear after 11.09 mm of displacement at a tensile force of 0.56 kN.
Using Equations (6) and (12), the minimum point where the linearity starts can be found. In
Table 2, the values of the slopes of the linear parts of the graphs can be found.
5.3.2. Second Representative Test: 1000 N
The following significant test condition is given for an initial normal load of 1000 N and with a 15 mm allowable displacement for both longitudinal (acceleration/braking condition) and lateral (cornering condition) directions.
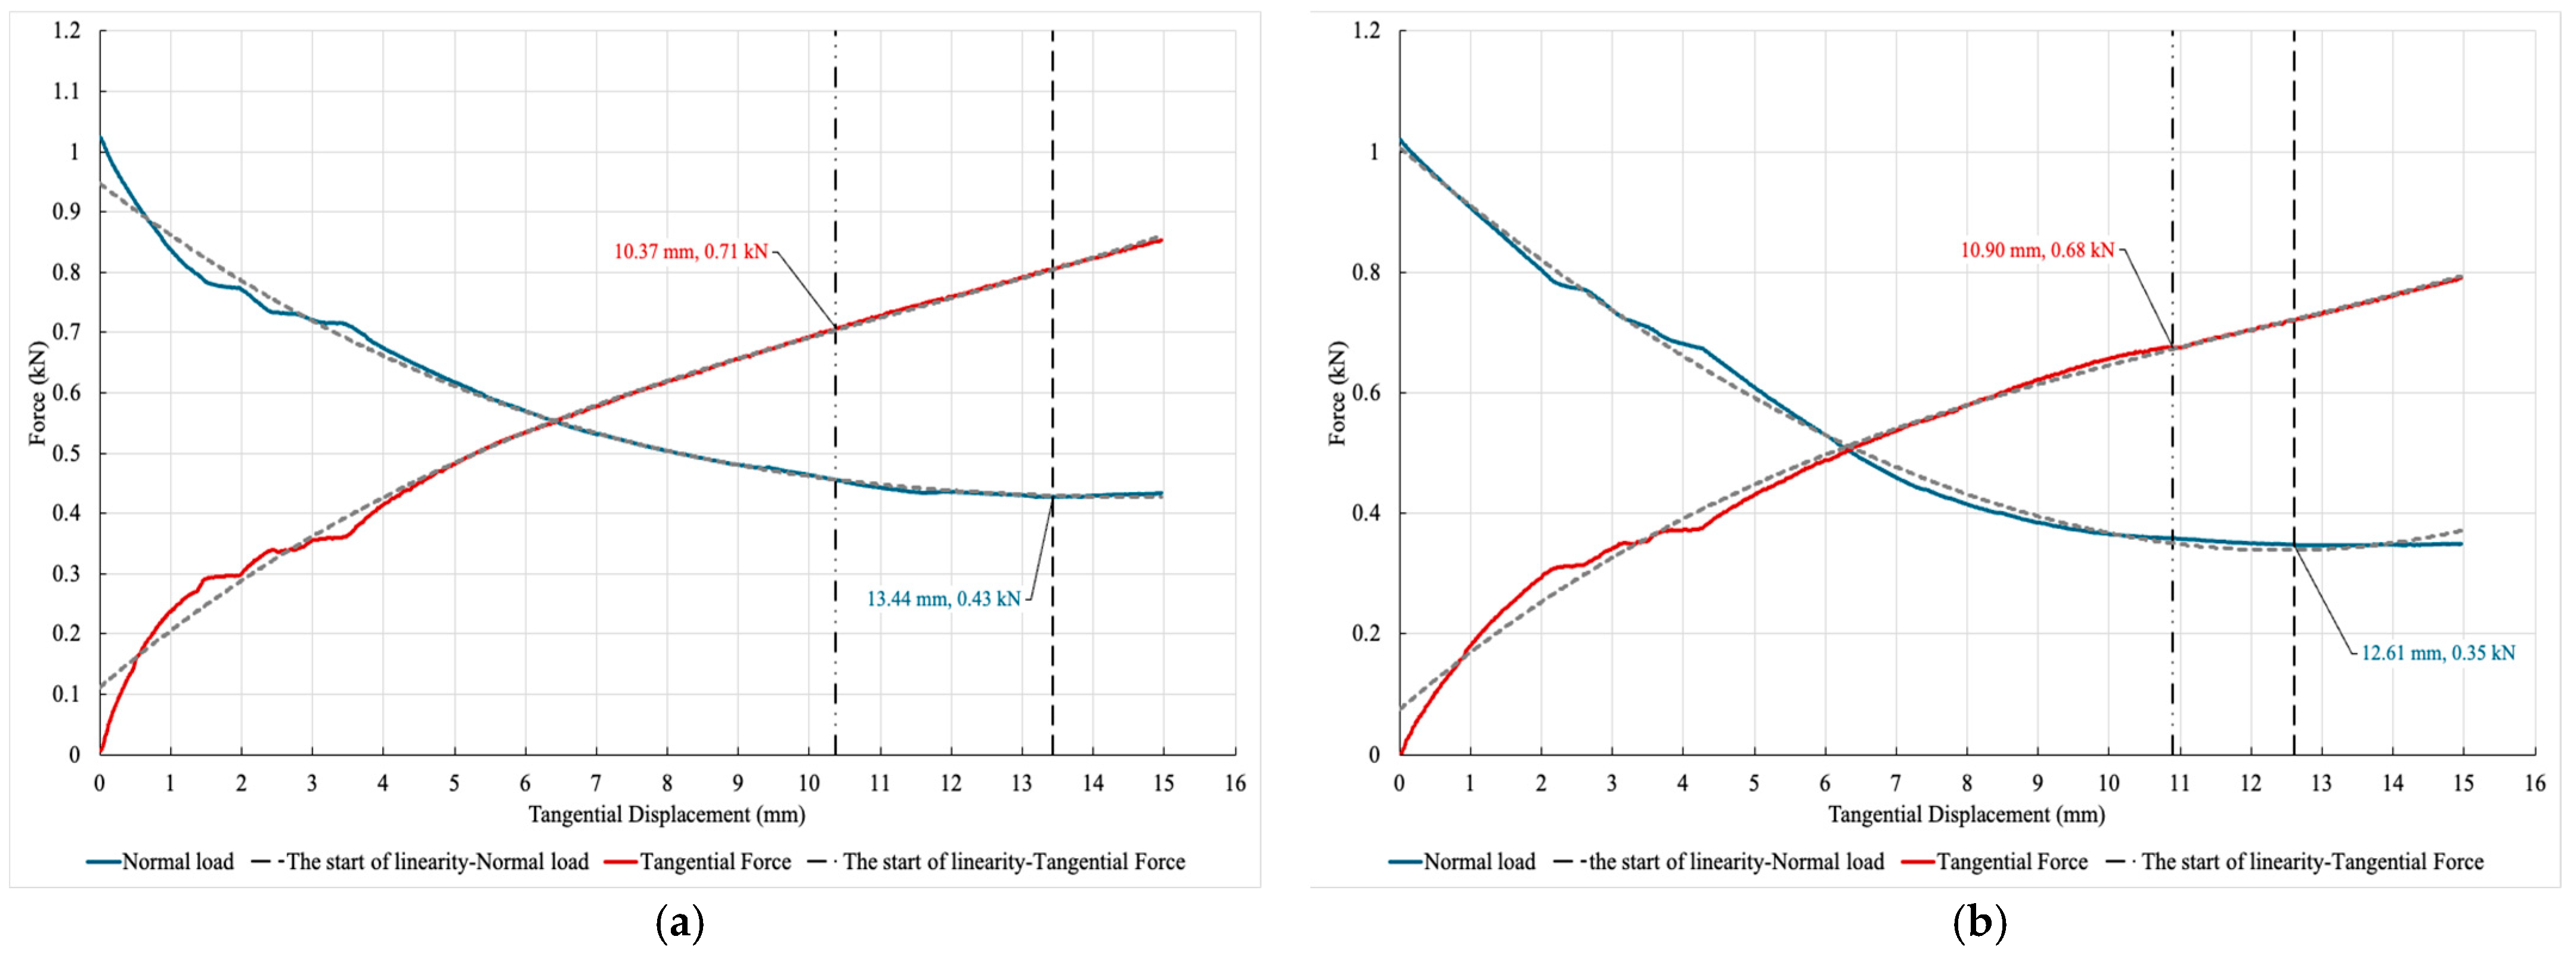
Figure 11a,b illustrates the results and behavior of the sample under a 1000 N normal load with a 15 mm allowable displacement in the longitudinal and lateral directions, respectively. In both figures, the Force vs. Displacement graph shows a similar trend: as the tangential force increases, the normal force initially decreases, but once again, after this previous stage, the normal force begins to increase gradually, indicating that the contact patch starts to slide and tends to separate.
In
Figure 11a, for the longitudinal condition, the behavior of the sample changes to a linear one after 13.44 mm of displacement at a normal load of 0.43 kN, and the tangential force graph becomes linear after 10.37 mm of displacement at a tangential force of 0.71 kN. Similarly, in
Figure 11b, for the lateral condition, the normal load graph starts exhibiting linear behavior after 12.61 mm of displacement at a normal load of 0.35 kN, while the tangential force graph turns linear after 10.90 mm of displacement at a tangential force of 0.68 kN. This linearity, along with the absence of separation, is crucial for the proper functioning of the new tire concept being proposed.
Using Equations (6) and (12), the minimum point where linearity begins can be found. It should be noted that in
Figure 11, due to the small deviation, it can be assumed that the indicated point marks the beginning of linear behavior.
Table 3 contains the values of slopes of the beginning of linear parts of the graphs.
5.3.3. Third Representative Test: 1500 N
The next significant test condition is given for an initial normal load of 1500 N and with a 15 mm allowable displacement for both longitudinal (acceleration/braking condition) and lateral (cornering condition) directions.
Figure 12a presents the results and behavior of the sample under a 1500 N initial normal load with a 15 mm allowable displacement in the longitudinal direction. In this figure, the Force vs. Displacement graph for the longitudinal condition indicates that as the tangential force increases, the normal load decreases. For this initial normal force, unlike the previous ones, the evolution of the normal force remains with a negative slope throughout the entire test, suggesting that the contact patch does not start to slide and tends to keep joined. The figure also highlights the critical point where the behavior of the sample shifts to a linear pattern. For this condition, the normal force curve begins to exhibit linear behavior after 10.24 mm of displacement at a normal load of 0.83 kN, while the tensile load graph becomes linear after 11.22 mm of displacement at a tangential force of 0.863 kN.
Similarly,
Figure 12b illustrates the results and behavior of the sample under a 1500 N initial normal load with a 15 mm allowable displacement in the lateral direction. The Force vs. Displacement graph for the lateral condition shows that as the tangential force increases, the normal force decreases throughout the entire displacement tested, as happened in the longitudinal direction. The figure also identifies the point where the sample’s behavior transitions to a linear mode. For this condition, the normal load graph shows linear behavior after 9.17 mm of displacement at a normal load of 0.72 kN, while the tangential force graph starts becoming linear after 10.27 mm of displacement at a tensile load of 0.70 kN.
Using Equations (6) and (12), the minimum point where linearity begins can be determined.
Table 4 contains the data for the critical points where linearity initiates under different conditions.
5.3.4. Results Discussion
By analyzing
Figure 8,
Figure 9,
Figure 10,
Figure 11 and
Figure 12, it can be seen that the joint tends to behave as a single material as the normal force increases, which is expected. The third test shows adequate behavior, suggesting that,, for relatively low inflation pressures (1500 N equivalent to 1.5 bars), the joint performs adequately. However, it would be interesting to expand the range of normal forces tested to further corroborate and consolidate this behavior.
The tests carried out at 300 N, 500 N, 700 N, 1000 N, 1500 N, and 2000 N are depicted in
Figure 13 and
Figure 14. Examining the behavior of normal and tangential forces, it is observed that as the initial normal force increases, the normal force graphs begin to exhibit a maintained negative slope, this being the objective of designing the geometry of a mechanical joint. This negative slope indicates that the contact patches not only remain in contact but also adhere more firmly.
From
Figure 13b and
Figure 14b, the evolution of different initial normal forces under conditions of simultaneous application of tangential force application, whether longitudinal or lateral, can be analyzed. It can be seen that with the increase in the initial normal force, starting from 1 kN, the value of said normal force exhibits a negative slope that slowly tends to zero, converging to a constant value. For small initial values, less than 1 kN for the geometry tested, what can be observed is that the slope does not tend to zero and becomes positive after a certain instant, indicating the separation of both surfaces.
Additionally, it is important to highlight that the operational pressure and normal force are significantly higher, ranging approximately from 1.5 kN to 2.5 kN for conventional tires.
The analysis of these results and the information they provide is very useful to make representative simulation models. These models can focus on the introduction of new materials, combinations of materials in the casing and tread, as well as modifications to the proposed joint geometry, already including the curvature of the tire.
The proposed geometry for the mechanical connection between the casing and tread demonstrates that the preselected angles and dimensions of the truncated pyramids allow for proper force transmission both longitudinally (for traction and braking) and laterally (for cornering), even with relatively low normal forces (inflation pressures) compared to conventional tires. Although this geometry will continue to be optimized and subjected to further testing, it suggests that the forces transmitted to the road surface by the “ECOTIRE” are potentially equivalent to those transmitted by a current tire. However, this must be verified by manufacturing a complete ECOTIRE prototype and comparing it with conventional reference tires through testing.
6. Conclusions
This paper introduces ECOTIRE, a sustainable removable-structure tire concept aimed at integrating new materials and sensor technology to reduce environmental impact while enhancing tire functionality.
The ECOTIRE concept makes it possible to separate the part of the tire subject to wear and apply new materials with less environmental impact.
At the same time, the service life of the casing can be increased, facilitating the introduction of sensors that improve vehicle safety.
Some coatings, based on polyurethanes and silicones, have been shown to effectively protect the tire against the action of ultraviolet radiation, temperature, and humidity. This would be a solution for the casing, but they could also serve as a base material for the tread, allowing the environmental impact of the part of the tire subject to wear to be reduced.
The design of the connection between the two parts is based on the dynamic study of a vehicle under severe maneuvers and the forces that the tire must withstand and transmit. This study has led to a truncated pyramid geometry as the initial connection geometry.
Based on dynamic tests, specific height and angles are proposed for this truncated pyramid. In other words, a basic configuration has been manufactured and tested in order to evaluate its behavior. This step is necessary to propose an optimization process through simulation and experimental evaluation to be carried out through later stages.
Experimental tests using a virtual contact patch validate the feasibility of this mechanical connection concept under varying normal forces, demonstrating promising results in grip and force transmission capabilities.
The research identifies key challenges and solutions in designing a functional prototype that can effectively transmit forces to the pavement while minimizing environmental impact. Furthermore, the analysis of the experimental force versus displacement curves illustrates the relationship between normal and tangential forces, showing that relatively low values of normal force (typical inflation pressures in conventional tires) are sufficient to obtain a stable and effective joint in the transmission of tangential forces. The tests carried out with initial normal forces varying from 300 N to 2000 N show promising behavior of the proposed geometry starting at 1000 N. As this value is equivalent to applying an internal pressure of around 1 bar (taking into account the geometry of the virtual contact zone tested), this confirms that the proposed geometry for the mechanical link behaves adequately, at least in the virtual contact footprint.
The comparison between different initial normal forces, under longitudinal and lateral tractive forces applied to the joint, shows the improvement in the behavior of the geometry proposed for the joint by increasing the normal force. The slope of the normal force curves remains negative, which indicates adequate contact and supportive behavior of the material of both parts of the joint. While the design of a fully functional prototype continues, the findings underscore ECOTIRE’s potential to revolutionize tire technology, integrating sustainability with advanced functionality. This holistic approach not only addresses current environmental challenges, but it also paves the way for future innovations in tire design and manufacturing.
Author Contributions
Conceptualization, D.G.-P.; methodology, D.G.-P., F.A., R.G.-M. and M.A.M.; software, D.G.-P. and F.A.; validation, D.G.-P. and M.A.M.; formal analysis, D.G.-P., F.A. and R.G.-M.; investigation, D.G.-P. and F.A.; resources, D.G.-P. and M.A.M.; data curation, D.G.-P. and F.A.; writing—original draft preparation, D.G.-P. and F.A.; writing—review and editing, D.G.-P., F.A., R.G.-M. and M.A.M.; visualization, D.G.-P. and F.A.; supervision, D.G.-P. and M.A.M.; project administration, D.G.-P.; funding acquisition, D.G.-P. and M.A.M. All authors have read and agreed to the published version of the manuscript.
Funding
The authors acknowledge the financial support for this publication as part of the R+D+i project TED2021-129604B-100, funded by MCIN/AEI/10.13039/501100011033 and by the European Union NextGeneration EU PRTR.
Institutional Review Board Statement
Not applicable.
Informed Consent Statement
Not applicable.
Data Availability Statement
The raw data supporting the conclusions of this article will be made available by the authors on request.
Acknowledgments
The authors would like to thank the company Advantaria and its director, Ignacio Requena Rodríguez, for the conceptual contributions and the provided technical and industrial support.
Conflicts of Interest
The authors declare no conflict of interest.
References
- Nan, X.; Hassan, A.; Amir, K. Intelligent Tire Systems; Springer: Berlin/Heidelberg, Germany, 2022. [Google Scholar]
- Min, D.; Wei, Y.; Zhao, T.; He, J. A fusion estimation of tire vertical forces using model-based tire state estimators for a dual-sensor intelligent tire. Proc. Inst. Mech. Eng. Part D J. Automob. Eng. 2023, 238, 2146–2159. [Google Scholar] [CrossRef]
- Zhang, J.; Fu, H.; Yang, B.; Ni, S.; Huo, R.; Lian, C. A spoke strain-based method to estimate tire condition parameters for intelligent tires. Sens. Actuators A Phys. 2024, 367, 115035. [Google Scholar] [CrossRef]
- Bastiaan, J.; Chawan, A.; Eum, W.; Alipour, K.; Rouhollahi, F.; Behroozi, M.; Baqersad, J. Intelligent tire prototype in longitudinal slip operating conditions. Sensors 2024, 24, 2681. [Google Scholar] [CrossRef] [PubMed]
- Han, Z.; Liu, W.; Gao, Z.; Liu, D. A Method for Realtime Road Surface Identification of Intelligent Tire Systems Based on Random Convolutional Kernel Neural Network. IEEE Trans. Intell. Veh. 2024, 1–15. [Google Scholar] [CrossRef]
- Shi, R.; Yang, S.; Chen, Y.; Wang, R.; Lu, J.; Pang, Z.; Cao, Y. Road Recognition for Autonomous Vehicles Based on Intelligent Tire and SE-CNN; Bennour, A., Ensari, T., Kessentini, Y., Eom, S., Eds.; Intelligent Systems and Pattern Recognition. ISPR 2022. Communications in Computer and Information Science; Springer: Cham, Switzerland, 2022; Volume 1589. [Google Scholar] [CrossRef]
- Lee, H.; Choi, S.B. Online Detection of Toe Angle Misalignment Based on Lateral Tire Force and Tire Aligning Moment. Int. J. Automot. Technol. 2023, 24, 623–632. [Google Scholar] [CrossRef]
- Min, D.; Wei, Y. An adaptive control strategy for a semiactive suspension integrated with intelligent tires. Mech. Syst. Signal Process. 2024, 212, 111281. [Google Scholar] [CrossRef]
- Sun, X.; Quan, Z.; Cai, Y.; Chen, L.; Li, B. Direct Tire Slip Angle Estimation Using Intelligent Tire Equipped With PVDF Sensors. IEEE/ASME Trans. Mechatron. 2024, 1–11. [Google Scholar] [CrossRef]
- Jawjit, W.; Kroeze, C.; Rattanapan, S. Greenhouse gas emissions from rubber industry in Thailand. J. Clean. Prod. 2010, 18, 403–411. [Google Scholar] [CrossRef]
- Khan, F.R.; Rødland, E.S.; Kole, P.J.; Van Belleghem, F.G.; Jaén-Gil, A.; Hansen, S.F.; Gomiero, A. An overview of the key topics related to the study of tire particles and their chemical leachates: From problems to solutions. TrAC Trends Anal. Chem. 2024, 172, 117563. [Google Scholar] [CrossRef]
- B.A.R. Environmental Inc. Evaluation of the Potential Toxicity of Automobile Tires in the Aquatic Environment; Report to Environment Canada; National Water Institute: Burlington, ON, Canada, 1992; p. 15. [Google Scholar]
- Bin-Shafique, S.; Benson, C.H.; Edil, T.B.; Hwang, K. Leachate concentrations from water leach and column leach tests on flyash stabilized soil. Environ. Eng. Sci. 2006, 23, 51–65. [Google Scholar] [CrossRef]
- Tik Root. Tires: The Plastic Polluter You Never Thought About. Environment. The Story of Plastic; National Geographic: Washington, DC, USA, 2019. [Google Scholar]
- Dabic-Miletic, S.; Simic, V. Smart and sustainable waste tire management: Decision-making challenges and future directions. Decis. Mak. Adv. 2023, 1, 10–16. [Google Scholar] [CrossRef]
- Piotrowska, K.; Kruszelnicka, W.; Bałdowska-Witos, P.; Kasner, R.; Rudnicki, J.; Tomporowski, A.; Flizikowski, J.; Opielak, M. Assessment of the Environmental Impact of a Car Tire throughout Its Lifecycle Using the LCA Method. Materials 2019, 12, 4177. [Google Scholar] [CrossRef]
- Ismail, H.; Rosnah, N.; DRozman, H. Effects of various bonding systems on mechanical properties of oil palm fibre reinforced rubber composites. Eur. Polym. J. 1997, 33, 1231–1238. [Google Scholar] [CrossRef]
- Lee, D.; Ho Song, S. A Study of Silica Reinforced Rubber Composites with Eco-Friendly Processing Aids for Pneumatic Tires. Macromol. Res. 2019, 27, 850–856. [Google Scholar] [CrossRef]
- Ren, X.; Sancaktar, E. Use of fly ash as eco-friendly filler in synthetic rubber for tire applications. J. Clean. Prod. 2019, 206, 374–382. [Google Scholar] [CrossRef]
- Qin, X.; Wang, J.; Han, B.; Wang, B.; Mao, L.; Zhang, L. Novel Design of Eco-Friendly Super Elastomer Materials With Optimized Hard Segments Micro-Structure: Toward Next-Generation High-Performance Tires. Front. Chem. 2018, 6, 240. [Google Scholar] [CrossRef]
- Sutisna, N.; Gapsari, F. Rolling Resistance and Noise Estimation for Product Design and Development of EcoTyre using Finite Element and Numerical Method. IOP Conf. Ser. Mater. Sci. Eng. 2019, 494, 012021. [Google Scholar] [CrossRef]
- Czarna-Juszkiewicz, D.; Kunecki, P.; Cader, J.; Wdowin, M. Review in waste tire management-Potential applications in mitigating environmental pollution. Materials 2023, 16, 5771. [Google Scholar] [CrossRef]
- Khudyakova, T.; Shmidt, A.; Shmidt, S. Sustainable development of smart cities in the context of the implementation of the tire recycling program. Entrep. Sustain. Issues 2020, 8, 698–715. [Google Scholar] [CrossRef]
- Formela, K.; Hejna, A.; Zedler, L.; Przybysz, M.; Ryl, J.; Saeb, M.R.; Piszczyk, Ł. Structural, thermal and physicomechanical properties of polyurethane/brewers’ spent grain composite foams modified with ground tire rubber. Ind. Crops Prod. 2017, 108, 844–852. [Google Scholar] [CrossRef]
- Araujo-Morera, J.; Santana, M.H.; Verdejo, R.; López-Manchado, M.A. Giving a Second Opportunity to Tire Waste: An Alternative Path for the Development of Sustainable Self-Healing Styrene–Butadiene Rubber Compounds Overcoming the Magic Triangle of Tires. Polymers 2019, 11, 2122. [Google Scholar] [CrossRef]
- Sambucci, M.; Marini, D.; Marco Valente, M. Tire Recycled Rubber for More Eco-Sustainable Advanced Cementitious Aggregate. Recycling 2020, 5, 11. [Google Scholar] [CrossRef]
- Mohamad Ali, I.; Samir Naje Salah Nasr, M. Eco-friendly chopped tire rubber as reinforcements in fly ash based geopolymer concrete. Glob. NEST J. 2020, 22, 342–347. [Google Scholar] [CrossRef]
- Nehdi, M.L.; Najjar, M.F.; Soliman, A.M.; Azabi, T.M. Novel eco-efficient Two-Stage Concrete incorporating high volume recycled content for sustainable pavement construction. Constr. Build. Mater. 2017, 146, 9–14. [Google Scholar] [CrossRef]
- Thomas, J.; Patil, R. The road to sustainable tire materials: Current state of the art and future prospectives. Environ. Sci. Technol. 2023, 57, 2209–2216. [Google Scholar] [CrossRef] [PubMed]
- Deng, S.; Chen, R.; Duan, S.; Jia, Q.; Hao, X.; Zhang, L. Research progress on sustainability of key tire materials. SusMat 2023, 3, 581–608. [Google Scholar] [CrossRef]
- Garcia-Pozuelo, D.; Olatunbosun, O.; Palli, G.; Strano, S.; Terzo, M.; Tordela, C. Estimation of tire-road contact forces through a model-based approach employing strain measurements. Meccanica 2022, 57, 1801–1829. [Google Scholar] [CrossRef]
- Garcia-Pozuelo, D.; Olatunbosun, O.; Yunta, J.; Yang, X.; Diaz, V. A Novel Strain-Based Method to Estimate Tire Conditions Using Fuzzy Logic for Intelligent Tires. Sensors 2017, 17, 350. [Google Scholar] [CrossRef]
- Garcia-Pozuelo, D.; Yunta, J.; Olatunbosun, O.; Yang, X.; Diaz, V. A Strain-Based Method to Estimate Slip Angle and Tire Working Conditions for Intelligent Tires Using Fuzzy Logic. Sensors 2017, 17, 874. [Google Scholar] [CrossRef]
- Yunta, J.; Garcia-Pozuelo, D.; Diaz, V.; Olatunbosun, O. A Strain-Based Method to Detect Tires’ Loss of Grip and Estimate Lateral Friction Coefficient from Experimental Data by Fuzzy Logic for Intelligent Tire Development. Sensors 2018, 18, 490. [Google Scholar] [CrossRef]
- Yunta, J.; Garcia-Pozuelo, D.; Diaz, V.; Olatunbosun, O. Influence of camber angle on tire tread behavior by an onboard strain-based system for intelligent tires. Measurement 2019, 145, 631–639. [Google Scholar] [CrossRef]
- Mendoza-Petit, M.F.; García-Pozuelo, D.; Díaz, V.; Olatunbosun, O. A Strain-Based Intelligent Tire to Detect Contact Patch Features for Complex Maneuvers. Sensors 2020, 20, 1750. [Google Scholar] [CrossRef] [PubMed]
- Mendoza-Petit, M.F.; Garcia-Pozuelo, D.; Diaz, V.; Garrosa, M. Characterization of the loss of grip condition in the Strain-Based Intelligent Tire at severe maneuvers. Mech. Syst. Signal Process. 2022, 168, 108586. [Google Scholar] [CrossRef]
- Wang, Y.; Hu, J.; Wang, F.; Dong, H. Tire Road Friction Coefficient Estimation: Review and Research Perspectives. Chin. J. Mech. Eng. 2022, 35, 6. [Google Scholar] [CrossRef]
- Li, P.; He, J. Geometric design safety estimation based on tire–road side friction. Transp. Res. Part C 2016, 63, 114–125. [Google Scholar] [CrossRef]
- Abenojar, J.; Martinez, M.A.; Butenegro, J.; Bahrami, M.; García-Pozuelo, D. Plasma treatment effects on the wettability and adhesion of commercial rubber. In Proceedings of the 7th International Conference on Structural Adhesive Bonding AB2023, Oporto, Portugal, 13–14 July 2023. [Google Scholar]
- Martinez, M.A.; Abenojar, J.; Garcia-Pozuelo, D.; Requena, I.; Butenegro, J.; Bahrami, M. Preliminary studies of adhesion and durability of coatings on rubber for tires/Estudios previos de adhesión y durabilidad de recubrimientos sobre caucho para neumáticos. In Proceedings of the XXII Congreso Internacional de Adhesión y Adhesivos, Malaga, Spain, 9 October 2023. [Google Scholar]
- Martínez, M.A.; Abenojar, J.; García-Pozuelo, D. Effect of Plasma Treatment on Coating Adhesion and Tensile Strength in Uncoated and Coated Rubber Under Aging. Materials 2025, 18, 427. [Google Scholar] [CrossRef]
- Advantaria. Mixed Wheel with Rigid Outer Ring Structure and Increased Safety. Invention Patent with Examination ES 2 662 695 B2, 16 November 2018.
- Advantaria. Wheel with Mixed Damping and Increased Safety Structure. Patent of Invention with Examination ES 2 665 819 B2, 7 February 2019. [Google Scholar]
- Advantaria. Mixed Wheel for Two-Wheeled Vehicles with Increased Safety. Invention Patent ES 2 687 105 B1, 2 August 2019. [Google Scholar]
- García-Pozuelo, D.; Afshari, F.; Martínez, M.A.; Viadero-Monasterio, F.; Álvarez-Caldas, C.; Calvo Ramos, J.A. Designing a new sustainable and instrumented tire: ECOTIRE. In Proceedings of the XIX European Congress on Mechanism Science EUCOMES 2024, Padova, Italy, 18–20 September 2024. [Google Scholar]
- GABAUER, W. The Determination of Uncertainties in Tensile Testing. In Manual of Codes of Practice for the Determination of Uncertainties in Mechanical Tests on Metallic Materials Code of Practice; Voest-Alpine Stahl Linz GmbH: Linz, Austria, 2000. [Google Scholar]
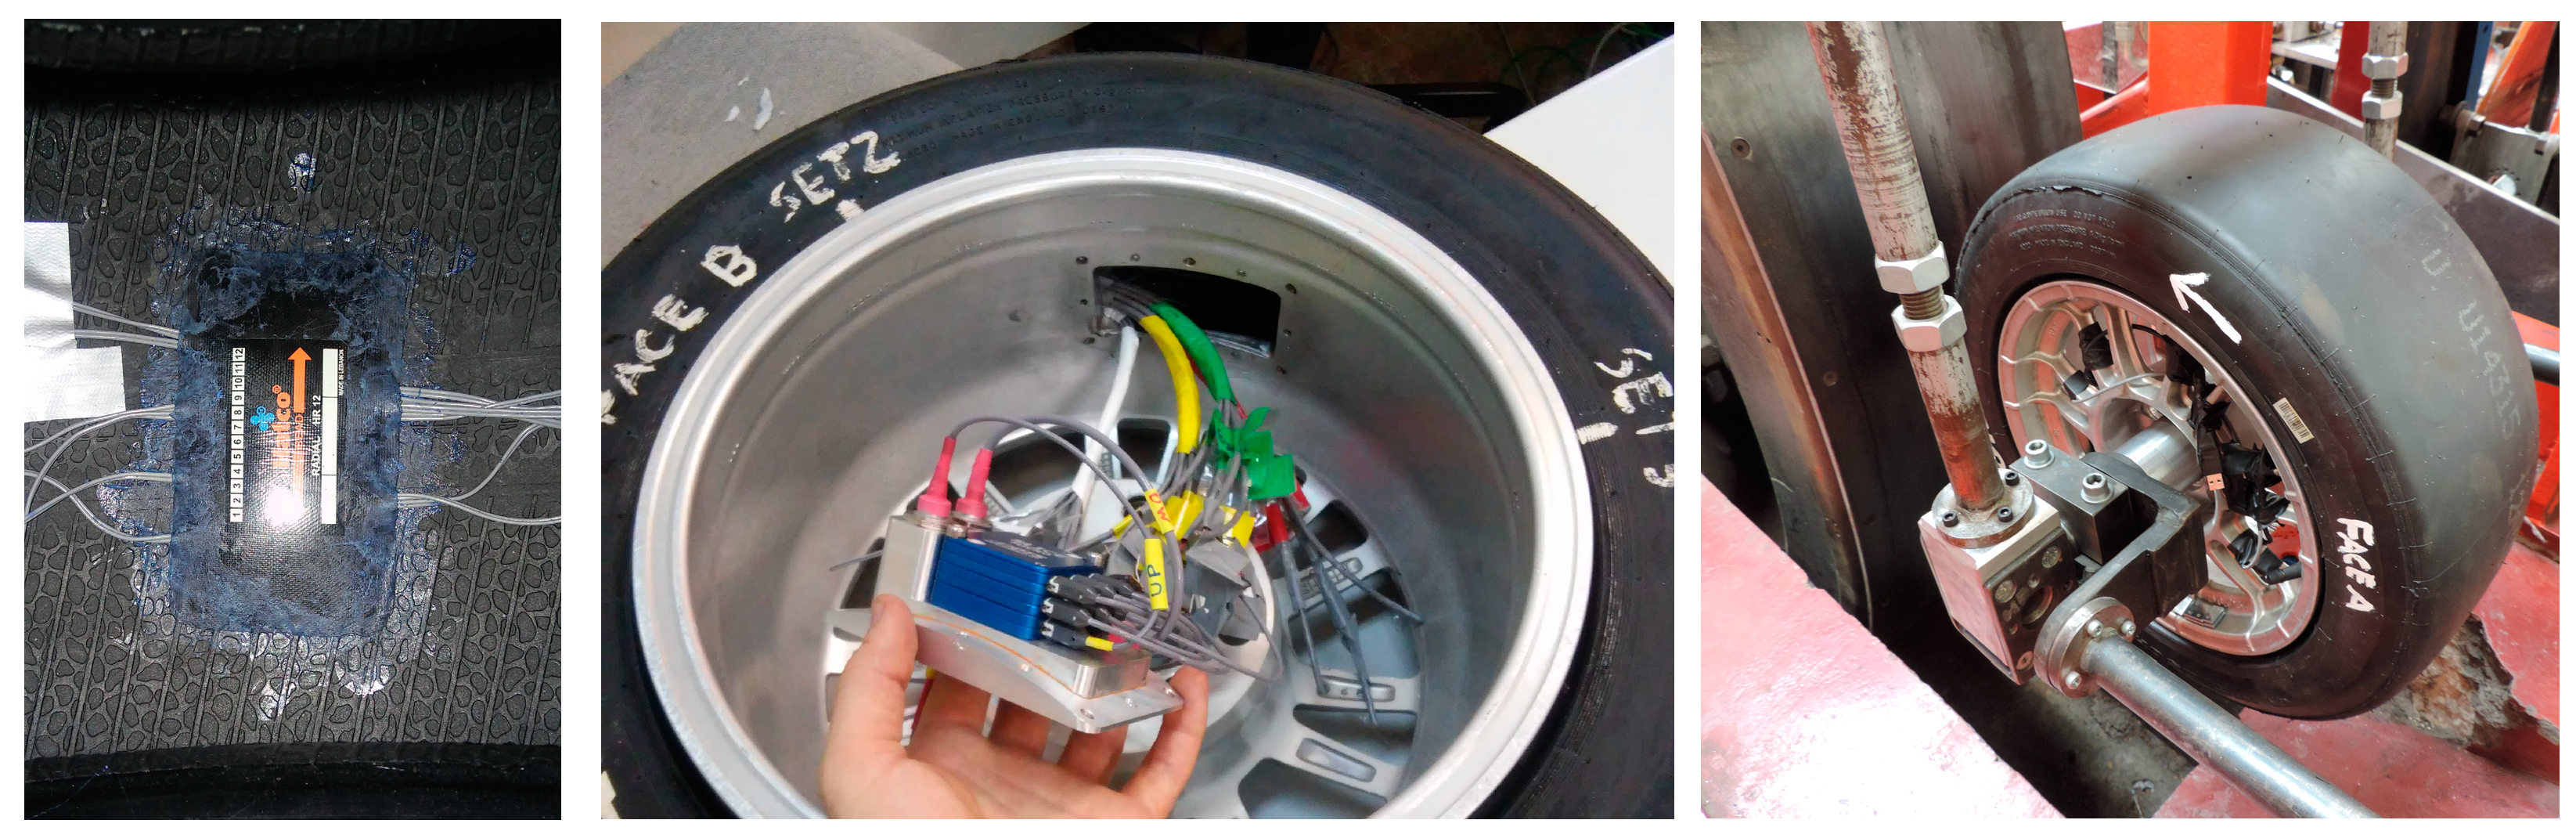
Figure 1.
Prototype of an instrumented/intelligent tire developed by the research team (Avon 175/53R13 slick tire).
Figure 1.
Prototype of an instrumented/intelligent tire developed by the research team (Avon 175/53R13 slick tire).
Figure 2.
Target trajectory and trajectories calculated by simulation of a segment D vehicle during a DLC maneuver at 50 km/h (passing the test) and 55 km/h (failing the test).
Figure 2.
Target trajectory and trajectories calculated by simulation of a segment D vehicle during a DLC maneuver at 50 km/h (passing the test) and 55 km/h (failing the test).
Figure 3.
Evolution of the values of tangential force, total requested grip, and angle of the tangential force during the DLC test at 50 km/h (a) and 55 km/h (b).
Figure 3.
Evolution of the values of tangential force, total requested grip, and angle of the tangential force during the DLC test at 50 km/h (a) and 55 km/h (b).
Figure 4.
Representation of the main parameters for proposed geometric optimization of the casing–tread connection and forces transmission through rhomboidal base geometry (top and side views, respectively). The casing is represented in gray, and the tread is shown in green.
Figure 4.
Representation of the main parameters for proposed geometric optimization of the casing–tread connection and forces transmission through rhomboidal base geometry (top and side views, respectively). The casing is represented in gray, and the tread is shown in green.
Figure 5.
(a) Manufactured test samples, (b) molds with the geometry of the test samples, (c) and one tested sample representation with the detail of the boundary conditions.
Figure 5.
(a) Manufactured test samples, (b) molds with the geometry of the test samples, (c) and one tested sample representation with the detail of the boundary conditions.
Figure 6.
Image of the “virtual contact patch models” test rig (a) and the device mounted in the universal testing machine for applying normal and tangential forces simultaneously (b).
Figure 6.
Image of the “virtual contact patch models” test rig (a) and the device mounted in the universal testing machine for applying normal and tangential forces simultaneously (b).
Figure 7.
Dimension of the treads and the plate in mm.
Figure 7.
Dimension of the treads and the plate in mm.
Figure 8.
The behavior of the sample under a 500 N normal load with a 15 mm allowable displacement in the longitudinal direction.
Figure 8.
The behavior of the sample under a 500 N normal load with a 15 mm allowable displacement in the longitudinal direction.
Figure 9.
Standard deviation vs. slope graph, the point where the behavior of the sample starts to show linearity for the tensile force.
Figure 9.
Standard deviation vs. slope graph, the point where the behavior of the sample starts to show linearity for the tensile force.
Figure 10.
The behavior of the sample under a 500 N normal load with a 15 mm allowable displacement in the lateral direction.
Figure 10.
The behavior of the sample under a 500 N normal load with a 15 mm allowable displacement in the lateral direction.
Figure 11.
The behavior of the sample under a 1000 N normal load with a 15 mm allowable displacement in the longitudinal (a) and lateral (b) direction.
Figure 11.
The behavior of the sample under a 1000 N normal load with a 15 mm allowable displacement in the longitudinal (a) and lateral (b) direction.
Figure 12.
The behavior of the sample under a 15,000 N normal load with a 15 mm allowable displacement in the longitudinal (a) and lateral (b) direction.
Figure 12.
The behavior of the sample under a 15,000 N normal load with a 15 mm allowable displacement in the longitudinal (a) and lateral (b) direction.
Figure 13.
(a) Longitudinal force evolution when imposing a displacement in that direction of 5 mm/min. (b) Evolution of the normal load when different values of initial normal load are set and the longitudinal force shown in (a) is applied over time.
Figure 13.
(a) Longitudinal force evolution when imposing a displacement in that direction of 5 mm/min. (b) Evolution of the normal load when different values of initial normal load are set and the longitudinal force shown in (a) is applied over time.
Figure 14.
(a) Evolution of the lateral force when imposing a displacement in that direction of 5 mm/min. (b) Evolution of the normal load when different values of initial normal load are set and the lateral force shown in (a) is applied over time.
Figure 14.
(a) Evolution of the lateral force when imposing a displacement in that direction of 5 mm/min. (b) Evolution of the normal load when different values of initial normal load are set and the lateral force shown in (a) is applied over time.
Table 1.
Analysis of the slopes for a 500 N initial normal load—longitudinal direction.
Table 1.
Analysis of the slopes for a 500 N initial normal load—longitudinal direction.
| Analyzed Force | Slope Equation (14) (kN·mm/kN·mm) |
|---|
| Normal force | 0.01345431 |
| Longitudinal force | 0.03166056 |
Table 2.
Analysis of the slopes for a 500 N initial normal load—lateral direction.
Table 2.
Analysis of the slopes for a 500 N initial normal load—lateral direction.
| Analyzed Force | Slope Equation (14) (kN·mm/kN·mm) |
|---|
| Normal force | 0.0099187 |
| Tangential force | 0.02811702 |
Table 3.
The slopes for a 1000 N normal load—longitudinal and lateral.
Table 3.
The slopes for a 1000 N normal load—longitudinal and lateral.
| Direction | Analyzed Force | Slope Equation (14) (kN·mm/kN·mm) |
|---|
| Longitudinal | Normal force | 0.00394634 |
| Longitudinal | Tangential force | 0.03179889 |
| Lateral | Normal force | 2.74369 × 10⁻⁶ |
| Lateral | Tangential force | 0.02864999 |
Table 4.
The slopes for a 1500 N normal load—longitudinal and lateral.
Table 4.
The slopes for a 1500 N normal load—longitudinal and lateral.
| Direction | Analyzed Force | Slope Equation (14) (kN·mm/kN·mm) |
|---|
| Longitudinal | Normal force | −0.0302729 |
| Longitudinal | Tangential force | 0.03547374 |
| Lateral | Normal force | −0.0307066 |
| Lateral | Tangential force | 0.0302354 |
| Disclaimer/Publisher’s Note: The statements, opinions and data contained in all publications are solely those of the individual author(s) and contributor(s) and not of MDPI and/or the editor(s). MDPI and/or the editor(s) disclaim responsibility for any injury to people or property resulting from any ideas, methods, instructions or products referred to in the content. |
© 2025 by the authors. Licensee MDPI, Basel, Switzerland. This article is an open access article distributed under the terms and conditions of the Creative Commons Attribution (CC BY) license (https://creativecommons.org/licenses/by/4.0/).


