Abstract
The main objective of this research is to evaluate the optimal design of the tendon profile layout and to examine the effect of the tendon profile layout on the flexural strength of unbonded, post-tensioned prestressed concrete bridge I-girders. In this study, the experimental investigation involved casting and testing ten unbonded, post-tensioned bridge girders under four-point loads. The main variable studied was the tendon profile layout. The experimental results showed that the flexural behavior of the tested specimens is divided into three stages, including the elastic stage, elastic–plastic stage, and plastic stage, and all specimens exhibited flexural failure. It can be concluded that for each tendon profile layout (trapezoidal, parabolic, harped), the tendon profile with eccentricity at the end of the beam (ee) = 0 had the maximum ultimate load capacity. It also can be concluded that specimen GF-2 HA (harped tendon profile with ee = 0 mm) had the maximum ultimate load capacity among all of the specimens. These enhancements in specimen stiffness, ultimate load capacities, and deflections are due to an increase in resisting capacity, a reduction in stresses, especially at the supports, a decrease in deflection, and an increase in the resisting bending moment, which lead to a reduction in the production cost of the girder.
Keywords:
tendon profile; flexural strength; unbonded; post-tension; prestress; bridge; ultimate load; cost 1. Introduction
Modern structural engineering has been moving toward more economical structures by continuously improving design methods and using higher-strength materials. This results in a smaller cross-sectional area and subsequent weight reduction. This is especially important for reinforced concrete, where dead loads represent a large amount of the load, and such advancements are vitally important. Prestressed concrete was developed to overcome the limiting features of ordinary reinforced concrete.
Prestressing systems are defined as the preloading of a structure prior to the application of service loads to improve structure performance in a specific way. Prestressing concrete systems include two types of prestressing. The first type is called pre-tensioning prestressing (the tendons are stressed before the concrete is placed), and the second one is known as post-tensioning prestressing (the tendons are tensioned after the concrete is placed) [1,2,3]. In bridge construction, the post-tensioned concrete system is most commonly used, as it has much better advantages compared to traditional reinforced concrete. This system offers improved material utilization, enhanced deflection and crack control, increased durability, faster construction times, reduced costs, and greater design flexibility [4].
A typical post-tensioning tendon includes prestressing strands, ducts that house the strands, grout, and anchorages that transfer the forces to the concrete [5].
There are two ways to achieve post-tensioned prestressed concrete: bonded post-tensioning and unbonded post-tensioning. In bonded post-tensioning, the tendons are in direct contact with the surrounding concrete, transferring stresses through the bond at the surface. On the other hand, in unbonded post-tensioning, tendons are away from the concrete, so the stress is not transferred through the bonding of the surface. The profile of the tendon is important for decreasing the tensile stress in the concrete. Finally, the forces induced by the curvature of the tendons provide counterbalancing forces that compensate for the tensile forces induced by the applied load. In order to counteract the sagging and bending moments caused by the transverse loads, tendons are positioned with eccentricities toward the soffit of the beam. When the prestressing force is applied, the prestressed beam deflects upward. The profile of the bending moment diagram is equal to the tendon profile layout because the bending moment diagram represents the product of eccentricity and prestressing force [6].
Flexural strength indicates the tensile strength or the ability of a beam or slab to resist bending moments up to the point where failure occurs [7].
In recent decades, numerous experimental and numerical studies have been conducted to examine the flexural behavior of unbonded prestressed concrete beams. Additionally, several numerical investigations have explored the impact of tendon profile configurations on the overall structural performance. In their study, Tang et al. [8] examined the flexural performance of prestressed concrete bridge girders using experiments and finite element modeling, providing insights into capacity, failure mechanisms, and design recommendations for engineers. In their research, Moreira et al. [9] conducted a finite element simulation of unbonded prestressed concrete beams, and a convergence method utilizing the Newton–Raphson scheme was developed for this purpose.
In their study, Páez et al. [10] provided a long-term pretension loss analytical method, and new formulas for the long-term prestress loss were developed. In the study by Kim et al. [11], 11 test specimens of post-tensioned prestressed concrete beams with different strength strands were used to evaluate flexural performance. The results showed that the increase in stress in the high-strength strands was underestimated by the ACI 318-19 [12] and AASHTO [12] design criteria [13]. In the study by Najem [14], the best section design was achieved by only considering flexural design constraints, including limiting the maximum stress at the extreme fibers of the section, which, in turn, were included in the design criteria. Another change implemented in the solution was the determination of an optimal location of the variable tendon eccentricity along the beam’s longitudinal section. In addition, tendon placement needs to be subject to certain design constraints concerning geometry and other design limitations; they ensure that the optimal placement of the tendon neither interferes with nor violates the original design integrity of the post-tensioned beam. In the work by Park et al. [15], a total of five large post-tensioned beams were tested to examine the flexural behavior of high-strength strands in relation to concrete compressive and strand tensile strengths. The results matched the code predictions, showing similar crack patterns and ductile behavior. Minimal excess in crack widths and stresses occurred under service loads, which can be controlled with a proper arrangement of deformed rebar. Dogu et al. [16] provided a method to predict the flexural behavior of post-tensioned ultra-high-performance concrete (UHPC) beams with unbonded tendons. The method uses a mechanics-based model to determine the ultimate strand stress based on a neutral axis depth, tendon properties, loading, and strains. Considering fiber tension and UHPC compression failure modes, predictions for 221 beams showed less than a 5% accuracy and a coefficient of variation of less than 17%. Oukaili et al. [17] conducted a nonlinear analysis to develop two models to predict the behavior of partially prestressed concrete flexural members with unbonded strands. One model was implemented using FORTRAN, while the other utilized ABAQUS. The models were validated with data from 22 beams and slabs, which varied in terms of the concrete’s strength, jacking stress, prestressing index, and span-to-depth ratio. Overall, the models accurately predicted the cracking loads, ultimate resistance, deflection, and strain, aligning well with the experimental data. Vichare et al. [18] investigated an efficient methodology for analyzing and designing prestressed concrete bridges using CSi Bridge version 20.2.0 advanced software. This software simplifies complex modeling by effectively handling dead loads, prestress forces, and live loads. The results demonstrate CSi Bridge’s automation capabilities, the dominance of dead loads in flexural design, live loads in shear, and the crucial role of cable profile positioning for stability and efficient design. Aravinthan et al. [19] conducted an experimental study to investigate the flexural behavior of single and two-span continuous beams with highly eccentric tendons. The study focused on various variables, including tendon profiles, loading patterns, casting methods, and confinement reinforcements. The results showed similar flexural responses across the tendon layouts, increased ductility from confinement without raising the ultimate strength, and tendon layout and loading patterns affected moment redistribution. Ibrahim et al. [20] studied the flexural behavior of corrosion-damaged reinforced concrete slabs that were reinforced with carbon fiber-reinforced polymer (CFRP) using NSM and CFRP strips. The slabs experienced corrosion levels of 11%, 26%, and 40%. The CFRP strengthening not only restored the original capacities of the slab but also exceeded them, leading to a significant increase in yield strength. However, when the corrosion level reached 40%, the yield strength began to decline, resulting in a decrease in load capacity strengthening from 38% to 15%. Khdir et al. [21] studied the flexural behavior of prestressed ultra-high-performance concrete beams, a modern type of concrete that is gaining popularity due to its high compressive and tensile strength, toughness, and durability. They tested four prestressed beams with compressive strengths from 40 MPa to 160 MPa, a reinforcement ratio of 0.00465, and an effective depth-to-width (d/b) ratio of 1.536. The results showed that an increasing compressive strength improved the ultimate load by approximately 46%. Load–deflection curves remained linear up to the yield load, similar to those of normal concrete. A failure occurred due to tensile fiber debonding and pull-out, which was attributed to the random distribution of fibers. Furthermore, strains in unbounded tendons were found to be incompatible with the adjacent concrete. Burhan [22] provided a finite element model to study creep, shrinkage, and tensile stiffness between cracks in partially prestressed continuous composite beams with deformable shear connections. This versatile algorithm accommodates any viscous law and load history. Numerical comparisons demonstrate its potential, and its simplicity allows for easy implementation in analytical programs.
Ng et al. [23] stated that the profile determination of prestressed tendons stands as a vital component in post-tensioned concrete structure design. They stated that using the load-balancing method provides substantial capabilities to obtain tendon profiles directly. They provided detailed explanations about method applications through two specific examples, which showed step-by-step procedures in different conditions. The method proves easy to execute for complex structural elements, including curved continuous bridges, according to the examples presented. The tests demonstrate that the load-balancing technique surpasses traditional approaches in efficiency, so standard procedures should be implemented according to the research findings. Khan et al. [24] utilized finite elements to propose a tendon layout design for one-way prestressed concrete slabs. In their approach, they considered B-Spline for the tendon layout design for slabs. The stresses of the structural body were calculated with the finite element method. They represented the tendons as parabolas and increased their eccentricities to minimize the tensile stresses despite the fact that the use of parabolas in the design of cables is complicated, particularly for continuous structures in which tendons are nominally not parabolic. The ordinates of the B-Spline were modified in such a way that the overall shape of the tendons fitted the intended profile. As they designed the tendon layout, they verified that the stress in the structural components would not exceed the allowable maximum tensile stress. The tendon profile was then iteratively optimized according to the stress results from the finite element analysis. Jagarapu et al. [25] applied a genetic algorithm-based optimization method for the design of simply supported prestressed concrete beams subjected to live and dead loads. In order to minimize the cost, they considered a tendon-to-concrete-cost ratio of 8. Their study examined various factors, including the beam length, tendon profile, sizing of the population in the algorithm, and live load intensity, which are effective in optimizing costs. The results demonstrated an increase of 21.7% in the optimum cost when the beam’s length is increased from 14 m to 15 m and a 16.8% increase when the live load is increased from 50 kN/m to 60 kN/m. Parabolic tendon profiles increase the optimum cost over straight profiles by 4.22% for beam lengths of 14 m and 15 m. Colajanni et al. [26] explained the design procedures for prestressed beams made from prestressed concrete. They provided the optimal layout for standard reinforcement in prestressed concrete beams that are subjected to bending moments and shear forces. Dixit et al. [27] investigated the effects of eccentricity, prestress load, and the tendon profile using a three-dimensional finite element model of a post-tensioned concrete beam under concentrated point loading. Analyses were conducted using the ANSYS 14.0 program. The static analysis results indicated that parameters including eccentricity, prestress load, and a tendon profile are vital components in the design of post-tensioned concrete beams. Naser [28] studied the impact of the tendon profile on the structural performance of post-tensioned concrete bridges in terms of moment bending, shear force, stress, and vertical deflection. The research studied two tendon profiles among multiple bridge models, which are seven simply supported and ten continuous bridge models. Simulation using the finite element method revealed that depending on the type and number of tendon anchorage points used, the performance of the bridges altered. In terms of serviceability loads, the continuous tendon profile design preferred is a post-tensioned concrete bridge solution, as it follows a design that induces lower deflection in the vertical [28]. Mohammed et al. [29] investigated the structural performance of post-tensioned two-way concrete slabs with diverse bonded tendon layouts. They investigated these tendon arrangements through a parametric study of slab tendon geometry and loads using nonlinear finite element analysis. The results showed that the slab post-tensioned in both directions failed at a load approximately 89% greater than the slab post-tensioned only in one direction. In their work, Yakov et al. [30] introduced a new method of optimizing the post-tensioned cable layouts in concrete slabs using 3D B-splines. Exact prestressing forces were modeled as cables and projected onto finite element meshes. Advanced designs using spline control points reduce the cable weight by more than 20% on regular floors and over 50% on irregular layouts without compounding performance. In their work, Xu et al. [31] investigated the effect of external prestressing tendons on reducing main span deflection, and concrete stress was studied using finite element models. Analytical evaluations on steel and concrete beams assessed the tendon contributions. An optimized tendon layout for hybrid beam rigid-frame bridges was developed, considering long-term shrinkage, creep, and tensioning schemes for maintenance insights. Rani [32] noted that the deflection of prestressed concrete beams with different cable profiles, including straight tendons, parabolic tendons, parabolic tendons with eccentric anchors, trapezoidal tendons, sloping tendons, and parabolic and straight cable combinations, was estimated. The analysis was performed using the basic concepts of C programming and conditional ‘if’ statements. The results of this method are compared with those obtained from an appropriate analytical method. Mohamed et al. [33] investigated the performance of reinforced concrete (RC) T-beams using external prestressing tendons to improve the load capacity and resistance. Seven beams were tested under four-point loading: one strengthened and six with straight, V-shaped, or U-shaped tendons. Finite element analysis showed that the cracking, yield, and ultimate loads increased by up to 250%, 570%, and 30%. Straight tendons with deviators performed best.
The tendon profile layout is an important factor in the design of post-tensioning concrete bridges. However, most studies that deal with tendon profile layouts study their effects on the structural performance of prestressed concrete beams and slabs numerically. Experimental studies do not exist, and if they do exist, there are very few.
In this study, experimental investigations were carried out to provide a better understanding of the flexural behavior of unbonded, post-tensioned, prestressed concrete bridge girders with different tendon profile layouts and eccentricities at end anchorages. Experiments were conducted on ten I-sections simply supported by unbonded single-strand prestressed post-tensioned beams with various profile shapes and eccentricities at the end anchorages; these beams were designed according to ACI 318M-19. The contribution rate of the tendon profile layout was investigated regarding improvements in the following:
- Increasing the load resistance.
- Increasing the bending moment capacity.
- Better deflection control.
- Increasing the stiffness of prestressed concrete I-bridge girders.
- Decreases in construction costs.
Finally, the ultimate capacity and serviceability observed through the tests and some recommendations for the design and practical application of the tendon profile layout of unbonded prestress concrete I-bridge girders are provided to engineers and designers.
2. Experimental Program
2.1. Size and Shape of the Test Specimens
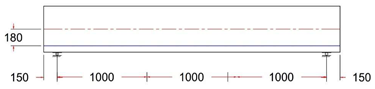
In this study, ten I-sections that were simply supported prestressed post-tensioned beams with various profiles of unbonded single strands were designed according to the ACI 318M-19 code and used in the experimental program [1,12,34,35]. All the beams were geometrically similar, having dimensions of 3300 (L) × 250 (W) × 500 (D) mm, and solid (rectangular) end blocks were provided at the ends, as shown in Figure 1.
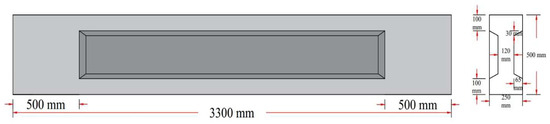
Figure 1.
Dimension of post-tensioned I-beam with rectangular end block.
These end blocks serve to accommodate the necessary end anchorage hardware and provide supplemental reinforcement; they are of little use in reducing transverse tension and avoiding cracking.
2.2. Prestressing and Reinforcement Detail
In each of the 10 tested specimens (beams), the main reinforcement was a single seven-wire low relaxation strand of 15.24 mm diameter (Grade 270), conforming to the requirements of ASTM A416/A416M standard specifications for steel strand [36], served as unbonded prestressing steel, and was located in the plastic duct of a 20 mm inner diameter. Deformed steel bars of 12 mm diameter are used for longitudinal steel bars to hold the stirrups, and 10 mm are used for vertical stirrups (all beams were designed for shear to avoid premature shear failure). Stirrups were spaced at 200 mm, center to center, along the beam, while 125 mm center-to-center spaced stirrups were used at the beam ends (anchorage zone) to prevent sudden shear failure and amplify end anchorage for the prestressed specimens. Figure 2 shows reinforcement details for a post-tensioned I-beam with end blocks.
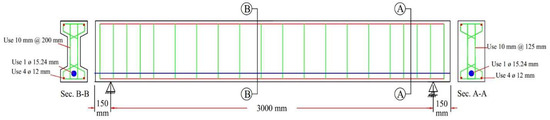
Figure 2.
Reinforcement detail for post-tensioned I-beam with end blocks.
Table 1 summarizes the physical properties of the strands and the steel reinforcement.

Table 1.
Physical properties of strands and rebars.
2.3. Concrete Mix Specification
The concrete mix was designed based on the (ACI 211.1) code and performed the guides in the (ACI 211.1R) code [37] by using high-performance superplasticizer admixture-type Sika Visco Crete 1681. The proportion of the concrete mix is listed in Table 2. The compressive strength of the cubes (fcu) at 28 days should not be less than 55 MPa [38].
Table 2.
Concrete mix proportion.
The compressive strength of the concrete was determined from 150 × 150 × 150 mm cubic samples after 28 days of curing. The average compressive strength (fcu) results for 12 concrete cubes were 71.6 MPa, as tested by a concrete compressive machine. The measured slump was 160 mm for the job mix.
The splitting tensile strength was found by testing a 150 × 300 mm cylindrical specimen according to the ASTM C496/C496M standard, as illustrated in Figure 3a. The splitting tensile strength (ft) was 3.64 MPa [39].
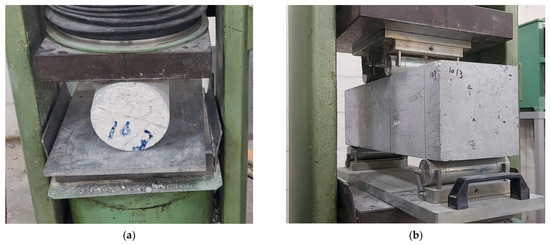
Figure 3.
(a) Splitting tensile strength test. (b) Prism test.
The flexural strength was obtained by testing 150 × 150 × 550 mm prisms, as illustrated in Figure 3b. Using the standard test method for concrete flexural strength (using a simple beam with third-point loading) according to ASTM C78/C78M, the modulus of rupture (fr) was 4.9 MPa [40].
The modulus of elasticity was obtained using a 150 × 300 mm cylinder in accordance with ASTM C469/C469M, as illustrated in Figure 4 [41]. For measuring deformation, a dial gauge with 0.001 mm accuracy was used, and the modulus of elasticity (Ec) was 34,699 MPa.
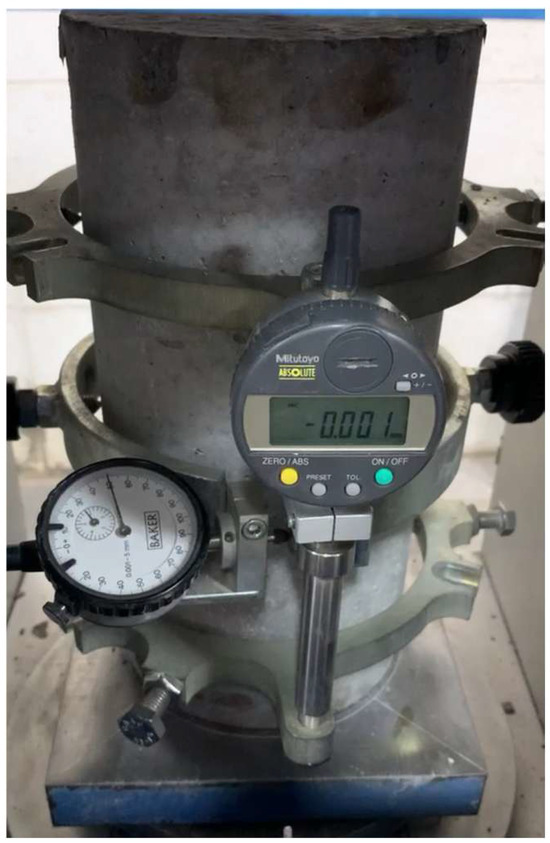
Figure 4.
The standard test for static modulus of elasticity.
2.4. Preparation of the Test Specimens
Reinforcement was prepared accurately, as shown in Figure 5a. The strands were prepared at the factory. One strand was cut for each beam with a total length of 3.70 m and inserted into the plastic ducts of 20 mm inner diameter, which were previously embedded inside the specimen body, as shown in Figure 5b. Spiral reinforcement was provided at the end block (anchorage zone), as shown in Figure 5c.
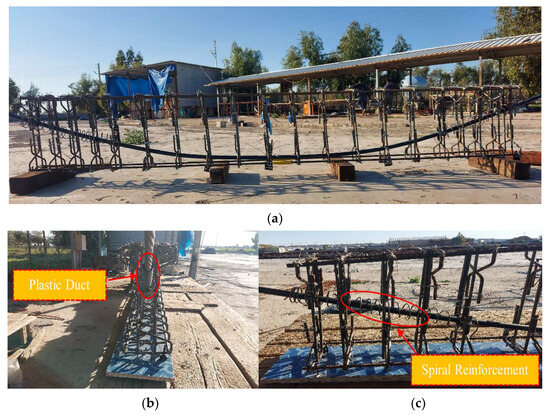
Figure 5.
Reinforcement preparation: (a) beam reinforcements detail, (b) strand in a plastic duct, and (c) spiral reinforcement.
Special molds made from steel and plywood were used for reinforced beam casting in separate matching. Ten reinforced concrete beams were constructed at Kirkuk Limited Company for Concrete Girder, as shown in Figure 6a. The moist curing process started after 15 h and continued for 7 days, as shown in Figure 6b.
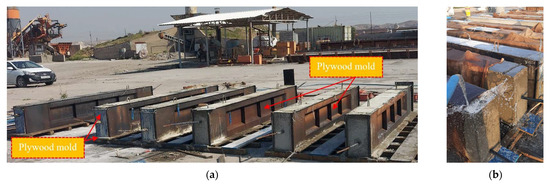
Figure 6.
The casting and curing of beams: (a) special molds made from steel and plywood used for casting specimens and (b) the moist curing process of the beams.
After 28 days from casting (concrete placement), post-tensioning of the beam was performed by the skilled staff of the prestressing concrete plant. A post-tensioning machine was used, as shown in Figure 7a. The strands were tensioned up to 0.7 ultimate strength (fpu) to reach a full prestressed condition under a full service load. At first, 20% of the jacking force was applied to tighten the wedge and plate in an accurate position, then a full jacking force of 182,282 N was applied to the strand, as shown in Figure 7b.
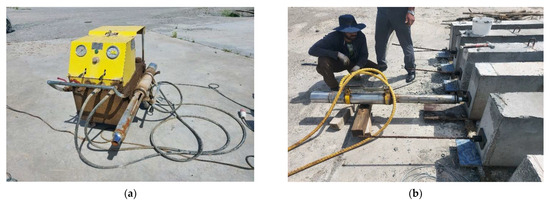
Figure 7.
(a) Post-tensioning machine. (b) Applying post-tensioning force.
The control of the jacking force was made by the load indicator of the hydraulic jack and by monitoring the elongation of the strand, and the process of post-tensioning took approximately 15 min for each beam. The flowchart for the preparation process of the test specimens is shown in Figure 8.
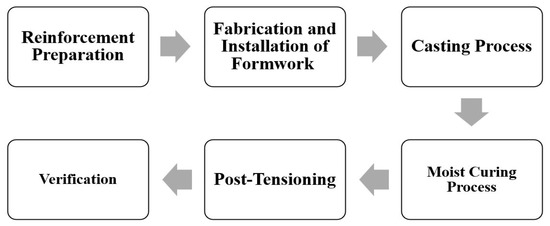
Figure 8.
Flow chart for the preparation of the test specimens.
2.5. Experimental Variables
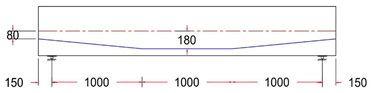
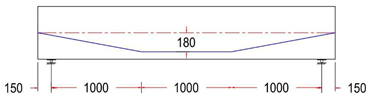
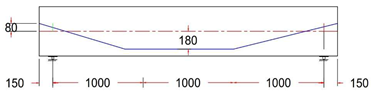
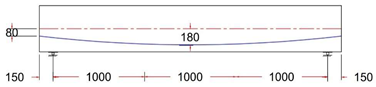
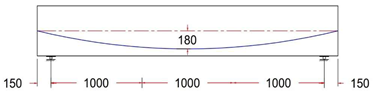
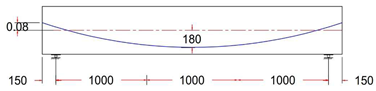
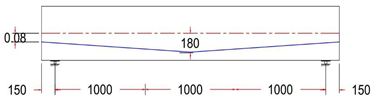
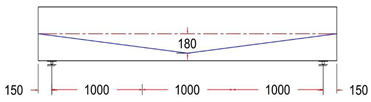
The options for selecting test variables were carefully studied, and specimens were prepared for the most questionable parameter. The target variable was a tendon profile layout; ten prestressed reinforced concrete beams with different tendon profile layouts were constructed, as illustrated in Table 3.
Table 3.
List of specimens with tendon profile layouts.
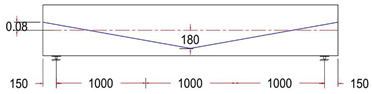
Eccentricity at midspan was 180 mm for all beams, while it varied between 180, 80, 0, and −80 mm at the anchorage points (at the end face of the beam).
2.6. Test Setup and Instrumentation
Experimental tests were conducted at the Laboratory of Civil Engineering at the University of Salaheddin Erbil. A four-point load test was performed to examine the flexural behavior of an unbonded, prestressed, post-tensioned beam. The specimens were simply supported at both ends.
The tested machine featured a steel frame with a load capacity of 2500 kN, as illustrated in Figure 9b. The load application was carried out using a hydraulic circular jack, which applied force to a load cell with a capacity of 1000 kN. This load cell measured the force applied during the tests and distributed the load through a steel beam.
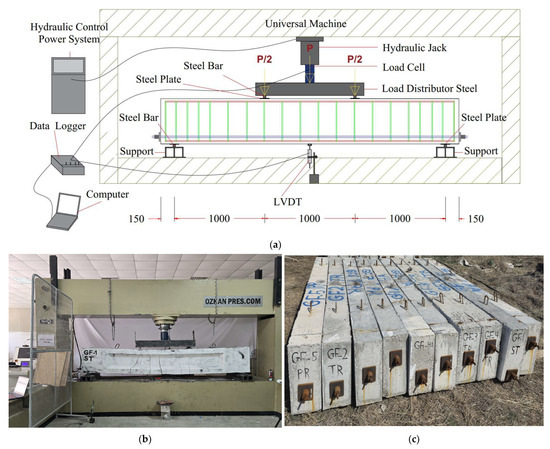
Figure 9.
Tested specimens, test setup, and instrumentation: (a) diagram of tested specimens and instrumentation, (b) testing machine (2500 kN capacity), and (c) tested specimens image.
The load-distributing steel beam divided the load into two regions, spaced 1000 mm apart, through two welded round bars with a diameter of 30 mm attached to plates that are 5 mm thick. Finally, the load was transferred to the concrete surface.
The supports consisted of rectangular (tube) steel sections that were braced to prevent bending distortion and restricted from horizontal movement. The clear span between the two supports measured 3000 mm. Additionally, a smooth 30 mm diameter bar was welded to the support, with a 5 mm thick plate positioned between the bar and the bottom of the beam. This setup allowed the plates to rotate smoothly with the specimens at the supports, as illustrated in Figure 9a.
In this experiment, two linear variable displacement transducers (LVDTs) with a gauge length of 300 mm were utilized to measure the center deflection of the beam as the applied load increased. The LVDTs were positioned at the midspan of the beam, attached to a rectangular steel tube placed between the LVDTs and the bottom face of the beam. This arrangement was designed to capture the maximum displacement of the specimens (beams). The first LVDT was mounted on the front face of the beam, while the second was placed on the back face, also at the midspan. This setup allows for the calculation of average displacement in case the steel tube becomes inclined rather than remaining straight, as illustrated in Figure 9a. The tested specimens are illustrated in Figure 9c.
2.7. Experimental Procedure
The specimens were tested using a flexural testing rig (universal machine) subjected to a four-point load test system, as shown in Figure 9a. The procedures for operating the test machine are outlined below:
- Connect the load cell and LVDTs to the data logger to obtain real-time measurements of the specimens’ load and displacement as the applied load increases, as shown in Figure 9a.
- Link the data logger to the computer. The computerized data acquisition system will automatically record and store the data.
- Loosen the load adjustment control wheel to prevent the sudden application of load to the specimen.
- After placing the specimen properly on the testing rig, slowly and steadily tighten the load adjustment control wheel to apply the load.
- The load control method was employed during the test, with the load applied at an average rate of 90 kN/min during the linear elastic stage. As cracks developed and the concrete began to exhibit plastic behavior, the digital load indicator no longer displayed a constant loading rate.
- For safety reasons, the test was terminated when the load remained constant or slightly decreased while the displacement significantly increased. On average, the tests took about 16 min from the beginning of the loading process until termination.
- While holding the load adjustment control wheel, highlight and mark each crack with a line.
- Finally, loosen the load adjustment control wheel before turning off the machine and disconnecting it from the computer.
3. Experimental Section
3.1. Tested Specimens
All specimens have the same cross-section and reinforcement rebar details, but they have different tendon profile layouts.
Ten unbonded, post-tensioned, prestressed beams were tested under a four-point loading test. Load–deflection curves, crack patterns, and modes of failure were used to investigate the flexure behavior of the prestressed bridge girders.
3.2. Load–Deflection Curves
Based on the result of the four-point load test, the load–deflection curves of the midspan of each beam were obtained. The load and corresponding deflection at both the first cracking load and the ultimate load for all beams are listed in Table 4.
Table 4.
Summary of experiment results.
The ratio of the first cracking load to the ultimate load (Pcr/Pu) is listed in Table 4, and this ratio serves as an indicator of beam ductility and structural behavior. The (Pcr/Pu) ratio is a good measure to obtain an idea of how a beam or structure reacts when it is loaded; it reflects the ability of structures to withstand loads prior to cracking and ultimate failure.
Generally, all specimens exhibited a linear response before cracking. Then, with an increase in the applied load, the ratio of the load to midspan deflection decreased, which means the stiffness of the tested beams decreased. Consequently, a plastic response was noted due to the yielding of the longitudinal tension reinforcement, which lasted until the end of the test, as shown in Figure 10.
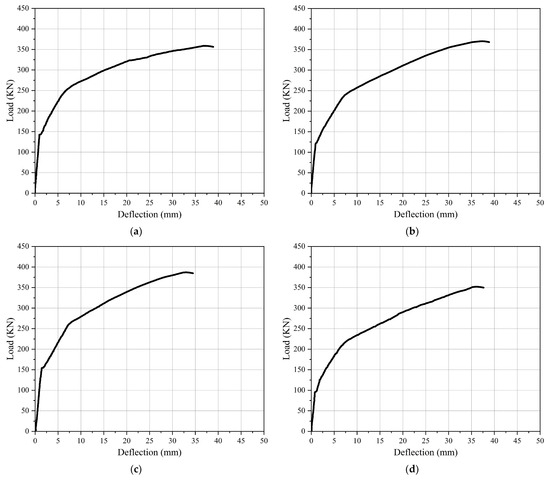
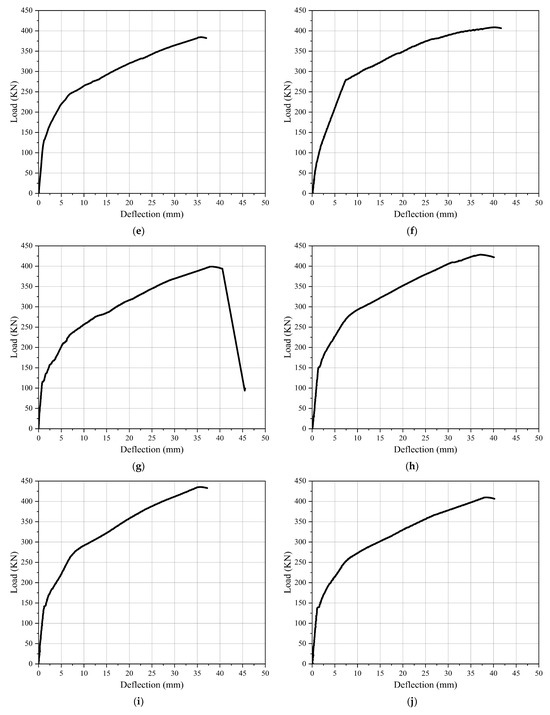
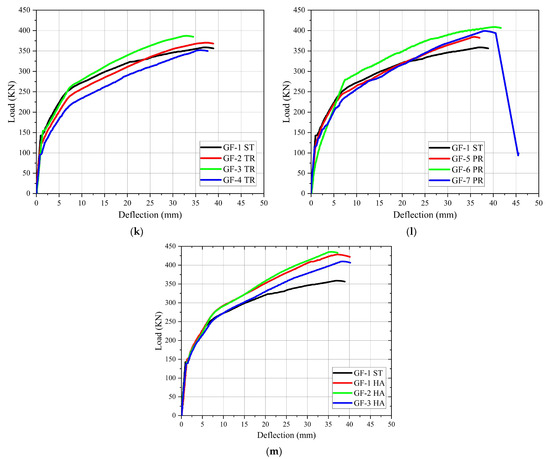
Figure 10.
Load–deflection curves: (a) GF-1 ST; (b) GF-2 TR; (c) GF-3 TR; (d) GF-4 TR; (e) GF-5 PR; (f) GF-6 PR; (g) GF-7 PR; (h) GF-1 HA; (i) GF-2 HA; (j) GF-3 HA; (k) GF-1 ST, GF-2 TR, GF-3 TR, and GF-4 TR; (l) GF-1 ST, GF-5 PR, GF-6 PR, and GF-7 PR; (m) GF-1 ST, GF-1 HA, GF-2 HA, and GF-3 HA.
As observed in Figure 10a, the load–deflection curve for the control specimen (GF-1 ST) with a straight tendon profile layout exhibited a linear response before cracking (elastic stage), in which the load varies linearly with deflection. As the load continues to increase, the first cracks appear in the concrete at 142.60 kN and a deflection of 0.95 mm. This marks the transition from elastic to inelastic behavior (elastic-plastic stage), and the slope of the load–deflection curve gradually decreases. This means the deflection increases faster than the load due to a decrease in stiffness resulting from cracking. As the load increased, a new inflection point was found in the load–deflection curve (the slope of the load–deflection curve gradually decreased again). Then, a plastic response (plastic stage) was observed due to the yielding of longitudinal tension reinforcement until the test was finished. In this stage, the load–deflection curve tends to be horizontal while the load no longer rises, and the deflection increases sharply. The ultimate load (maximum load) was 358.70 kN, and the deflection was 36.80 mm. The ratio (Pcr/Pu) was 39.75%, as shown in Table 4.
For the specimen GF-2 TR with a trapezoidal tendon profile and eccentricity at the end (the anchorage point of the tendon), ee = +80 mm, the load–deflection curve is illustrated in Figure 10b. Although its elastic stage is lower than the control beam, the first crack appeared in the concrete at 122.02 kN with a deflection of 0.96 mm, but it has a higher ultimate load of 371.63 kN and a smaller deflection of 36.76 mm at ultimate load. That means increasing the ultimate load by 12.93 kN with an increasing rate of 3.60% and decreasing the ultimate load deflection by 0.04 mm with a decreasing rate of 0.11%, as shown in Table 5. The (Pcr/Pu) ratio for this specimen was 32.83%, which was lower than the control beam, as shown in Table 4.
Table 5.
Comparison of ultimate load and ultimate load deflection of the control beam with other specimens.
For specimen GF-3 TR with a trapezoidal tendon profile layout and eccentricity at the end (ee) = 0, the load–deflection curve is observed in Figure 10c. Its elastic stage is greater than the control beam; the first crack appeared in the concrete at 154.12 kN with a deflection of 1.42 mm. It has a higher ultimate load of 386.72 kN and a smaller deflection of 32.36 mm at the ultimate load. This means increasing the ultimate load by 28.02 kN with an increasing rate of 7.81% and decreasing the ultimate load deflection by 4.44 mm with a decreasing rate of 12.07%, as shown in Table 5. The (Pcr/Pu) ratio for this specimen was 39.85%, which was higher than the control beam, as shown in Table 4.
For specimen GF-4 TR with a trapezoidal tendon profile layout and eccentricity at the end (ee) = −80 mm, the load–deflection curve is observed in Figure 10d. Its elastic stage is lower than the control beam, and the first cracks appeared in the concrete at 95.80 kN with a deflection of 0.79 mm. It has a lower ultimate load of 351.27 kN and a smaller deflection of 35.24 mm at the ultimate load. That means decreasing the ultimate load by 7.43 kN with a decreasing rate of 2.07% and decreasing the ultimate load deflection by 1.56 mm with a decreasing rate of 4.24%, as shown in Table 5. The (Pcr/Pu) ratio for this specimen was 27.27%, which was lower than the control beam, as shown in Table 4.
For the specimen GF-5 PR with a parabolic tendon profile layout and eccentricity at the end (ee) = +80 mm, the load–deflection curve is observed in Figure 10e. Its elastic stage is lower than the control beam. Although the first cracks appeared in the concrete at 131.72 kN, which is lower than the control beam, and the deflection was 1.16 mm greater than the control beam, it had a higher ultimate load of 383.75 kN and a smaller deflection of 35.22 mm at the ultimate load. That means increasing the ultimate load by 25.05 kN with an increasing rate of 6.98% and decreasing the ultimate load deflection by 1.58 mm with a decreasing rate of 4.29%, as shown in Table 5. The (Pcr/Pu) ratio for this specimen was 34.32%, which was lower than the control beam, as shown in Table 4.
For specimen GF-6 PR with a parabolic tendon profile layout and eccentricity at the end (ee) = 0, the load–deflection curve was observed in Figure 10f. Although its elastic stage is lesser than the control beam, the first cracks appeared in the concrete at 120.07 kN and with a deflection of 2 mm, but it had a higher ultimate load of 408.3 kN and a larger deflection of 39.56 mm at the ultimate load. That means increasing the ultimate load by 49.6 kN with an increasing rate of 13.83% and increasing the ultimate load deflection by 2.76 mm with an increasing rate of 7.50%, as shown in Table 5. The (Pcr/Pu) ratio for this specimen was 29.41%, which was lower than the control beam, as shown in Table 4.
For specimen GF-7 PR with a parabolic tendon profile layout and eccentricity at the end (ee) = −80 mm, the load–deflection curve is observed in Figure 10g. Although it has an elastic stage that is lower than the control beam, the first crack appeared in the concrete at 119.1 kN with a deflection of 0.85 mm. However, it has a higher ultimate load of 398.98 kN and a larger deflection of 37.83 mm at the ultimate load. That means increasing the ultimate load by 40.28 kN with an increasing rate of 11.23% and increasing the ultimate load deflection by 1.03 mm with an increasing rate of 2.80%, as shown in Table 5. The (Pcr/Pu) ratio for this specimen was 29.85%, which was lower than the control beam, as shown in Table 4.
For the specimen GF-1 HA, with a harped tendon profile layout and eccentricity at the end (ee) = +80 mm, the load–deflection curve is observed in Figure 10h. Its elastic stage was lower than the control beam, and the first crack appeared in the concrete at 150.45 kN with a deflection of 1.52 mm. This had a higher ultimate load of 426.00 kN and a smaller deflection of 35.74 mm at the ultimate load. That means increasing the ultimate load by 67.3 kN with an increasing rate of 18.76% and decreasing the ultimate load deflection by 1.06 mm with a decreasing rate of 2.88%, as shown in Table 5. The (Pcr/Pu) ratio for this specimen was 35.32%, which was lower than the control beam, as shown in Table 4.
For specimen GF-2 HA, with a harped tendon profile layout and eccentricity at the end (ee) = 0, the load–deflection curve is observed in Figure 10i. Its elastic stage was higher than the control beam; the first crack appeared in the concrete at 151.03 kN, and the deflection was 1.20 mm. It had a higher ultimate load of 434 kN but a lower deflection of 35.00 mm at the ultimate load. This means increasing the ultimate load by 75.3 kN with an increasing rate of 20.99% and decreasing the ultimate load deflection by 1.8 mm with a decreasing rate of 4.89%, as shown in Table 5. The (Pcr/Pu) ratio for this specimen was 34.80%, which was lower than the control beam, as shown in Table 4.
For specimen GF-3 HA, with a harped tendon profile layout and eccentricity at the end (ee) = −80 mm, the load–deflection curve was observed in Figure 10j. Although its elastic stage is higher than the control beam, the first cracks appeared in the concrete at 139.02 kN with a deflection of 1.20 mm, and it showed a higher ultimate load of 409.00 kN and a greater deflection of 37.90 mm at ultimate load. This means increasing the ultimate load by 50.3 kN with an increasing rate of 14.02% and increasing the ultimate load deflection by 1.1 mm with an increasing rate of 3%, as shown in Table 5. The (Pcr/Pu) ratio for this specimen was 33.99%, which was lower than the control beam, as shown in Table 4.
In the summary that compares all specimens with the control beam, as illustrated in Figure 10k–m, the differences in ultimate loads and deflections at these loads were attributed to the layout of the tendon profiles (trapezoidal, parabolic, and harped) and the end anchorage of the tendons. The bending moment at each section is determined by the product of the prestressing force and eccentricity of the tendon profile. Beams with zero eccentricity at the end anchorages demonstrated a greater load capacity than those with end eccentricity. The greater load capacity is because beams with zero eccentricity experience uniform compression stress only without any tension stress at the supports, resulting in a more uniform distribution of the applied load across the cross-section compared to the beams with eccentric tendons.
3.3. Crack Patterns and Mode of Failure
The cracking loads of each specimen were recorded during testing as soon as the first vertical crack appeared. The first crack appeared in the bottom flange for all specimens. In some cases, the specimens already had fine surface cracks before the test began, likely caused by drying shrinkage. These initial cracks often were not visible until they had extended to the beam’s surface. Additionally, some cracks were so small that they took time to become noticeable. As a result, the recorded cracking load was typically slightly higher than the actual cracking load.
The crack patterns and failure modes of each specimen are shown in Figure 11 and Table 4. Flexural cracking was observed in all specimens in the pure moment region and initially appeared at the bottom flange of the girder between the two loading points. As the load continued to increase, the flexural crack propagated vertically upward and expanded, and more cracks appeared in the constant moment region. Then, some oblique flexural cracks would propagate from the bottom flange toward the loading points. Finally, a reduction in the loading capacity (beam stiffness) was noted, resulting from the cracks expanding and extending.
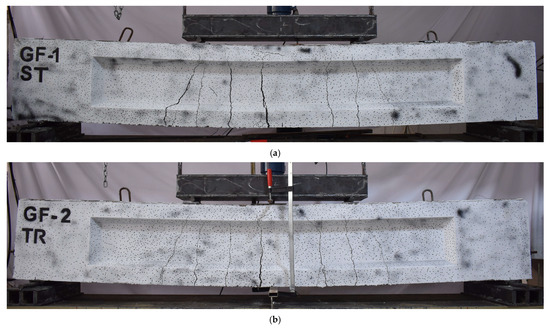
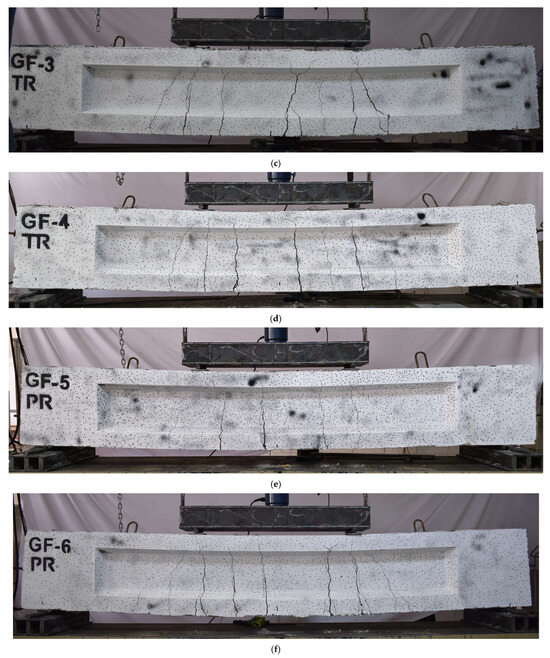
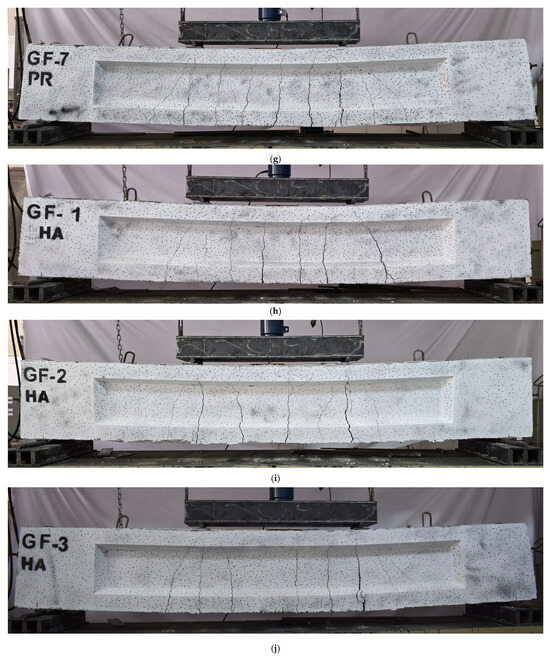
Figure 11.
Crack patterns for the tested specimens: (a) GF-1 ST; (b) GF-2 TR; (c) GF-3 TR; (d) GF-4 TR; (e) GF-5 PR; (f) GF-6 PR; (g) GF-7 PR; (h) GF-1 HA; (i) GF-2 HA; (j) GF-3 HA.
For specimens GF-1 ST, GF-2 TR, GF-3 TR, GF-4 PR, and GF-5 PR, the first crack was observed near the midspan. More cracks would appear with increasing the applied load; finally, the first crack was a major one at the end of loading. For specimens GF-6 PR, GF-7 PR, GF-1 HA, GF-2 HA, and GF-3 HA, the first crack was observed near the midspan. More cracks would propagate with increasing the applied load. Finally, one of the propagated cracks near the left point loading was a major crack at the end of the loading.
This means that if the tendon profile layout at the pure moment region was straight, the final major crack would be near the midspan. However, the final major crack position transferred near the left point load with an increasing tendon curvature for the parabolic tendon profiles and a tendon slope for the harped tendon profiles.
For the trapezoidal tendon profile, the major final crack was still near the midspan of the beam because the tendon profile between the two point loads was straight.
For the parabolic tendon profile, GF-5 PR, a major final crack formed near the midspan of the beam because the tendon curvature was very little between the two point loads and was straight, and with increasing the tendon curvature for parabolic tendon profiles for GF-6 PR and GF-7 PR. The final major crack position transferred near the left point load.
4. Conclusions
In order to examine the effect of the tendon profile’s layout on the flexural strength of unbonded prestress concrete bridge I-girders, an experimental investigation was conducted on ten unbonded prestress concrete bridge I-girders with different tendon profile layouts. The following conclusions were drawn from this study:
- The flexural destruction of unbonded prestressed concrete bridge I-girders experienced elastic, elastic–plastic, and ductility (plastic) stages similar to those of bonded prestressed concrete bridge I-girders. However, unbonded prestressed concrete bridge I-girders present superior ductility and deformation-recovery ability after unloading.
- The tendon profile layout has a significant influence on the destruction process in unbonded prestress concrete bridge I-girders.
- The experimental results showed that the flexural behavior of the tested specimens is divided into three stages: the elastic stage, the elastic–plastic stage, and the plastic (ductility) stage. All specimens exhibited flexural failure.
- The ultimate load of the specimens using a trapezoidal tendon profile showed a maximum increase of 28.02 kN with an increasing rate of 7.81% for specimen GF-3 TR if we compare it to the control beam.
- The ultimate load of the specimens using a parabolic tendon profile had a maximum increased load of 49.6 kN with an increasing rate of 13.83% for specimen GF-6 PR if we compare it to the control beam.
- The ultimate load of the specimens using a harped tendon profile had a maximum increased load of 75.3 kN with an increasing rate of 20.99% for specimen GF-2 HA if we compare it to the control beam.
- For the specimens using a trapezoidal tendon profile, specimen GF-3 TR had a minimum vertical deflection of 32.36 mm, which was less than the control beam by 4.44 mm, with a decreasing rate of 12.07% from the control beam.
- For specimens with a parabolic tendon profile, specimen GF-5 PR had a minimum vertical deflection of 35.22 mm, which was lower than the control beam by 1.58 mm, with a decreasing rate of 4.29% from the control beam.
- For the specimens with a harped tendon profile, specimen GF-2 HA had a minimum vertical deflection of 35 mm, which was less than the control beam by 1.80 mm, with a decreasing rate of 4.89% from the control beam.
- Each tendon profile shape (trapezoidal, parabolic, harped) with eccentricity at the end (ee) = 0 had a maximum ultimate load capacity. It can be concluded that specimen GF-2 HA with a harped tendon profile had the maximum ultimate load capacity compared to all other specimens. Also, it can be concluded that specimen GF-3 TR with a trapezoidal tendon profile had minimum deflection compared to all other specimens, which agrees with the results of the finite element analysis by Ansys 14.0 and Sap2000 version 14 software, completed by Dixit and Naser [27,28], and it has the highest (Pcr/Pu) ratio compared to all other specimens. These enhancements in specimen stiffness, ultimate load capacities, and deflections are because of the effect of the tendon profile layout on the flexural capacity of girders.
- The experimental results of the tests on girders with optimized tendon profiles illustrated remarkable improvements in performance. These girders carried higher loads with less deflection than the control beam. The efficiency of prestressing forces throughout the girder length makes the girders with optimized tendon configurations more performant. These improvements allow for a more even distribution of the induced stresses to the concrete member, engaging with more of the cross-section for load carrying. This uniform stress distribution enhances the ductility of the girder and, hence, the service life of the structure.
Finally, the research results demonstrate that optimized tendon arrangements achieve substantial improvements in load-carrying capacity, deflection control, and overall performance. These outcomes inform and enhance the design and optimization of prestressed concrete girders, and they facilitate the optimization of performance, service life, and safety in bridge construction.
Author Contributions
Conceptualization, S.I.H. and O.Q.A.; methodology, S.I.H.; validation, S.I.H., O.Q.A. and A.M.L.; formal analysis, S.I.H.; investigation, S.I.H.; resources, S.I.H.; data curation, S.I.H.; writing—original draft preparation, S.I.H.; writing—review and editing, A.M.L. and O.Q.A.; visualization, S.I.H. and A.M.L.; supervision, A.M.L. and O.Q.A.; project administration, A.M.L. and O.Q.A. All authors have read and agreed to the published version of the manuscript.
Funding
This research received no external funding.
Institutional Review Board Statement
Not applicable.
Informed Consent Statement
Not applicable.
Data Availability Statement
The data presented in this study are available on request from the corresponding author. The data are not publicly available due to privacy restrictions.
Acknowledgments
The authors would like to acknowledge the Laboratory of Civil Engineering at the University of Salaheddin-Erbil for providing the facilities and resources required to conduct the experimental tests. Special thanks to the technical staff for their assistance and support throughout the research process. We extend our sincere gratitude to Kirkuk Limited Company for Concrete Girder for their expert technical support in the post-tensioning of beams. Special thanks to their skilled prestressing concrete plant staff, whose precision and professionalism were essential to this research.
Conflicts of Interest
The authors declare no conflicts of interest.
References
- Nilson, A.H. Design of Prestressed Concrete, 2nd ed.; Wiley: Hoboken, NJ, USA, 1987. [Google Scholar]
- Naser, A.F.; Zonglin, W. Strengthening of Jiamusi Pre-Stressed Concrete Highway Bridge by Using External Post-Tensioning Technology in China. J. Eng. Appl. Sci. 2010, 5, 60–69. [Google Scholar]
- Naser, A.F.; Zonglin, W. Finite Element and Experimental Analysis and Evaluation of Static and Dynamic Responses of Oblique Pre-Stressed Concrete Box Girder Bridge. Res. J. Appl. Sci. Eng. Technol. 2013, 6, 3642–3657. [Google Scholar] [CrossRef]
- Abdullah, A.B.M.; Rice, J.A.; Hamilton, H.R.; Consolazio, G.R. Damage Identification in Unbonded Tendons for Post-Tensioned Bridges. In Proceedings of the International Conference on Advances in Experimental Structural Engineering, Champaign, IL, USA, 1–2 August 2015; p. 8. [Google Scholar]
- Corven, J.; Natio, C.; Pessiki, S. Designing and Detailing Post-Tensioned Bridges to Accommodate Nondestructive Evaluation; Office of Bridges and Structures: Hong Kong, China, 2018.
- Nusrath, F.R.; Satheesh, V.S.; Manigandan, M.; Suresh, B.S. An Overview on Tendon Layout for Prestressed Concrete Beams. IJISET-Int. J. Innov. Sci. Eng. Technol. 2015, 2, 944. [Google Scholar]
- Lim, S.S.; Wong, J.Y.; Yip, C.C.; Pang, J.W. Flexural Strength Test on New Profiled Composite Slab System. Case Stud. Constr. Mater. 2021, 15, e00638. [Google Scholar] [CrossRef]
- Tang, C.; Zhang, G.; Song, C.; Li, X.; Hou, Y. Flexural Behavior of Unbonded Prestressed Concrete Bridge Girders. Adv. Civ. Eng. 2021, 2021, 6642513. [Google Scholar] [CrossRef]
- Moreira, L.S.; Sousa, J.B.M.; Parente, E. Nonlinear Finite Element Simulation of Unbonded Prestressed Concrete Beams. Eng. Struct. 2018, 170, 167–177. [Google Scholar] [CrossRef]
- Páez, P.M.; Sensale, B. Improved Prediction of Long-Term Prestress Loss in Unbonded Prestressed Concrete Members. Eng. Struct. 2018, 174, 111–125. [Google Scholar] [CrossRef]
- ACI 318-19 Building Code Requirements for Structural Concrete (ACI 318-19) Commentary on Building Code Requirements for Structural Concrete (ACI 318R-19); American Concrete Institute: Farmington Hills, MI, USA, 2019.
- AASHTO. AASHTO LRFD Bridge Design Specifications: SI Unit, 4th ed.; AASHTO: Washington, DC, USA, 2007. [Google Scholar]
- Kim, M.S.; Lee, Y.H. Flexural Behavior of Posttensioned Concrete Beams with Unbonded High-Strength Strands. Adv. Mater. Sci. Eng. 2020, 2020, 5317456. [Google Scholar] [CrossRef]
- Najem, R.M. Optimum Tendon Placement for Post Tensioned S.S. Beam with Variable Eccentricity. Tikrit J. Eng. Sci. 2018, 25, 27–35. [Google Scholar] [CrossRef]
- Park, H.; Jeong, S.; Lee, S.C.; Cho, J.Y. Flexural Behavior of Post-Tensioned Prestressed Concrete Girders with High-Strength Strands. Eng. Struct. 2016, 112, 90–99. [Google Scholar] [CrossRef]
- Dogu, M.; Menkulasi, F. A Flexural Design Methodology for UHPC Beams Posttensioned with Unbonded Tendons. Eng. Struct. 2020, 207, 110193. [Google Scholar] [CrossRef]
- Oukaili, N.; Peera, I. Behavioral Nonlinear Modeling of Prestressed Concrete Flexural Members with Internally Unbonded Steel Strands. Results Eng. 2022, 14, 100411. [Google Scholar] [CrossRef]
- Vichare, A.M.; Barbudhe, P.S.; Rele, R. Effective Positioning of Cable Profiles in Prestressed: I Girders. J. Emerg. Technol. Innov. Res. 2024, 11, 447–460. [Google Scholar]
- Aravinthan, T.; Witchukreangkrai, E.; Mutsuyoshi, H. Flexural Behavior of Two-Span Continuous Prestressed Concrete Girders with Highly Eccentric External Tendons. Aci. Struct. J. 2005, 102, 402–411. [Google Scholar] [CrossRef]
- Ibrahim, R.K.; Lateef, A.M. Flexural Behavior of Corroded One-Way Slabs Strengthened with CFRP in Two Different Techniques. Innov. Infrastruct. Solut. 2024, 9, 353. [Google Scholar] [CrossRef]
- Khdie, M.K.; Qziz, O.Q. ZANCO Journal of Pure and Applied Sciences The Flexural Behavior of UHP Pre-Stressed Concrete Beams. Zanco J. Pure Appl. Sci. 2016, 28, 29–36. [Google Scholar]
- Burhan, M. A Finite Element Model for the Study of The Creep and Shrinkage Effects in the Partially Prestressed Continuous Composite Beams. Tikrit J. Eng. Sci. 2005, 12, 77–100. [Google Scholar] [CrossRef]
- Ng, P.L.; Kwan, A.K.H. Practical Determination of Prestress Tendon Profile by Load-Balancing Method. Hkie Trans. Hong Kong Inst. Eng. 2006, 13, 27–35. [Google Scholar] [CrossRef]
- Khan, A.A.; Pathak, K.K.; Dindorkar, N. Cable Layout Design of One Way Prestressed Slabs Using Fem. J. Eng. Sci. Manag. Educ. 2010, 2, 34–41. [Google Scholar]
- Jagarapu, D.C.K.; Venkat, L. Genetic Algorithm Based Optimum Design of Prestressed Concrete Beam. Int. J. Comput. Civ. Struct. Eng. 2013, 3, 644–654. [Google Scholar]
- Colajanni, P.; Recupero, A.; Spinella, N. Design Procedure for Prestressed Concrete Beams. Comput. Concr. 2014, 13, 235–253. [Google Scholar] [CrossRef]
- Dixit, A.S.; Khurd, V.G. Effect of Prestressing Force, Cable Profile and Eccentricity on Post Tensioned Beam. Int. Res. J. Eng. Technol. 2017, 4, 626–632. [Google Scholar]
- Naser, A.F. Optimum Design of Vertical Steel Tendons Profile Layout of Post-Tensioning Concrete Bridges: Fem Static Analysis. Arpn J. Eng. Appl. Sci. 2018, 13, 9244–9256. [Google Scholar]
- Mohammed, A.H.; Abdul-Razzaq, K.S.; Mohammedali, T.K.; Nassani, K.D.E.; Hussein, A.K. Finite Element Modeling of Post-Tensioned Two-Way Concrete Slabs under Flexural Loading. Civ. Eng. J. 2018, 4, 1–10. [Google Scholar] [CrossRef]
- Yakov, Z.; Amir, O. Layout Optimization of Post-Tensioned Cables in Concrete Slabs. Struct. Multidiscip. Optim. 2021, 63, 1951–1974. [Google Scholar] [CrossRef]
- Xu, G.; Zeng, M.; Su, Q. Layout and Optimization of the External Prestressing Tendons of Hybrid Beam Rigid Frame Bridges. In IOP Conference Series: Earth and Environmental Science; IOP Publishing: Bristol, UK, 2021; Volume 719, pp. 1–10. [Google Scholar]
- Rani, U.M. Effect of Tendon Profile on Deflections in Prestressed Concrete Beams Using C Programme. Int. J. Comput. Sci. Eng. 2021, 8, 6–8. [Google Scholar] [CrossRef]
- Mohamed, G.A.; Eisa, A.S.; Purcz, P.; Ručinský, R.; El-Feky, M.H. Effect of External Tendon Profile on Improving Structural Performance of RC Beams. Buildings 2022, 12, 789. [Google Scholar] [CrossRef]
- Nawy, E.G. Prestressed Concrete: A Fundamental Approach, 5th ed.; Person Education: London, UK, 2010; ISBN 0136081509. [Google Scholar]
- Nilson, A.H.; Darwin, D.; Dolan, C.W. Design of Concrete Structures, 14th ed.; McGraw-Hill: New York, NY, USA, 2011; ISBN 978-007-131139-7. [Google Scholar]
- ASTM A416/A416M-24; Standard Specification for Low-Relaxation Seven-Wire Steel Strand for Prestressed Concrete (ASTM A416/A416M-24). ASTM International: West Conshohocken, PA, USA, 2024; Volume 01.04.
- ACI Committee 211. Selecting Proportions for Normal-Density and High-Density Concrete-Guide Inch-Pound Units Selecting Proportions for Normal-Density and High-Density Concrete-Guide (ACI Committee 211); American Concrete Institute: Farmington Hills, MI, USA, 2022. [Google Scholar]
- Hassan, O.S. Concrete Job Mix Formula for (Precast-Prestressed Girder Plant); Kirkuk Limited Company for Concrete Girder: Kirkuk, Iraq, 2023. [Google Scholar]
- ASTM C496/C496M-17; Standard Test Method for Splitting Tensile Strength of Cylindrical Concrete Specimens (ASTM C496/C496M-17). ASTM International: West Conshohocken, PA, USA, 2017; Volume 04.02.
- ASTM C78/C78M-18; Standard Test Method for Static Modulus of Elasticity and Poisson’s Ratio of Concrete in Compression (ASTM C78/C78M-18). ASTM International: West Conshohocken, PA, USA, 2018; Volume 04.02.
- ASTM C469/C469M-14; Standard Test Method for Static Modulus of Elasticity and Poisson’s Ratio of Concrete in Compression (ASTM C469/C469M-14). ASTM International: West Conshohocken, PA, USA, 2014; Volume 04.02.
Disclaimer/Publisher’s Note: The statements, opinions and data contained in all publications are solely those of the individual author(s) and contributor(s) and not of MDPI and/or the editor(s). MDPI and/or the editor(s) disclaim responsibility for any injury to people or property resulting from any ideas, methods, instructions or products referred to in the content. |
© 2025 by the authors. Licensee MDPI, Basel, Switzerland. This article is an open access article distributed under the terms and conditions of the Creative Commons Attribution (CC BY) license (https://creativecommons.org/licenses/by/4.0/).