Abstract
To analyze the dynamic characteristics of single-tooth rock-cutting behavior, this paper proposes that the height of the extrusion zone (hc) is not constant and does not equal the cutting depth in real rock-cutting behavior, and introduces a new dynamic cutting model (NDCM). By analyzing the single-tooth rock-cutting process, the concepts of the single cutting process and cutting frequency (fc) are defined. A method for determining fc based on the tangential cutting force (Fct) is also proposed. A series of single-tooth rock-cutting tests were conducted using numerical simulation, and the influence of rake angle (a), cutting speed (v), and cutting depth (h) on fc was analyzed. The geometric difference coefficient (GDC) is introduced in the new dynamic cutting model, defined as the ratio of hc to h. The determination method of GDC and its relationship with cutting parameters are explored from both theoretical and experimental perspectives. The results show that the cutting frequency corresponds to the main frequency of the tangential cutting force. fc is linearly proportional to v and decreases nonlinearly with increasing h, while the rake angle has little effect on cutting frequency within the range of 10–20°. hc exhibits a nonlinear relationship with h: when the cutting depth is small, GDC is close to 1.0; as h increases, GDC gradually decreases and eventually stabilizes, which aligns with experimental findings. The results of this study provide valuable insights for engineers to better understand the dynamic characteristics of tool–rock interaction in single-tooth rock cutting and offer new perspectives for applying cutting force and optimizing rock-cutting models.
1. Introduction
It is well known that drilling efficiency is closely linked to project profitability. Compared to traditional extrusion-based rock-breaking methods, cutting techniques significantly enhance rock-breaking efficiency [1]. As a result, PDC (polycrystalline diamond compact), which utilizes cutting for rock breakage, has become widely adopted in drilling engineering. Since its introduction in the 1950s, the study of rock-breaking mechanisms has remained a key research focus in drilling engineering, serving as a theoretical foundation for improving drilling efficiency [2,3,4,5].
A typical Polycrystalline Diamond Compact (PDC) bit consists of multiple cutters, and its rock-breaking mechanism is complex [6,7,8]. To better understand this mechanism and optimize the rock-breaking parameters, single-tool testing was first employed in the 1970s and has been used ever since [9,10]. Based on the relative motion between the tool and the rock, single-tooth cutting tests can be classified into three types: linear cutting, rotary cutting, and mixed cutting [8,11,12]. Due to its convenience and clarity, the linear cutting test is considered the most suitable for studying tool–rock interactions [13]. As a result, extensive research has been conducted on single-tooth cutting tests for rock breaking [6,11,14,15,16].
In the study of single-tool cutting, researchers have developed mechanical models for rock breaking, which are influenced by drilling operation parameters, the mechanical properties of the rock, and the geometric parameters of the cutting teeth [6,17,18,19]. Subsequently, by incorporating the shape and distribution of the cutting teeth on the drill bit, a comprehensive drilling and rock-breaking model for the entire drill bit was derived using the superposition principle [6,20].
In the drilling mechanics model, the geometric parameters of the tool can be directly measured, while the rotational speed, drilling speed, and drilling load can be accurately obtained through various functional sensors [11]. As a result, to derive the fundamental parameters for geotechnical engineering design and safety assessment, researchers have applied the drilling model to predict lithological parameters, based on drilling operations and the monitoring of mechanical response parameters [18,21,22,23,24,25].
According to previous literature, the cutting tool does not make direct contact with the rock at the front during the cutting process; instead, an extrusion zone typically exists between them [26]. The primary function of this zone is to transfer the force and energy applied by the tool to the rock, thereby inducing and maintaining the continuous occurrence of rock-breaking activities [27,28,29]. Considering this characteristic, the presence of the extrusion zone has been incorporated into the study of the rock-cutting mechanism, and a corresponding theoretical model has been proposed [27]. Additionally, scholars have observed that as the rock failure process progresses in front of the tool, the cutting force fluctuates accordingly, indicating a close relationship between cutting force variations and the rock failure process [16,17]. Moreover, achieving optimal rock-breaking efficiency has always been a key objective for engineers and researchers. To characterize the efficiency of rock cutting, the concept of mechanical specific energy, based on cutting force, was introduced [30,31]. This concept represents the energy consumption per unit of rock failure and has led to several valuable conclusions [8,10,28,32].
Furthermore, the numerical simulation method has been applied to the study of rock cutting due to its excellent capability in handling large deformations, yielding many significant results [14,33,34,35].
Based on the analysis above, cutting force is one of the most valuable indicators in the rock-breaking process, as it contains a wealth of critical information related to the cutting behavior. Historically, research on rock-cutting force has primarily focused on the quasi-static moment when the shear failure surface is formed [22,27]. However, the actual rock-breaking process is inherently dynamic [12], especially when the cutting state is stable, where the interaction between the cutting teeth and the rock may exhibit cyclic patterns [14]. Therefore, we hypothesize that the cutting force may possess frequency domain characteristics closely associated with the cutting process, such as periodicity. Nevertheless, existing research has predominantly concentrated on the time domain characteristics of cutting force, such as its average and peak values [14], with limited attention given to its frequency domain characteristics.
In addition, the wear of cutting teeth is an inevitable phenomenon in drilling and significantly impacts drilling efficiency [36,37,38,39]. In rock cutting, the interaction between the tool and the rock is the fundamental factor driving tool wear. As seen from the previous cutting model, the extrusion zone serves as an intermediary medium for the interaction between the tool and the rock [22,27]. Its geometric characteristics not only form the basis for analyzing the rock-breaking mechanism, but also directly reflect the contact area between the tool and the rock. However, in previous studies, the longitudinal dimension of the extrusion zone has typically been empirically approximated as the cutting depth [22]. Therefore, to better understand the interaction between the tool and the rock during the cutting process, it is essential to further explore and analyze the geometric characteristics of the extrusion zone.
In light of the above analysis, and building upon the previous quasi-static single-tooth cutting model, this paper develops a new dynamic cutting geometry model in which the height of the extrusion zone is not equal to the cutting depth. Through an analysis of the dynamic evolution of the cutting force during the rock-breaking process, it is demonstrated that the cutting force exhibits periodicity. A method for extracting the cutting frequency by applying the fast Fourier transform (FFT) to the cutting force time series signal is proposed. The results are then validated through cutting tests using numerical simulations. Additionally, a series of linear single-tooth rock-breaking simulations were conducted to investigate the influence of cutting parameters such as rake angle, cutting depth, and cutting speed on the cutting frequency. Finally, based on the new dynamic cutting model, the impact mechanism of cutting parameters on the cutting frequency is explored, and the relationship between the height of the extrusion zone and the cutting depth is analyzed. This study provides new insights into the application of cutting force, enhances our understanding of the dynamic cutting rock-breaking process, and offers valuable reference for optimizing cutting models and determining tooth–rock contact range.
According to the idea of this study, the chapters in the paper are arranged as follows: Section 1 is the introduction; Section 2 is the theoretical research. The construction of a dynamic cutting model and the theoretical analysis of dynamic cutting characteristics such as cutting frequency are carried out. Section 3 is the research method, which introduces the verification of the theoretical analysis results and the research approach of the cutting dynamic characteristics in detail. Section 4 is the presentation of the research results. Section 5 is the discussion, contains in-depth analysis of the research results, and analyzes the shortcomings of the current research and the prospect of future work. Section 6 is the summary of the research content.
2. Construction of New Dynamic Rock-Cutting Model and Analysis of Cutting Periodicity
2.1. Construction of a New Dynamic Cutting Model
It can be seen from the photos of the PDC coring bits shown in Figure 1 that the drilling process results from the superposition of multiple single-tooth cutting and rock-breaking behaviors. To investigate the mechanism of rock cutting, previous studies proposed a quasi-static cutting model (QCM), as shown in Figure 2 [22]. This model represents the cutting state under the limiting condition of shear surface formation, referred to as the ‘limit cutting state’ in this study. The region formed between the cutter and the rock by the accumulation of cuttings is known as the extrusion zone or crushed zone. Since the formation of the failure surface follows the shear criterion [18,19,39], it is referred to as the shear surface in this study. To determine the geometric characteristics of the extrusion zone, the height of the extrusion zone, denoted as hc, is introduced to represent the length of its vertical projection. Once hc is determined, the other dimensions of the extrusion zone can be obtained through geometric relationships. As shown in Figure 2, hc in the QCM is considered equal to the cutting depth h.
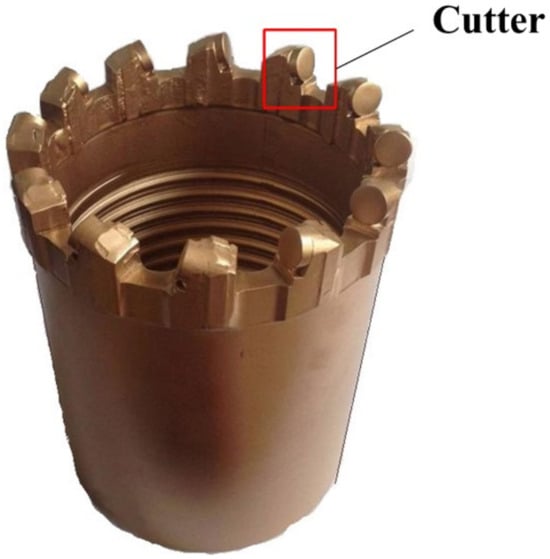
Figure 1.
Photo of the PDC bit.
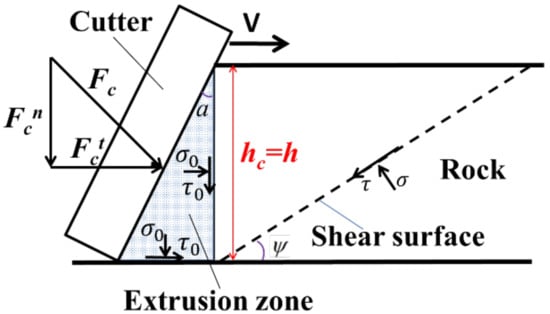
Figure 2.
The quasi-static rock-cutting model (QCM) with hc = h.
To analyze the dynamic characteristics of the cutting process, we expand the quasi-static cutting model (QCM) in Figure 2 from the perspectives of time and space, resulting in a dynamic cutting model (DCM) shown in Figure 3. The DCM illustrates the positional relationship between the cutter and the rock during two consecutive limit cutting states. Similarly to the QCM, the extrusion zone height hc is considered equal to the cutting depth h in the DCM. However, studies have shown that the height of the extrusion zone is not always equal to the cutting depth [35]. To address this, the DCM is further modified into a new dynamic cutting model (NDCM), as shown in Figure 4. Compared to the DCM, the most significant feature of the NDCM is that hc is treated as a variable, not equal to h.
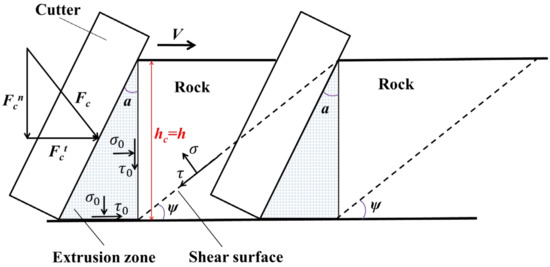
Figure 3.
The dynamic rock-cutting model (DCM) with hc = h.
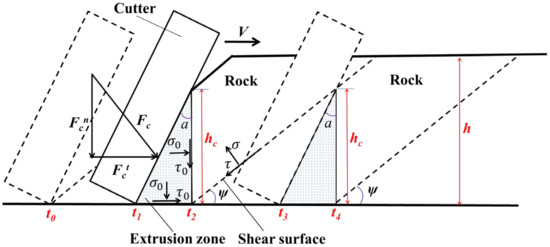
Figure 4.
The new dynamic rock-cutting model (NDCM) with hc ≠ h.
2.2. The Relationship Between the Variation Characteristics of Tangential Cutting Force Fct and the Dynamic Rock-Cutting Process
Before analyzing the tangential cutting force in the dynamic cutting model, the following assumptions are made, based on previous literature [26]:
- To simplify the problem, the cutter is considered a rigid body, without considering its wear and thermal effects.
- Except for the rock debris forming the crushing zone, the remaining debris can be cleared promptly and will not affect the cutting due to accumulation in front of the cutter.
- To avoid the influence of uneven distribution of rock components on the cutting force, the rock is considered an isotropic, homogeneous material.
- In the analysis, the problem is simplified to a two-dimensional orthogonal cutting model.
- The effects of temperature and humidity on the cutting process are not considered.
In NDCM, t0 is the starting time of cutting, when the rake face of the tool begins to contact the fresh rock below the existing shear surface. As the cutter moves at speed v, the rock ahead of the rake face is broken by the tooth. Some of the generated cuttings escape directly, while others accumulate near the rake face to form an extrusion zone. During this period, the tangential cutting force Fct increases with the growth of the effective cutting depth. By t1, the stress state of the potential shear surface satisfies the shear failure condition. At this point, cutting enters a limit state, and the tangential cutting force Fct reaches a local maximum. The extrusion zone reaches its maximum size, and the shear plane is rapidly formed. Subsequently, as the wedge-shaped cuttings above the shear surface and the fine cuttings in the extrusion zone dissipate, the resistance to the forward movement of the tool decreases, causing the thrust Fct to gradually diminish. By t2, the rock debris is completely expelled, and Fct is reduced to a minimum.
Subsequently, the rock-breaking activities between t0 to t2 will be repeated between t2 and t4, where the cutting states at t2, t3 and t4 correspond to those at t0, t1 and t3, respectively. This repetition will continue until the cutting process stops. This phenomenon aligns with the findings of previous linear cutting tests [40,41]. The rock-breaking activity from t0 to t2 can be regarded as the smallest unit of the entire cutting process. Therefore, it is defined as a single cutting process (SCP) in our study.
Accordingly, when the cutting depth h, cutting speed v, and rake angle a are determined, we hypothesize that the tangential cutting force Fct will oscillate periodically with the cycle of the single cutting process. Similar observations have been made in previous studies [25]. Inspired by these phenomena, the periodicity of the tangential cutting force Fct is proposed in this study. The tangential cutting force Fct will oscillate periodically with the cycle of the single cutting process (SCP) [25]. The duration and frequency of the single cutting process are defined as the cutting cycle Tc and the cutting frequency fc, respectively, which satisfy the following relationship:
The cutter travels during the cutting cycle Tc, which is defined as a single cutting stroke Lc, and its expression is as follows:
Then, the height of the extrusion zone hc can be obtained by the following:
where ψ is the shear angle.
Substituting Equations (1) and (2) into Equation (3) yields the following:
When the contact between the dissipated cuttings and the tooth is not considered, the length of the oblique edge of the extrusion zone represents the maximum contact range of tool–rock interactions (MCR), and it can be expressed as follows:
Substituting Equation (4) into Equation (5), we have the following:
It can be seen from Equation (6) that the cutting frequency fc is directly related to the size of the extrusion zone. Based on the above analysis, the determination of the cutting cycle is crucial for the development of the cutting model and for understanding the tool–rock contact relationship.
To obtain the cutting frequency fc, the tangential cutting force Fct is analyzed from the perspective of signal theory. According to the principle of signal analysis, the spectrum of Fct can be obtained using fast Fourier transform (FFT) at the appropriate sampling frequency. If a peak appears in the spectrum, the corresponding frequency is considered to be the dominant frequency of the signal. This method has been employed to determine the frequency of the rock-breaking force of the disk cutter, and the results demonstrate its effectiveness [40]. The dominant frequency of the signal represents the primary component of the original signal, which dictates the overall signal’s trend. Therefore, it is inferred that the dominant frequency of the tangential force Fct is the cutting frequency fc. Based on this, an FFT-based cutting frequency acquisition method (referred to as the FFT method) is proposed. The key operational steps are as follows:
Firstly, the cutting parameters are set, the cutting test is conducted, and the time history signal of the tangential cutting force Fct is monitored and collected.
Next, the tangential force signal is processed using FFT, and the tangential force spectrum is extracted.
Finally, based on the spectral pattern of the tangential force, the dominant frequency corresponding to the peak is extracted as the cutting frequency.
The cutting frequency obtained by this method is denoted as fc-F.
The test system of rock cutting consists of two parts: cutting system, test, and post-processing system. The cutting system refers to the mechanical platform for rock cutting, which is mainly used to complete the fixation of rock samples, as well as control of the tool moving speed and cutting depth. In the actual experiment, these settings are completed by the automatic control platform, and in the numerical simulation experiment, they are set by the relative position change, boundary conditions, and constraints. The test and post-processing system are mainly used to collect and process the operating state parameters of the cutting system. In the indoor experiment, the tangential cutting force signal is collected by the force sensor, and the cutting force change is obtained directly through the monitoring function in the numerical simulation experiment. After that, by using the MATLAB software R2017b to program, the cutting force data are fast-Fourier-transformed to obtain the main frequency. In addition, the Drucker–Prager criterion (D-P criterion) is commonly used in the numerical simulation of single-tool rock cutting.
In order to verify the above theoretical analysis of cutting dynamic characteristics, appropriate single-tooth cutting experiments should be carried out. At the same time, through the combination of tool inclination, cutting speed and cutting depth, the influence of these three important parameters on the dynamic characteristics of single-tooth cutting is further explored.
3. Numerical Simulation of Single-Tooth Rock Cutting
Based on theoretical analysis, we have proposed a method to obtain the periodic characteristics of the cutting force and its characterization parameters. This chapter will validate the proposed approach through numerical simulation experiments using the finite element software ABAQUS 2016. Furthermore, since the cutting depth, cutting speed, and rake inclination significantly influence the rock-breaking activity during cutting, we will investigate how these parameters affect the cutting frequency fc.
3.1. Constitutive Model of Rock
According to previous literature [34], the D-P criterion is employed as the rock yield criterion in rock-cutting simulations. This criterion incorporates both the Mohr–Coulomb criterion and the Mises criterion, and is widely used in the analysis of elastoplastic problems.
The failure of rock during cutting activities results from the accumulation of plastic strain. When the plastic strain reaches a critical threshold, the rock undergoes plastic failure and detaches from the original material, forming debris. In finite element numerical simulation software, the equivalent plastic strain (PEEQ) is used as a measure of the material’s plastic deformation, with its value representing the cumulative plastic strain in the superplastic region. Therefore, plastic strain serves as the criterion for failure in rock-breaking simulations. To accurately describe the rock failure process, the concept of the ‘damage factor’ from damage mechanics is incorporated into the failure description of materials [34]. The stress–strain curve for the failure process of the material is shown in Figure 5, where σy is the yield stress at which initial damage occurs. When the stress σ increases to σ0, the material is considered undamaged, and the damage factor D = 0; when the plastic strain reaches εf, the material is fully destroyed, and the damage factor D = 1.0.
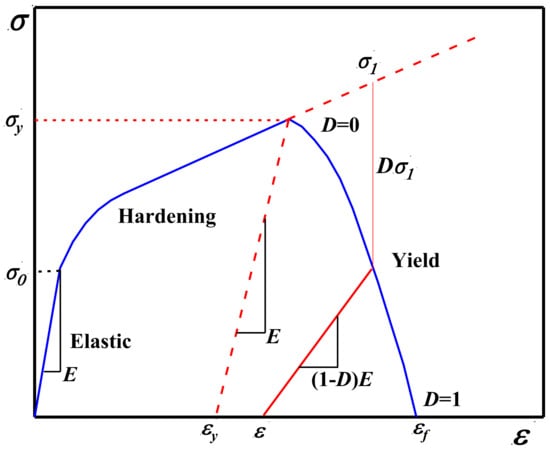
Figure 5.
The schematic diagram of isotropic damage mechanism.
3.2. Geometric Model and Material Parameters
The cutting model is set according to the following rules [34]:
- (1)
- Since the hardness of the tool is much greater than that of the rock, the tool is rigidly constrained;
- (2)
- The rock is considered an isotropic, homogeneous material;
- (3)
- The effects of temperature and thermo-mechanical coupling on cutting are not considered;
- (4)
- The rock mass element is deleted in real time upon failure and no longer participates in subsequent calculations;
- (5)
- The size of the cutting tooth is much larger than the cutting depth. Therefore, rock cutting is treated as a plane strain problem, and a two-dimensional model is used for numerical simulation.
Figure 6 presents the geometric model for the rock-cutting simulation. The tool is a rectangle with dimensions of 2.0 mm by 6.0 mm, while the rock is a rectangle measuring 40.0 mm by 8.0 mm. To ensure calculation accuracy and minimize resource usage, the upper part of the rock element is refined. The mesh sizes for the normal and refined areas are 0.5 mm and 0.1 mm, respectively. The element type is CPE4R, with a total of 19,320 elements. The element deletion option is selected, meaning that the rock element will no longer participate in the calculation after failure. Based on published works [41,42], the rock parameters and tooth parameters are listed in Table 1.
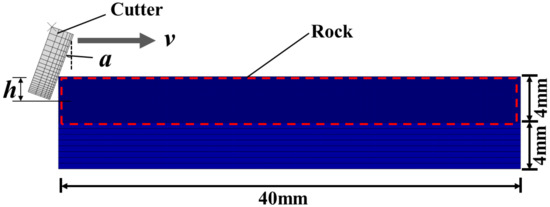
Figure 6.
The geometric model for the rock-cutting simulation.

Table 1.
The mechanical properties of rock and tooth.
3.3. Boundary Conditions and Solver Settings
The bottom of the rock is fixed with a fully constrained boundary condition. A reference point is defined and attached to the tool for the application of cutting speed. The rake angle a is set by the relative position of the tool to the rock. A highly nonlinear surface-to-surface erosion contact is defined between the tool and the rock, with a friction coefficient u = 0.27 [42]. The numerical simulation utilizes the explicit dynamic solution module in the finite element software and accounts for geometric nonlinearity.
3.4. Scheme Setting
Figure 7 illustrates the combination of cutting depth, cutting speed, and rake angle in the numerical model, resulting in a total of 90 simulation schemes. When the tool chamfer exceeds 20°, cutting efficiency decreases significantly. Therefore, the tool inclination angle is set within this range in this study [43]. The monitored parameters are the tangential cutting force and the cutter-rock contact area. To ensure that the monitoring data accurately reflects the real-time changes in cutting force and to avoid noise interference caused by the high sampling rate [13], pre-cutting numerical tests were conducted to determine the simulation time and sampling frequency. These were ultimately set to 0.5 s and 800 Hz, respectively.
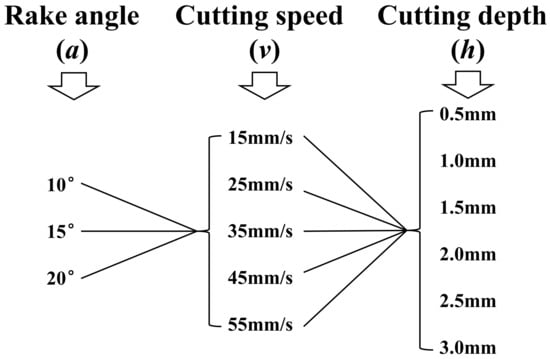
Figure 7.
The combination of cutting depth, cutting speed and rake angle.
3.5. Model Validation
To verify the accuracy of the cutting model, a series of rock-cutting simulations with v = 35 mm/s and a = 20° are conducted to obtain the relationship between the mean tangential cutting force and cutting depth h, as shown in Figure 8. As the cutting depth increases from 0.5 mm to 3.0 mm, two distinct trends in the tangential force are observed: When h < 1.5 mm, there is a linear relationship between tangential force and cutting depth; when h > 1.5 mm, the relationship becomes nonlinear. This behavior is consistent with the experimental results from previous work by other researchers [44], confirming the accuracy of the cutting model developed in this study.
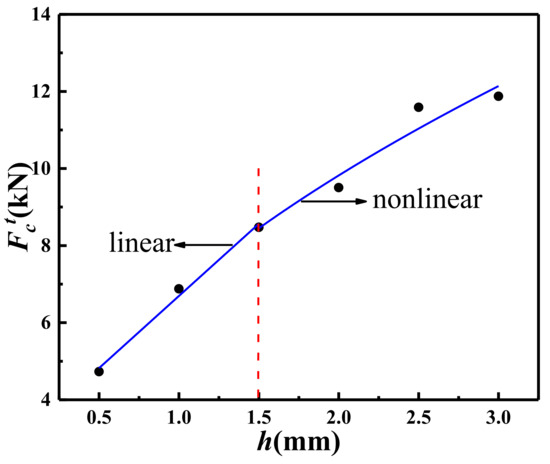
Figure 8.
The relationship between tangential cutting force and cutting depth in the example scheme of v = 35 mm/s and a = 20°.
4. Result
4.1. Verification of Tangential Force Periodicity and Cutting Frequency Extraction Method
In the numerical simulation, the equivalent plastic zone cloud map indicates the deformation degree of each part of the rock. During the single cutting process, the penetration of the shear surface is represented by the complete entry of the rock on the potential failure surface into the plastic zone. Based on this, the penetration of the plastic zone serves as an indicator. By performing a frame-by-frame analysis of the evolution of the plastic zone cloud map, the time at which each shear surface penetration occurs can be determined. As shown in Figure 4, the time interval between two consecutive plastic zone penetrations is theoretically equal to the cutting cycle Tc, and the cutting frequency can be obtained using Equation (1). This method for determining the cutting frequency is referred to as the plastic zone method, and the result is recorded as fc-P. Here, a numerical experiment with a = 20°, v = 35 mm/s and h = 1.0 mm is used as an example for the following analysis.
Figure 9 shows the variation in tangential cutting force with time. It can be observed that after 0.043 s, the cutting process enters a stable phase, and the tangential cutting force fluctuates smoothly. Similar phenomena have also been reported in other studies [11,34].
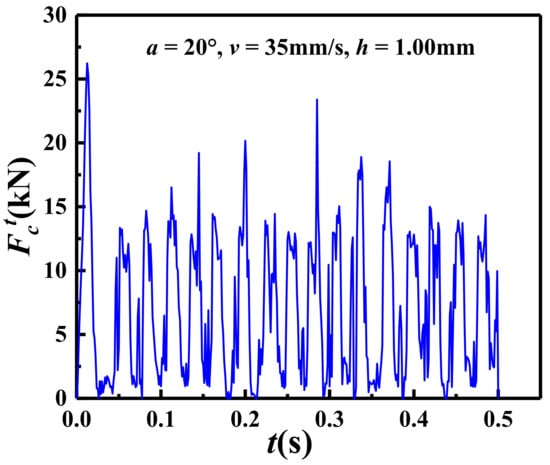
Figure 9.
The variation in tangential cutting force with time in the scheme of a = 20°, v = 35 mm/s and h = 1.0 mm.
Figure 10 presents the cloud diagram of the equivalent plastic zone when the shear failure surface extends to the free surface of the rock for six consecutive times. The moments shown in Figure 10a–f are 0.2000 s, 0.2263 s, 0.2525 s, 0.2788 s, 0.3063 s, and 0.3350 s, respectively, with time intervals of 0.0263 s, 0.0262 s, 0.0263 s, 0.0275 s, and 0.0287 s. The mean and standard deviation of the time intervals are 0.0270 s and 0.001 s, respectively, which indicates that the generation of shear surfaces follows a regular pattern and confirms the repeatability of the single cutting process in rock cutting. Accordingly, the average interval time is taken as the cutting cycle Tc, and the corresponding cutting frequency fc-P is 37.04 Hz.
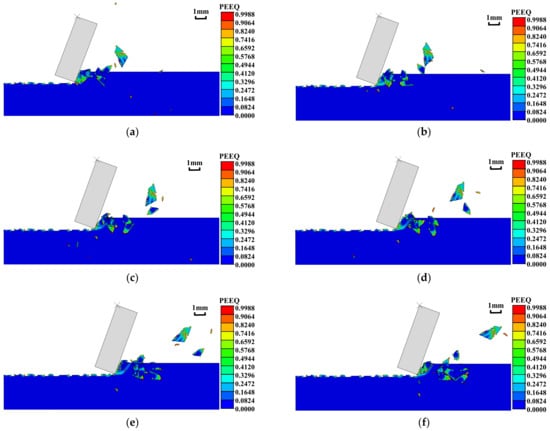
Figure 10.
The equivalent plastic zone cloud diagram of six continuous shear surfaces at the time of generation in the schemes of a = 20°, v = 35 mm/s and h = 1.0 mm. (a) t = 0.2000 s, (b) t = 0.2263 s, (c) t = 0.2525 s, (d) t = 0.2788 s, (e) t = 0.3063 s, (f) t = 0.3350 s.
Moreover, the tangential cutting force in Figure 9 was analyzed using the fast Fourier transform (FFT), and its spectrum is shown in Figure 11. A significant peak appears at f = 35.85 Hz, indicating that the tangential cutting force Fct has a dominant frequency of 35.85 Hz. This frequency, obtained using the FFT method, differs by 3% from the fc-P value obtained through the plastic zone method. Additionally, it is noteworthy that there is some amplitude at frequencies other than the peak, suggesting the presence of signal components in other frequency bands. This can be attributed to the fact that, while the primary rock-breaking activity cycle occurs during the single cutting process, the formation of the extrusion zone is accompanied by small-scale rock-breaking activities.
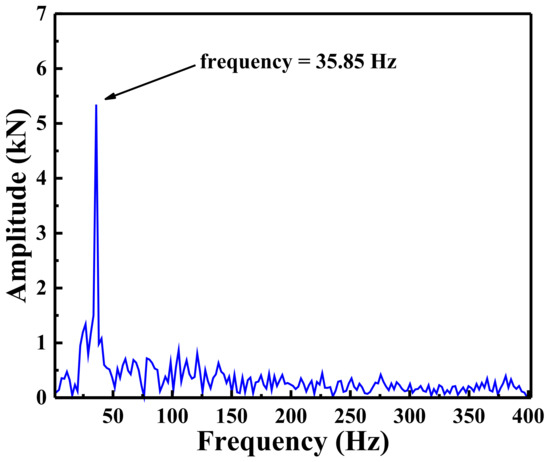
Figure 11.
The spectrum diagram of tangential cutting force in the scheme of a = 20°, v = 35 mm/s and h = 1.0 mm.
To systematically explore the difference in cutting frequency between the two methods, the distribution of fc-P and fc-F across all schemes is shown in Figure 12. It can be observed that the cutting frequency data points are clustered near the contour line, and the root mean square error (RMSE) between the two methods is 1.48 Hz. The small difference in cutting frequency between the two methods demonstrates the reliability of the FFT method. Given the difficulty of monitoring the plastic deformation of rock in practice, the FFT method is simpler and more reliable. Therefore, in the subsequent study on the influence of cutting parameters on cutting frequency, the analysis will be based on fc-F.
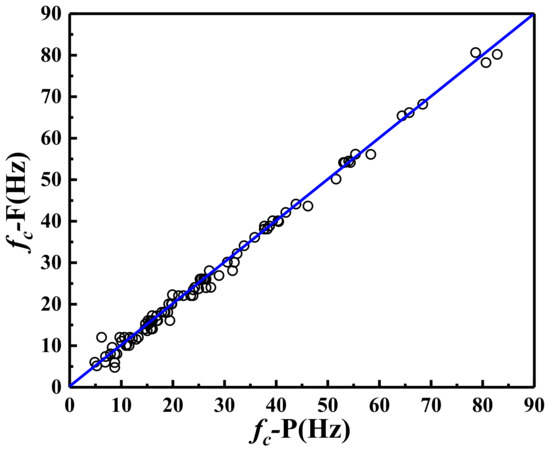
Figure 12.
The relationship between fc-P and fc-F.
4.2. The Influence of Cutting Parameters on Cutting Frequency
4.2.1. The Influence of Rake Angle on Cutting Frequency
Using the average value, standard deviation, and coefficient of variation as statistical indicators, the average level, degree of fluctuation, and relative fluctuation of cutting frequency under different inclination angles are analyzed. Table 2 presents the mean, standard deviation (SD), and coefficient of variation (COV) of the cutting frequency for each cutting scheme under the three rake angles. The largest coefficient of variation in cutting frequency is 17.62% at v = 20 mm/s and h = 3.0 mm; the largest standard deviation of cutting frequency is 3.69 at v = 45 mm/s and h = 1.0 mm, with the corresponding coefficient of variation being 8.04%. Overall, the standard deviation of cutting frequency in each scheme listed in Table 2 is less than 4.00 Hz, and the coefficient of variation is mostly within 10%. It can be inferred that, within the range of 10–20°, the rake angle has little effect on the cutting frequency.
Table 2.
The mean, standard deviation, and coefficient of the variation in the cutting frequency of the schemes under the three rake angles (10°, 15°and 20°).
4.2.2. The Influence of Cutting Speed v on Cutting Frequency
Taking a series of cutting schemes with a = 20° and h = 1.0 mm as an example, the change in tangential force with time under different cutting speeds is shown in Figure 13. First, the tangential force at each cutting speed is observed separately, and it is found that the tangential force in the stable section exhibits roughly circular oscillations with similar amplitude and uniform intervals. By comparing the fluctuations in tangential force with cutting speed, it is observed that, at the same cutting depth, the amplitude of the tangential force curve is similar across different speeds. Moreover, the higher the cutting speed, the more oscillations occur within the same period. Similar phenomena have been observed in other studies [14].
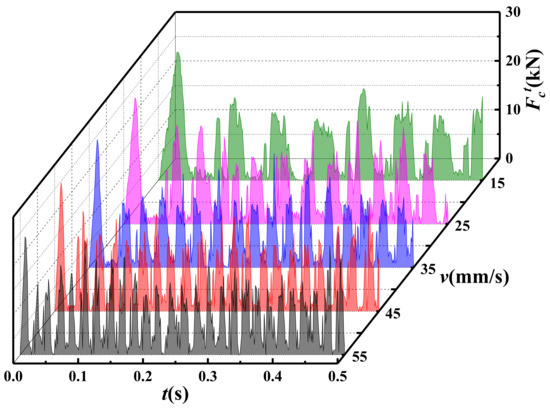
Figure 13.
The evolution of tangential cutting force with time under different cutting speed in the schemes of a = 20° and h = 1.0 mm.
Figure 14 shows the change in cutting frequency with cutting speed at different cutting depths. The fitting relationship between fc and v, obtained using the linear fitting method, is presented in Table 3. At different cutting depths, there is a linear relationship between cutting frequency and cutting speed, with slopes of 1.53 (h = 0.5 mm), 0.99 (h = 1.0 mm), 0.71 (h = 1.5 mm), 0.50 (h = 2.0 mm), 0.43 (h = 2.5 mm), and 0.34 (h = 3.0 mm); all intercepts are 0 Hz. These results indicate that the cutting frequency is linearly proportional to the cutting speed.
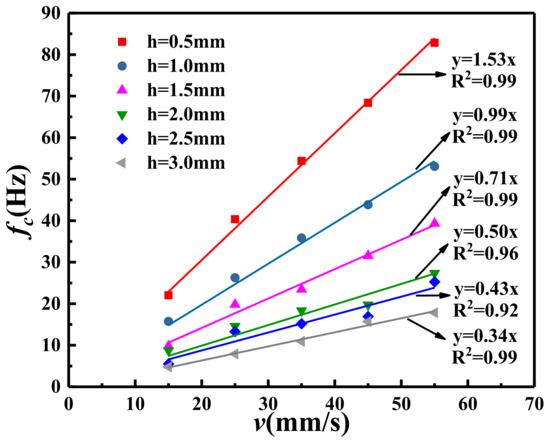
Figure 14.
The relationship between cutting frequency and cutting speed in the schemes of a = 20° and h = 1.0 mm.
Table 3.
The fitting relationship between fc and v of the different cutting depth in the schemes of a = 20° and h = 1.0 mm.
4.2.3. The Influence of Cutting Depth H on Cutting Frequency
Taking a series of numerical simulation schemes with v = 35 mm/s and a = 20° as an example, the variation in cutting force with time at different cutting depths is shown in Figure 15. At each cutting depth, the trend of the individual tangential force is similar to that shown in Figure 11. The larger the cutting depth, the larger the amplitude of the tangential force, which is consistent with previous research [16]. Additionally, as the cutting depth increases, the number of oscillations of the cutting force decreases significantly, indicating that the cutting frequency also decreases. This trend is consistent with the phenomenon observed in actual cutting tests [21].
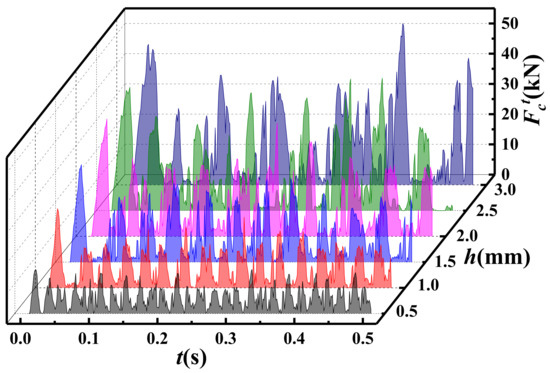
Figure 15.
The variation in tangential cutting force with time under different cutting depths in the schemes of a = 20° and v = 35 mm/s.
Subsequently, to study the quantitative effect of cutting depth on cutting frequency, the distribution of cutting frequency with cutting depth at each cutting speed is shown in Figure 16. At the same cutting speed, the cutting frequency decreases nonlinearly with an increase in cutting depth, and the greater the depth, the more slowly the cutting frequency decreases. For example, when the cutting speed is 55 mm/s, as the cutting depth increases from 0.5 mm to 1.0 mm, the cutting frequency decreases from 81.37 Hz to 55.17 Hz, which is a reduction of 26.2 Hz. As the cutting depth increases from 2.5 mm to 3.0 mm, the cutting frequency decreases from 24.22 Hz to 18.73 Hz, a reduction of 5.49 Hz, which is only 20% of the previous decrease. Additionally, with a decrease in cutting speed, the influence of cutting depth on cutting frequency diminishes. For example, when the cutting speed is 15 mm/s, for the same changes in cutting depth as in the above example, the cutting frequency decreases by 8.51 Hz and 1.69 Hz, respectively, which is only about 30% of the change observed when the cutting speed is 55 mm/s.
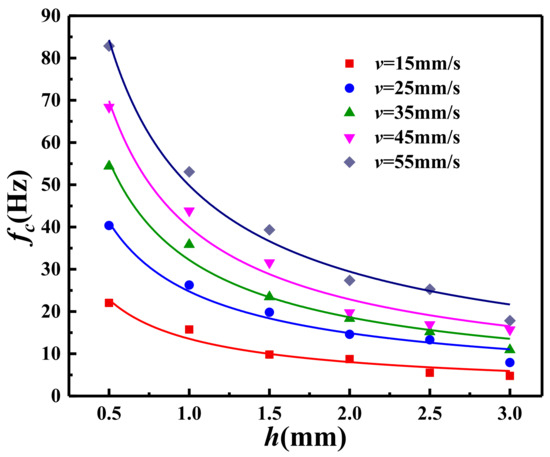
Figure 16.
The relationship between cutting frequency and cutting depth in the schemes of a = 20°.
5. Discussion
5.1. The Influence Mechanism of Cutting Parameters on Cutting Frequency
Based on the construction of the new dynamic cutting geometric model, the periodicity of the cutting force is proposed and verified through numerical experiments. Subsequently, the influence of rake angle, cutting depth, and cutting speed on cutting frequency is studied. To reveal the underlying mechanisms of the above results, efforts are made to analyze the rock-breaking process from the perspective of energy conservation.
The rock-cutting process is also a process of energy conversion. Before the shear surface is formed, the generation of the extrusion zone is accompanied by the accumulation of extrusion energy. Once the conditions for the formation of the shear surface are met, the energy accumulated in the extrusion zone dissipates. This energy is primarily used for the formation of the shear fracture surface and the dissipation of the cuttings [16]. Based on this, the energy conversion relationship in the single-cutting process is analyzed.
Firstly, the energy dissipation term is analyzed. As shown in Figure 4, when the shear surface is formed, the newly generated fracture area is 2bh/sinψ. According to fracture theory, the energy required to form the unit failure surface is the fracture energy density Es, and the total fracture energy Ws required to form the shear surface is as follows:
Equation (7) shows that as the cutting depth increases, more energy is required to form the fracture surface [11].
In addition, when the shear surface is generated, the powdery debris in the extrusion zone and the wedge-shaped debris formed by shear failure will dissipate. Assuming that the dissipation velocity of all cuttings is equal to the cutting speed v, the energy Wm converted into the kinetic energy of the cuttings can be expressed as follows:
where ms is the quality of the cuttings.
Simultaneously, the friction between the tool and the rock will also cause energy dissipation in the form of thermal and acoustic energy, which is collectively referred to as the friction energy Wf.
According to previous literature [22,26,27], the uniform load σ0 imposed on the boundary by the cuttings in the extrusion zone is solely related to the rock mechanical parameters under the limiting cutting condition. In order for the stress on the boundary of the extrusion zone to reach σ0, the accumulation of cuttings is accompanied by energy accumulation. Considering that the energy accumulated in the extrusion zone will subsequently be converted into the three types of dissipative energy mentioned above, we infer that one of these types should be elastic energy. Therefore, under the limiting cutting conditions, we define the elastic energy absorbed by the unit volume of cuttings in the extrusion zone as the extrusion energy density Ec, and assume that it is uniquely associated with the rock type. In this case, the accumulated extrusion energy Wc in the extrusion zone can be expressed as follows:
Now, considering that the extrusion energy is equal to the dissipation energy, we have the following:
Due to the small mass of cuttings generated in the single cutting process and the short duration of friction energy dissipation, the cuttings’ kinetic energy Wm and friction energy Wf can be ignored. Therefore, Equation (10) is as follows:
Substituting Equations (7) and (9) into Equation (10), the height of the extrusion zone hc can be obtained as follows:
The cutting speed v is not included in Equation (12), indicating that the cutting speed does not affect the size of the extrusion zone. Combined with the proportional relationship between cutting speed and cutting frequency shown in Figure 14, we conclude that the cutting speed v primarily affects the rate of rock-breaking behavior, while it has little impact on the mechanism of tool–rock interaction. Similar viewpoints have been presented in previous studies [13,45,46].
Subsequently, hc in Equation (12) is replaced by Equation (4), and the cutting frequency fc can be simplified as follows:
The inner part of the bracket on the right side of Equation (13) is related to rock parameters and rake angle. Considering that the square root of tana varies little within the range of 10° to 20°, it is considered a constant value here. Thus, the inner part of the bracket on the right side of Equation (13) becomes a constant term related to the mechanical properties of the rock, which is defined as the cutting coefficient Kc. Therefore, Equation (13) can be rewritten as follows:
Equation (14) reveals the theoretical relationship between cutting frequency, cutting speed, and cutting depth. When the cutting depth is fixed, the cutting frequency is linearly proportional to the increase in cutting depth. However, when the cutting speed is fixed, the cutting frequency decreases nonlinearly with the increase in cutting depth. The variation characteristics of the cutting frequency are consistent with the numerical results obtained in this study (Figure 13 and Figure 15), which validates the theoretical relationship presented in Equation (14).
5.2. The Relationship Between the Height of Extrusion Zone and Cutting Depth
The key distinction between the proposed new dynamic cutting model (NDCM) and the traditional dynamic cutting model (DCM) lies in the size of the extrusion zone. To quantitatively analyze this distinction, the ratio of the extrusion zone depth hc to the cutting depth h is defined as the geometric difference coefficient (GDC).
The closer the geometric difference coefficient is to 1, the smaller the difference between NDCM and DCM. Based on this study, the variation in GDC can be analyzed from the following three perspectives.
Firstly, the theoretical change rule of the geometric difference coefficient is investigated. hc in Equation (15) is replaced by Equation (12), yielding the following:
As long as the relevant parameters in Equation (16) are determined, the geometric difference coefficient can be obtained. Since Equation (12) is based on the principle of energy conservation, this method of deriving GDC is referred to as the energy analysis method. Once the characteristic parameters of the rock and the rake angle are determined, the term within the brackets in Equation (3) becomes constant. Additionally, there exists a power function relationship between GDC and cutting depth h, as shown in Figure 17. As the cutting depth increases, GDC exhibits a nonlinear trend, initially decreasing and then gradually stabilizing.
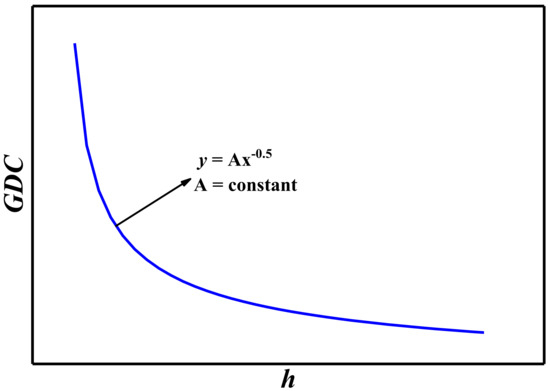
Figure 17.
An example of the diagram of the relationship between GDC and h.
Moreover, the geometric difference coefficient can also be determined based on the proposed new dynamic cutting model (NDCM) and the cutting frequency fc. According to the geometric relationship shown in Figure 4, the height of the extrusion zone can be expressed as follows:
Ψ can be obtained according to the following equations [22,27].
where φ is the internal friction angle of the rock, and φ′ is the friction angle between the cuttings in the extrusion zone and the rock. The value of fc can be obtained from the tangential force sampling data through fast Fourier transform (FFT). By substituting Equation (17) into Equation (15), the geometric difference coefficient based on cutting force (referred to as GDCf) is given as follows:
Figure 14 shows that the linear slope k of the relationship between fc and v is related to the cutting depth. Based on the fitting equation in Table 3, the distribution of k with h is presented in Figure 18. The fitting equation demonstrates that k is proportional to h−0.5, with a fitting degree of 0.97. Therefore, by combining the data from Table 3, the relationship between cutting frequency, cutting speed, and cutting depth can be expressed as follows:
where m is the slope of the fitted linear relationship between k and h−0.5 in Figure 18.
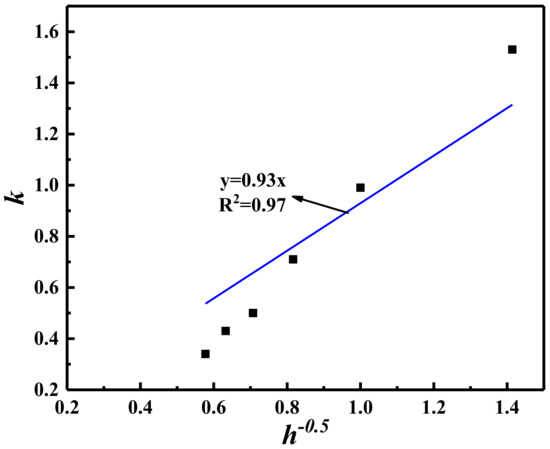
Figure 18.
The relationship between k and h−0.5.
By substituting Equation (20) into Equation (19), we obtain the following:
Clearly, the relationship between GDC and h in Equation (21) is similar to that in Equation (16), with both equations illustrating that rock characteristic parameters and cutting depth are the decisive factors influencing GDC.
Additionally, once the size of any boundary of the extrusion zone is determined, the height of the extrusion zone hc and GDC can be obtained based on Figure 4. According to previous studies [35], it is feasible to measure or monitor the boundary size of the extrusion zone. On one hand, the contact area between the tool and the rock (corresponding to the inclined plane size of the extrusion zone in Figure 4) can be monitored through numerical experiments; on the other hand, the extrusion zone height (hc) can be measured using the morphological evolution diagram of the extrusion zone, which is recorded by high-speed camera technology during laboratory cutting tests. Subsequently, GDC can be determined by substituting hc and h into Equation (15), with the result obtained through this monitoring method denoted as GDCm.
Considering the available parameters, the method based on cutting force and size monitoring to determine GDC is feasible in this study. Therefore, using a series of schemes with v = 35 mm/s as an example, the relationship between GDCf and GDCm, as well as the cutting depth, is shown in Figure 19. Under the three inclination angles, GDCf and GDCm are relatively close, indicating that the rake angle has little effect on GDC within the range of 10–20°. When h = 0.5 mm, the GDC values based on both methods are near 1.00, suggesting that the height of the extrusion zone is close to the cutting depth when the cutting depth is small. As the cutting depth increases, the GDC obtained by the two methods decreases sharply at first and then tends to stabilize. When the cutting depth increases from 0.5 mm to 1.5 mm, GDCf and GDCm decrease from 1.00 to 0.75 and 0.40, respectively, and then both show a slight reduction with further increases in cutting depth. Additionally, GDCf and GDCm are similar at a cutting depth of 0.5 mm, with the former being larger than the latter at greater cutting depths. This discrepancy may arise because, in the numerical simulation, the rock element is no longer involved in the calculation after the rock failure, leading to a smaller monitored tool–rock contact area. Although there are differences between the results of the two methods, their trends are similar with increasing cutting depth and are consistent with the nonlinear relationship reflected by Equation (16). Therefore, it can be concluded that the analysis of the dynamic cutting rock-breaking mechanism based on the principle of energy conservation is reasonable.
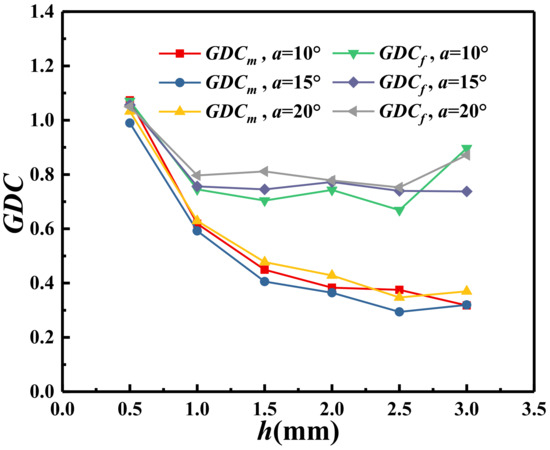
Figure 19.
The variations in GDCf and GDCm with cutting depth in the schemes of v = 35 mm/s.
To verify the relationship between GDC and h obtained in this study, experimental data from previous literature are collected. Based on the measured extrusion zone height (hc) obtained through high-speed photography technology [35], the relationship between the experimental GDC and cutting depth for the two types of rock is shown in Figure 20. The GDC of rock 1 is approximately 1.00 when the cutting depth is 0.5 mm. As the cutting depth increases from 0.5 mm to 2.5 mm, the GDC of rock 1 decreases sharply at first and then tends to stabilize when the cutting depth exceeds 1.0 mm. The GDC variation in rock 2 follows a similar trend to that of rock 1. The relationship between GDC and h in the cutting test is consistent with the results of theoretical analysis and numerical simulations presented in this study.
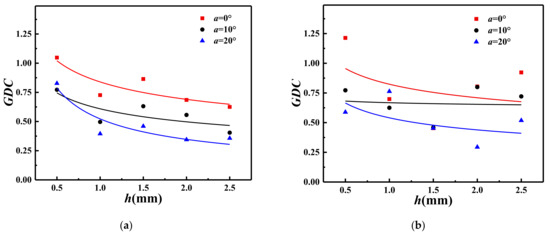
Figure 20.
The relationship between experimental GDC and h. (a) Rock 1, (b) rock 2.
The variations in GDC with h show the smaller the cutting depth is, the closer hc is to h. However, as the cutting depth increases, the height of the extrusion zone no longer equals the cutting depth but gradually decreases to a stable value less than 1.00. Therefore, if the variations in GDC are not considered, and the rock-cutting model is established with hc = h, it may lead to some deviation in the results of the analysis. This deviation may be particularly significant when the cutting depth is large. For instance, in numerical simulations and laboratory tests [35], the minimum value of GDC has been as low as 0.40. In such cases, it is not appropriate to treat the cutting depth as the height of the extrusion zone. Thus, before constructing the rock-cutting model, it is recommended to perform a series of single-tooth pre-cutting tests on the rock to determine the height of the extrusion zone based on experimental results.
The new dynamic model constructed in this study visualizes the change in tool–rock interaction in the process of cutting rock breaking, and theoretically reveals the mechanism of dynamic rock breaking. The influence of cutting parameters on cutting frequency and GDC reveals the influence of tool inclination, cutting speed and cutting depth on tool–rock interaction and contact relationship. Therefore, this study can provide new ideas and references for cutting-related research and design. Firstly, in the aspect of cutting model construction, this study proposes a method based on the dominant frequency of single tool cutting force to determine the height of extrusion zone hc in cutting, which provides a new idea for accurate modeling. For example, in the study of tool wear, tool wear is closely related to the range of tool–rock contact position. If the model is modeled according to the previous static cutting model, the longitudinal projection of the tool–rock contact range is a fixed value of the cutting depth h. According to this study, the acquisition of GDC based on the new dynamic single-tooth cutting model provides a new way to determine the tool–rock contact range. Secondly, according to the change in GDC with cutting depth, it can be seen that when the cutting depth is small (h ≤ 0.5 mm in this study), the longitudinal scale of the contact range can be considered as h in the construction of the cutting model or the analysis of the tool–rock contact range. When the cutting depth gradually becomes larger, to accurately determine the hc or GDC, it is best to carry out a certain pre-cutting experiment according to the method in this paper. In addition, according to the influence of three cutting parameters on cutting frequency and GDC, when analyzing the contact relationship between tool and rock in the range of tool inclination angle of 10–20° and cutting speed of 15 mm/s–55 mm/s, only the depth can be explored without paying too much attention to the changes in the other two parameters. This provides a good reference for the design and optimization of the cutting scheme in the subsequent research.
At the same time, due to the limitations of research level and objective conditions, there are still some shortcomings in this study. First, on the basis of comprehensive consideration of the research focus and problem simplification, this study ignores or assumes some factors that will affect the cutting process in practice. For example, when constructing and analyzing the new dynamic cutting model, the influence of temperature, humidity and other factors on the cutting parameters is ignored, and the cutting tool is regarded as a rigid body without considering its wear in the cutting process. Secondly, the research focus of this paper is to propose a new method of dynamic cutting model, and accordingly put forward the corresponding research method of cutting dynamic characteristics. Therefore, only the Tuffeau rock type is selected to carry out relevant research and verification. Although the final numerical simulation is consistent with the results of the theoretical analysis, it can provide support for this study. However, due to the singleness of the rock samples, the research conclusions have certain limitations. Thirdly, for the theoretical analysis in this study, the relevant research is carried out by means of numerical simulation. Although the research results are consistent with the data rules of other scholars in indoor experiments, due to the limitations of objective research conditions, the existing initial research equipment still cannot meet the experimental conditions of this study. Additionally, the preliminary study found that a lot of innovations and attempts are still needed to achieve the corresponding conditions. Therefore, the indoor experiments corresponding to the numerical simulation can only be supplemented in the subsequent research. Fourthly, there are usually multiple drill bits on the actual drill bit, but this study only focuses on the single-tooth rock-breaking behavior.
In order to systematically study the dynamic characteristics of cutting rock breaking, the next step will be based on this study, and research will be carried out from the following aspects: For rock selection, more types of rocks should be compared to reveal the dynamic characteristics of different types of rocks in the process of single-tooth rock breaking; with regard to the research object, in the study of the dynamic process of rock cutting, the factors such as temperature, humidity and rock wear are gradually taken into account to promote the transformation of theoretical research into practical application. Concerning the research conditions, the follow-up will be based on this research, continue to carry out the upgrading and research and development of cutting equipment, and create a complete cutting research system integrating theoretical research, numerical simulation and experiment; aiming at rock-breaking tools, the single-tooth cutting theory is gradually extended to the application scenario of simultaneous cutting of multiple tools, and the influence of factors such as the number and distribution of tools on the dynamic characteristics of rock breaking is studied.
6. Conclusions
(1) Based on the previous single-tooth cutting model, the idea that the height of the extrusion zone is not always equal to the cutting depth is introduced. By analyzing the continuous cutting rock-breaking behavior, a new dynamic cutting model is established, in which the extrusion zone is not equal to the cutting depth. Additionally, the definition of the single cutting process is presented, and it is emphasized that the rock-breaking process is composed of the repeated occurrence of the single cutting process. A new concept of cutting frequency fc is also proposed to represent the speed of the single cutting process.
(2) According to the new dynamic cutting model, the correlation between the fluctuations of tangential cutting force and the evolution of the single cutting process is analyzed. The results indicate that the two are synchronous, with the main frequency of the single-tooth tangential force signal, extracted using the fast Fourier transform (FFT) method, corresponding to the cutting frequency fc. Subsequently, a numerical simulation test of single-tooth rock cutting was conducted. Frame-by-frame analysis of the equivalent plastic zone cloud map revealed that the occurrence of the rock shear failure surface is periodic. Furthermore, the difference between the cutting frequency, based on the equivalent plastic zone cloud diagram, and the main frequency of the tangential cutting force is analyzed, with a root mean square error of 1.48 Hz. These results validate the periodicity of the single cutting process and confirm the effectiveness of the method used for extracting the cutting frequency.
(3) Based on the numerical simulation of single-tooth rock breaking for Tuffeau, the influence of key operating parameters, such as rake angle, cutting speed, and cutting depth, on the cutting frequency is explored. The results show that the rake angle has little effect on the cutting frequency within the range of 10° to 20°. The cutting frequency is positively proportional to the cutting speed. As the cutting depth increases, the cutting frequency decreases nonlinearly. Subsequently, the energy relationship between the formation of the extrusion zone and the formation of the shear failure surface in the single cutting process is analyzed, revealing the influence of rake angle, cutting speed, and cutting depth on the cutting frequency.
(4) The concept of the geometric difference coefficient (GDC) is introduced to characterize the ratio of the extrusion zone height to the cutting depth. Based on the principle of energy conservation, the influence of cutting depth on GDC is theoretically analyzed. Additionally, utilizing the geometric relationship in the new dynamic cutting model, the relationship between GDC, cutting parameters, and cutting frequency is established. The reliability of the GDC acquisition method, based on cutting frequency, and the influence of cutting depth on GDC are then verified through the numerical simulation results of Tuffeau cutting. The findings show that as cutting depth increases, the GDC initially decreases and then stabilizes. When the cutting depth is small, the GDC is approximately 1.00, indicating that the height of the extrusion zone is nearly equal to the cutting depth. However, as cutting depth increases, the GDC gradually decreases and eventually stabilizes within a smaller range. These results confirm the assumption that the depth of the extrusion zone is not always equal to the cutting depth, and offer new insights for determining the height of the extrusion zone and optimizing the application of cutting force, providing valuable reference for the optimization of the cutting model.
Author Contributions
Conceptualization, Y.H. and N.L.; methodology, Y.H., N.L. and G.L.; software, Y.H.; validation, G.L. and Y.H.; formal analysis, Y.H. and G.L.; investigation, Y.H. and G.L.; writing—original draft preparation, Y.H.; writing—review and editing, G.L.; supervision, G.L. and N.L.; funding acquisition, G.L. and N.L. All authors have read and agreed to the published version of the manuscript.
Funding
The authors would like to acknowledge the following financial supports: Project (52179111,52309144) supported by National Natural Science Foundation of China, Project (GZC20232139, 2024M762626) supported by China postdoctoral researchers funded planning and China Postdoctoral Science Foundation.
Institutional Review Board Statement
Not applicable.
Informed Consent Statement
Not applicable.
Data Availability Statement
The data used to support the findings of this study are available from the corresponding author upon request.
Acknowledgments
We would like to thank the anonymous reviewers for their time and effort devoted to improving the quality of this research. The financial support provided by this sponsor is greatly appreciated.
Conflicts of Interest
The authors declare no conflicts of interest.
References
- Bruton, G.; Crockett, R.; Taylor, M.; DenBoer, D.; Lund, J.; Fleming, C.; Ford, R.; Garcia, G.; White, A. PDC bit technology for the 21st century. Oilfield Rev. 2014, 26, 48–57. [Google Scholar]
- Cutting Experiments in Sandstones with Blunt PDC Cutters: Almenara, J R; Detournay, E Proc ISRM Symposium: Eurock’92, Chester, 14–17 September 1992P215–220. Publ London: Thomas Telford, 1992. Int. J. Rock Mech. Min. Sci. Geomech. Abstr. 1993, 30, A242. [CrossRef]
- Akbari, B.; Miska, S. The Effects of Chamfer and Back Rake Angle on PDC Cutters Friction. J. Nat. Gas Sci. Eng. 2016, 35, 347–353. [Google Scholar] [CrossRef]
- Yahiaoui, M.; Paris, J.-Y.; Delbé, K.; Denape, J.; Gerbaud, L.; Colin, C.; Ther, O.; Dourfaye, A. Quality and Wear Behavior of Graded Polycrystalline Diamond Compact Cutters. Int. J. Refract. Met. Hard Mater. 2016, 56, 87–95. [Google Scholar] [CrossRef]
- Rostamsowlat, I. Effect of Cutting Tool Properties and Depth of Cut in Rock Cutting: An Experimental Study. Rock Mech. Rock Eng. 2018, 51, 1715–1728. [Google Scholar] [CrossRef]
- Detournay, E.; Defourny, P. A Phenomenological Model for the Drilling Action of Drag Bits. Int. J. Rock Mech. Min. Sci. Geomech. Abstr. 1992, 29, 13–23. [Google Scholar] [CrossRef]
- Fu, X.-K.; Xiong, C.; Shi, H.-Z.; He, W.-H.; Wang, L.-H.; Huang, Z.-W. Comparative Analysis of Rock Breakage Characteristics and Failure Mode on Conventional and Conical PDC Cutter Cutting Carbonate. Pet. Sci. 2025, 22, 821–834. [Google Scholar] [CrossRef]
- Wang, H.; He, M.; Ding, M.; Wang, J.; Hao, W.; Yu, X. Determination of Elastic Modulus and Anisotropy for Rocks Using Digital Drilling Method. Geoenergy Sci. Eng. 2024, 243, 213373. [Google Scholar] [CrossRef]
- Cheatham, J.B., Jr.; Daniels, W.H. A Study of Factors Influencing the Drillability of Shales: Single-Cutter Experiments With STRATAPAX(T) Drill Blanks. J. Energy Resour. Technol. 1979, 101, 189–195. [Google Scholar] [CrossRef]
- Wei, J.; Liu, W.; Gao, D. Modeling of PDC Bit-Rock Interaction Behaviors Based on the Analysis of Dynamic Rock-Cutting Process. Geoenergy Sci. Eng. 2024, 239, 212955. [Google Scholar] [CrossRef]
- Cheng, Z.; Sheng, M.; Li, G.; Huang, Z.; Wu, X.; Zhu, Z.; Yang, J. Imaging the Formation Process of Cuttings: Characteristics of Cuttings and Mechanical Specific Energy in Single PDC Cutter Tests. J. Pet. Sci. Eng. 2018, 171, 854–862. [Google Scholar] [CrossRef]
- Liu, W.; Deng, H.; Zhu, X.; Deng, K. The PDC Cutter-Rock Interaction Behavior in Rock Cutting: A Review. Geoenergy Sci. Eng. 2023, 229, 212168. [Google Scholar] [CrossRef]
- Che, D.; Zhang, W.; Ehmann, K. Chip Formation and Force Responses in Linear Rock Cutting: An Experimental Study. J. Manuf. Sci. Eng. 2016, 139, 011011. [Google Scholar] [CrossRef]
- Liu, W.; Luo, Y.; Zhu, X.; Yang, F. The Ductile–Brittle Failure Mode Transition of Hard Brittle Rock Cutting—New Insights from Numerical Simulation. Geomech. Geophys. Geo-Energy Geo-Resour. 2022, 8, 129. [Google Scholar] [CrossRef]
- Kadkhodaei, M.H.; Ghasemi, E.; Hamidi, J.K.; Rostami, J. Evaluation of Fine Material and Chip Formation in Rock Cutting with a Conical Tool. Bull. Eng. Geol. Environ. 2024, 83, 276. [Google Scholar] [CrossRef]
- Dai, X.; Huang, Z.; Shi, H.; Wu, X.; Xiong, C. Cutting Force as an Index to Identify the Ductile-Brittle Failure Modes in Rock Cutting. Int. J. Rock Mech. Min. Sci. 2021, 146, 104834. [Google Scholar] [CrossRef]
- PDC Cutter-Rock Interaction—Experiments and Modeling|Semantic Scholar. Available online: https://www.semanticscholar.org/paper/PDC-cutter-rock-interaction-experiments-and-Akbari/668c150bd3cfc2f2d9cb7cfd2955fb37f4e31c17 (accessed on 6 January 2025).
- Dougherty, P.S.M.; Mpagazehe, J.; Shelton, J.; Higgs III, C.F. Elucidating PDC Rock Cutting Behavior in Dry and Aqueous Conditions Using Tribometry. J. Pet. Sci. Eng. 2015, 133, 529–542. [Google Scholar] [CrossRef]
- Glowka, D.A. Use of Single-Cutter Data in the Analysis of PDC Bit Designs: Part 1—Development of a PDC Cutting Force Model. J. Pet. Technol. 1989, 41, 797–849. [Google Scholar] [CrossRef]
- Ziaja, M.B. Mathematical Model of the Polycrystalline Diamond Bit Drilling Process and Its Practical Application; OnePetro: Richardson, TX, USA, 1985. [Google Scholar]
- Richard, T.; Dagrain, F.; Poyol, E.; Detournay, E. Rock Strength Determination from Scratch Tests. Eng. Geol. 2012, 147–148, 91–100. [Google Scholar] [CrossRef]
- Kalantari, S.; Baghbanan, A.; Hashemalhosseini, H. An Analytical Model for Estimating Rock Strength Parameters from Small-Scale Drilling Data. J. Rock Mech. Geotech. Eng. 2019, 11, 135–145. [Google Scholar] [CrossRef]
- Evans, I. A Theory of the Basic Mechanics of Coal Ploughing. In Mining Research; Clark, G.B., Ed.; Pergamon: Oxford, UK, 1962; pp. 761–798. ISBN 978-1-4832-8307-4. [Google Scholar]
- Nishimatsu, Y. The Mechanics of Rock Cutting. Int. J. Rock Mech. Min. Sci. Geomech. Abstr. 1972, 9, 261–270. [Google Scholar] [CrossRef]
- Li, Z.; Itakura, K. An Analytical Drilling Model of Drag Bits for Evaluation of Rock Strength. Soils Found. 2012, 52, 216–227. [Google Scholar] [CrossRef]
- Che, D.; Zhu, W.-L.; Ehmann, K.F. Chipping and Crushing Mechanisms in Orthogonal Rock Cutting. Int. J. Mech. Sci. 2016, 119, 224–236. [Google Scholar] [CrossRef]
- Kalantari, S.; Hashemolhosseini, H.; Baghbanan, A. Estimating Rock Strength Parameters Using Drilling Data. Int. J. Rock Mech. Min. Sci. 2018, 104, 45–52. [Google Scholar] [CrossRef]
- Mishnaevsky, L.L. Investigation of the Cutting of Brittle Materials. Int. J. Mach. Tools Manuf. 1994, 34, 499–505. [Google Scholar] [CrossRef]
- Yilmaz, N.G.; Yurdakul, M.; Goktan, R.M. Prediction of Radial Bit Cutting Force in High-Strength Rocks Using Multiple Linear Regression Analysis. Int. J. Rock Mech. Min. Sci. 2007, 44, 962–970. [Google Scholar] [CrossRef]
- Simon, R. Energy Balance in Rock Drilling. Soc. Pet. Eng. J. 1963, 3, 298–306. [Google Scholar] [CrossRef]
- Teale, R. The Concept of Specific Energy in Rock Drilling. Int. J. Rock Mech. Min. Sci. Geomech. Abstr. 1965, 2, 57–73. [Google Scholar] [CrossRef]
- Caicedo, H.U.; Calhoun, W.M.; Ewy, R.T. Unique ROP Predictor Using Bit-Specific Coefficient of Sliding Friction and Mechanical Efficiency as a Function of Confined Compressive Strength Impacts Drilling Performance. In Proceedings of the SPE/IADC Drilling Conference, Amsterdam, The Netherlands, 23–25 February 2005; p. SPE-92576-MS. [Google Scholar]
- He, L.; Huang, J.; Luo, Y.; Liu, W.; Zhu, X.; Fan, S. The Ductile–Brittle Transition of Rock Cutting: Insight from the Discrete Element Method. J. Braz. Soc. Mech. Sci. Eng. 2022, 44, 605. [Google Scholar] [CrossRef]
- Liu, W.; Qian, X.; Li, T.; Zhou, Y.; Zhu, X. Investigation of the Tool-Rock Interaction Using Drucker-Prager Failure Criterion. J. Pet. Sci. Eng. 2019, 173, 269–278. [Google Scholar] [CrossRef]
- Aresh, B.; Khan, F.N.; Haider, J. Experimental Investigation and Numerical Simulation of Chip Formation Mechanisms in Cutting Rock-like Materials. J. Pet. Sci. Eng. 2022, 209, 109869. [Google Scholar] [CrossRef]
- Che, D.; Han, P.; Guo, P.; Ehmann, K. Issues in Polycrystalline Diamond Compact Cutter-Rock Interaction from a Metal Machining Point of View-Part I: Temperature, Stresses, and Forces. Trans. ASME-B-Journ Manuf. Sci. Eng. 2012, 134, 064001. [Google Scholar] [CrossRef]
- Che, D.; Han, P.; Guo, P.; Ehmann, K. Issues in Polycrystalline Diamond Compact Cutter–Rock Interaction from a Metal Machining Point of View—Part II: Bit Performance and Rock Cutting Mechanics. J. Manuf. Sci. Eng. 2012, 134, 064002. [Google Scholar] [CrossRef]
- Zhang, G.; Thuro, K.; Konietzky, H.; Menschik, F.M.; Käsling, H.; Bayerl, M. In-Situ Investigation of Drilling Performance and Bit Wear on an Electrical Drill Hammer. Tunn. Undergr. Space Technol. 2022, 122, 104348. [Google Scholar] [CrossRef]
- Hood, M.; Alehossein, H. A Development in Rock Cutting Technology. Int. J. Rock Mech. Min. Sci. 2000, 37, 297–305. [Google Scholar] [CrossRef]
- Gou, B.; Zhang, M. Effects of Surface Grooves on Rock Cutting Performance and Contact Behavior of a TBM Disc Cutter. Eng. Fract. Mech. 2022, 267, 108466. [Google Scholar] [CrossRef]
- Li, X.; Huang, B.; Li, C.; Jiang, S. Dynamics Analysis on Roadheader Cutting Head Based on LS-DYNA. J. Converg. Inf. Technol. 2012, 7, 333–340. [Google Scholar] [CrossRef]
- Munoz, H.; Taheri, A.; Chanda, E. Rock Cutting Characteristics on Soft-to-Hard Rocks under Different Cutter Inclinations. Int. J. Rock Mech. Min. Sci. 2016, 87, 85–89. [Google Scholar] [CrossRef]
- Rostamsowlat, I.; Richard, T.; Evans, B. An Experimental Study of the Effect of Back Rake Angle in Rock Cutting. Int. J. Rock Mech. Min. Sci. 2018, 107, 224–232. [Google Scholar] [CrossRef]
- Richard, T.; Detournay, E.; Drescher, A.; Nicodeme, P.; Fourmaintraux, D. The Scratch Test as a Means to Measure Strength of Sedimentary Rocks; OnePetro: Richardson, TX, USA, 1998. [Google Scholar]
- Gray, K.E.; Armstrong, F.; Gatlin, C. Two-Dimensional Study of Rock Breakage in Drag-Bit Drilling at Atmospheric Pressure. J. Pet. Technol. 1962, 14, 93–98. [Google Scholar] [CrossRef]
- Majidi, R.; Miska, S.; Tammineni, S. PDC Single Cutter: The Effects of Depth of Cut and RPM under Simulated Borehole Conditions. Wiert. Naft. Gaz 2011, 28, 283–295. [Google Scholar]
Disclaimer/Publisher’s Note: The statements, opinions and data contained in all publications are solely those of the individual author(s) and contributor(s) and not of MDPI and/or the editor(s). MDPI and/or the editor(s) disclaim responsibility for any injury to people or property resulting from any ideas, methods, instructions or products referred to in the content. |
© 2025 by the authors. Licensee MDPI, Basel, Switzerland. This article is an open access article distributed under the terms and conditions of the Creative Commons Attribution (CC BY) license (https://creativecommons.org/licenses/by/4.0/).