Article

Research on Improved Bridge Surface Disease Detection Algorithm Based on YOLOv7-Tiny-DBB

School of Vehicle and Transportation Engineering, Taiyuan University of Science and Technology, Taiyuan 030024, China
*
Author to whom correspondence should be addressed.
Appl. Sci. 2025, 15(7), 3626; https://doi.org/10.3390/app15073626
Submission received: 24 February 2025 / Revised: 23 March 2025 / Accepted: 24 March 2025 / Published: 26 March 2025

Abstract

:
In response to the diverse target types, variable morphological characteristics, and the prevalence of small sample targets that are prone to missed detections in the bridge surface disease identification, this paper proposes an improved algorithm for detecting bridge surface diseases based on YOLOv7-Tiny-DBB. By introducing the DBB module to replace the ELAN-Tiny module in the backbone network, the capability of multi-scale feature extraction during the training phase is enhanced, the number of parameters during inference is reduced, and the inference speed has been accelerated. Additionally, by substituting the CIoU loss function with a boundary box regression loss function based on MPDIoU, the regression prediction capabilities are strengthened and both regression accuracy and speed are improved. Effective training and testing are conducted using a self-constructed augmented dataset. The results indicate that, compared to the YOLOv7-Tiny algorithm, the improved algorithm achieves an increase of 4.2% in precision, 6.5% in recall, 5.4% in F1 score, and 7.3% in mean Average Precision (mAP). Additionally, the detection speed improves by 13.1 FPS, successfully addressing the issue of missed detections for minor diseases. The ablation experiments, along with the performance comparison of different network models and visual effect assessments further corroborate the effectiveness of the proposed improvements, providing critical technical support for the deployment of real-time detection systems for bridge surface diseases on industrial edge devices.

1. Introduction

Bridges, as vital infrastructure for transportation tasks, play a crucial role in ensuring the safety of people’s lives and property, as well as in promoting social and economic development. With acceleration of urbanization and long-term effects of environmental factors, various surface defects have emerged in bridges, including cracks, exposed reinforcement bars, spalling, and honeycombing. The timely and accurate identification of these defects is essential not only for effectively preventing bridge collapse incidents but also for extending the service life of bridges. Furthermore, it enhances the operational safety and reliability of these structures [1,2,3].
Currently, there is a significant demand for the detection of apparent diseases in bridges, characterized by heavy workloads and high precision requirements. This situation presents certain challenges in terms of detection equipment, methods, and accuracy. Traditional approaches, such as visual inspections or non-contact automatic monitoring instruments, including bridge inspection vehicles, not only exhibit low efficiency but are also heavily influenced by the skill level of the inspectors and the conditions of the inspection sites. Consequently, these methods often suffer from strong subjectivity and high rates of missed detections or false positives. The shortcomings become particularly pronounced when addressing minor defects or inspecting areas with poor lighting conditions. It is evident that traditional methods can no longer meet the demands of modern bridge inspections effectively. In recent years, with the rapid development of artificial intelligence, machine vision has gradually been applied to the research of rapid detection of surface defects in bridges. By acquiring digital image feature information and employing relevant algorithms for automated data analysis and processing [4,5,6], machine vision has emerged as a current research hotspot due to its advantages, such as non-contact operation, non-destructive testing, and extensive coverage. Deep learning-based object detection algorithms, as a branch of machine learning, have made significant advancements in recent years. Scholars both domestically and internationally have conducted relevant research focusing on the characteristics of surface diseases in bridges. In an international context, Phan [7] tested four of the latest YOLO variants using the COCO-Bridge-2021 dataset for bridge detail detection. This research advanced the selection process for lightweight models aimed at detecting bridge defects via drone technology. A YOLOv8 network training model utilizing an auto distillation pipeline for bridge detection and segmentation was proposed, aimed at ensuring the safe navigation and collision avoidance of autonomous vessels [8]. Ameli [9] developed an open-source corrosion dataset for steel bridges, which was evaluated using the Mask R-CNN and YOLOv8 algorithms. The results demonstrated that these methods perform effectively in both segmentation and assessment of corrosion. Wu [10] enhanced the YOLOv5 model by incorporating the CBAM attention mechanism, resulting in a 15% improvement in the accuracy of concrete bridge crack detection. By incorporating a Squeeze-and-Excitation (SE) network attention mechanism module into the detection layer of YOLOv3 and employing the K-means algorithm for anchor box clustering, the performance of the traditional YOLOv3 model in bridge damage detection was significantly enhanced [11]. In domestic research, Liu [12] had summarized a technical framework for the detection of surface defects in bridges based on machine vision methods. This framework served as a valuable reference for subsequent researchers engaged in similar detection efforts. Based on an improved coordinate attention mechanism, a modified YOLOX algorithm that integrated positional information with channel information had been proposed. Experimental results indicated that the performance of the bridge disease identification using this approach surpassed that of the original network by 4.4% [13]. A bridge disease target detection model based on SE-YOLOv3 was proposed by utilizing the EM algorithm grounded in Gaussian distribution and the SoftIoU Loss function, which had significantly improved the accuracy of bridge crack detection to a certain extent [14]. Yu [15] proposed the YOLOv4-fpm deep learning model for bridge crack detection, building upon the YOLOv4 framework. The pruning algorithm to simplify the network was employed and the loss function using focal loss was optimized, resulting in a reduction of model size and parameters by 18.2%. The YOLOv7 algorithm was improved by integrating the SimAM and CARAFE attention mechanisms. This enhancement had resulted in a 15% reduction in inference time for defect detection in large-span bridges [16]. Ding [17] proposed the BGV-YOLOv5 bridge surface irregularity detection system, taking into account factors, such as lighting conditions, weather variations, and changes in bridge materials. This system provided significant reference for accurately monitoring abnormal situations during the operation of highway bridges. In the application of the deep learning models to edge devices, Carvalho [18] achieved the automation of the digital meter reading process through a deep learning-driven universal controller and flow meter. The robustness of this system was validated through evaluation experiments. Samanta [19] focused on various architectures of deep learning and explored the potential obstacles to deploying these technologies on edge devices, thereby providing direction for future research. Ma [20] introduced the convolution and ICTNet network architecture, which successfully enhanced modulation recognition accuracy while reducing model size. This approach had been effectively applied to signal modulation recognition in resource-constrained small devices within Internet of Things (IoT) environments. Sun [21] developed an electric vehicle violation detection system for unauthorized passenger transport, based on an improved YOLOv5 network model. This system incorporated a lightweight MobileNetV3 architecture and the ECA-Net attention mechanism. The enhancements resulted in an 18% reduction in the number of parameters. Li [22] developed a bridge monitoring module based on edge computing technology, which addressed issues, such as insufficient bandwidth, high energy consumption, and data security associated with cloud computing, to some extent.
In summary, both domestic and international scholars have achieved significant results in the detection of surface diseases on bridges and the deployment of edge devices using deep learning-based object detection algorithms. These findings provide important references for the development of this research. However, the inherent complexity of bridge diseases and their backgrounds somewhat limits the improvement in detection accuracy. Some high-precision recognition models possess a large number of convolutional layers and parameters, resulting in larger model sizes and slower detection speeds. Additionally, these models are prone to missing detections, making them unsuitable for deployment on edge devices. To this end, this paper conducts an analysis based on the principles of the YOLOv7-Tiny algorithm. It replaces the ELAN-Tiny module in the original backbone feature extraction network with a multi-scale feature extraction module known as Diverse Branch Block (DBB). This modification not only enriches the extracted feature information but also enhances model parameter capacity, accelerates inference speed, and improves multi-scale object detection performance. The loss function CIoU is replaced with MPDIoU to enhance the regression prediction capability. Consequently, an improved algorithm for detecting surface diseases in bridges based on YOLOv7-Tiny-DBB is proposed. The effectiveness of this improvement is further validated through training and testing on a self-constructed augmented bridge surface dataset, as well as verification and visualization of results. This research provides critical technical support for the accurate and rapid identification of surface diseases in bridges, facilitating the deployment of real-time detection equipment at industrial edges.

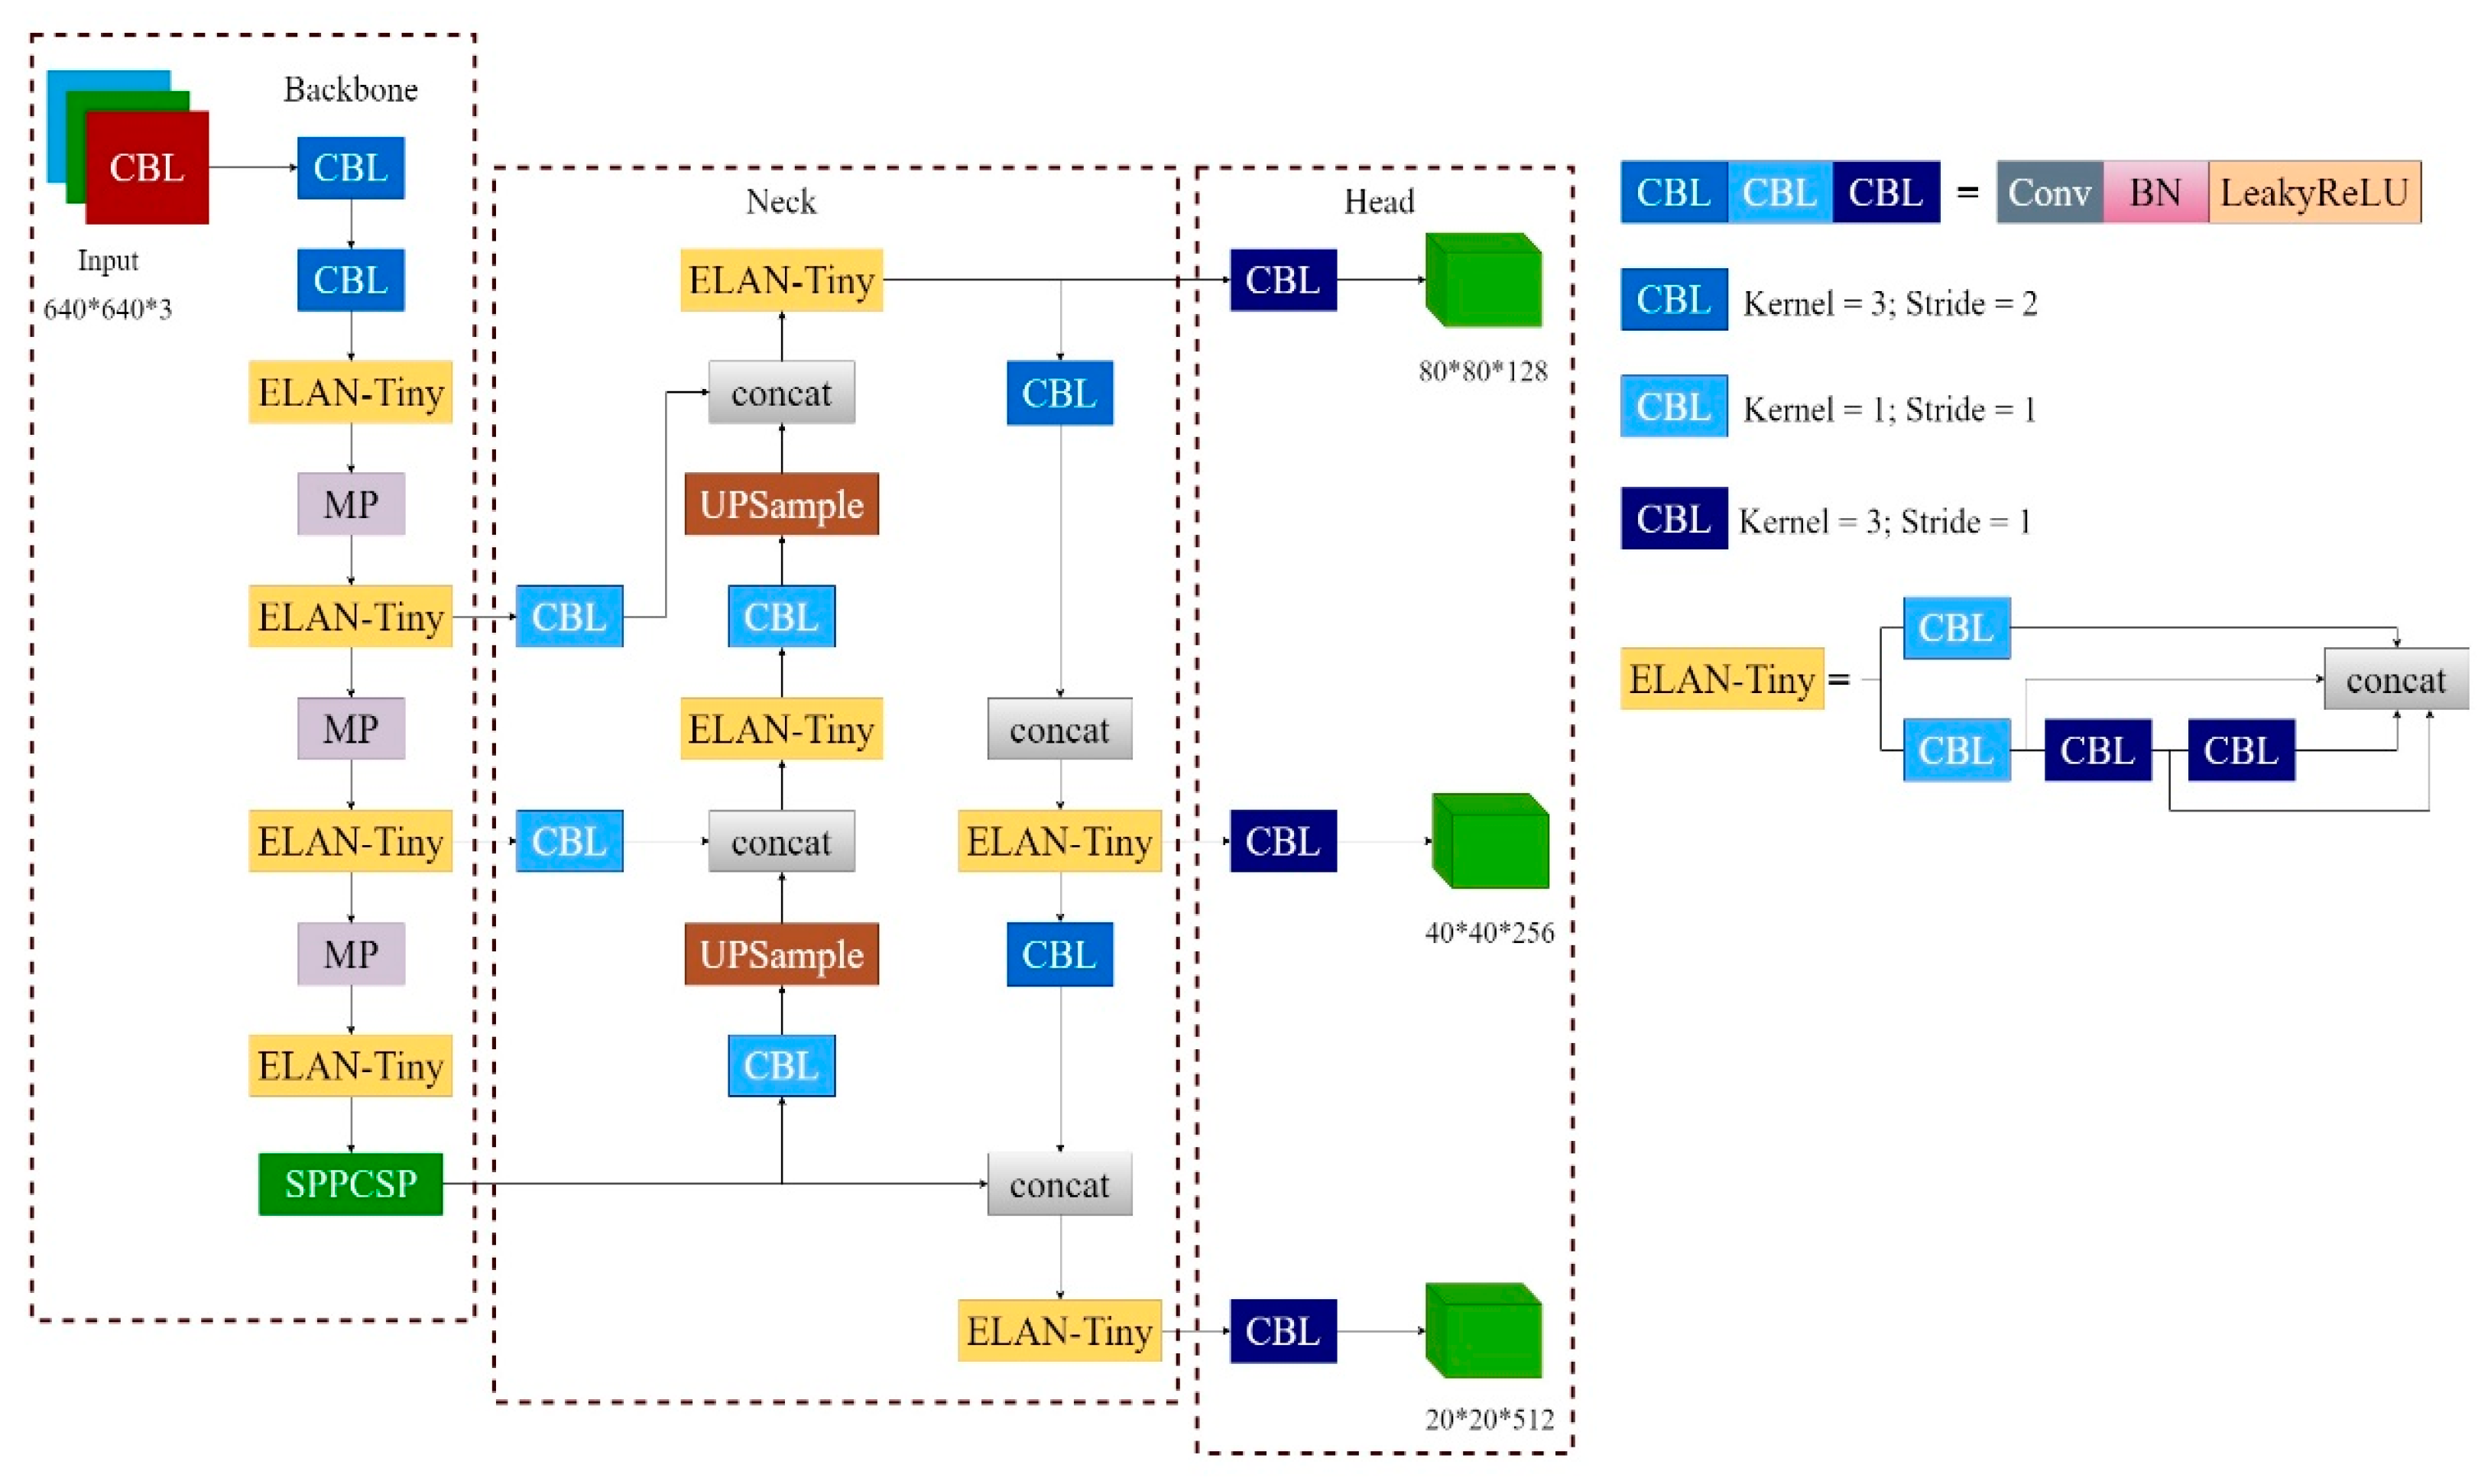
2. Principles of the YOLOv7-Tiny Algorithm

The YOLO algorithm is widely utilized in object recognition and localization due to its advantages of high detection accuracy and fast processing speed. With the continuous advancement of object detection technology, the network architecture of the YOLO algorithm has also undergone ongoing improvements and optimizations. For instance, the YOLOv7 model introduces reparameterization into its network structure, proposing a novel ELAN efficient network architecture that enhances both the accuracy and efficiency of object detection. The YOLOv7 [23,24] network architecture identifies targets by first performing feature extraction to capture key information from the input image. Subsequently, it conducts feature fusion at different levels to enhance the expressive capability of the features. Finally, based on these fused features, it predicts the characteristics of objects corresponding to prior boxes, including object categories, locations, and confidence scores. This process effectively realizes the entire workflow from image input to object detection output. Furthermore, YOLOv7 employs BCE With Logits Loss for calculating both class confidence loss and object confidence loss, while the CIoU loss function is utilized for coordinate regression loss. Although the YOLOv7 algorithm achieves a further improvement in accuracy, its network structure is overly complex, resulting in a substantial number of parameters and high-performance requirements for the hardware. Consequently, it is not suitable for deployment on edge terminal devices.
The YOLOv7-Tiny network is a simplified version of the YOLOv7 architecture, which reduces the number of model parameters [25]. It is designed as a compact model for the edge GPU computing devices, effectively balancing detection accuracy and real-time performance. The network structure is illustrated in Figure 1.
In the backbone network section, YOLOv7-Tiny replaces the activation function in the YOLOv7 CBS module with Leaky ReLU. This modification not only mitigates issues related to gradient vanishing caused by excessively large or small data values but also alleviates problems associated with insufficient activation values that hinder the updating of neuron parameters [26,27]. On the other hand, it employs a more streamlined ELAN (Efficient Long-Distance Attention Network)-Tiny module, eliminating the convolution operations present in MPConv and solely performing MaxPooling for downsampling. In the feature fusion network, the SPPCSP spatial pyramid pooling module is still utilized to enlarge the receptive field, thereby providing richer feature maps as input to the Neck layer. It also retains the PAFPN (Pyramid Aggregation Feature Pyramid Network) structure to achieve feature fusion. At the prediction end, the CBL (Conv-BN-Leaky ReLU) module is employed in place of REPConv (Re-parameterized Convolution) to adjust the number of channels and output the prediction results.
Compared to the YOLOv7 algorithm, YOLOv7-Tiny employs a significant amount of ELAN-Tiny in its backbone feature extraction network. This results in fewer network layers, which is not conducive to the extraction of multiple features related to bridge diseases. Consequently, there is a noticeable reduction in both parameter count and computational load, leading to a decline in detection accuracy. Therefore, to achieve rapid and accurate detection of surface diseases on bridges, it is necessary to improve the YOLOv7-Tiny algorithm.

3. Algorithm Enhancement

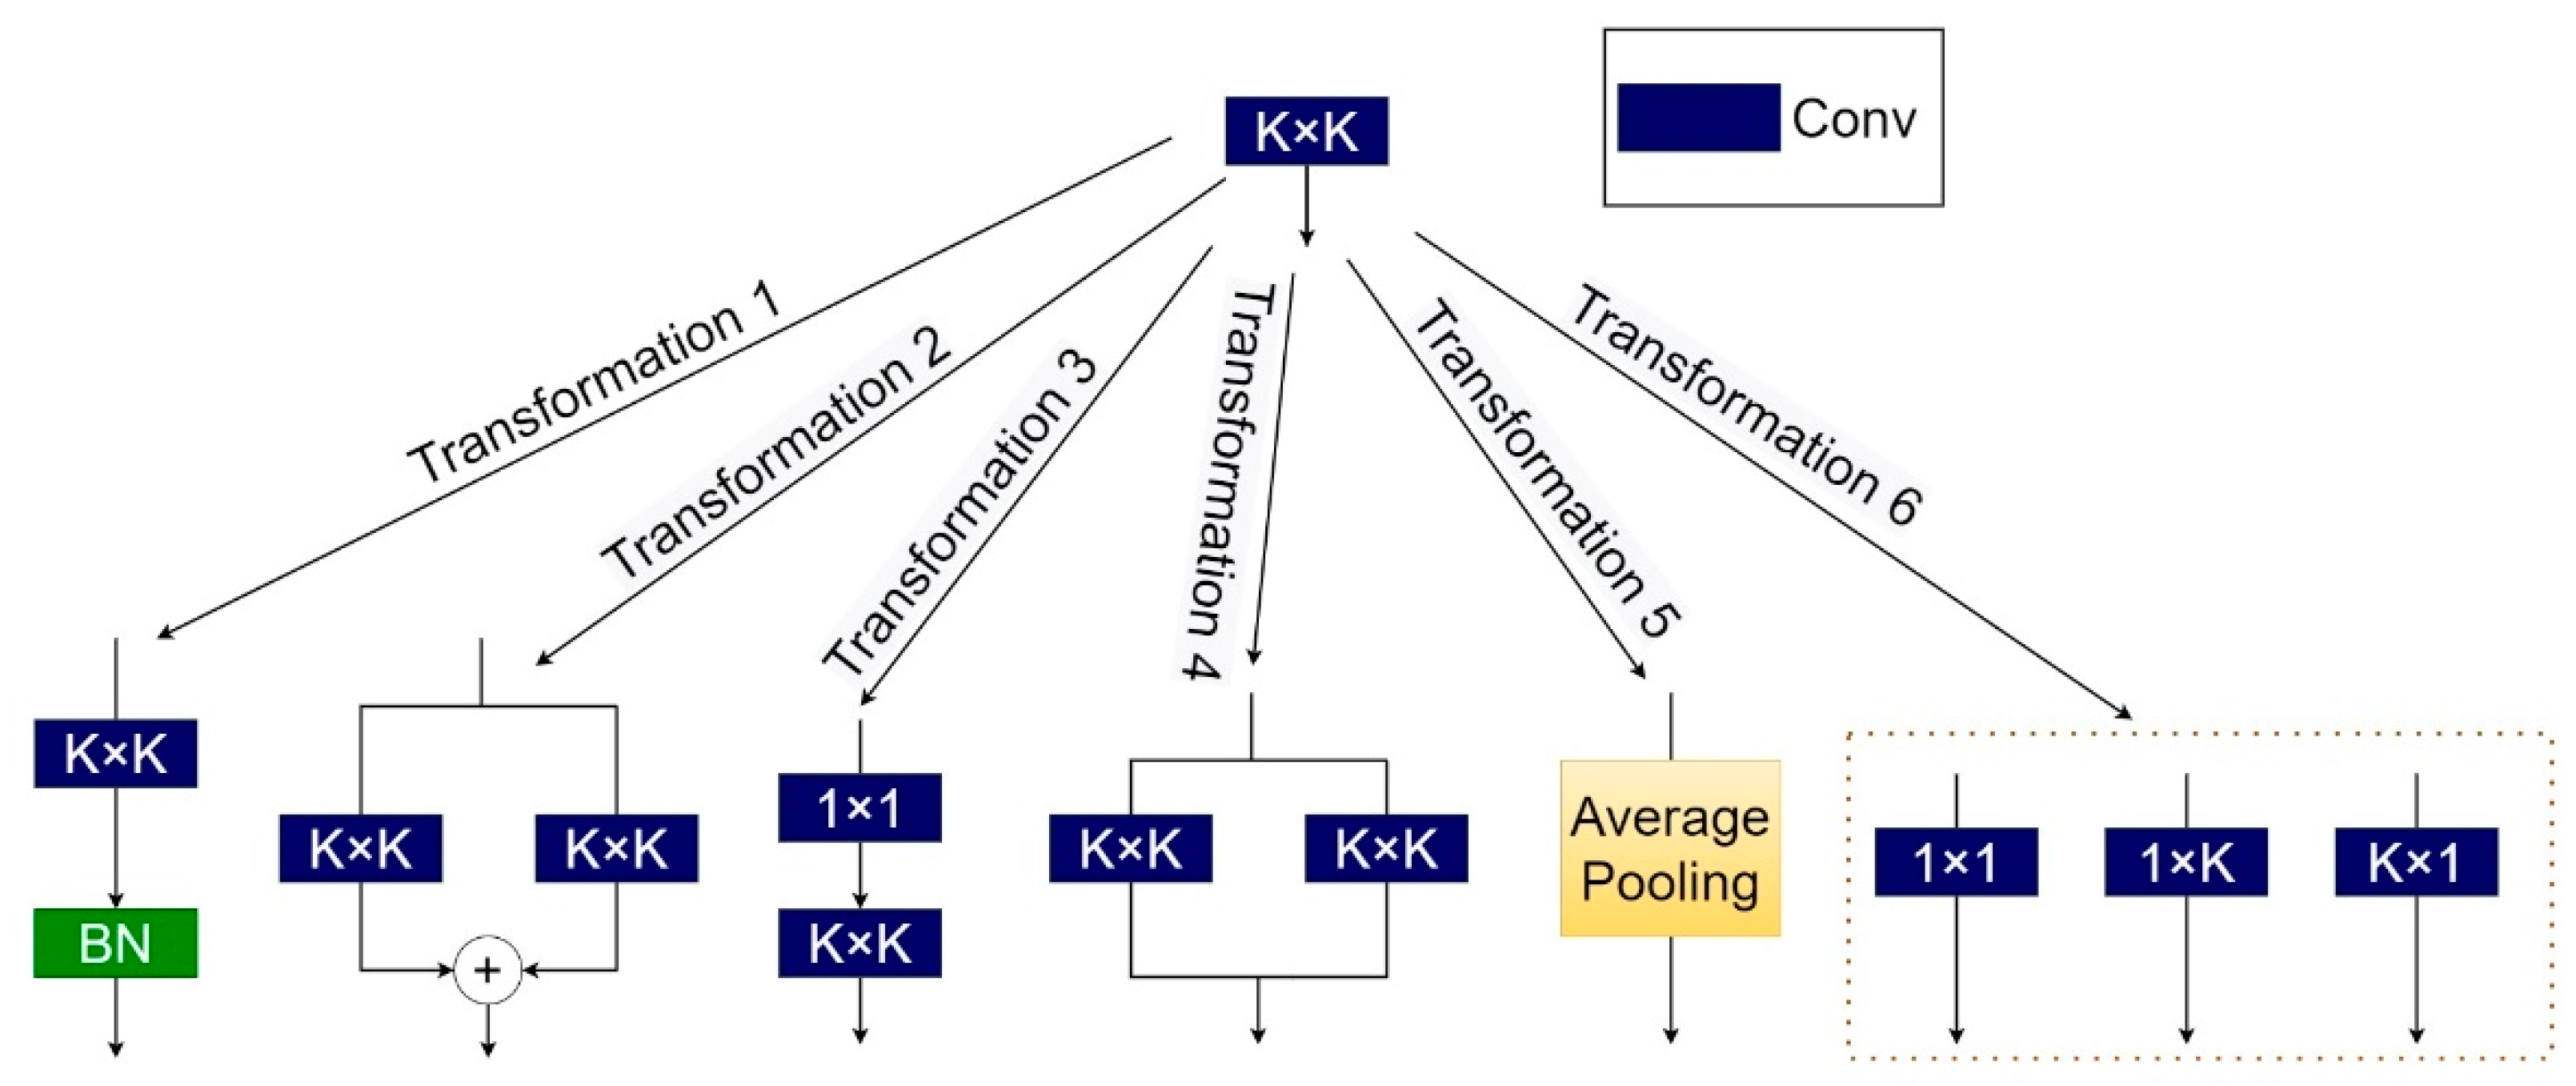
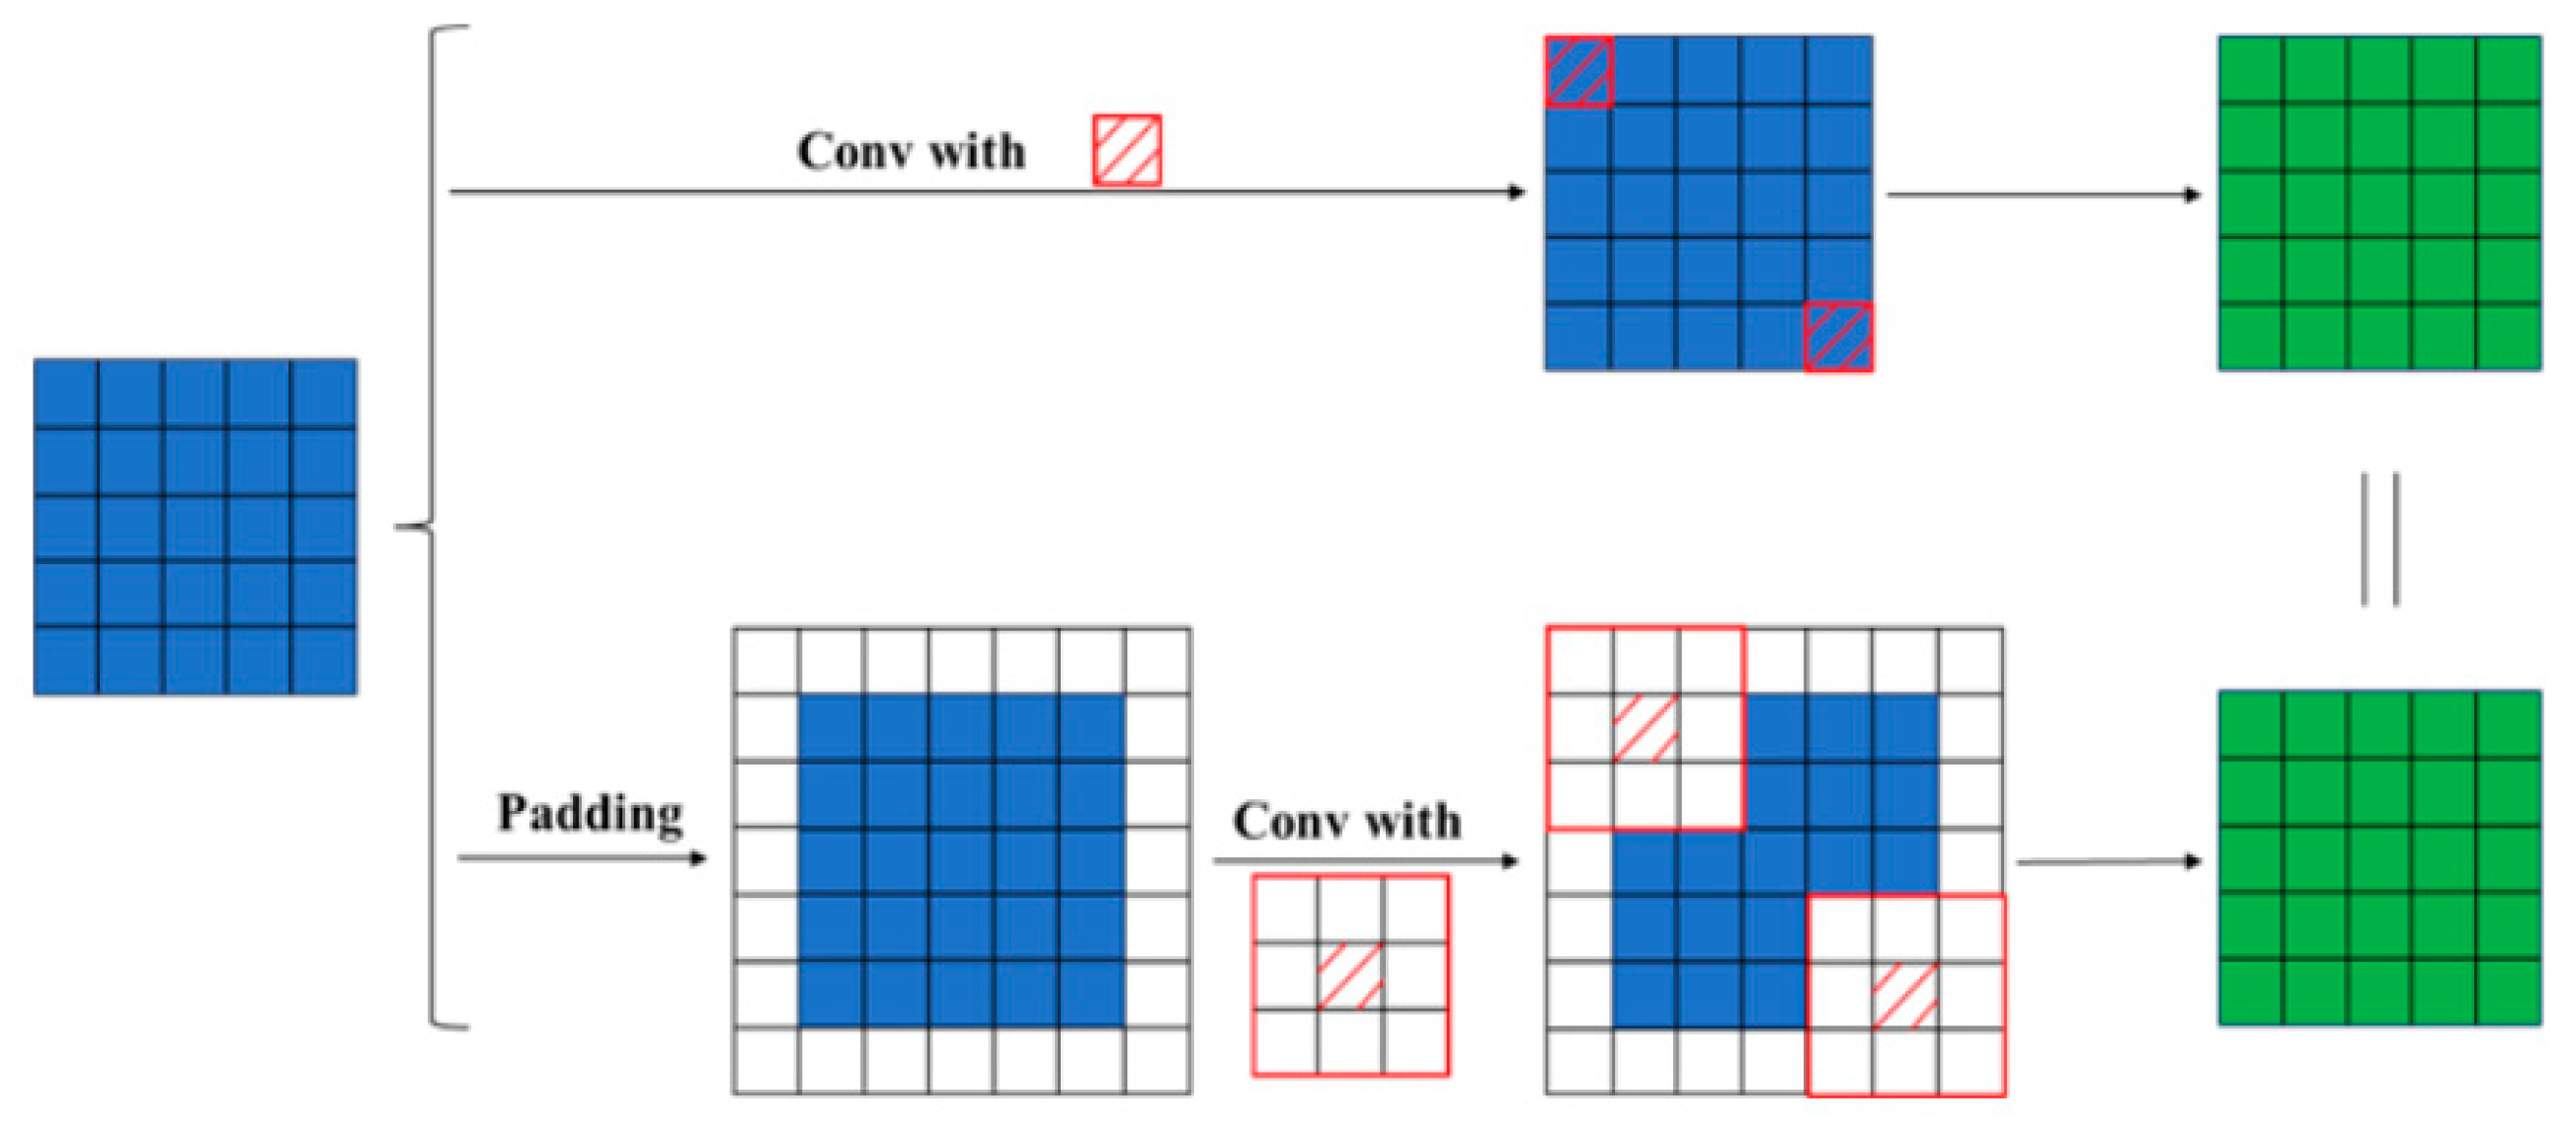
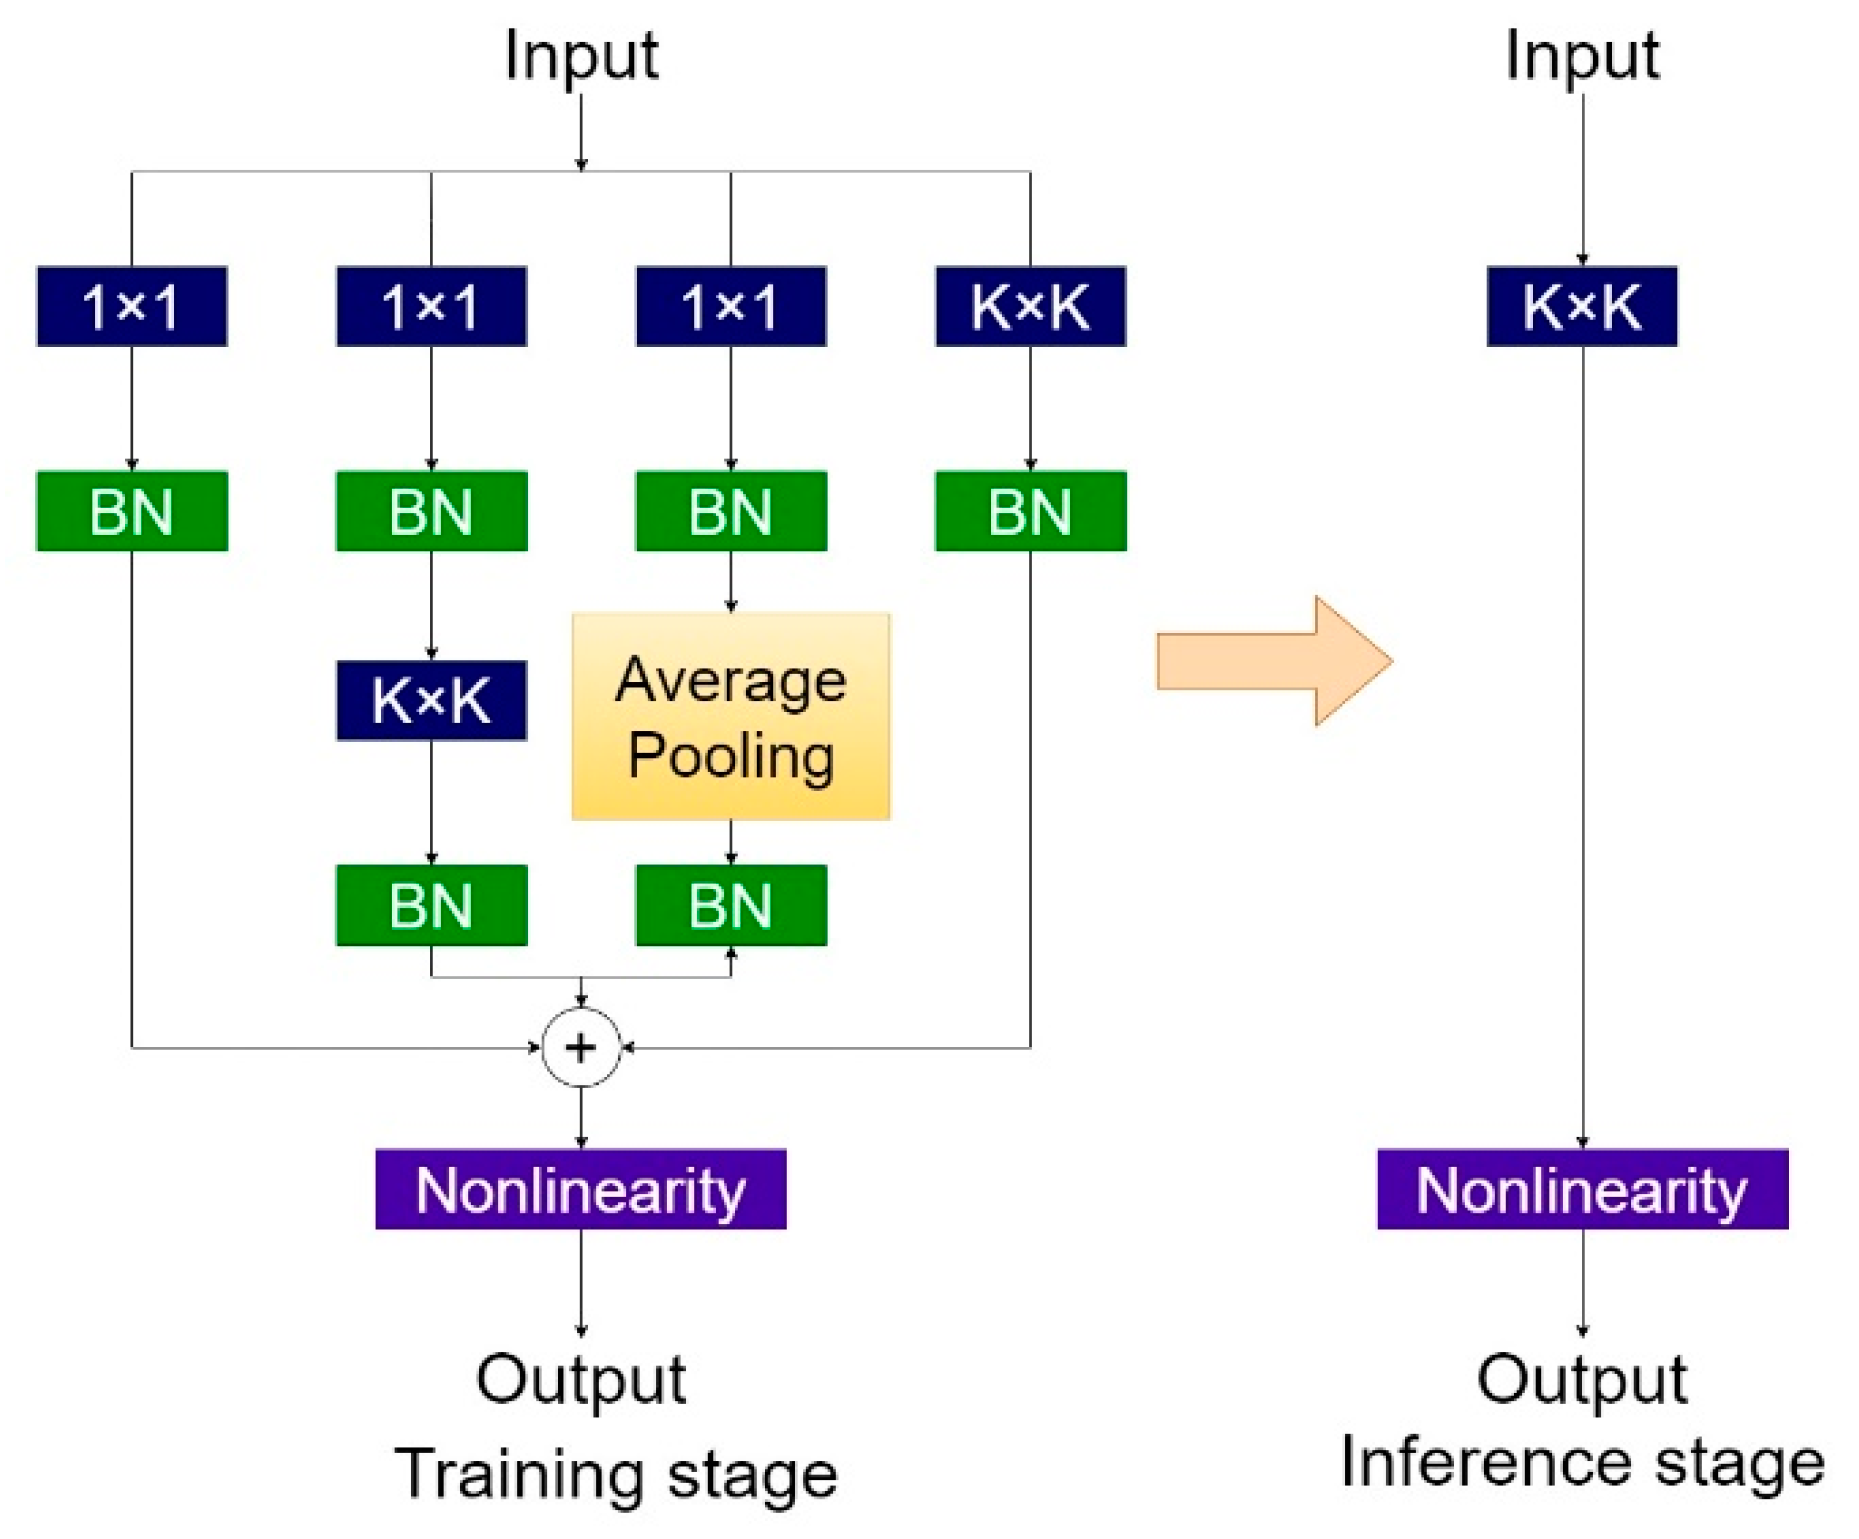
3.1. Diverse Branch Block (DBB) Module Introduction

The numerous ELAN-Tiny modules in YOLOv7-Tiny are primarily composed of multiple densely connected standard convolutional layers. This results in a complex network structure characterized by a high number of parameters and significant computational demands. However, the limited depth of the network poses challenges for effective feature extraction [28]. Diverse Branch Block (DBB) is a diversified branch module proposed by Ding Xiaohan in 2021 [29]. It serves as an alternative to conventional convolutional modules, enhancing detection accuracy without incurring additional inference time costs. Compared to the convolutional replacements utilized in ACNet, the DBB module introduces a more intricate multi-branch structure reminiscent of Inception. It is based on the concept of structural reparameterization, which utilizes parameters derived from one structure to parameterize another. Specifically, during the training process, different receptive fields are introduced through a complex multi-branch architecture that incorporates branches with varying scales and complexities. Upon completion of training, this architecture can be equivalently transformed into a single convolutional layer for deployment during the inference phase. Consequently, replacing the EALN-Tiny module in the original algorithm with the DBB module contributes to a reduction in computational load and parameter count while enhancing detection speed. As illustrated in Figure 2, there are six distinct transformation methods for structural reparameterization within DBB.
The two transformations that are particularly significant for the improvement of this algorithm are as follows: First, Transformation 2 involves convolutional branch fusion. Based on the additivity property of convolution, two convolutional layers with identical configurations can be summed and merged into a new convolutional layer, as illustrated in Equation (1). This merging process enhances the performance of the original model.
F F 1 + F 2 , b b 1 + b 2
In Formula (1), F(1) represents the convolution after the fusion of 1 × 1 Conv and BN, F(2) represents the convolution after the fusion of K × K Conv and BN, and F′ is the convolution kernel after the merger. b(1) represents the bias after the fusion of 1 × 1 Conv and BN, b(2) represents the bias after the fusion of K × K Conv and BN, and b′ is the bias after the merger.
Another approach is the multi-scale convolution transformation 6, which utilizes multi-scale convolution kernels K h × K w K h K , K w K and applies zero padding to convert them into a K × K convolution. This process involves performing padding operations on the input to align the sliding window, as illustrated in Figure 3. Specifically, the 1 × 1 convolution undergoes zero padding to be transformed into a 3 × 3 convolution. Finally, after incorporating biases into the transformed 3 × 3 convolutions, these branches are summed according to Transformation 2, thereby integrating the DBB module into a new 3 × 3 convolution.
The structure of the fused DBB is illustrated in Figure 4. During the training phase, the DBB module comprises four branches that enhance the original K × K convolution through various combinations, including 1 × 1, 1 × 1-K × K, and 1 × 1-AVG. Notably, the intermediate output channels of the 1 × 1 − K × K branch are equal to those of the input channels, with the 1 × 1 convolution initialized to 1; other branches utilize conventional initialization methods. Subsequently, a Batch Normalization (BN) layer is added after each convolutional operation to provide non-linear transformations during the training phase, thereby enhancing the model’s generalization capability. During the inference phase, the DBB module can be equivalently transformed into a convolutional layer of size K × K based on the aforementioned transformation method, thereby achieving the combination of different branches through a single convolution. In other words, the separation of training and inference structures has been achieved; by complicating the model architecture during training (such as employing multi-branch structures), it can be reverted to its original inference structure post-training. This approach aims to enhance performance during training while maintaining consistent costs during inference. Consequently, by introducing the DBB module, it is possible to improve the performance of existing convolutional neural networks without affecting the macro structure or testing time.

3.2. Refinement of the Loss Function

In the object detection field, the bounding boxes accuracy is crucial as it directly impacts the performance of detection algorithms. The traditional Intersection over Union (IoU) loss function quantifies the ratio between the intersection area and union area of the predicted bounding boxes and the ground truth bounding boxes [30,31], as illustrated in Formula (2). This metric assesses the degree of overlap between two bounding boxes.
When the predicted bounding box does not overlap with the ground truth bounding box, i.e., IoU = 0, it fails to reflect the distance discrepancy between the two bounding boxes. To address this issue, researchers have subsequently proposed GIoU, DIoU, CIoU, and EIoU [32,33,34]. These metrics tackle various problems, including non-overlapping predictions versus ground truths, overlapping scenarios, distances between center points, and discrepancies in aspect ratios, respectively.
I o U = β g t β p r d β g t β p r d
In the equation: β p r d represents the predicted bounding box; β g t denotes the ground truth bounding box.
In the YOLOv7-Tiny algorithm, a combination of two loss functions, Focal Loss and CIoU Loss, is employed. The Focal Loss addresses the issue of class imbalance by reducing the weight of easily classified samples. On the other hand, CIoU Loss is an IoU-based loss function that takes into account not only the distance between the centers of bounding boxes but also their aspect ratios. This enhancement allows for a more accurate assessment of spatial relationships between target boxes, ultimately contributing to improved detection accuracy. However, when the predicted bounding box and the ground truth bounding box share the same aspect ratio but differ in their width and height values, the traditional loss functions (such as GIoU, DIoU, CIoU, and EIoU) may lose their effectiveness. This limitation hinders optimization processes and restricts both the convergence speed and accuracy of bounding box regression.
The MPDIoU [35] boundary box loss function is a novel regression loss function based on the minimum point distance, which integrates the advantages of CIoU and EIoU. It also addresses the limitations encountered by CIoU and EIoU when the predicted boundary box and the ground truth boundary box share identical aspect ratios but differ in width and height values. Inspired by the rectangular characteristics of boundary boxes, the MPDIoU comprehensively considers relevant factors, such as overlapping areas, distances between center points, and deviations in width and height. It directly minimizes the distances between the top-left corner and bottom-right corner points of the predicted boundary box and its corresponding annotated ground truth box, as illustrated in Figure 5 (where green boxes represent predicted boxes and red boxes denote ground truth). The MPDIoU simplifies the computational process, as demonstrated in Equations (3)–(5).
d 1 2 = x 1 p r d x 1 g t 2 + y 1 p r d y 1 g t 2
d 2 2 = x 2 p r d x 2 g t 2 + y 2 p r d y 2 g t 2
M P D I o U = I o U d 1 2 w 2 + h 2 d 2 2 w 2 + h 2 = A B A B d 1 2 w 2 + h 2 d 2 2 w 2 + h 2
In the equation, w denotes the width; h represents the height; A and B are two arbitrary convex shapes; x 1 g t , y 1 g t and x 2 g t , y 2 g t indicate the coordinates of the center point of the ground truth bounding box; x 1 p r d , y 1 p r d and x 2 p r d , y 2 p r d signify the coordinates of the center point of the predicted bounding box. Moreover, in the calculation process of the MPDIoU, the parameters d1 and d2 play a crucial role. The parameter d1 primarily influences the weight of the center point distance. By adjusting its value, it can alter the significance of this distance in the MPDIoU computation, thereby affecting both the accuracy and convergence speed of the bounding box regression. A larger value for d1 will elevate the importance of center point distance in calculations, facilitating greater emphasis on accuracy during bounding box localization. Conversely, the parameter d2 affects the weight assigned to deviations in width and height. By modifying the value of d2, it can modify the weight of width and height deviations in the calculation of MPDIoU. A higher value for d2 will result in increased significance being placed on width and height deviations during computations, which aids in more accurately regressing both the shape and size of bounding boxes.
The loss function LMPDIoU is defined as shown in Equation (6).
L M P D I o U = 1 M P D I o U
In the detection of apparent diseases in bridges, the diversity of these diseases and the complexity of their backgrounds pose significant challenges. Specifically, exposed reinforcement-related diseases often occur concurrently with damage-related ailments, leading to overlapping conditions. When descriptions of the overlapping bounding boxes are insufficient, there is a heightened risk of missed detections. To address this issue, the original loss function in the YOLOv7-Tiny algorithm had been improved by replacing it with MPDIoU. It can effectively mitigate the failure of detection boxes caused by disease overlap, reduce the instances of missed detections, and improve the accuracy in detecting small target diseases.

3.3. Enhanced YOLOv7-Tiny-DBB Algorithm

The characteristics of apparent diseases in bridges include the following: (1) a diverse range of disease types and variable morphological features; (2) significant differences in the area occupied by diseases in images, particularly for the small target samples of bridge cracks, which may lead to instances where detection fails; (3) in some collected images, the distribution of bridge diseases is relatively concentrated with overlapping conditions, resulting in occurrences of missed detections and false positives during the inspection process. The YOLOv7-Tiny algorithm has been improved to address the characteristics of surface diseases in bridges. Firstly, a Diverse Branch Block (DBB) module is introduced to replace the ELAN-Tiny module in the backbone feature extraction network, as illustrated by the red dashed box in Figure 6. This modification effectively utilizes disease features of bridges at different scales, enabling multi-scale feature extraction and enriching the information related to bridge diseases, thereby enhancing the overall network’s capability to capture disease-related features. Secondly, the original model’s loss function CIoU is replaced with the MPDIoU loss function. By comparing the similarity between the predicted bounding boxes and the actual annotated bounding boxes during the bounding box regression process, this modification can achieve a faster convergence speed and more accurate regression results. The improved network structure of the YOLOv7-Tiny-DBB algorithm is illustrated in Figure 6.

4. Experimental Analysis and Validation

4.1. Dataset and Experimental Environment

Due to the current limitations of existing open-source datasets for bridge surface defect images, the photographic survey of bridges in Taiyuan, Xi’an, Tianjin, and Hebei Province is conducted. This effort results in a total of 1271 images, and the images of certain bridge defects are illustrated in Figure 7.
During the process of collecting data on bridge defects, it is essential to conduct the collection based on the type of defect and detection requirements. For subtle defects in bridges, such as cracks and fine fissures, it is necessary to maintain a photographing distance within 1 to 3 m, with a resolution reaching between 0.15 and 0.20 mm per pixel to ensure that the defects are clearly visible. In contrast, for assessing the overall condition of the bridge or larger defects, the photographing distance can be extended beyond 10 m while maintaining a resolution of at least 1 mm per pixel. Furthermore, to avoid an overly homogeneous dataset, this study also selects 583 images from the publicly available CODEBRIM (Concrete Defect Bridge Image dataset) [36], along with an additional 1006 crack images. In total, we collect 2860 bridge surface defect images. Considering that the sample size is still insufficiently rich, data augmentation techniques are employed to expand the dataset and enhance the model’s generalization capability. Firstly, to improve the model’s adaptability to variations in target positioning, random horizontal or vertical translations of objects within images are applied as a form of data augmentation. Secondly, to assist the model in better recognizing targets from different angles, images are rotated within a specified angular range. Additionally, to simulate target detection scenarios under varying lighting conditions, adjustments are made to image brightness. Finally, in order to replicate potential disturbances encountered in real-world settings, random noise is added to the images. Through these data augmentation techniques—translation, rotation, noise addition, and brightness adjustment—a dataset comprising 8043 images of bridge surface defects is established. The types of defects include honeycombing, pitting, holes, wear-related damages, as well as cracks and exposed reinforcement. The sample distribution is relatively balanced to meet the experimental requirements.
In addition, to enhance the comparability of the experimental results, the dataset is randomly divided into training and testing sets in an 80:20 ratio. In terms of hardware, the experiments are conducted on a 64-bit Windows 10 operating system, utilizing an AMD EPYC 7352 CPU and an NVIDIA GeForce RTX 3090 GPU, along with an AMD Ryzen 9 3950X 16-Core Processor running at 3.49 GHz and equipped with 64 GB of RAM. The deep learning framework employed for this study is PyTorch 2.0.1, with programming carried out using Python 3.7 software. Furthermore, the hyperparameter settings used in the experiments are presented in Table 1.
During the experimental process, it is essential to ensure that the testing environment remains constant. The YOLOv7-Tiny algorithm and the improved YOLOv7-Tiny-DBB algorithm are trained using the same dataset. Based on the training results, an analysis of the evaluation metrics is conducted. Subsequently, the effectiveness of the proposed method is validated through testing on a dataset. A comparative analysis of the test results is conducted to evaluate the performance of the improved algorithm.

4.2. Performance Evaluation Metrics

The performance metrics of the experimental model include precision (P), recall (R), the harmonic mean of the precision and recall known as the F1 score, and mean Average Precision (mAP) [37,38]. Additionally, the speed of the model in detecting bridge defects is assessed by measuring the inference time per image and the Frames Per Second (FPS) to determine whether it could meet the standards required for industrial applications.
The formulas for calculating precision (P) and recall (R) are presented in Equations (7) and (8), respectively.
Precesion = TP TP + FP
Recall = TP TP + FN
In the formula: TP denotes the number of correctly detected diseases; FP represents the number of falsely detected diseases; FN indicates the number of undetected diseases.
The F1 score is the harmonic mean of precision and recall, calculated according to Equation (9).
F 1 = 2 PR P + R
The mean Average Precision (mAP), as illustrated in Equation (10), represents the average of the Average Precision (AP) values across all categories. It reflects the trends in precision and recall rates.
mAP = i = 0 1 AP i n 1 n i = 0 1 0 1 P R d R
In the equation, n denotes the number of target classes.
The mean Average Precision (mAP) includes both mAP@0.5 and mAP@0.5:0.95. Specifically, mAP@0.5 indicates the average mAP when the threshold exceeds 0.5, reflecting the trends in precision and recall rates. On the other hand, mAP@0.5:0.95 represents the average mAP across various Intersection over Union (IoU) thresholds ranging from 0.5 to 0.95 with a step size of 0.05; a higher value of mAP@0.5:0.95 signifies stronger boundary regression capabilities of the model and a greater degree of alignment between predicted bounding boxes and ground truth annotations.
“FPS” refers to the number of images that a network model can detect per second, which indicates the detection speed of the network.
FPS = NumFigure TotalTime
In the equation, NumFigure denotes the total number of images detected; TotalTime represents the overall inference time.

4.3. Experimental Results and Analysis

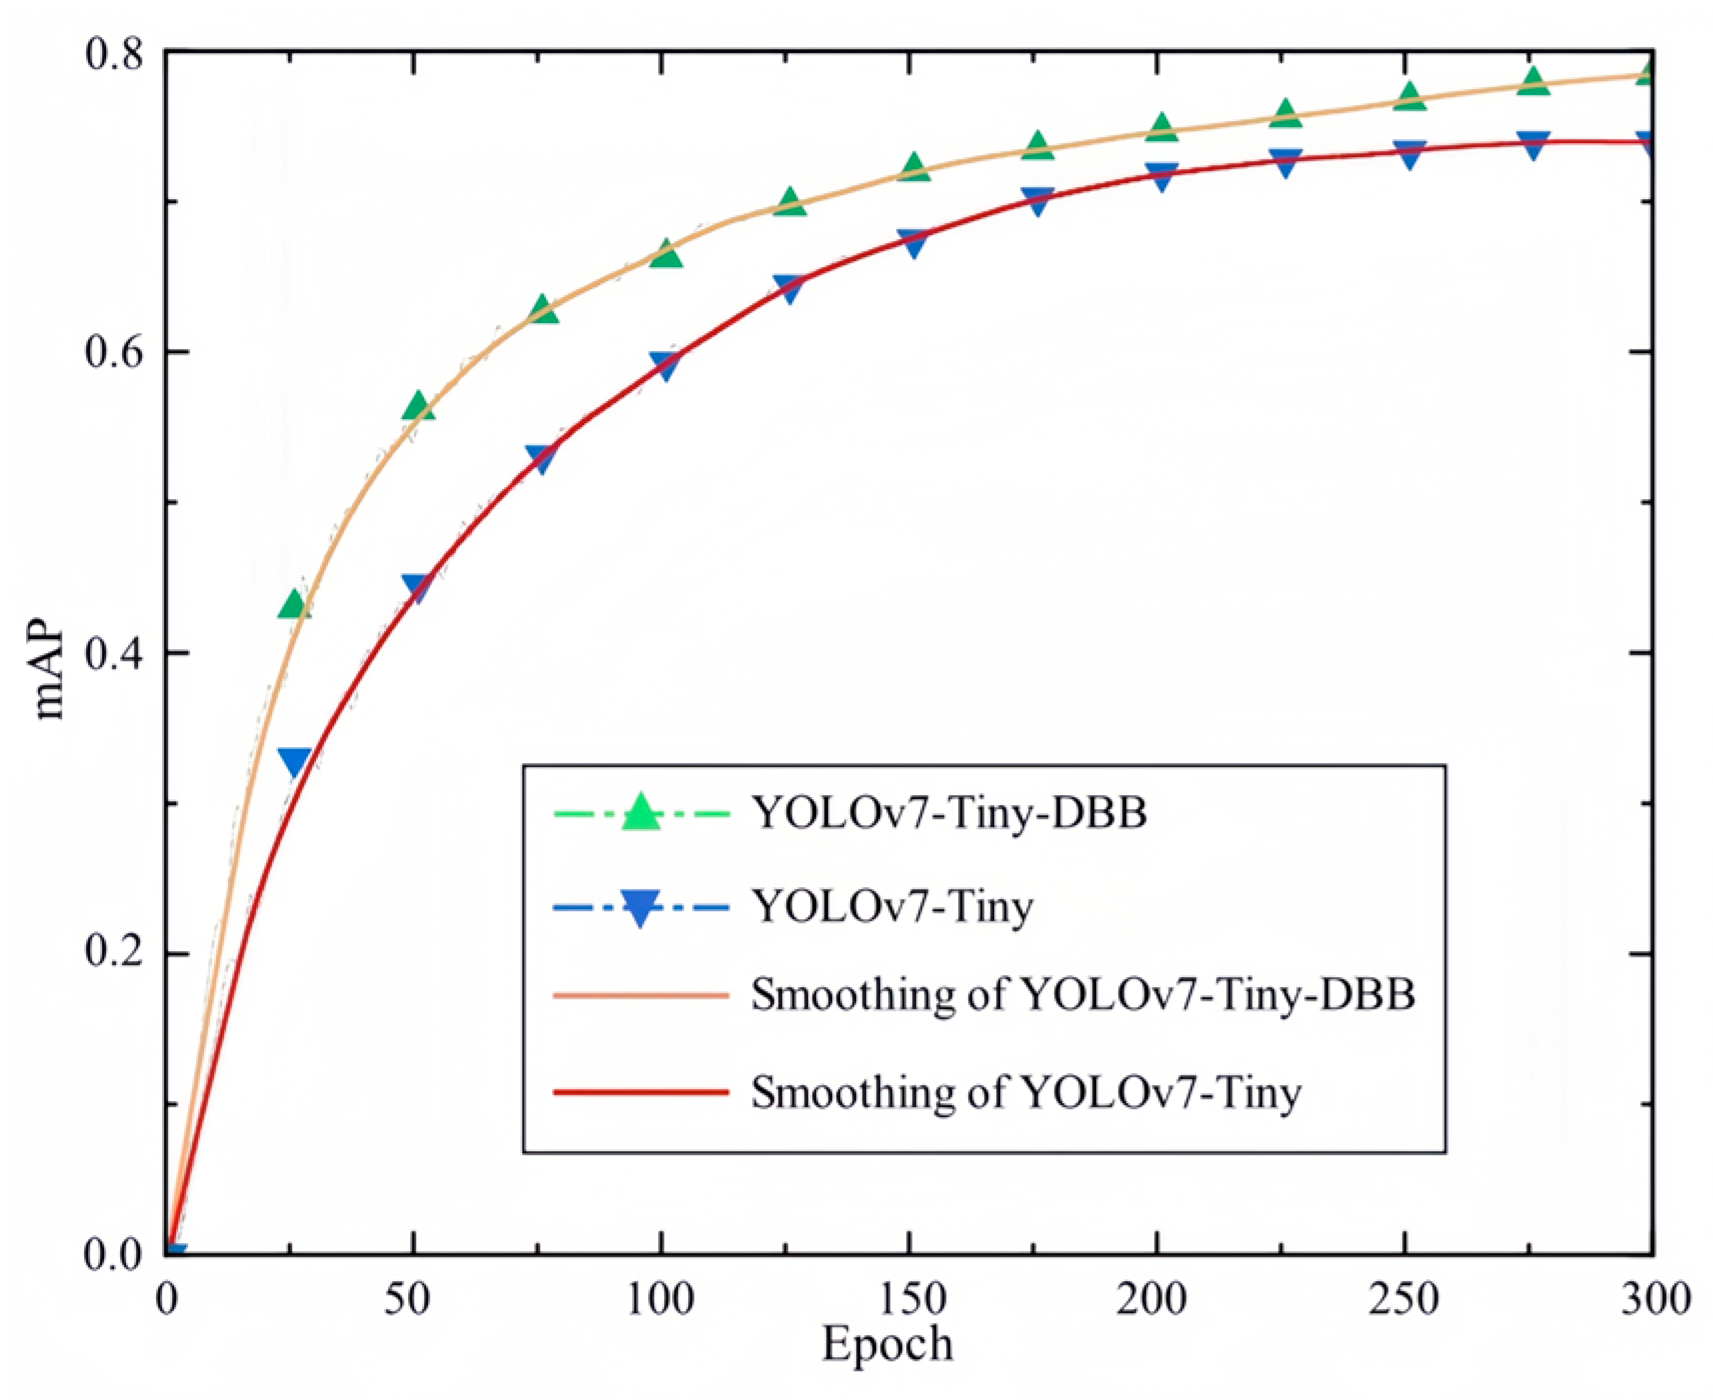
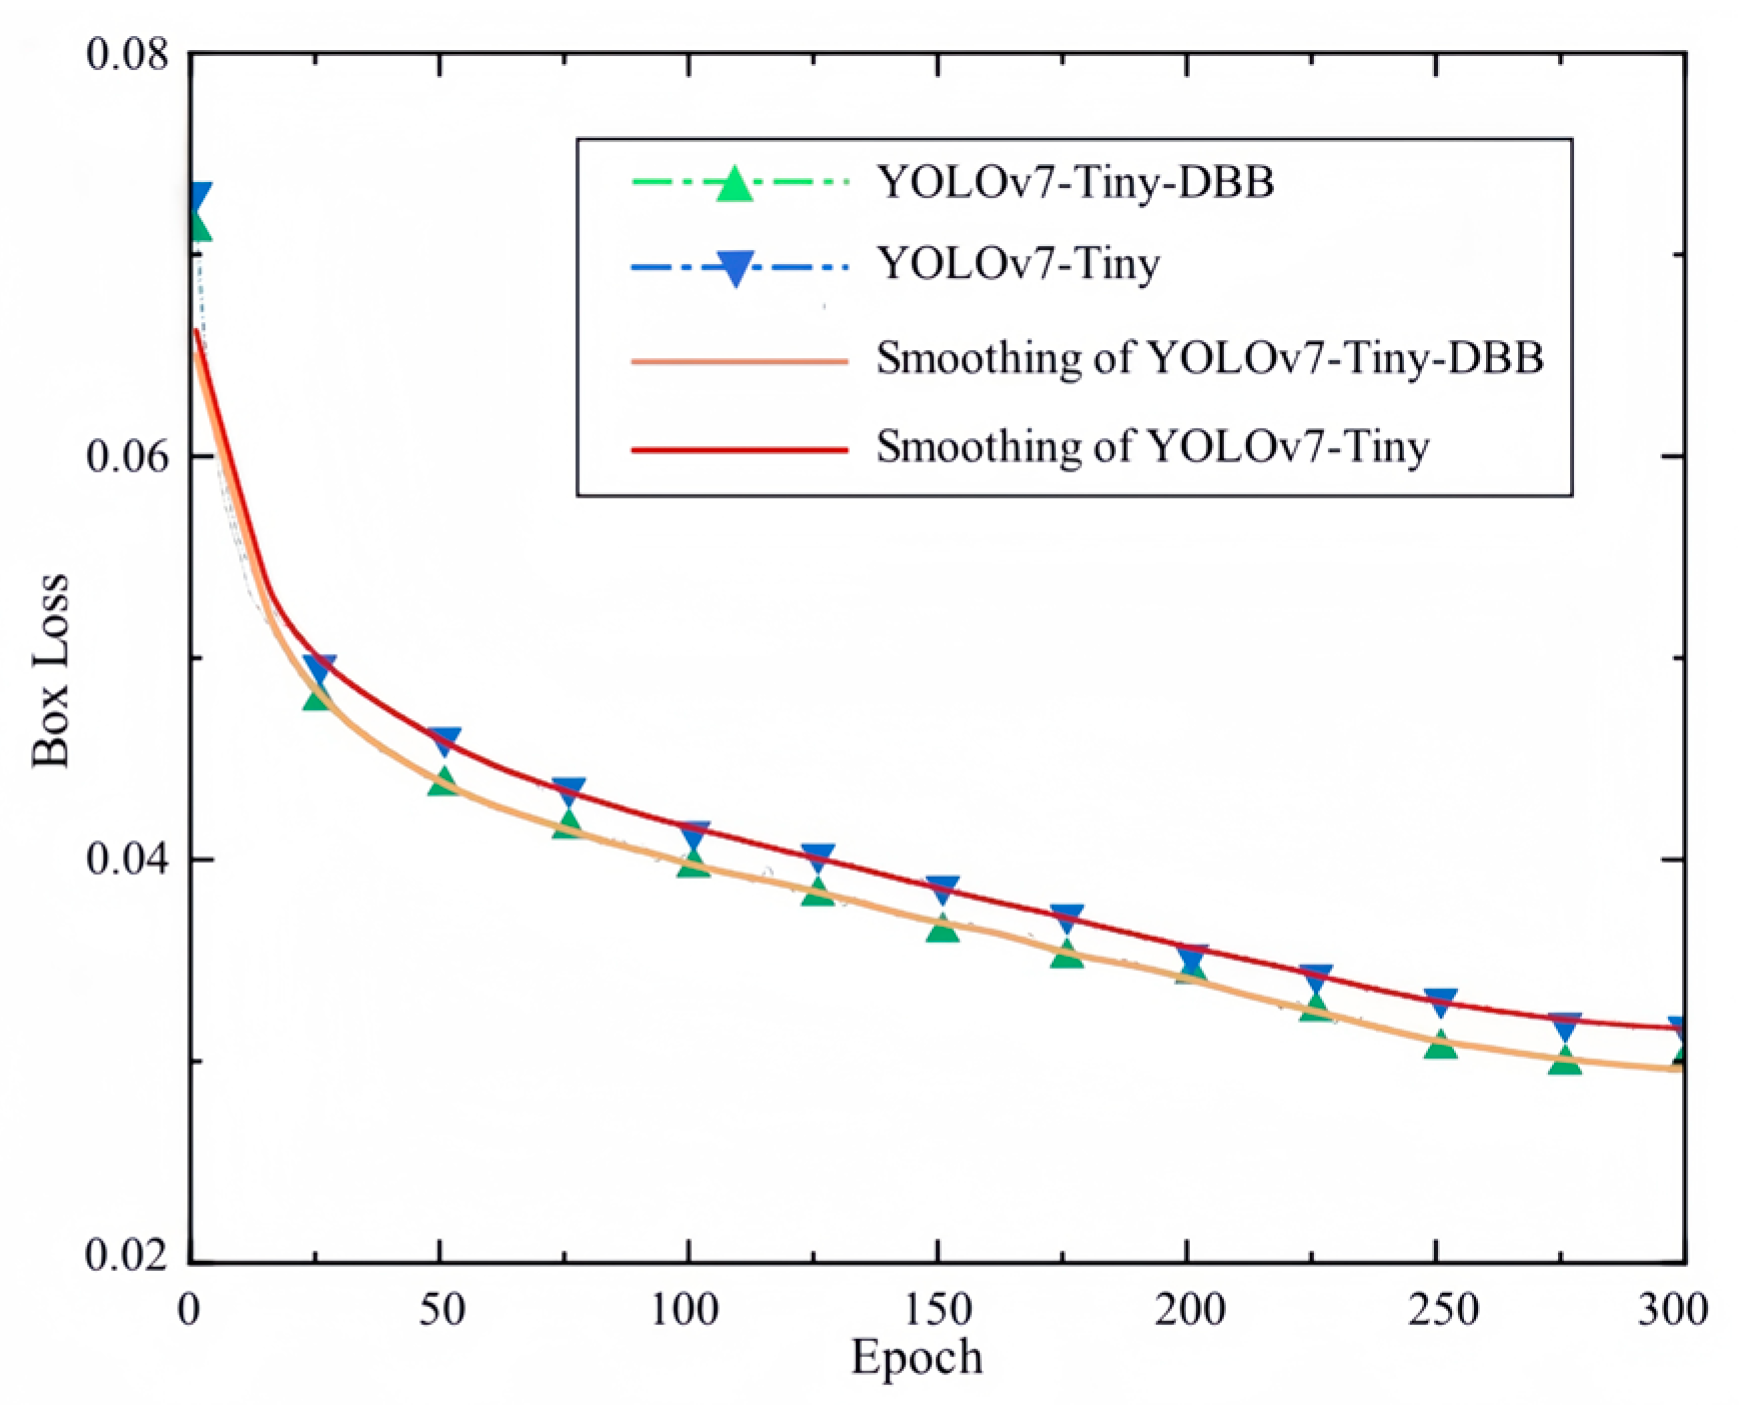
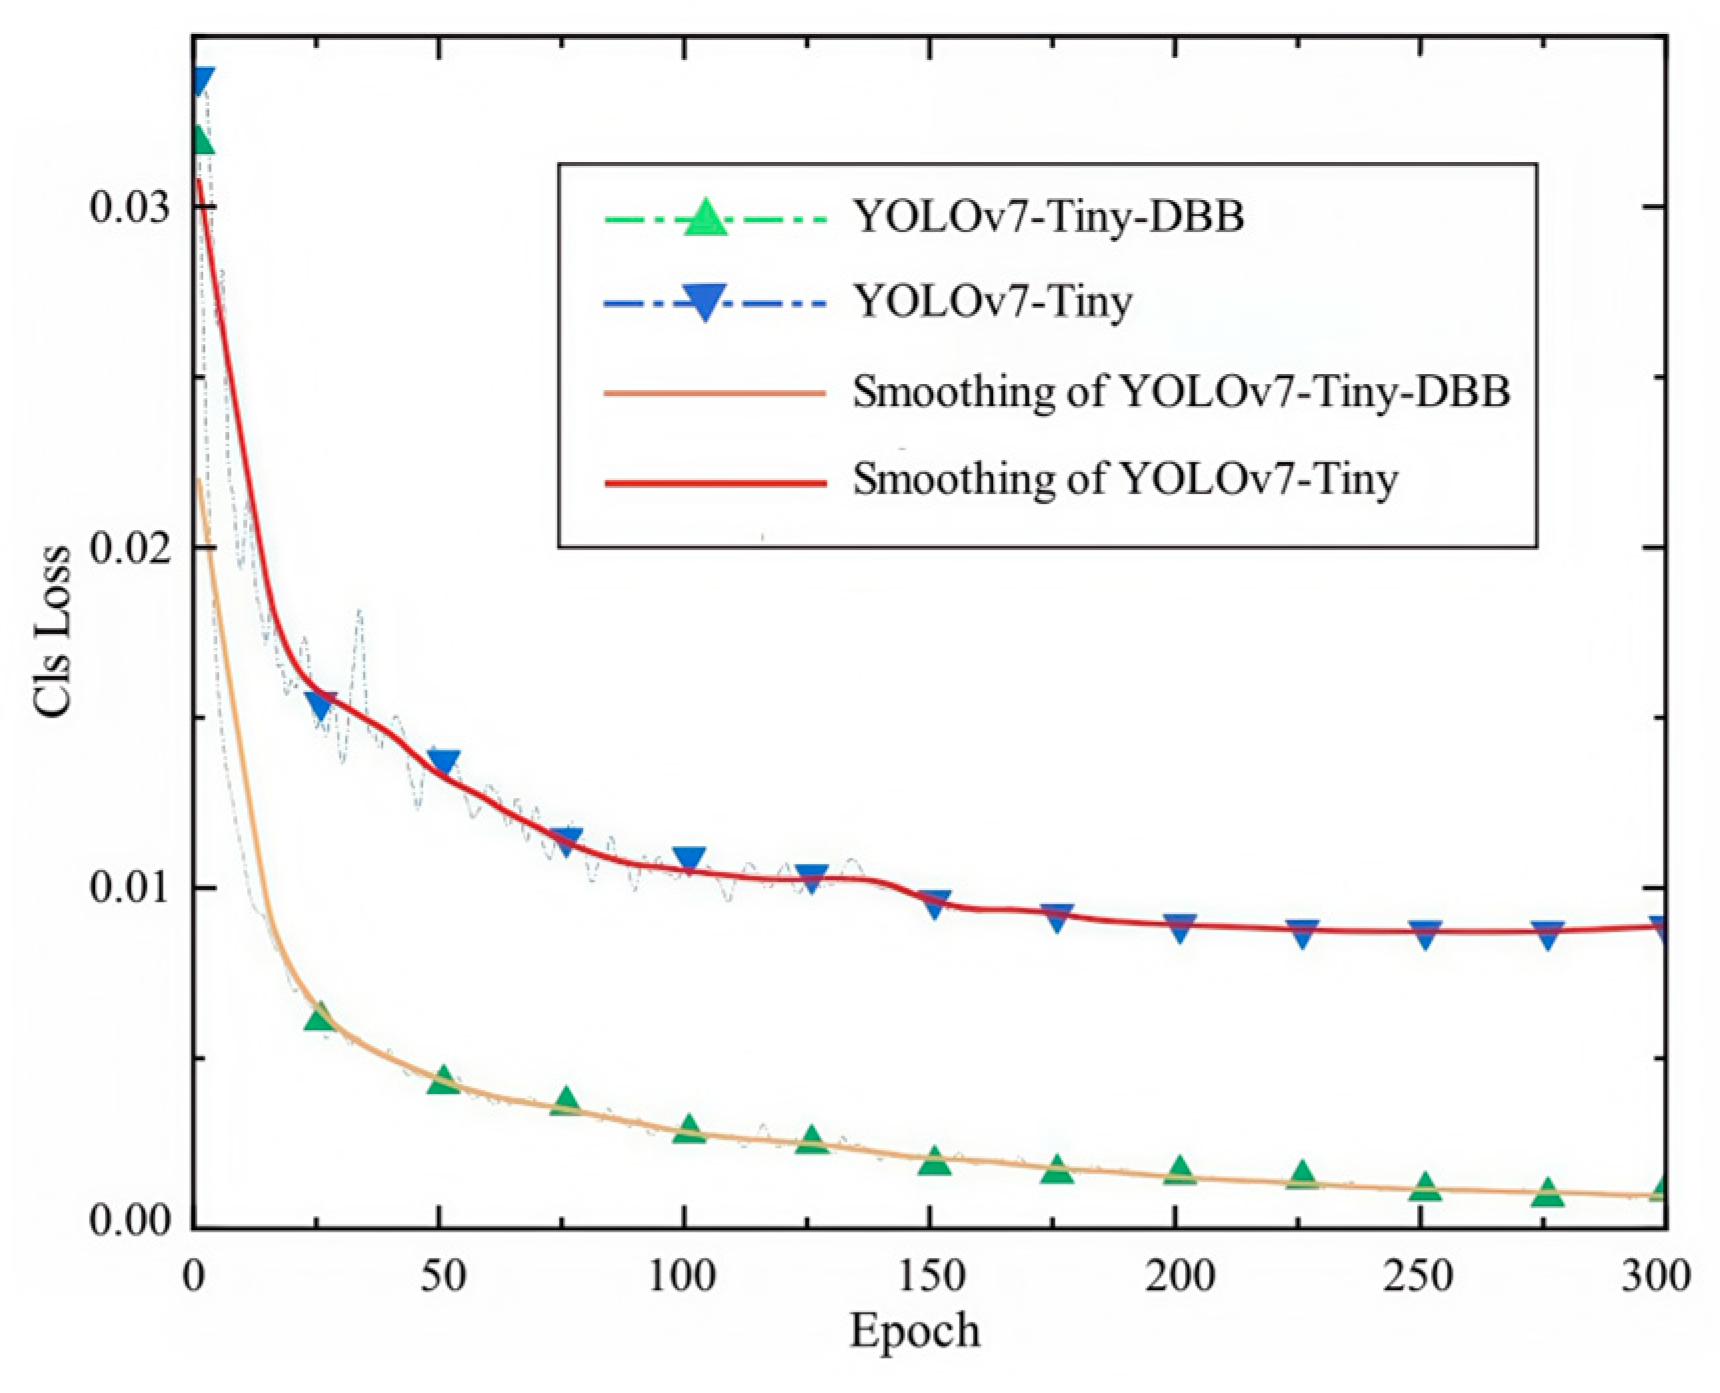
4.3.1. Analysis of the Training Results of the Improved Algorithm

The two models before and after the improvement are trained separately for 300 epochs. The training results are analyzed and compared based on precision, recall, and mean Average Precision (mAP) metrics, as illustrated in Figure 8, Figure 9 and Figure 10.
Based on Figure 8 and Figure 9, it can be observed that as the number of iterations increase, both models exhibit an upward trend in the precision and recall rates. However, from the precision comparison curve in Figure 8, it is evident that the improved YOLOv7-Tiny-DBB algorithm demonstrate a significant increase during the first 100 iterations. After reaching 100 iterations, this upward trend begins to plateau and gradually stabilize. Throughout the entire training iteration process, the YOLOv7-Tiny-DBB algorithm consistently outperform the YOLOv7-Tiny algorithm. Furthermore, as illustrated by the recall comparison curve in Figure 9, it is clear that the recall rate of the YOLOv7-Tiny-DBB algorithm remains consistently higher than that of the YOLOv7-Tiny algorithm.
Considering the trends in the precision and recall, it can be observed from Figure 10 that throughout the entire iteration process, the mAP curve of the YOLOv7-Tiny-DBB algorithm is significantly higher than that of the YOLOv7-Tiny algorithm. This difference is particularly pronounced during the first 150 iterations. Subsequently, both algorithms exhibit a slowdown in their upward trend and gradually stabilize. The comparison indicates that by replacing the ELAN-Tiny module in YOLOv7-Tiny with the DBB module, the improved algorithm enhances multi-scale extraction of bridge damage information, thereby facilitating better learning of bridge damage features and demonstrating superior learning capability.
The loss function is a mathematical construct used to quantify the degree of discrepancy between an algorithm’s predicted values and the actual values. Generally, a smaller value of the loss function indicates better performance of the algorithm in terms of detection capabilities. The loss functions before and after the algorithm improvement are illustrated in Figure 11.
From Figure 11, it can be observed that as the number of iterations increased, both algorithms exhibit an overall decreasing trend in their loss functions. Throughout the training phase, the loss regression performance of the improved YOLOv7-Tiny-DBB algorithm consistently outperform that of the YOLOv7-Tiny algorithm. Notably, during the first ten iterations, the loss functions of both algorithms are nearly overlapping; however, after twenty-five iterations, the advantages of the improved algorithm gradually become apparent. This indicates that by replacing the original loss function with MPDIoU, the algorithm demonstrates effective boundary box regression predictions and enhances prediction accuracy.

4.3.2. Analysis of the Testing Results for the Improved Algorithm

In order to validate the detection performance of the improved YOLOv7-Tiny-DBB algorithm, a test set is employed for evaluation, yielding numerical values for various performance metrics, as presented in Table 2.
Through Table 2, it can be observed that the improved YOLOv7-Tiny-DBB algorithm demonstrates a significant enhancement in detecting surface diseases of bridges compared to the YOLOv7-Tiny algorithm. The precision of YOLOv7-Tiny-DBB is 77.2%, with a recall rate of 75.5% and an F1 score of 76.3%. The mean Average Precision (mAP) reaches 80.6%. In comparison to the original YOLOv7-Tiny algorithm, these metrics show improvements of 4.2%, 6.5%, 5.4%, and 7.3%, respectively, with the most notable increase being in the mean Average Precision value. This indicates that the detection performance of the improved YOLOv7-Tiny-DBB algorithm is clearly superior to that of the YOLOv7-Tiny algorithm.
Furthermore, the Average Precision (AP) metric can assess the detection accuracy of the algorithm for each category. As shown in Table 2, the detection performance for crack-related defects is the best, with an AP value of 88.0% achieved by the improved algorithm, representing a 2.5% increase compared to the original algorithm. The AP value for damage-related defects reached 80.1%, reflecting a significant improvement of 9.7%. Although this category encompasses various types, such as honeycombing, rough surfaces, voids, wear, and spalling of surface layers, the introduction of the DBB module enable better learning of feature information related to target objects, resulting in commendable detection performance. In contrast, regarding rebar-exposed defects—which typically occur alongside damage-related defects and exhibit considerable size variation—the AP value has increased; however, their detection accuracy remains relatively low.
The performance comparison of the improved algorithm and other algorithm is presented in Table 3.
Through Table 3, it can be observed that the Faster R-CNN algorithm required thousands of forward propagations through a convolutional neural network to perform object detection due to the extraction of over a thousand proposal regions from each image. Consequently, the amount of parameters processed is excessively large, reaching 286.16 M, which results in relatively slow processing speeds and a lower mean Average Precision (mAP) value in this experimental outcome. In contrast, the SSD algorithm significantly reduces computational load compared to the Faster R-CNN and decreases parameter count by 35.4% when compared to YOLOv7; however, its mAP value remains low and necessitates further improvements. Furthermore, compared to YOLOv7-Tiny, the improved algorithm exhibits an increase in both the number of layers and parameters during the training phase. The floating-point operations reach a total of 17.9 GFLOPS; however, this remains significantly lower than the parameter count and computational load associated with YOLOv7. This reduction can be attributed to the introduction of the multi-branch DBB module. The module also employs structural reparameterization, resulting in a 3.46% reduction in parameter count and a 6.47% decrease in floating-point operations during the inference phase. The mean Average Precision (mAP) reaches 80.6%, representing an improvement of 9.96%. Additionally, the detection speed is enhanced, making the improved algorithm particularly suitable for deployment on edge devices.
In order to further evaluate the performance of the improved algorithm during testing, the classification regression results before and after the improvement are compared by analyzing the variations in the classification loss function, as illustrated in Figure 12.
The analysis of the brown-yellow curve in Figure 12 indicates that the use of the MPDIoU loss function significantly reduces classification loss for small target objects in real-world scenarios, thereby enhancing performance. This approach effectively addresses the limitations associated with traditional CIoU loss functions, resulting in improved detection accuracy for the enhanced prediction algorithm.
In order to validate the effectiveness of improvements made to the YOLOv7-Tiny-DBB algorithm, three groups of ablation experiments are designed under identical experimental conditions. The numbers in Table 4 denote the following: 1 represents the utilization of the YOLOv7 algorithm, 2 indicates the incorporation of only the DBB module, and 3 signifies the improved YOLOv7-Tiny-DBB algorithm. The results are presented in Table 4. In this table, “√” indicates the use of the improved method, while “×” signifies that the improved method is not employed.
According to Table 4, after applying the improved algorithm with the DBB module, the inference time for a single image is reduced by 4.7 ms, and the frames per second (FPS) increases by 12.7 FPS. This indicates an acceleration in inference speed. The DBB module demonstrates excellent feature extraction capabilities, resulting in a 6.1% improvement in mean Average Precision (mAP), thereby enhancing detection performance. Furthermore, replacing the loss function CIoU with MPDIoU led to more stable regression predictions of bounding boxes within the detection algorithm, which contributes to an increase in prediction accuracy. The mAP improves by 1.2%, indicating that the MPDIoU loss function effectively reduces instances of missed detections and enables better identification of surface defects on bridges. Additionally, the system achieves a detection rate of 59.2 FPS, which essentially meets the real-time detection requirements and further validates the effectiveness of the proposed improvements.

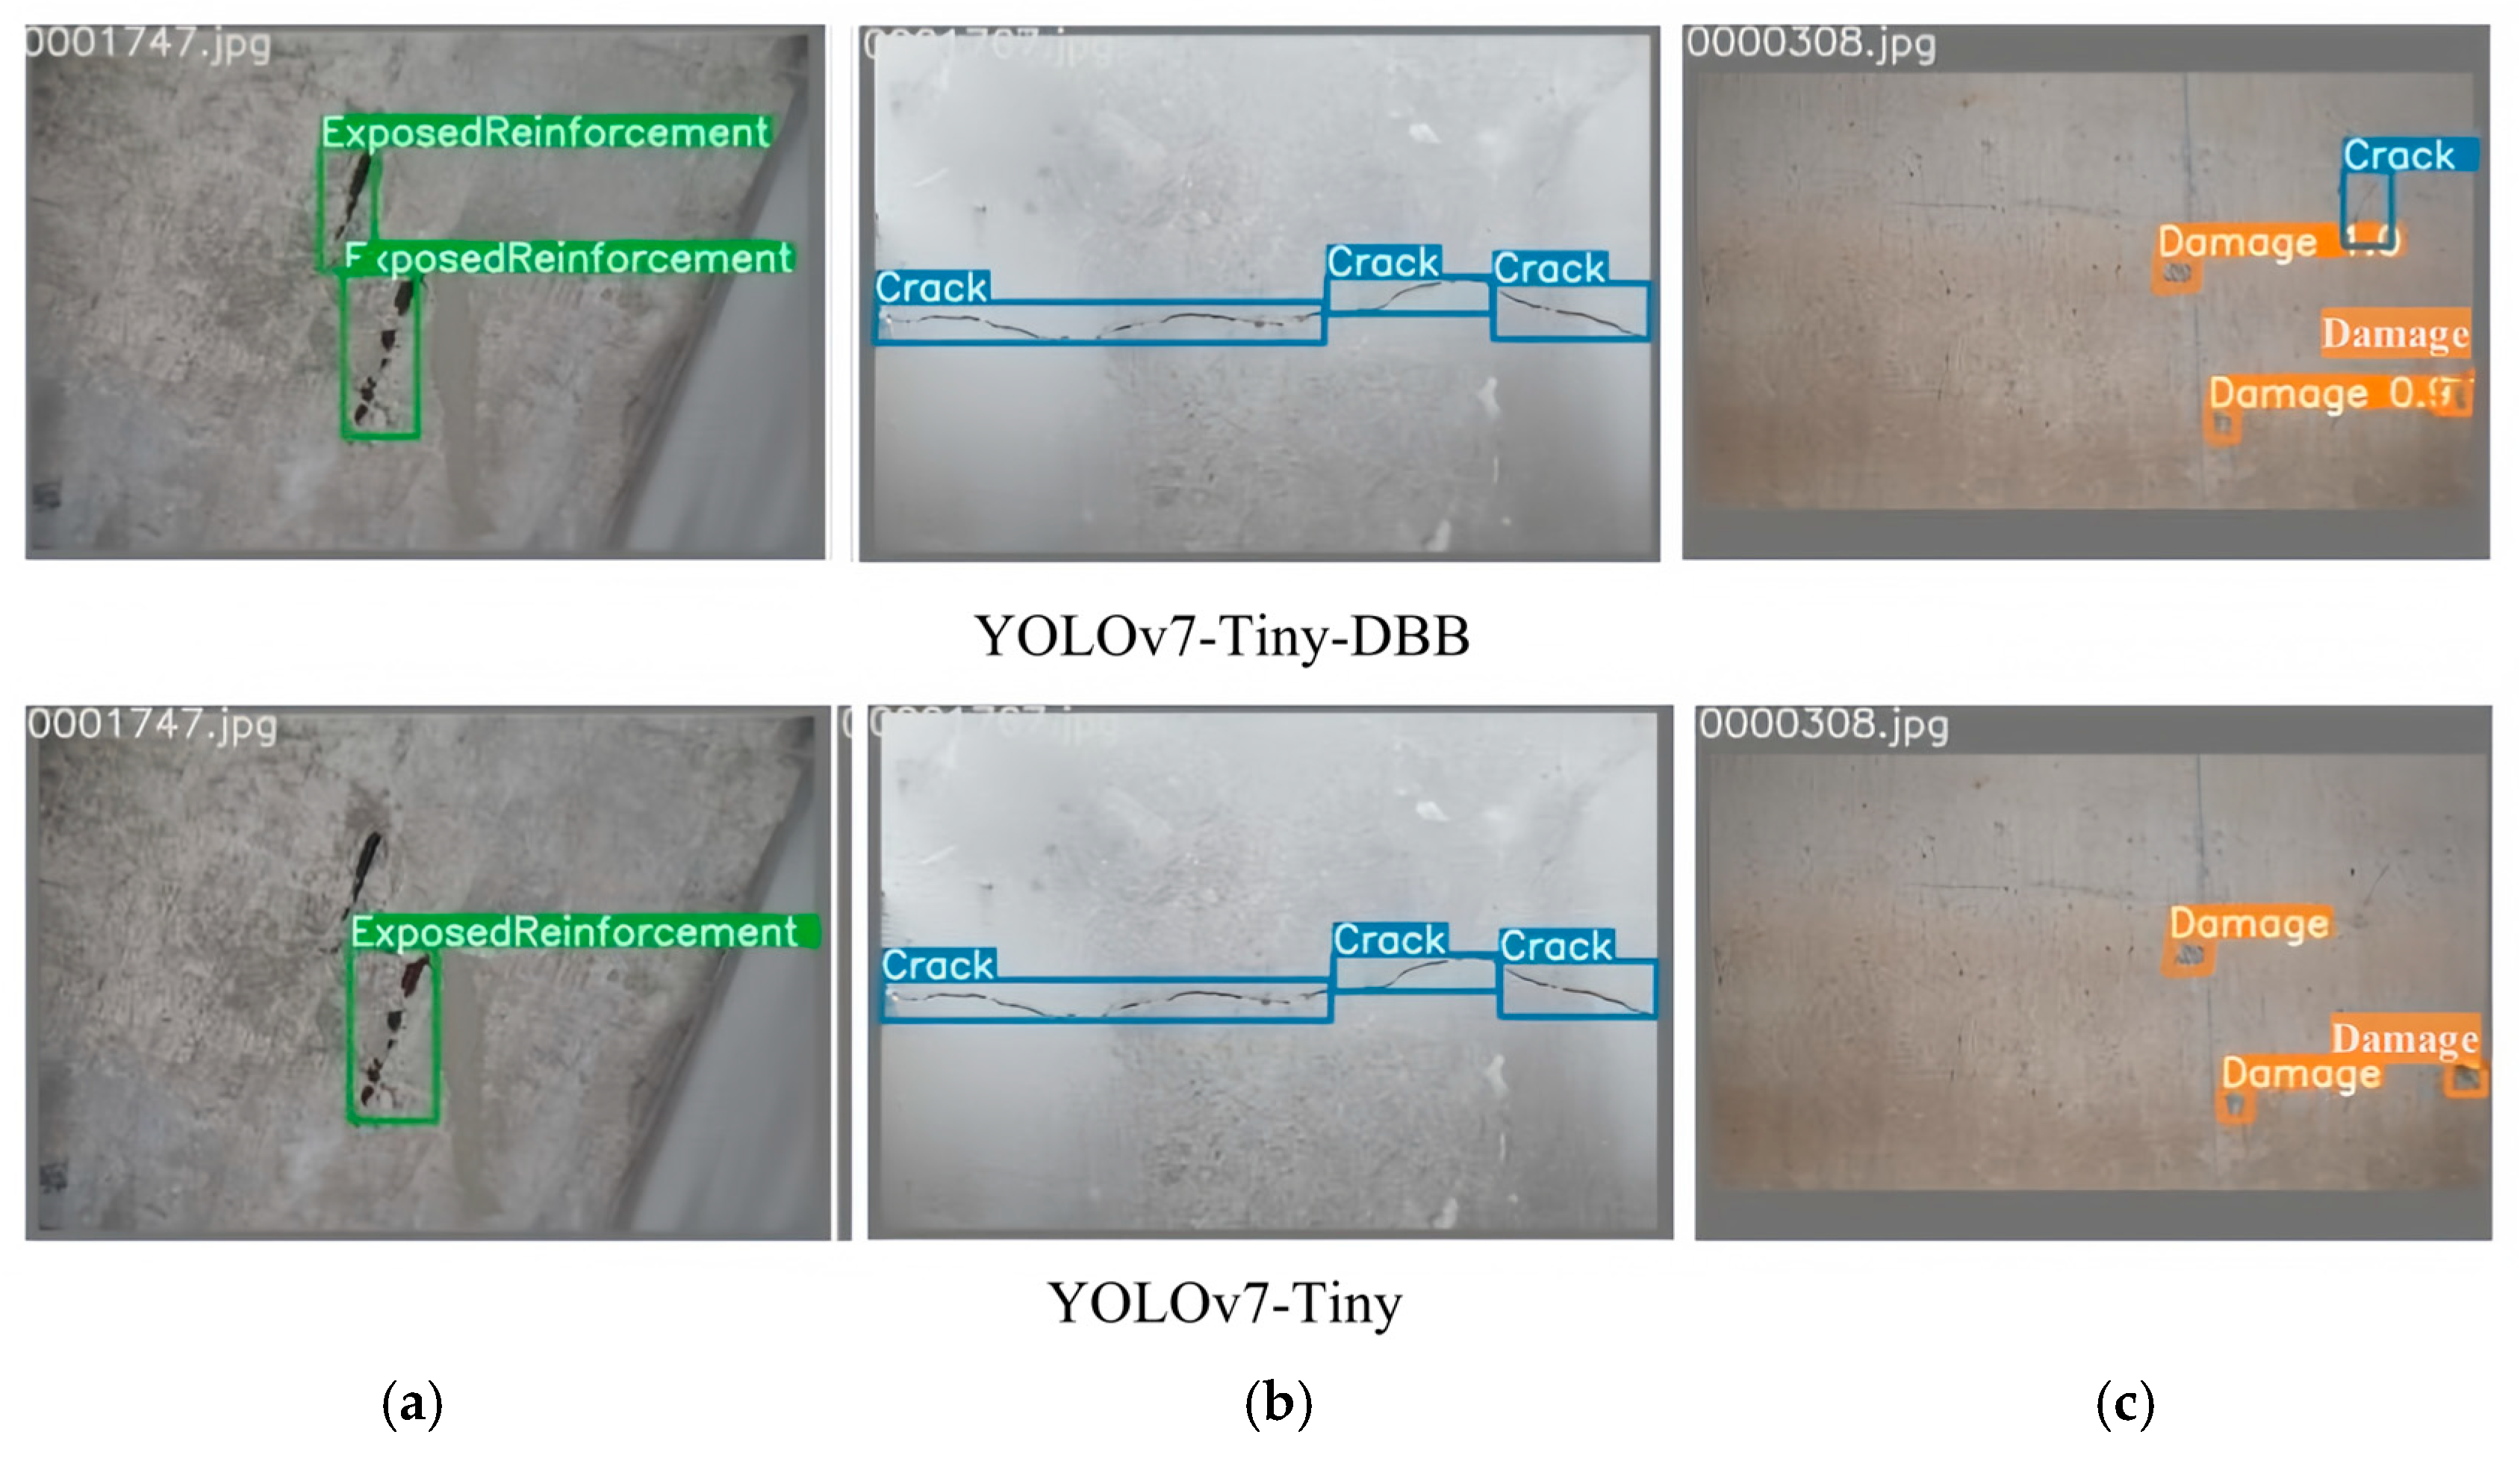
4.3.3. Visualization Effects of Bridge Diseases Detection Before and After Algorithm Improvement

The detection of bridge defects is conducted by randomly selecting three images, with the results illustrated in Figure 13.
As illustrated in Figure 13, the detection performance of the YOLOv7-Tiny-DBB algorithm (upper) and the YOLOv7-Tiny algorithm (lower) for bridge exposure diseases, ordinary crack damage, and minor crack damage is presented.
Through comparison, it can be observed that the YOLOv7-Tiny algorithm exhibits omission phenomena in the detection of the exposed reinforcement and the fine crack diseases, as illustrated in Figure 13a,c, resulting in suboptimal detection performance. In contrast, the improved algorithm demonstrates a more accurate identification of various types of bridge diseases. Additionally, this enhanced algorithm feature reduces complexity and strengthens regression prediction capabilities. Consequently, it has shown commendable detection performance on test samples, effectively identifying a greater number of subtle bridge ailments while minimizing instances of missed detections. Therefore, the improved algorithm proves to be an effective tool for detecting surface diseases in bridges.

5. Conclusions

Through comprehensive research, the bridge apparent disease detection algorithm is improved. Through self-made enhanced dataset test experiments, ablation experiments, visual effect detection and comparative result analysis, the following key conclusions are drawn:
(1)
In response to the problems posed by the diverse target types, variable morphological characteristics, numerous small sample targets, and a high likelihood of missed detections in bridge surface diseases, this study replaced the ELAN-Tiny module of the original YOLOv7-Tiny algorithm with a DBB module. Additionally, the traditional CIoU loss function had been replaced with a boundary box regression loss function based on MPDIoU. Based on this foundation, the improved YOLOv7-Tiny-DBB detection algorithm for the identification of surface defects in bridges had been proposed. This approach not only enriched the extraction of feature information but also enhanced regression prediction capabilities, effectively addressing the issue of missed detections encountered with the YOLOv7-Tiny algorithm.
(2)
The proposed improved YOLOv7-Tiny-DBB detection algorithm was effectively trained and tested using a self-constructed augmented dataset. The results indicated that the modified algorithm achieved an increase of 4.2% in precision, 6.5% in recall, 5.4% in F1 score, and 7.3% in mean Average Precision (mAP) compared to the original YOLOv7-Tiny algorithm. Additionally, the detection speed improved by 13.1 FPS, and further validation through ablation experiments confirmed the efficiency and effectiveness of the proposed improvements.
(3)
The improved YOLOv7-Tiny-DBB algorithm demonstrated a significant reduction in both the number of parameters and floating-point operations, resulting in enhanced detection speed and performance. Visualization tests indicated that the application of this improved algorithm effectively mitigated the risk of detecting the reinforcement exposure defects and the microcracks defects. This advancement provided a novel approach for deploying the real-time detection of surface diseases on bridges using industrial edge devices.
(4)
In future research, it is essential to further enhance the construction of datasets that capture the distribution of bridge defects under various challenging conditions. Additionally, comparisons and improvements with more advanced network models should be conducted to increase the effectiveness of this method. Building on this foundation, experimental studies on real-time detection of the apparent bridge defects using edge devices will be initiated.

Author Contributions

H.A.: Conceptualization, Data curation, writing—review and editing. Y.F.: Investigation, Methodology, Validation. Z.J.: Formal analysis, Supervision. M.L.: Methodology, writing—review and editing. All authors have read and agreed to the published version of the manuscript.

Funding

This research was funded by the Shanxi Science and Technology Project (201903D121176) and the Shanxi Province Youth Fund Project (202203021212306).

Institutional Review Board Statement

Not applicable.

Informed Consent Statement

Not applicable.

Data Availability Statement

The original contributions presented in this study are included in the article. Further inquiries can be directed to the corresponding author.

Conflicts of Interest

The authors declare no conflicts of interest.

References

  1. Worley, S.B.; Ervin, E.K. Health study of reinforced concrete test bridge with pier damage. ACI Struct. J. 2017, 4, 959–968. [Google Scholar]
  2. Jiang, Y.Y.; Liu, Y.; Zhou, X.Y. Grading diagnosis of beam bridge support separation disease within one cluster based on the difference in the probability density function of the measured data. Struct. Health Monit. 2023, 22, 3659–3676. [Google Scholar] [CrossRef]
  3. Gan, L.F.; Liu, H.; Yan, Y.; Chen, A.A. Bridge bottom crack detection and modeling based on faster R-CNN and BIM. IET Image Process. 2024, 18, 664–677. [Google Scholar]
  4. Xu, W.C. Vehicle load identification using machine vision and displacement influence lines. Buildings 2024, 14, 392. [Google Scholar] [CrossRef]
  5. Hurtado, A.C.; Alamdari, M.M.; Kim, E.A.; Chang, K.C.; Kim, W.C. A data-driven methodology for bridge indirect health monitoring using unsupervised computer vision. Mech. Syst. Signal Process. 2024, 210, 111109. [Google Scholar] [CrossRef]
  6. Song, F.; Liu, B.; Yuan, G.X. Pixel-Level crack identification for bridge concrete structures using unmanned aerial vehicle photography and deep learning. Struct. Control. Health Monit. 2024, 2024, 1299095. [Google Scholar]
  7. Phan, T.N.; Nguyen, H.H.; Ha, T.T.H.; Thai, H.T.; Le, K.H. Deep learning models for UAV-assisted bridge inspection: A YOLO benchmark analysis. In Proceedings of the 2024 International Conference on Advanced Technologies for Communications (ATC), Ho Chi Minh City, Vietnam, 17–19 October 2024; pp. 1–13. [Google Scholar]
  8. Schlonsak, R.; Schreiter, J.P. Bridge detection in autonomous shipping: A YOLOv8 approach with autodistill and grounded SAM. J. Phys. Conf. Ser. 2024, 2867, 012019. [Google Scholar]
  9. Ameli, Z.; Nesheli, S.J.; Landis, E.N. Deep learning-based steel bridge corrosion segmentation and condition rating using mask RCNN and YOLOv8. Infrastructures 2024, 9, 3. [Google Scholar]
  10. Wu, Y.J.; Shi, J.F.; Ma, W.X.; Liu, B. Bridge crack recognition method based on YOLOv5 neural network fused with attention mechanism. Int. J. Intell. Inf. Technol. 2024, 20, 1–25. [Google Scholar]
  11. Su, H.F.; Kamanda, D.B.; Han, T.; Guo, C.; Li, R.Z.; Liu, Z.L.; Su, F.Z.; Shang, L.H. Enhanced YOLO v3 for precise detection of apparent damage on bridges amidst complex backgrounds. Sci. Rep. 2024, 14, 8627. [Google Scholar] [CrossRef] [PubMed]
  12. Liu, Y.F.; Feng, C.Q.; Chen, W.L.; Fan, J.S. Review of bridge apparent defect inspection based on machine vision. China J. Highw. Transp. 2024, 37, 1–15. [Google Scholar]
  13. Liao, Y.N.; Yao, L. Bridge disease detection and recognition based on improved YOLOX algorithm. J. Appl. Opt. 2023, 44, 792–800. [Google Scholar]
  14. Wang, Y.L.; Zhang, Z.; Yin, H. Detection method of dense bridge disease targets based on SE-YOLOv3. J. Phys. Conf. Ser. 2020, 1544, 012141. [Google Scholar]
  15. Yu, Z.W.; Shen, Y.G.; Shen, C.K. A real-time detection approach for bridge cracks based on YOLOv4-FPM. Autom. Constr. 2021, 122, 103514. [Google Scholar]
  16. Zhang, Y.J.; Chen, X.; Yan, W.B. Automated intelligent detection system for bridge damages with Fractal-features-based improved YOLOv7. Signal Image Video Process. 2025, 19, 243. [Google Scholar]
  17. Ding, H.P.; Tang, Q.L. Optimization of the road bump and pothole detection technology using convolutional neural network. J. Intell. Syst. 2024, 33, 20240164. [Google Scholar]
  18. Carvalho, R.; Melo, J.; Graa, R.; Ricardo; Santos, G.; Vasconcelos, M.J.M. Deep learning-powered system for real-time digital meter reading on edge devices. Appl. Sci. 2023, 13, 2315. [Google Scholar]
  19. Samanta, A.; Hatai, I.; Mal, A.K. A survey on hardware accelerator design of deep learning for edge devices. Wirel. Pers. Commun. 2024, 137, 1715–1760. [Google Scholar]
  20. Ma, W.X.; Cai, Z.R.; Wang, C.; Lin, Y. Edge devices modulation recognition method based on lightweight hybrid neural network. Inf. Countermeas. Technol. 2024, 3, 83–94. [Google Scholar]
  21. Sun, F.L.; Li, Z.X.; Liang, Y.Q.; Dong, M.M.; Ge, G.Y. Detection of illegal manning of electric vehicles based on improved YOLOv5 algorithm and edge devices. Mod. Comput. 2023, 29, 1–11. [Google Scholar]
  22. Li, X.X.; Yuan, L.; Chen, X.L.; Chen, Y.P. Edge computing technology and system development of bridge smart detection. J. Hunan City Univ. (Nat. Sci.) 2021, 30, 1–5. [Google Scholar]
  23. Qin, L.M.; Xu, Z.; Wang, W.H.; Wu, X.F. YOLOv7-based intelligent weed detection and laser weeding system research: Targeting veronica didyma in winter rapeseed fields. Agriculture 2024, 14, 910. [Google Scholar] [CrossRef]
  24. Dapinder, K.; Neeraj, B.; Akanksha; Shashi, P. A swin-YOLO: Attention—Swin Transformers in YOLOv7 for air-to-air unmanned aerial vehicle detection. In Pattern Recognition; Springer: Cham, Switzerland, 2025; pp. 159–173. [Google Scholar]
  25. Wang, L.; Bai, J.X.; Wang, P.; Bai, Y. Research on pedestrian detection algorithm in industrial scene based on improved YOLOv7-tiny. IEEJ Trans. Electr. Electron. Eng. 2024, 19, 1203–1215. [Google Scholar]
  26. Xie, G.B.; Lin, S.Z.; Lin, Z.Y.; Wu, C.F.; Liang, L.H. Road defect detection algorithm based on improved YOLOv7-tiny. J. Graph. 2024, 45, 987–997. [Google Scholar]
  27. Fan, Q.; Yao, L.D.; Zhao, Y.; Li, H.M.; Chen, R.H. Lightweight traffic vehicle and pedestrian target detection algorithm based on improved YOLOv7-tiny. J. Yangzhou Univ. (Nat. Sci. Ed.) 2024, 27, 34–42. [Google Scholar]
  28. Li, Y.F.; Li, H. A novel real-time object detection method for complex road scenes based on YOLOv7-tiny. Clust. Comput. 2024, 27, 13379–13393. [Google Scholar]
  29. Zhang, L.; Zou, F.S.; Wang, X.F.; Wei, Z.Z.; Li, Y. Improved algorithm for YOLOX-S object detection based on diverse branch block (DBB). In Proceedings of the 2022 6th International Conference on Electronic Information Technology and Computer Engineering, Xiamen, China, 21–23 October 2022. [Google Scholar]
  30. Budiarsa, R.; Wardoyo, R.; Musdholifah, A. Face recognition with occluded face using improve intersection over union of region proposal network on Mask region convolutional neural network. Int. J. Electr. Comput. Eng. 2024, 14, 3256–3265. [Google Scholar]
  31. Cho, Y.J. Weighted intersection over union (wIoU) for evaluating image segmentation. Pattern Recognit. Lett. 2024, 185, 101–107. [Google Scholar]
  32. Xiong, C.; Zayed, T.; Jiang, X.; Alfalah, G.; Abelkader, E.M. A novel model for instance segmentation and quantification of bridge surface cracks—The YOLOv8-AFPN-MPD-IoU. Sensors 2024, 24, 4288. [Google Scholar] [CrossRef]
  33. Wang, J.X.; Liu, M.; Su, Y.H.; Yao, J.H.; Du, Y.R.; Zhao, M.H.; Lu, D.Z. Small target detection algorithm based on attention mechanism and data augmentation. Signal Image Video Process. 2024, 18, 3837–3853. [Google Scholar]
  34. Li, J.; Liu, S.; Chen, D.; Zhou, S.; Li, C. APD-YOLOv7: Enhancing sustainable farming through precise identification of agricultural pests and diseases using a novel diagonal difference ratio IOU loss. Sustainability 2024, 16, 8855. [Google Scholar] [CrossRef]
  35. Ma, S.L.; Xu, Y. MPDIoU: A loss for efficient and accurate bounding box regression. arXiv 2023, arXiv:2307.07662. [Google Scholar]
  36. Che, A.A.; Wang, C.; Lu, K.; Tao, T.; Wang, W.Y.; Wang, B. Multi-label classification for concrete defects based on efficientnetV2. In Advanced Intelligent Computing Technology and Applications; Springer: Singapore, 2024; pp. 37–48. [Google Scholar]
  37. Qiu, C.Q.; Tang, H.; Xu, X.X.; Liang, J.; Ji, J.; Shen, Y.J. Optimized strategies for vehicle detection in autonomous driving systems with complex dynamic characteristics. Eng. Res. Express 2025, 7, 015249. [Google Scholar]
  38. Huang, B.Q.; Wu, S.B.; Xiang, X.J.; Fei, Z.S.; Tian, S.H.; Hu, H.B.; Weng, Y.L. An improved YOLOv5s-based helmet recognition method for electric bikes. Appl. Sci. 2023, 13, 8759. [Google Scholar] [CrossRef]
  39. Zhang, Y.S.; Chen, G.D.; Lin, C.G.; Mou, H.L.; Xiong, H.N.; Lin, J.X. Research on bridge damage detection method based on YOLO-Bridge. J. Jiamusi Univ. (Nat. Sci. Ed.) 2024, 42, 13–17+91. [Google Scholar]
Figure 1. YOLOv7-Tiny network architecture.
Applsci 15 03626 g001
Figure 2. Reparameterization transformation diagram of the DBB.
Applsci 15 03626 g002
Figure 3. Schematic diagram of multi-scale convolution.
Applsci 15 03626 g003
Figure 4. Schematic diagram of the DBB network structure after integration.
Applsci 15 03626 g004
Figure 5. Schematic diagram of the loss function (LMPDIoU) calculation process.
Applsci 15 03626 g005
Figure 6. YOLOv7-Tiny-DBB network architecture.
Applsci 15 03626 g006
Figure 7. Examples of structural deficiencies in bridges. (a) Cracks. (b) Exposed rebar. (c) Micro-cracks. (d) Peeling. (e) Multiple diseases co-exist.
Applsci 15 03626 g007
Figure 8. Comparison of precision curves.
Applsci 15 03626 g008
Figure 9. Comparison of recall curves.
Applsci 15 03626 g009
Figure 10. The mAP curve of the training process for YOLOv7-Tiny and YOLOv7-Tiny-DBB algorithms.
Applsci 15 03626 g010
Figure 11. The loss function curves during the training process of the YOLOv7-Tiny and YOLOv7-Tiny-DBB algorithms.
Applsci 15 03626 g011
Figure 12. Comparison of the classification loss function curves between YOLOv7-Tiny and YOLOv7-Tiny-DBB algorithms.
Applsci 15 03626 g012
Figure 13. Comparison of the algorithm detection effects before and after improvement. (a) Exposure of reinforcement disease; (b) Common crack disease; (c) Microcracks disease.
Applsci 15 03626 g013
Table 1. Configuration of Experimental Hyperparameters.
ParameterInitialize Learning RateMomentumWeight DecayRefinement of Training EpochsBatch SizeImage Size
Value0.010.9370.000530016640*640
Table 2. Comparison of the algorithm performance before and after improvement.
AlgorithmPrecision
(%)
Recall
(%)
F1
(%)
AP (%)mAP
(%)
CrackDamageExposed Reinforcement
YOLOv7-Tiny73.069.070.985.570.464.073.3
YOLOv7-Tiny-DBB77.275.576.388.080.173.780.6
Table 3. Performance comparison of the different algorithms.
AlgorithmPhaseNumber of LayersParameter
Quantity/M
Floating-Point Arithmetic Numbers (GFLOPs)mAP
(%)
SSD
Ref. [39]
--24.28-58.9
Faster R-CNN
Ref. [39]
--286.16-52.1
YOLOv7-41537.62106.5-
YOLOv7-Tiny-2636.2313.973.3
YOLOv7-Tiny-DBBTraining phase3558.1117.9-
Inference Phase1726.0113.080.6
Table 4. Comparison of the ablation experiment results.
MethodologyDBB ModuleMPDIoUParameter Quantity/MGFLOPsmAP (%)Time per Picture (ms)FPS
1××6.2313.973.321.746.1
2×6.0113.079.417.058.8
36.0113.080.616.959.2
Disclaimer/Publisher’s Note: The statements, opinions and data contained in all publications are solely those of the individual author(s) and contributor(s) and not of MDPI and/or the editor(s). MDPI and/or the editor(s) disclaim responsibility for any injury to people or property resulting from any ideas, methods, instructions or products referred to in the content.

