Article

Research on Unmanned Aerial Vehicle Path Planning for Carbon Emission Monitoring of Land-Side Heavy Vehicles in Ports

School of Transportation and Logistics Engineering, Wuhan University of Technology, Wuhan 430063, China
*
Author to whom correspondence should be addressed.
Appl. Sci. 2025, 15(7), 3616; https://doi.org/10.3390/app15073616
Submission received: 5 February 2025 / Revised: 10 March 2025 / Accepted: 18 March 2025 / Published: 26 March 2025

Abstract

:
Climate change makes it necessary to implement precise carbon dioxide reduction measures, and establishing a port carbon dioxide emission inventory has become a key step in port management.However, the establishment of a port carbon emission inventory, while crucial for the execution of environmental policies, currently lacks effective monitoring and path planning schemes to support this process. To address these issues, we propose a path planning scheme for port-based carbon emission monitoring. The scheme analyzes the factors affecting the effectiveness of the scheme and establishes a hierarchy of these factors to optimize the monitoring path. Furthermore, a multi-objective path planning mathematical model is established in this article, introducing the optimal goals of economic and environmental costs to achieve the overall path planning objectives. Lastly, this paper focuses on the initial path planning problem of drone monitoring and proposes an improved A* algorithm (IEHA). The algorithm improves the search method of child nodes by eliminating nodes that collide with obstacles, thereby reducing the threat of path collisions. At the same time, the evaluation function is improved by introducing the average value and Gaussian distribution probability function into the heuristic function, enhancing the reliability of the evaluation function, reducing the length of the optimal path, and improving operational efficiency. In the simulation experiment results, the proposed algorithm outperforms A*, ACO, and IEA algorithms in optimizing path length, reducing collision points to ensure path safety, and robustness. This indicates that the proposed algorithm can effectively improve the path planning performance of drones in port carbon dioxide emission monitoring, providing an effective technical means for port carbon dioxide emission monitoring.

1. Introduction

The Intergovernmental Panel on Climate Change (IPCC) in its Sixth Assessment Report in 2023 noted that the global surface temperature from 2011 to 2022 was 1.1 °C higher than the 1850–1900 period, with land surface temperatures being higher than ocean surface temperatures. Furthermore, as a hub of economic activity, the operation of ports, including the movement of heavy vehicles, ships, and industrial equipment, has a significant environmental impact, exacerbating air pollution and carbon dioxide emissions in coastal areas. Ports are unique in terms of scale and complexity, with highly concentrated economic activities that generate substantial carbon dioxide emissions. In particular, the operation of heavy vehicles within ports is a major source of direct carbon dioxide emissions, making it a key focus for environmental management. Unlike other economic activities, ports are subject to strict environmental regulations and are often located in sensitive coastal ecosystems, further highlighting the need for accurate monitoring of carbon dioxide emissions. The unique characteristics of ports, such as their complex layout, dynamic operations, and high traffic volume of heavy vehicles, pose particular challenges for carbon dioxide emission monitoring. Traditional carbon dioxide emission monitoring methods, such as activity inventory models and energy consumption-based calculations, are often insufficient for capturing real-time emissions from these sources. Therefore, there is an urgent need for innovative solutions to provide accurate and timely data on port carbon dioxide emissions. This observation is attributed to human activities [1], primarily due to the warming caused by greenhouse gases, especially carbon dioxide and methane. With the rapid development of human society, over 80 % of global trade is transported via port terminals. In recent years, the automation of container ports has led to industrial upgrades, enhancing transportation efficiency but also posing environmental challenges. Port operations and related activities consume various resources such as water, electricity, coal, and land, and inevitably damage the urban environment. They have significantly exacerbated the deterioration of air quality in coastal areas [2]. According to the International Maritime Organization’s “Fourth IMO Greenhouse Gas Study 2020”, current shipping greenhouse gas emissions account for 2.89 % of the total global greenhouse gas emissions. Ports, as one of the main pillars of the shipping industry, have a substantial share in the overall environmental impact generated by maritime trade and activities [3].
As highlighted in the 2023 Emissions Gap Report by the United Nations Environment Program, the global temperature benchmarks are persistently being surpassed, with greenhouse gas emissions attaining unprecedented levels in 2022. The realm of global port emission regulation is marred by the lack of stringent emission reduction efforts from high-income, high-emission nations, coupled with an inadequate control over emission increments in low-income, low-emission countries, thereby exacerbating the discharge of port-related pollutants. The environmental challenges, including pollution at global ports, have precipitated a discord between port facilities and urban environments. In response, local governmental bodies and international entities have been instrumental in devising a spectrum of policies aimed at mitigating the emissions of CO 2 , SO X , NO 2 , and NH 3 from port operations, thereby curbing the progression of ocean acidification [4]. The array of extant port emission mitigation strategies encompasses several pivotal dimensions: fiscal incentives predicated on port considerations, optimization of energy consumption and transition, deployment of energy conservation and emission reduction technologies, institutionalization of carbon dioxide emission trading mechanisms, and stringent carbon dioxide emission monitoring and reporting protocols. The “Port Emissions Toolkit”, unveiled in 2018, advocates for the integration of port incentives aimed at low-emission vessels into strategic frameworks, a proposition that merits acknowledgment within the International Maritime Organization’s greenhouse gas mitigation strategy of the same year. Scholarly discourse posits that the cornerstone for targeted carbon dioxide reduction initiatives in ports hinges upon the formulation of a comprehensive carbon dioxide emission inventory [5,6,7].
Ports are required to initially quantify their carbon dioxide emissions. Thereafter, it is imperative to ascertain strategies for the mitigation of port-related emissions in an economically efficient manner. The strategic collaboration between the International Maritime Organization’s (IMO) GloMEEP energy efficiency project and the International Association of Ports and Harbors (IAPH) is facilitating the development of port emission inventories in select nations. The “Port Emissions Inventory Guide” published by the United States Environmental Protection Agency (EPA) in 2020, stipulates the necessity for precise data monitoring across a spectrum of vessels, cargo handling equipment, and terrestrial machinery within port confines, thereby demanding an expanded and refined scope for carbon dioxide emission monitoring objectives. Owing to the multiplicity and intricacy of port operations, the surveillance of carbon dioxide emissions at ports entails the aggregation and synthesis of diverse datasets. The deployment of an array of technologies and instruments is indispensable for this surveillance, posing challenges in demarcating the surveillance boundaries and ensuring precision [8]. Adherence to a plethora of international, national, and local legislative and regulatory frameworks is mandatory for the monitoring of carbon dioxide emissions at ports. The accurate delineation of carbon dioxide emission issues at ports presents a pressing challenge that warrants immediate resolution.
As of now, only Shandong Port in China has publicly released the “2020 Port Mobile Source Air Pollutants and Greenhouse Gas Emission Inventory” in 2022, which has propelled the assessment of China’s port system and the development of pollution reduction and carbon dioxide emission mitigation policies. Carbon dioxide emissions within ports encompass both direct and indirect emissions; the consumption of diesel and gasoline represents direct sources of carbon dioxide emissions, while purchased electricity and steam are indirect sources. The primary greenhouse gas in question is carbon dioxide [9]. Indirect carbon dioxide emissions are calculated through supply chain emission accounting by enterprises and government agencies within the port, using the carbon dioxide Emission Flow (CEF) tracking method [5], and can be more accurately determined based on input–output models and other analytical approaches [10]. However, there are currently issues with the precision of direct carbon dioxide emission measurements and the scope of monitoring, including the phenomenon of unaccounted emissions from certain sources. Against the backdrop of the aforementioned real carbon dioxide reduction imperatives and the policies proposed by the international community to safeguard the path of common human development, the demand for carbon dioxide emission inventories has increased. The need for more precise carbon dioxide emission monitoring data and a broader range of surveillance has accelerated research in the field of carbon dioxide emission monitoring.
Currently, the estimation of carbon dioxide emissions at ports primarily involves the quantification, statistical calculation, and monitoring of emissions from the port and its associated enterprises [11]. Emissions within the port are mainly attributed to vessels docked at the port, land vehicles within the port area, terminal equipment, and cargo handling machinery. Existing research has largely focused on the navigation process of ships; for instance, Lixin S and colleagues conducted air pollution monitoring studies on vessels sailing across vast sea areas using a verified and effective methodology [12]. Additionally, studies have been conducted on emissions during the berthing and departure of ships at ports, such as the work by Murcia et al. on monitoring emissions during the docking and undocking periods of ships at a specific port [13]. Due to the diverse characteristics of ports worldwide based on their usage and performance, it is not feasible to uniformly describe the proportion of emissions from different port areas. Building on the existing research, it is concluded that the main sources of land-based emissions at cargo ports originate from port operation vehicles and heavy vehicles entering the port area [14], while at passenger ports, the primary source of land-based emissions comes from electricity consumption. Currently, land-based transportation vehicles in ports are primarily subject to emission reduction measures, that involve the use of renewable energy to satisfy electricity needs and the optimization of port layouts. Research on carbon dioxide emission monitoring is categorized into non-real-time and real-time monitoring. Non-real-time monitoring of carbon dioxide emissions includes determination by activity-based inventory models, or by energy consumption types and quantities combined with traffic data for post-calculation [15]. Real-time monitoring focuses on the performance enhancement of fixed equipment [16,17]. This study selects drones equipped with pollution gas sensors as the monitoring entity. As a device capable of real-time monitoring of carbon dioxide emissions within ports, drones offer flexibility and efficiency, low operational costs, adaptability to hazardous environments, and real-time data collection. Currently, extensive research on the application of drones in fire rescue has been conducted, such as fire monitoring and reconnaissance, aerial release of firefighting agents, and search and rescue operations [18,19].
In recent years, research on the use of drones for atmospheric monitoring and real-time carbon dioxide emission monitoring has gradually commenced. For instance, Zhiqiang L et al., in their 2017 paper, involved the use of drones equipped with cameras and environmental air quality monitoring payloads to conduct atmospheric monitoring over targeted areas and their airspace [20]. Shunji X et al., in 2020, conducted research on drone monitoring of ship exhaust, refining the application of mobile monitoring platforms for ship exhaust [21]. In the realm of port shipping, in 2022, Lixin S et al. utilized ship-borne drones to monitor air pollution from vessels sailing across vast water areas [12]. However, there remain numerous issues to be addressed in research on drone monitoring of carbon dioxide emissions, such as the study of drone flight duration and endurance capabilities, air traffic control, and drone monitoring path planning. Compared to other mobile monitoring platforms, such as ground vehicles and ships, drones offer distinct advantages for port carbon dioxide emission monitoring. Firstly, drones can bypass ground obstacles and cover large areas quickly, which is particularly important in the complex environment of ports. Ground vehicles are restricted by predefined roads and pathways, while drones can navigate freely over terrain and obstacles. This allows them to reach emission sources more efficiently and conduct real-time monitoring without the constraints of fixed paths. Secondly, drones can operate in hazardous environments, such as near fuel storage zones or high-emission industrial areas, where human-operated vehicles may face safety risks. Thirdly, drones provide real-time emissions data, which is crucial for accurate and timely monitoring. Even within a two-dimensional (2D) simulation, this study demonstrates that drones can find more efficient monitoring paths than ground vehicles. This study applies drone monitoring technology to the land side of ports, proposing a new drone monitoring path scheme, targeting carbon dioxide emission monitoring of land-based transportation vehicles within port areas. By establishing a new path planning model and its algorithm, and conducting experimental simulations, it aims to provide ports with more accurate and extensive direct carbon dioxide emission data.
The contribution of this study can be summarized as follows. First, we propose a novel drone monitoring path planning scheme, which is an innovative path planning solution specifically designed for carbon dioxide emission monitoring on the land side of ports. A framework diagram of the proposed planning scheme is presented, which serves as a potential guideline for progressively improving port emission inventories and formulating environmental enhancement strategies. Second, this paper conducts data analysis on certain aspects involved in the overall scheme, and ultimately selects the initial drone monitoring path plan as a starting point for optimizing the path planning algorithm, resulting in the improved A* path planning algorithm presented. Multiple simulations were conducted, and comparisons made with traditional algorithms, demonstrating the superior performance of the algorithm refined in this study.

2. Problem Description

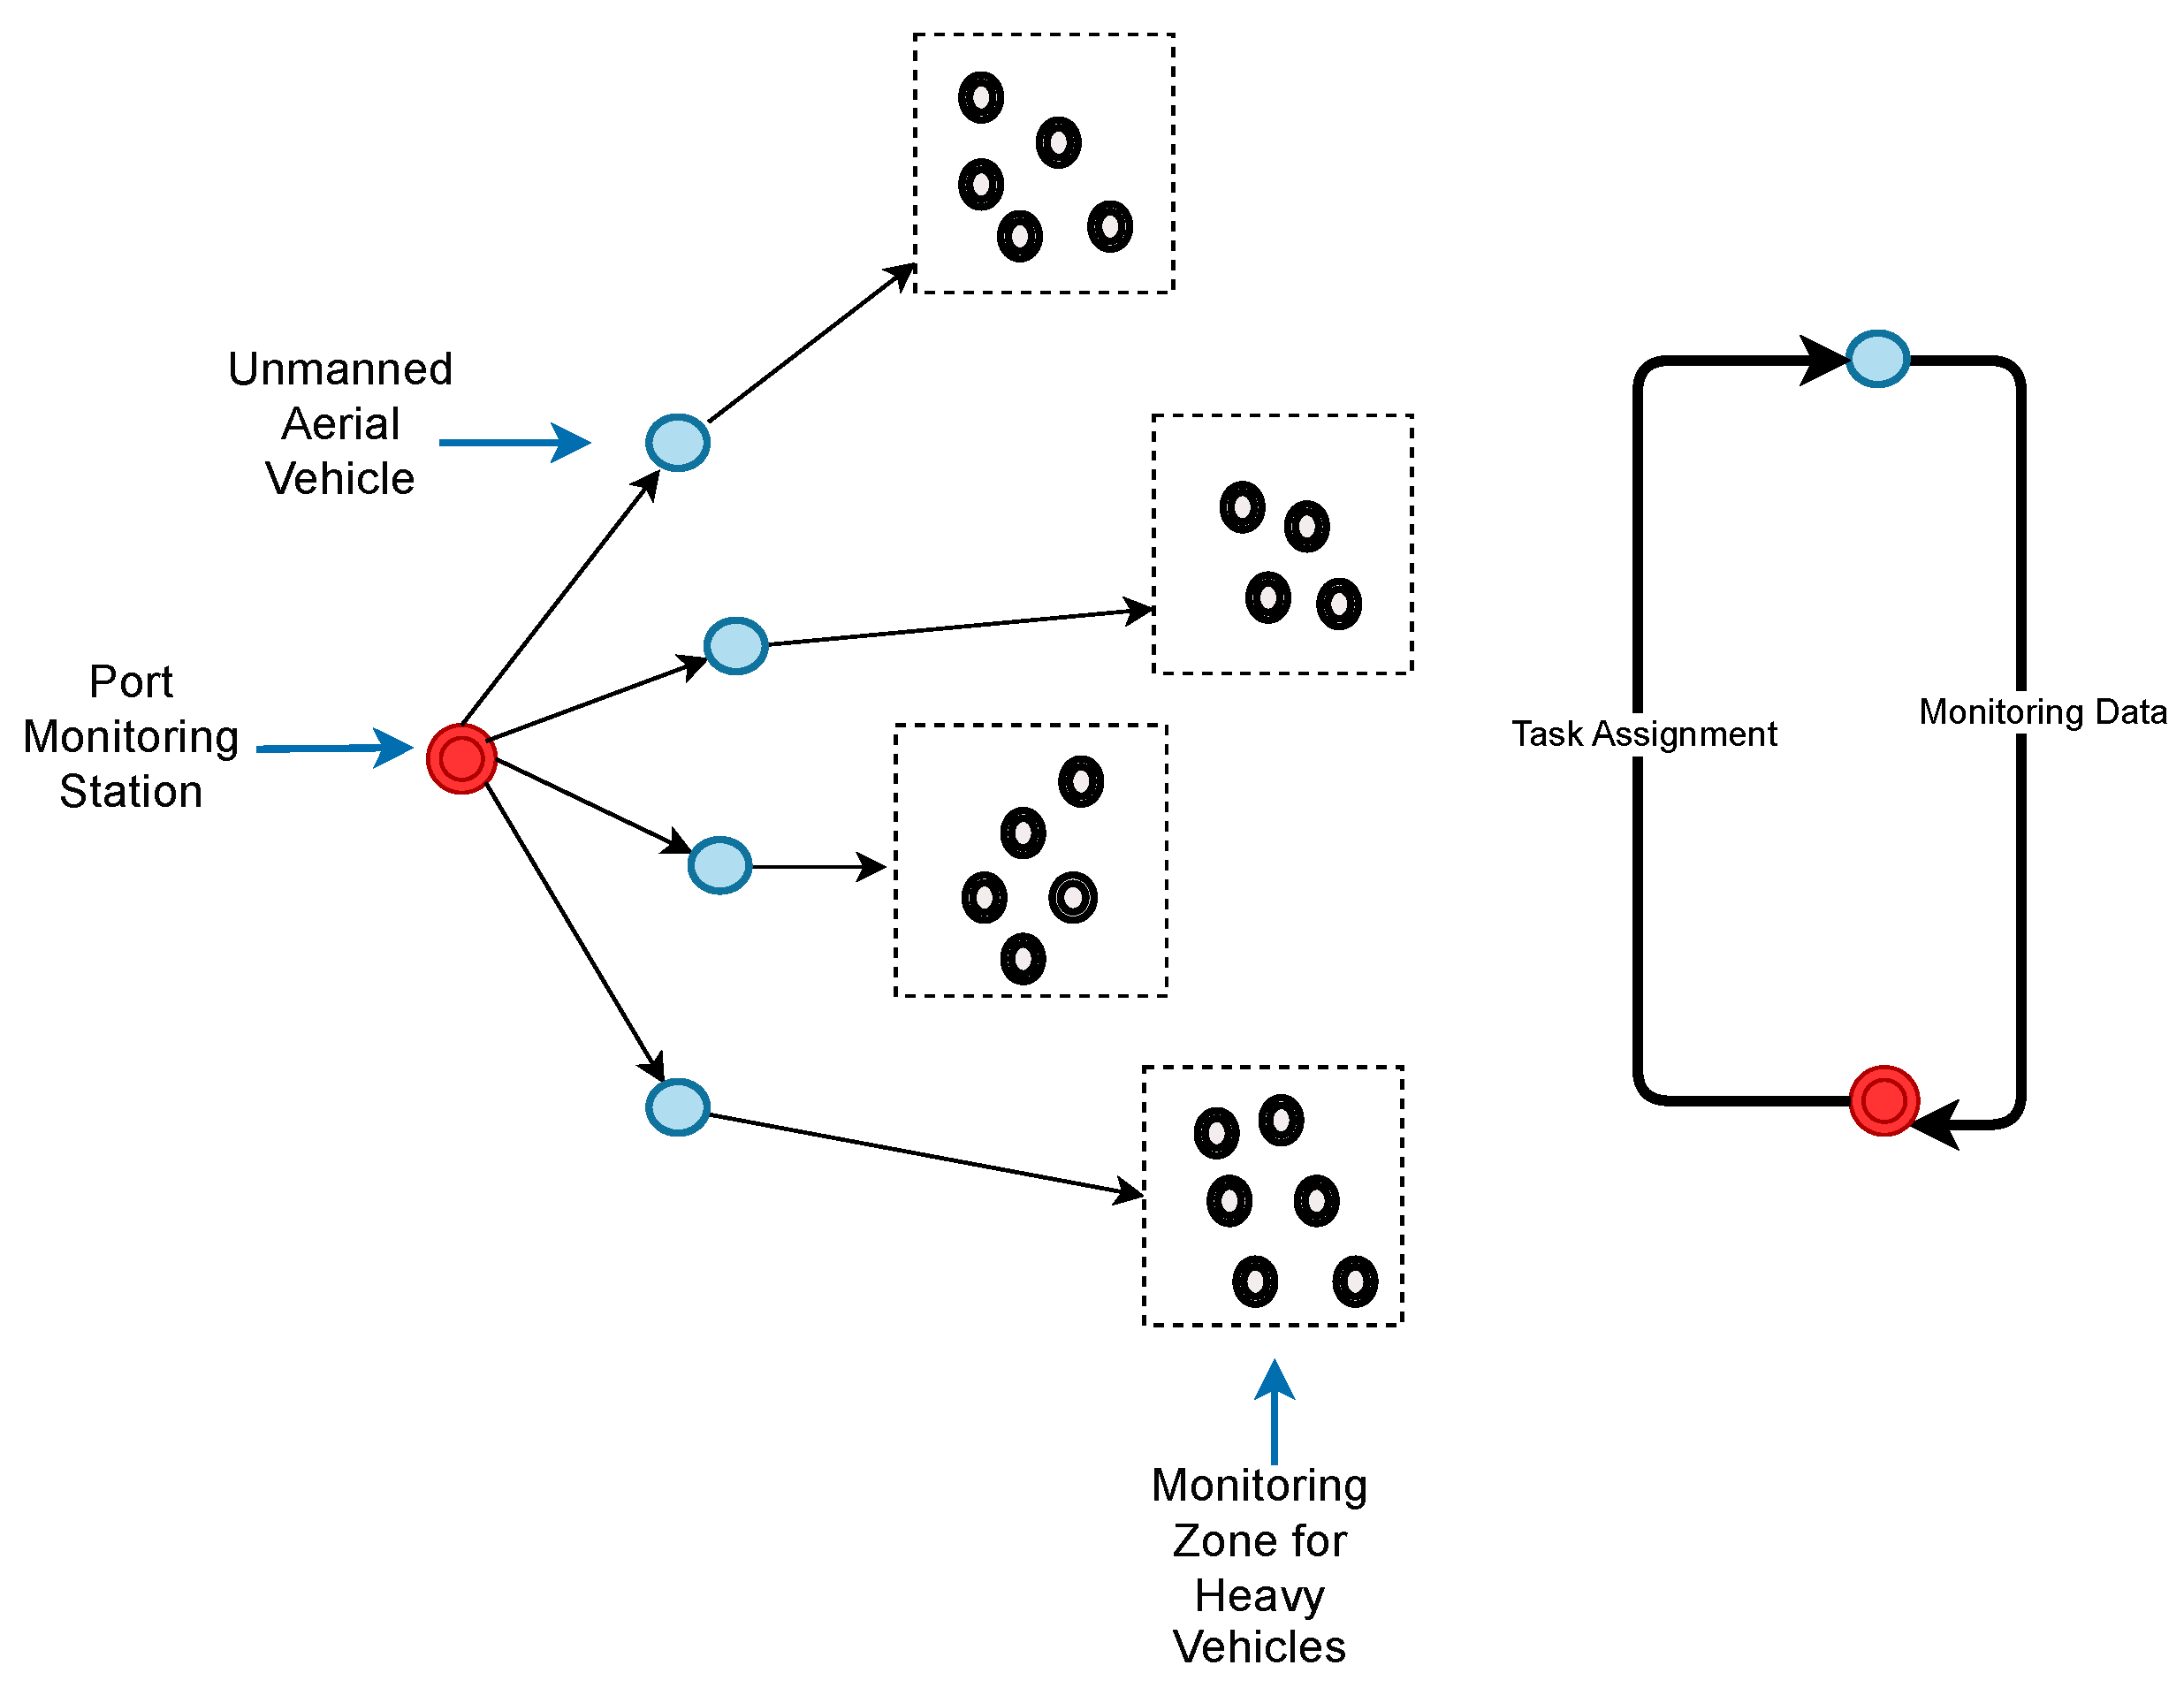
The main issue investigated in this study is the monitoring of carbon dioxide emission data on the land side of ports. The aim is to offer ports with more precise carbon dioxide emission inventories (CEIs). The discussion is structured as follows: Initially, our study introduces the UAV monitoring path planning scheme proposed for monitoring carbon dioxide emissions from heavy vehicles on the land side of ports, as illustrated in Figure 1. Carbon dioxide emission data monitoring stations are established within the port area, and a fleet of UAVs is deployed to conduct real-time monitoring of carbon dioxide emissions from the distributed heavy vehicle groups within the port. UAVs execute monitoring tasks based on the assignments from the monitoring station. During the initial monitoring phase, each UAV is assigned a specific destination and proceeds to these destinations safely and efficiently to perform the monitoring as directed. In the second phase, based on the completion status of UAV A’s tasks, a secondary assignment is considered. If UAV A’s battery level falls below the minimum required for operation, and if another UAV B with sufficient battery life is available to meet the monitoring requirements, a secondary dispatch for the monitoring task can be made nearby. Should there be no available idle UAVs in the current system, a new UAV C is dispatched by the port monitoring station to undertake new monitoring tasks, while the original UAV A returns to the station for battery recharge. Throughout this process, UAVs maintain data integration with the port carbon dioxide emission monitoring station, ensuring real-time surveillance, task dispatch, and data collection and organization.
The selection of UAVs equipped with gas sensors (pollution gas sensors) for carbon dioxide emission monitoring of heavy vehicles in port landside areas is based on their comprehensive advantages in flexibility, cost-effectiveness, real-time data transmission, and safety. UAVs can respond quickly, flexibly adjust monitoring routes, and transmit high-precision data in real time, making them particularly suitable for short-term, high spatiotemporal resolution monitoring tasks in complex environments like ports. In comparison, ground sensor monitoring is suitable for long-term, stable monitoring tasks but is costly and has limited coverage. Satellite monitoring, while covering a large area, has low data precision and cannot meet the detailed monitoring needs of specific port areas. Therefore, UAV monitoring has unique advantages and application value in port carbon dioxide emission monitoring [22,23,24].
Secondly, the DEMATEL-ISM analysis is conducted to assess the influencing factors on the accuracy of the final carbon dioxide emission inventory (CEI), to guide the subsequent research focus of this paper [25,26]. Finally, addressing the key issues identified through the analysis of influencing factors, we explore how to devise the initial UAV monitoring path for carbon dioxide emissions from heavy trucks in ports, while also considering UAV monitoring safety and path optimization. The DEMATEL-ISM analysis of the influencing factors in the entire monitoring scheme on the accuracy of the finally formed carbon dioxide emission inventory (CEI) proceeds as follows:
In the study of port carbon dioxide emission monitoring, keywords such as “port carbon dioxide emission”, “carbon dioxide emission monitoring”, “direct carbon dioxide emission”, “indirect carbon dioxide emission”, “monitoring path planning”, “drone path planning”, and “path planning influencing factors” were utilized in the research conducted on China Knowledge Network and Wanfang Data. By extensively reading and analyzing influential journals and papers, and consulting with experienced logistics and transportation industry experts, a comprehensive list of factors influencing the monitoring process was identified. These include Initial Resource Allocation Efficiency, Initial Path Algorithm Quality, Initial Path Modeling Accuracy, Monitoring Task Priority, Re-planning Theory Compatibility, Re-planning Monitoring Algorithm Quality, Re-planning Response Timeliness, Compliance of Inspection Task Execution, Monitoring Data Processing Standardization, Communication Link Stability, Monitoring Data Real-time Availability, Monitoring Target Value, Charging Facilities and Maintenance Equipment, UAV Equipment Status, and Number of Heavy Truck Area Sets, totaling 15 influencing factors.
By identifying system elements, constructing the direct influence matrix, normalizing the influence matrix, calculating the comprehensive influence matrix, and evaluating the degree of influence and the degree of being influenced for each element, the causal diagram is constructed. This process is followed by determining the overall influence matrix and the reachability matrix, culminating in the delineation of the system elements’ hierarchy and the construction of the hierarchical structure to reveal the interrelationships and the distribution of hierarchy among the elements of the complex system [
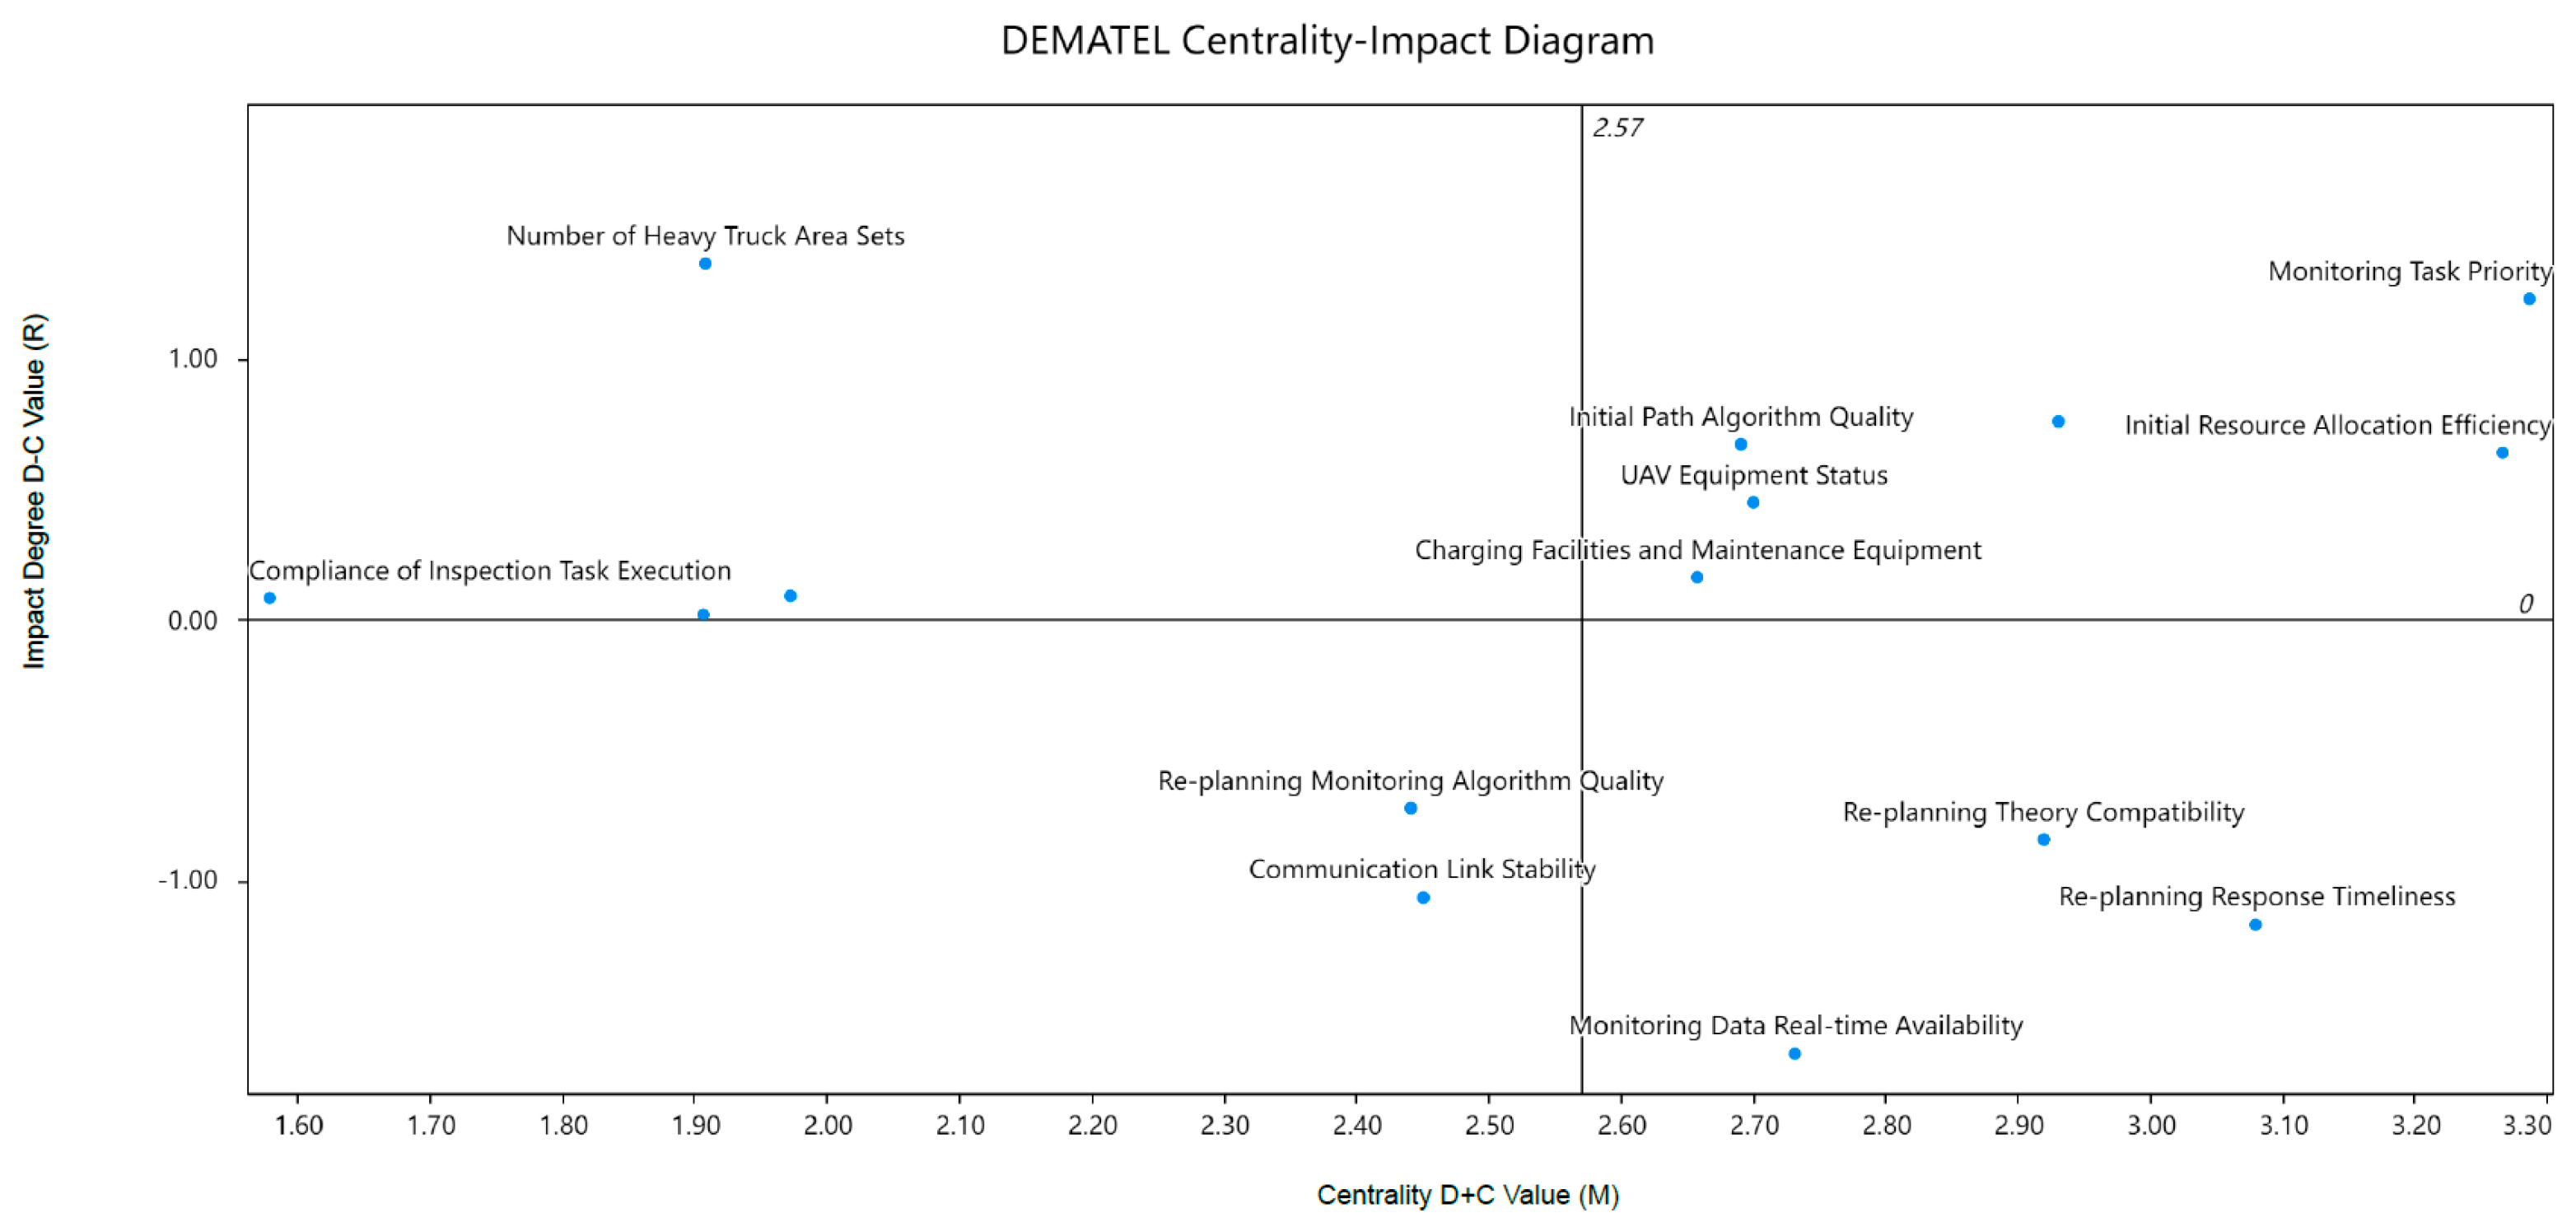
27]. The DEMATEL-ISM analysis presents the center degree and cause degree in 
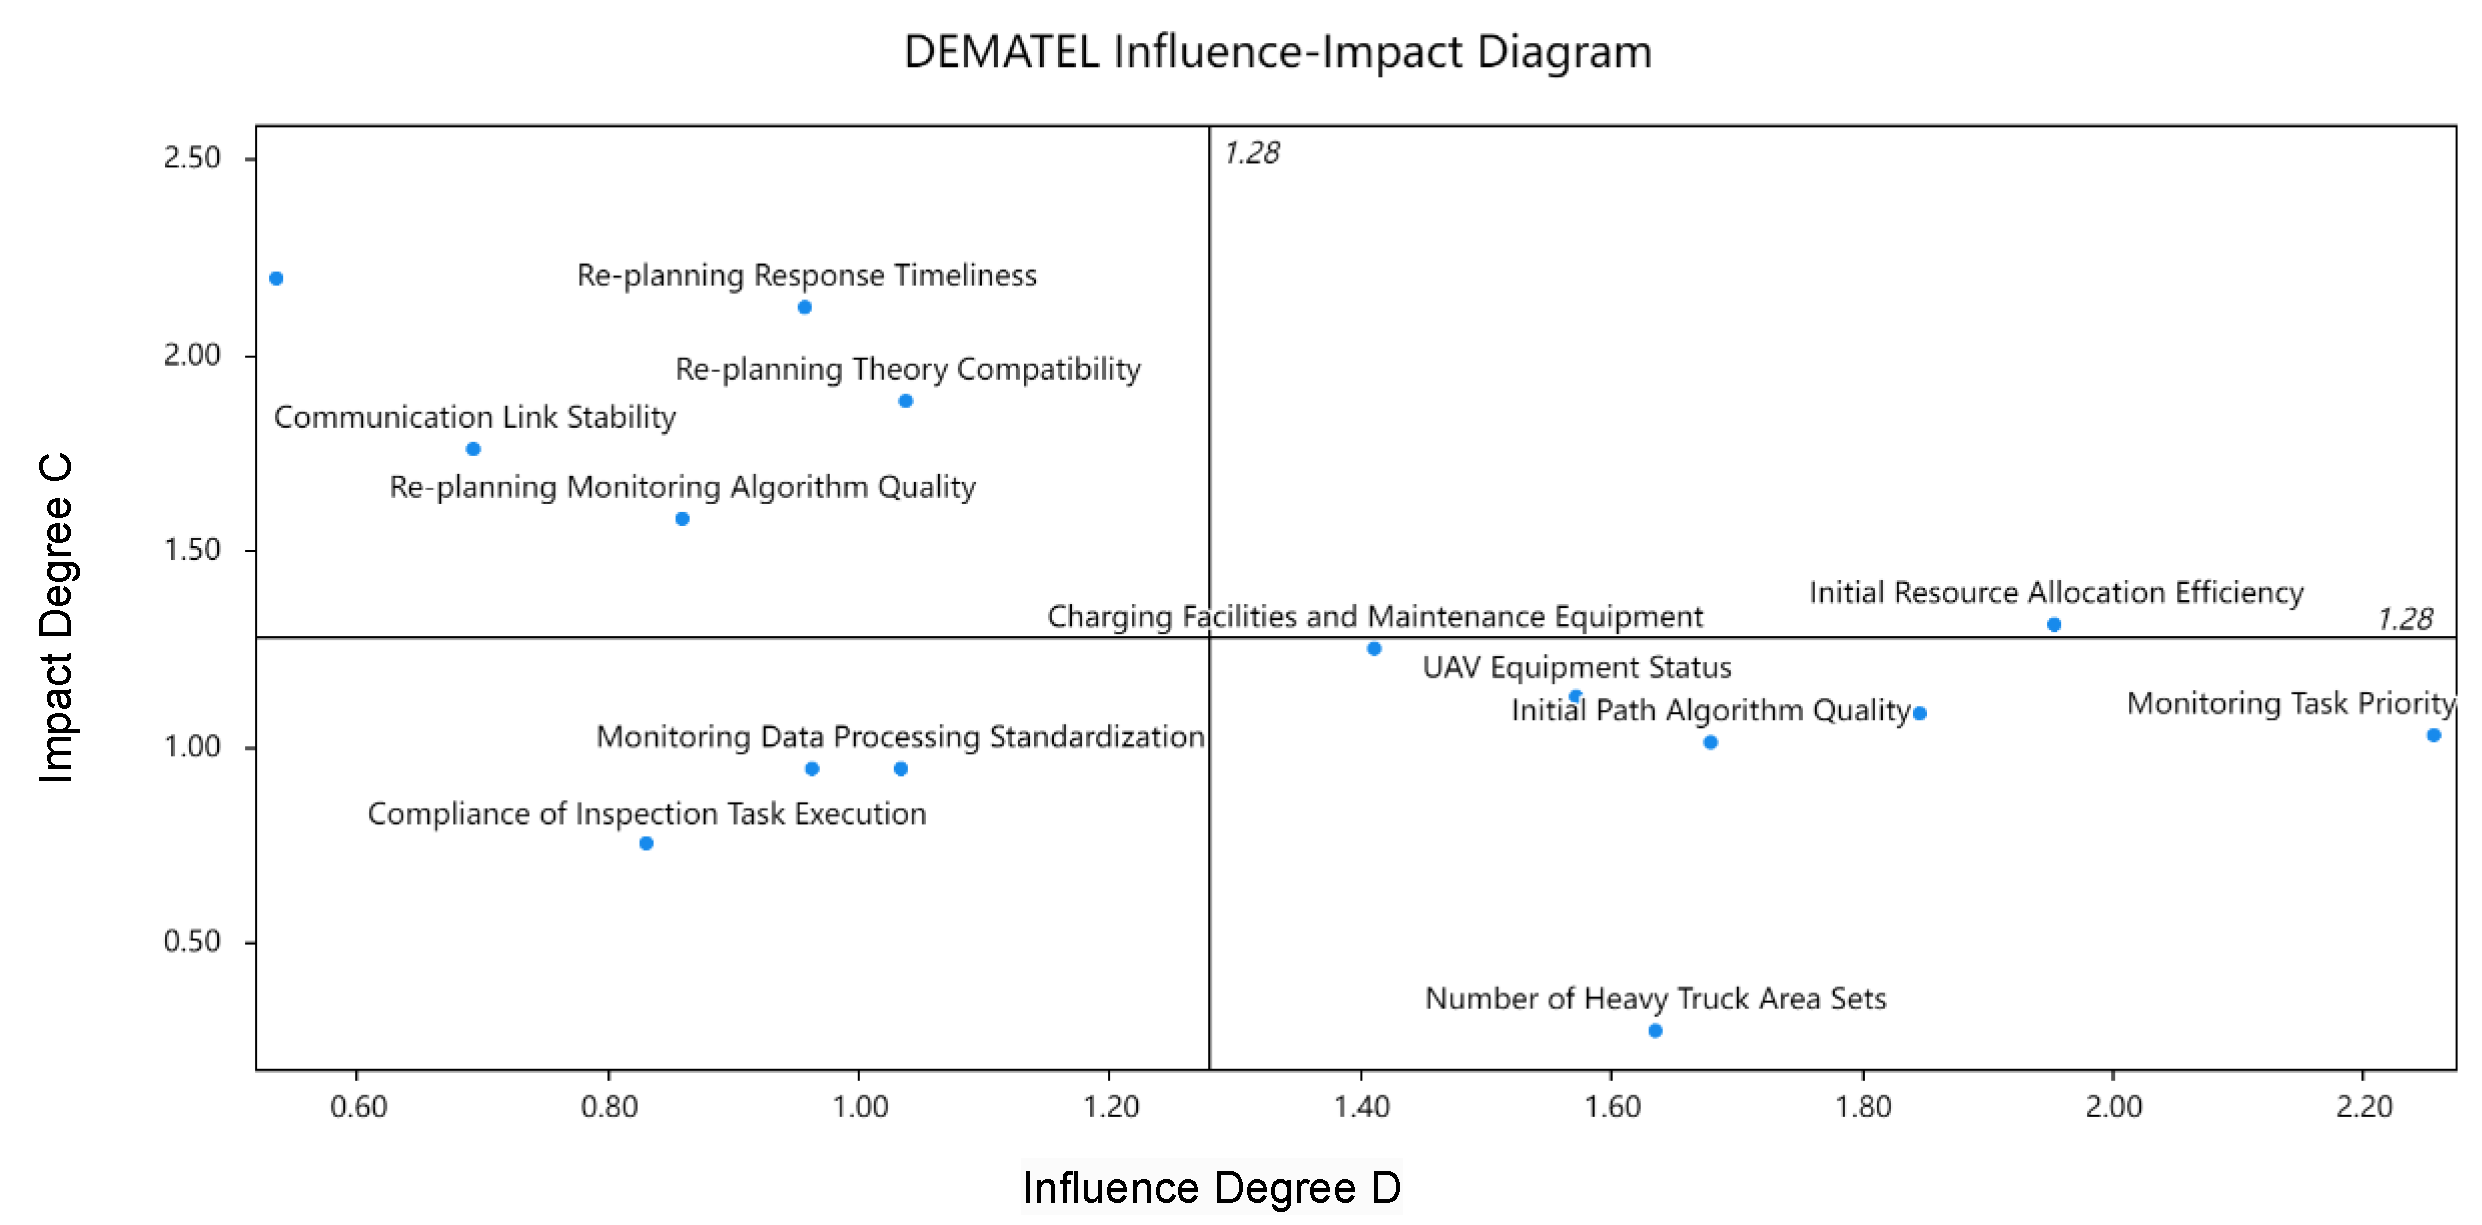
Figure 2. The influence degree and influenced degree are depicted in 
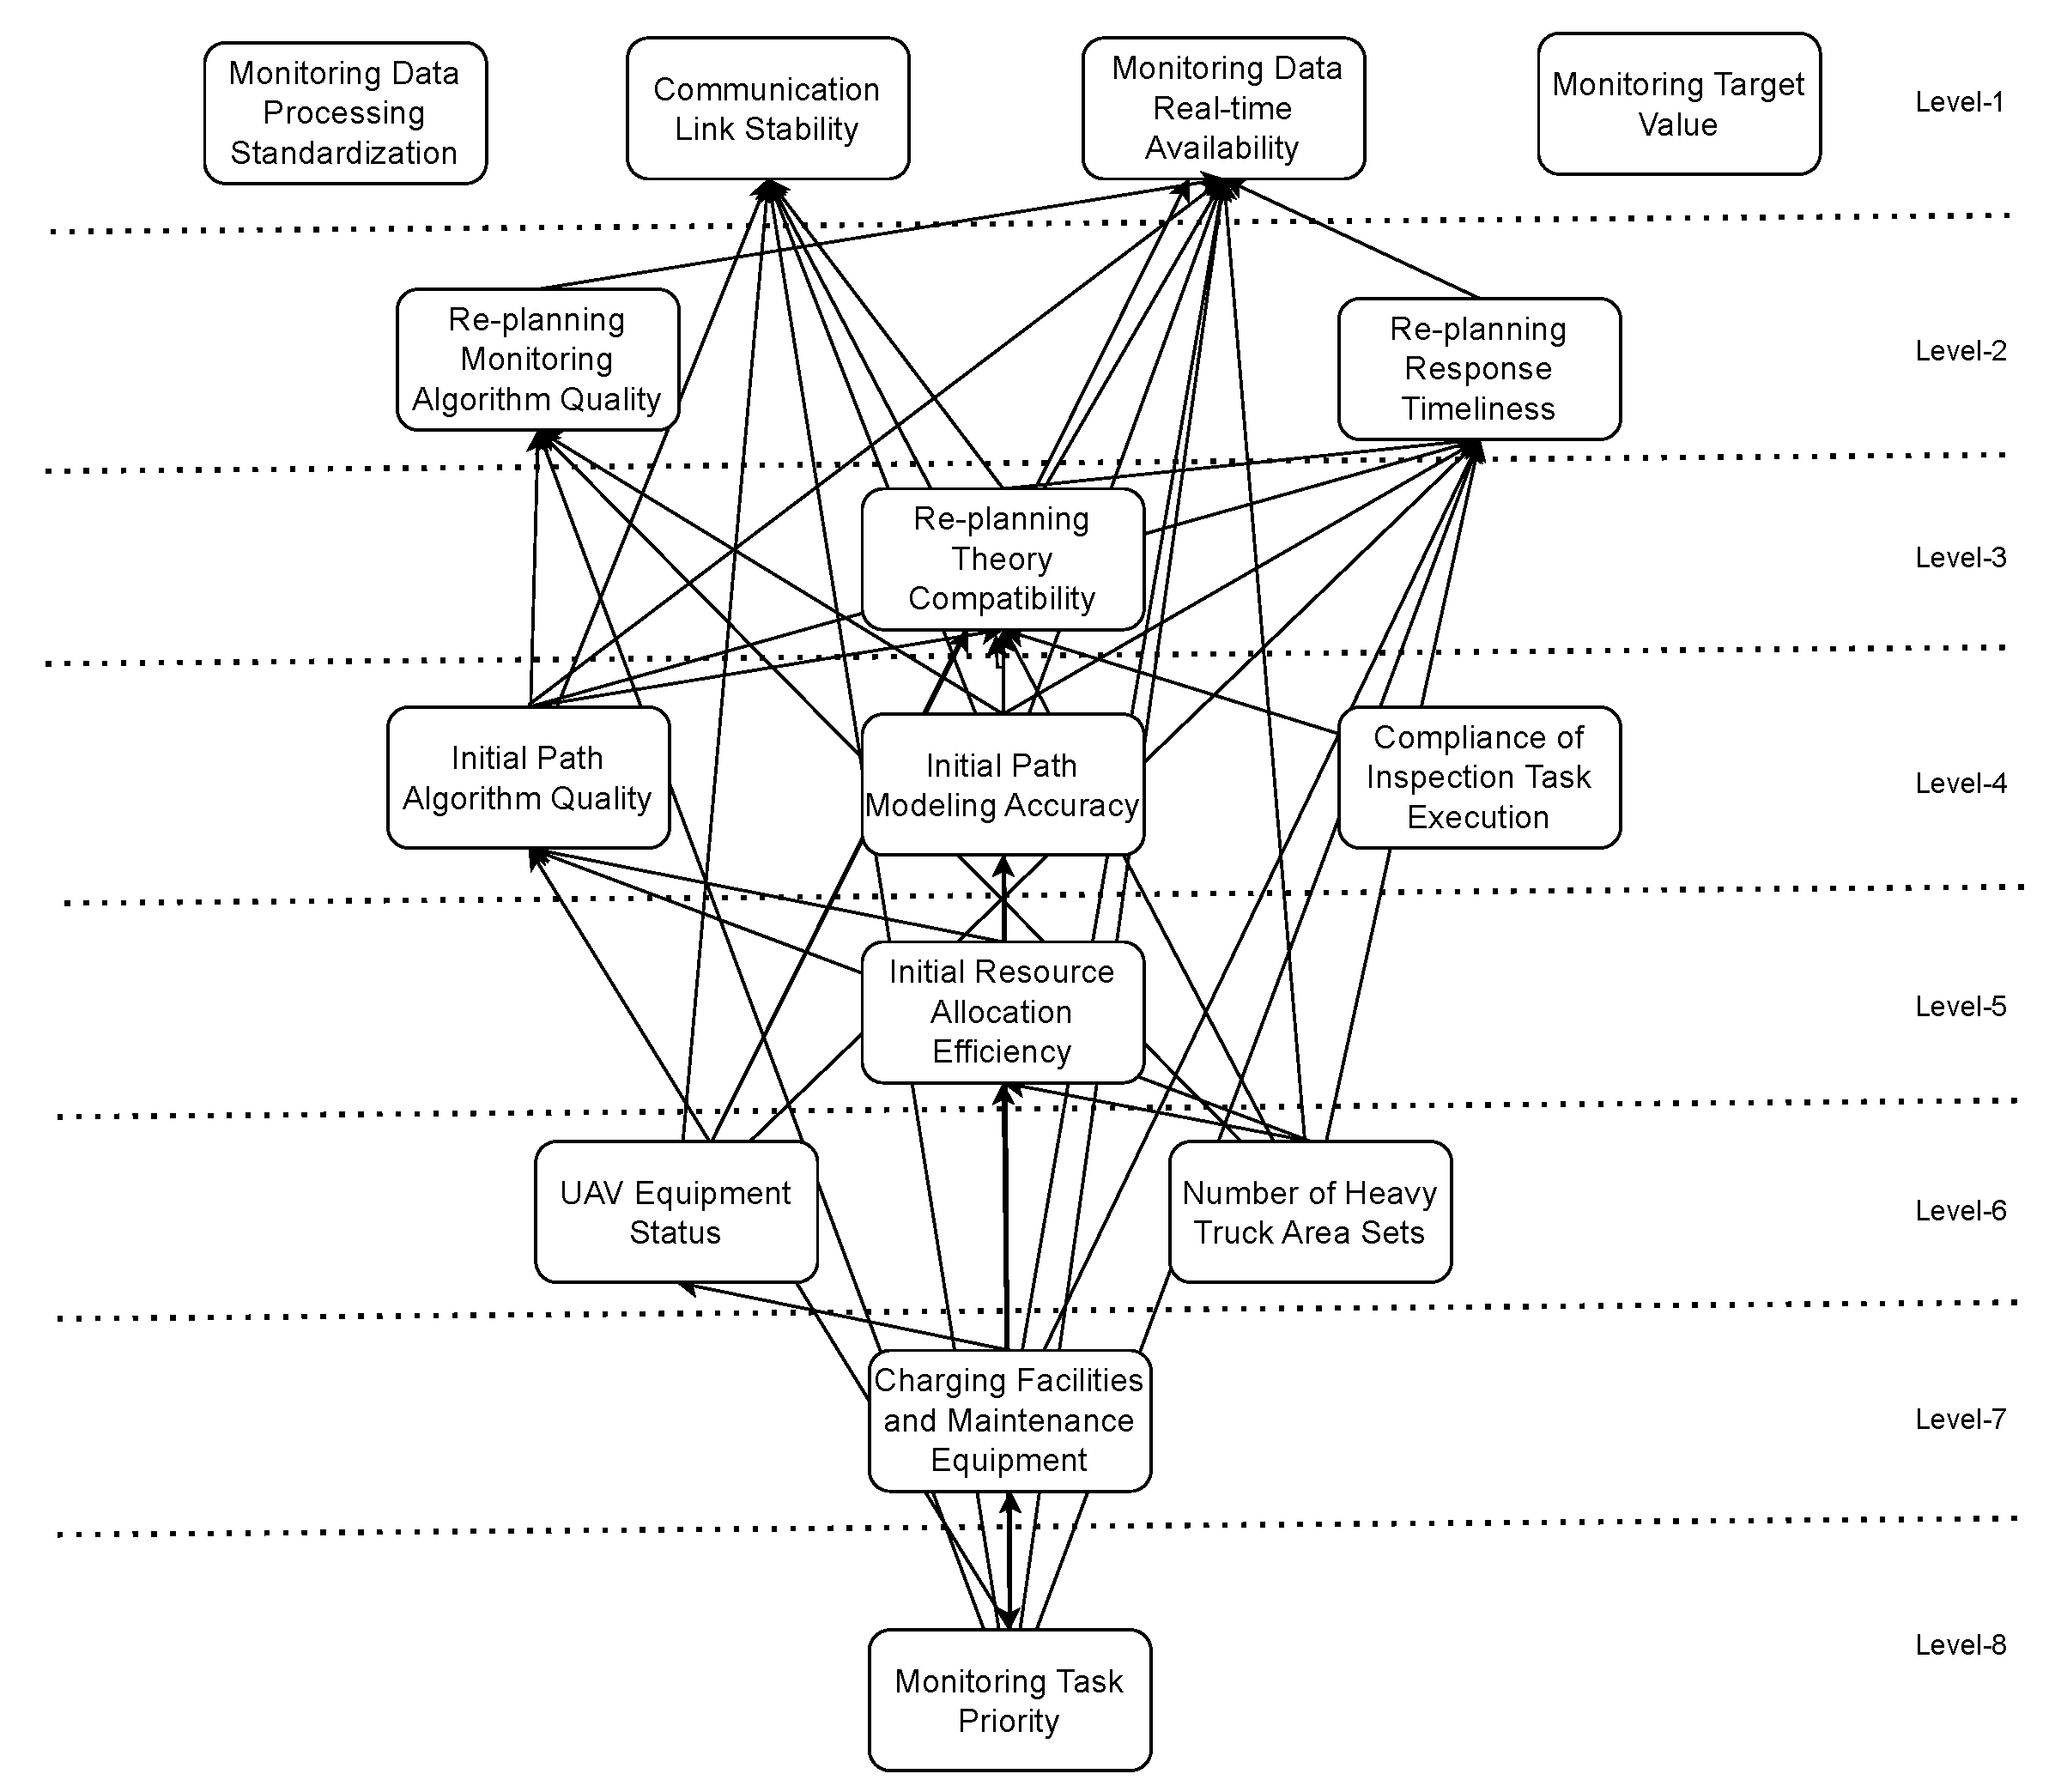
Figure 3. The hierarchical relationship is illustrated in Figure 4.
Based on the outcomes of the DEMATEL-ISM analysis, monitoring task priority, initial resource allocation efficiency, initial path modeling accuracy, UAV equipment status, and the strengths and weaknesses of the initial path algorithm are identified as causal factors. These five factors are recognized as significant influencers within the research system, specifically concerning the optimization of UAV monitoring paths for heavy vehicle carbon dioxide emissions in port areas, and they exert an impact on other factors, necessitating enhanced focus on these elements during the research. Monitoring task priority, initial resource allocation efficiency, re-planning response timeliness, initial path modeling accuracy, re-planning theory fitness, re-planning response timeliness, and real-time monitoring data are the seven key indirect influencing factors on the research system, concerning the UAV monitoring of heavy vehicle carbon dioxide emissions in port areas. Initial resource allocation efficiency, re-planning theory adaptability, initial path algorithm effectiveness, initial path modeling precision, and compliance with detection task execution are intermediate tier factors that are closely associated with others and require focused attention.
Taking into account the key insights, the influencing factors that warrant attention exhibit a hierarchical and progressive influence, ranging from the preliminary preparation of the research problem, including the condition of UAV equipment, to subsequent stages involving initial path planning elements such as initial resource allocation efficiency, initial path algorithm strengths and weaknesses, and initial path modeling accuracy, and finally to the re-planning phase. Accordingly, integrating the aforementioned data analysis and outcome assessment, building on prior research, affirms that, within the research problem at hand, the efficiency of resource allocation, modeling, and algorithmic problem-solving during the initial path planning stage are pivotal to the system’s functionality. In light of this finding, this study proceeds to advance the initial path planning efforts within the dynamic UAV monitoring for optimizing the carbon dioxide emission paths of heavy trucks in port areas, aiming to minimize the overall monitoring cost. Minimizing the total cost of the UAV monitoring process is the mathematical modeling goal, and the overall solving efficiency and merit of the algorithm serve as the evaluation criterion, contributing to the enhancement of the carbon dioxide Emission Inventory (CEI) in the port area with both theoretical and practical significance. Ultimately, this paper focuses its research on the problem of initial path planning for UAV monitoring of carbon dioxide emissions from heavy trucks in the port area during in-port monitoring. To this end, mathematical and environmental modeling is performed to ensure the safe flight and path optimization of the UAV. Based on this, we propose an improved algorithm (IEHA) to improve the efficiency and effectiveness of path planning.

3. Model Construction and Review of Traditional A* Algorithms

3.1. Mathematical Model

First we need to clarify that, in the context of land-based carbon dioxide emission monitoring in port environments, selecting appropriate drones equipped with sensors is crucial. Taking into account the unique characteristics of port settings, light-assisted TiO 2 sensors offer monitoring accuracy that meets the requirements of high sensitivity and selectivity. According to existing research, TiO 2 sensors enhanced by photoexcitation can achieve a CO 2 detection limit as low as several tens of parts per million (ppm) or even lower at room temperature, with specific values depending on the degree of sensor optimization and environmental conditions. Under sufficient illumination, their response time can reach the order of seconds, enabling rapid detection of changes in CO 2 concentration. Furthermore, light-assisted TiO 2 sensors exhibit stable performance in high humidity environments and are less affected by humidity variations, making them well-suited for real-time monitoring demands in such complex port scenarios [28,29]. Therefore, the selection of drones equipped with light-assisted TiO 2 sensors in this study can provide high-precision, real-time data support for monitoring carbon dioxide emissions in ports, thus offering reliable technical assurance for improving the completeness and accuracy of the port carbon dioxide Emission Inventory (CEI).
Among the primary research issues addressed in the research, the initial step in examining the initial path planning problem for UAV monitoring of carbon dioxide emissions from heavy trucks in the harbor monitoring process involves establishing a robust mathematical model to advance to the subsequent phase of algorithmic simulation. Considering the multitude of factors in the UAV monitoring process, to streamline calculations and subsequent experiments, the multi-objective task is converted into a single-objective task by assigning weights, with the optimization objective set to minimize the total monitoring cost. The mathematical modeling approach in this paper proceeds as follows:
Obj.
MinCost = Min U × W 1 Cost EC + W 2 Cost EM
S.t.
W 1 + W 2 = 1
Cost E M = c E M · ξ g r i d · 1 η · η g i , j E i j + k E h k
d i j = ( x j x i ) 2 + ( y j y i ) 2
Cost E M = c E M ξ g r i d E i j η · η g + E h
E i j = p ( v i j ) · l r
p ( v i j ) = 1 2 C D S f ρ ( v i j ) 3 + m 0 3 g 3 2 ρ S f
l r = i j d i j v i j
E h = W · l t = 2 m g 3 2 ρ A r · l t
i , j E i j + E h k E max k { 1 , , U }
i , j v i j d i j + l t k T max
( x i , y i ) Obstacle set
U N + , i , j N , d i j R +
( x i , y i ) G
v i j v max
  • c Individual UAV purchase cost
  • U Number of UAVs required for monitoring
  • c E C Unit price of electricity (price of electricity consumed per unit distance)
  • d i j Euclidean geometric distance
  • c E M Unit environmental costs
  • ξ g r i d Marginal carbon dioxide dioxide emission rate
  • E i j Theoretical energy consumption of UAVs flying along planned paths
  • p ( v i j ) Unit energy expended in horizontal motion (when the UAV is flying horizontally at speed v i j )
  • v i j UAV flight speed
  • G Representing raster maps
  • l r Duration (duration at this speed v i j )
  • η Integrated efficiency for battery charging and discharging
  • η g Efficiency of grid transmission and distribution
  • C D Pneumatic resistance factor
  • S f Front surface area of the drone
  • p Air density
  • m o Weight of a single drone
  • g Gravitational acceleration
  • E m a x Battery capacity
  • T m a x Total task time limit
  • E h k Hover energy consumption of the k-th drone
  • l t k Hover time of the k-th drone
Objective (1) is to minimize the total weighted costs, including economic and environmental factors. Constraint (2) stipulates that the sum of weights W 1 and W 2 equals 1. Constraint (3) defines the economic cost as the sum of the UAV’s fixed purchase cost and its per-unit economic cost. Constraint (4) specifies the Euclidean distance for UAV flight paths. Constraint (5) accounts for the total environmental cost of the monitoring process, comprising horizontal movement and hovering energy expenses. Constraints (6), (7), and (8) outline the theoretical energy expenditure for horizontal movement of UAVs, the energy consumption per unit speed v i j , and the horizontal movement speed, respectively. Constraint (9) captures the hovering energy cost during UAV monitoring, calculated as the product of hovering power and duration. Constraint (10) ensures that the total energy consumption of each drone does not exceed the battery capacity E m a x . Constraint (11) ensures that the task is completed within the time limit T m a x . Constraint (12) means the path avoids obstacle coordinates. Constraints (13), (14), and (15) are left undefined.
Explicit assumptions underpinning the construction of this mathematical model are delineated, including the assumption of a constant flight velocity. The residence time at each monitoring point is assumed to be equivalent to the flight duration. Energy consumption is assumed to vary between horizontal motion and hovering. The influences of flight inclination and wind speed on UAV flight are not considered.
Combined with the mathematical model established above in this article, the core variables to be considered comprehensively for UAV monitoring of carbon dioxide emissions from heavy trucks in the harbor area are the cost of UAV purchase inputs and the length of monitoring paths, which affect our total economic cost and total environmental cost, respectively. Thus, we set the environment of the following algorithm simulation as a raster environment with obstacles, and in the final validation process of the algorithm, we comprehensively consider both the number of drone collisions and the total monitoring path.

3.2. Environmental Model

In existing research on UAV path planning, environmental modeling approaches include the raster method [30], visual map method, cell decomposition method, and high-dimensional reduction 3D environment modeling method. For the UAV monitoring of carbon dioxide emission path planning for heavy trucks in harbor areas, as studied in here, the raster method is adopted to depict environmental maps. The raster map has been widely applied in UAV flight path planning, offering advantages such as simplifying complex environmental information into easily processible discrete cells. These cells visually represent obstacles and free areas in space. By selecting different raster sizes, map accuracy and computational complexity can be balanced, allowing path planning algorithms to find feasible paths within an acceptable timeframe. Thus, we employ the raster map to construct the simulation environment for subsequent experiments, which verify the algorithm’s effectiveness. 
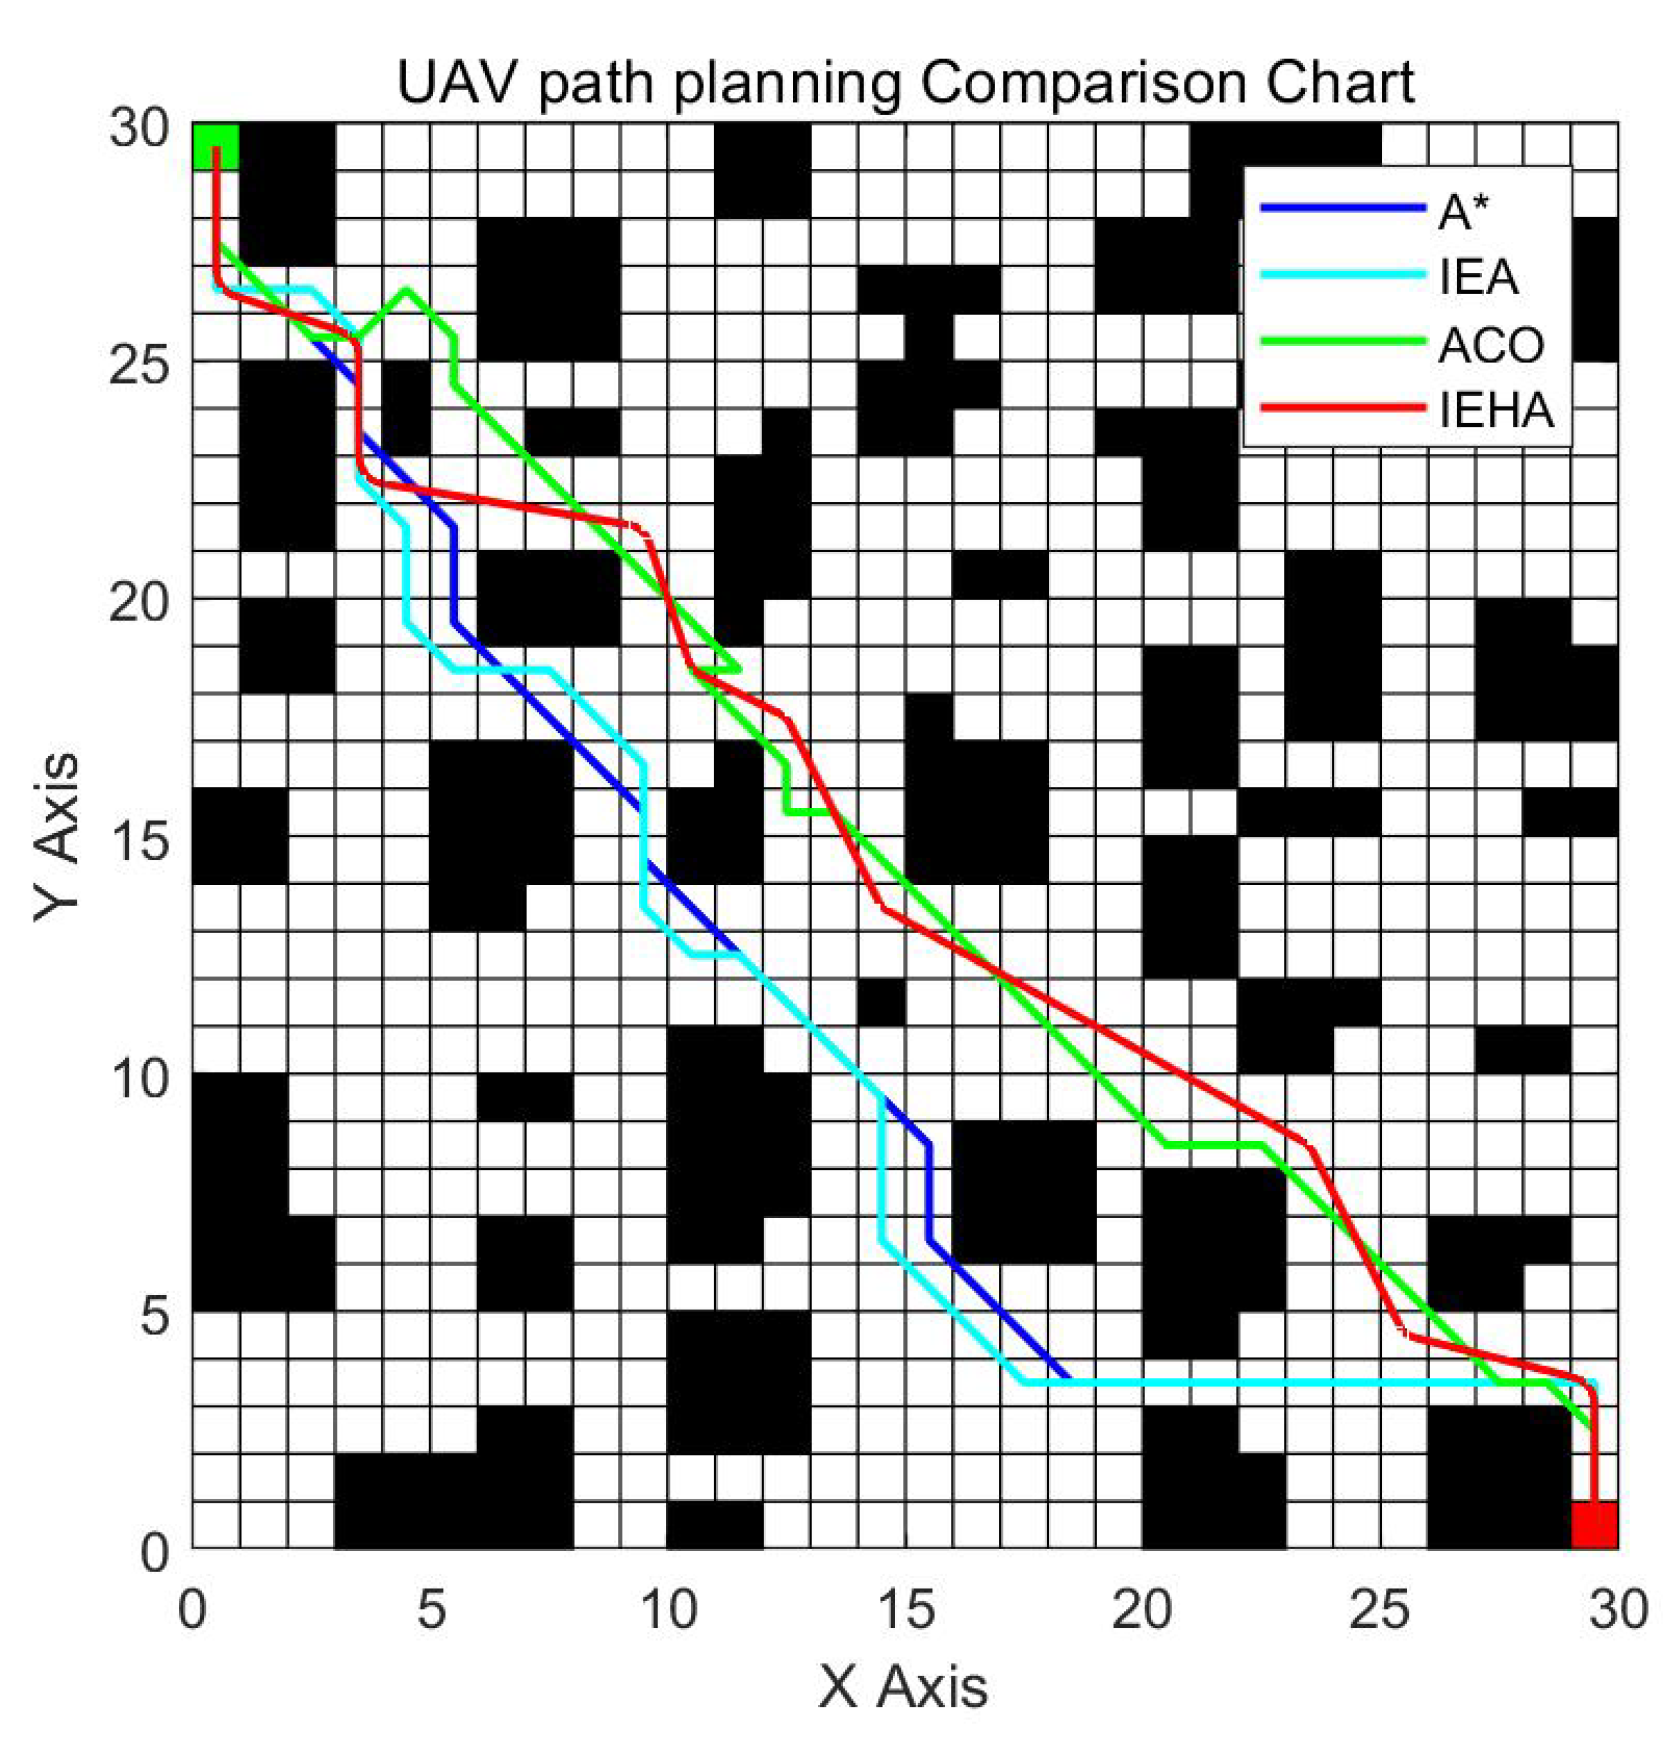
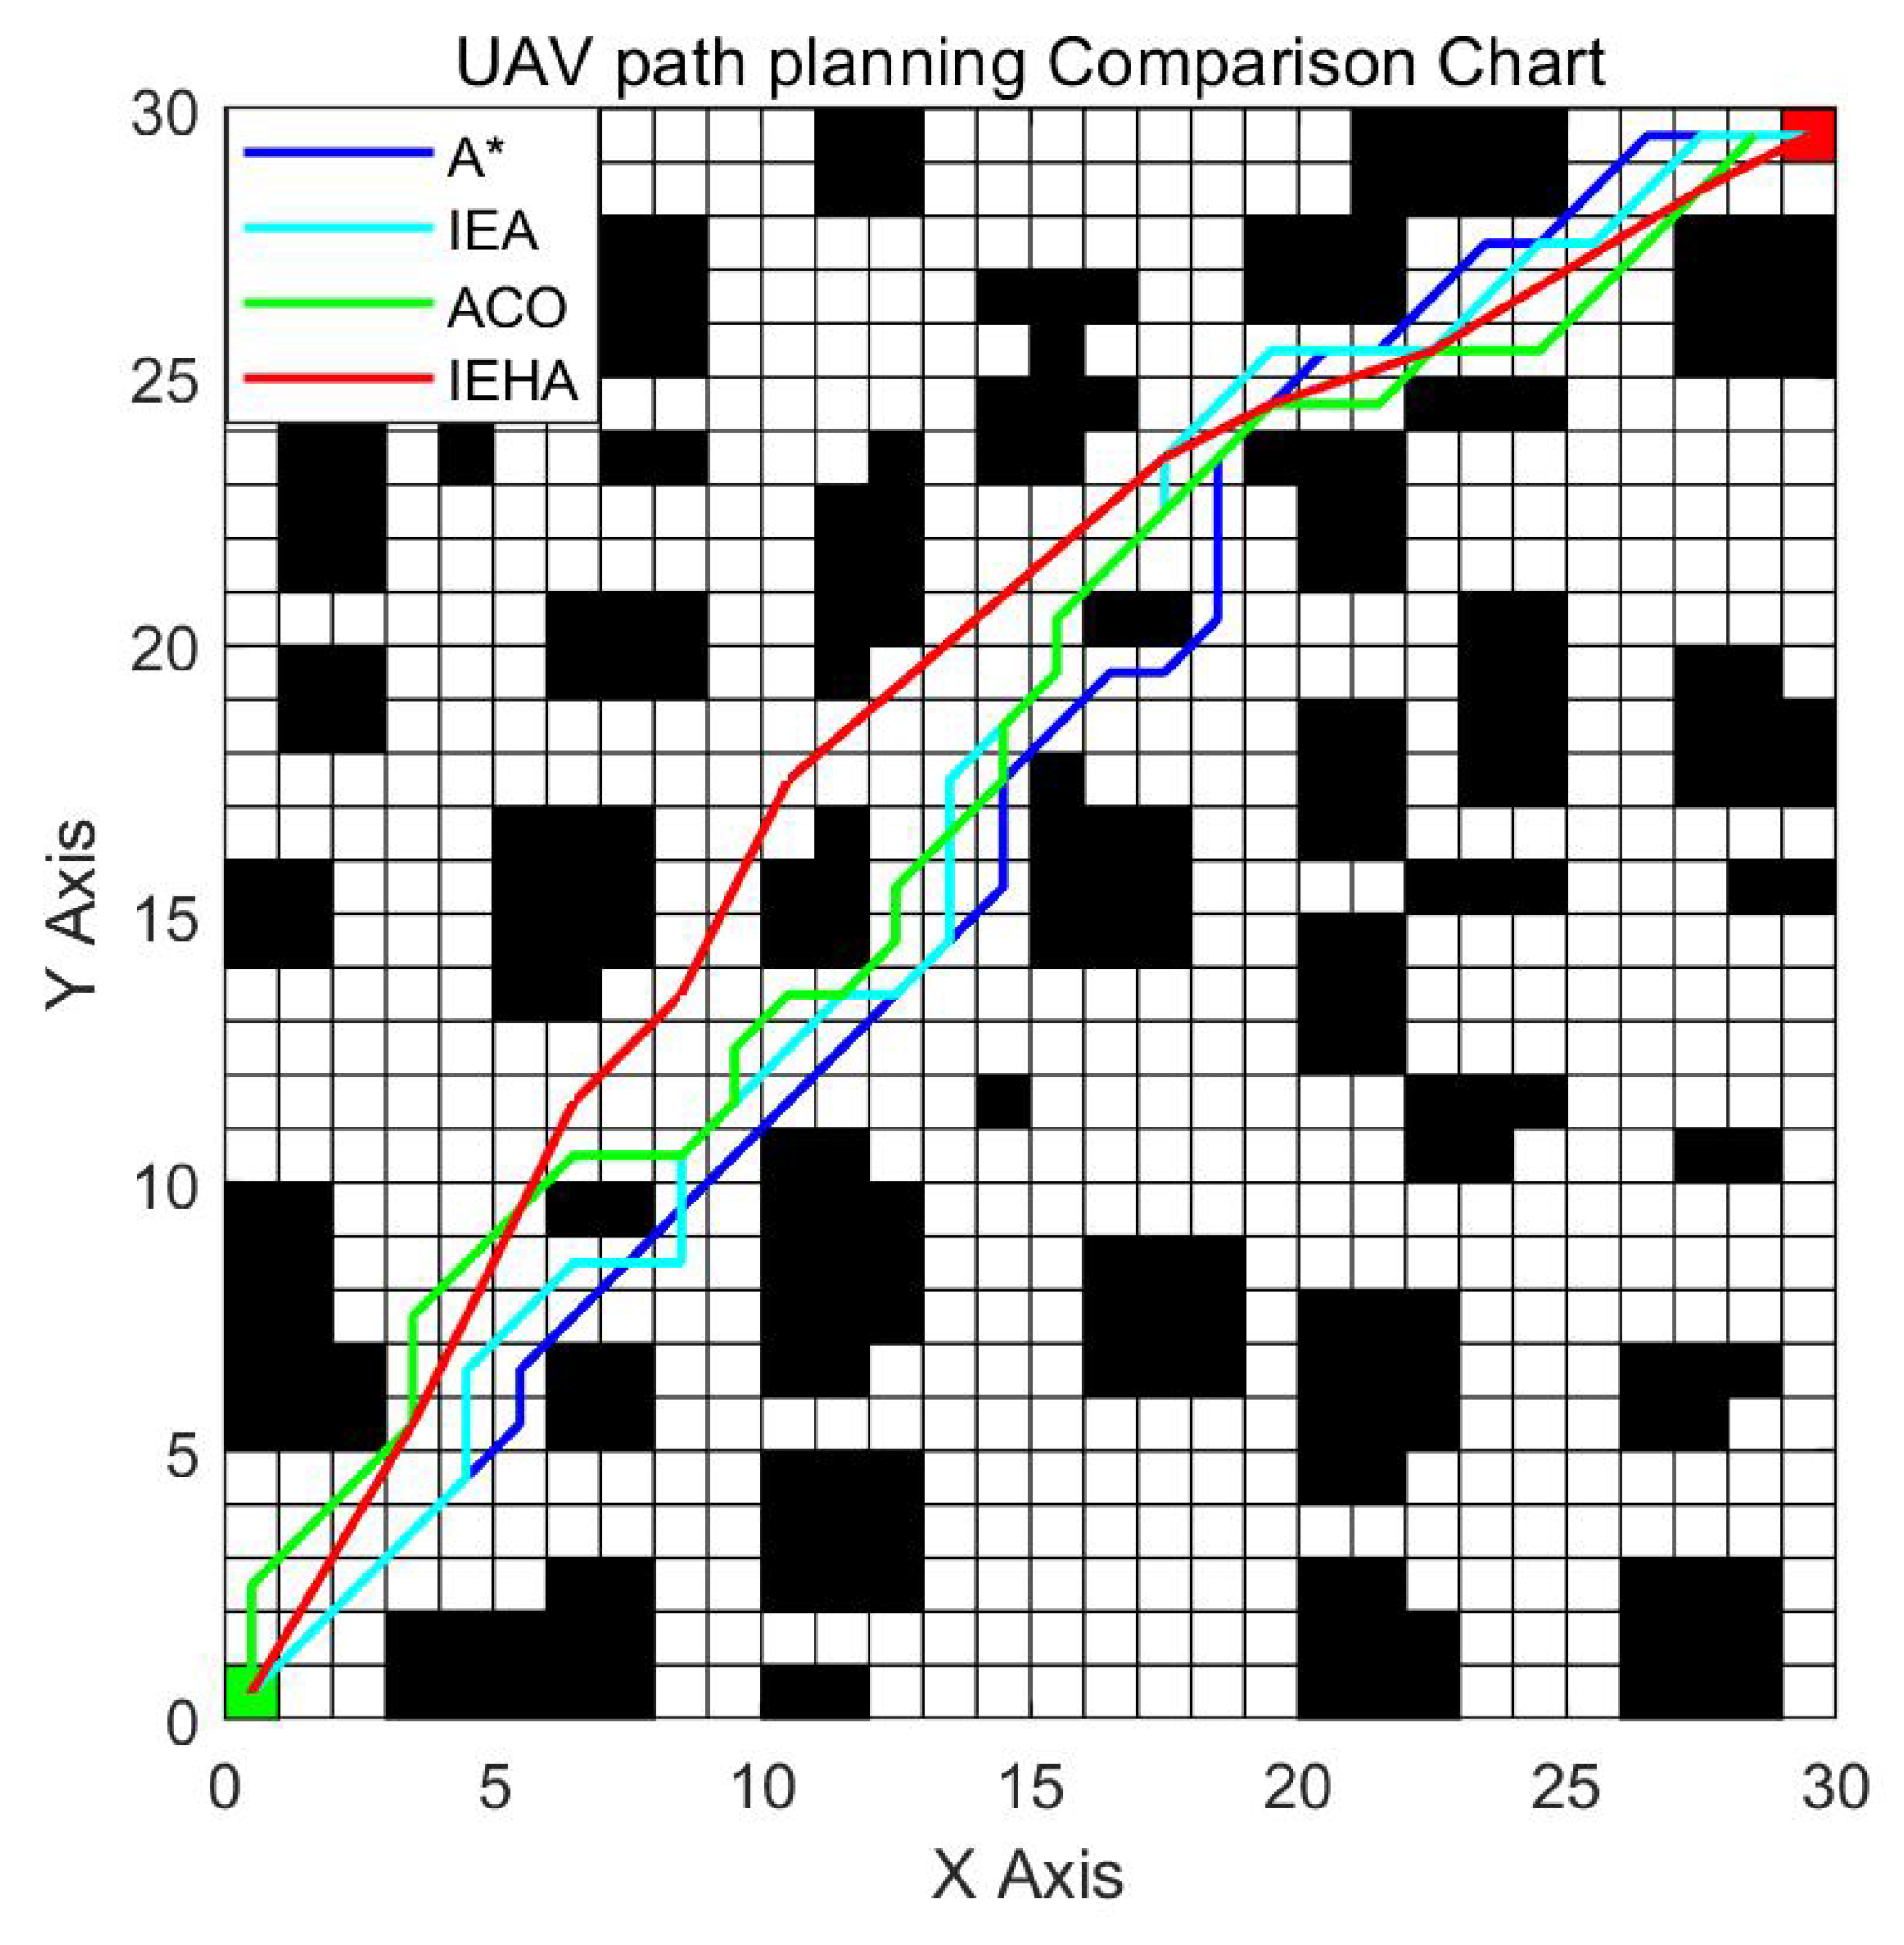
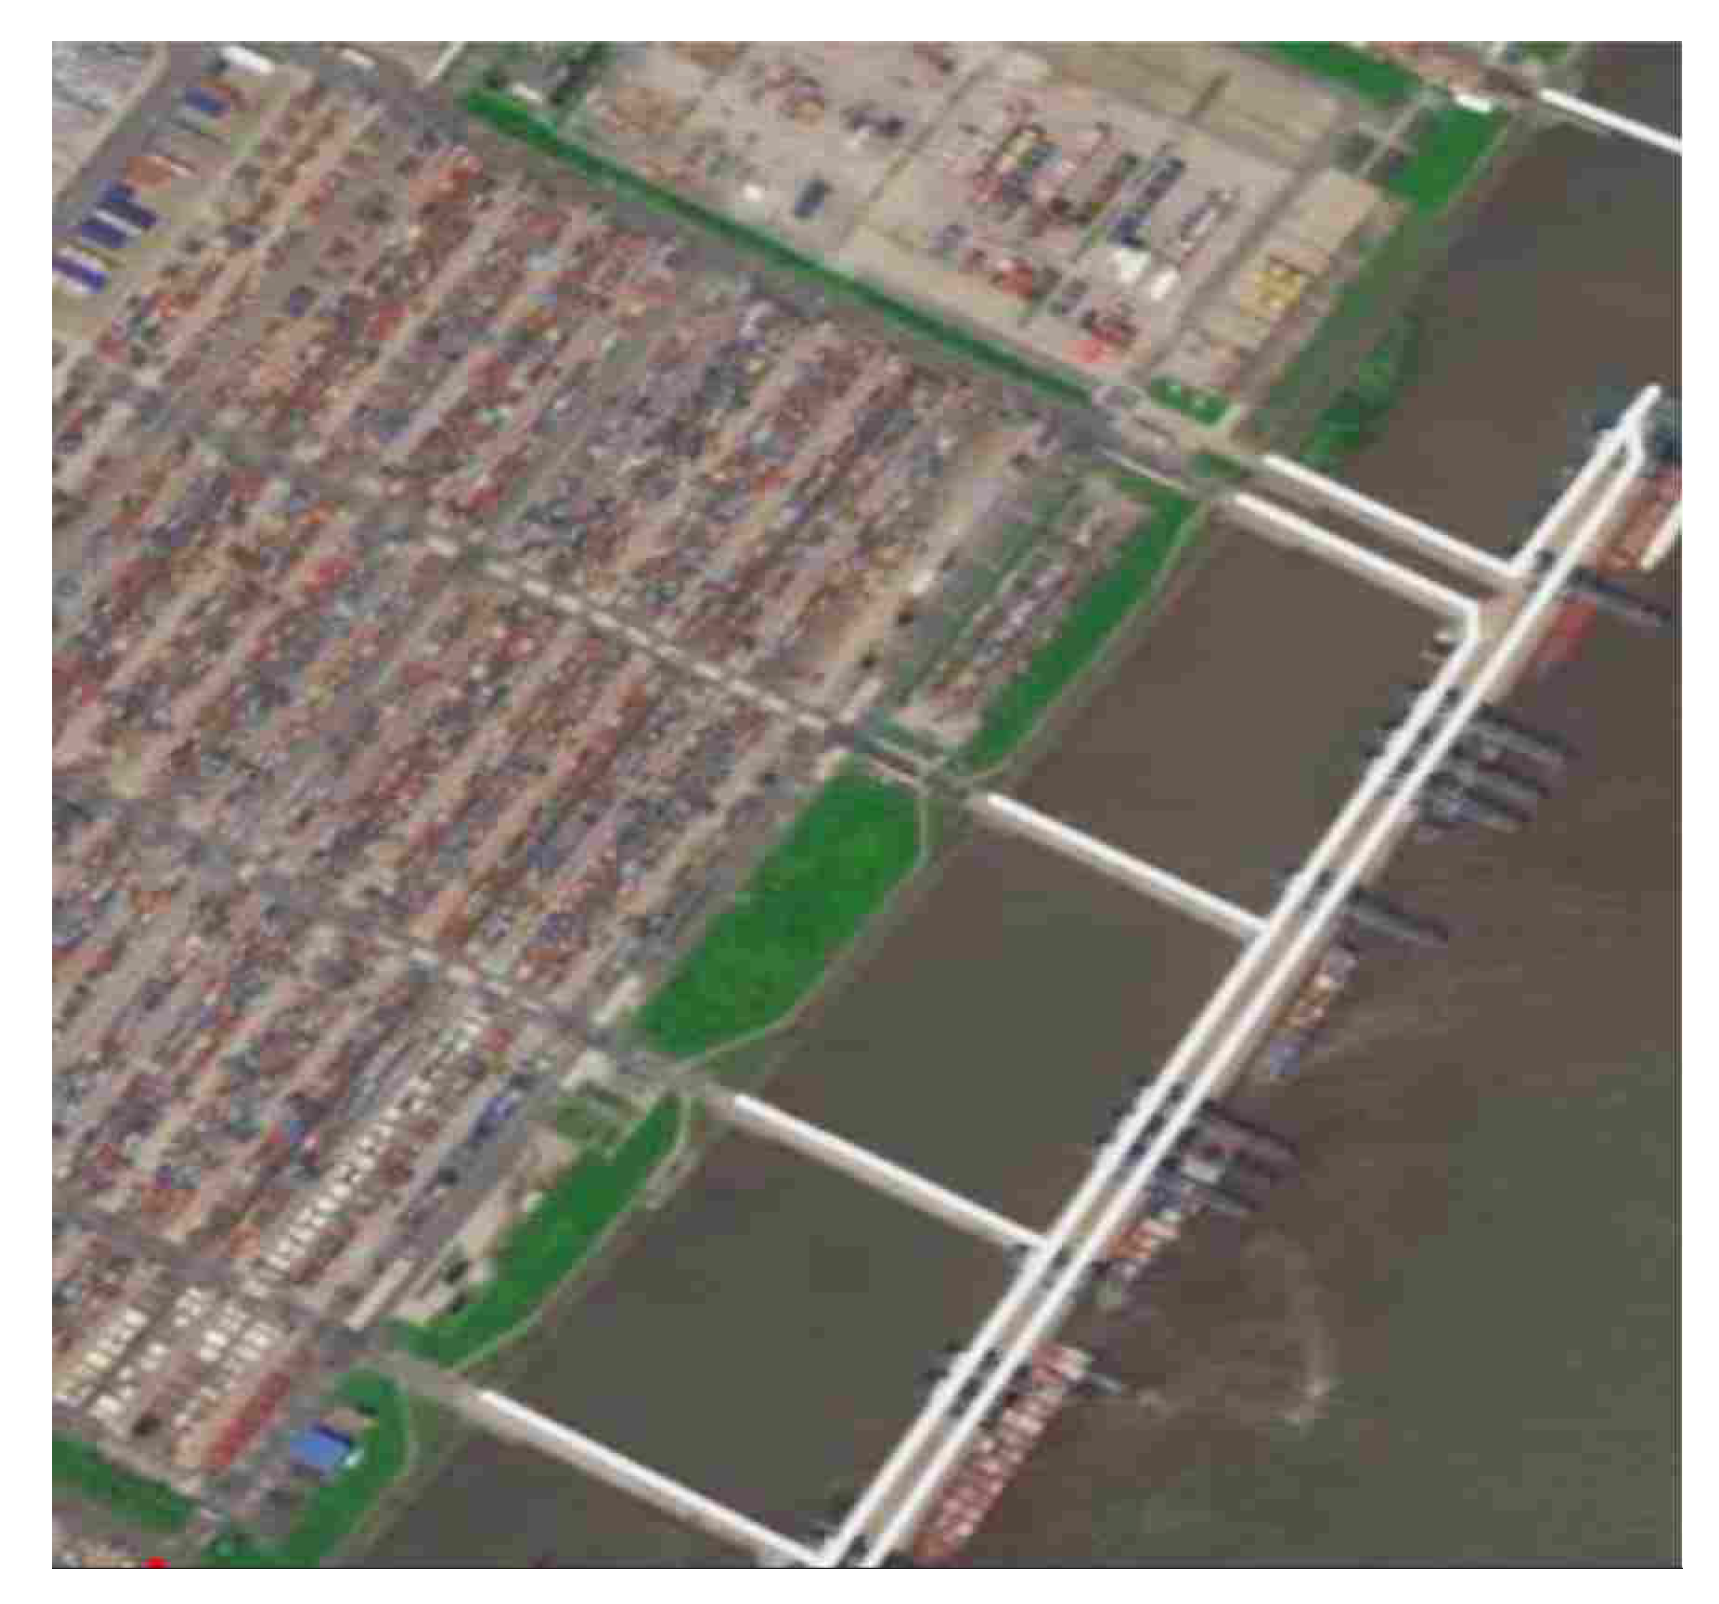
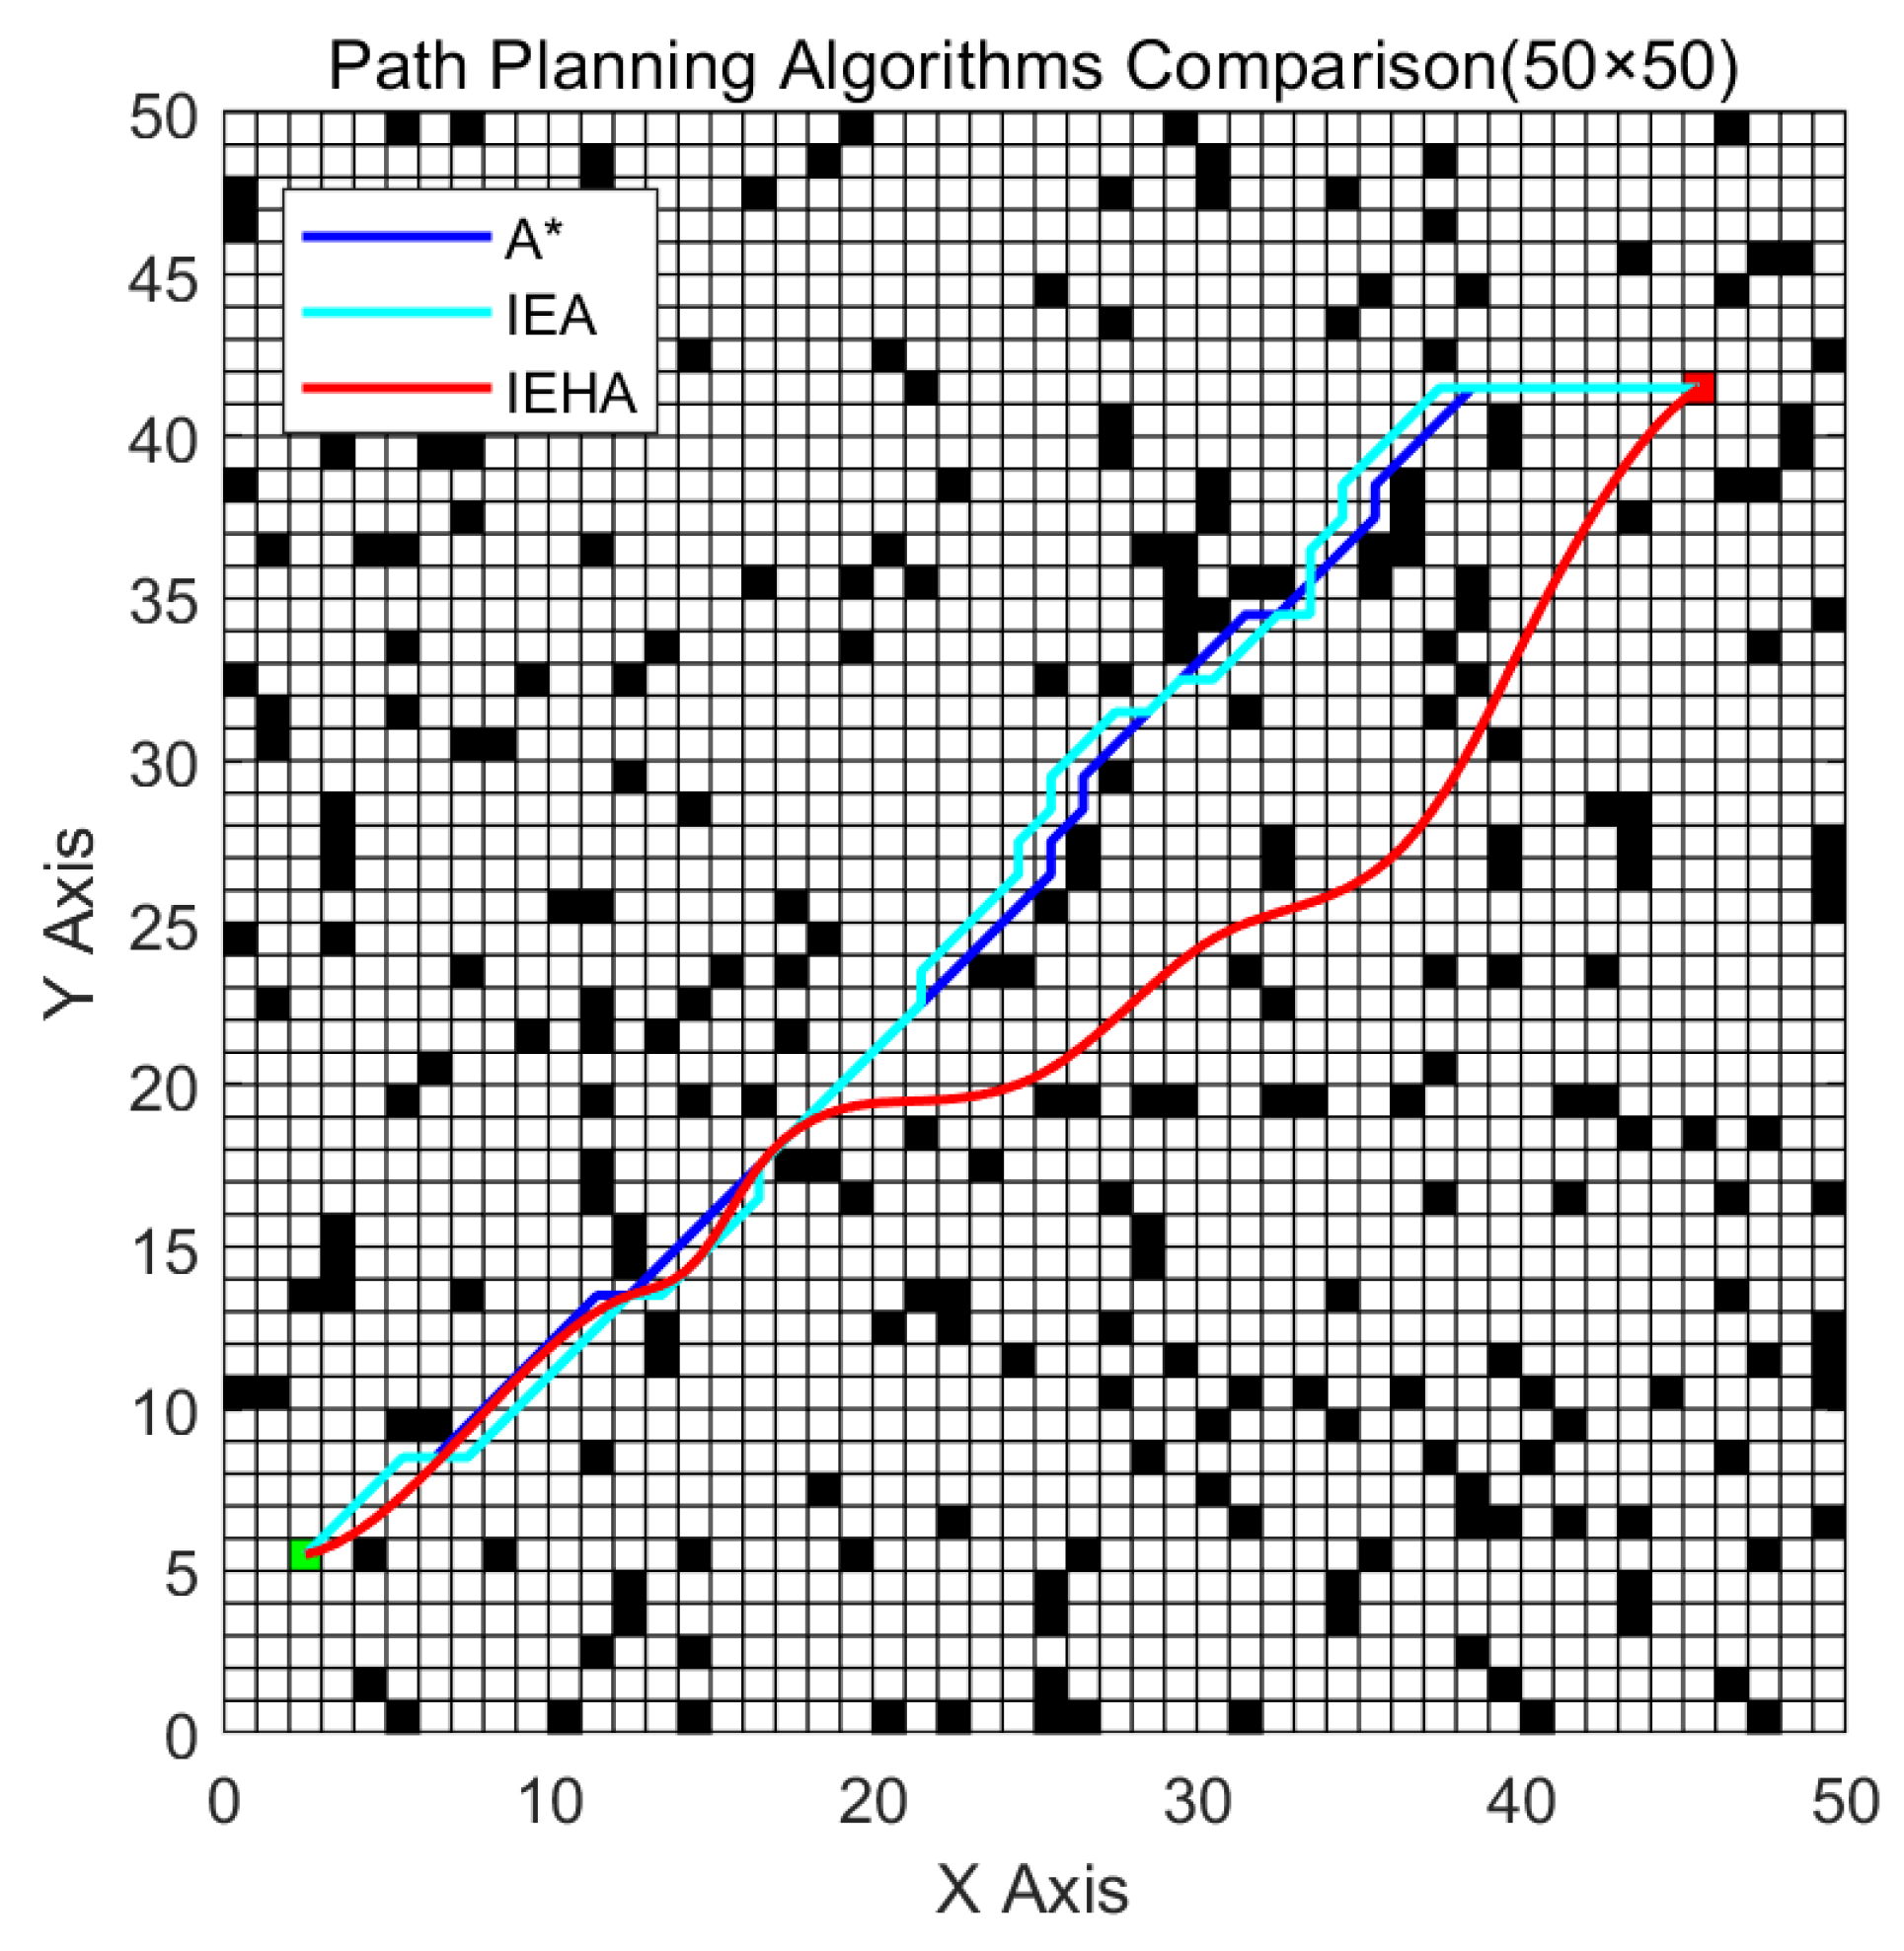
Figure 5 illustrates the 30 × 30 raster environment used in our research, where the green point signifies the starting point, the red point the target point, the black square denotes the obstacle [31], and the white square indicates the navigable area.

3.3. Review of Traditional A* Algorithms

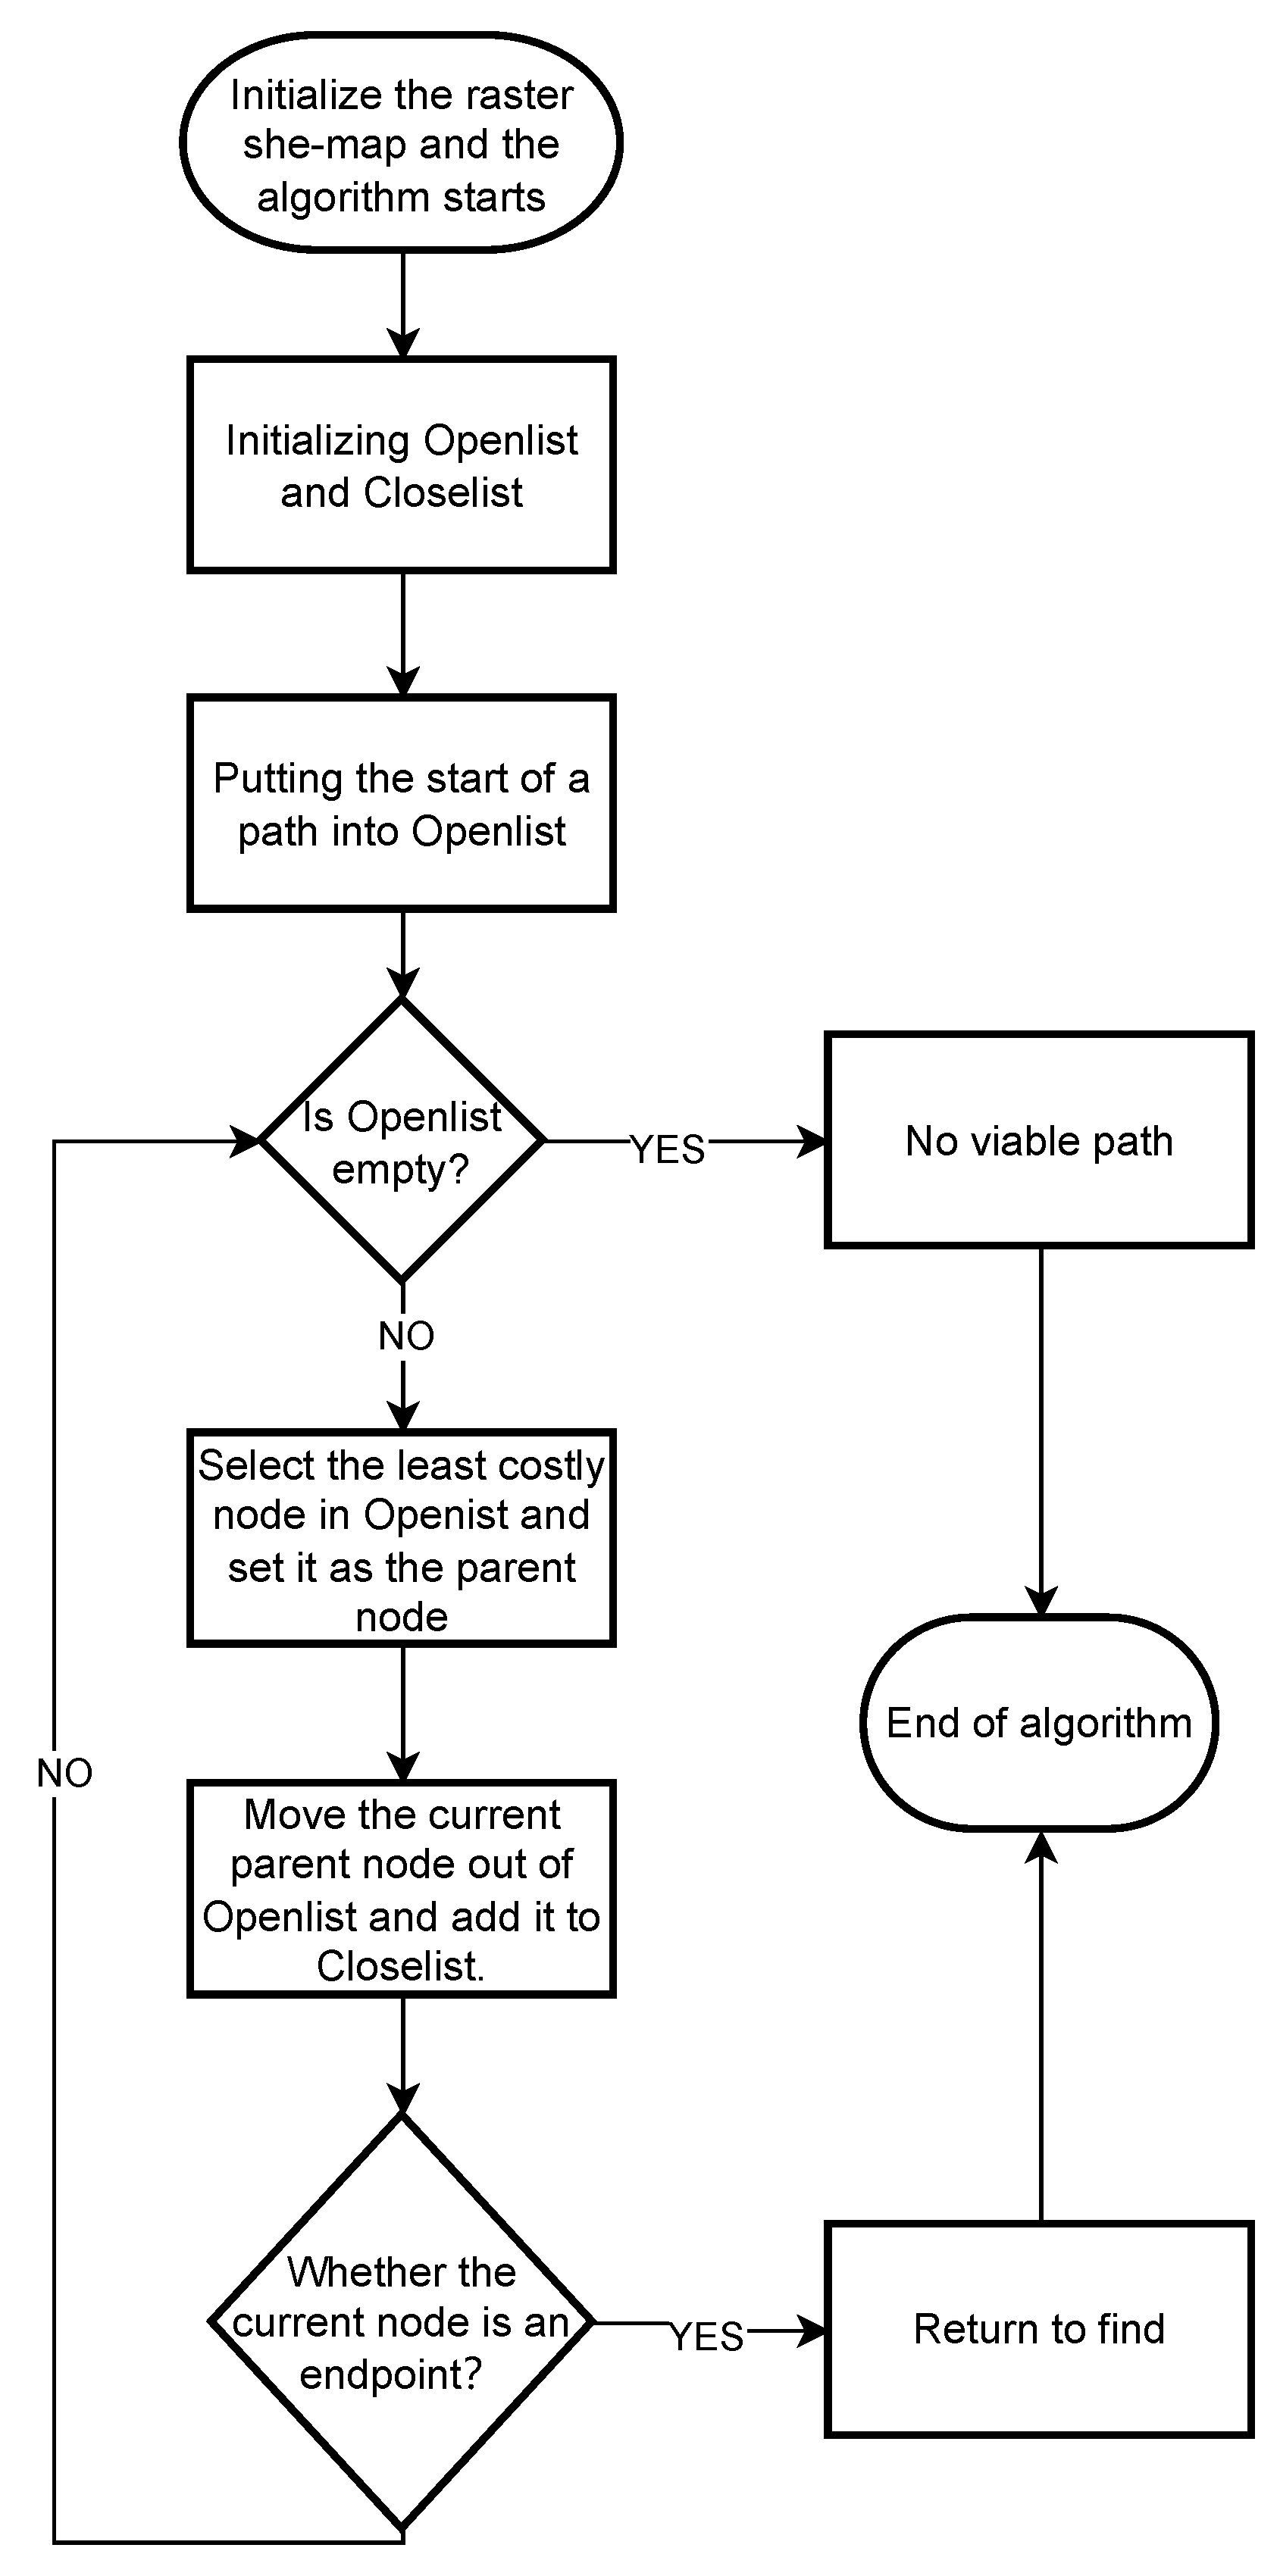
The operational flow of the traditional A* algorithm is depicted in Figure 6 [32], which can be summarized as evaluating nodes by integrating the cost and heuristic estimation, initiating from the starting node using a priority queue, and progressively exploring nodes within the open list until the target node is located or the open list is exhausted, followed by path reconstruction via backtracking to parent nodes. The core components primarily consist of two parts: the evaluation function and the search method. The evaluation function of the traditional A* algorithm is as follows:
f ( n ) = g ( n ) + h ( n )
In the traditional A* algorithm, the function f ( n ) is employed to assess the cumulative cost of node n. This cost comprises g ( n ) , which represents the actual expenditure from the origin node to the current node n, and h ( n ) , which estimates the heuristic cost from node n to the target node. On a grid or map, g ( n ) is typically calculated as the straight-line or Manhattan distance from the starting point to the current position. Common heuristic functions encompass Euclidean distance, Manhattan distance, and Chebyshev distance, among others. The selection of heuristic is contingent upon the specific spatial characteristics and requirements of the problem at hand.
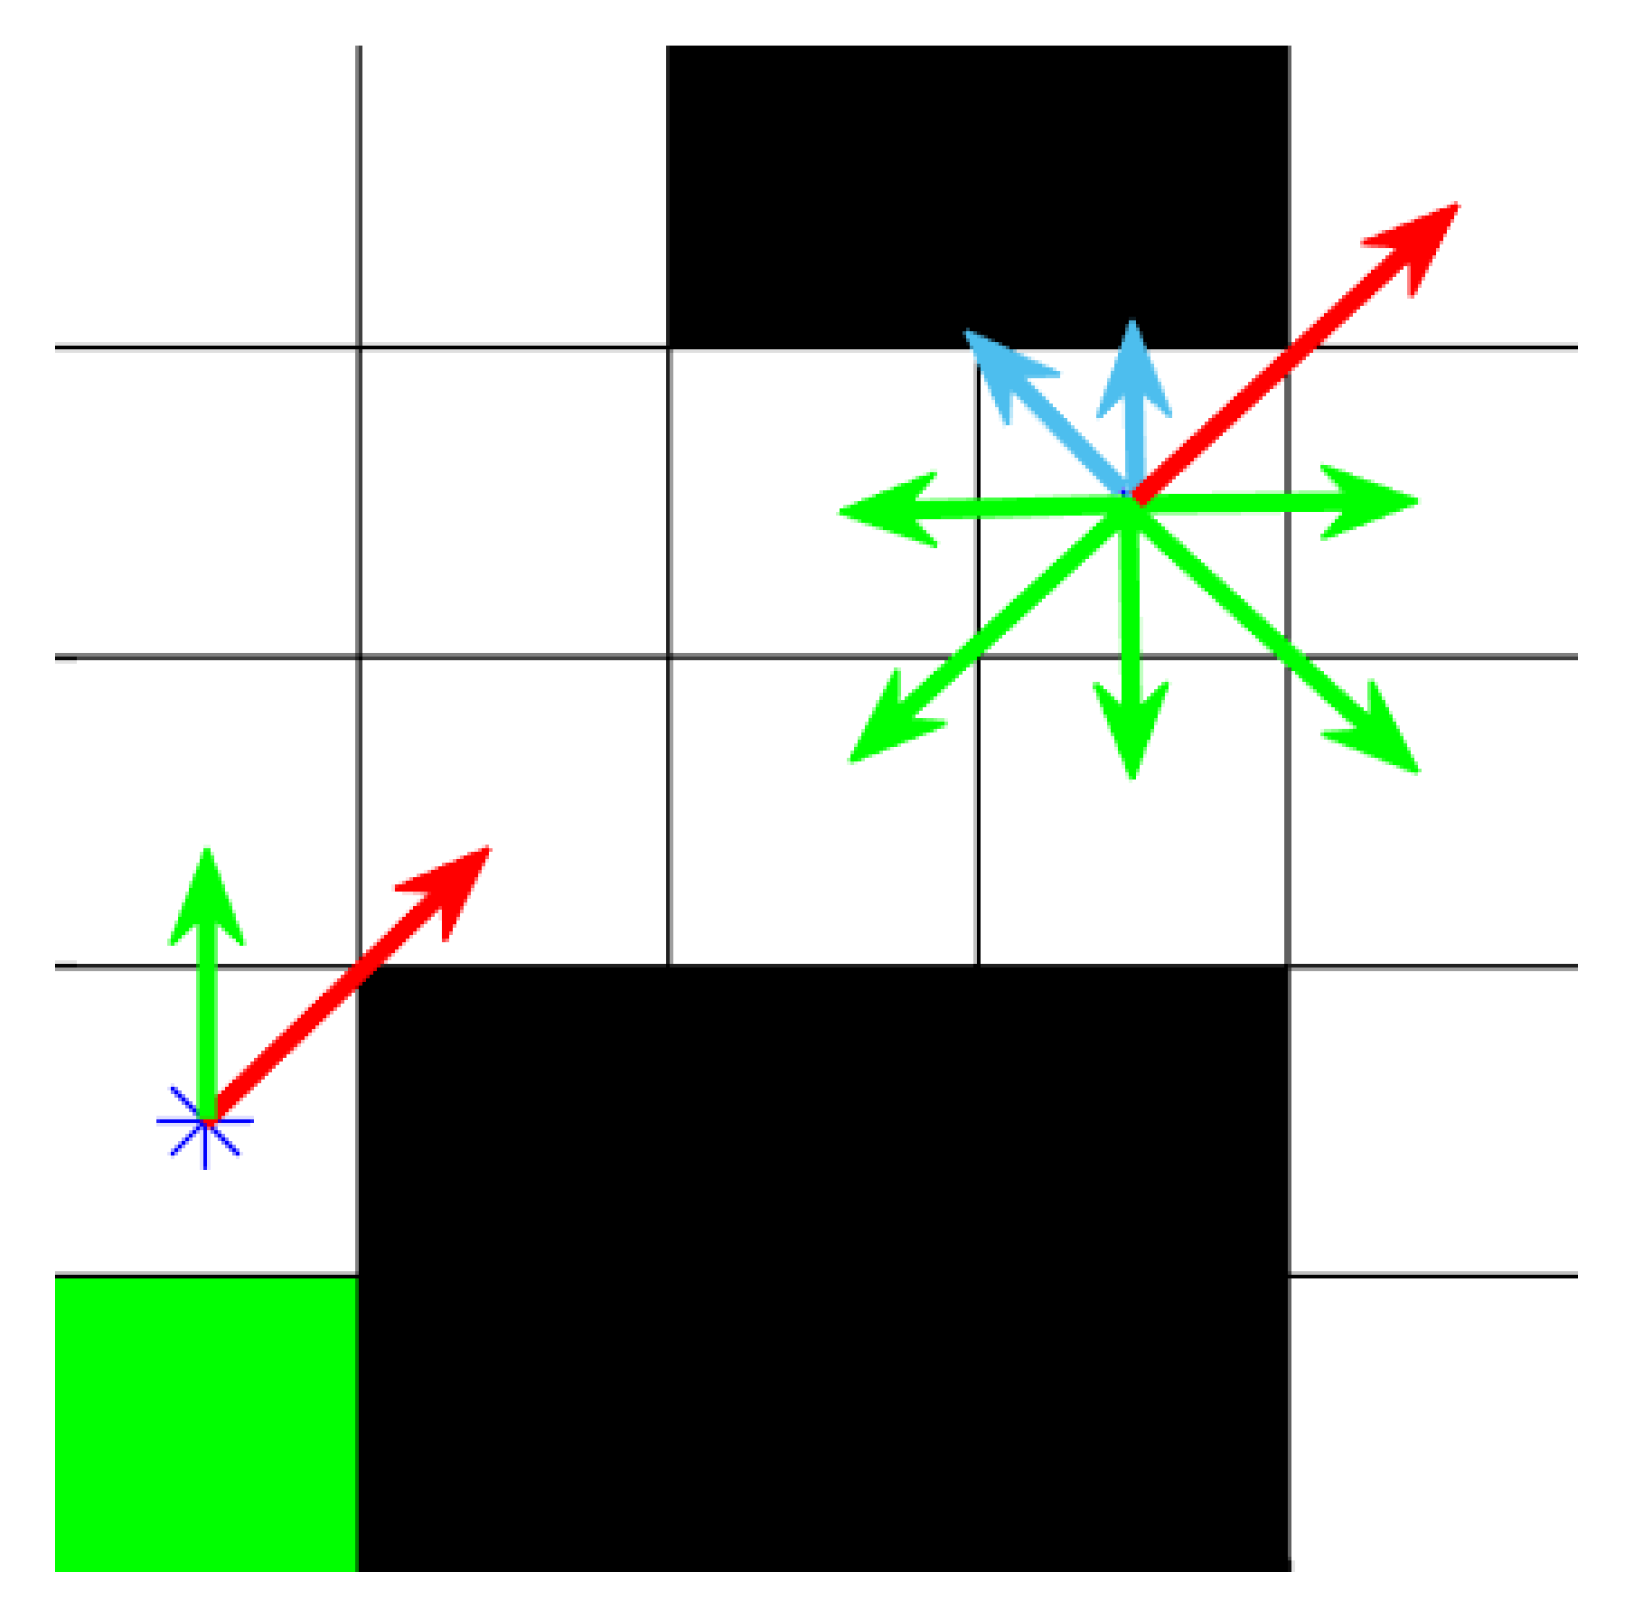
The traditional A* algorithm search methods are mainly 8-domain search method or 4-domain search method, but the traditional 8-domain search may lead to more tortuous paths and higher computational complexity, and the traditional 4-domain search may not be able to capture all the possible shortest paths, especially when it is necessary to bypass obstacles [33]. Combining the two goals of path security and path length that need to be considered, we believe that traditional search methods cannot fulfill them. Based on this, this paper optimizes the above two key nodes and conducts experimental simulations in a raster environment to further verify the effectiveness of the algorithm.

4. Improved Algorithm (IEHA) for This Paper

4.1. Improvement of Search Strategy

In traditional A* algorithms, the search methods primarily consist of the 8-domain search method or the 4-domain search method. However, the traditional 8-domain search may lead to more convoluted paths and higher computational complexity, while the traditional 4-domain search may fail to capture all possible shortest paths, especially when it is necessary to navigate around obstacles. Integrating the dual objectives of path security and path length that need to be considered, it is believed that traditional search methods cannot fulfill these requirements [34,35].
In this study, the improved algorithm (IEHA) is improved based on the traditional 8-domain search method by incorporating an obstacle adjacency check to ensure that child nodes are not adjacent to obstacles, and by verifying whether obstacles block the horizontal or vertical neighboring nodes of the child nodes, thereby enhancing the safety and precision of path planning. Concurrently, the removal of child nodes that do not meet the search selection criteria from the closed list, as well as the exclusion of closed nodes, optimizes the search efficiency and renders the algorithm more suitable for complex environments that necessitate the security of UAV flights and fine path planning.
Figure 7 shows the schematic diagram of the A* algorithm searching for child node traveling through the obstacle zone, the black squares represent the areas occupied by obstacles, while the white background indicates the regions where the UAV (Unmanned Aerial Vehicle) can safely navigate. The green arrows denote the directions of safe passage for the UAV, which completely avoid the obstacles. The blue arrows indicate the directions into which the UAV should not proceed, as they point directly at the obstacles. The red arrows represent paths that are open but pose a risk of collision with the obstacles. While the traditional 8-domain search method will have the situation of crossing the obstacle zone, while the 4-domain search method is unable to move diagonally. The traditional search method can avoid the blue marking situation, but cannot avoid the red marking situation. The improved algorithm in this paper (IEHA) can avoid both blue and red unsafe situations, making the UAV flight path safer and more reliable.

4.2. Improvement of Evaluation Function

The traditional A* algorithm is a deterministic search algorithm that combines the advantages of Dijkstra [36] and the breadth-first traversal (BFS) algorithm [37], and it is the most effective method for solving the shortest path length problem in the grid model. The evaluation function at the core of the algorithm is
f ( n ) = g ( n ) + h ( n )
where the traditional h ( n ) is generally the Euclidean distance from node n to the target node, diagonal distance or Manhattan distance, etc. In this paper, for comparison experiments, the traditional A* algorithm is taken as Euclidean distance:
h ( n ) = ( x 1 x 2 ) 2 + ( y 1 y 2 ) 2
In order to further optimize the heuristic function to obtain more accurate heuristic estimation, reduce the search space, and obtain the optimal requirements of UAV flight safety and flight path, an optimized heuristic cost function is designed. The Gaussian distribution and distance average are introduced and combined with the actual cost g ( n ) to jointly control the heuristic cost function, and the subsequent experimental simulation session proves that this optimization can find shorter and safer monitoring paths for UAV flights compared with the traditional heuristic function. The following is the optimized heuristic cost function h ( n ) in this paper:
h ( n ) = g ( n ) · exp d 1 + d 2 2 / 2 · σ 2
d 1 = | x 2 x 1 | + | y 2 y 1 |
d 2 = h ( n ) = ( x 1 x 2 ) 2 + ( y 1 y 2 ) 2
A Gaussian distribution probability density function is employed to model the cost distribution from the current node to the target node. The heuristic function is adjusted to align more closely with the actual shortest path estimation. This approach accounts for the probability distribution of distances between nodes, reflecting cost variations in path planning more accurately, particularly when multiple paths and uncertainties are present. Incorporating the average of distances before and after the current node assists the heuristic function in maintaining robustness against diverse path choices and minimizes bias due to the characteristics of a single node. Additionally, multiplying g ( n ) to the overall formula aids in balancing heuristic estimation with actual cost, enhancing the robustness of the search process.

4.3. Path Smoothing

Common smoothing methods include B-splines [38] and Bezier curves [39]. This paper proposes an improvement to Bezier smoothing. A two-layer smoothing strategy is implemented to effectively minimize path length and enhance path smoothness. Initially, a dynamic iterative inverse tracing strategy is employed to ensure both the overall safety and optimal length of the path, while eliminating redundancy. Subsequently, Bessel curve optimization is applied for a smoother UAV flight path. The smoothing process involves fitting the path points with a Bessel curve three times, ensuring a safer and more efficient trajectory. This method not only prevents path collisions with obstacles but also achieves a shorter path than the traditional A* algorithm, fulfilling the minimum objective of the mathematical model.
A dynamic iterative reverse tracing strategy is utilized in the initial stage to optimize the path, initiating the reverse search from the endpoint back to the starting point, ensuring optimal path length and overall safety. During this process, the improved search and evaluation functions remove unnecessary path segments, yielding a more concise and efficient route.
Path smoothing is executed in the second stage using Bessel curves, resulting in a smooth path by fitting the path points with a Bessel curve three times. This approach ensures path safety and reliability, securing a shorter route relative to the traditional A* algorithm, thus realizing the minimum objective of the mathematical model.

4.4. Process of Improved Algorithm (IEHA)

Compared with the traditional A* algorithm, an improved A* algorithm is proposed, integrating enhancements in search strategy, evaluation function, and path smoothing across three steps. This algorithm, named Improved Exploration and Heuristic Function of the A Algorithm (IEHA), is designed for UAV path planning in monitoring carbon dioxide emissions from heavy trucks. The flowchart of this algorithm is depicted in Figure 8.

5. Simulation Experiment and Analysis

In MATLAB R2021a, several simulation experiments were designed to assess the Improved A* Algorithm (IEHA)’s efficacy. Different environment models were used, including three scenarios: small-scale simulation experiments, large-scale simulation experiments, and a mapped representation of the actual port environment in the experimental setup. The algorithm was compared with state-of-the-art ones like the traditional A* algorithm, traditional Ant Colony Optimization (ACO), the initial algorithm (IEA) after this paper’s search strategy enhancement, and the final optimization algorithm (IEHA). These comparative experiments confirmed that our research algorithm (IEHA) works better in solving the initial path-planning problem for UAV monitoring of land-based heavy-vehicle carbon dioxide emissions in harbor areas.

5.1. The First Simulation Environment

In the first simulation environment, a 30 × 30 raster map is used, featuring obstacles, navigable areas, and start/target points as per Section 3.2. Figure 9 shows path planning diagrams for each algorithm in this environment. Table 1 offers a comparative analysis of the simulation results. In terms of average path length, the IEHA algorithm proposed in this paper is slightly better than ACO. ACO reduces the path length by 1.2% compared to IEHA; however, it incurs 11 more collisions, and the total number of collisions increases by 37.5% compared to the traditional A * algorithm. The core variables comprehensively considered for UAV monitoring of carbon dioxide emissions from heavy vehicles in the harbor area are the cost of UAV procurement and the length of the monitoring path, influencing the total economic and environmental costs, respectively. Thus, in the context of this paper’s research, the improved algorithm (IEHA) exhibits superior performance in the first simulation environment.
To further verify the robustness of the proposed algorithm (IEHA), the starting and target points of the previous environmental model were adjusted. Figure 10 illustrates the path planning diagrams for each algorithm within the second simulation environment. Table 2 presents a comparative analysis of the results from the second simulation environment. Compared to the traditional A* algorithm, the improved algorithm (IEHA) in this paper significantly reduces the number of turns and shortens the path length by 61.5 % and 4.5 %, respectively. The collision count is minimized to zero occurrences, greatly enhancing the safety and reliability of the path. In the average path length metric, the improved algorithm (IEHA) outperforms the other three algorithms, with both its average and minimum path lengths being shorter. It also reduces the average turning count by 61.5% compared to the traditional A* algorithm and by 58.3% compared to the ACO algorithm. Additionally, the improved algorithm (IEHA) achieves an average collision count of zero.

5.2. The Second Simulation Environment

To further verify the applicability and stability of the proposed algorithm (IEHA) in diverse scenarios and bolster theoretical support for its real-world applications, we introduced the third simulation environment. We transformed the layout of the actual port into a raster map by grayscale processing, as in Figure 11, for use in the simulation. Based on Figure 12 and Table 3 from the simulation experiments, the IEHA algorithm shows a clear edge in path planning within the third simulation set. Against the A* algorithm, IEHA cuts down average turns by 38.46%. Compared to the IEA algorithm, it slashes average turns by 57.89% and shortens the average path length by 6.48%. Though facing a 1.96% increase in average path length relative to the ACO algorithm, IEHA delivers a 33.33% drop in steering and eradicates collisions. Considering all factors, IEHA surpasses other algorithms in minimizing steering, preventing collisions, and optimizing path length. It achieves complete collision avoidance, remarkably boosting path planning safety and cutting potential collision-induced environmental costs and resource waste.

5.3. The Third Simulation Environment

To assess the viability of our algorithm (IEHA) in complex, large-scale scenarios akin to real-world settings, we conducted experiments using a 50 × 50 grid map with intricate obstacle arrangements, as shown in Figure 13. Following a thorough analysis of the initial three sets of experiments, our team identified limitations in the ant colony algorithm’s performance relative to the problem scope defined in this study. Consequently, we decided to discontinue its testing from the fourth experiment onward. Instead, we focused on algorithms that demonstrated superior security and operability to enhance the efficiency and practicality of our experiments. In the fourth simulation experiment, after changing the location of the start and target points in Figure 14, running the experiment multiple times, the results in Table 4 show that the IEHA algorithm significantly outperforms both the traditional A* and IEA algorithms in path planning. This algorithm can effectively ensure safety and reduce operational costs. Compared to the traditional A* algorithm, while the IEHA algorithm does not have a particularly significant advantage in terms of the shortest path length, it does have clear advantages in terms of Average Turning Count and Average Collision Count. Specifically, compared to the A* and IEA algorithms, the IEHA algorithm reduces the Average Turning Count by 44.4% and 75%, respectively, and eliminates the Average Collision Count entirely.
In this study, the robustness of the proposed IEHA algorithm is systematically verified through multiple sets of simulation experiments carried out in three different experimental environments. The experimental design encompasses simulation environments under two distinct starting conditions, assessing the algorithm’s performance and adaptability under diverse operating scenarios. The findings consistently demonstrate that this algorithm exhibits a high degree of feasibility and efficiency in UAV path planning tasks for carbon emission monitoring applications that involve vehicles in port areas. This result underscores the algorithm’s reliability and effectiveness in addressing complex real-world problems and provides a solid theoretical and empirical foundation for its further application in related fields.

6. Conclusions

Regarding research on UAV path planning for carbon dioxide emission monitoring of land-side heavy vehicles in ports, the contributions made in this paper are as follows:
  • It proposes a method for monitoring the land-side carbon dioxide emissions of the port to provide a more accurate carbon dioxide emission inventory (CEI) for the port. Additionally, a UAV monitoring path planning scheme for carbon dioxide emission monitoring on the port land side is presented. A rational mathematical model is constructed to consider the impact of safety and path length on the total cost, offering a novel perspective and research framework for subsequent carbon dioxide emission data monitoring tasks in the port area.
  • A systematic analysis of the path planning scheme for carbon dioxide emission monitoring on the land side of ports, focusing on heavy vehicles, was conducted to identify the causal and effect factors influencing the monitoring program. A hierarchical diagram of the influencing factors was established. This analysis aids subsequent researchers in recognizing and understanding the key issues and challenges that may arise during the implementation of the monitoring program, offering guidance for further in-depth studies.
  • Focusing on the initial path planning in the UAV monitoring process, an improved algorithm (IEHA) is proposed and verified through simulation experiments. The new algorithm ensures a safer and more reliable path generation. It optimizes path length and smooths the path, avoiding the risks associated with sharp turns, offering a new insights into solving the UAV monitoring path planning problem.
This paper addresses the issue of monitoring heavy truck carbon dioxide emissions on the land side of the port using UAVs to improve the port’s carbon dioxide emission inventory and contribute to the realization of energy-saving and green ecological goals. The focus of our study is on the initial UAV path planning problem, with potential for in-depth research on subsequent stages such as UAV task reallocation, path replanning, and coordination of multi-UAV monitoring tasks. Additionally, the path simulation experiments conducted are in a two-dimensional environment, with future experiments potentially incorporating three-dimensional real-world scenarios. Future research should delve into the limitations of UAV monitoring technology and explore ways to boost energy efficiency, optimize communication protocols, enhance environmental adaptability, and conduct in-depth studies on regulations and safety standards to ensure the legality and safety of UAV operations. These issues will become the key directions for our future research.

Author Contributions

X.W.: Conceptualization, Methodology, Writing—original draft, Investigation, Software, Data curation. Z.L.: Writing—review, Investigation, Validation. X.C.: Conceptualization, Methodology, Supervision. All authors have read and agreed to the published version of the manuscript.

Funding

This research was funded by the Key Research and Development Program of Hubei Province, China (Grant ID: 2023BAB097).

Institutional Review Board Statement

Not applicable.

Informed Consent Statement

Not applicable.

Data Availability Statement

The data supporting this study are not publicly available due to privacy. Requests for access to these data should be directed to Xiaohua Cao, tomm_cao@163.com.

Acknowledgments

We would like to thank Yan Chen for his insightful comments on the manuscript.

Conflicts of Interest

The authors declare no conflicts of interest.

References

  1. Lee, H.; Calvin, K.; Dasgupta, D.; Krinner, G.; Mukherji, A.; Thorne, P.; Trisos, C.; Romero, J.; Aldunce, P.; Barrett, K.; et al. Climate Change 2023: Synthesis Report. Contribution of working groups I, II and III to the Sixth Assessment Report of the Intergovernmental Panel on Climate Change; The Australian National University: Canberra, Australia, 2023. [Google Scholar]
  2. Ducruet, C.; Martin, B.P.; Sene, M.A.; Prete, M.L.; Sun, L.; Itoh, H.; Pigné, Y. Ports and their influence on local air pollution and public health: A global analysis. Sci. Total Environ. 2024, 915, 170099. [Google Scholar] [PubMed]
  3. Okşaş, O. Carbon emission strategies for container handling equipment using the activity-based method: A case study of Ambarlı container port in Turkiye. Mar. Policy 2023, 149, 105480. [Google Scholar] [CrossRef]
  4. Wang, B.; Liu, Q.; Wang, L.; Chen, Y.; Wang, J. A review of the port carbon emission sources and related emission reduction technical measures. Environ. Pollut. 2023, 320, 121000. [Google Scholar]
  5. United Nations Environment Programme. Emissions Gap Report 2023: Broken Record—Temperatures Hit New Highs, Yet World Fails to Cut Emissions (Again). 2023. Available online: https://www.unep.org/resources/emissions-gap-report-2023 (accessed on 1 March 2025).
  6. Villalba, G.; Gemechu, E.D. Estimating GHG emissions of marine ports—the case of Barcelona. Energy Policy 2011, 39, 1363–1368. [Google Scholar] [CrossRef]
  7. Alamoush, A.S.; Ölçer, A.I.; Ballini, F. Ports’ role in shipping decarbonisation: A common port incentive scheme for shipping greenhouse gas emissions reduction. Clean. Logist. Supply Chain. 2022, 3, 100021. [Google Scholar] [CrossRef]
  8. Freitas, D.; Gervásio, H. The Challenge of Benchmarking Carbon Emissions in Maritime Ports. Environ. Pollut. 2024, 363, 125170. [Google Scholar] [CrossRef]
  9. Ying, S. Research on Carbon Emission Reduction Status of Qinhuangdao Port Dry Bulk Terminal. Transp. Energy Conserv. Environ. Prot. 2024, 20, 49–54. [Google Scholar]
  10. Wang, L.; Peng, C.; Shi, W.; Zhu, M. Carbon dioxide emissions from port container distribution: Spatial characteristics and driving factors. Transp. Res. Part Transp. Environ. 2020, 82, 102318. [Google Scholar] [CrossRef]
  11. Wang, Y.; Zhou, M.; Wu, Z.; Wang, J.; Li, G. Carbon Flow Tracing based Consumer’s Indirect Carbon Emissions Calculation. In Proceedings of the 2023 IEEE Power & Energy Society General Meeting (PESGM), Orlando, FL, USA, 16–20 July 2023; pp. 1–5. [Google Scholar]
  12. Shen, L.; Hou, Y.; Yang, Q.; Lv, M.; Dong, J.X.; Yang, Z.; Li, D. Synergistic path planning for ship-deployed multiple UAVs to monitor vessel pollution in ports. Transp. Res. Part Transp. Environ. 2022, 110, 103415. [Google Scholar] [CrossRef]
  13. Murcia González, J.C. Analysis and measurement of SOx, CO2, PM and NOx emissions in port auxiliary vessels. Environ. Monit. Assess. 2021, 193, 374. [Google Scholar] [CrossRef]
  14. Mingzhong, F.; Xixian, L.; Shubi, H.; Tuo, J.; Yangdan, F.; Lichao, L. Research progress on volatile organic compound emission monitoring technology and equipment in port areas. Exp. Technol. Manag. 2024, 41, 70–77. [Google Scholar]
  15. Liu, Y.; Lan Yi, Z.; Xisheng, H.; Qiu, R. Spatio-temporal dynamics of pollutants and their influencing factors in the core area of Fuzhou City based on GIS technology and LUR modeling. J. Fujian Agric. For. Univ. (Nat. Sci. Ed.) 2020, 49, 550–558. [Google Scholar]
  16. Liao, C.H.; Tseng, P.H.; Cullinane, K.; Lu, C.S. The impact of an emerging port on the carbon dioxide emissions of inland container transport: An empirical study of Taipei port. Energy Policy 2010, 38, 5251–5257. [Google Scholar] [CrossRef]
  17. Sim, J. A carbon emission evaluation model for a container terminal. J. Clean. Prod. 2018, 186, 526–533. [Google Scholar] [CrossRef]
  18. Qin, H.; Cui, J.Q.; Li, J.; Bi, Y.; Lan, M.; Shan, M.; Liu, W.; Wang, K.; Lin, F.; Zhang, Y.; et al. Design and implementation of an unmanned aerial vehicle for autonomous firefighting missions. In Proceedings of the 2016 12th IEEE international conference on control and automation (ICCA), Kathmandu, Nepal, 1–3 June 2016; pp. 62–67. [Google Scholar]
  19. Zhu, X.; Lai, J.; Chen, S. Cooperative Location Method for Leader-Follower UAV Formation Based on Follower UAV’s Moving Vector. Sensors 2022, 22, 7125. [Google Scholar] [CrossRef]
  20. Zhiqiang, L.; Xiaoxu, Z.; Ling, L.; Yang, Z.; Zhang, L.; Yue, W.; Wenjuan, B.; Li, Y. Research on unmanned aircraft monitoring methods for the atmospheric environment. Environ. Monit. Manag. Technol. 2017, 29, 65–68. [Google Scholar]
  21. Shunji, X.; Xunpeng, N.; Jian, Z.; Zhang, Y. Research on Mobile Monitoring Platform for Ship Exhaust Based on Unmanned Aerial Vehicle (UAV). World Marit. Transp. 2020, 43, 34–39. [Google Scholar]
  22. Jońca, J.; Pawnuk, M.; Bezyk, Y.; Arsen, A.; Sówka, I. Drone-assisted monitoring of atmospheric pollution—A comprehensive review. Sustainability 2022, 14, 11516. [Google Scholar] [CrossRef]
  23. Liu, Y.; He, X.; Wang, W.; Zhu, C.; Jian, R.; Chen, J. Agri-environment atmospheric real-time monitoring technology based on drone and light scattering. Agriculture 2022, 12, 1885. [Google Scholar] [CrossRef]
  24. Chae, M.; Kwon, I.; Lee, D.; Kim, H.D. Threshold trigger embedded gas sensor for low-power and real-time atmospheric NO2 monitoring using drones. Chem. Eng. J. 2025, 507, 160605. [Google Scholar] [CrossRef]
  25. Cui, H.; Li, X.; Hao, S. The DEMATEL-ISM Analysis on Influence Factors of Economic Operation of Wind Power Projects. Int. J. u-e-Serv. Sci. Technol. 2016, 9, 35–42. [Google Scholar] [CrossRef]
  26. Chen, P.; Cai, B.; Wu, M.; Zhao, Y. Obstacle analysis of application of blockchain technology in power data trading based on improved DEMATEL–ISM method under fuzzy environment. Energy Rep. 2022, 8, 4589–4607. [Google Scholar]
  27. Fontela, E.; Gabus, A. Events and economic forecasting models. Futures 1974, 6, 329–333. [Google Scholar]
  28. John, R.A.B.; Ruban Kumar, A. A review on resistive-based gas sensors for the detection of volatile organic compounds using metal-oxide nanostructures. Inorg. Chem. Commun. 2021, 133, 108893. [Google Scholar] [CrossRef]
  29. Tian, X.; Cui, X.; Lai, T.; Ren, J.; Yang, Z.; Xiao, M.; Wang, B.; Xiao, X.; Wang, Y. Gas sensors based on TiO2 nanostructured materials for the detection of hazardous gases: A review. Nano Mater. Sci. 2021, 3, 390–403. [Google Scholar] [CrossRef]
  30. Candeloro, M.; Lekkas, A.M.; Sørensen, A.J. A Voronoi-diagram-based dynamic path-planning system for underactuated marine vessels. Control Eng. Pract. 2017, 61, 41–54. [Google Scholar]
  31. Zhang, H.; Tao, Y.; Zhu, W. Global path planning of unmanned surface vehicle based on improved A-Star algorithm. Sensors 2023, 23, 6647. [Google Scholar] [CrossRef]
  32. Hart, P.E.; Nilsson, N.J.; Raphael, B. A formal basis for the heuristic determination of minimum cost paths. IEEE Trans. Syst. Sci. Cybern. 1968, 4, 100–107. [Google Scholar]
  33. Foead, D.; Ghifari, A.; Kusuma, M.B.; Hanafiah, N.; Gunawan, E. A systematic literature review of A* pathfinding. Procedia Comput. Sci. 2021, 179, 507–514. [Google Scholar]
  34. Park, H.; Lee, J.H. B-spline curve fitting based on adaptive curve refinement using dominant points. Comput.-Aided Des. 2007, 39, 439–451. [Google Scholar]
  35. Xiang, D.; Lin, H.; Ouyang, J.; Huang, D. Combined improved A* and greedy algorithm for path planning of multi-objective mobile robot. Sci. Rep. 2022, 12, 13273. [Google Scholar] [CrossRef] [PubMed]
  36. Wang, H.; Yu, Y.; Yuan, Q. Application of Dijkstra algorithm in robot path-planning. In Proceedings of the 2011 Second International Conference on Mechanic Automation and Control Engineering, Inner Mongolia, China, 15–17 July 2011; pp. 1067–1069. [Google Scholar]
  37. Beamer, S.; Asanović, K.; Patterson, D. Direction-optimizing breadth-first search. Sci. Program. 2013, 21, 137–148. [Google Scholar] [CrossRef]
  38. XiangRong, T.; Yukun, Z.; XinXin, J. Improved A-star algorithm for robot path planning in static environment. J. Phys. Conf. Ser. 2021, 1792, 012067. [Google Scholar] [CrossRef]
  39. Patrikalakis, N.M.; Maekawa, T. Shape Interrogation for Computer Aided Design and Manufacturing; Springer: Berlin/Heidelberg, Germany, 2002; Volume 15. [Google Scholar]
Figure 1. The path planning scheme for monitoring carbon dioxide emissions from heavy vehicles on the land side of ports.
Applsci 15 03616 g001
Figure 2. DEMATEL centrality-impact diagram.
Applsci 15 03616 g002
Figure 3. DEMATEL influence-impact diagram.
Applsci 15 03616 g003
Figure 4. ISM analytics impact factor hierarchy chart.
Applsci 15 03616 g004
Figure 5. Raster environmental maps in this paper.
Applsci 15 03616 g005
Figure 6. Flowchart of traditional A* algorithm operation.
Applsci 15 03616 g006
Figure 7. Schematic diagram of searching for child node traveling.
Applsci 15 03616 g007
Figure 8. Flowchart of IEHA algorithm.
Applsci 15 03616 g008
Figure 9. Comparison of planning paths by algorithms.
Applsci 15 03616 g009
Figure 10. Comparison of planning paths by algorithms.
Applsci 15 03616 g010
Figure 11. A satellite image of an port in China.
Applsci 15 03616 g011
Figure 12. Comparison of planning paths by algorithms.
Applsci 15 03616 g012
Figure 13. Comparison of planning paths by algorithms.
Applsci 15 03616 g013
Figure 14. Comparison of planning paths by algorithms.
Applsci 15 03616 g014
Table 1. Performance comparison of algorithms.
Simulation Experiment One
AlgorithmSimulation CountAverage Turning CountAverage Collision Count
A*10128
IEA10160
ACO101211
IEHA10100
Simulation Experiment One
AlgorithmAverage Path LengthMinimum Path LengthMaximum Path Length
A*46.8746.8746.87
IEA50.9750.9750.97
ACO45.7144.7747.11
IEHA46.3146.3146.31
Table 2. Performance comparison of algorithms.
Simulation Experiment Two
AlgorithmSimulation CountAverage Turning CountAverage Collision Count
A*10138
IEA10181
ACO10126
IEHA1050
Simulation Experiment Two
AlgorithmAverage Path LengthMinimum Path LengthMaximum Path Length
A*44.5344.5344.53
IEA46.2846.2846.28
ACO46.5344.5348.18
IEHA42.5242.5242.52
Table 3. Performance comparison of path planning algorithms.
Simulation Experiment Three
AlgorithmSimulation CountAverage Turning CountAverage Collision Count
A*10137
IEA10193
ACO10127
IEHA1080
Simulation Experiment Three
AlgorithmAverage Path LengthMinimum Path LengthMaximum Path Length
A*39.5339.5339.53
IEA44.4544.4544.45
ACO41.540.3542.36
IEHA41.5741.5741.57
Table 4. Performance comparison of path planning algorithms.
Simulation Experiment Three
AlgorithmMinimum Path LengthAverage Turning CountAverage Collision Count
A*62.5399
IEA66.63201
IEHA62.5250
Disclaimer/Publisher’s Note: The statements, opinions and data contained in all publications are solely those of the individual author(s) and contributor(s) and not of MDPI and/or the editor(s). MDPI and/or the editor(s) disclaim responsibility for any injury to people or property resulting from any ideas, methods, instructions or products referred to in the content.

