1. Introduction
In today’s world, while the demand for energy is constantly increasing, the use of fossil fuels, which play a significant role in energy production, is diminishing due to their limited reserves and also their causing adverse environmental effects. This situation leads to a shift towards renewable energy sources, which are environmentally friendly and sustainable.
Among renewable energy sources obtained from naturally replenishing resources, such as wind, wave, and biomass, solar energy, in particular, stands out in meeting the need for electricity.
As the role of photovoltaic (PV) systems in energy production continues to grow, improving the efficiency of these systems holds critical importance in terms of both economic and environmental sustainability. The main factors affecting the efficiency of PV systems include meteorological variables, such as temperature, solar radiation, wind speed, humidity, and cloud cover. Additionally, the limitation of PV systems is that electricity generation is only possible during daylight hours. To overcome this limitation, energy storage solutions are being developed. However, energy storage requires additional space and incurs extra costs.
Thus, energy management and planning play a crucial role. Renewable energy sources are not only clean and domestically available but also preferable due to their potential to be more cost-effective and reliable. However, it should not be overlooked that certain renewable energy sources, such as solar energy, generate intermittent power, and environmental factors significantly influence their energy production performance. In this context, many methods have been proposed in the literature to increase the efficiency of PV systems [
1,
2,
3]. These proposed methods aim to contribute to energy efficiency and sustainability in the established plants.
Before establishing a power plant, it is crucial to conduct a feasibility study that includes planning related to the process, determining the energy potential of the region where the installation will be placed, assessing the supply–demand balance, and calculating costs. In summary, energy management and planning must be conducted considering all these factors while maintaining a balance between supply and demand. Otherwise, significant challenges may arise for both consumers and power generation plants.
In feasibility studies, accurately determining the energy potential of the region where the plant will be established ensures the correct assessment of plant capacity, equipment to be used, and, consequently, costs. Accurately determining the energy potential of the region also ensures the correct prediction of the energy to be produced by the plant.
Proper power forecasting of power plants at the installation stage can help mitigate these challenges. Accurate power forecasting enhances energy management by providing answers to key questions, such as which power plant should be utilized, at what time intervals, and in what quantities, thereby reducing uncertainties in energy security. Furthermore, when renewable energy sources are available (solar power plants when sunlight is sufficient, wind power plants when wind speeds are adequate, hydroelectric plants when river flow is appropriate, etc.), planned reductions in fossil fuel consumption can yield economic benefits, allowing consumers to access cheaper energy.
In recent years, with the increasing number of PV plants, energy production is directly affected by changing weather conditions since energy production depends on sunlight. Therefore, before the establishment of a PV plant, or during capacity expansion planning, it becomes essential to make energy forecasts considering the changing climate and environmental conditions in order to foresee the future of the plant. Otherwise, incorrect energy forecasts will lead to faulty energy planning. This will dampen the economic advantages of renewable energy and negatively affect both grid stability and energy management.
Accurate power forecasting contributes to improving the performance of PV systems. Efficiently determining the number of panels and, consequently, other equipment, reduces costs and helps manage energy production, transmission, and storage efficiency by ensuring that the forecasted energy production values are close to the actual values.
For these reasons, many studies have already been conducted on power forecasting in PV systems and improving the accuracy of these predictions [
4,
5,
6,
7,
8,
9,
10,
11]. In these studies, the accuracy of energy forecasts has been improved using artificial intelligence (AI) techniques.
In one of the studies in the literature [
5], a deep Convolutional Neural Network (CNN) architecture was combined with Empirical Mode Decomposition for PV power generation forecasting, and power forecasting was performed for a 1000 kW PV power plant in Türkiye [
6] employing an autoregressive neural network model optimized with the Levenberg–Marquardt algorithm to forecast PV power generation for the upcoming weekend. Additionally, ref. [
7] used a single axis tracking PV module and Artificial Neural Network (ANN) architecture to predict energy production on sunny and cloudy days. The effectiveness of this model was validated through experimental studies. In [
8], a hybrid model consisting of CNN and Long Short-Term Memory was proposed for PV energy production forecasting at a solar power plant in Busan, South Korea. Another study employed a new CNN model, SolarNet, for short-term PV power forecasting [
9].
Apart from these studies, in [
10], various machine learning algorithms (including Support Vector Machines (SVM), ANN, and Linear Regression (LR)) were used for day-ahead prediction PV power forecasting, and in [
11], various ensemble learning models (such as AdaBoost Trees, Bagged Trees, Random Forests, and Generalized Random Forests) were used for short-term solar radiation forecasting.
Despite the effectiveness of existing forecasting models, there is a significant gap in the literature in the lack of comprehensive studies that integrate multiple meteorological parameters simultaneously. Most existing studies primarily focus on a limited set of meteorological variables, often neglecting the combined influence of multiple parameters. This simplification reduces the accuracy and generalizability of the models, particularly under diverse and dynamic weather conditions. This study addresses this gap by proposing a multi-parameter ANN-based model that combines temperature, radiation, wind speed, cloud cover, and humidity to improve forecast accuracy.
In this study, power forecasting is performed using ANN methodology with power and meteorological data collected from a solar power plant in Elazığ, Türkiye. The ANN technique was chosen due to its ability to model complex nonlinear relationships for PV power forecasting.
The accuracy and complexity of power forecasting methods vary depending on the technique used. Traditional statistical models, such as LR and SVM, offer simplicity and interpretability, but may struggle to capture the nonlinear relationships between meteorological variables and PV power output. More advanced machine learning models, such as ANNs and CNNs, have demonstrated higher predictive accuracy due to their ability to model complex nonlinear dependencies. However, these models require more computational resources and careful hyper-parameter tuning to achieve high performance. In this study, an ANN was selected as it provides a balance between predictive accuracy and computational efficiency, making it suitable for PV power forecasting where both precision and processing speed are crucial.
Since meteorological factors affect the power output of PV systems in solar power plants, the amount of energy produced varies depending on weather conditions, which complicates the energy system. Therefore, accurate power forecasting is crucial for energy planning, and energy planning must be carried out in a way that ensures economic solutions while maintaining grid stability.
Deep learning techniques, such as CNN and LSTM, have shown superior performance in handling sequential and spatial data but may require large datasets and extended training times. In contrast, an ANN provides a flexible and efficient approach to power forecasting while maintaining a manageable computational cost. For this reason, the Levenberg–Marquardt algorithm was chosen for training due to its effectiveness in refining the ANN weights and achieving rapid convergence.
A review of the existing literature reveals that most studies primarily consider radiation, temperature, and wind speed as the key parameters, often overlooking the combined effects of other crucial meteorological factors, such as humidity and cloud cover. As a result, comprehensive multi-parameter approaches remain scarce, limiting the reliability of power forecasting models. When evaluating the forecast, the more environmental factors that are considered together, the more accurate the prediction will be. For this purpose, this study proposes an ANN-based power forecasting model that takes multiple environmental factors, such as temperature, radiation, wind speed, cloud cover, and humidity, into account, aiming to enhance forecasting performance. Using the meteorological data along with the actual power values generated in the solar power plant, an ANN model was trained to develop a reliable PV power forecasting model.
The main contributions of this study can be summarized as follows:
Unlike most existing studies that focus on a limited set of meteorological variables (such as radiation, temperature, and wind speed), this study integrates five meteorological parameters—temperature, radiation, wind speed, cloud cover, and humidity—into an ANN-based forecasting model to enhance accuracy. This comprehensive approach improves the model’s robustness under varying weather conditions.
A detailed analysis is provided regarding the impact of each meteorological parameter on PV power generation. In particular, this study highlights the underexplored effects of humidity and cloud cover, contributing new insights into their influence on power output.
The model is tested using real meteorological and power generation data from a solar power plant in Elazığ, Türkiye, demonstrating its practical applicability.
The effectiveness of the proposed model is rigorously validated through multiple performance metrics, including Coefficient of Regression (R) and Mean Squared Error (MSE), achieving high predictive accuracy, with R = 0.98 and MSE = 0.03.
A comparative evaluation using cross-validation is conducted to benchmark the ANN model against alternative AI techniques such as GPR, SVM, LR, DT, and Ensemble learning. The results confirm that the ANN model outperforms these methods, reinforcing its suitability for PV power forecasting.
These contributions enhance the existing body of research by addressing the key limitations in previous studies and presenting a more holistic forecasting methodology. The findings underscore the importance of incorporating multiple meteorological factors to achieve more reliable and precise energy predictions, which is crucial for effective energy planning and management.
The paper is organized as follows: In
Section 2, PV systems and electricity generation, and factors affecting PV system performance are discussed, highlighting the importance of meteorological factors in power forecasting. In
Section 3, information is provided about the proposed ANN model. Finally, in
Section 4, the ANN-based power forecasting model developed in this study is presented, and the system’s success is supported by experimental results.
2. Photovoltaic Systems
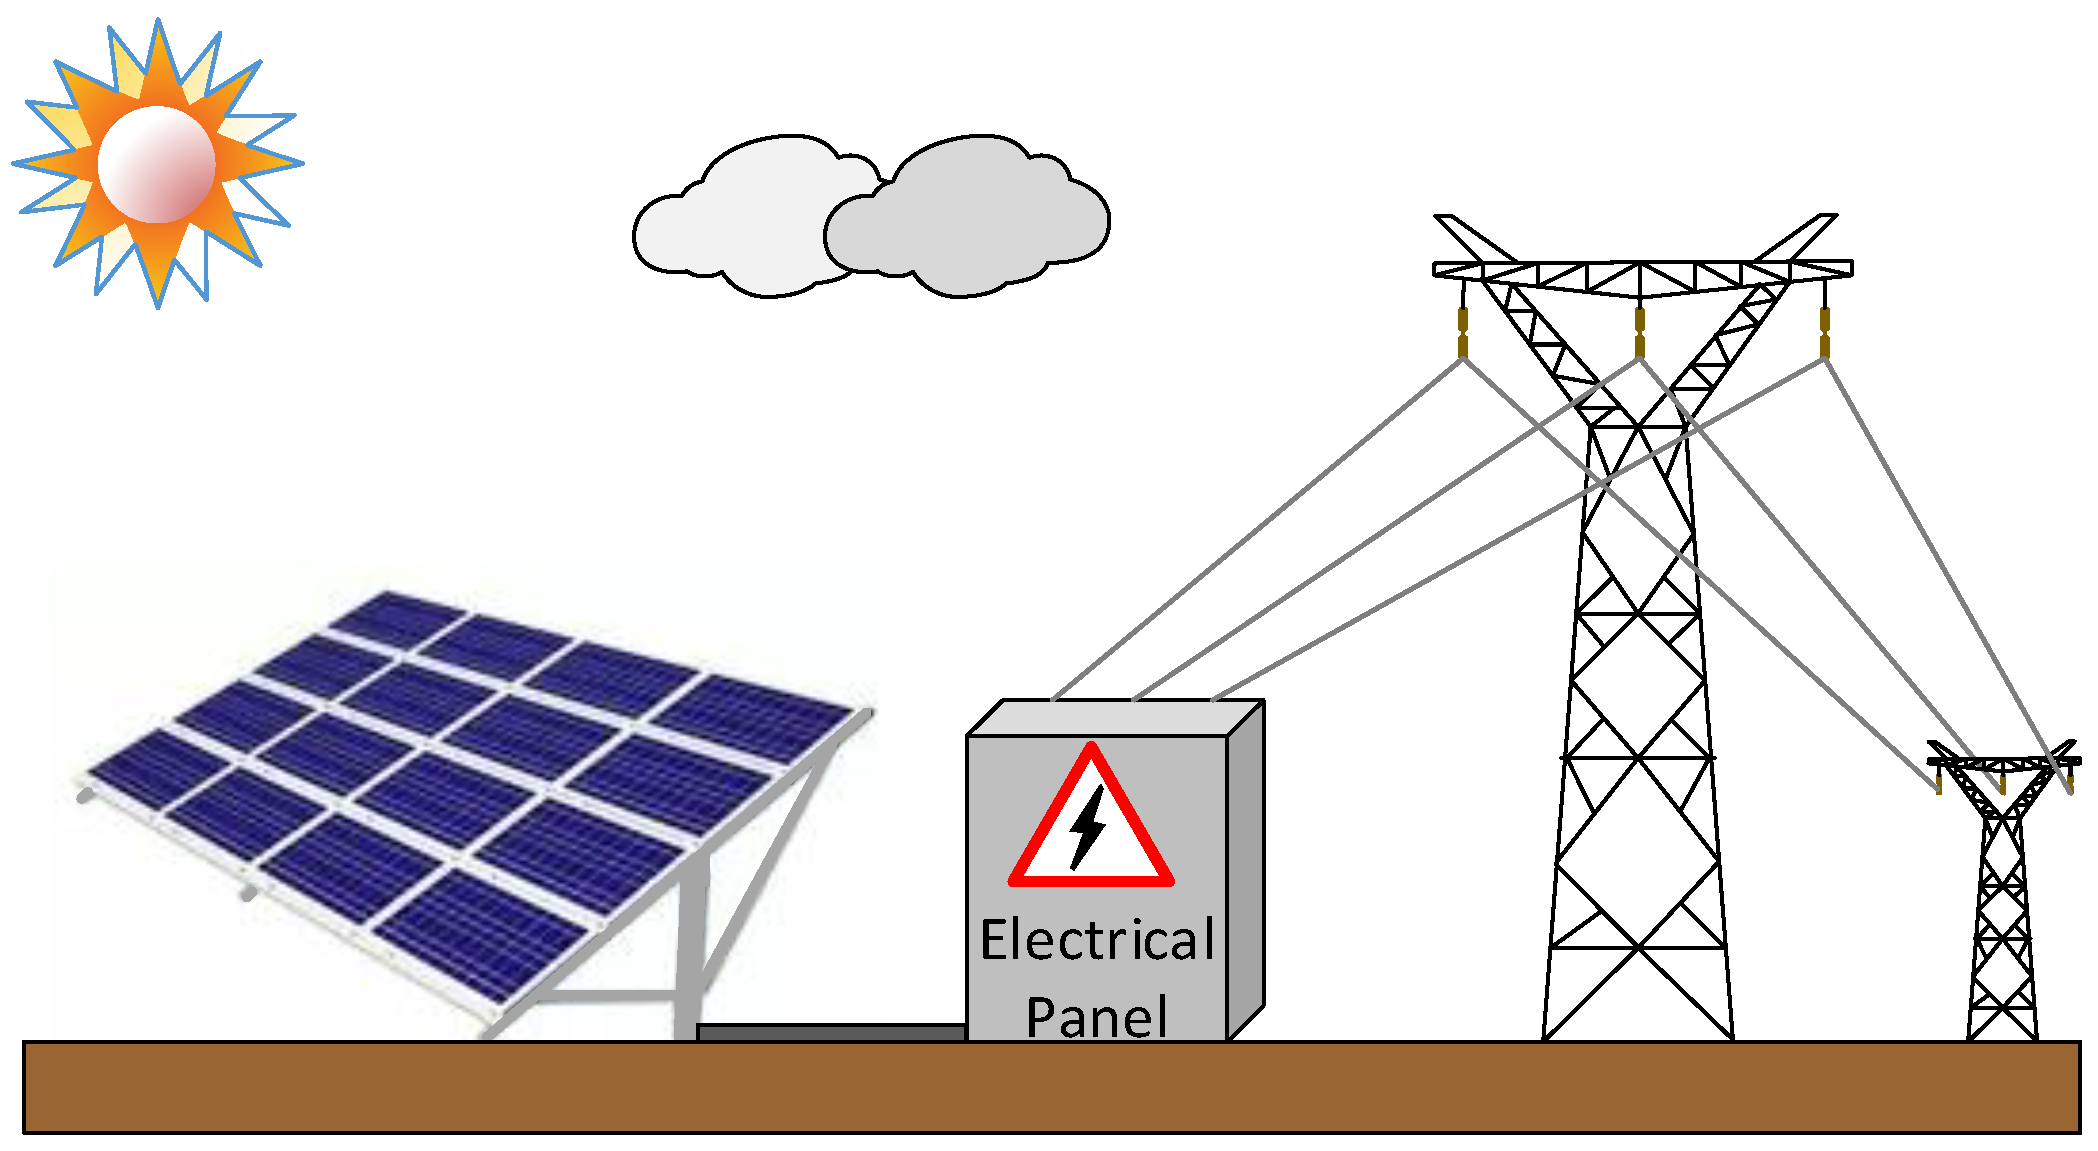
PV systems, composed of semiconductor materials, are devices that directly convert sunlight into electrical energy upon exposure to solar radiation. When sunlight strikes the semiconductor material, electron movement occurs between the
p-type and n-type regions, generating an electric current. This is the fundamental operational principle of PV conversion. In grid-connected systems, the generated energy is transferred to the grid after being converted to AC by an inverter, as seen in
Figure 1.
PV systems offer advantages such as long lifespan, environmental friendliness, modularity, and relatively low maintenance and operational costs. However, their efficiency is somewhat limited, and various environmental factors impact their performance. Parameters such as temperature, geographical location, surface cleanliness, and shading are among the key environmental factors affecting PV system performance [
12].
Since the efficiency of PV panels is highly dependent on solar irradiance, different technologies such as bifacial panels, solar tracking systems and maximum power point tracking (MPPT) techniques have been developed to maximize energy yield [
1,
3].
In addition to solar radiation, dust accumulation, clouds and shading significantly impact the efficiency of PV systems [
1,
2,
13,
14,
15]. Dust on the panel surface reduces the effectiveness of solar radiation absorption, while shading and cloud cover limit the available sunlight.
Humidity is another significant environmental factor, as it not only reduces the amount of solar radiation reaching the panel but also leads to technical issues such as corrosion [
16,
17].
Temperature variations also play a crucial role in PV performance, as excessive heat can reduce efficiency, whereas wind may help mitigate temperature effects and naturally remove dust and other particulates [
18,
19,
20,
21].
Due to these environmental dependencies, effective energy management and forecasting are crucial for PV power systems. Proper forecasting enables efficient energy planning, cost reduction, and improved grid stability. While PV systems are a promising renewable energy source, their intermittency remains a challenge, highlighting the necessity of accurate power predictions.
To address this challenge, numerous studies have been conducted on precise energy forecasting. These studies employ various techniques and approaches to achieve reliable power estimation. Recently, AI techniques, including ANN, fuzzy logic, genetic algorithms, and Extreme Learning Machines (ELM), have been utilized for power forecasting [
4,
5,
6,
7,
8,
9,
10,
11]. These advancements contribute to more reliable PV power integration into the energy grid.
3. Neural Network
AI is a scientific field that enables computers to perform problem-learning and solving processes by imitating human cognitive abilities [
22].
Today, AI is utilized for various purposes in many fields, including education, healthcare, defense, energy, and construction [
22,
23,
24]. There exist numerous AI algorithms [
4], each possessing distinct technical characteristics and being selected based on factors such as purpose of use and data type. Among the most commonly used AI algorithms are LR, SVM, Decision Trees (DT), Gaussian Process Regression (GPR), and ANN.
Among these methods, an ANN operates by mimicking biological neural networks. It first analyzes the problem, learns the input/output values, and then autonomously generates the most appropriate output based on predefined criteria. ANNs are known for their effectiveness in solving nonlinear problems [
25,
26]. Moreover, they have a large memory capacity and high-speed processing capability. Therefore, ANNs are widely used in solving complex problems [
27].
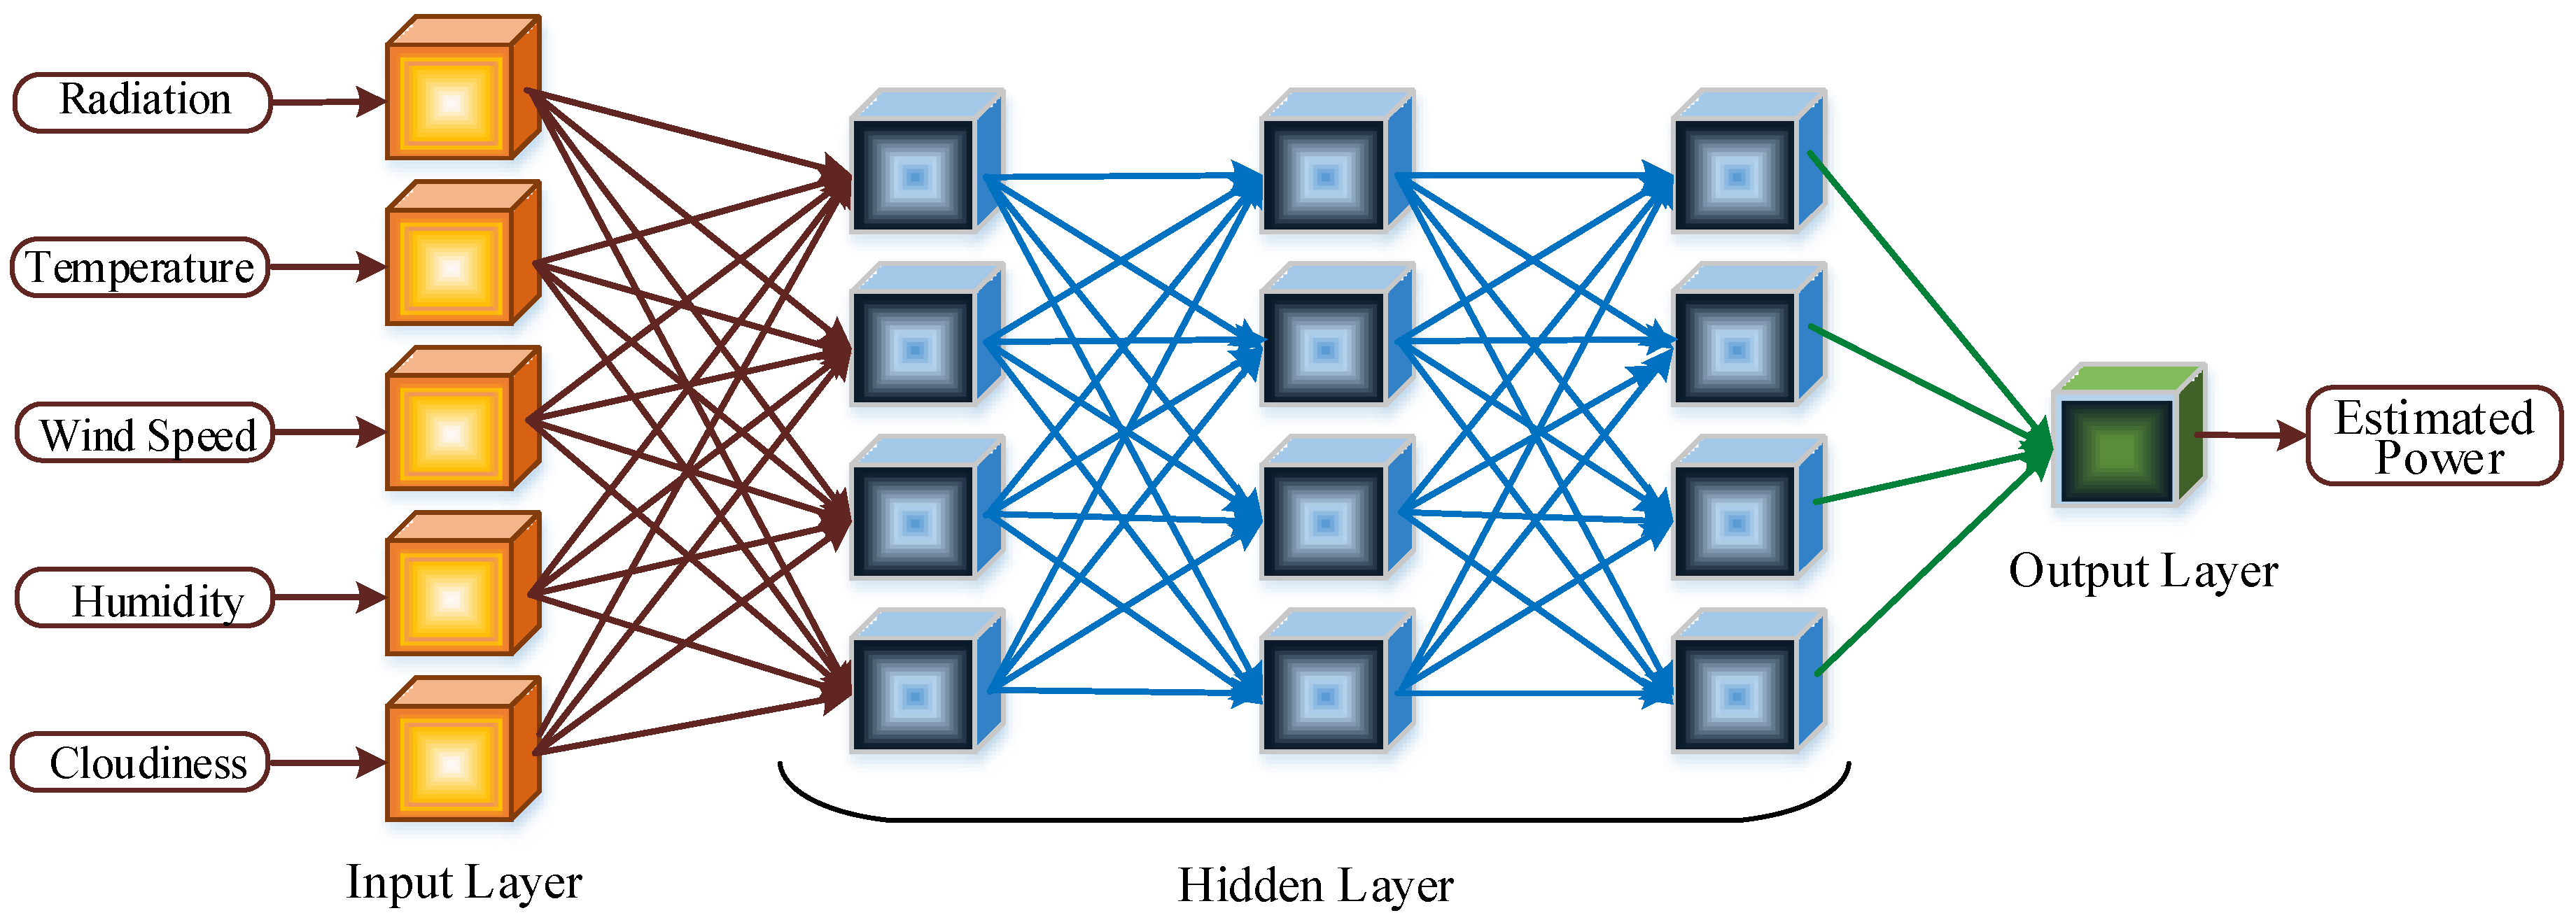
A basic ANN model consists of an input layer, an output layer, and one or more hidden layers, as illustrated in
Figure 2. The data related to the problem to be solved by the ANN are transmitted to the input layer as input values. These input values are analyzed in the hidden layer, which contains hidden neurons, and processed to generate the appropriate output value by the ANN model. The number of hidden layers, which is determined according to the complexity of the problem, enhances the learning ability of the network but, unfortunately, also increases the complexity of the model. The processed data from the hidden layer are then transmitted to the output layer, where the target values are generated and presented as output values.
The success of an ANN model is fundamentally based on several factors, including the quantity and quality of data, the model architecture (e.g., number of layers, number of neurons, activation functions), and the learning process.
Various algorithms are used in an ANN to train the network, enhance the learning process, and make accurate predictions. The Levenberg–Marquardt algorithm is one of the widely used techniques for training ANNs. By combining the advantages of Gauss–Newton and gradient descent methods, it provides fast and accurate learning and can solve nonlinear least squares problems [
28]. In addition, the Levenberg–Marquardt algorithm regulates the learning process by dynamically adjusting the step size, and provides faster convergence and higher accuracy [
28].
The learning process consists of training, validation, and testing phases. To complete these phases, the input data of the model are divided into three subsets and used accordingly in training, validation, and testing processes. In the training phase, input data are processed, network weights are adjusted, and the error rate is minimized. This phase forms the foundation of the learning process. In the second phase, validation, the generalization ability of the model is evaluated, and parameters are updated to prevent overfitting. If the model’s performance does not meet expectations, the number of layers and neurons can be adjusted to improve accuracy. In the final phase, testing, the model’s performance is evaluated using data that were never used in the training and validation phases.
Various metrics are used to evaluate the performance of the ANN model. R and MSE are among the most commonly used metrics.
The MSE value is calculated using Equation (1).
In the equation, n represents the number of data points, while yi denotes the actual value and yi′ represents the predicted value. The closer the predicted value is to the actual value, the smaller the MSE value becomes. In other words, a lower MSE indicates higher model performance. Ideally, the MSE value is expected to be as close to zero as possible.
The R value is calculated using Equation (2).
In the equation, and represents the mean of the actual values. The R value indicates how close the predicted values are to the actual values. Therefore, a high R value signifies a successful model and demonstrates that the predicted values closely align with the actual values. Ideally, R is expected to be as close to 1 as possible.
In addition to R and MSE, other common evaluation metrics include Mean Absolute Error (MAE) and Root Mean Square Error (RMSE). MAE represents the average absolute differences between predicted and actual values, while RMSE is simply the square root of MSE, placing more emphasis on larger errors. Since both metrics are closely related to MSE, their interpretations align with the conclusions derived from MSE, reinforcing the reliability of the model’s performance evaluation.
4. Power Prediction in Photovoltaic Systems with Neural Networks
Since many parameters have an impact on the energy production performance of PV systems, all these factors must be taken into account for an accurate power estimate.
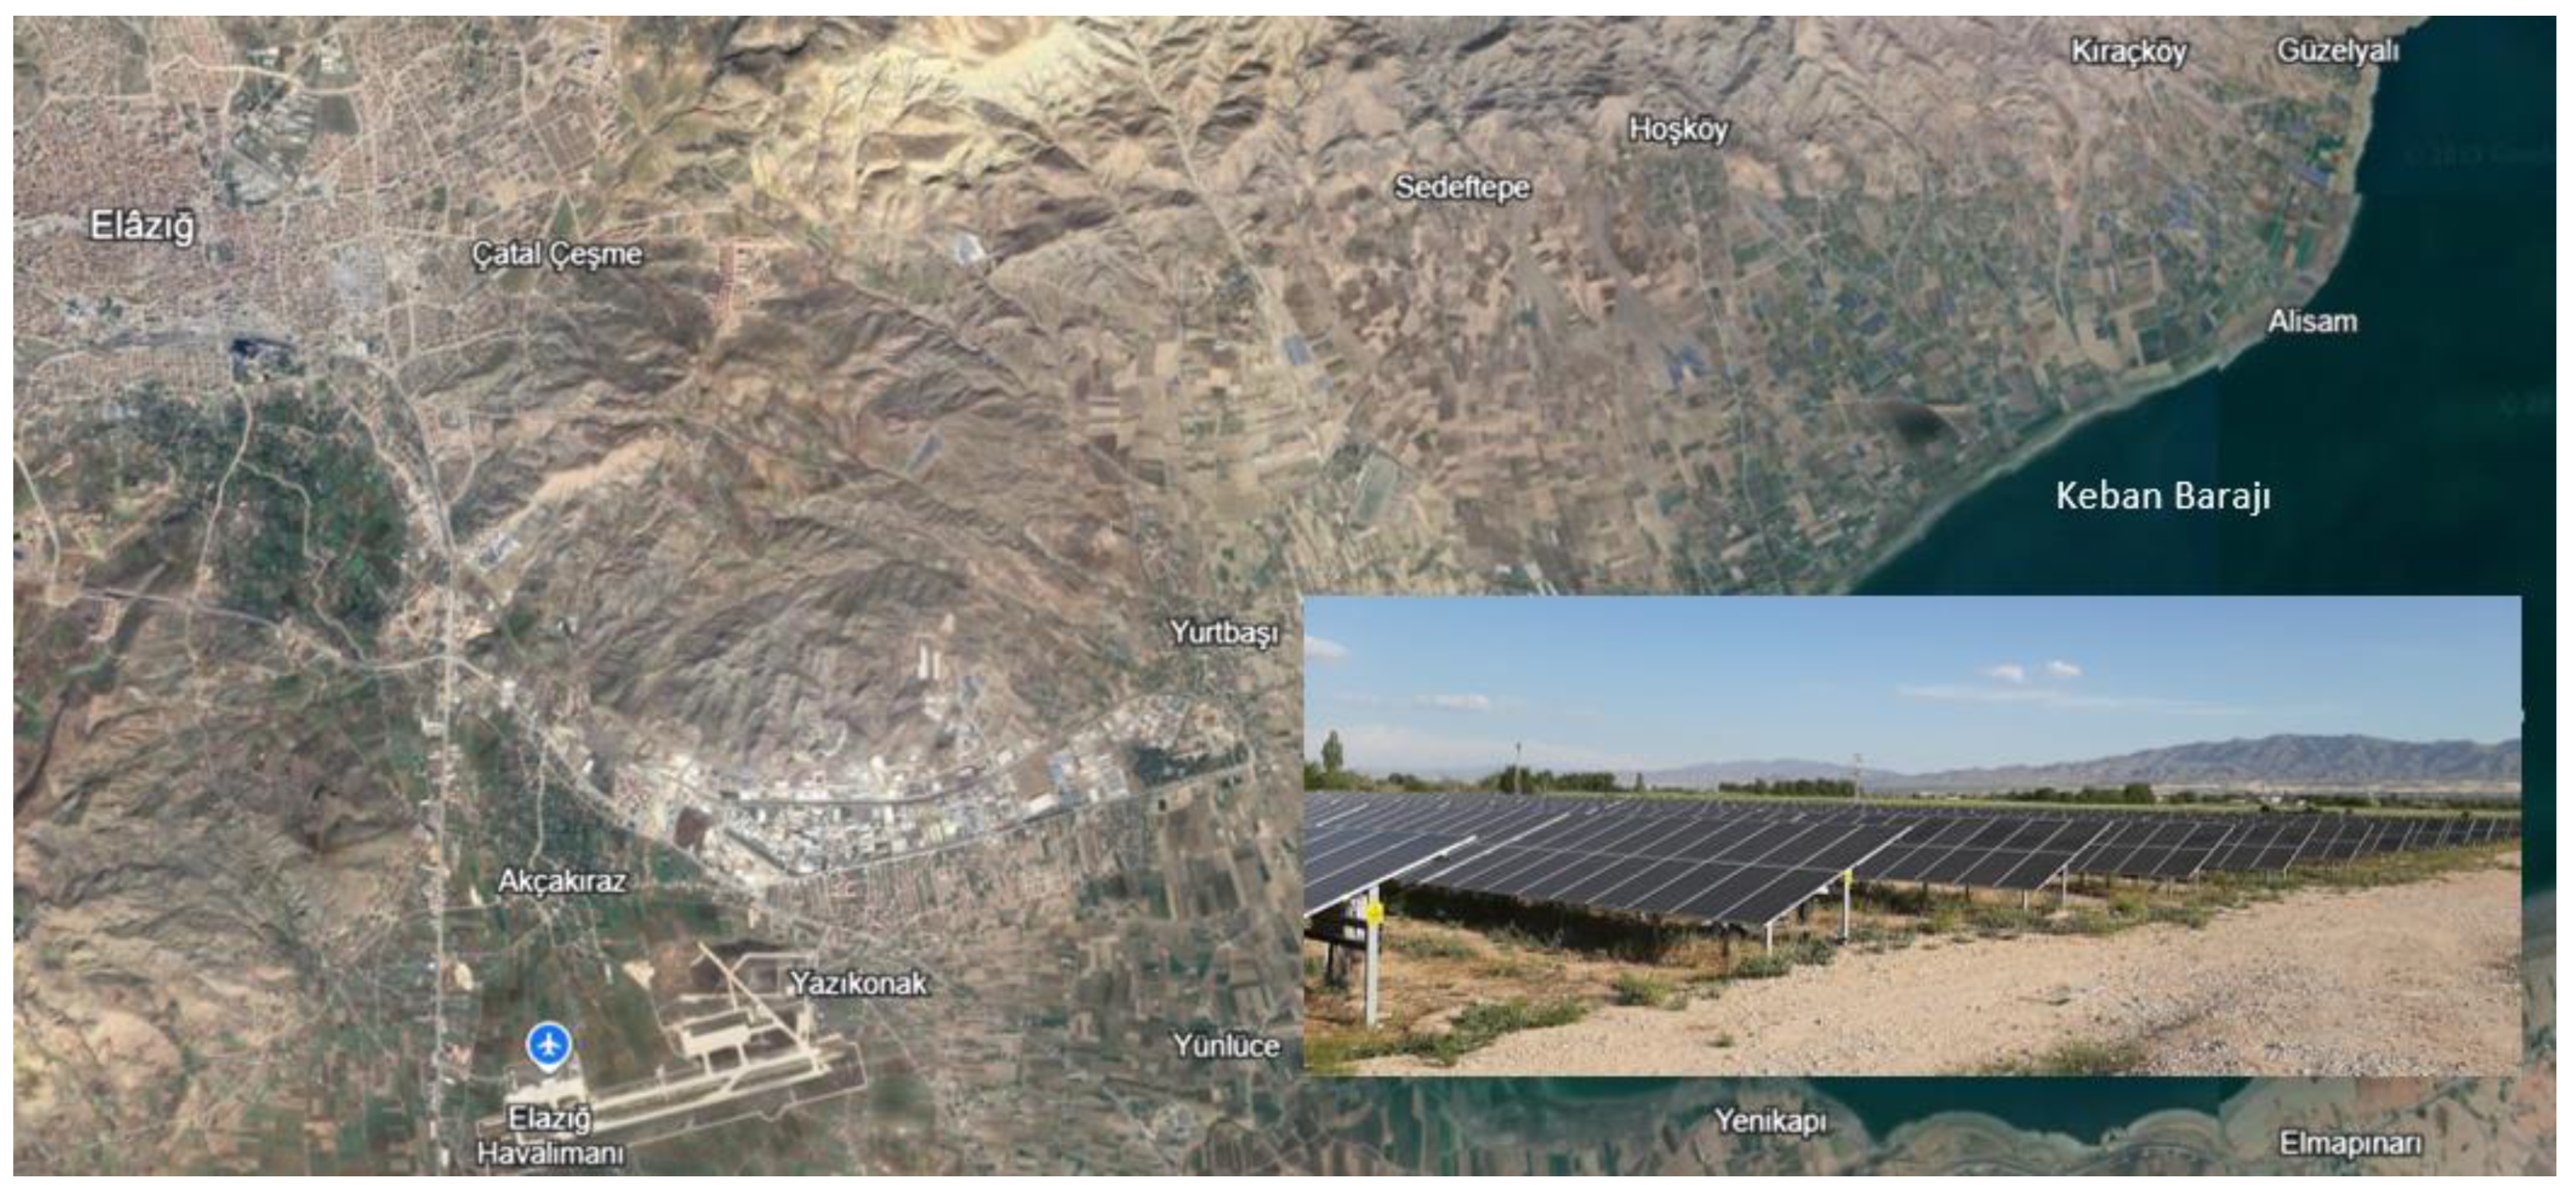
In this study, the ANN is used to make a multi-parameter power estimation in PV systems. For this purpose, the actual power values obtained from a PV power plant located in Elazığ, Türkiye, together with the meteorological data of radiation, temperature, wind speed, humidity and cloudiness obtained between 1 January 2024 and 31 December 2024, are used.
The PV power plant is installed on a 1000 m
2 area at the Latitude 38.59 Longitude 39.33 coordinates, as seen in
Figure 3.
The system, with a nominal power of 998 kW, uses 3564 PV panels (16.5 strings consisting of Mono-crystalline modules, 18 in parallel and 12 in series). Technical information on PV modules is presented in
Table 1.
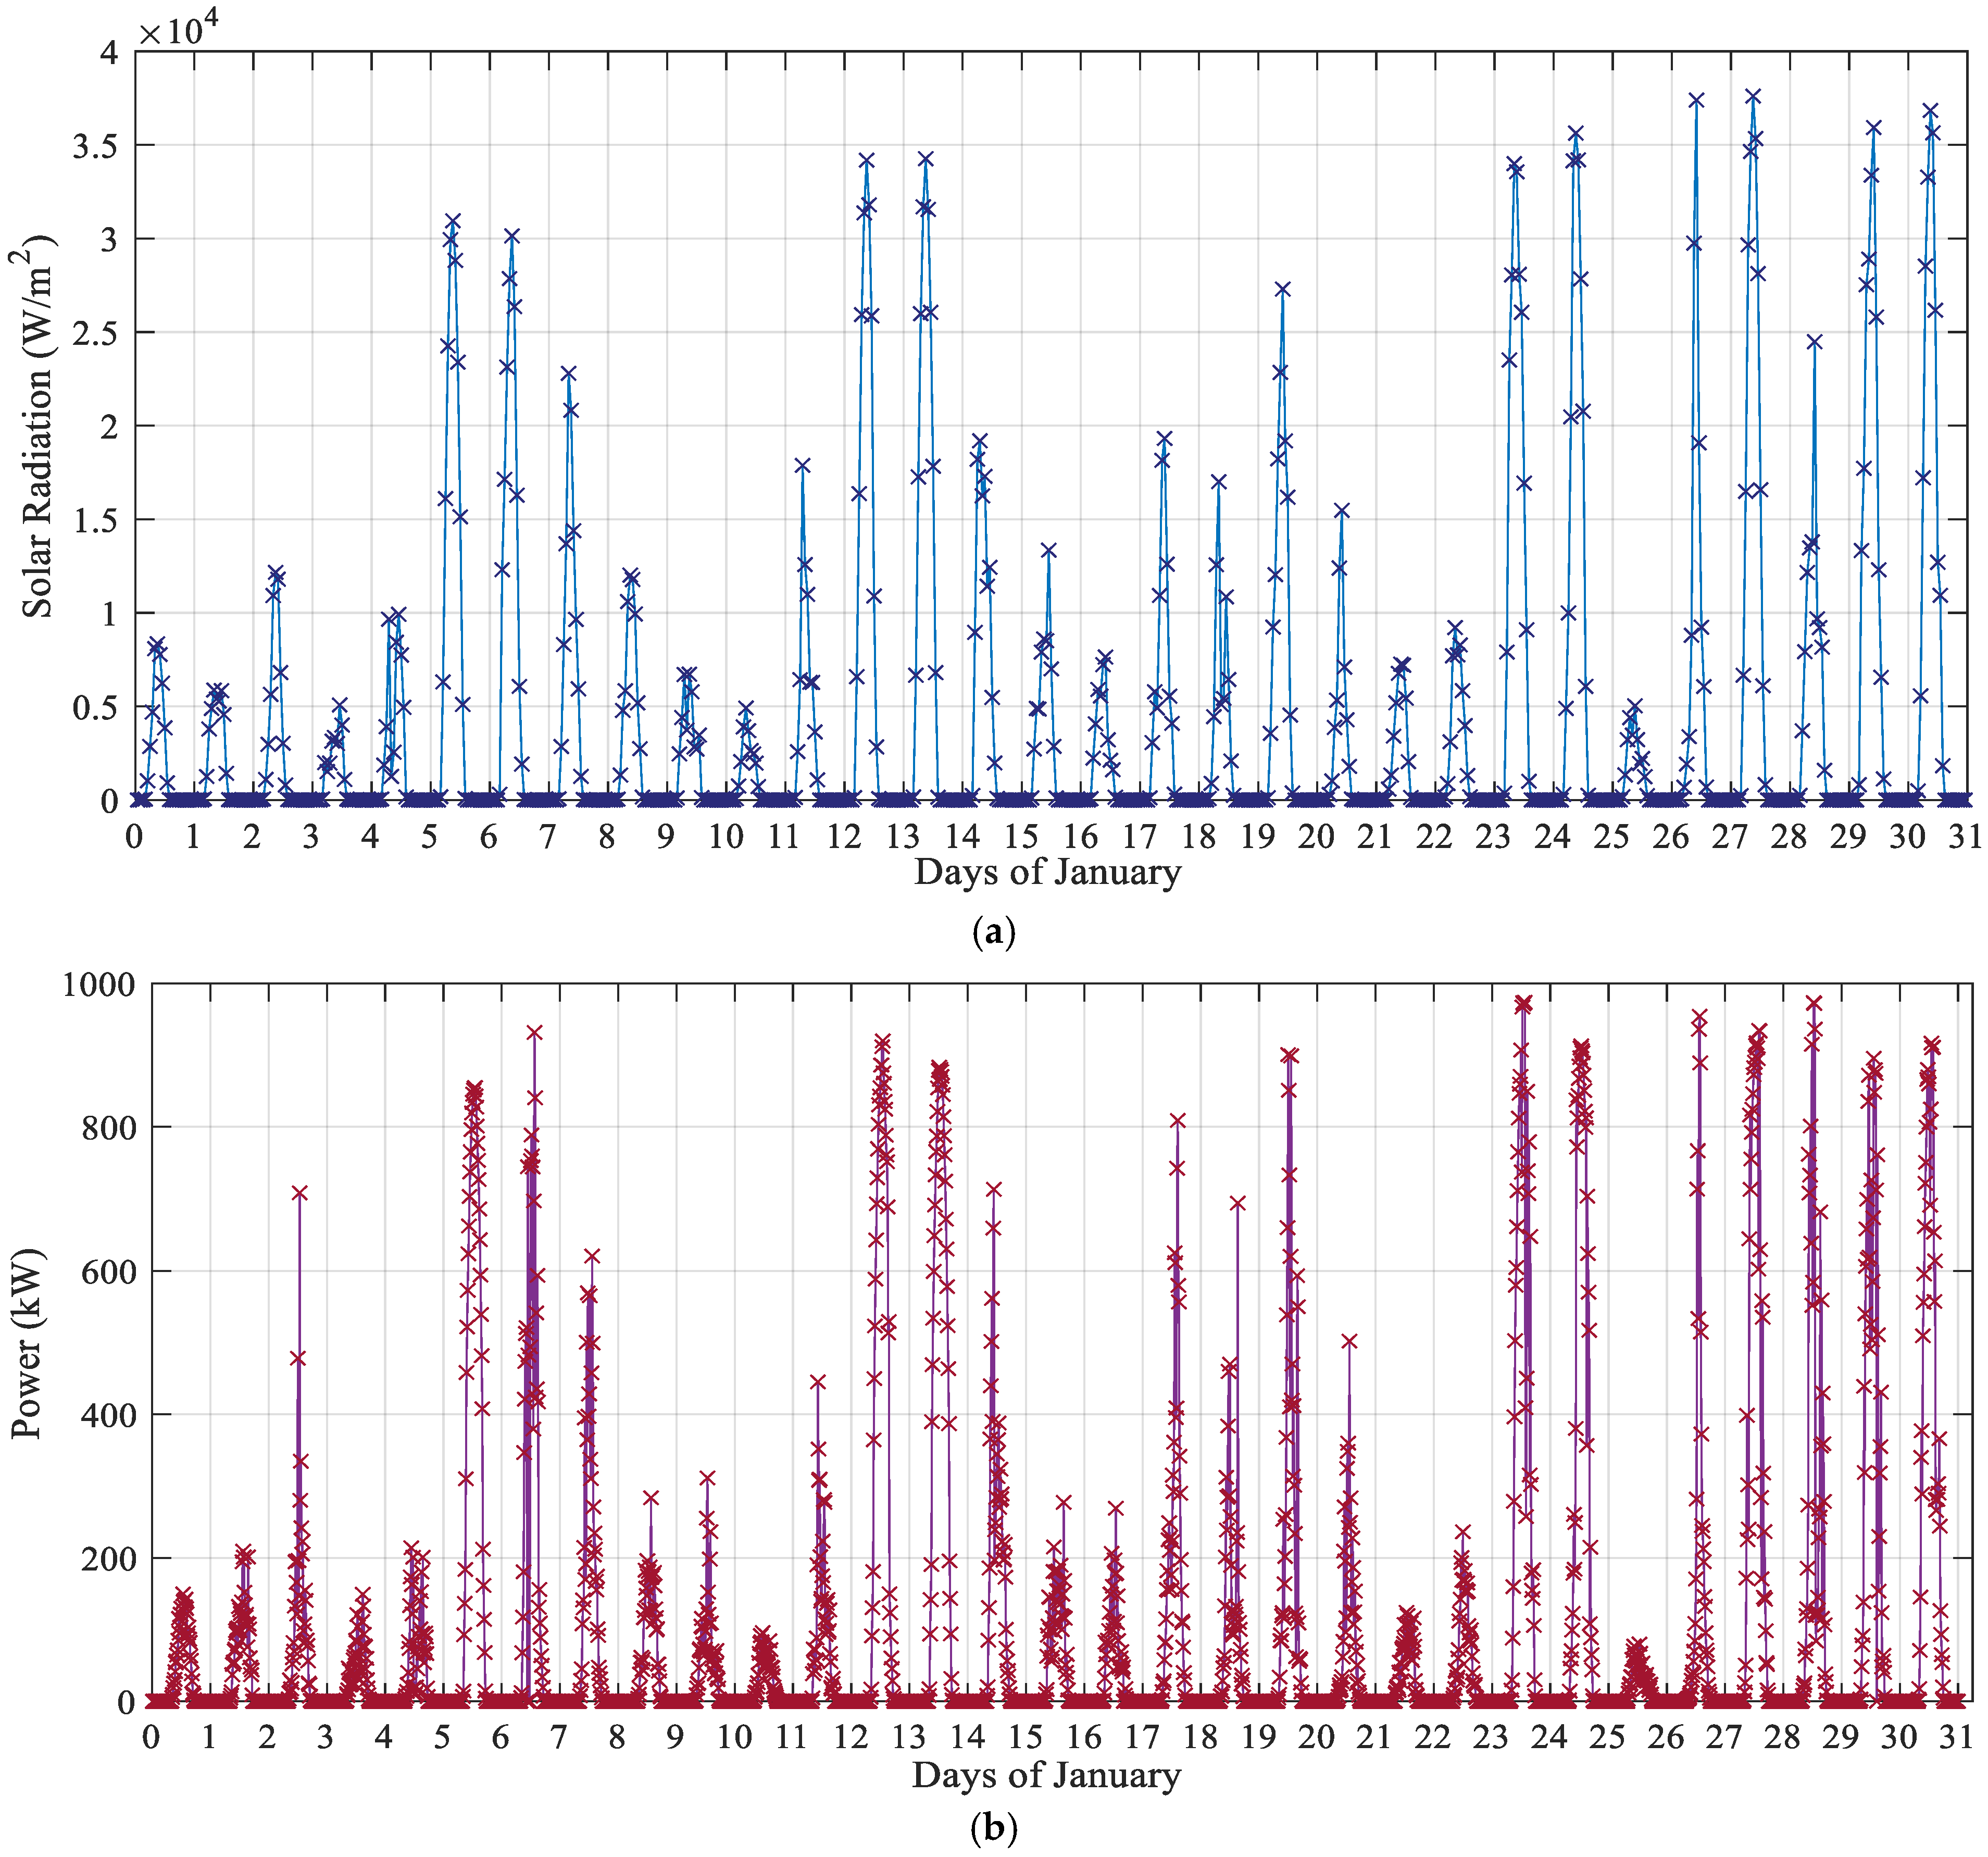
As stated in previous sections, since electricity generation in PV systems depends on solar radiation, the most crucial parameter in power prediction for a PV system is the radiation level.
Figure 4a,b illustrates the daily variations of average radiation and actual power values for the month of January, respectively.
Analyzing
Figure 4a,b reveals that fluctuations in the power output of the PV system are largely influenced by the increase or decrease in solar radiation levels. However, the variations in the two graphs are not identical. This discrepancy arises because, in addition to radiation levels, factors such as temperature, wind, humidity, and cloud cover also have direct or indirect, as well as positive or negative, effects on power generation. This observation highlights the importance of utilizing multiple parameters in power prediction studies for PV systems.
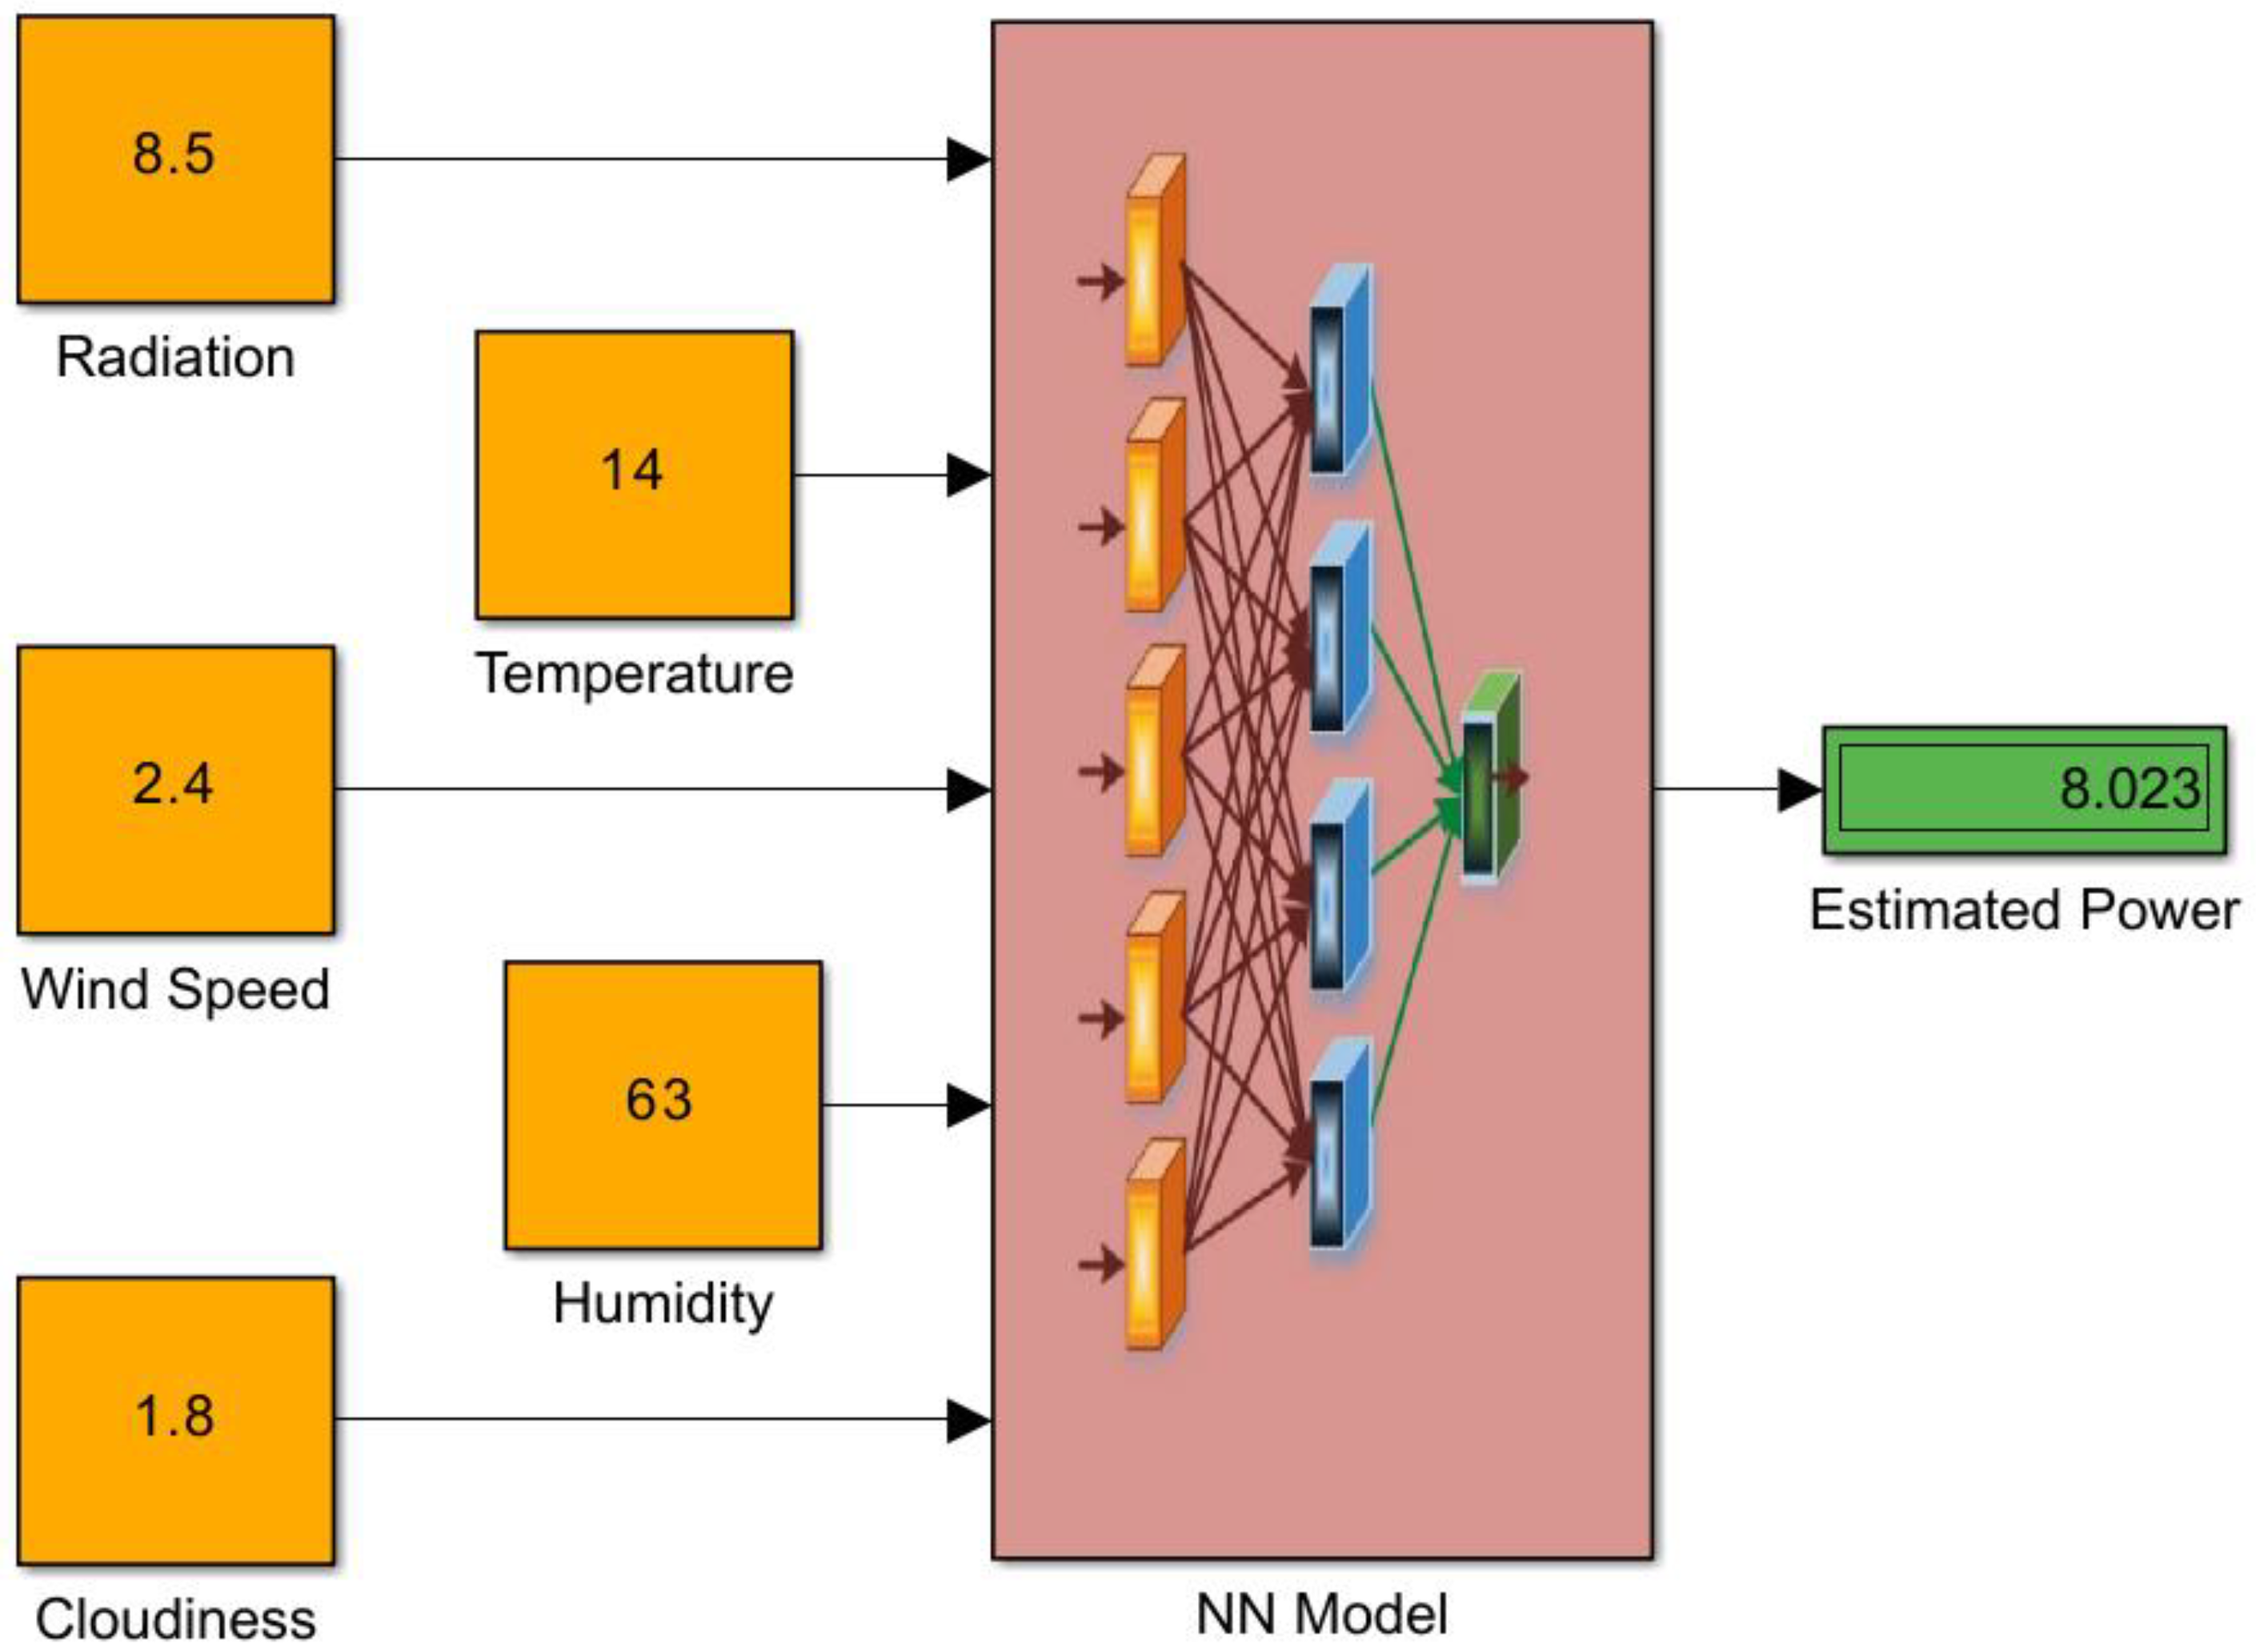
As seen in
Figure 5, the ANN architecture of the model used in this study consists of three layers: an input layer with five neurons (corresponding to radiation, temperature, wind speed, humidity, and cloudiness), a hidden layer with 20 neurons, and an output layer with a single neuron representing the estimated power. The number of hidden layers and neurons was determined empirically using a trial-and-error approach. Different configurations were tested, and the structure with one hidden layer and 20 neurons provided the better trade-off between model accuracy and computational efficiency. The weights and biases of the network were initialized randomly and adjusted during training using the Levenberg–Marquardt algorithm to minimize the error function.
In this study, a total of 35,136 data points (15-min interval data for each of 366 days) were used. The dataset was randomly split into 90% for training, 5% for validation, and 5% for testing to ensure a well-distributed representation of the data.
The input variables were used in their original form without normalization. However, the power output values were normalized during the training phase to enhance model stability.
As illustrated in
Figure 5, the ANN model estimated that 8023 kW power will be produced in the power plant with the input data 8.5 W/m
2 radiation, 14 °C temperature, 2.4 m/s wind speed, 63% average humidity, and 1.8 Oktas cloudiness.
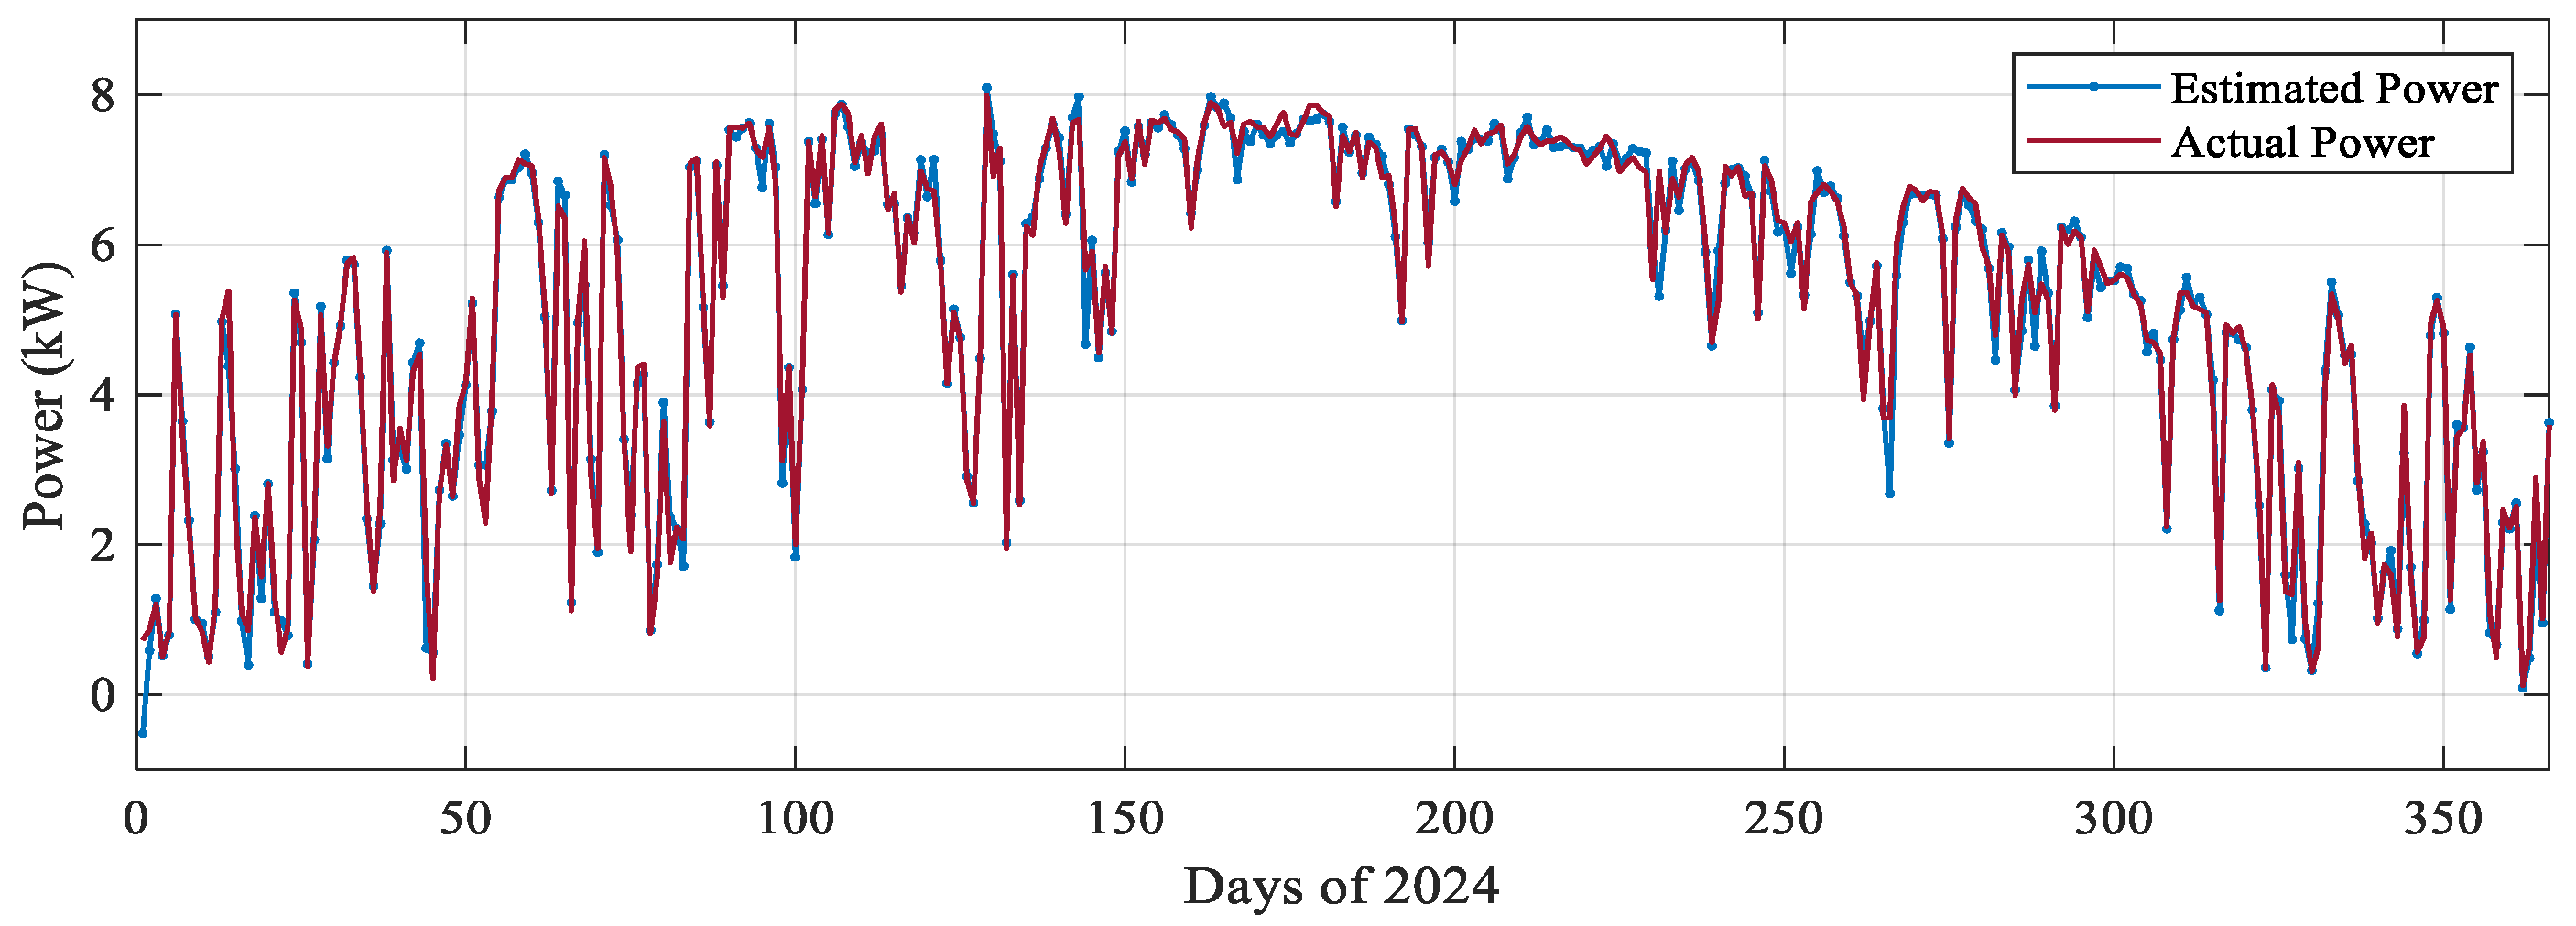
The comparison of the daily power value estimated by the ANN model and the actual power value for 2024 is presented in
Figure 6.
When examining the figure, it is observed that the prediction results obtained using the ANN model are quite close to the actual power values recorded from the PV power plant.
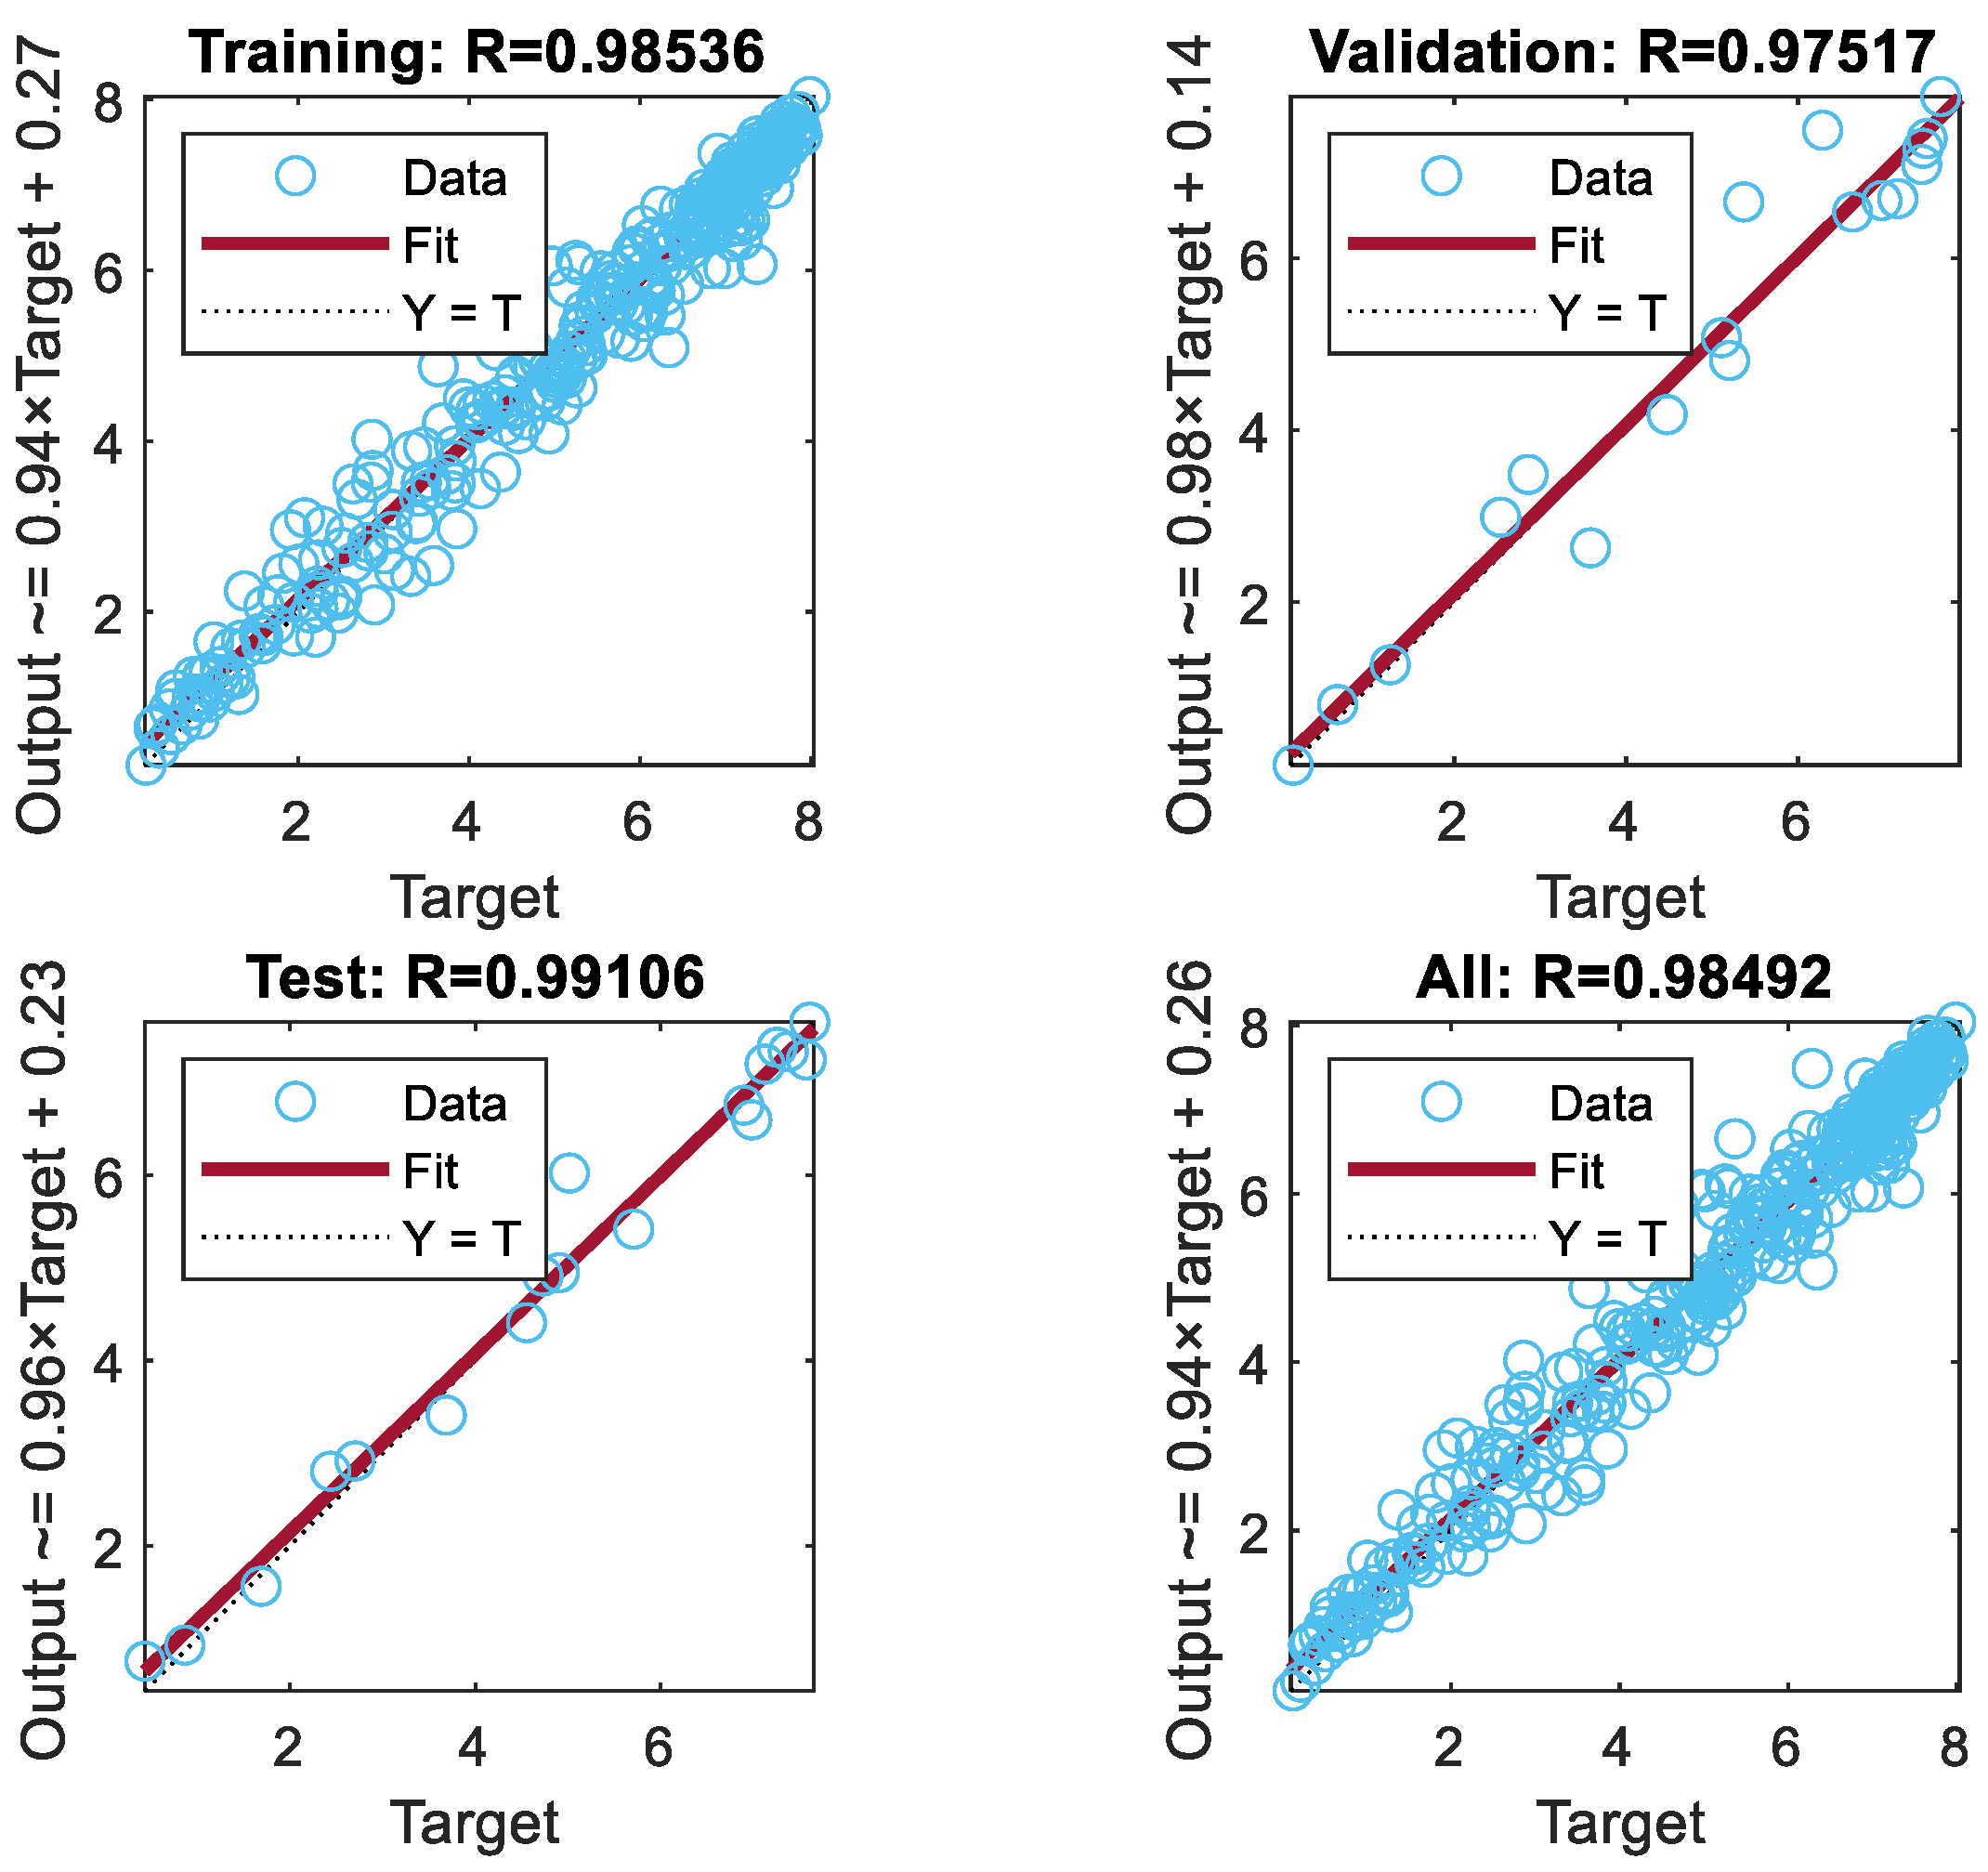
Although the success of the ANN model is evident from the overlap of the graphs, this is also quantitatively expressed in
Figure 7 using the R and MSE metrics. The R values for training, test, validation, and all data were obtained as 0.98, 0.99, 0.97, and 0.98, respectively. The MSE value for all data was obtained as 0.03.
It is well known that an R value close to 1 signifies a strong correlation between predicted and actual values, while an MSE value approaching 0 indicates minimal prediction error. These metrics are widely used to assess the accuracy and reliability of predictive models. In this study, the ANN model yielded an R value of 0.98 and an MSE value of 0.03, indicating a strong agreement between the predicted and actual power values. These results suggest that the model provides a reliable performance in power prediction.
The results presented in
Figure 6 indicate that the proposed ANN-based model can successfully capture the nonlinear relationships between meteorological variables and PV power output. The strong correlation between predicted and actual values, as seen in
Figure 7, is reflected in the high R values and low MSE, and demonstrates the model’s reliability and robustness.
Table 2 shows the presented meteorological data and the monthly averages of actual and estimated power values. As expected, the lowest irradiation values occur in winter months, while the highest irradiation values are recorded in summer months. Among the winter months with the lowest power generation, a comparison of December and January reveals that, although the irradiation level in December is lower, higher power generation was achieved due to lower temperature and cloudiness levels.
To interpret the impact of the meteorological data on power generation, the data utilized in developing the ANN model were examined in detail, and certain data values were shared in
Table 3. When selecting the data presented in
Table 3, data points where each parameter used in the study were most prominent were chosen.
When
Table 3 is examined, the impact of five parameters on PV power generation can be observed more clearly. For instance, to analyze the effect of irradiation, data from two different days were selected where the other parameters (temperature, wind speed, average humidity, and cloudiness) had the same or very similar values. The same approach was applied to all parameters.
Looking at the table, while the other parameters are nearly identical, the irradiation values for the two days differ by almost 1.5 times. Although the positive effect of irradiation on PV power generation is already well known, it is clearly evident in the table as well. Similarly, for the datasets selected to observe the effect of temperature, the well-documented negative impact of temperature on PV power generation is apparent. In the data selected to analyze the influence of wind, there is an almost two times difference in wind speed, and an increase in wind speed has positively affected power generation. In a system that generates power from solar irradiation, an increase in cloud cover naturally has a negative impact, which is clearly visible in the table. While the total radiation for both days is 6.9 W/m2, as expected, the higher cloud cover has adversely affected power generation. However, no significant effect of humidity on the PV system has been identified.
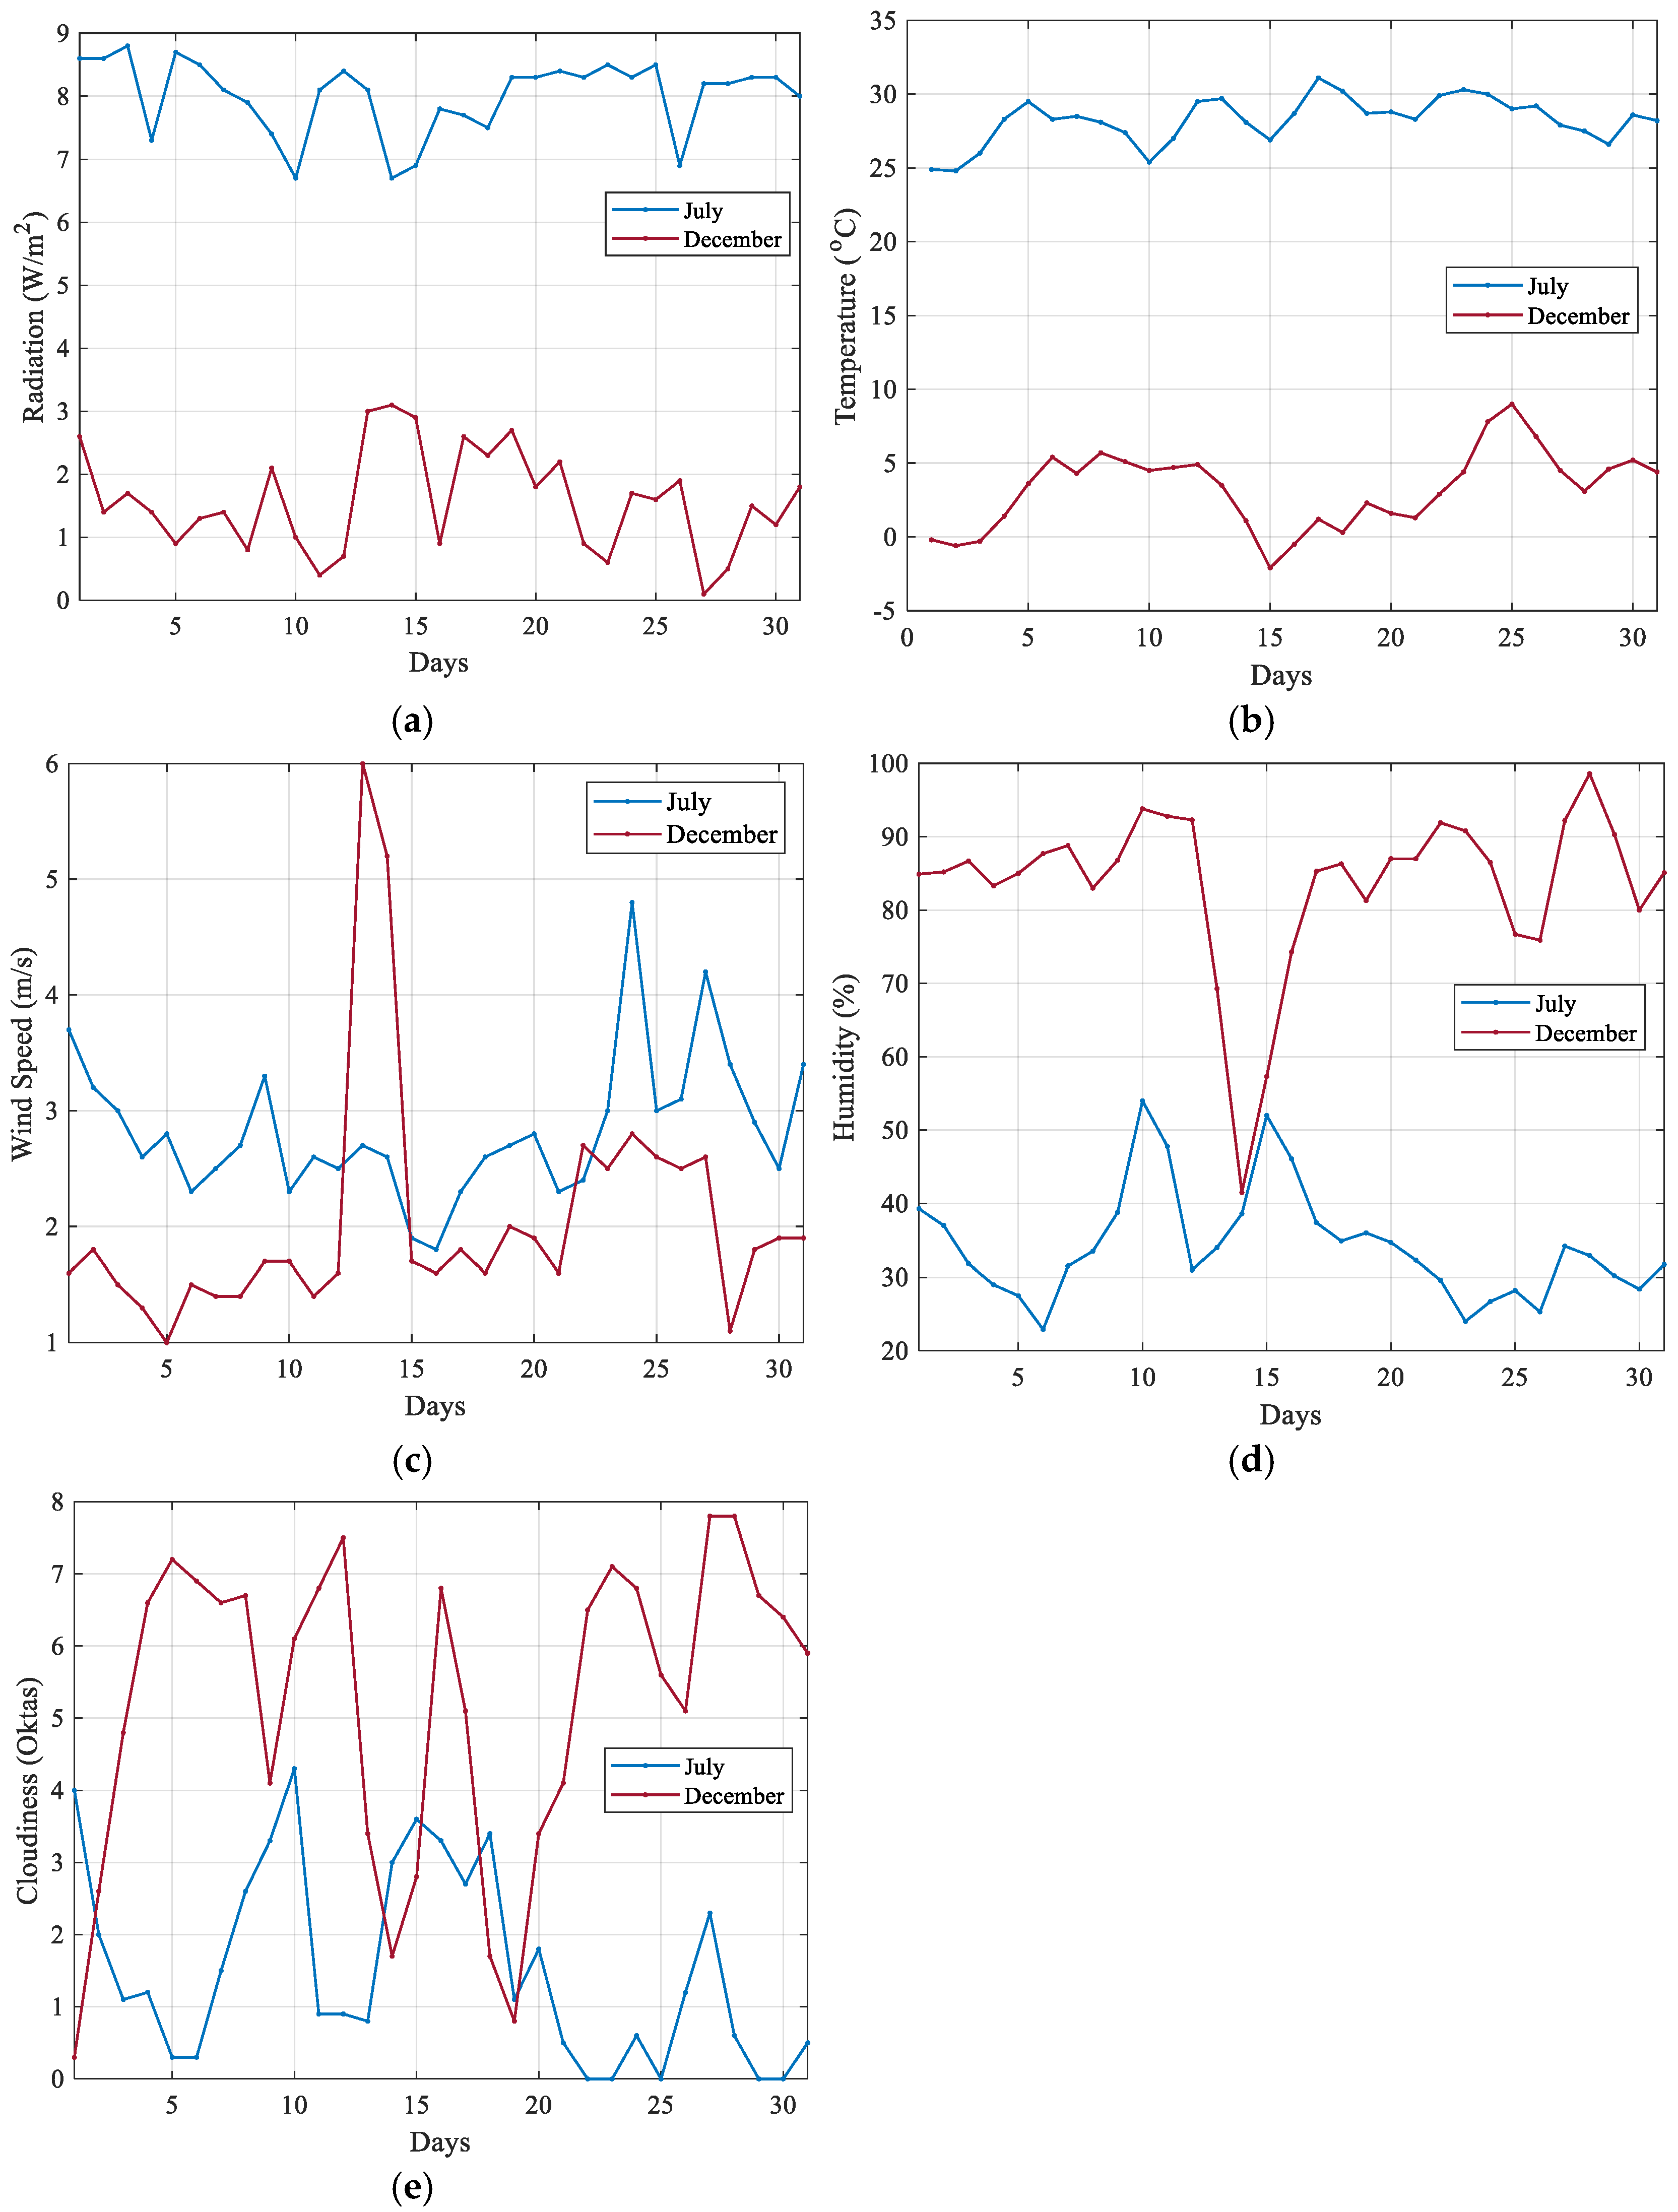
Finally, the graphs illustrating the variation of meteorological data for July and December, representing summer and winter months, are presented in
Figure 8.
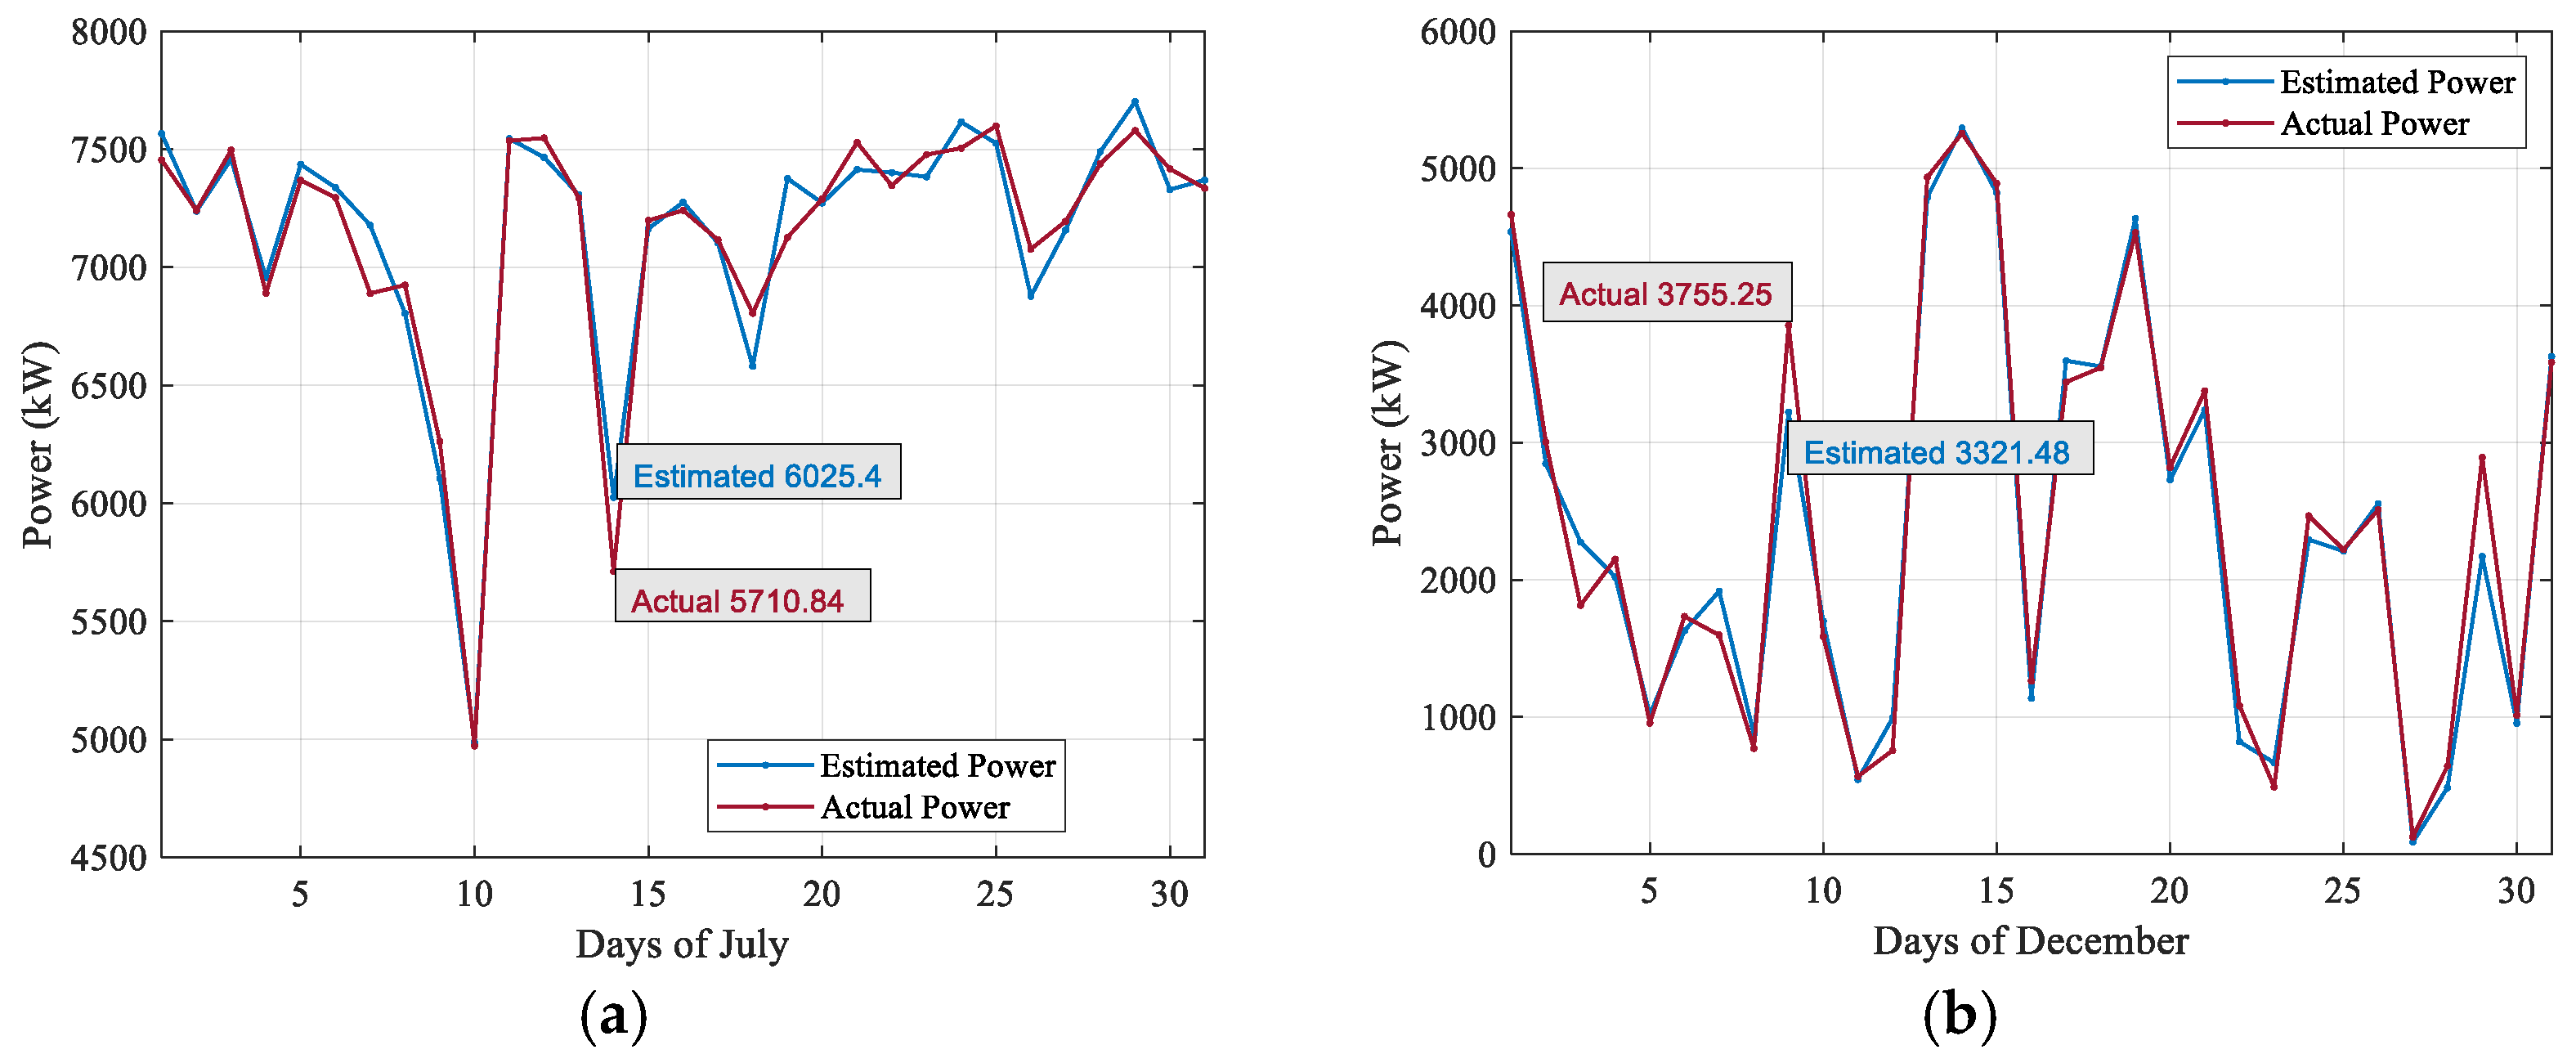
From the data obtained in the study, the changes in daily average actual and estimated power for July and December are given in
Figure 9a,b, respectively. In both graphs, it can be observed that the power predicted by the ANN closely follows the actual power values. As seen in
Figure 9, the maximum difference between actual and estimated power values are 314.5 kW and 433.77 kW, which correspond to 5.5% and 11.5% for July and December, respectively. As seen in
Figure 8, there is a rapid fluctuation in the meteorological data in December, which has yielded a high prediction error.
As a final validation step, cross-validation was performed to ensure the reliability and generalizability of the proposed model. Cross-validation is a statistical technique that divides the dataset into multiple subsets, allowing the model to be trained and tested on different data splits [
22]. In this study, 5-fold cross-validation was applied, where the dataset was divided into five equal parts. The model was trained on the 5-1 subset and tested on the remaining subset in each iteration, and the process was repeated five times. This approach helps reduce overfitting and provides a more robust assessment of the predictive performance of the model [
22].
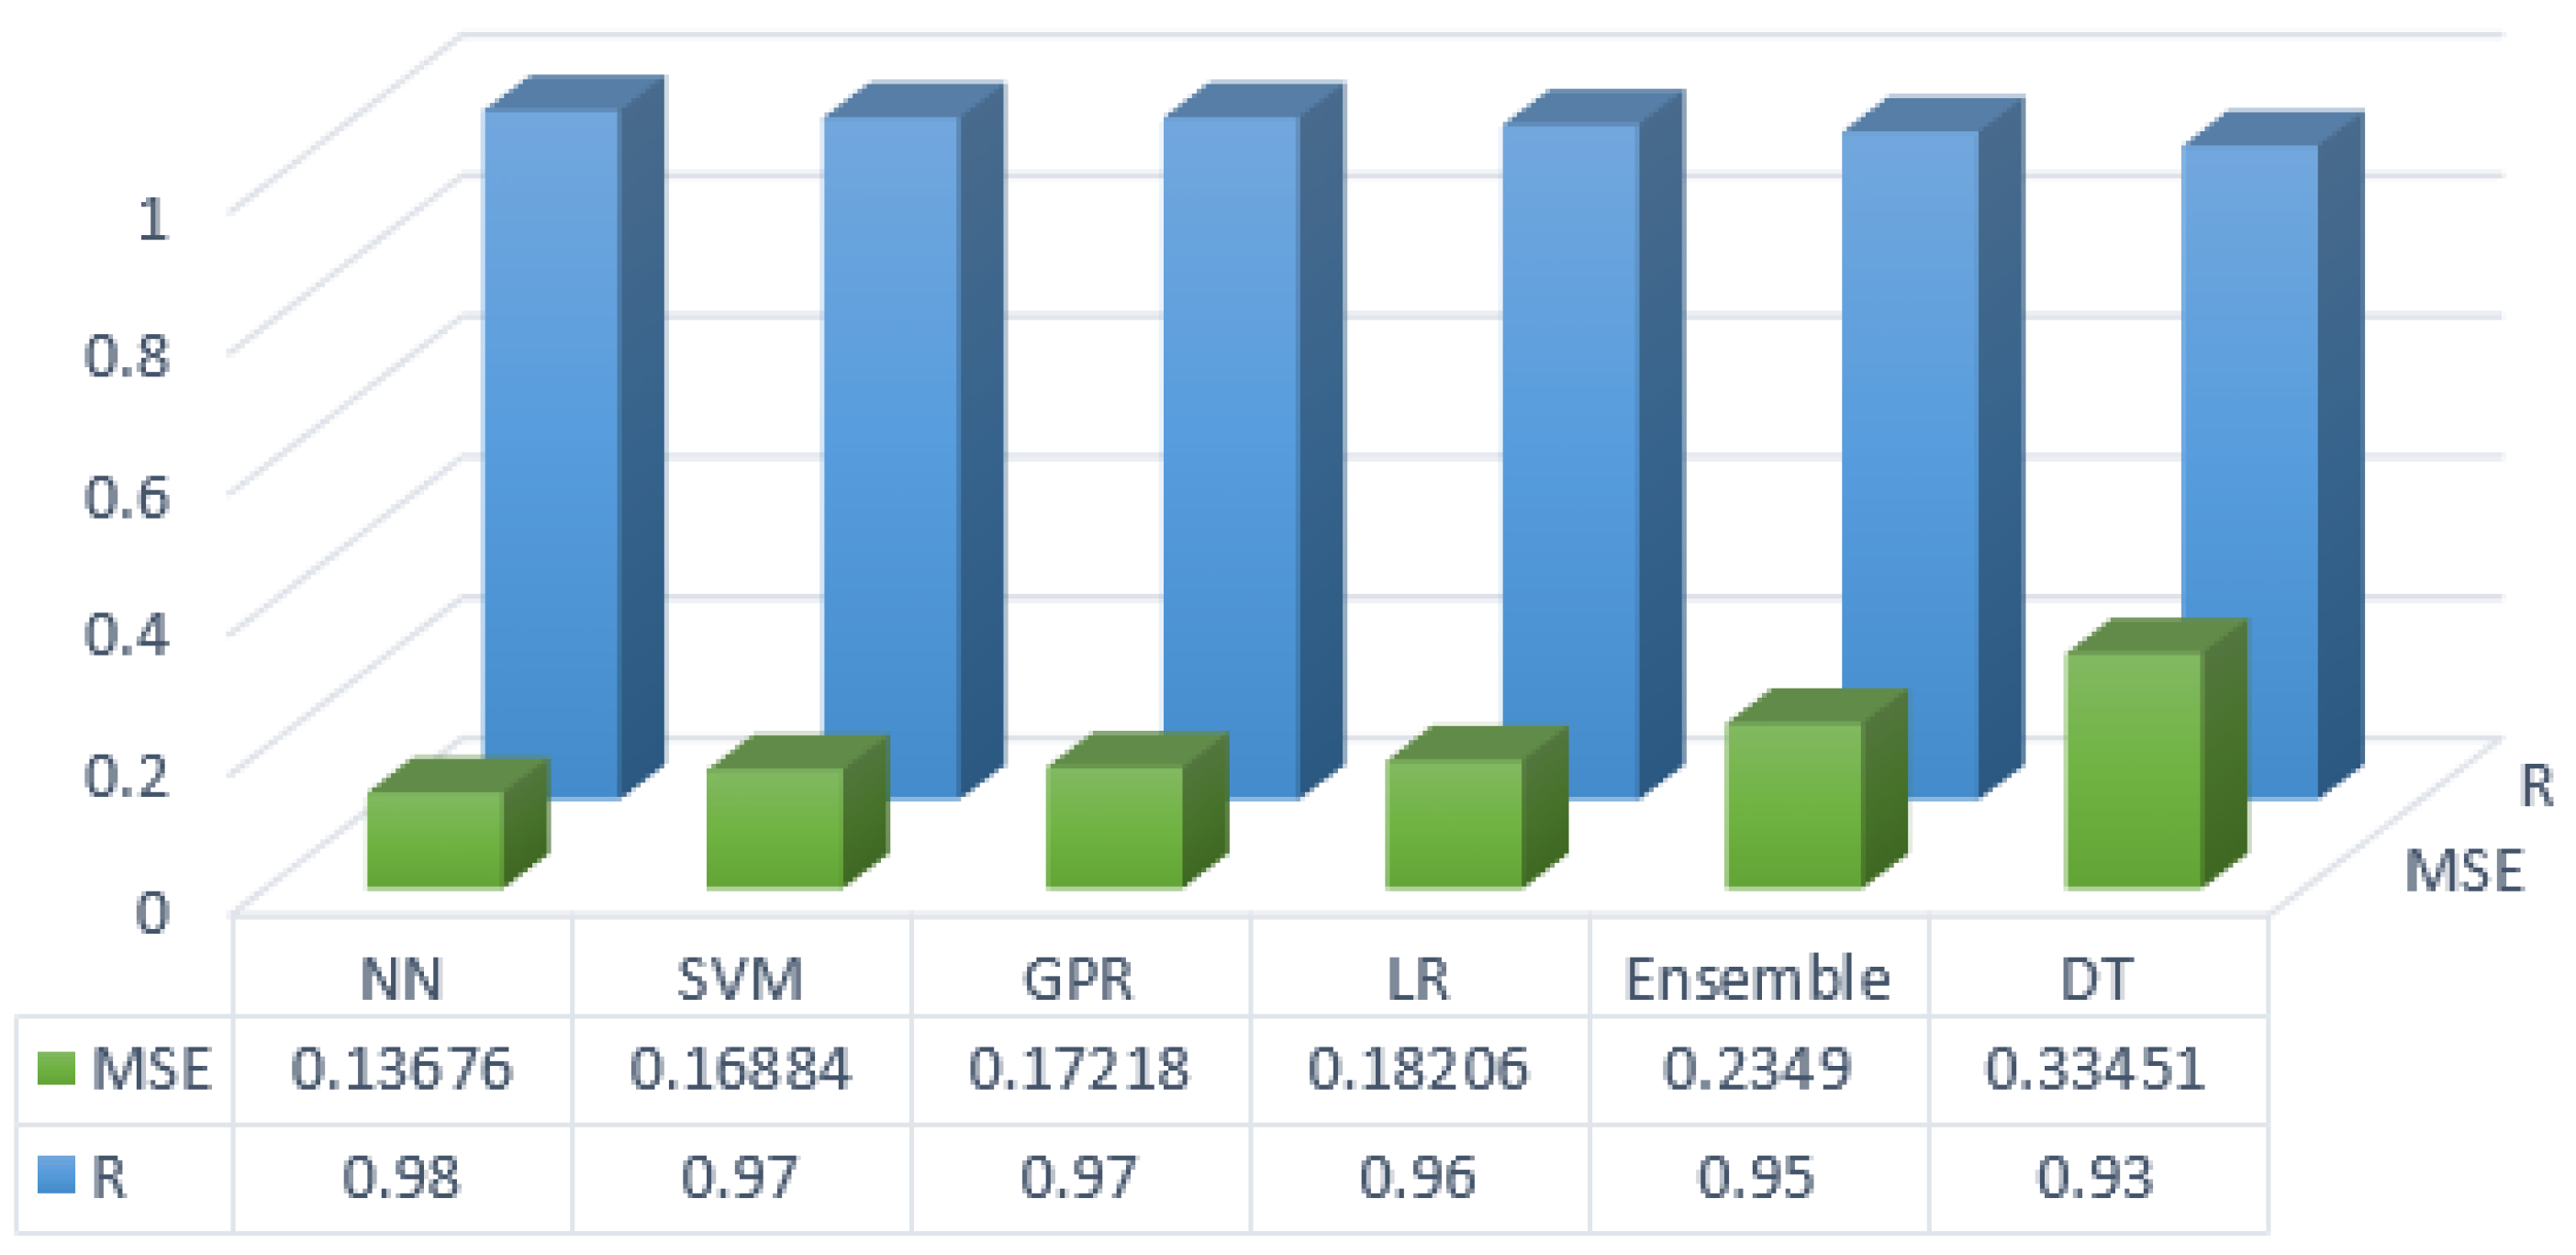
To further validate the performance of the proposed ANN model, a comparative analysis was conducted using cross-validation with alternative machine learning techniques, including SVM, GPR, LR, Ensemble methods, and DT, as presented in
Figure 10.
As summarized in
Figure 10, the results show that the ANN model achieved the lowest MSE of 0.13676 and the highest R value of 0.98. This confirms that the proposed ANN model outperforms the traditional methods in PV power prediction.
5. Conclusions
Prioritizing environmentally friendly renewable energy sources not only helps reduce dependence on external energy sources but also contributes to sustainability. However, the intermittent nature of renewable energy due to meteorological conditions poses challenges for ensuring continuous energy production. For this reason, accurately estimating the amount of energy that can be generated from renewable sources is essential.
Since the fuel used for electricity generation in PV systems is solar irradiation, energy can only be produced when sunlight is available. Thus, when daylight is absent or insufficient, the system either fails to generate energy or operates at low efficiency. The significance of solar irradiation implies that factors such as shading, cloud cover, dust, and humidity, which influence the amount of irradiation received by the panel, are also crucial. Additionally, temperature, which negatively affects the system, and wind, which influences both temperature and the removal of dust from PV panels, must be considered in power forecasting models. Therefore, when estimating the power output of a PV system, variations in all these parameters should be taken into account.
For these reasons, forecasting the energy production of PV systems is crucial for energy planning and management. Accurate power predictions facilitate the proper alignment of supply and demand through effective energy policies, ultimately leading to more reliable and cost-effective energy access.
In this study, an ANN-based model was selected for PV power forecasting due to its ability to model complex nonlinear relationships. Power data obtained from a PV power plant for the year 2024, along with meteorological data, were used to train the ANN model.
The results of the power predictions made using the ANN model were presented in both tabular and graphical formats. The graphs illustrate that the ANN-based predicted power closely follows the actual power throughout the year. Additionally, data from various days were selected and analyzed in table form to examine the effects of irradiation, temperature, wind speed, humidity, and cloud cover on PV power generation. Moreover, meteorological data and both actual and ANN-predicted power values for July and December were also presented in graphical form.
According to the obtained results, irradiation and wind speed have a positive impact on PV power generation, whereas temperature exhibits a negative effect. Since cloud cover reduces irradiation, it also has a detrimental impact on PV power generation. However, the findings indicate that humidity does not have a significant effect on PV system performance.
Finally, the performance of the proposed ANN model was evaluated using R and MSE metrics. The obtained results suggest that the R and MSE values were 0.98 and 0.03, respectively. The R value being close to 1 and the MSE value being close to 0 indicates that the model provides a high level of predictive accuracy.
Despite the promising results of the proposed ANN model, this study has certain limitations. First, the model was trained and tested using data from a single PV power plant located in Elazığ, Türkiye. The generalizability of the results to different geographical locations with varying climate conditions should be further examined using data collected from those regions. Second, although multiple meteorological parameters were considered, additional factors such as atmospheric pressure, precipitation, and panel soiling effects were not incorporated, which might contribute to further improving forecasting accuracy.
Future research should focus on expanding the dataset by including data from multiple locations and longer time periods to improve model robustness. Additionally, incorporating real-time weather forecast data into the model could enhance its practical applicability in energy management systems.


