4.1. Application to Aluminium, Copper, Titanium and Steel Plates
The deformation of a slab by temperature gradients in the presence of electric charges and currents is of interest for mechanical structures such as (i) electrostatic speakers that use electric currents to cause unsteady deformations of a membrane radiating sound; (ii) magnetostatic loudspeakers that use electric currents for the same purpose; (iii) plates of aluminium 2024 and related alloys that are extensively used in aeronautics; (iv) copper that has a higher thermal conductivity than aluminium but lower strength; (v) titanium that has a higher strength than aluminium and steel but a higher cost; (vi) steel which combines strength with low cost; (vii) PZT, which is a piezoelectric material widely used in adaptive and morphing structures and is anisotropic. Within the assumptions of the present theory, the relevant physical properties [
16,
17] are indicated in
Table 1 for the cases of (A) aluminium, (C) copper, (S) carbon steel and (T) titanium. The numerical examples that follow use the SI thermomechanical and electromagnetic units indicated in
Appendix A.
The physical properties [
16,
17] indicated in
Table 1 are (i/ii) the Young’s modulus
E and Poisson ratio
, which are the elastic moduli in Hooke’s law (
21d); (iii) the thermal conductivity
k in the heat flux (
22b); (iv) the Ohmic electrical conductivity
in the electric current (
22a); (v) the dielectric permittivity
relating (
21b) electric displacement
to electric field
; (vi) the magnetic permeability
relating (
21c) the magnetic induction
to the magnetic field
; (vii) the mass density
for reference purposes, since it appears only in the inertia force in the unsteady momentum equation (
17) but drops out in the steady case; (viii) the coefficient of thermal expansion
where
V is the volume that is distinct from the coefficient of thermal stress
which appears in (
21d) the direct Hooke law
whose relation is obtained subsequently for inclusion in the table of derived quantities (
Table 2); (ix) the cross-coupling coefficient
between the heat flux (
22b) and electric current (
22a), which is assumed to be negligible, and is omitted from
Table 1. Due to the lack of reliable values for the dielectric permittivity of metals, an estimated value in the SI system
is obtained assuming that the electromagnetic wave speed (
35a) equals that in a vacuum
so that the dielectric permittivity is calculated from the magnetic permeability
The relation between the coefficient of thermal expression (
63a) and the coefficient of thermal stress (
63b) is obtained in four steps: (i) the direct Hooke law (
21d), equivalent to (
63c), is used to relate the trace
of the stress tensor, equal to
, where
p is the pressure, to the trace of the strain tensor
, equal to the dilatation
:
(ii) substitution of (
65) in the last term of the direct stress–strain Hooke law (
63c), leading to the inverse strain–stress Hooke law:
(iii) the inverse Hooke law, which must be of the following form:
where the thermal expansion coefficient (
63a) appears; (iv) comparing (
66a)≡(
66b), which leads to the relation
expressing the thermal stress coefficient (
63b) in terms of the coefficient of thermal expansion (
63a).
Table 2 indicates the physical properties derived from those in
Table 1, namely, (i) the thermal stress coefficient (
67); (ii) the decay time (
34b); (iii) the decay length scale or penetration depth (
35c); (iv) the effective elastic modulus (
53).
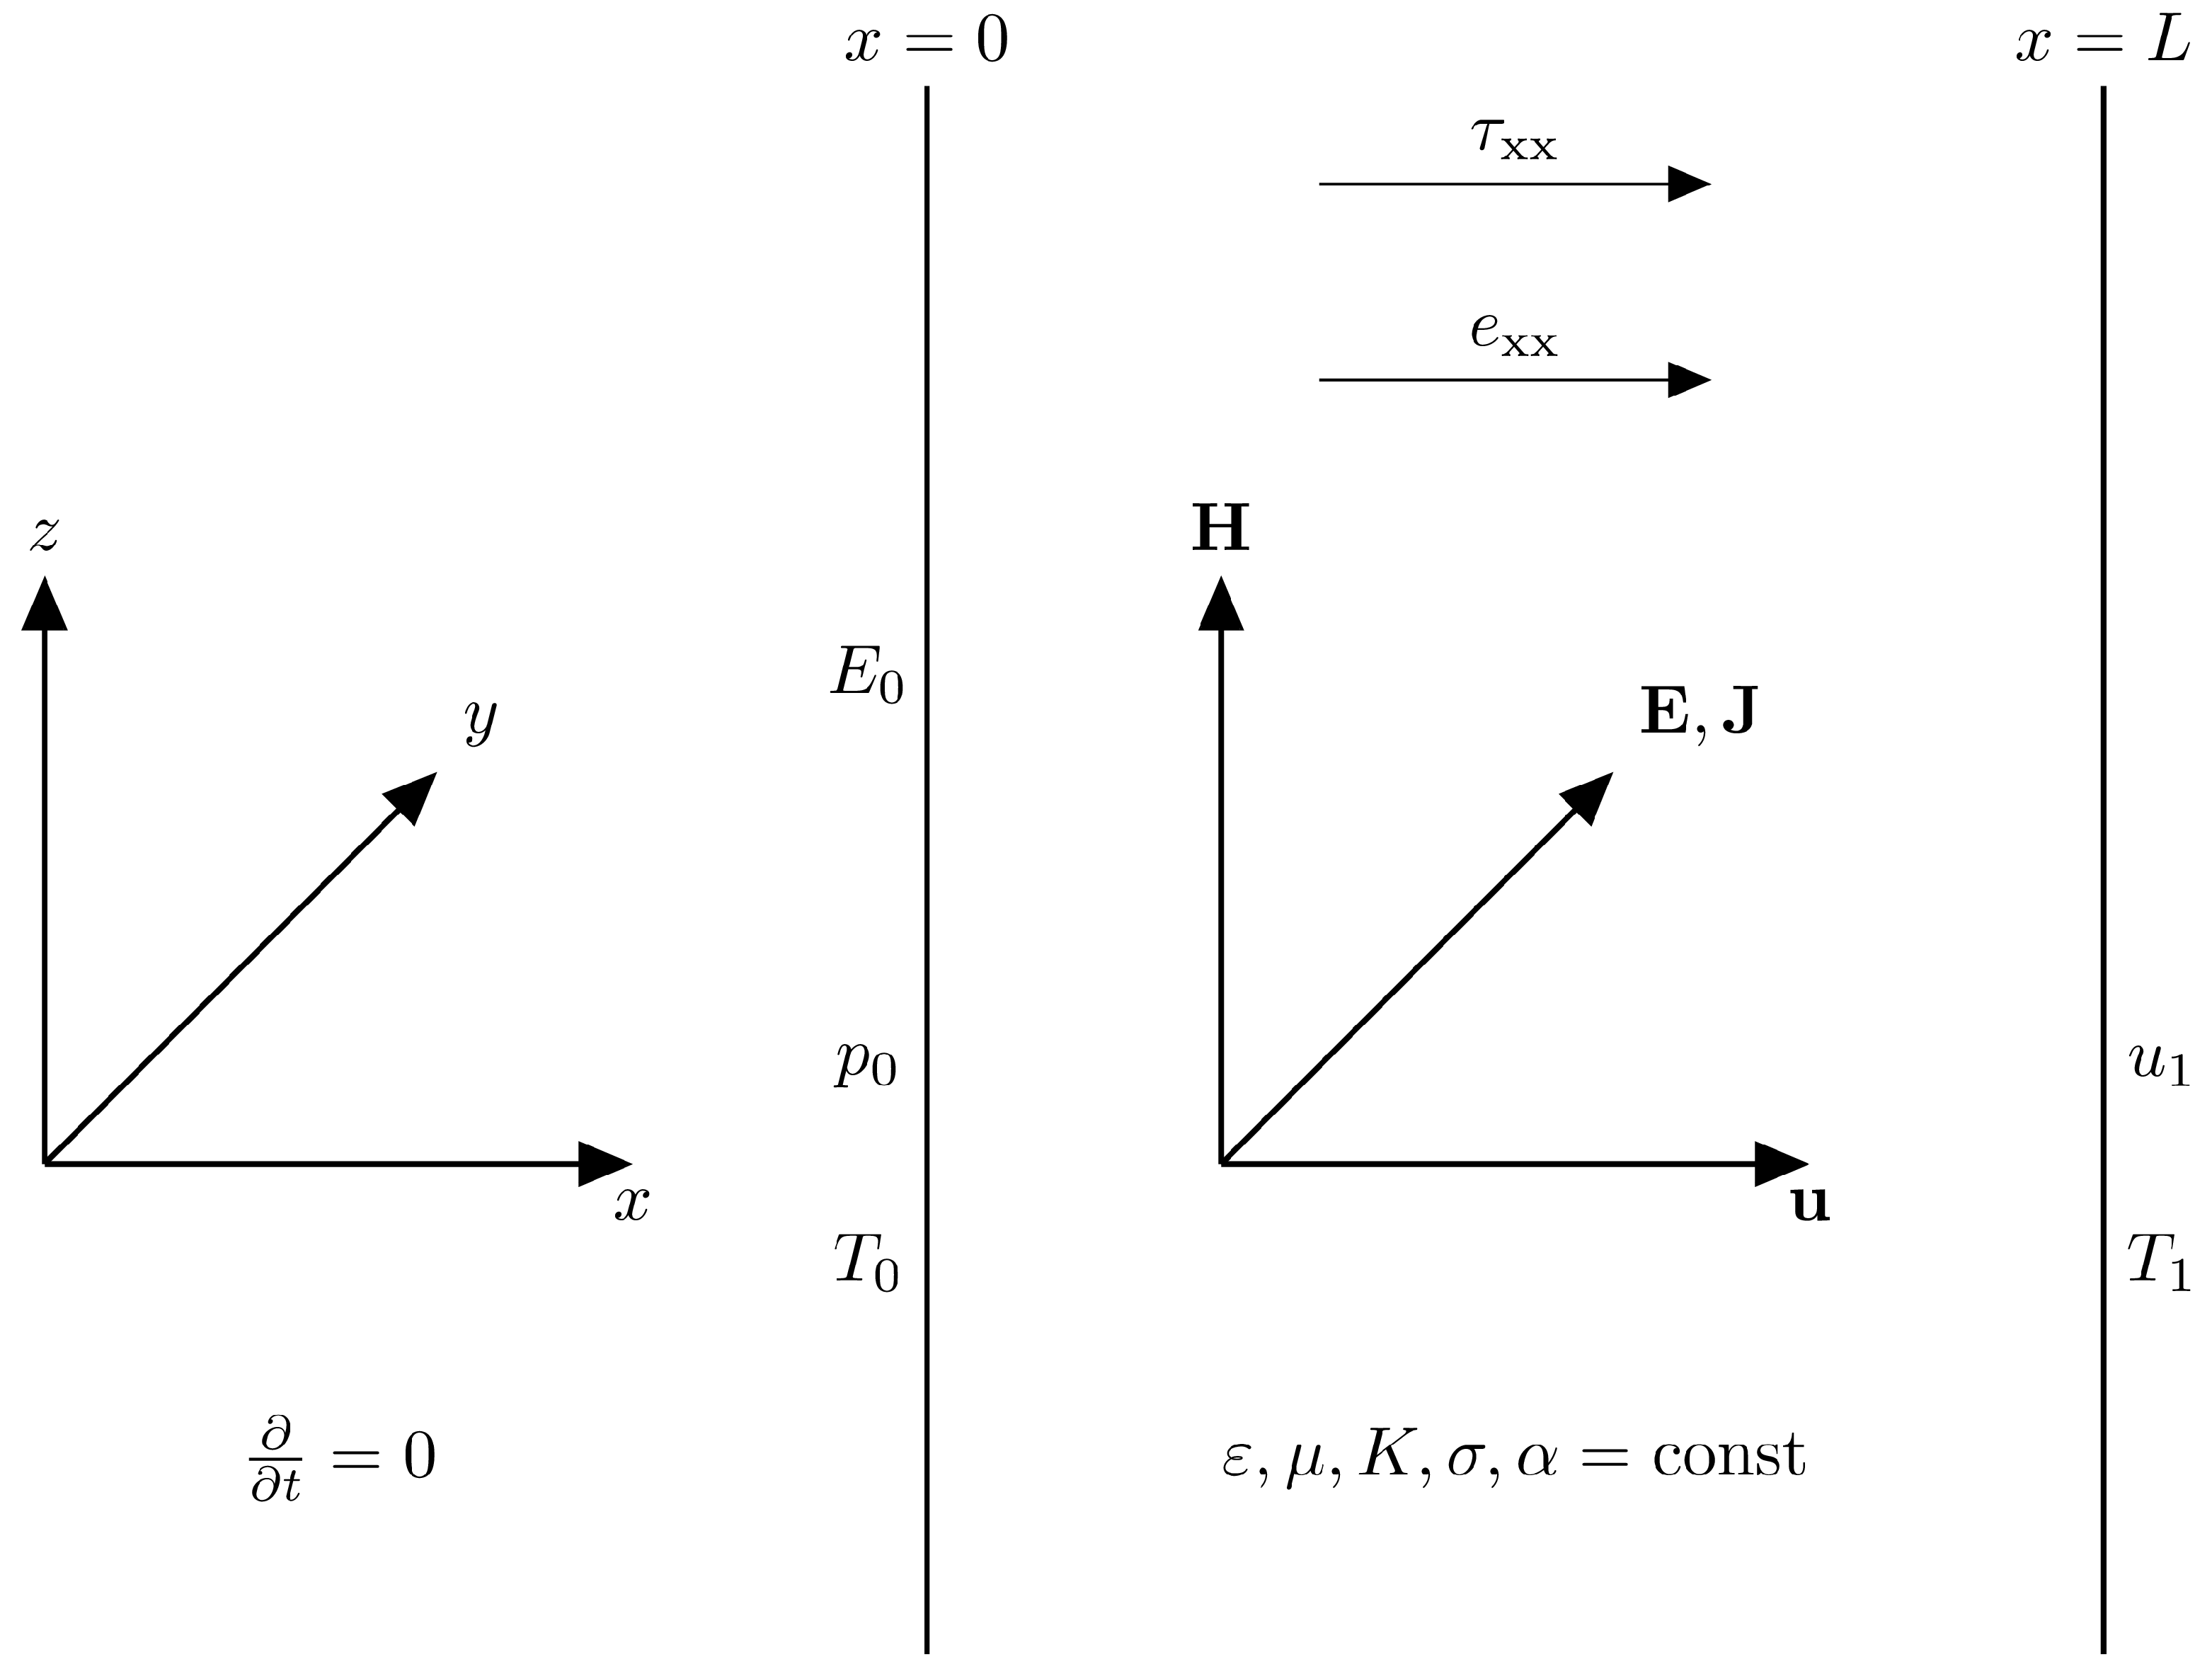
The basic and derived physical parameters in
Table 1 and
Table 2, respectively, appear in the profiles as a function of the depth of the eight physical variables, namely, (i–iii) the electric field (
35b), current (
35d) and the magnetic field (
37a)–(
37b)
for an external electric field
; (iv) the temperature profile (
49) with temperature at the outer (
48a) and at the inner (
48b) boundaries; (v) heat flux (
50b), which takes the values at the outer and at the inner boundaries:
(vi) displacement (
59), which vanishes at the inner boundary (
57a) and takes the value
at the outer boundary; (vii) strain (
60), which takes the value
at the outer and
at the inner boundaries; (viii) stress (
61), which equals minus the atmospheric pressure at the outer boundary (
58b) and takes the value
at the inner boundary.
The approximation (
62a) allows the omissions of (i) the first term in square brackets in (
69a); (ii) the first term in curved brackets in (69b); (iii–v) the last terms in square brackets in (
70), (
71b) and (
72). The only remaining data needed concern the boundary values for (a) the electric field at the outer boundary:
(b,c) temperature at the outer and inner boundaries:
(d) pressure or stress at the outer boundary:
These boundary values are indicated in
Table 3 for flight at the tropopause in two cases (
Section 4.2): (a) in fair weather with the average electric field of the Earth; (b) in a lightning storm with the electric field specified by the voltage of the discharge.
4.2. Flight at the Tropopause in Fair Weather
The aluminium 2024 plate used in many applications, including aeronautics, is often supplied with a thickness of
. The plate thickness used in aeronautics is usually 1 or
for fuselage panels and 2 or
for wing skins. A panel thickness
is chosen. The same value is used for all four metals for comparison purposes. The coordinate
x varies between (i) the outer surface in contact with the atmosphere
and (ii) the inner surface
corresponding to the wall of the passenger or cargo cabin. For flight at the tropopause at the altitude
, in [
18,
19], the International Standard Atmosphere (ISA) the pressure is
and the temperature is
The internal temperature is taken as the following comfortable value in an air-conditioned cabin:
For flight in fair weather, the surface electric field is taken [
20] as the average value on the surface of the Earth:
The physical conditions during lightning storms [
20,
21] can be quite different from the average Earth conditions in fair weather. For example, the electric and magnetic fields in fair weather are the average Earth values, whereas, for a lightning storm, they should be calculated from the electric discharge. Lightning storms are associated with cumulonimbus clouds, which can extend over a wide altitude range from 0.5 to 16 km. Most lightning strikes on aircraft occur in low-level flight between the clouds and the ground. Lightning strikes on aircraft can also occur at high altitude near cumulonimbus clouds, although these are usually associated with storms, and are thus best avoided. Lightning strikes can occur up to 15 km from the clouds. The lightning strikes associated with thunderstorms can vary considerably from one event to another, and some indicative values are (a) a lightning strike can reach
–
, that is up to
, with an average value of
; (b) the duration of a lightning flash is
; (c) a lightning storm can consist of about
flashes in close succession, lasting about
. Since the present theory is steady, an average voltage
is considered,
using an overbar to distinguish quantities in a lightning storm from fair weather; (ii) the external electric field is calculated from the average voltage and the thickness of the slab:
The value taken for the surface electric field in a lightning storm (
82) is much higher than (
80) for fair weather [
21].
The boundary and atmospheric values in
Table 3, together with the basic and derived physical properties in
Table 1 and
Table 2, respectively, specify in
Table 4 several parameters that (a) depend on the material, namely, aluminium (A), copper (C), steel (S) and titanium (T); (b) are different in fair weather (no overbar) and in a lightning storm (with overbar). The seven parameters listed in
Table 4 are (i) from (
32b) the surface electric current:
(ii) from (
37b) the surface magnetic field:
which can be simplified using (
64b),
(iii) the surface value of the Joule heating (
42b); (iv) the temperature (
47b); (v) the first parameter in (
55b), which, on account of (
62a) and the smallness of
, simplifies to
(vi) the second parameter in (
55b), which, on account of (
47b) and (
35a), can be rewritten as
where the first term is dominant:
(vii) the third parameter (
58d), where the first term is dominant:
Table 1,
Table 2,
Table 3 and
Table 4 contain all the data needed to (a) plot
Figure 2,
Figure 3,
Figure 4,
Figure 5,
Figure 6,
Figure 7,
Figure 8 and
Figure 9 as a function of depth and (b) list in
Table 5 the values at the inner and outer boundaries for the eight physical variables of the problem, namely, (i) the electric field (
35b); (ii) the electric current (
35d); (iii) the magnetic field (
37a); (iv) the temperature (
49); (v) the heat flux (
50b); (vi) the displacement (
59); (vii) the strain (
60); (viii) the stress (
61).
Figure 2,
Figure 3,
Figure 4,
Figure 5,
Figure 6,
Figure 7,
Figure 8 and
Figure 9 and
Table 5 compare the flight in fair weather versus in lightning storms (
Section 4.3).
4.3. Comparison of Flight in Fair Weather and Lightning Storms
Figure 2 shows that the electric field (
68) decays exponentially with depth from a surface value that is much higher
in a lightning storm than
in fair weather. In both the fair weather (left) and lightning storm (right) cases in
Figure 2, the electric field is highest for titanium and lowest for steel, with aluminium and copper in between. In all cases, the values in a lightning storm are higher than in fair weather, as represented by the scheme
In
Figure 3, the exponential decay of the electric current with depth (
68) is the same as for the electric field in
Figure 2, but the starting values are all distinct due to the Ohmic electrical conductivity and much higher in a lightning storm than in fair weather. For the electric current in
Figure 3, the hierarchy is not as clear as for the electric field in
Figure 2, with some curves for different metals crossing at intermediate depth instead of being separated over the whole thickness of the slab. Both for the fair weather case (left) and for the lightning storm case (right) in
Figure 3, the electric field starts highest for copper, but then crosses with aluminium and titanium, and remains always larger only relative to steel.
In
Figure 4, the magnetic field decays exponentially with depth (
68) like the electric field in
Figure 2 and the electric current in
Figure 3, with starting values that are (a) much higher in a lightning storm than in fair weather and (b) in both cases different for distinct metals, namely, maximum for titanium, and decreasing for aluminium and copper and minimum for steel, thus leading to the same hierarchy (
88) as for the electric field in
Figure 2.
In all three figures, specifically,
Figure 2 for the electric field,
Figure 3 for the electric current and
Figure 4 for the magnetic field, the exponential decay in (
68) is very rapid because the penetration depth is very small. In order to make the “skin effect” visible, and avoid the curves collapsing to the
x axis, only a small depth below the surface,
is shown in
Figure 2,
Figure 3 and
Figure 4. The very fast decay with the depth of the electric current in
Figure 2 implies that the Joule heating is hardly visible on (
76) the full length scale
used in
Figure 5 for the temperature, in
Figure 6 for the heat flux, in
Figure 7 for the displacement, in
Figure 8 for the strain and in
Figure 9 for the stress.
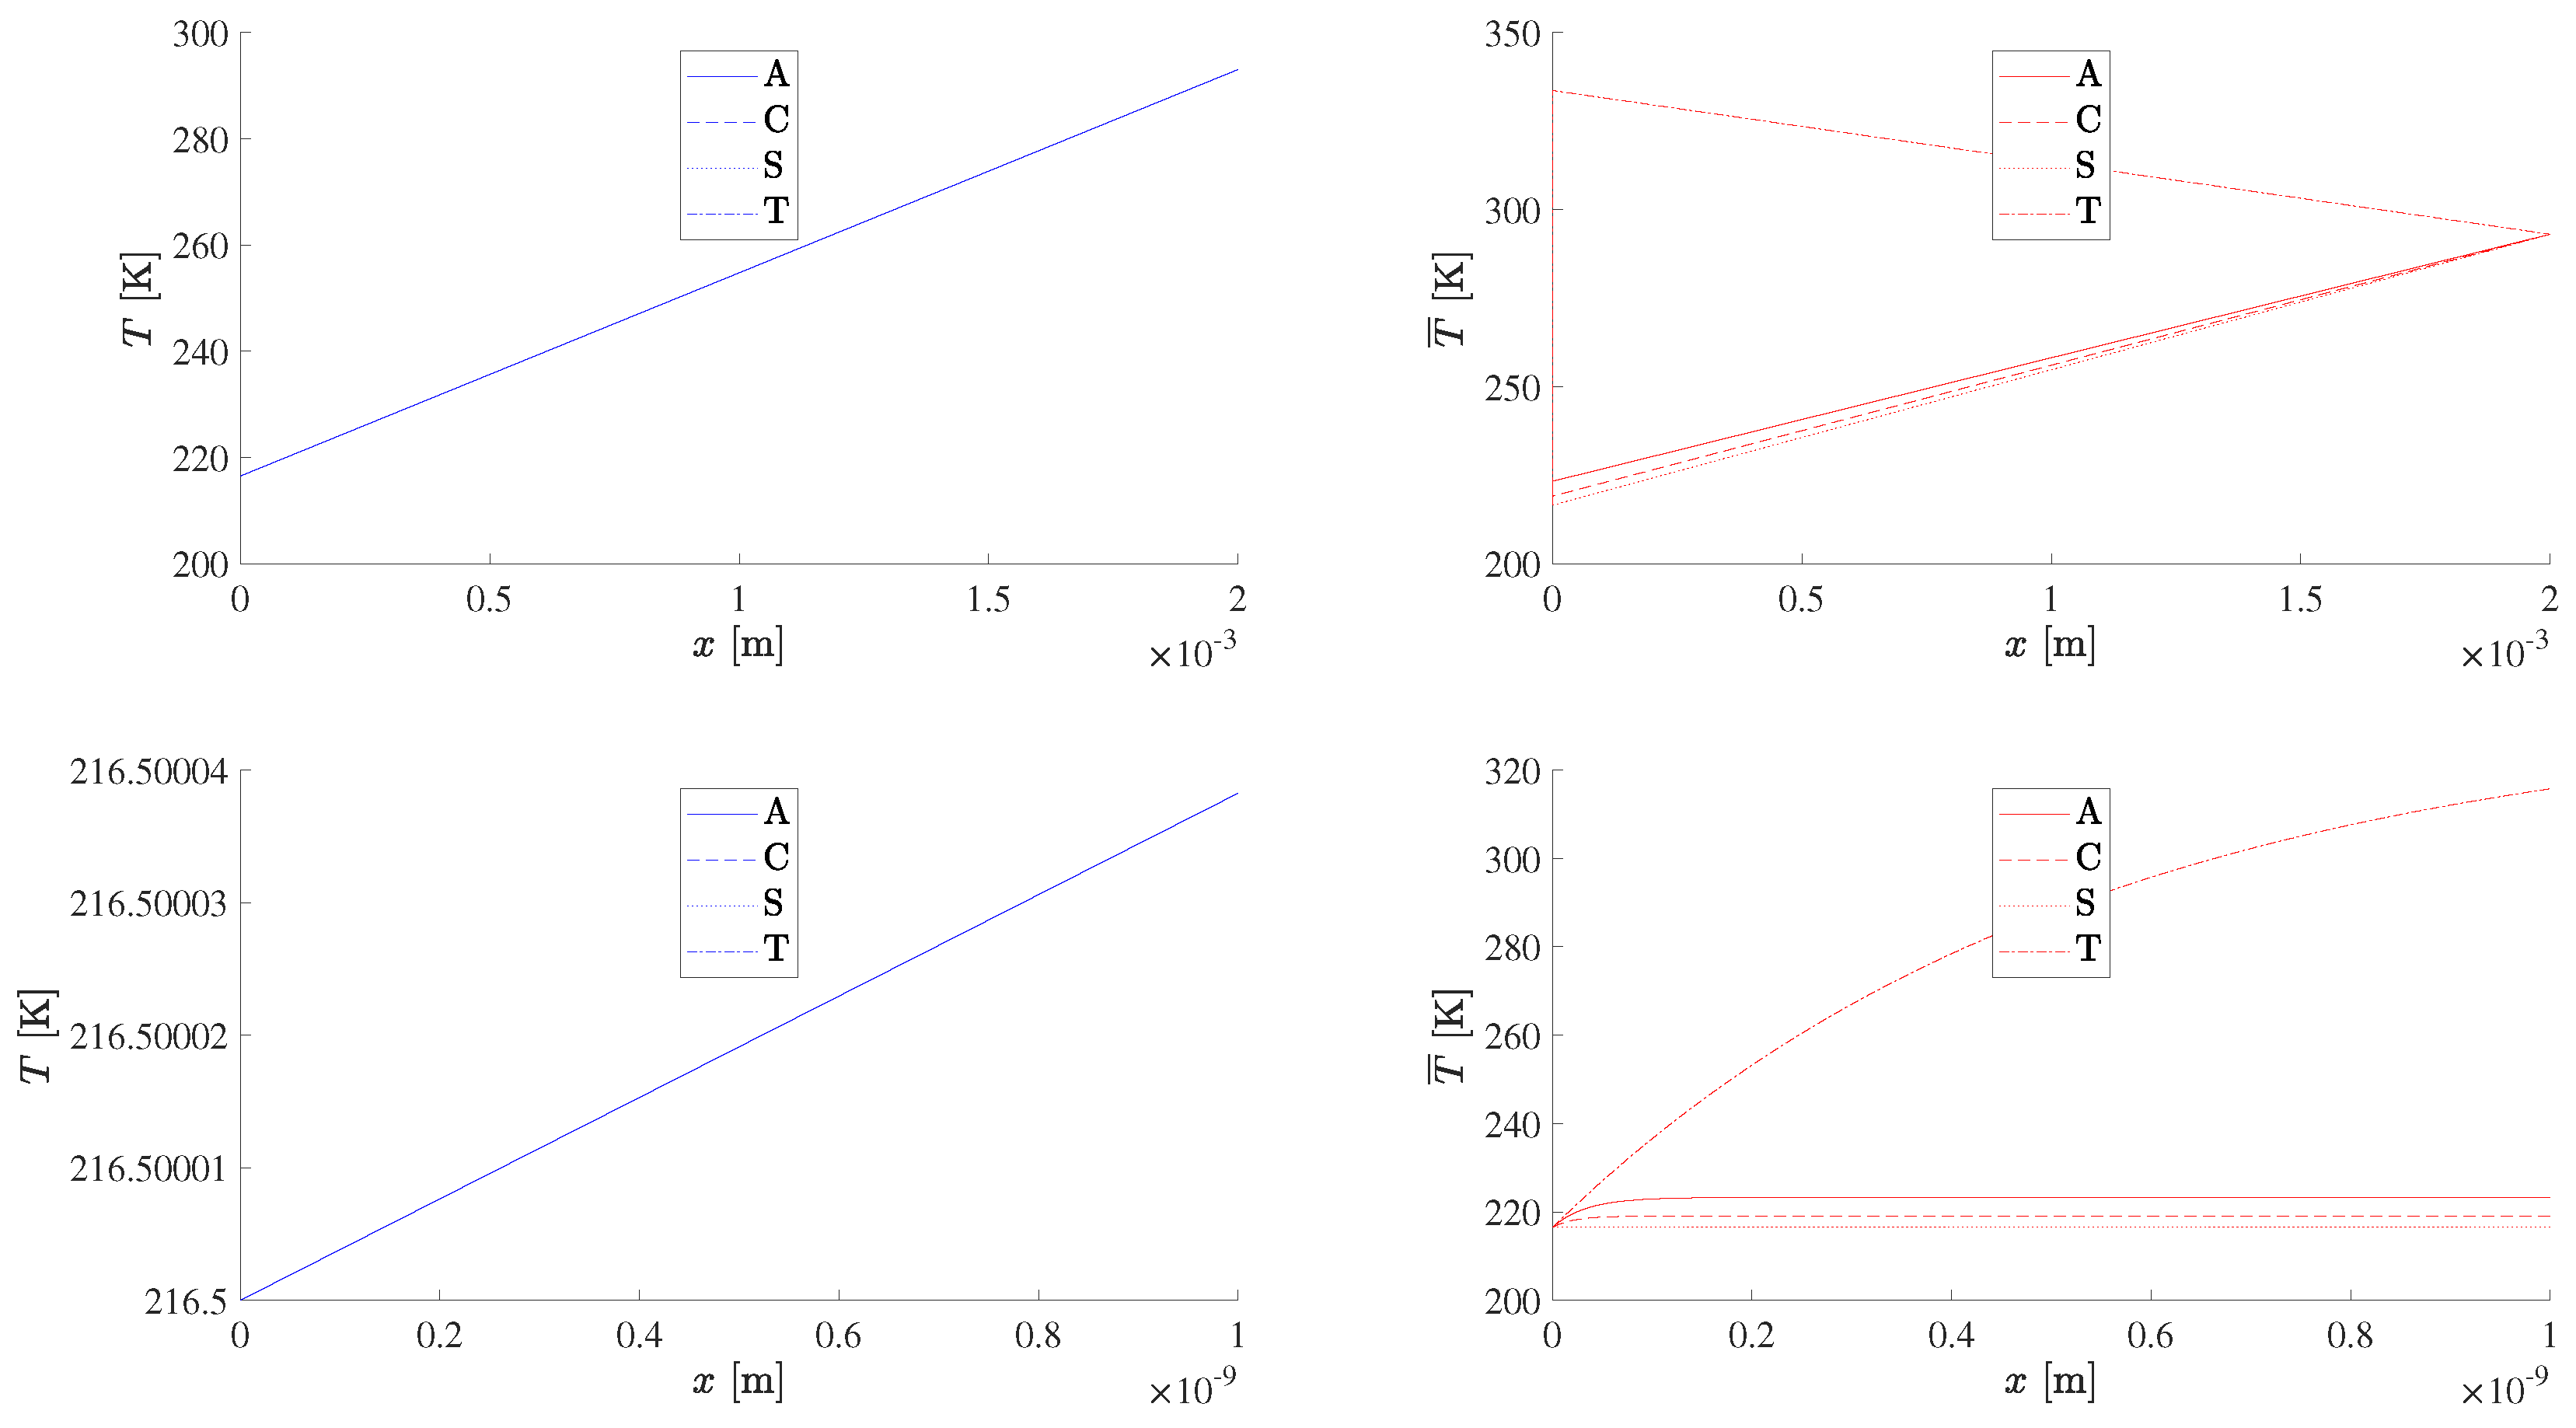
The temperature profile (
49) would be linear (dotted line) between the fixed boundary values (
Figure 5) in the absence of the Joule heat source due to the resistive dissipation of electric currents shown in
Figure 3. The Joule heating in fair weather (left plots of
Figure 5) is small enough not to affect the linear temperature profile between the temperatures (
78) at the outer and (
79) at the inner wall, with no discernible difference between different metals. The situation is different in a lightning storm (right plots of
Figure 5): (i) the outer wall retains (bottom right of
Figure 5) the same atmospheric value (
78), and the intense Joule heating within the thin region of skin effect appears as a higher initial temperature
in
Figure 5 (top right); (ii) the highest temperature
is for titanium, which is a heat-resistant metal, with clearly lower values for aluminium, copper and steel, in decreasing order, as shown in
Table 6; (iii)
Table 6 indicates the peak temperature
due to the Joule heating in the skin effect and the depth
at which it occurs for each metal, showing that the penetration depth is largest for titanium and smallest for steel, with copper and aluminium in between; (iv) outside the skin effect
, the Joule heating is negligible and the temperature varies linearly from the “peak” value
at
in
Table 6 to the fixed value (
79) at the inner wall; (v) for all metals except titanium, the “peak” temperature
due to Joule heating at
is lower than the inner wall temperature
, and thus, beyond the “peak”
, the temperature rises almost linearly from
at
to
at
. For titanium, the peak temperature
at
is larger than the inner wall temperature
, leading to a linear decay to the same temperature (
79) at the inner wall; (vi) in the full range plot (top plots of
Figure 5) the temperature always ends at the inner wall value (
79); (vii) the temperature always starts at the outer wall temperature (
78), as is apparent for fair weather (left plots of
Figure 5); (viii) for a lightning storm, the temperature also starts (right bottom plots of
Figure 5) at the outer wall value (
78), but, since the Joule heating region is so thin (
Table 6), the temperature appears to start at
in the full thickness plot (top-right plots of
Figure 5); (ix) the values of
are noticeably higher for titanium and close for aluminium, copper and steel (
Table 6); (x) thus, over the full thickness of the slab in a lightning storm (top-right plots of
Figure 5), the temperature for titanium appears higher than for fair weather, whereas, for aluminium, copper and steel, there is not much difference between fair weather and the lightning storm because the Joule heating is not too significant in either case. Thus the hierarchy is different in detail in a thin skin heating region
and, overall, over the whole thickness of the slab,
The hierarchy for temperature in the Joule heating region (
91a) is the same as (
88) for the electric and magnetic fields in a lightning storm, whereas, in fair weather, the hierarchy in (
88) becomes negligible in (
91a). The hierarchy over the full thickness of the slab (
91b) in the top plots of
Figure 5 (i) also applies to the weak Joule heating in fair weather in the skin region (bottom-left plots of
Figure 5); (ii) does not show the detail (bottom-right plots of
Figure 5) of more intense Joule heating in the skin region in a lightning storm (
Table 6) that corresponds to the hierarchy (
91b).
The heat flux (
Figure 6) would be (
69a)–(
69b) constant (dotted line),
in the absence of Joule heating. For fair weather (left plot of
Figure 6), the Joule heating is very small or negligible, leading to a horizontal line for the heat flux. For a lightning storm, the Joule heating is also small outside the skin area, leading to nearly the same horizontal line as for fair weather if the full range of depth (
90) is used. In order to show the effect of Joule heating in the case of a lightning storm (right plot of
Figure 6), the heat flux is plotted in a subset
with a smaller depth within the thin skin region (
89). The modulus of the heat flux is highest for copper and lowest for steel with titanium and aluminium in between in fair weather (left plot of
Figure 6) when the heat flux is constant. In a lightning storm (right plot of
Figure 6), in the thin region of the skin effect, the intense Joule heating leads to an increase in heat flux that is fastest for titanium and slowest for steel, with copper and aluminium in between. Thus the hierarchy for heat flux is different in a lightning storm to in fair weather,
with much larger values in the former case. The hierarchy for the heat flux (
93) is broadly similar to those for the temperature (
91a)–(
91b) and electric and magnetic fields (
88).
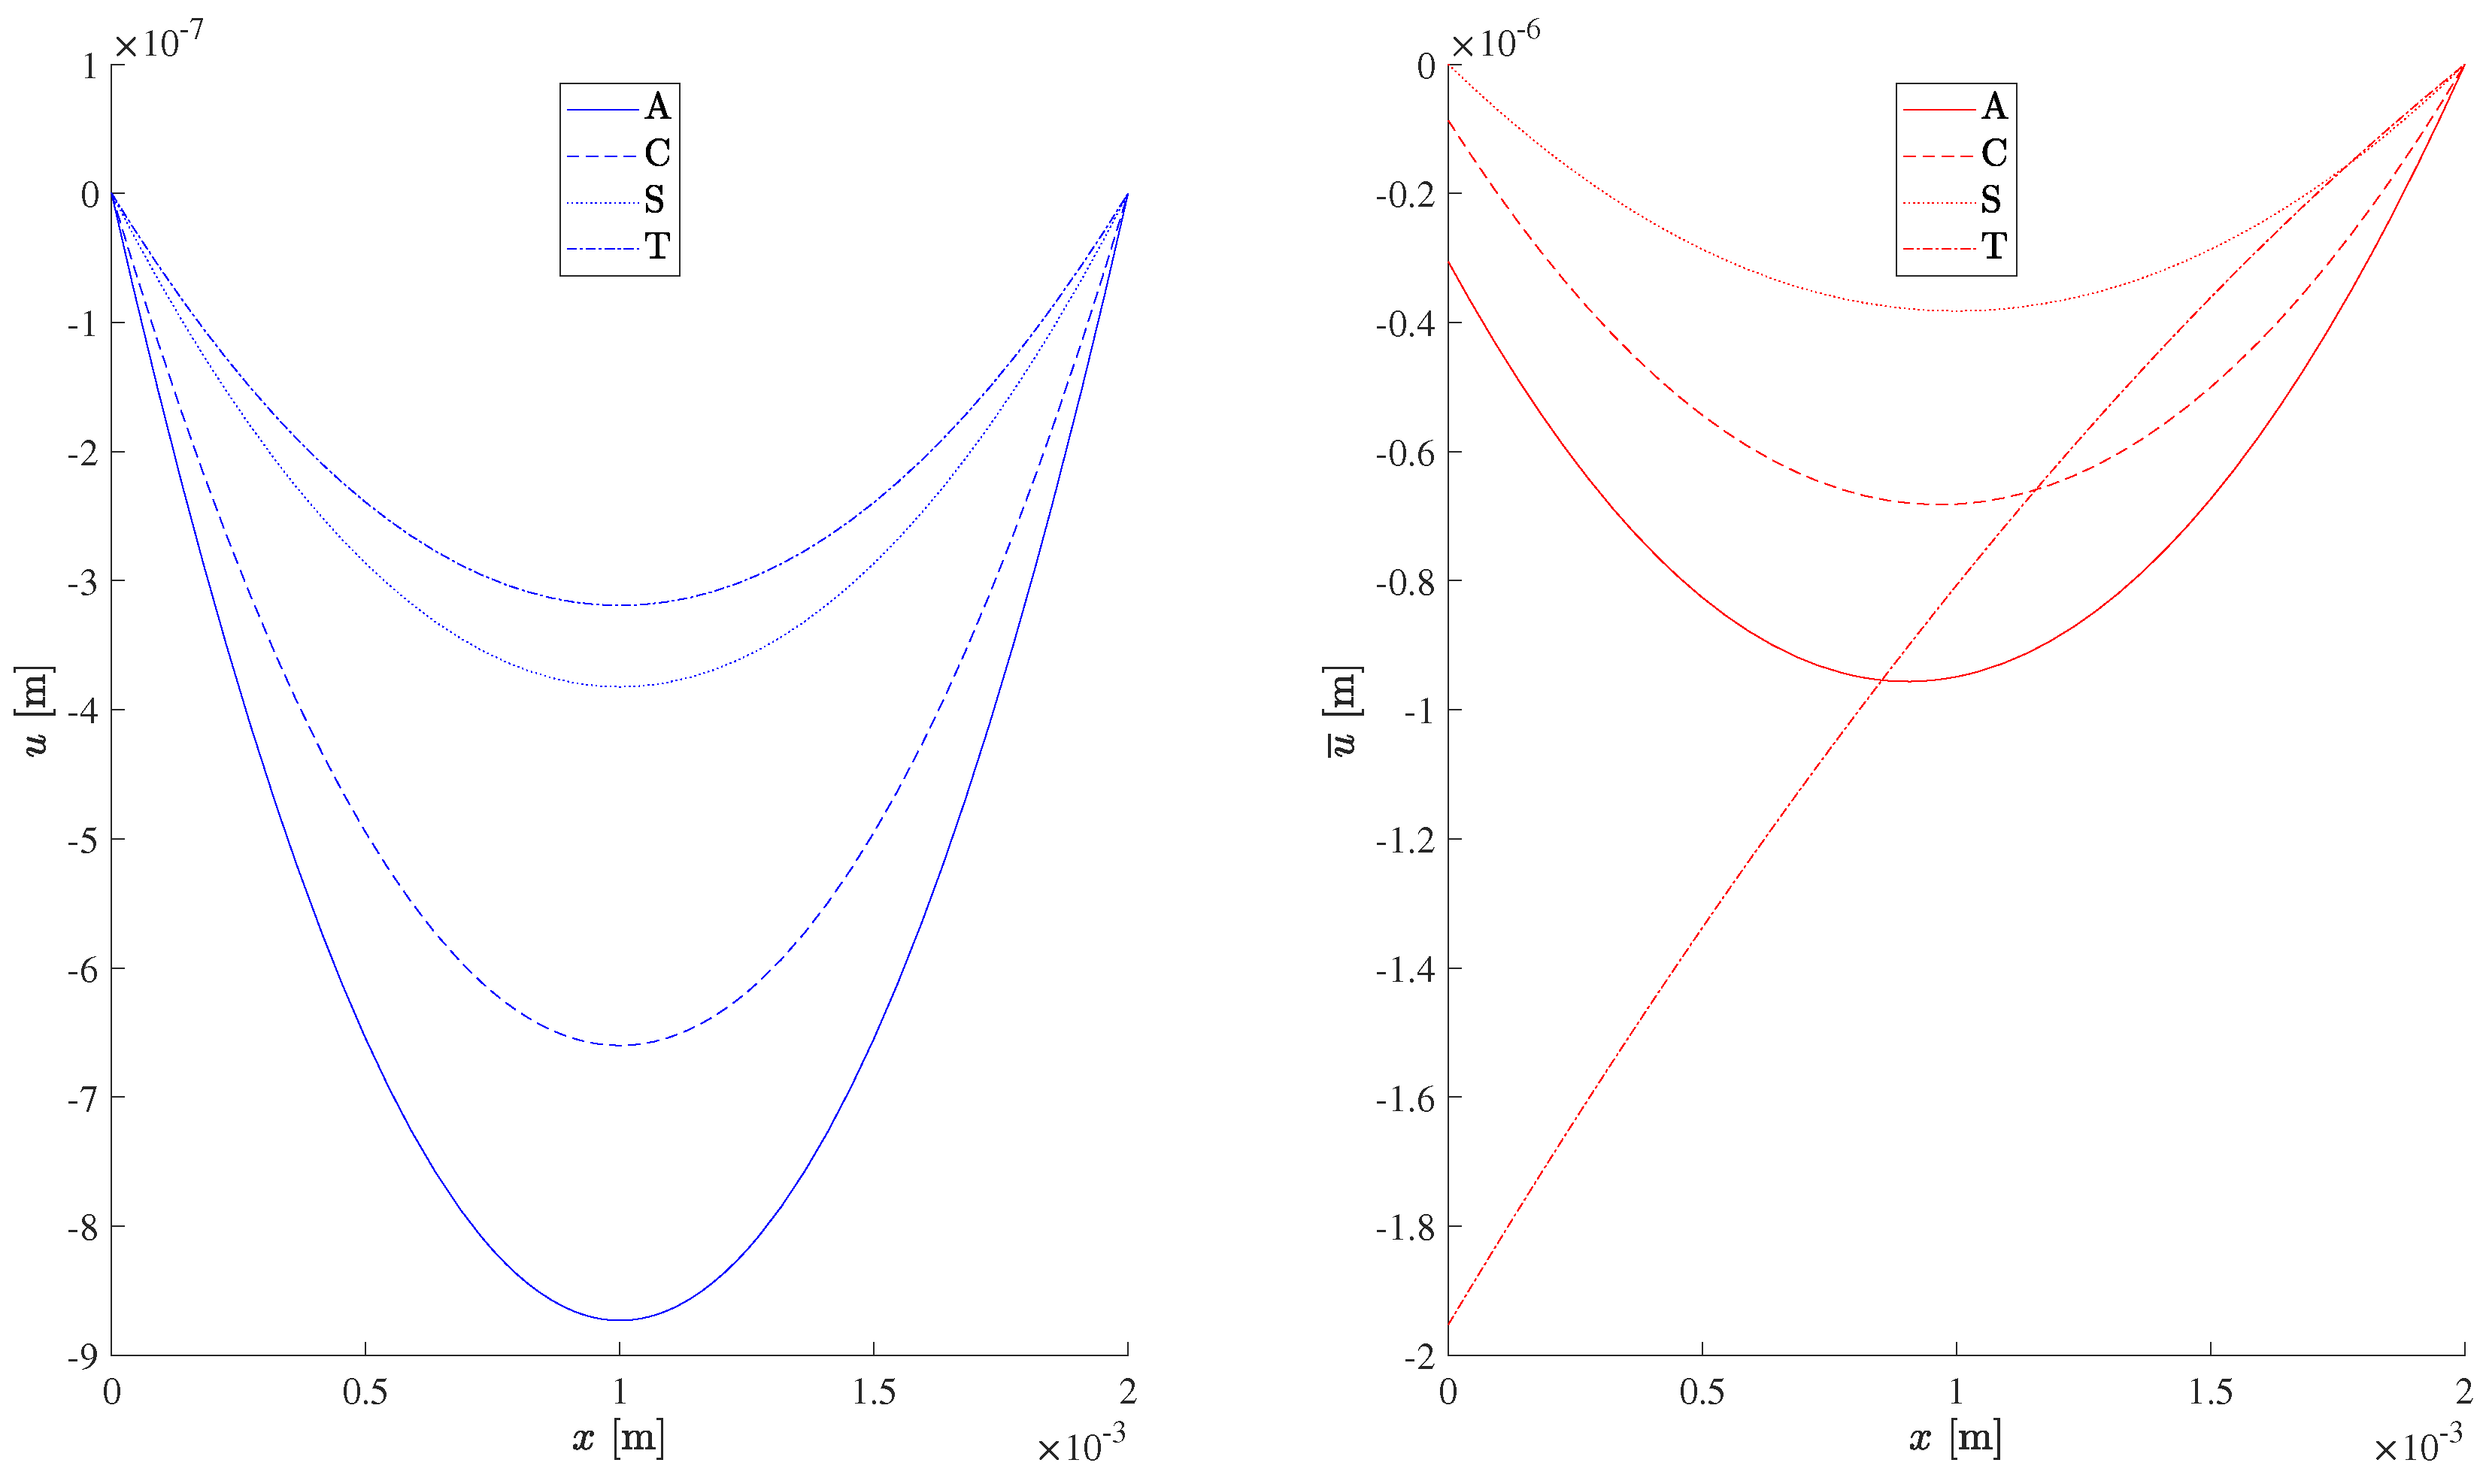
Figure 7 shows that the displacement is zero at the inner boundary and negative at the outer boundary, with larger values in modulus depending more on the metal than on the weather. The displacement is (
59), the sum of a quadratic function and a negative exponential of position. The displacement in
Figure 7 is close for fair weather (left) and a lightning storm (right) for all metals except titanium. In both cases, the displacement in the modulus is largest for aluminium and decreases for copper and steel. For fair weather, the smallest displacement in the modulus is for titanium:
For a lightning storm, the curve for titanium corresponds to a smaller displacement in modulus than for aluminium, and crosses with the curve for copper close to the outer wall, and also crosses with the curve for steel close to the inner wall. The hierarchy (
94) for the displacement differs from (
88) for the electric and magnetic fields (
93) and from (
91a)–(
91b) for the temperature and (
93) for the heat flux because the ordering of metals is distinct.
Figure 8 shows that the strain (
60) does not vanish at either boundary and is (
60) a linear function (dotted line) plus an exponential. The exponential effect away from the surface is small and the strain is almost linear, with the magnitude and slope depending more on the metal than on the weather. Although not zero, the strain is very small at the outer wall in fair weather (
Figure 8, left) and increases towards the inner wall. At the inner wall, the strain in a lighting storm (
Figure 8, right top) is not too different from in fair weather, starting at the outer wall with small values. The sole exception is titanium in a lightning storm, for which the strain increases rapidly in the skin region (
Figure 8, right bottom), and thus, beyond the skin region (
Figure 8, right top), it starts with a relatively large value and decays towards the inner wall, where it takes the lowest value after crossing with the curves for the other three metals. The hierarchy for strain
is distinct from the heat flux (
93), temperature (
91a)–(
91b) and electric and magnetic fields (
88). The hierarchy for the strain (
95) is similar to (
94) for the modulus of the displacement interchanging fair weather and the lightning storm.
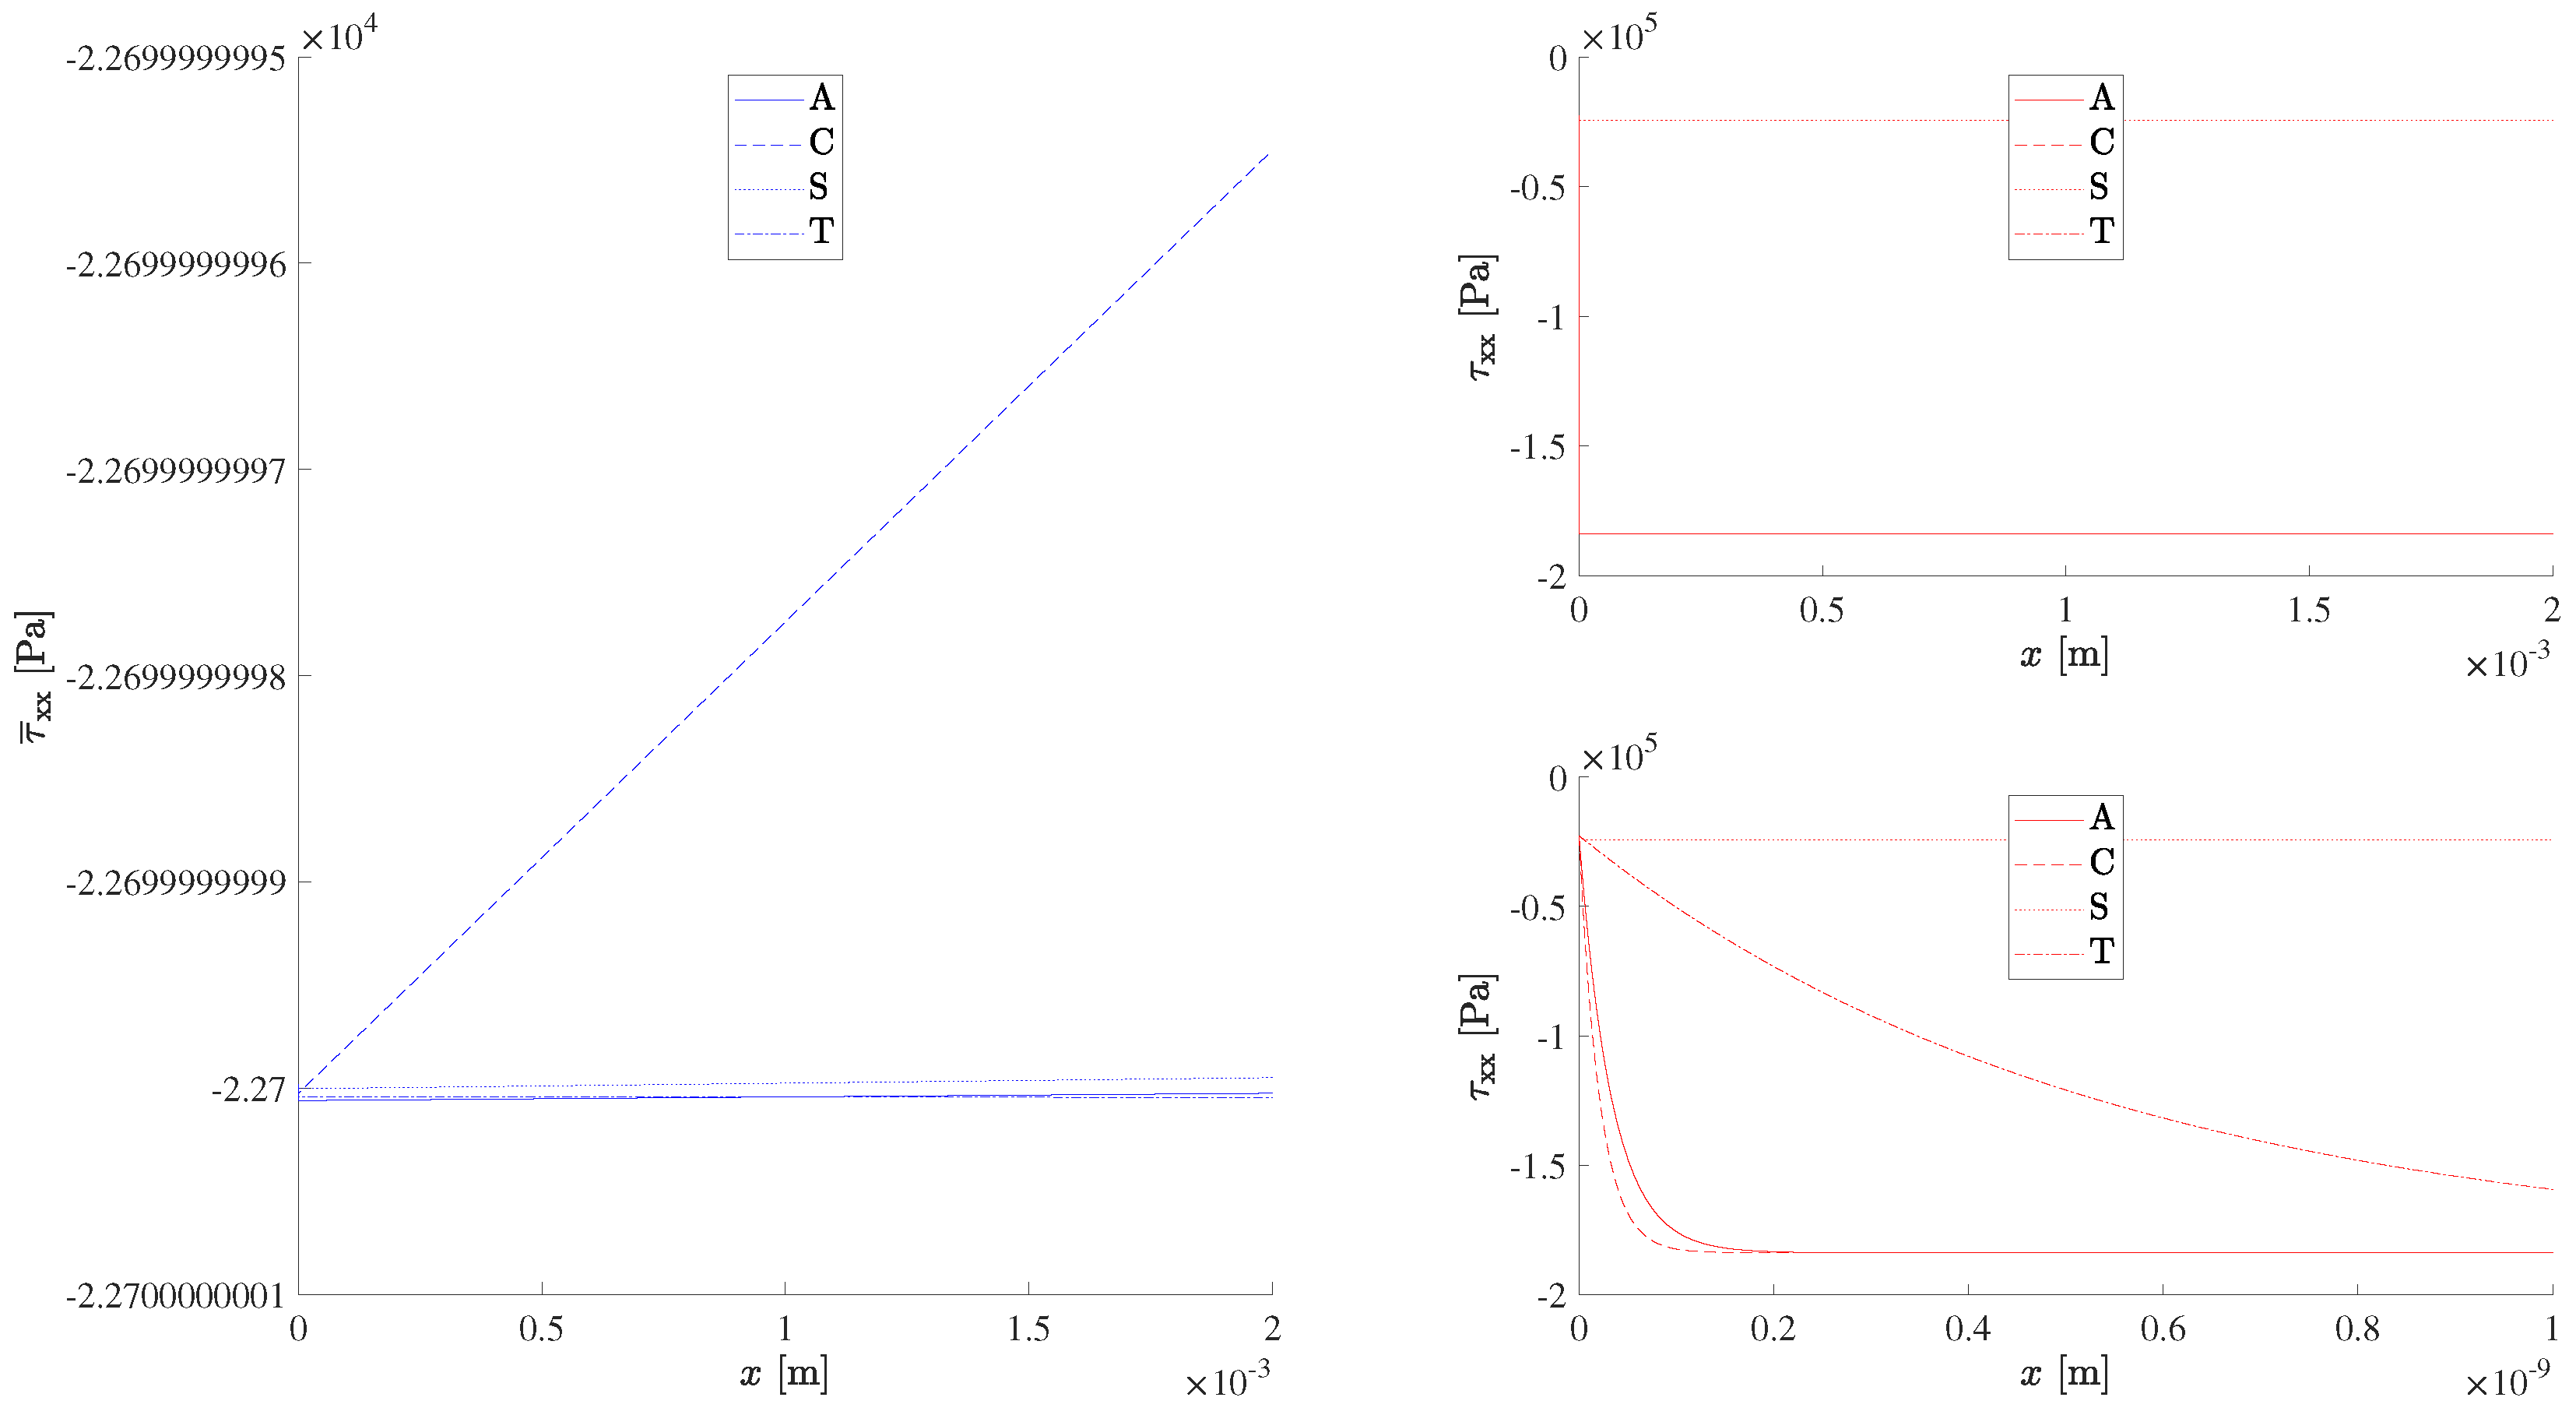
In the stress (
62c), it is assumed that the reference temperature (
62b) is given by the mean value of external (
78) and internal (
79) wall temperatures, specifying an intermediate point at about half the depth at which the thermal stresses are zero. The stress (
Figure 9) equals (
61) minus the atmospheric pressure at the outer boundary plus an exponential term associated with Joule heating decreasing from the outer to the inner wall and depends more on the material than on the weather. The stress starts at the atmospheric pressure at the outer wall, and, in fair weather (
Figure 9, left), remains nearly constant, except for a marked linear decrease in the modulus for copper. In a lightning storm, the stress appears constant (
Figure 9, right top), and smaller for steel, because, in the thin skin region (
Figure 9, right bottom), the stress increases in the modulus for all metals other than steel. The hierarchy for the modulus of the stress
is distinct from strain (
95), heat flux (
93), temperature (
91a)–(
91b) and electric and magnetic fields (
88).


