Article

Wearable 256-Element MUX-Based Linear Array Transducer for Monitoring of Deep Abdominal Muscles

1
Ultrasound Department, Fraunhofer IBMT, D-66280 Sulzbach, Germany
2
Prema Semiconductor GmbH, D-55129 Mainz, Germany
3
Fraunhofer MEVIS, D-28359 Bremen, Germany
4
Forschungsgruppe Geriatrie, Charité–Universitätsmedizin Berlin, D-13347 Berlin, Germany
*
Author to whom correspondence should be addressed.
Appl. Sci. 2025, 15(7), 3600; https://doi.org/10.3390/app15073600
Submission received: 30 January 2025 / Revised: 17 March 2025 / Accepted: 24 March 2025 / Published: 25 March 2025

Abstract

:
Reliable acoustic coupling in a non-handheld mode and reducing the form factor of electronics are specific challenges in making ultrasound wearable. Applications relying on a large field of view (such as tracking of large muscles) induce a need for a large element count to achieve high image quality. In our work, we developed a 256-element linear array for imaging of abdominal muscles with four integrated custom-developed 8:32 multiplexer Integrated Circuits (ICs), allowing the array to be driven by our compact 32 ch electronics. The system is optimized for flexible use in R&D applications and allows adjustable transmit voltages (up to +/−100 V), arbitrary delay patterns, and 12-bit analog-to-digital conversion (ADC) with up to 50 MSPS and wireless (21.6 MBit/s) or USB link. Image metrics (SLL, FWHM) were very similar to a fully populated array driven with a 256 ch system. The contrast allowed imaging of lesions down to 7 cm in the phantom. In a first in-vivo study, we demonstrated reliable acoustic contact even during exercise and were able to visualize deep abdominal muscles such as the TrA. In combination with a muscle tracking algorithm, the change of thickness of the TrA during SSE could be monitored, demonstrating the potential of the approach as biofeedback for physiotherapy training.

1. Introduction

Deep abdominal muscles, in particular, the musculus (M.) transversus abdominis (TrA), are known to play a crucial role in (management of) chronic low back pain, a condition with a high prevalence, especially in the older population. For people older than 75 years, back pain is the most frequent musculoskeletal health problem, with a prevalence of 66% in women and 56% in men (data for Germany, 2020) [1].
When it comes to therapy, painkillers are often prescribed, but they have no therapeutic effect on the cause of the symptoms. On the other hand, there is clinical evidence that physiotherapy represents an effective treatment for chronic back pain [2]. The standard approach consists of performing so-called core stabilization exercises whose benefits for the management of low back pain have been well documented in the literature [3]. Studies have shown that performing such exercises has positive effects on different levels, especially on pain and the overall quality of life [4]. When performing such exercise, in particular segmental stabilization exercise (SSE) [5], which is the most widespread form of core stabilization exercises, patients and therapists encounter the challenge that isolated contraction of the relevant muscles (TrA) is perceived as very challenging, especially for patients with poor body awareness. Patients must first be taught how to perform the training correctly, for which a reliable feedback method is required. Appropriately trained physiotherapists can palpate if the SSE is performed adequately, which, however, requires the continuous assistance of the patient by a therapist and thereby prevents training in a home setting. Furthermore, it has been shown that visual feedback is superior to verbal feedback when learning physical exercise execution [6,7]. In addition to palpation, pressure sensors, electromyography and ultrasound have been investigated as biofeedback for SSE. Since the thickness of the TrA, which can be assessed by ultrasound [8], changes during correctly performed training, ultrasound is the only method that allows real-time visual feedback on the correct training execution. In the past, some studies were conducted to investigate the effect of real-time ultrasound imaging as biofeedback for selective strengthening of the TrA [9,10]. While these studies were very relevant with respect to investigating the potential of ultrasound as a biofeedback tool in SSE, the setups used were not suitable for a wider deployment as a standard tool during physiotherapy. This relates to the nature of the equipment used, which consists of clinical sonography devices with handheld linear or curved probes in the frequency range of 5–10 MHz. When thinking about the routine use of ultrasound in the proposed application, different boundary conditions must be kept in mind, among which the costs/availability, portability/wearability and automated analysis for easy-to-understand and patient-friendly visualization seem the most relevant. First, routine use of ultrasound in physiotherapy rehabilitation would require low-cost ultrasound imaging systems, which provide imaging quality that is good enough to assess the change of the thickness of the TrA reliably in real-time. Second, such a system should ideally be wearable or at least compact and portable, such that it is usable during exercise. In particular, probes must be designed such that they can be worn or attached to patients during exercise, in contrast to standard sonography probes, which are made for handheld use. Finally, since expertise in the interpretation of ultrasound data is not always given (for physiotherapists and especially for patients), methods of image interpretation and conversion of image data into easy visual feedback are required.
In the last years, a number of portable or even wearable ultrasound probes have been developed [11,12,13,14,15,16]. However, from a closer look, many of them are wearable ultrasound transducers, which still require bulky table-top multichannel electronics to drive them [11,12,13]. Nevertheless, fully integrated, miniaturized and wearable ultrasound systems have been reported [14,15,17]. In wearable ultrasound, especially when the applications require (B-Mode) images, the huge amount of data that needs to be acquired and processed represents a main challenge. Since B-mode relies on driving array transducers with typically 100 to 200 elements, a digitization scheme either relying on parallel channels or on multiplexing needs to be implemented. Due to the size and power consumption constraints, most so far presented wearable ultrasound systems rely on a reduced channel count combined with multiplexers (in contrast to table-top multichannel ultrasound research systems with dozens to hundreds of native TX/RX channels). In addition to challenges with respect to the form factor, the large number of digitization channels needed for imaging represents a burden for the implementation of a wireless data link. On the other hand, since ultrasound imaging is typically based on very low-duty cycles (DC), thermal dissipation does not play a major role as a design constraint. With respect to the data handling issue, most so far presented potentially portable systems with many native transmit and receive channels that had no wireless data link [18]. However, very recently, an ultra-compact system with 32 TX/RX channels, a wireless data link (Wi-Fi up to 21.6 MBps), low power mode and less than 60 mm in the largest dimension has been presented [19]. Here, a design optimized for wearable applications was realized by using a 32 ch IC (Integrated Circuit) focusing on energy efficiency and size rather than flexibility (e.g., max. 16 delay profiles, 2048 samples/ch and 64 Vpp excitation). Up to now, imaging performance comparable to established sonography devices in a handheld format has only been achieved in so-called POCUS (Point of care ultrasound) devices such as the Butterfly IQ (Butterfly Network, Burlington, VT, USA), where the entire data processing pipeline (from channel data to images) has been integrated into the probe by means of customized ASICs [20]. However, such systems, despite being highly compact, provide no interfaces for use in research tasks and have limited suitability for wearable applications (since probes are optimized for handheld use).
In previous work, we presented a compromise between such miniaturized wearable devices and table-top systems consisting of a small portable system with native 32 TX/RX channels and full access to pre-beamformed channel data [16]. Beyond the availability of all data formats throughout the pipeline, from pre-beamformed channel data to image data, the flexible architecture allows combination with all kinds of transducers, representing an advantage in research applications. In the past, the system was combined with self-adhesive probes, which represent an option for continuous imaging (e.g., during exercise) competing with other solutions such as mounts for standard handheld sonography probes [21] or patch transducers.
As mentioned above, when aiming at establishing ultrasound as biofeedback for SSE, automated interpretation of the ultrasound data (images or signals) is required. Different methods have been implemented and tested for real-time segmentation of ultrasound muscle data in the past [22,23,24]. Recently, we investigated the suitability of different deep-learning segmentation approaches for abdominal muscles during SSE training [25], and a semi-automated algorithm was used in a pilot study on the use of ultrasound-biofeedback for improved TrA activation [26]. Since the topic of image segmentation can be considered independent of the availability of a suitable hardware setup and has successfully been demonstrated in the context of muscle tracking, our manuscript focuses on the development of the transducer and the electronics. Accordingly, we report here on the development of a transducer combining the contradictory requirements of a large footprint (and consequently a large number of elements) and being driveable by a compact and portable system. A second focus of the work is the development of the wireless version of our multichannel electronics, which is flexible enough to provide all kinds of data formats, leaving the freedom for postprocessing (e.g., segmentation and/or muscle tracking) on anything from pre-beamformed channel data, single A-scans or scan converted image data. The system was first characterized on phantoms, and in-vivo data were acquired during SSE to assess its suitability as a biofeedback device.

2. Materials and Methods
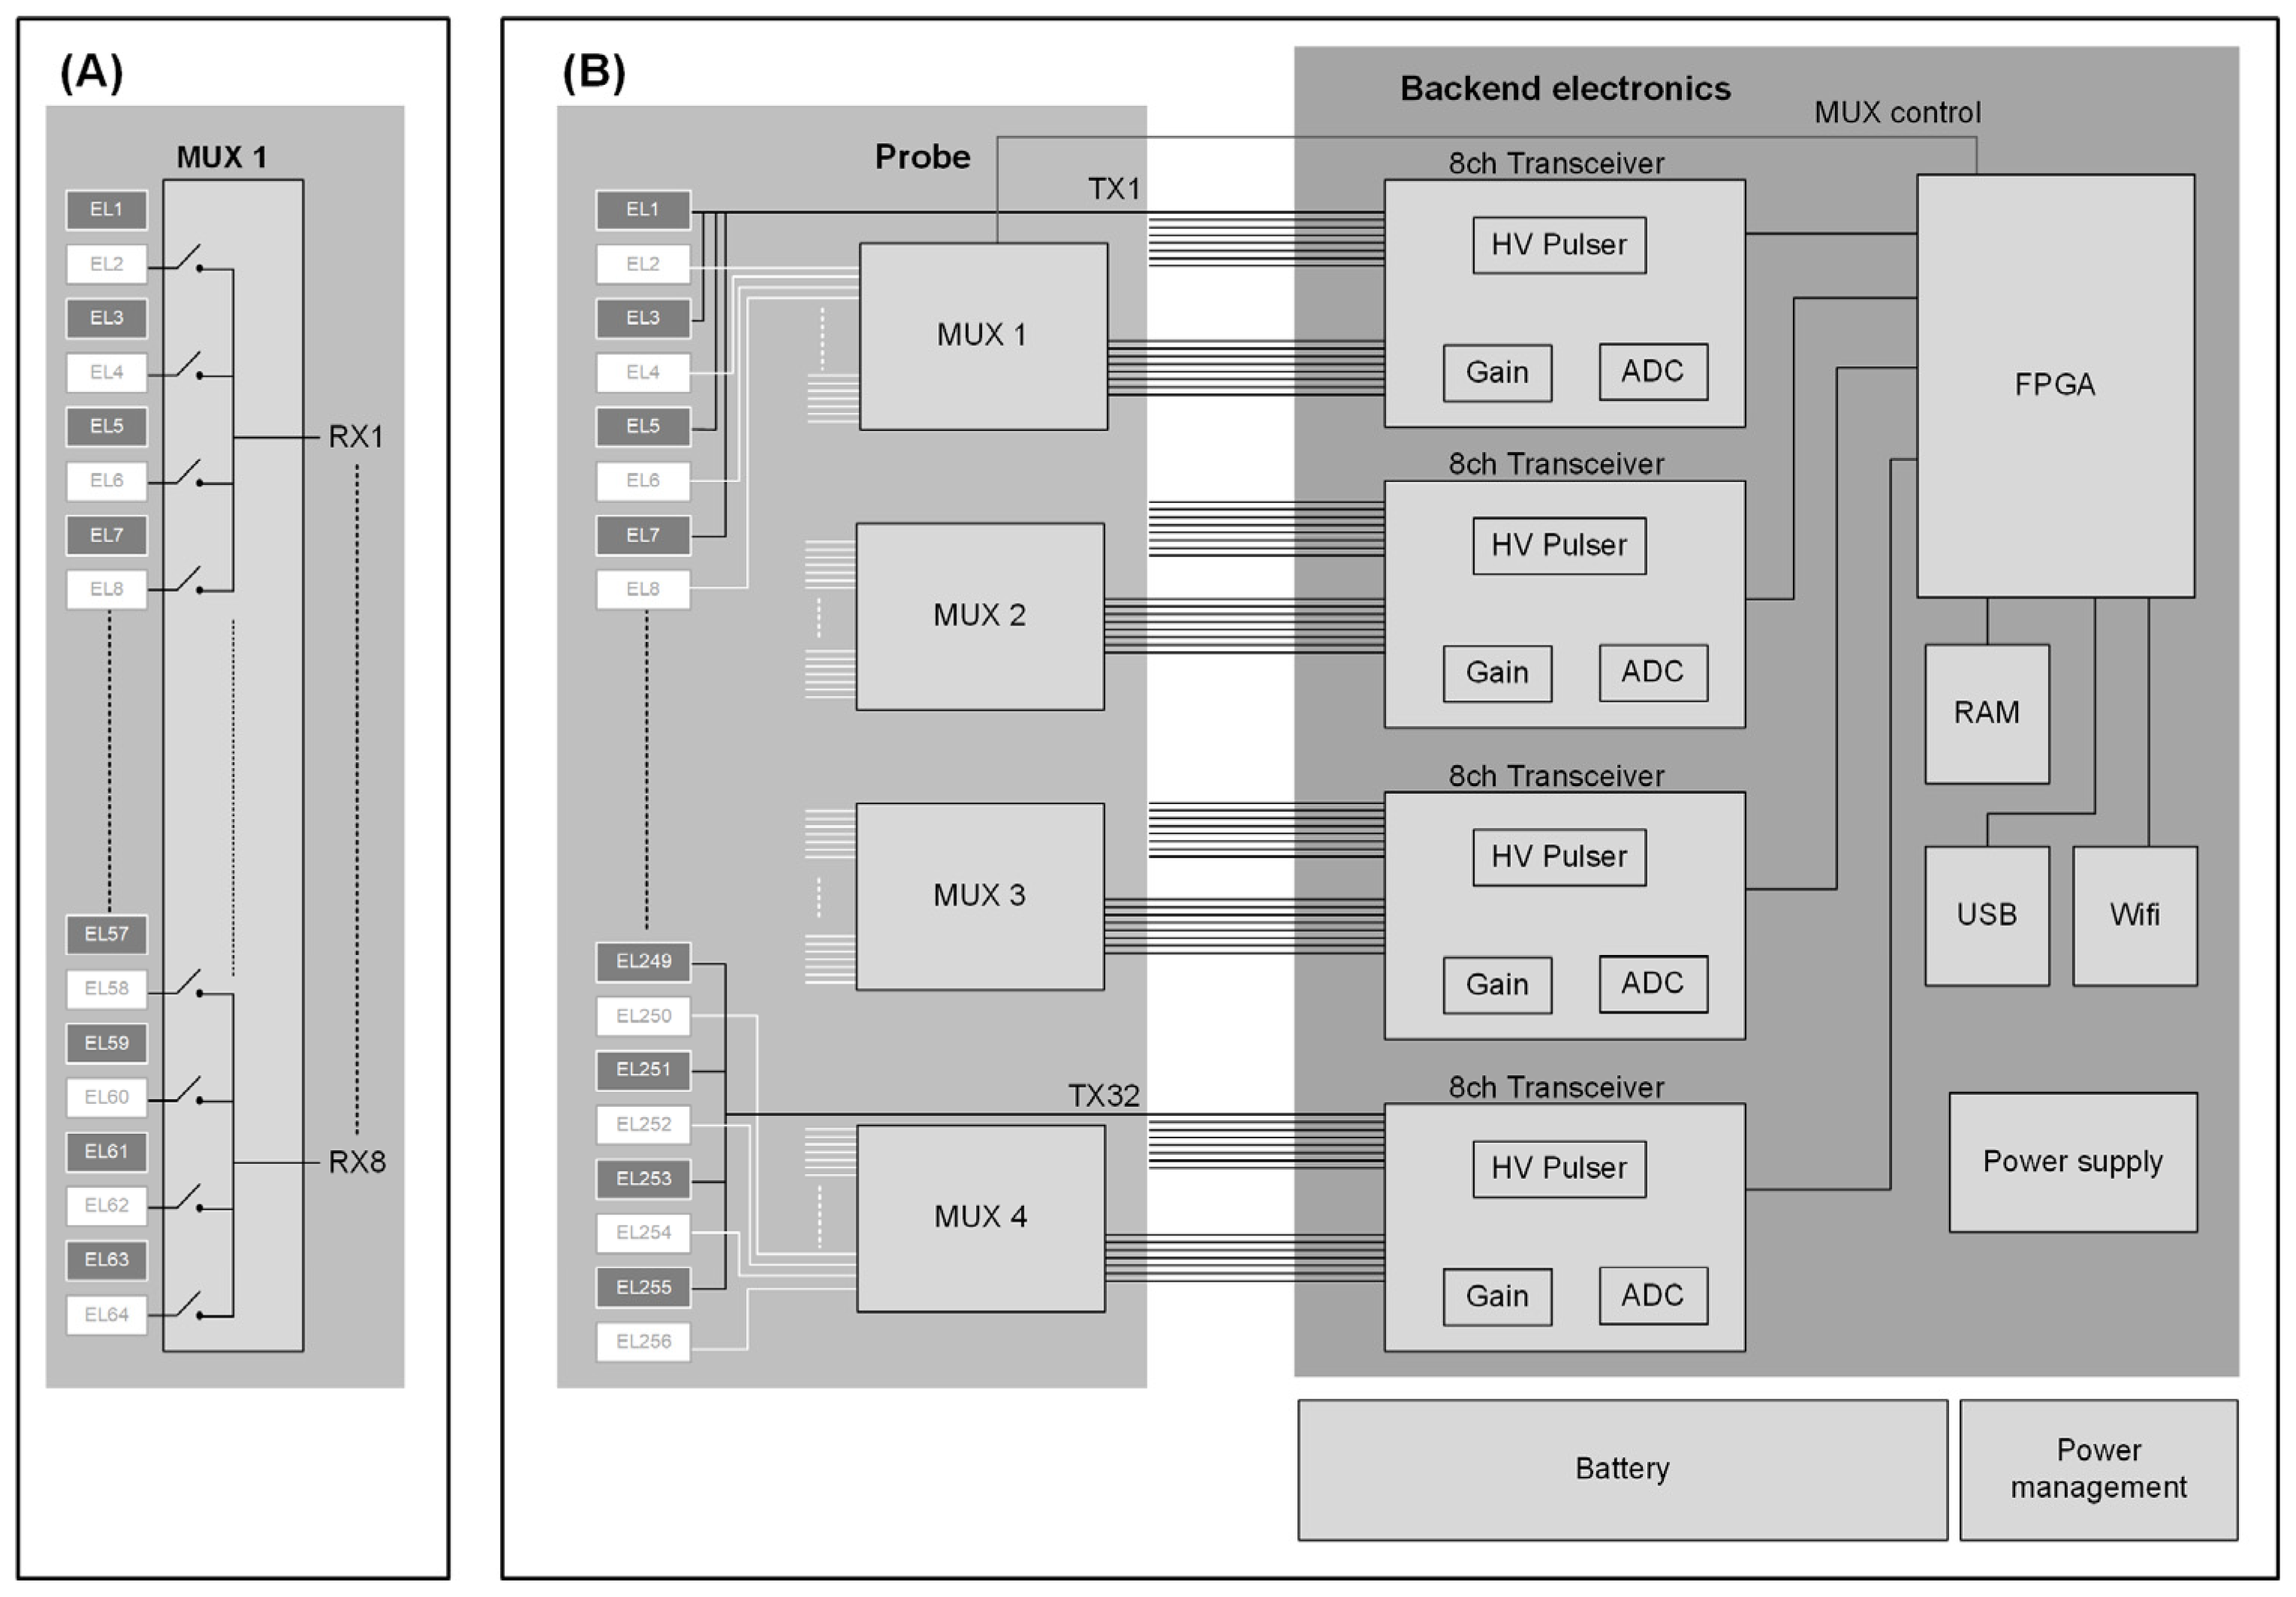
2.1. System Design

The system design consists of a compromise between contradictory requirements relating to the ultrasound transducer and the electronics. First, a wide field of view is required to ensure easy identification of the muscle structure of interest. The frequency must be in the range of 5 MHz or more, which is a spectral range often used for musculoskeletal (MSK) ultrasound. Typically, frequencies up to 15 MHz are used for imaging of superficial muscles, tendons and joint capsules. However, since the TrA is a deep muscle whose depth below the skin furthermore can strongly vary depending on the presence of an abdominal fat layer, a frequency at the lower end of the range that is typically used in MSK applications was chosen. With a pitch in the range of λ/2 and a footprint of ~4 cm, such as many clinically used linear arrays, this results in >200 elements. The electronics needed to drive all array elements should ideally be wearable but, at the same time, provide access to all data types (from pre-beamformed RF channel data to image data) for later processing. A multiplexer is typically used to drive a large element count linear array with a significantly smaller number of TX/RX channels. Since no HV MUX (high voltage multiplexer) with the needed specifications could be identified, we specified a system based on LV MUX integrated into the receive path, inducing the need for different TX-only and RX-only transducer elements.
To investigate the impact of such a system design with reduced transmit element count (and consequently larger TX pitch), we acquired data from a commercial ultrasound phantom (CIRS multipurpose phantom Model 040GSSE, Sun Nuclear, Melbourne, FL, USA) in different transmit-receive schemes. First, the full aperture of a 128-element 5 MHz linear array transducer was used in plane wave compound (PWC) mode (Figure 1A). Next, 64 elements (even-numbered ones) were used in transmission, and the odd-numbered ones were used as receive elements in the same PWC scheme (Figure 1B). As can be seen, there is little difference (apart from a slightly reduced contrast) between both images acquired with identical voltage and TGC. Accordingly, a system concept based on 32 native RX/TX channels in the backend electronics with a custom ASIC MUX in the RX path was chosen for the next steps. In this concept, 128 elements are used in TX with 4 elements excited with the same delay (accounting for the 32 available transmit channels) and a second set of 128 elements is used as receive. Here, four TX/RX events are required for the acquisition of signals of all RX elements, with the MUX switching between elements after each event. The corresponding system scheme is given in Figure 2.

2.2. Multiplexer Development

The system requires 32 multiplexers with four inputs each. To limit the die size and the number of connections per chip, it was decided to put eight multiplexers on one chip and cascade four chips in one system. Each switch within the multiplexer can be controlled independently, thus not only allowing one input out of four to be selected but also connecting two or more inputs simultaneously. The switches are controlled via a 3-wire serial interface. The input amplitude is limited to less than ±0.7 V and is AC coupled into the MUX.
To reduce the output impedance and allow the connection of a longer cable, we decided to combine each MUX channel with a low-noise amplifier (LNA). This also compensates for the signal attenuation by the switch. The circuit was developed using PREMA’s 800 nm BiCMOS process. CMOS transistors with a maximum voltage of 2.8 V were used for the transmission gates of the multiplexer, as well as for the shift register with a clock frequency of at least 20 MHz. For the LNA, both CMOS and bipolar circuits were simulated and tested for the highest gain-bandwidth product. Both concepts achieved similar performance data, but finally, a bipolar amplifier was picked for use in the complete circuit. For the voltage regulator supplying the circuit, using DMOS transistors with a breakdown voltage above 15 V proved to be the most adequate choice.
Metal-metal capacitors with a capacitance of 2.1 fF/µm2 were used for the AC coupling of the input signals. The BiCMOS process used for the ASIC consists of 14 mask layers, including triple metal and a high-capacitance layer. It is manufactured in Prema’s own wafer fabrication facility in Mainz/Germany. Before designing and producing the complete circuit, several variations of the circuit blocks were produced on multiproject wafers to characterize their performance. This was necessary specifically for the transmission gates and the LNA. Two rounds of multiproject wafers were processed to optimize the performance before being put together to the complete ASIC. For the ASIC, 32 transmission gates were combined with a serial shift register and eight LNAs to one circuit and produced on wafers. One wafer contains several 100 ASICs, which have to be tested after production so that only fully functional ASICs are used in the next step. Selected ASICs were then assembled in QFN packages. Four QFN packages are soldered together with the ultrasonic transducer on one flexible PCB to form a MUX with 128 inputs and 32 outputs, controlled by one serial bus. (see Figure 2 and Figure 3A).

2.3. Multichannel Backend Electronics

The multichannel electronics system is based on a modified version of a system we previously reported on [27]. Briefly, it is a single PCB system with 32 transmit and receive channels based on 4 commercial octal transceiver ICs. In transmit mode, tri-state square wave burst signals up to +/−100 V can be generated. Received signals are amplified with up to 44 dB and digitized with 50 MSPS at a resolution of 12 bits. USB and Wi-Fi interfaces are implemented so that pre-beamformed channel data can be transferred for reconstruction. Onboard beamforming is not yet implemented, but the chosen FPGA (ZYNQ-7, Xilinx, San José, CA, USA) would offer such an operation mode. Furthermore, the FPGA is used to control the MUX ICs integrated into the probe head. The system can be powered by a 12 V DC medically certified power supply in the standard implementation. In the setup used in the present work, a battery (RRC 2040, RRC Power Solutions, Homburg, Germany) has been used. The power consumption is in the range of 11 W (or 375 mW for each channel), where 900 mW is due to the Wi-Fi data link.
Software interfaces have been implemented for Wi-Fi data transfer to Windows or iOS-based devices. The ultrasound system is integrated together with the battery and the power management into a 3D-printed customized housing, which is designed to be wearable by strapping to the thigh during exercise (Figure 4).

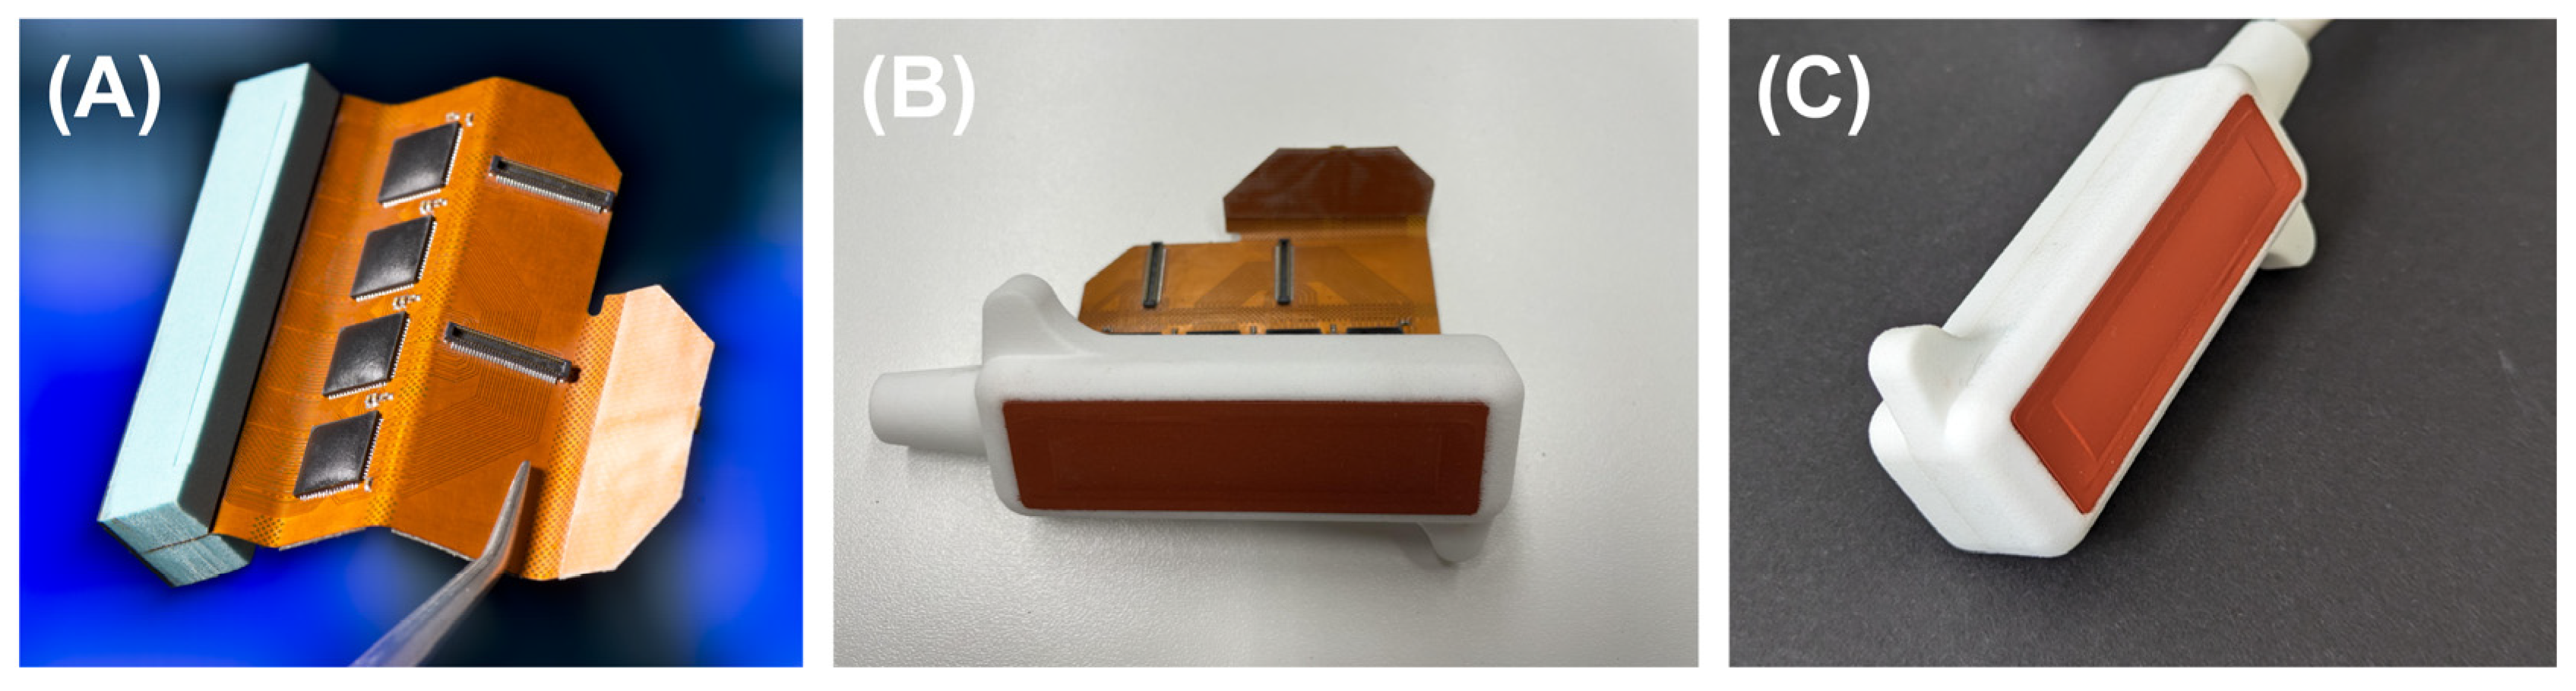
2.4. Transducer Development

The transducer is a 256-element linear array made from bulk PZT with a pitch of 200 µm and an elevational element size of 10 mm. PZT was mounted on a polyurethane backing material, and the elements were realized by dicing. A common ground electrode was applied through a gold sputtering process. For element contacting, a flex PCB is used, as can be seen in Figure 3A. The four MUX to distribute the available 32 receive channels on the 128 receive elements are mounted on the flex PCB. The 128 transmit elements are wired to the 32 available transmit channels of the electronics in groups of 4, which are excited by the same delay. After the ground electrode is deposed, two matching layers are applied to optimize bandwidth. The front of the aperture is sealed with a protective silicon layer, which at the same time acts as an elevational lens. The lens geometry was determined in a simulation study, and a corresponding mold was generated. The lens/protective layer has then been applied to the acoustic block prior to integration into the custom-made 3D printed housing. To keep the transducer as flat as possible and thereby reduce the risk of tipping while it is mounted to the skin surface during exercise, the housing was kept as flat as possible. To achieve this, the flex PCB was designed so that it could be folded (see Figure 3A). Furthermore, the cable outlet is on the side of the housing (cable direction is parallel to the lateral dimension of the array), such that the overall height of the transducer housing could be reduced to 11 mm and the center of mass is as close to the body as possible. The connection to the backend electronics is realized by means of a multi-micro-coax cable, which is terminated by customized connector PCBs on both sides.

2.5. Beamforming Algorithm and Image Processing

Prebeamformed channel data are reconstructed with a parallelized implementation of a PWC compounding algorithm [27] modified with coherence weighting [28] and non-linear filtering based on wave-front statistics [29]. Accordingly, the reconstructed pixel value I(x, z) is given as
I x , z = α m I m , α x , z · σ 1 · σ 2
where
I m , α x , z = n s n ,   τ x , z , α
with s being the pre-beamformed channel data, m being the multiplexer position, n standing for the index of the receive transducer element (itself depending on the multiplexer position), α being the plane wave angle and τ being the time of flight from the aperture to a reconstructed point located at (x, z) and back to the element located at ( x n , 0). In (1), σ 1 and σ 2 are the mentioned coherence factor and the non-linear wave-front homogeneity coefficient. After beamforming, the 12-bit RF data are envelope-filtered using a Hilbert transform and scan-converted to 8-bit values. When it comes to the segmentation of the muscle layers for tracking the TrA thickness change during SSE, a semi-automatic approach was chosen [23]. Briefly, an initial frame was identified, and a Viterbi-based algorithm [30] was used to identify the muscle fascia. An optical flow tracking algorithm was used to propagate the resulting muscle mask through the frame sequence using the Lucas-Kanade method [31,32]. Three measurement points per muscle at which the thickness is analyzed were tracked additionally.

3. Results

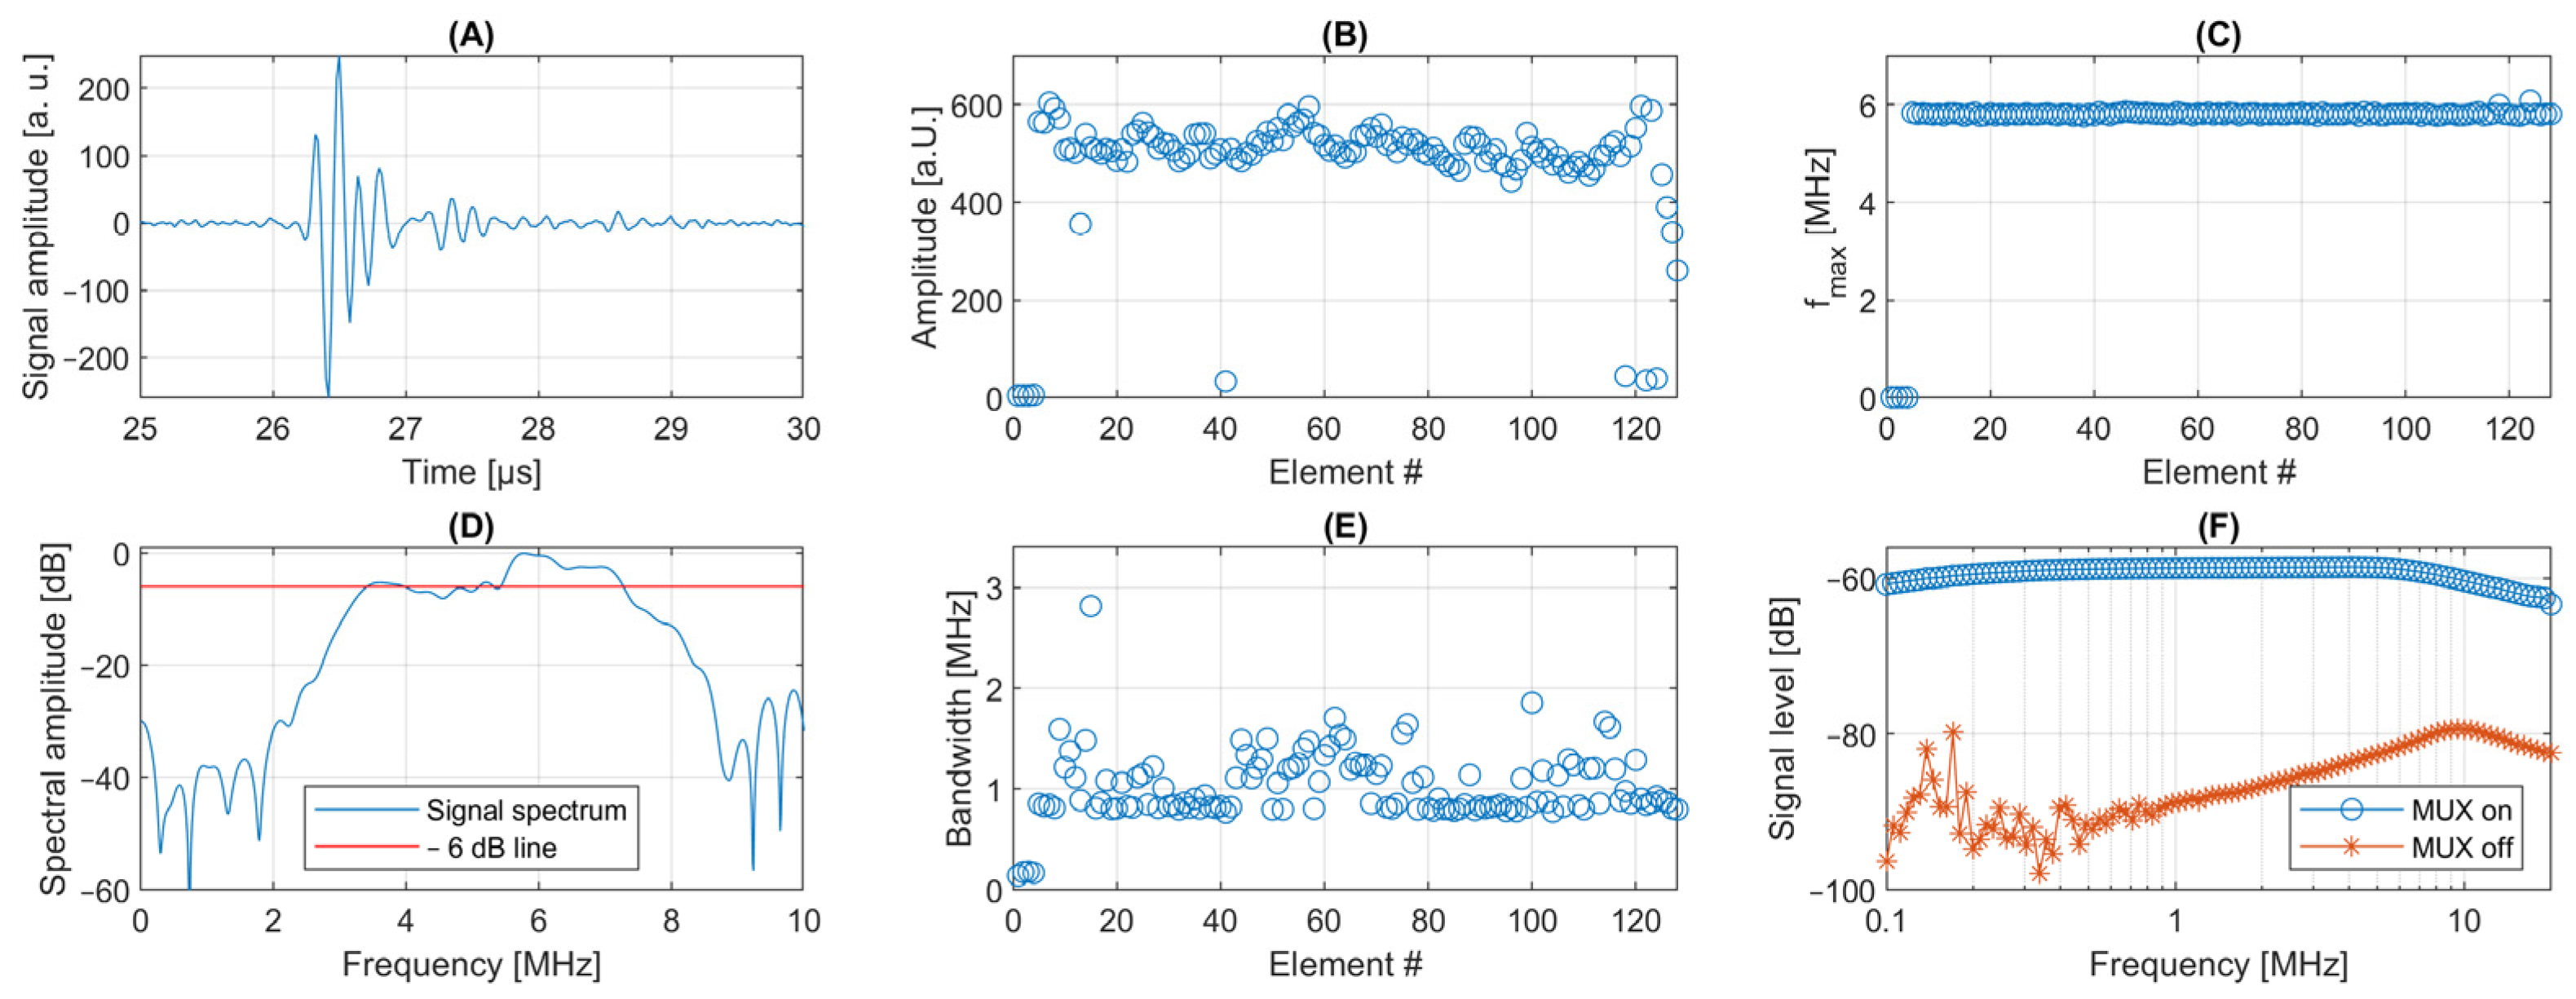
3.1. System Characterization

3.1.1. Multiplexer Characterization

The functional cells (transmission gates, LNA, serial shift register) were first produced and characterized separately. The transmission gates used in the multiplexer were characterized: An open switch should attenuate the signal by at least 60 dB, while the closed switch should have minimal attenuation. Also, the crosstalk between adjacent channels should be better than 60 dB. Due to the capacitive coupling of cables in the measurement system, the actual attenuation and crosstalk could not be measured, but it could be shown that the target of 60 dB could be met. When measuring the LNA, the gain-bandwidth product was the critical parameter to qualify the different circuits, partly using CMOS or bipolar transistors and different phase compensation for stability. The combination of MUX and LNA was characterized using a test PCB with CW signals of different frequencies (from a waveform generator) fed into the ASIC. The characterization of the response is shown in Figure 5F, with an attenuation larger than 60 dB for frequencies below 4 MHz and between 50 and 60 dB for the relevant spectral range between 4 and 10 MHz. On the other hand, with open MUX and active LNA, the gain is between 0 and 4 dB for frequencies between 200 kHz and 9 MHz (−0.1 dB attenuation for a frequency of 10 MHz). The power consumption of the ASIC-MUX was measured as 17 mW (current of 5 mA at the driving voltage of 3.3 V), which is negligible in comparison to the overall power consumption of the system. The switching speed of the MUX is defined by the half-period of the system clock of 50 MHz, which means it can theoretically switch within 10 ns, which is much faster than needed for the application. In the chosen beamforming scheme, a switching of MUX settings is performed between consecutive transmission events such that the requirements for switching speed are defined by the system PRF and the acoustic time of flight (e.g., 65 µs for 5 cm image depth).

3.1.2. Transducer Characterization

Pulse echo signals from a steel reflector were acquired for the characterization of the transducer in terms of homogeneity and spectral response. Figure 5A,D shows a typical impulse response in the time and frequency domain. The minor drop below the red −6 dB line in Figure 5D is responsible for the seemingly small bandwidth (Figure 5E). Figure 5B shows that eight elements seem not to be active; however, it remains unclear if this is due to the acoustic block of corresponding channels in the ASIC. The frequency of maximum amplitude is 5.8 MHz and is highly homogeneous over the aperture (Figure 5C).

3.1.3. Data Transfer

Data rates were characterized in the following setting: the sampling rate was set to 25 MSPS (a maximum of 50 MSPS is possible), an image depth of 5 cm and a single plane wave was used in transmission. In this configuration, 40 data sets of 32 signals could be transferred per second via the Wi-Fi interface, resulting in a 10 Hz image rate (4 transmit events corresponding to the 4 MUX settings are required for a full image). This resulted in a data transmission rate of approximately 15 Mbit/s, which depends on the hardware on the receiving side. When using the USB interface, data were transmitted with up to 1.8 Gbit/s.

3.1.4. System Imaging Performance—Phantom Study

The system’s image quality was assessed on the above-mentioned commercial multipurpose tissue phantom and on an in-house wire phantom. The tissue-mimicking phantom has an acoustic attenuation in the range of human tissue of approximately 0.5 dB/(MHz cm) and includes scatterers for reproducing typical speckle patterns and echo-free voids approximating the acoustic behavior of vessels. While the wire phantom was used for quantitative assessment by analyzing relevant image metrics such as the FWHM and the SLL (side lobe level), the commercial tissue-mimicking phantom was used for qualitative comparison of the images and for quantitative assessment of the contrast. Figure 6A,B show the results when using the same acoustic block of 256 elements but driven by a 256-channel electronics system instead of using the MUX setup. In Figure 6A, the CIRS phantom is imaged in conventional PWC mode (with 21 angles), which represents the ideal configuration and, consequently, the best image quality. In Figure 6B, the ASICS use case is mimicked by using only 128 elements in transmit, where four adjacent uneven-numbered elements (e.g., elements 1, 3, 5, and 7) are excited with the same transmit delay, such as in the case of the MUX-based array. Finally, in Figure 6C, the array with integrated MUX, such as shown in Figure 5, is used. Here, 128 elements are used in transmit, such as in B, but the MUX is integrated into the receive path, and four acquisition steps are necessary to get data from all elements (with 20 plane waves in each step). The experiment relating to case C has been performed without averaging and with 8 times averaging. Only the averaged data, representing the best possible image quality with the MUX-based array, is shown as reconstructed B-mode. However, image metrics relating to the contrast are given in Figure 6D for all cases (with/without averaging). For assessment of the contrast, the contrast-to-noise ratio (CNR), which is typically used to quantify lesion detectability, and the contrast ratio (CR) were calculated as described in [33]. For this purpose, the mean value and standard deviation of the envelope-filtered data inside the lesion (red circle in Figure 6C) and in the speckle background (yellow circle in Figure 6C) were taken. The data shows that echo-free lesions in the phantom can be imaged with a CNR of 4 dB up to a depth of 45 mm with the MUX-based array. In terms of the CR, we see a larger difference between the MUX-based and the fully populated array, especially for the most shallow lesion, which might be due to near-field effects resulting from addressing the MUX-based array in groups of 4 transmit elements with identical delays. When it comes to the wire phantom, the data shows that the reflectors can be seen with excellent contrast over the full image depth of 12 cm. The image seems darker in cases B and C for depths larger than 10 cm, which results from the lower transmit pressure (since only half of the elements are transmitting when compared to A). Finally, all echo-free voids can be identified in all configurations. When it comes to the quantitative image metrics, the lateral resolution decreases from 600 µm to approximately 1000 µm in all three cases, with limited influence on the number of angles in PWC. The SLL ranging between −30 and −45 dB is very similar in all array configurations, with the number of angles having a larger impact than the array type.

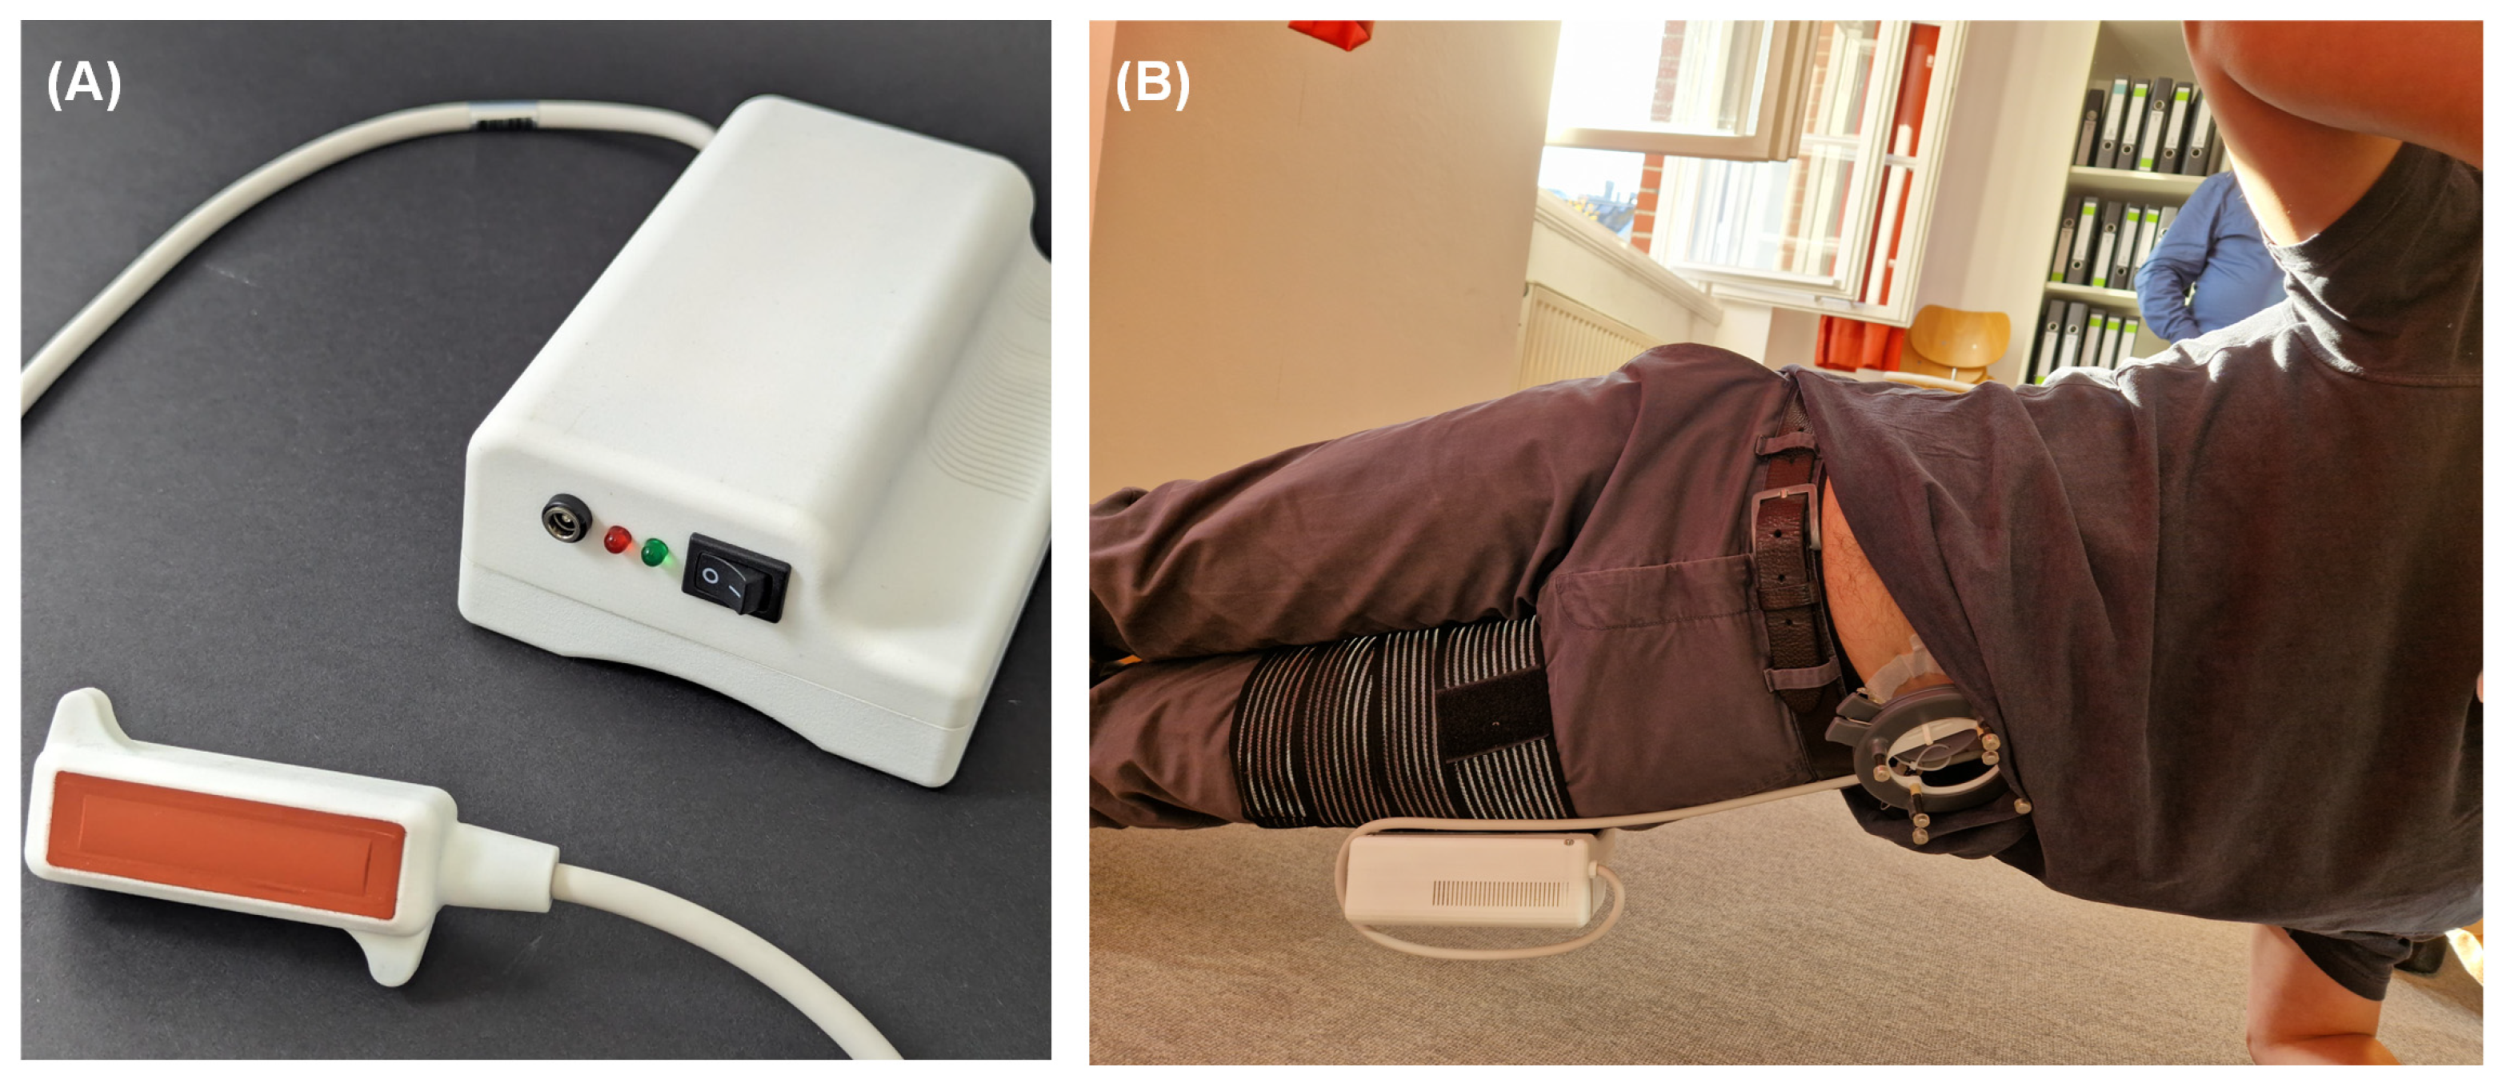
3.2. In-Vivo Testing

In the first step, the quality and stability of acoustic coupling during exercise were assessed on one healthy proband. For this purpose, the wearable probe was applied to the abdomen of the proband using the customized holder (Figure 7A). Acoustic coupling was realized by using clinical sonography gel. Since there is no established metric for quantification of acoustic coupling, we monitored the maximum of each image line over time and the median of all image lines over time (Figure 7B) for two proband positions (standing such as in Figure 7A and laying). In both positions, no significant decrease in acoustic coupling could be observed during SSE. Second, to test the system’s ability to quantify the thickness change of TrA during exercise, probands were asked to perform a typical SSE. Again, the transducer was attached to the abdomen with the custom-designed holder (Figure 7A) so that data could be acquired during SSE without the need to hold the probe. The exercise is split into 3 phases: in the initial phase, the proband is breathing normally for 10 s. Then, the TrA is contracted for 10 s, followed by normal breathing for another 10 s. It has to be mentioned that static images, such as Figure 7C, could be acquired with the Wi-Fi data link, while the USB link was used for the ideal assessment of dynamic changes, such as in Figure 7F (see Discussion). The reconstructed B-mode images were analyzed according to the method presented in Section 2.5. For the analysis of the TrA deformation, representative measurement points marked in red in Figure 7E were selected, and the muscle layer thickness in this given position was followed over time. For instance, in the example given in Figure 7F, the TrA thickness has a constant value of approximately 4 mm for three breathing cycles before the beginning of muscle contraction. Then, during contraction, the TrA thickness (average value over several breathing cycles) increases by approximately 30–40% before it returns to the initial value.

4. Discussion

Our wearable ultrasound platform consists of a MUX-based linear array probe specifically designed for monitoring muscle motion in the context of training combined with a flexible multichannel research system. Until recently, this wireless version of our previous platform, MOUSE, was the only system combining native multichannel capabilities in transmit and receive with full access throughout the entire data pipeline and a wireless data link. It has only recently been outperformed by the new state-of-the-art wearable ultrasound TinyProbe [19], which comes in a significantly reduced size and weight while still providing 32 TX/RX and a wireless data link. Our system is derived from a wired system with a focus on maximum flexibility for research applications (adjustable transmit voltage, arbitrary delay profiles, 12 Bit analog-to-digital conversion (ADC) with 50 MSamples/s (MSPS), adjustable number of samples per receive channel), TinyProbe comes with more integrated components with optimal performance-per-mW, resulting in an unprecedented compactness and wearability.
The combination of our 32 ch electronics with our new MUX-based linear array transducer showed an imaging performance very similar to that of a 256 ch system and a fully populated array in terms of resolution and SLL but with a decrease in contrast, most likely due to the lower number of transmit elements. A penetration depth of 11 cm was achieved with our 5.8 MHz linear probe, and lesions could be visualized up to 7 cm. In the in-vivo setting for which the system was designed, we could demonstrate stable and reliable acoustic coupling during segmental stabilization exercise by means of a customized probe holder, eliminating the need for the transducer to operate in a handheld manner. The goal of in-vivo imaging was a proof-of-concept of our probe’s capability for wearable use and monitoring of deep abdominal muscles during exercise. The validation of the system’s effectiveness as a biofeedback instrument on a larger target population was beyond the scope of the work and will be the object of a follow-up study. Nevertheless, we could demonstrate suitable image quality for identification and tracking of the muscle structures of interest in a realistic setting. The implementation of a muscle tracking algorithm, which was performed offline on image data reconstructed with a plane wave compounding scheme adapted to the specific transmit/receive setting, allowed measuring the thickness of the muscle structures of interest (Figure 7). At the same time, the in-vivo experiments showed the main limitation of the system, which is the Wi-Fi data link, which consists of a bottleneck. As reported, 40 frame/s of pre-beamformed channel data could be transmitted, which, however, results in 10 frames/s for a full aperture, given the need for switching between the four MUX positions. Although this seems acceptable for applications with low temporal dynamics, it has to be mentioned that multiple transmit angles are necessary for ideal image quality, resulting in a further decrease in frame rate. In applications in which tissue displacements occur in the time frame needed for a compound image (e.g., cardiac imaging), this would result in motion artifacts highlighting the need for faster data transfer. However, since SSE can be considered a static exercise, such motion artifacts did not play a role in the present work. The limited transfer bandwidth of the wireless data link implemented so far nevertheless induced a tradeoff between image rate and image quality, such that the USB link had to be used for ideal temporal sampling of the TrA thickness change in Figure 7.
While the image resolution is only mildly affected by the number of transmit angles (Figure 5E), the SLL is improved by 10 dB when using 10 or more transmit angles. However, when it comes to these metrics, our system performed very similarly to the same array driven by a 256 ch system (where all elements are addressed individually without the need for multiplexing). Contrast metrics such as the CR and the CNR showed a larger difference between the MUX-based and the fully populated version in the order of 10 and 5 dB (for CR and CNR, respectively). The largest difference in CR is seen in the most shallow lesion, which we assume is due to the fact that elements are addressed with identical transmit delays in groups of four, potentially resulting in a non-homogeneous near-field wave-front. On the other hand, the contrast drops for the deepest lesion, which, to our understanding, is due to the lower transmit pressure when compared with the fully populated array.
Our work focused on a proof of concept of using a large element count array based on a MUX scheme together with a portable electronics system as biofeedback in SSE. Although we could show that motion and deformation of deep abdominal muscles could be monitored with our setup, our work is just a first step in view of more widespread clinical or even consumer use. To achieve these goals, different challenges must be tackled. As already mentioned, the current implementation of the wireless data link represents a bottleneck, which, however, can be overcome in three ways. First, the system is currently used with WLAN in access point mode with a measured rate of 15 Mbit/s. To optimize the transmission speed, the Ad-Hoc mode could be implemented, which would result in 21 Mbit/s. Second, by adding a mini PCIe interface for the Wi-Fi link, the data rate could easily be increased by a factor of 10 or more, and thus significantly improve the temporal resolution at the highest image quality. Finally, the system FPGA is prepared for onboard beamforming and gray-scale conversion. Currently, one image (in 11 angles PWC mode, 5 cm depth, 25 MSPS) requires 11 × 4 × 32 × 1666 = 2.3 × 10⁶ samples of 12-bit. In contrast, a reconstructed and gray-scaled data set would be 512 × 512 samples of 8-bit, thus dividing the amount of data by 13. Onboard implementation of feature extraction, such as in the proposed application, could further reduce the amount of data to be transferred and thereby open the door to even higher temporal resolution. Next, fully automated analysis and segmentation of ultrasound data are needed so that metrics relating to the training success, which are easily understood by non-experts (in contrast to B-mode images whose understanding requires intense training), are made available. Finally, widespread use anticipates that the system fulfills regulatory requirements such as standards defined by the MDR (medical device directive). This can be considered a minor hurdle since the system has been designed according to (and partially testing for compliance with) specific aspects of IEC 60601-1 (electrical safety). Furthermore, the implemented B-mode scheme based on plane waves leads to very low-pressure levels, such that the device output is in compliance with the thresholds defined by IEC 60601-2-37 (acoustic safety).

5. Summary

We designed and developed a wearable ultrasound probe with 256 elements based on an integrated custom-made 1:4 multiplexing ASIC. The probe was designed to image deep abdominal muscles so that it can be used as biofeedback during exercise. The challenge of integrating a large footprint fully populated B-mode array in a wearable form factor was tackled by combining the 1:4 ASIC-MUX with portable 32-ch electronics and an adapted beamforming scheme. The MUX-based system was characterized on phantoms and showed an imaging performance comparable to a fully populated array. In a first proband experiment, data from deep abdominal muscles (TrA) could be acquired with the worn probe in different postures and during exercise with reliable acoustic contact. Using a semi-automated segmentation algorithm, the thickness variation of the TrA, which is an established metric for the effectiveness of deep abdominal muscle training, could be retrieved from the ultrasound data. Thereby, we demonstrated the potential of our system and approach as ultrasound-based biofeedback in physiotherapy. Future work will aim to overcome the current limitations in terms of wireless data transfer (by onboard processing and data reduction prior to transfer and more performant transfer protocols) and validate the approach with a larger target population.

Author Contributions

Conceptualization, H.H., T.G., D.S., S.R., S.K. and M.F.; methodology, H.H., S.H.T., S.K. and M.F.; software, H.H., S.R., S.W. and H.S.; validation, L.P., O.S. and M.F.; formal analysis, M.F.; investigation, H.H. and M.F.; resources, M.F. and S.H.T.; data curation, L.P., O.S. and M.F.; writing—original draft preparation, H.S., L.P., S.K. and M.F.; writing—review and editing, H.S., L.P., S.K. and M.F.; visualization, H.S., S.K. and M.F.; supervision, O.S., H.H. and M.F.; project administration, M.F. and O.S.; funding acquisition, M.F. All authors have read and agreed to the published version of the manuscript.

Funding

This research was funded by the German Federal Ministry for Education and Research BMBF, grant number 01EC1906, project name ULTRAWEAR.

Institutional Review Board Statement

Not applicable.

Informed Consent Statement

Not applicable.

Data Availability Statement

The raw data supporting the conclusions of this article will be made available by the authors upon request.

Acknowledgments

The authors thank Klementina Nagy Kanasz, Daniel Marcato and Chris Steiner from DITABIS GmbH for the design of the probe holder and the electronics housing. We also thank Marc Fournelle Sr. for his careful proofreading of the manuscript and our colleague Wolfgang Bost from Fraunhofer IBMT for his consultation on data analysis.

Conflicts of Interest

Authors Stephan Klesy and Schabo Rumanus were employed by the company Prema Semiconductor GmbH. The remaining authors declare that the research was conducted in the absence of any commercial or financial relationships that could be construed as a potential conflict of interest.

References

  1. Von Der Lippe, E.; Krause, L.; Prost, M.; Wengler, A.; Leddin, J.; Müller, A.; Zeisler, M.-L.; Anton, A.; Rommel, A.; BURDEN 2020 Study Group Prävalenz von Rücken- und Nackenschmerzen in Deutschland. Ergebnisse der Krankheitslast-Studie BURDEN 2020. J. Health Monit. 2021, 6, 2–14. [Google Scholar] [PubMed]
  2. Hayden, J.A.; Ellis, J.; Ogilvie, R.; Malmivaara, A.; van Tulder, M.W. Exercise Therapy for Chronic Low Back Pain. Cochrane Database Syst. Rev. 2021, 9, CD009790. [Google Scholar] [CrossRef] [PubMed]
  3. França, F.R.; Burke, T.N.; Hanada, E.S.; Marques, A.P. Segmental Stabilization and Muscular Strengthening in Chronic Low Back Pain—A Comparative Study. Clinics 2010, 65, 1013–1017. [Google Scholar] [CrossRef]
  4. Shaughnessy, M.; Caulfield, B.A. Pilot Study to Investigate the Effect of Lumbar Stabilisation Exercise Training on Functional Ability and Quality of Life in Patients with Chronic Low Back Pain. Int. J. Rehabil. Res. 2004, 27, 297–301. [Google Scholar] [PubMed]
  5. Richardson, C. Therapeutic Exercise for Spinal Segmental Stabilization. In Lower Back Pain; Churchill Livingstone: Edinburgh, UK, 1998; ISBN 978-0-443-05802-8. [Google Scholar]
  6. Mödinger, M.; Woll, A.; Wagner, I. Video-Based Visual Feedback to Enhance Motor Learning in Physical Education—A Systematic Review. Ger. J. Exerc. Sport Res. 2022, 52, 447–460. [Google Scholar]
  7. Van Hides, J.A.; Richardson, C.A. The use of real-time ultrasound imaging for biofeedback of lumbar multifidus muscle contraction in healthy subjects. J. Orthop. Sports Phys. Ther. 2006, 36, 920–925. [Google Scholar] [CrossRef]
  8. Mannion, A.F.; Pulkovski, N.; Gubler, D.; Gorelick, M.; O’Riordan, D.; Loupas, T.; Schenk, P.; Gerber, H.; Sprott, H. Muscle Thickness Changes during Abdominal Hollowing: An Assessment of between-Day Measurement Error in Controls and Patients with Chronic Low Back Pain. Eur. Spine J. 2008, 17, 494–501. [Google Scholar]
  9. Lee, D.H.; Hong, S.K.; Lee, Y.S.; Kim, C.H.; Hwang, J.M.; Lee, Z.; Kim, J.M.; Park, D. Is abdominal hollowing exercise using real-time ultrasound imaging feedback helpful for selective strengthening of the transversus abdominis muscle?: A prospective, randomized, parallel-group, comparative study. Medicine 2018, 97, e11369. [Google Scholar] [CrossRef]
  10. Shamsi, M.; Sarrafzadeh, J.; Jamshidi, A.; Zarabi, V.; Pourahmadi, M.R. The effect of core stability and general exercise on abdominal muscle thickness in non-specific chronic low back pain using ultrasound imaging. Physiother. Theory Pract. 2016, 32, 277–283. [Google Scholar] [CrossRef]
  11. Zhang, L.; Marcus, C.; Lin, D.; Mejorado, D.; Schoen, S.J., Jr.; Pierce, T.T.; Kumar, V.; Fernandez, S.V.; Hunt, D.; Li, Q.; et al. A conformable phased-array ultrasound patch for bladder volume monitoring. Nat. Electron. 2024, 7, 77–90. [Google Scholar] [CrossRef]
  12. Zhang, Y.; Jin, T.; Deng, Y.; Zhao, Z.; Wang, R.; He, Q.; Luo, J.; Li, J.; Du, K.; Wu, T.; et al. A low-voltage-driven MEMS ultrasonic phased-array transducer for fast 3D volumetric imaging. Microsyst. Nanoeng. 2024, 10, 128. [Google Scholar] [CrossRef] [PubMed]
  13. Elloian, J.; Jadwiszczak, J.; Arslan, V.; Sherman, J.D.; Kessler, D.O.; Shepard, K.L. Flexible ultrasound transceiver array for non-invasive surface-conformable imaging enabled by geometric phase correction. Sci. Rep. 2022, 12, 16184. [Google Scholar] [CrossRef]
  14. Lin, M.; Zhang, Z.; Gao, X.; Bian, Y.; Wu, R.S.; Park, G.; Lou, Z.; Zhang, Z.; Xu, X.; Chen, X.; et al. A fully integrated wearable ultrasound system to monitor deep tissues in moving subjects. Nat. Biotechnol. 2024, 42, 448–457. [Google Scholar] [CrossRef] [PubMed]
  15. Frey, S.; Vostrikov, S.; Benini, L.; Cossettini, A. WULPUS: A Wearable Ultra Low-Power Ultrasound probe for multi-day monitoring of carotid artery and muscle activity. In Proceedings of the IEEE International Ultrasonics Symposium (IUS), Venice, Italy, 1 December 2022; pp. 1–4. [Google Scholar] [CrossRef]
  16. Fournelle, M.; Grün, T.; Speicher, D.; Weber, S.; Yilmaz, M.; Schoeb, D.; Miernik, A.; Reis, G.; Tretbar, S.; Hewener, H. Portable Ultrasound Research System for Use in Automated Bladder Monitoring with Machine-Learning-Based Segmentation. Sensors 2021, 21, 6481. [Google Scholar] [CrossRef]
  17. Yang, X.; Chen, Z.; Hettiarachchi, N.; Yan, J.; Liu, H. A wearable ultrasound system for sensing muscular morphological deformations. IEEE Trans. Syst. Man Cybern. Syst. 2021, 51, 3370–3379. [Google Scholar] [CrossRef]
  18. Xu, X.; Wala, S.A.; Vishwa, A.; Shen, J.; K, D.; Devi, S.; Chandak, A.; Dixit, S.; Granata, E.; Pithadia, S.; et al. A programmable platform for accelerating the development of smart ultrasound transducer probe. IEEE Trans. Ultrason. Ferroelectr. Freq. Control 2021, 68, 1296–1304. [Google Scholar] [CrossRef] [PubMed]
  19. Vostrikov, S.; Tille, J.; Benini, L.; Cossetini, A. TinyProbe: A wearable 32-chanel multi-modal wireless ultrasound probe. IEEE Trans. Ultrason. Ferroelectr. Freq. Control 2024, 72, 64–76. [Google Scholar] [CrossRef]
  20. Li, L.; Zhao, L.; Hassan, R.; Ren, H. Review on Wearable System for Positioning Ultrasound Scanner. Machines 2023, 11, 325. [Google Scholar] [CrossRef]
  21. Liu, J.Y.; Xu, J.; Forsberg, F.; Liu, J.-B. CMUT/CMOS-based Butterfly iQ—A portable sonoscope. Adv. Ultrasound Diagn. Ther. 2019, 3, 115–118. [Google Scholar]
  22. Salvi, M.; Caresio, C.; Meiburger, K.M.; De Santi, B.; Molinari, F.; Minetto, M.A. Transverse Muscle Ultrasound Analysis (TRAMA): Robust and Accurate Segmentation of Muscle Cross-Sectional Area. Ultrasound Med. Biol. 2019, 45, 672–683. [Google Scholar] [CrossRef]
  23. Ardhianto, P.; Tsai, J.-Y.; Lin, C.-Y.; Liau, B.-Y.; Jan, Y.-K.; Akbari, V.B.H.; Lung, C.-W. A Review of the Challenges in Deep Learning for Skeletal and Smooth Muscle Ultrasound Images. Appl. Sci. 2021, 11, 4021. [Google Scholar] [CrossRef]
  24. Marzola, F.; van Alfen, N.; Doorduin, J.; Meiburger, K.M. Deep learning segmentation of transverse musculoskeletal ultrasound images for neuromuscular disease assessment. Comput. Biol. Med. 2021, 135, 104623. [Google Scholar] [CrossRef] [PubMed]
  25. Strohm, H.; Rothluebbers, S.; Perotti, L.; Stamm, O.; Fournelle, M.; Jenne, J.; Guenther, M. Contraction assessment of abdominal muscles using automated segmentation designed for wearable ultrasound applications. Int. J. CARS 2024, 19, 1607–1614. [Google Scholar] [CrossRef]
  26. Perotti, L.; Stamm, O.; Strohm, H.; Jenne, J.; Fournelle, M.; Lahmann, N.; Müller-Werdan, U. Learning Transversus Abdominis Activation in Older Adults with Chronic Low Back Pain Using an Ultrasound-Based Wearable: A Randomized Controlled Pilot Study. J. Funct. Morphol. Kinesiol. 2025, 10, 14. [Google Scholar] [CrossRef] [PubMed]
  27. Montaldo, G.; Tanter, M.; Bercoff, J.; Benech, N.; Fink, M. Coherent plane-wave compounding for very high frame rate ultrasonography and transient elastography. IEEE Trans. Ultrason. Ferroelectr. Freq. Control 2009, 56, 489–506. [Google Scholar] [CrossRef] [PubMed]
  28. Hollman, K.W.; Rigby, K.W.; O’Donnell, M. Coherence factor of speckle from a multi-row probe. In Proceedings of the IEEE Ultrasonics Symposium. Proceedings. International Symposium (Cat. No.99CH37027), Tahoe, NV, USA, 17–20 October 1999; pp. 1257–1260. [Google Scholar] [CrossRef]
  29. Fournelle, M.; Bost, W. Wave front analysis for enhanced time-domain beamforming of point-like targets in optoacoustic imaging using a linear array. Photoacoustics 2019, 14, 67–76. [Google Scholar] [CrossRef]
  30. Forney, G.D. The Viterbi Algorithm. Proc. IEEE 1973, 61, 268–278. [Google Scholar] [CrossRef]
  31. Bouguet, J.-Y. Pyramidal Implementation of the Lucas Kanade Feature Tracker Description of the Algorithm; Technical Report; Microprocessor Research Labs, Intel Corporation: Santa Clara, CA, USA, 1999. [Google Scholar]
  32. Bradski, G. OpenCV Library. Dr. Dobb’s J. Softw. Tools 2000, 120, 122–125. [Google Scholar]
  33. Liebgott, H.; Rodriguez-Molares, A.; Cervenansky, F.; Jensen, J.A.; Bernard, O. Plane-wave imaging challenge in medical ultrasound. In Proceedings of the IEEE Ultrasonics Symposium (IUS), Tours, France, 18–21 September 2016; pp. 1–4. [Google Scholar] [CrossRef]
Figure 1. Comparison of PWC image of CIRS phantom acquired with different transmit schemes to mimic a system with a LV MUX in the RX path. (A) A full 128-element 5 MHz linear array is used for both TX and RX. (B) even-numbered elements transmitting and odd-numbered ones receiving. (C) is the same as (B) but with an additional 10 dB gain to mimic the effect of an additional LNA integrated into a MUX ASIC.
Applsci 15 03600 g001
Figure 2. The system diagram shows one MUX chip (A) and a full system consisting of the 256-element probe (with separate transmit and receive elements) and the 32-ch backend electronics (B).
Applsci 15 03600 g002
Figure 3. Acoustic block with 256-element array combined with flex PCB and 4 MUX ICs prior to integration (A), during integration into the housing with protective silicon layer (B) and after final integration (C).
Applsci 15 03600 g003
Figure 4. Integrated 32 ch TX/RX electronics with battery and power management in custom 3D printed housing (A) when using during SSE training (B). The probe is attached to the skin by a custom-designed holder, allowing reliable acoustic contact even during exercise (the holder was designed and manufactured by DITABIS GmbH, Pforzheim, Germany).
Applsci 15 03600 g004
Figure 5. Transducer and multiplexer characterization. (A,D): an echo from a steel reflector in the time and frequency domain acquired with a typical element after excitation of all 128 transmit elements. (B) amplitude distribution of 128 receive elements. (C,E): distribution of spectral maximum and −6 dB bandwidth of the 128 receive elements. (F) The spectral response of the MUX was characterized using a test PCB (without the array).
Applsci 15 03600 g005
Figure 6. Qualitative comparison of image quality on CIRS phantom when using PWC on fully populated 256-element array together with a 256 ch electronics (A), 256 element array in a mode mimicking the ASIC (even elements transmitting, odd-numbered one receiving) (B) and same phantom imaged with the ASIC-MUX based system described above with 8 times averaging (C). Quantitative assessment of different image metrics with respect to contrast (based on CNR and CR) measured on a multipurpose tissue phantom (D) and to resolution (based on FWHM) and amount of beamforming artifacts (based on side lobe level mode—SLL) on a wire phantom in a water tank (E).
Applsci 15 03600 g006
Figure 7. Investigation of acoustic coupling stability and analysis of change of TrA thickness during SSE. While static images such as C could be obtained with the wireless data link, the USB link was used for ideal temporal sampling of the TrA thickness change in (F). Figure (A) shows the setup with the probe in the custom holder, ensuring reliable acoustic contact. Figure (B) shows the signal amplitude over time as a metric for acoustic coupling in two proband positions. (C) the gives a B-mode image of the abdomen showing the different muscle layers. (D) The flow field image shows the displacement of specific landmarks in the B-mode image during the breathing cycle and SSE. (E) Segmented image with specific points at which the thickness of the muscle layer is followed over time. (F) Analysis of the muscle layer thickness over more than 1000 frames (corresponding to 30 s). The reddish area defines the SSE contraction.
Applsci 15 03600 g007
Disclaimer/Publisher’s Note: The statements, opinions and data contained in all publications are solely those of the individual author(s) and contributor(s) and not of MDPI and/or the editor(s). MDPI and/or the editor(s) disclaim responsibility for any injury to people or property resulting from any ideas, methods, instructions or products referred to in the content.

