1. Introduction
Energy efficiency has gained significant attention in recent years as a means of lowering harmful emissions, enhancing buildings’ performance, and guaranteeing more sustainable building practices. This approach contributes to the creation of greener areas, reduces energy waste, and aids in international environmental protection initiatives.
The number of studies addressing energy-efficient improvements for sustainable buildings has been constantly increasing [
1,
2,
3,
4]. However, many of these studies have faced unresolved challenges and limitations. Energy efficiency in sustainable construction is a rapidly evolving and significant topic that requires deeper exploration to address the existing gaps. Hafez et al. [
5] highlighted the need for more in-depth, data-driven research to fill knowledge gaps and improve the practical application of energy efficiency strategies in sustainable buildings, as well as the need to overcome stakeholder attitudes towards energy-inefficient activities and the practical application of clean technologies. Comfort remains a universal priority, making the study of indoor environmental quality (IEQ) essential. IEQ involves elements like air quality, temperature, noise, and lighting, which significantly enhance quality of life; lower stress; conserve energy; and promote health, productivity, and well-being [
6].
Educational buildings play a crucial role in IEQ due to the large number of occupants that spend long hours in these spaces. Factors such as noise, air quality, lighting, and temperature affect students’ focus, productivity, and overall well-being [
7,
8]. The proper design of these buildings is essential to ensure efficient energy use while maintaining comfort and minimizing environmental impacts. Improving the IEQ in educational buildings can enhance academic performance, reduce stress, and support the health of both students and staff [
9,
10,
11]. These buildings make up a substantial part of the total building inventory and are known for their high energy consumption, especially due to their lighting, cooling, and heating requirements. Given their impact on both energy use and occupant well-being, there has been growing focus in recent years on researching the IEQ and improving the energy performance in these types of buildings [
12,
13]. This change reflects growing concerns about making educational environments more sustainable and energy-efficient. As the impact of energy use and resource consumption in schools becomes more evident, there has been increasing focus on improving the sustainability of these buildings while ensuring that they remain comfortable and effective for learning [
9,
14], but this research has been limited in its applicability to higher education environments and has not fully explored or quantified the impact of indoor sources of pollution compared to that if outdoor sources.
Environmental impacts, including climate change, air, water, and land pollution, are linked to categories like global warming potential and energy demand, with rapid climate change, primarily driven by human activities such as energy consumption and greenhouse gas emissions, necessitating urgent efforts to reduce emissions and increase energy efficiency. Operational carbon, accounting for 37% of global energy-related emissions, arises from the use of energy to cool, heat, ventilate, light, and power buildings. Building design involves key decisions on a structure’s shape, orientation, and height; the material selection; and the dimensions of its components [
15].
Modern school designs are increasingly prioritizing green and healthy learning environments, with communities incorporating more green spaces into the planning and development of educational facilities to promote sustainability and well-being [
16], without establishing a causal relationship between green spaces and academic performance. Maintaining a balance between a building’s energy needs and IEQ is crucial, leading to a significant increase in recent experimental and numerical studies on this subject [
17]; nevertheless, the impact of comfort parameters on energy consumption has not yet been thoroughly explored.
Beyond health concerns, detrimental effects of inadequate environmental conditions on students’ learning and performance have been established. These observations have revealed that IEQ issues are prevalent in schools and significantly impact children’s attendance, particularly due to symptoms associated with sick building syndrome and pollutants present in the indoor environments of these facilities [
3,
14,
18]. For instance, lecture rooms play a vital role as the primary setting of formal education, profoundly affecting students’ learning experiences. To create healthy classroom environments, it is imperative to maintain a high IEQ. Research has consistently shown that IEQ significantly impacts various factors, including the comfort, productivity, effectiveness, health, and overall satisfaction of students and educators. Studies on the environment of educational buildings [
19,
20,
21] have highlighted specific elements of IEQ, such as lighting, indoor air quality (IAQ), acoustics, and thermal comfort, all of which contribute to an optimal learning atmosphere, overlooking the potential for combined effects of these environmental parameters on overall satisfaction and the influence of seasonal variations. Improving all of these environmental factors can not only enhance academic performance but also promote the well-being of individuals within these educational spaces.
When designing buildings, researchers and designers need to consider aspects like thermal, acoustic, and visual comfort, as well as sick building syndrome. Although green building designs encourage sustainability and efficiency, tenant comfort and well-being are not always guaranteed by them. To achieve this, greater focus must be placed on user-centric aspects and energy efficiency, while monitoring building systems and occupants’ experiences during their use to ensure long-term comfort and well-being. Indoor environments often allow pollutants from outside to accumulate [
7]. Beyond external pollutants, indoor environments can also accumulate viruses, and mitigating this risk through measures like enhanced ventilation can significantly influence buildings’ energy consumption and efficiency [
22,
23].
In addition to supporting the global construction industry, buildings that prioritize lowering emissions and water consumption while increasing the energy performance to obtain green building certifications during the material selection and construction stages also have an improved IEQ, providing their occupants with more comfortable and functional spaces.
The diversity of studies regarding IEQ underscores its multifaceted impact on learning environments and occupant well-being. The research spans various disciplines, including architecture, psychology, and environmental science, with each contributing unique insights into how different aspects of IEQ affect occupants. For instance, one study compared natural ventilation with air cleaners and mechanical ventilation with fresh air systems in 33 classrooms across twenty-one schools to examine the IAQ in Beijing’s educational buildings [
18]. They measured indoor carbon dioxide (CO
2), air temperature, humidity, and the efficiency of the mechanical ventilation systems in cleaning the air in real time, but severe ambient PM
2.5 pollution overwhelmed both the natural and mechanical ventilation systems, rendering them unable to improve the indoor air quality, and the instability of indoor temperatures during seasonal transitions, particularly around central heating adjustments, highlighted the shortcomings of both ventilation systems. Other studies have looked to improve the year-round thermal comfort, increase the appropriate CO
2 concentration hours from 34% pre-retrofit to 100% post-retrofit, and decrease the energy demand while improving IEQ [
24,
25]. Research performed by Lee et al. [
26] focused on the connection between IEQ and academic performance in air-conditioned university classrooms, utilizing environmental variables like temperature, humidity, CO
2 levels, and lighting. Their findings indicate that thermal comfort, IAQ, and visual conditions hold equal significance; however, the acoustic environment emerges as the primary factor influencing learning outcomes, with a strong correlation between complaints and declines in performance. Physical factors including temperature, sound pressure levels, and illumination affect thermal, acoustic, and lighting experiences; thus, these factors contribute to overall happiness [
27]. Factors including indoor temperature and individuals’ clothing styles and age can also affect the levels of emissions in indoor air. Educational facilities are distinct because of their occupants, types of activities, and usage patterns [
28,
29]. One experimental study performed in an educational building in Serbia found that the air pollutant concentrations exceeded the safe limits due to faulty boiler operations and poor ventilation [
30], but due to the restricted 10-day data collection period in April, these findings may not have been representative of the year-round air quality, particularly considering seasonal changes in heating and ventilation.
In Romania, studies have explored the relationship between certain IEQ parameters (thermal comfort and IAQ) and energy efficiency in rural schools. The results show that keeping windows closed increases CO
2 and humidity levels during class, with heat build-up in the summer due to high occupancy [
31,
32]. Research carried out by Catalina et al. [
33] in which the IAQ and thermal comfort in schools were analyzed revealed that during winter, the CO
2 levels rose above the recommended levels, while temperatures did not reach 19 °C. Yet another field investigation undertaken by Catalina et al. [
34] in which the CO
2, temperature, noise, and thermal comfort were measured revealed that there were significant fluctuations in CO
2 levels during the day, the average temperature was 23 °C, and the sound levels surpassed the threshold limit.
Contemporary research on educational buildings places strong emphasis on investigating various indoor environmental quality parameters, as evidenced by numerous studies [
35,
36,
37]. However, only a few of these studies have assessed the cumulative impact of all IEQ parameters in conjunction [
6,
38] or the relationship between IEQ parameters and energy efficiency [
13,
38,
39]. Other researchers have focused specifically on energy efficiency and greenhouse gas emissions [
15,
40]. This disparity highlights an important research gap: a comprehensive overview of how IEQ interacts with the energy use and environmental impacts in educational buildings. This underscores the pressing need for innovative approaches that offer a more holistic perspective, enriching our understanding of the intricate connections between energy consumption, IEQ, and environmental outcomes in educational spaces.
In response to these challenges, this study aims to explore and assess long-term measurements of the IEQ parameters, energy use, and associated emissions within an educational building. The goal is to identify how these factors interact over time, which can provide insights into the building’s performance, inform design improvements, enhance occupants’ comfort and health, and reduce the emissions associated with energy use. Integrating strategies that consider all of these factors is not merely an operational necessity; it represents a commitment to sustainable development. As educational institutions strive to balance these elements, they transform into incubators of innovation, fostering research and development on new technologies and methodologies.
This study introduces an innovative approach by overcoming the limitations of the previous research and offering a comprehensive, scalable model for educational institutions. Its year-round analysis—considering seasonal variations, energy consumption, emissions, and their interplay with IEQ parameters—provides a more holistic understanding of sustainable building performance. Beyond academia, these advancements set new industry benchmarks, inspiring the broader adoption of sustainable practices across sectors and contributing to a greener future.
2. Materials and Methods
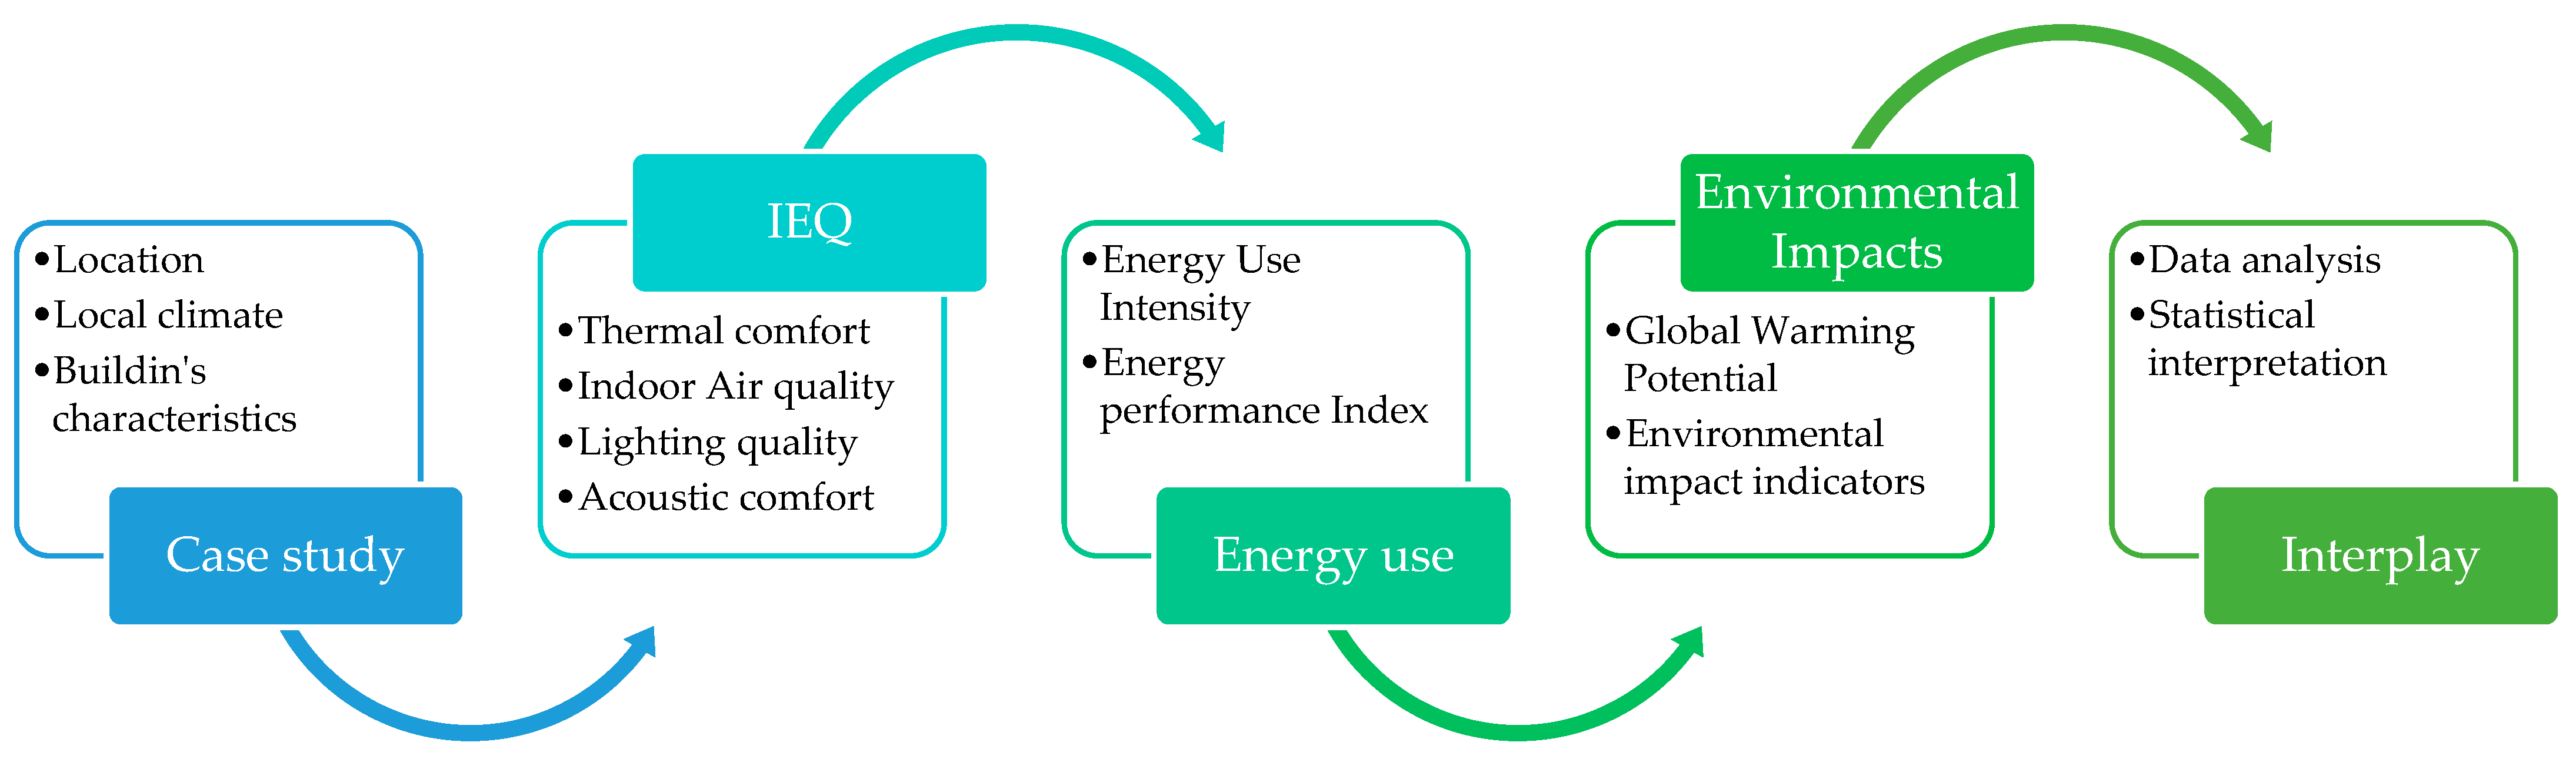
The methods employed to evaluate the educational building environment are detailed, focusing on an intricate balance between IEQ, energy consumption, and overall environmental impacts. This study adopts a multi-faceted approach, integrating quantitative assessments of energy use and indoor environmental factors, such as visual, acoustic, and thermal comfort and air quality. This methodology seeks to provide insights that can inform the operation of educational facilities, ultimately promoting sustainability and enhancing the learning environment. To provide a clear and comprehensive understanding of the research methodology, a detailed flowchart illustrating the experimental and analytical procedures is presented in
Figure 1.
Over the course of an entire year, a comprehensive monitoring program was carried out in a designated educational facility located at the Technical University of Cluj-Napoca situated in the north-western part of Romania, with a specific focus on the Faculty of Building Services Engineering, as illustrated in
Figure 2.
The Köppen–Geiger system [
41] defines the study area’s climate as Dfb, or a hemi-boreal climate, a subtype of a continental climate [
37]. The region’s climate exhibits a clear seasonal contrast, with annual temperatures generally being between −6 °C and 26 °C and extremes ranging from −15 °C to 31 °C. The warm season, from late May to mid-September, features daily highs above 20 °C, with July averaging 25 °C (high) and 14 °C (low). The cold season, from late November to early March, sees daily highs below 5 °C, and January’s average temperatures are particularly low, with a high of 0 °C and a low of −6 °C [
42]. One distinctive aspect of this region is that the city is situated between hills, and during the winter months, fog, which can be extremely persistent, rapidly affects it [
37].
The educational facility, which was originally built in the early 1960s, experienced significant renovations between the years 2005 and 2008 to enhance its functionality and aesthetic appeal. An additional third floor constructed of metal framework was added to the top of the pre-existing two-story structure made of brick and cement. This expansion included the installation of a newly insulated roof, which greatly improved the building’s energy efficiency. The overall area of the building spans 4806.83 square meters (m2), distributed across the four stories. This includes a ground floor that occupies 1476.89 m2, along with a roof area measuring 1368.42 m2. All of the original windows were replaced with models featuring PVC frames and double-glazed glass. Additionally, all of the building services were either replaced or retrofitted, including the heating system and electrical and lighting systems, as well as the plumbing infrastructure, ensuring modern standards of functionality and efficiency throughout the facility. The building’s heating system consists of a gas-fired condensing boiler for space heating and electric boilers for domestic hot water. Heat from the gas boiler is distributed via wall-mounted fan coil units positioned under the windows for optimal heating. These enhancements contribute to a more functional and comfortable learning environment.
2.1. Indoor Environmental Quality
To achieve a thorough understanding of the building’s IEQ, an investigation campaign was performed over the course of an academic year, specifically from October 2023 to September 2024. Data were gathered through a series of targeted measurement sessions. These sessions were conducted in various classrooms within the building, with the measurements taken on multiple days of each month throughout the study period. Throughout this time frame, we measured the indoor temperature (T
a), radiant temperature (T
r), humidity level (H), air velocity (V
a), illumination, sound level, and CO
2 concentrations. To facilitate this comprehensive monitoring process, a universal IAQ instrument, namely the Testo 400 equipped with various probes, and a Testo 815 sound level meter were employed. Both instruments adhered to the standards outlined in [
43]. A summary of these instruments’ technical specifications is provided in
Table 1.
The field measurement activities encompassed an assessment of the IEQ across a variety of classrooms within the educational facility. A comprehensive review of the recommended standards presented in sources [
44,
45] guided the selection of the optimal locations for the measuring devices. The placement of these instruments within the classrooms was meticulously determined to ensure accurate data collection, as illustrated in
Figure 3.
The measuring devices were positioned around the central area of the occupied space at a height of 1.1 m to ensure accurate readings. To reduce any local disturbances, a safety distance of at least 1 m was maintained from all possible sources of interference, which included people, walls, and windows. In accordance with the guidelines established by [
44], the metabolic rate associated with a typical sedentary task was quantified as 1.0 met. An observational method was employed to assess how insulated students were by their clothing. These data enabled the calculation of the PMV, which provided valuable information about thermal comfort in the educational setting. Additionally, for the assessment of the artificial lighting conditions, a measurement grid was established in accordance with point 4.4 from reference [
46] and set at a height of 0.8 m to facilitate precise evaluations.
2.2. Energy Use
Alongside the recordings of the IEQ parameters, a comprehensive energy audit was conducted to quantify and analyze the energy use patterns, enabling the identification of areas for improvement and optimization. Monthly electricity and natural gas consumption data were obtained from the utility companies’ billing statements. Moreover, detailed data recordings capturing the hourly electricity consumption, provided by the Building Energy Management System (BEMS) installed in the educational settlement, were utilized in this assessment. The timeline of energy use data covered an academic year. This process entailed a meticulous examination of the consumption trends over an extended period, allowing for the identification of any significant fluctuations or irregularities in the usage patterns.
The collected data were analyzed to assess total energy consumption and identify peak usage periods. The energy use intensity (EUI) was calculated by normalizing the total energy consumption against the building’s square footage, facilitating comparisons with benchmark values for similar educational facilities. Additionally, an analysis of the energy performance index (EPI) was conducted to evaluate the building’s efficiency relative to the established standards.
2.3. Environmental Impacts
The cloud-based software tool OneClick LCA was employed in the assessment of the environmental impacts associated with the educational building’s operation [
47]. The software is designed for conducting life cycle assessments (LCAs) and calculating the environmental impacts of buildings and construction projects. It provides users with a comprehensive and user-friendly platform for evaluating sustainability across the entire life cycle of a building, from raw material extraction through to construction, operation, and eventually decommissioning.
This research focuses on quantifying the environmental emissions generated during the building’s operational phase, which significantly contribute to its overall life cycle impacts. Data related to operational energy consumption were collected over a comprehensive time frame, namely one academic year.
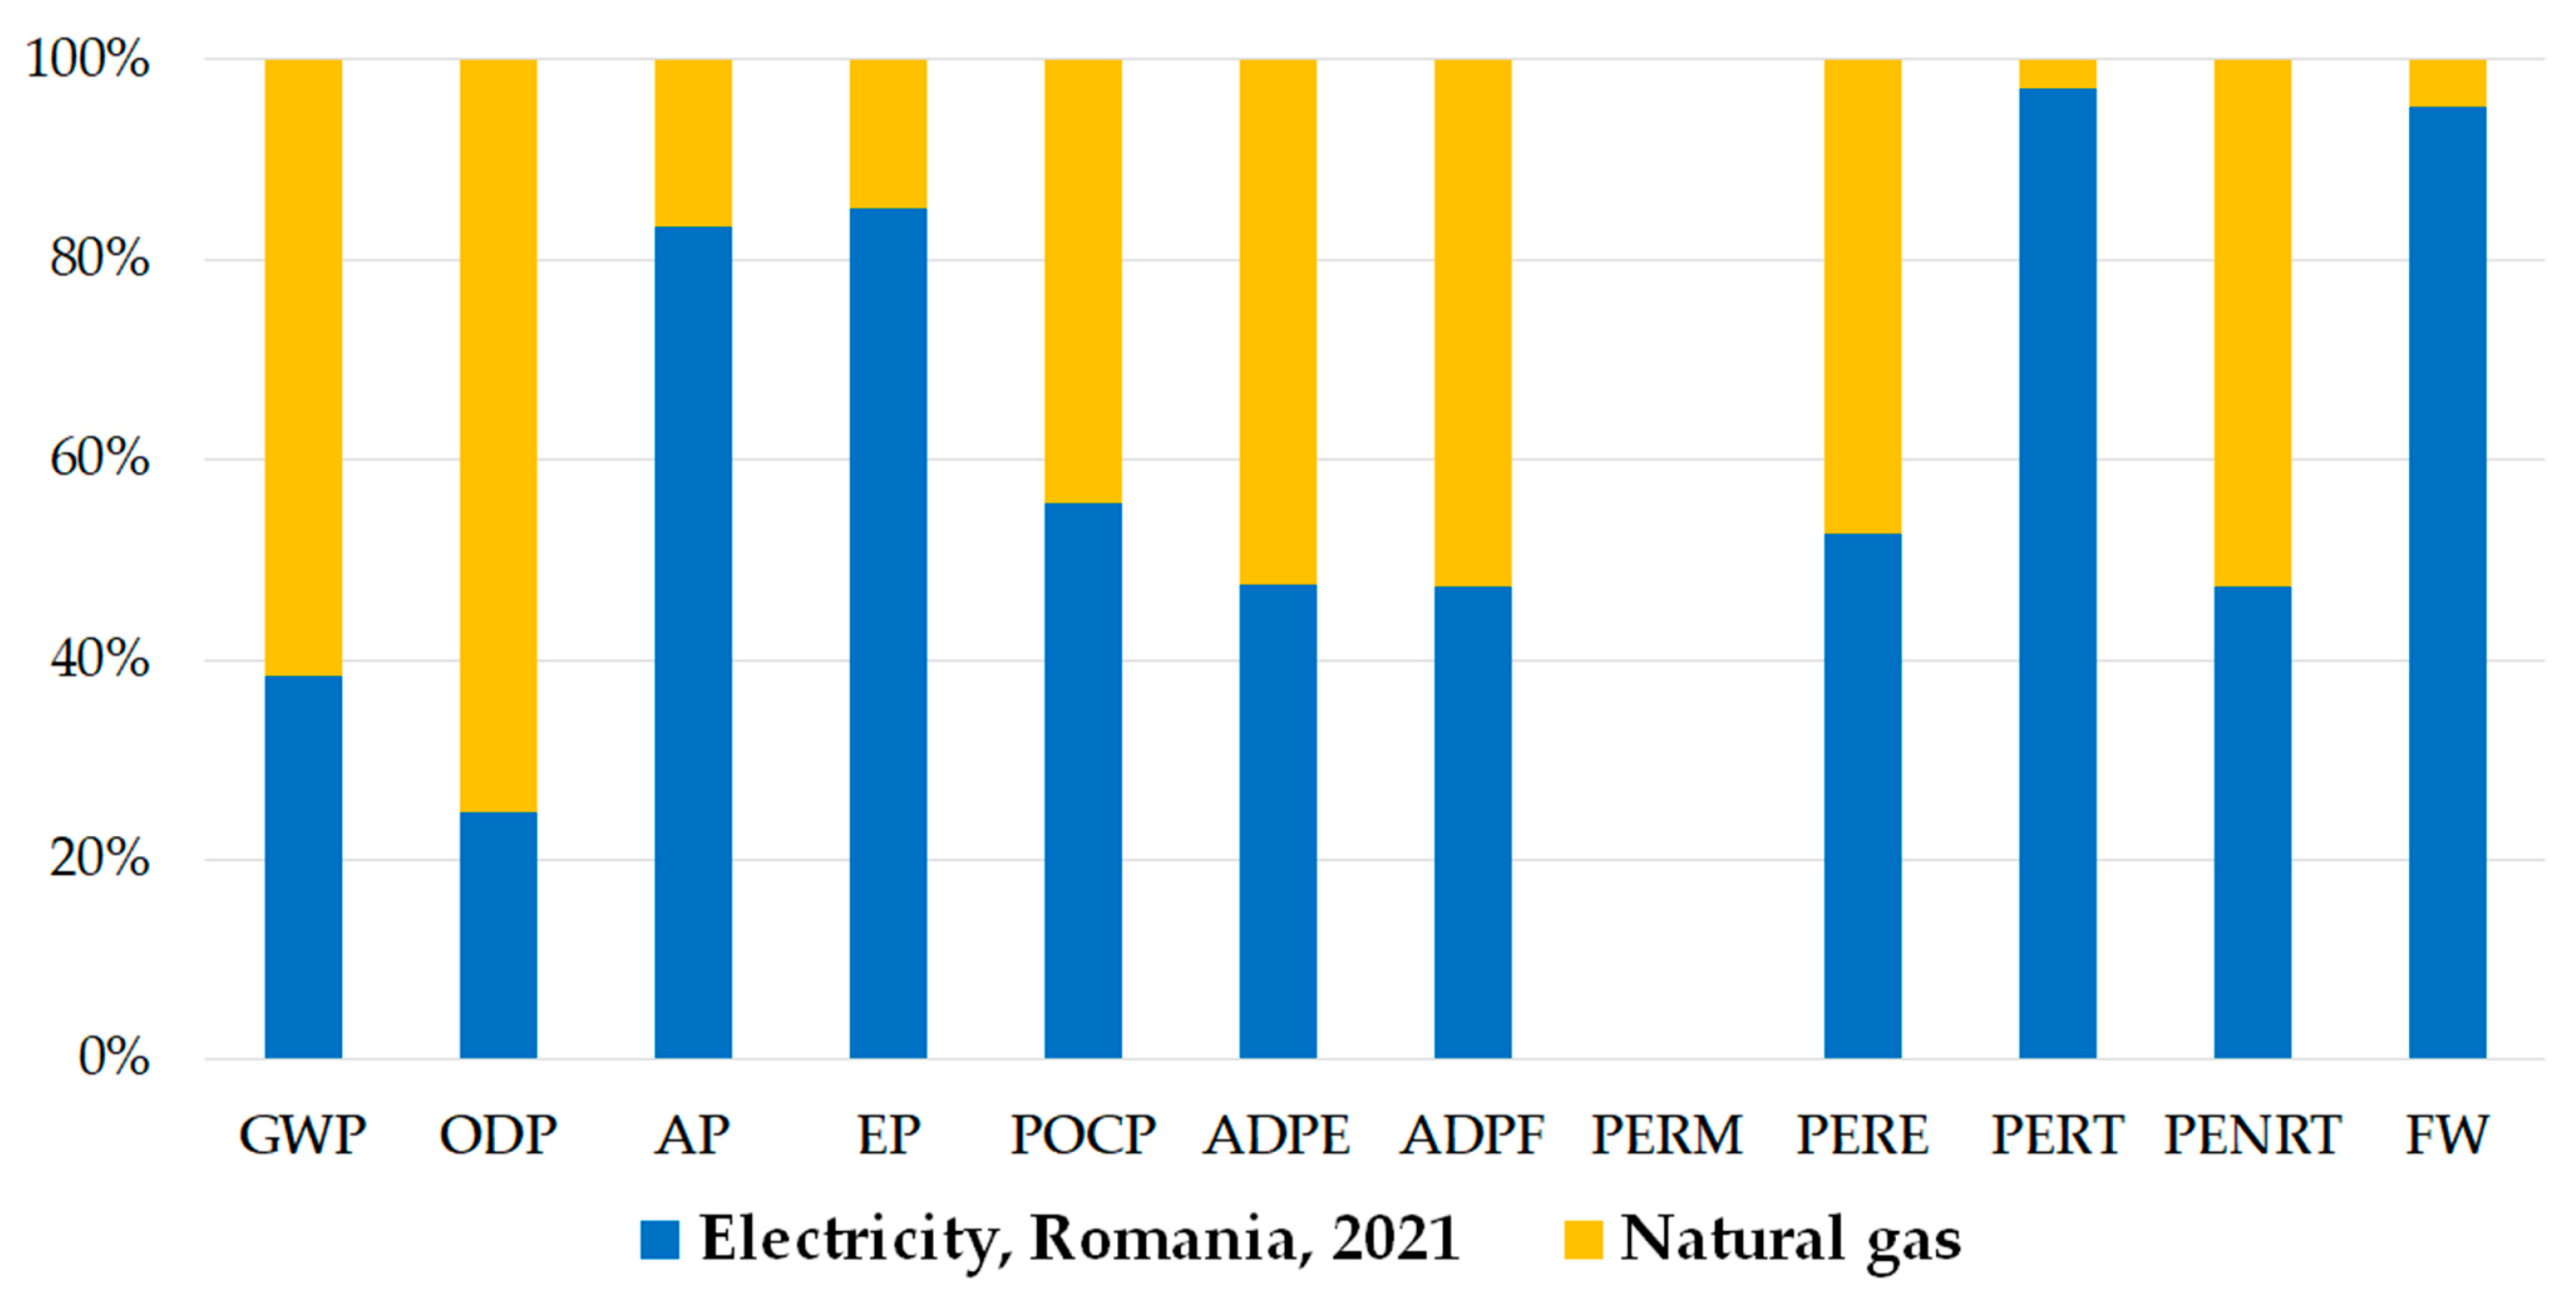
All of the collected data, namely the measured natural gas and electricity consumption, were inputted into OneClick LCA, allowing for a detailed analysis of the global warming potential (GWP), which represents the emissions associated with energy consumption measured in kilograms of CO2 equivalents (kgCO2e). Additionally, the following impact categories were assessed: acidification potential (AP), ozone depletion potential (ODP), eutrophication potential (EP), abiotic depletion potential for fossil resources (ADPF), photochemical creation potential (POCP), abiotic depletion potential for non-fossil resources (ADPE), primary energy resources without raw materials (PERE), renewable primary energy resources as raw materials (PERM), total use of renewable primary energy (PERT), total use of non-renewable primary energy (PENRT), and net fresh water (FW).
2.4. Statistical Analysis
To examine the relationships and patterns within the collected data, a statistical analysis was conducted. Besides assessing the descriptive statistics of the data, the Shapiro–Wilk test was applied to check their normal distribution. To quantify the strength and direction of the relationships between the IEQ parameters, energy consumption, and environmental impacts, a detailed correlation analysis was performed. Pearson’s correlation coefficient was calculated to assess linear relationships between continuous variables. All of the statistical analyses were conducted using OriginPro 2025 SR1 software [
48]. A significance level of 0.05 was adopted for all statistical tests unless otherwise specified.
3. Results
The findings of this research are presented as follows, providing a novel perspective on the interrelationship between the IEQ parameters (thermal comfort, air quality, lighting, and acoustic levels), energy consumption patterns, and environmental impacts.
3.1. Indoor Environmental Quality
Table 2 provides a summary of the descriptive statistics for the measured IEQ parameters, including the PMV values calculated using the data collected by the Testo 400 instrument. To calculate the PMV, four environmental parameters were considered: air temperature, radiant temperature, air velocity, and relative humidity. In addition to other factors, personal factors, including metabolic rate (set at 1.0 met for a seated activity) and clothing insulation, were considered. The clothing insulation values varied depending on the season in which the experimental campaign was conducted: 0.5 clo (in summer), 0.7 clo (in autumn and spring), and 1.0 clo (in winter). All of these data were inputted into the Testo 400 instrument, which then calculated the PMV accordingly.
The values shown in the table represent the averages derived from the complete set of measurements taken during the data collection period.
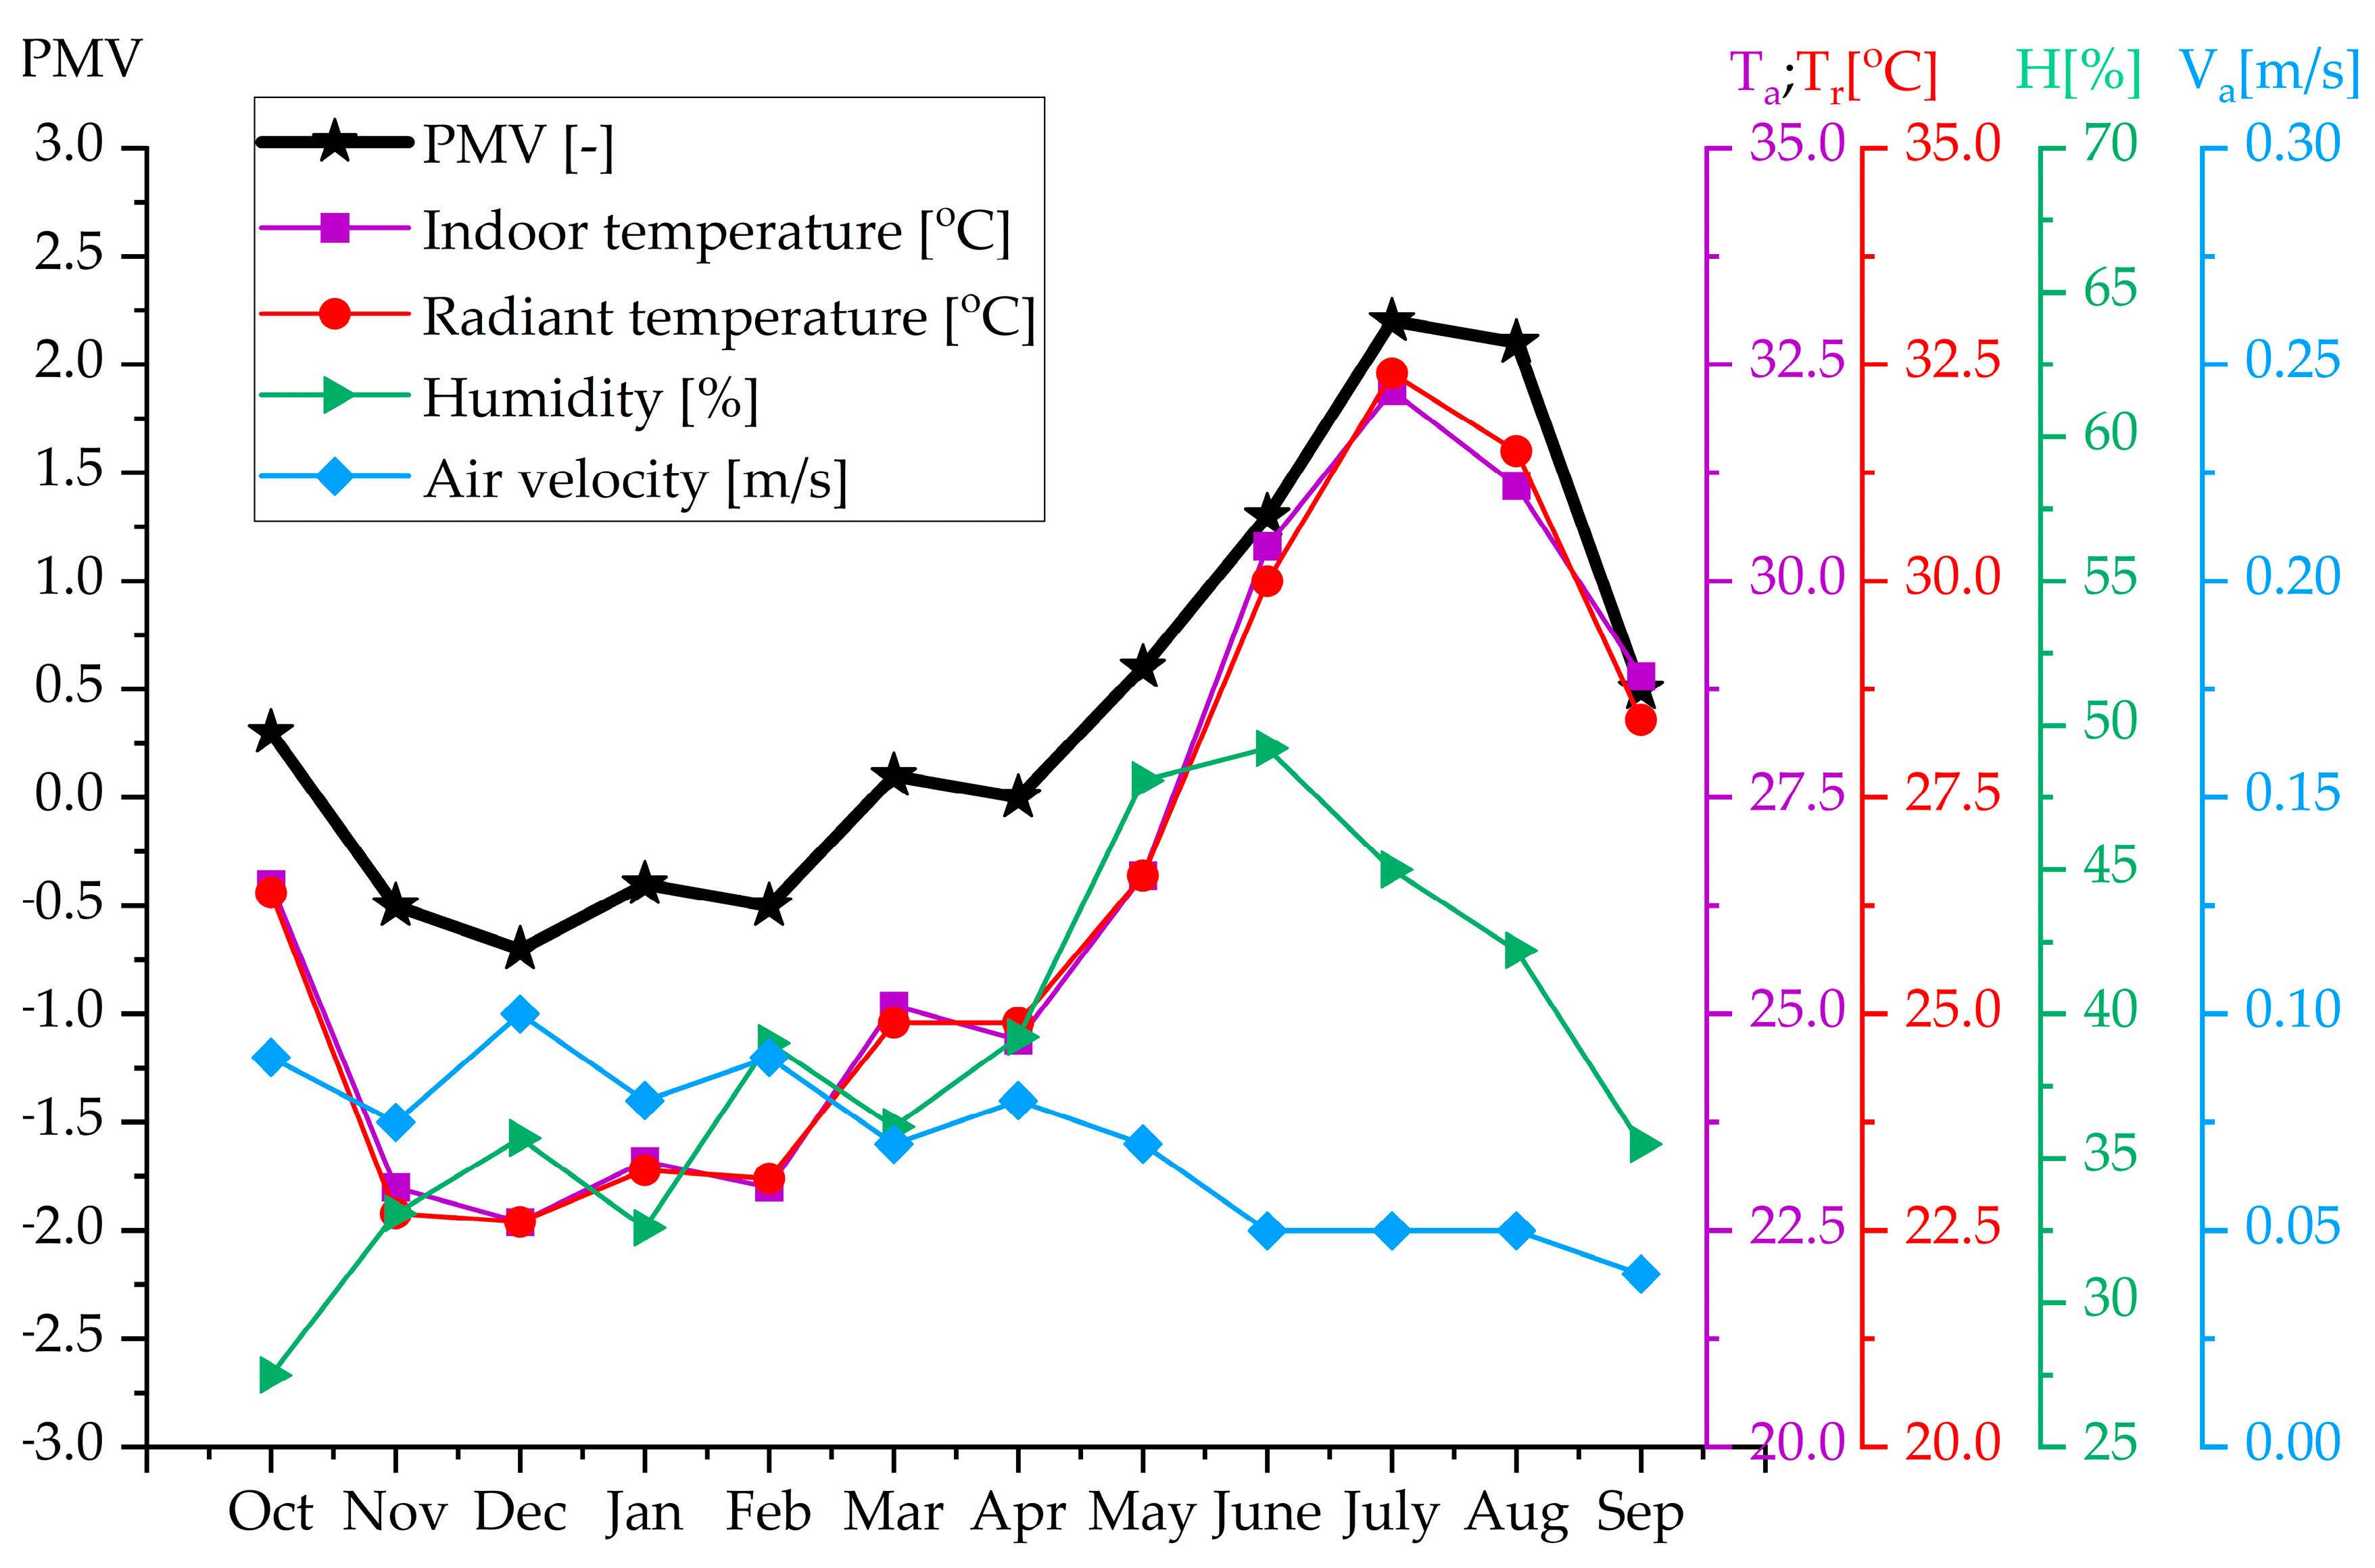
The monthly average values of key indoor thermal comfort variables—including air temperature, radiant temperature, relative humidity, and air velocity—exhibited seasonal variations throughout the academic year. Specifically, the indoor air temperature ranged from a minimum of 22.6 °C during cooler months to a maximum of 33 °C during warmer periods, demonstrating a significant temperature swing. The relative humidity levels fluctuated between 27.5% and 49.2%, indicating variations in the moisture content in the air. Air velocity, a crucial factor in convective heat transfer and perceived comfort, remained relatively low, ranging from 0.04 m/s to 0.1 m/s. The PMV, a widely used index for assessing thermal comfort based on the previous parameters, varied considerably from −0.7 to 2.2 throughout the year. A PMV value of −0.7 suggests a slightly cool environment, while a value of 2.2 indicates a warm environment. This range highlights potential periods of thermal discomfort for the building’s occupants.
The CO2 concentration, the primary indicator of IAQ related to the effectiveness of ventilation, fluctuated significantly between 409 ppm and 1372 ppm. The higher end of this range suggests periods of inadequate ventilation, which could impact occupants’ health and productivity.
The sound levels remained relatively consistent throughout the recorded period, suggesting a stable acoustic environment. However, the lighting levels, another crucial aspect of IEQ, showed variations from 254 lx to 480 lx, which could impact visual comfort and task performance. These fluctuations in lighting levels may be due to factors such as the availability of natural daylight, the use of artificial lighting, and the use of window blinds.
For a more detailed visualization of the monthly variations in these IEQ parameters, graphical representations are provided in
Figure 4 and
Figure 5. These figures offer a clearer picture of the dynamic changes in the indoor environment over the course of the academic year and facilitate a more in-depth analysis of potential challenges in terms of IEQ and opportunities for improvement.
3.2. Energy Use
In order to provide a thorough understanding of the building’s energy consumption, utility billing data for the academic year (October 2023–September 2024) were consolidated, as presented in
Figure 6. The building’s educational activities rely on electricity and natural gas in terms of energy. While natural gas is used only for the heating system, electricity is essential for various functions, including lighting, laboratories, equipment, internet, computers, domestic hot water, and more.
Due to the geographical positioning of the building, high natural gas consumption can be observed during the cold season, and almost zero consumption is seen during the warm season. The natural gas consumption was highest in January when the outside temperature reached its lowest point during the period studied.
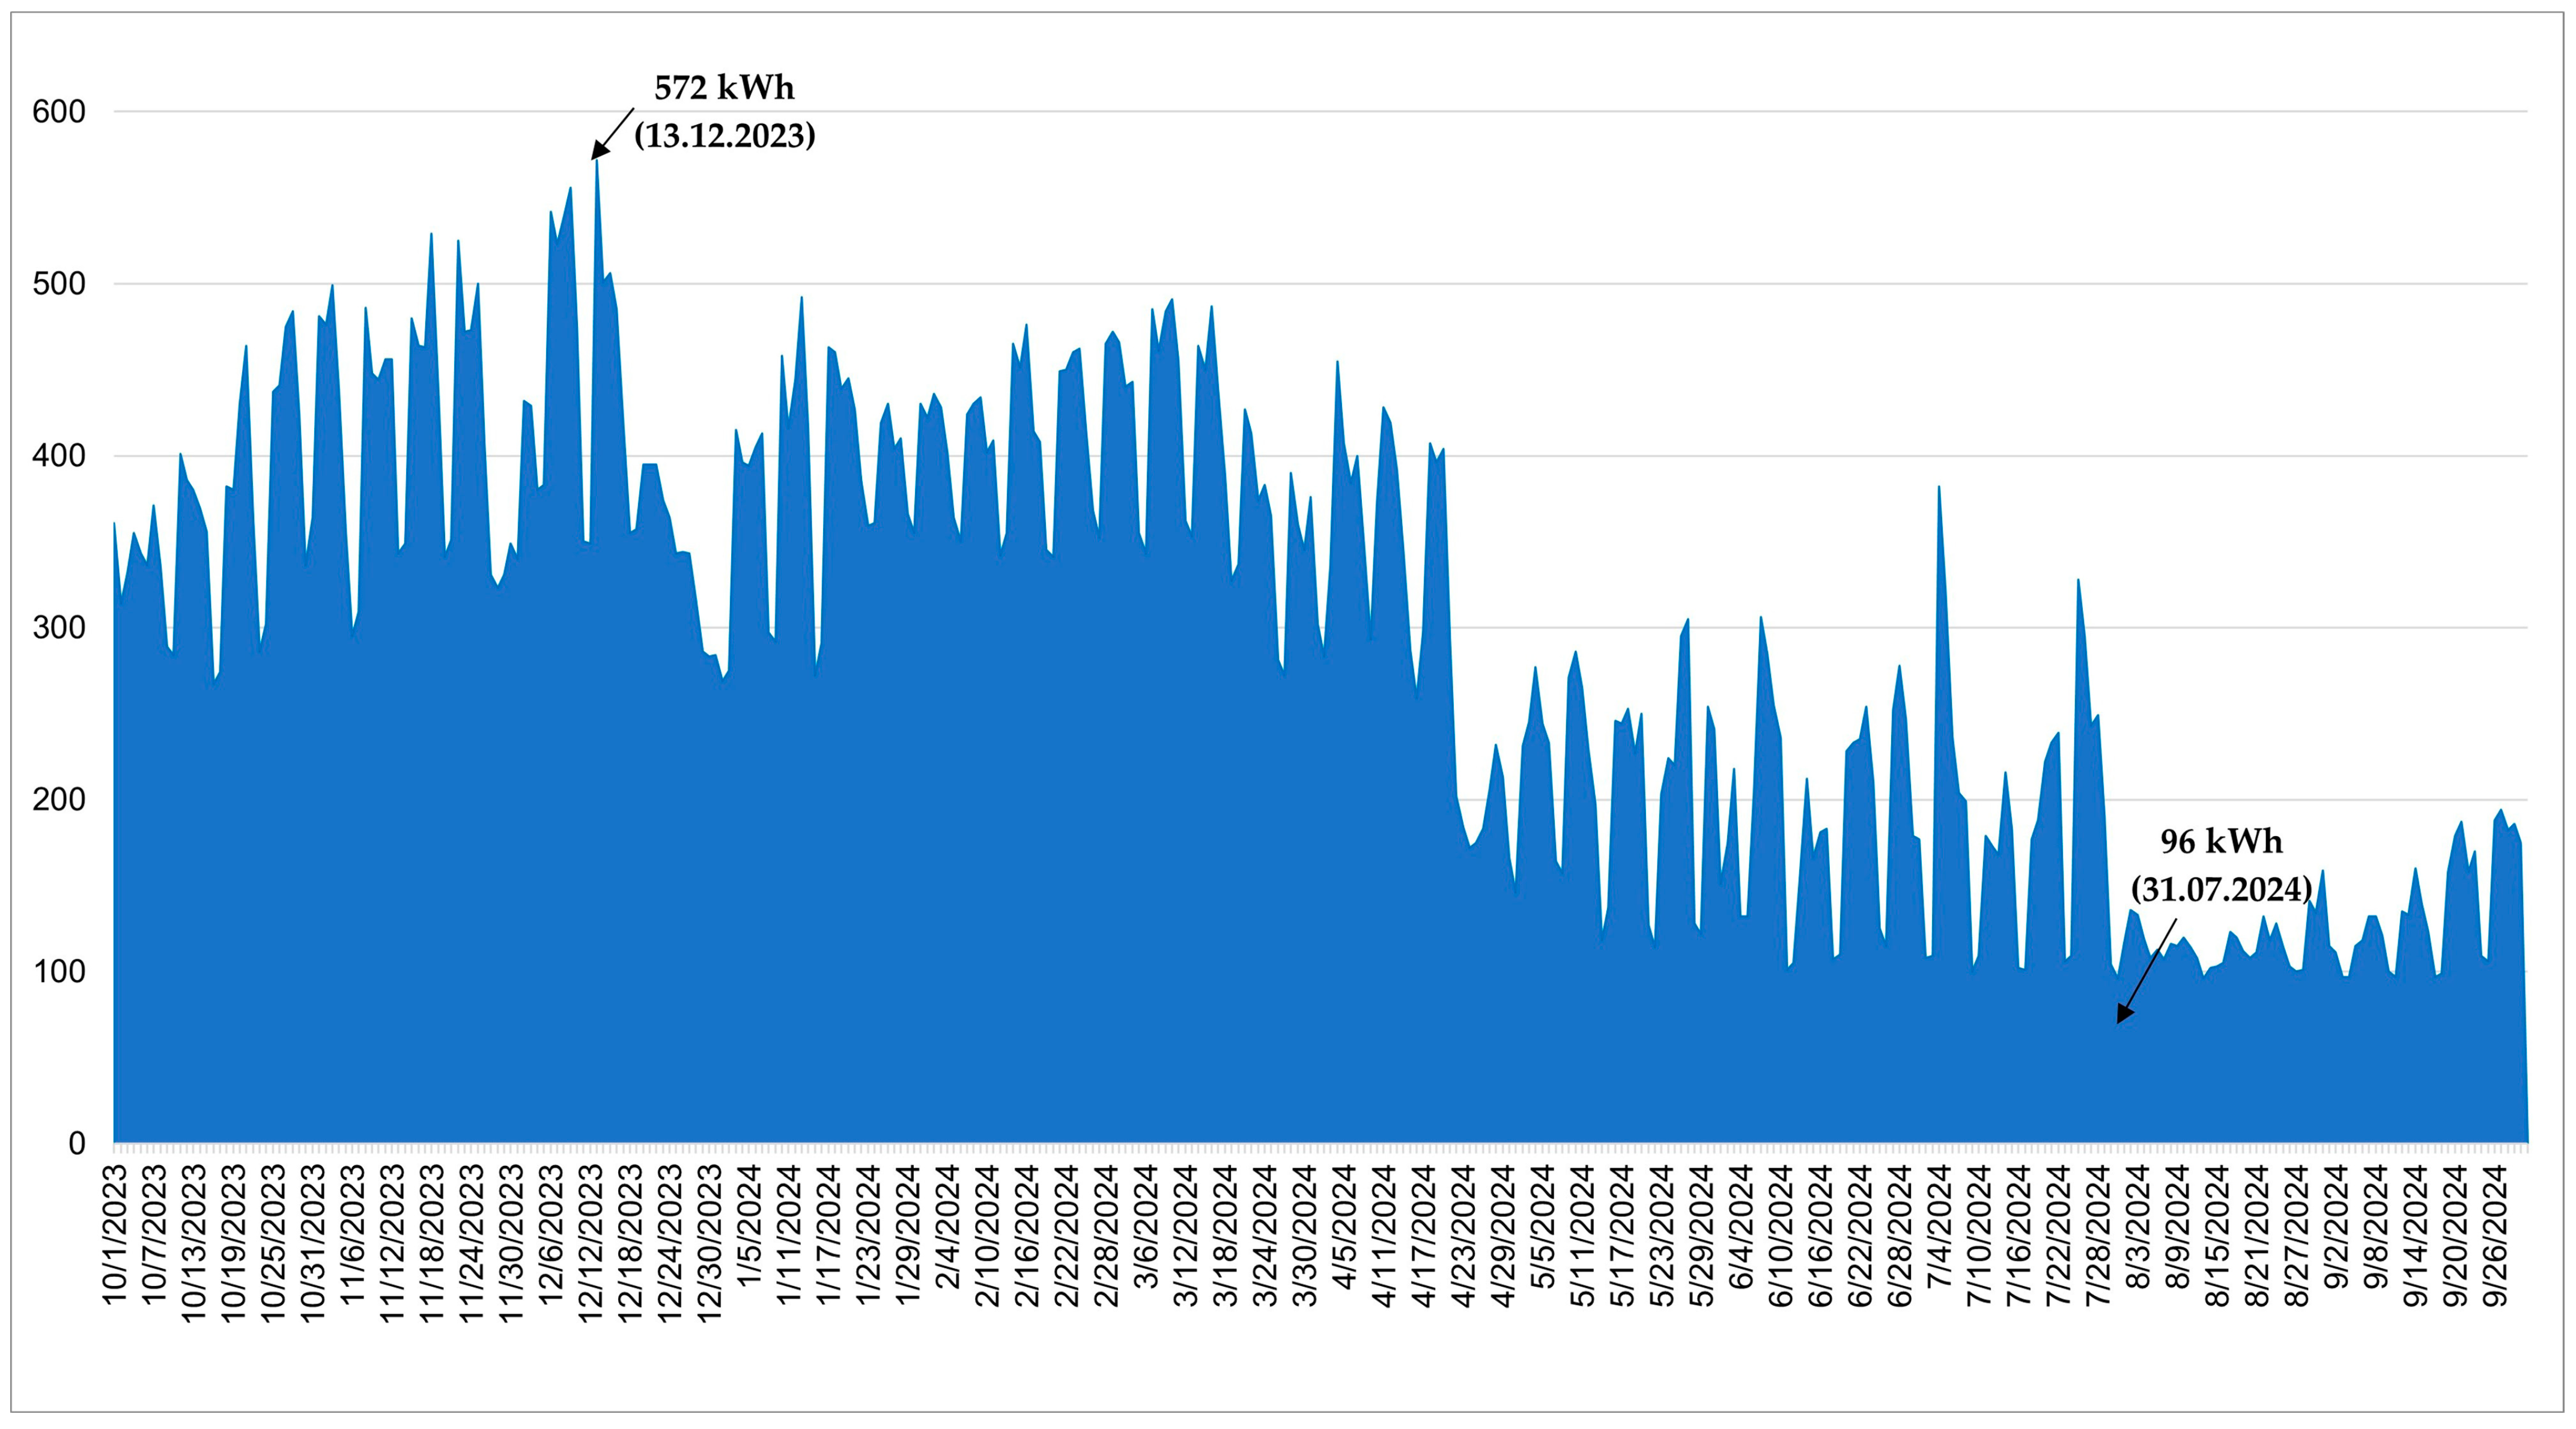
Electricity consumption is more predictable than gas consumption and does not depend on weather as much as natural gas consumption. From November to January, the consumption remains nearly the same each month due to consistent building activity and an equal number of daylight hours. Other months with similar consumption patterns include February–March, October, April, May–July, and August–September. Based on the BEMS installed in the educational facility, a daily electricity consumption report was generated and is presented in
Figure 7.
The mean daily electricity consumption is approximately 295 kWh, with a peak value of 572 kWh recorded in December and a minimum value of 96 kWh in July. Since the minimum value occurs during the vacation period, it may not accurately reflect the overall mean for the academic year. To provide a more precise analysis, the mean consumption from October to June was calculated at 345 kWh, with the minimum value during this period being 101 kWh.
To illustrate the building’s electricity consumption patterns, a 3D graphical representation was created for the entire academic year, as shown in
Figure 8. This figure highlights the periods of the highest consumption, revealing that during the cold season, the daily electricity usage typically ranges between 400 and 500 kWh, occasionally exceeding 500 kWh. Approximately 23% of the studied period shows a daily consumption between 300 and 400 kWh, while 30% of the time, the usage falls below 300 kWh. This lower consumption corresponds to the warmer months with longer daylight hours and includes vacation periods when building activities are significantly reduced.
Based on the collected energy consumption data, the energy use intensity (EUI) was calculated using the following formula [
49]:
This calculation resulted in an EUI of 90.19 kWh/m2/year for the building in question.
To thoroughly understand the energy consumption, the energy performance index (EPI) was also calculated using the following equation [
50]:
The resulting EPI was 75.16 kWh/m2/year.
3.3. Environmental Impact Assessment
The environmental impact indicators were determined using energy consumption data from the 2023/2024 academic year (103.42 MWh of electricity and 296.77 MWh of natural gas), focusing exclusively on the operational phase.
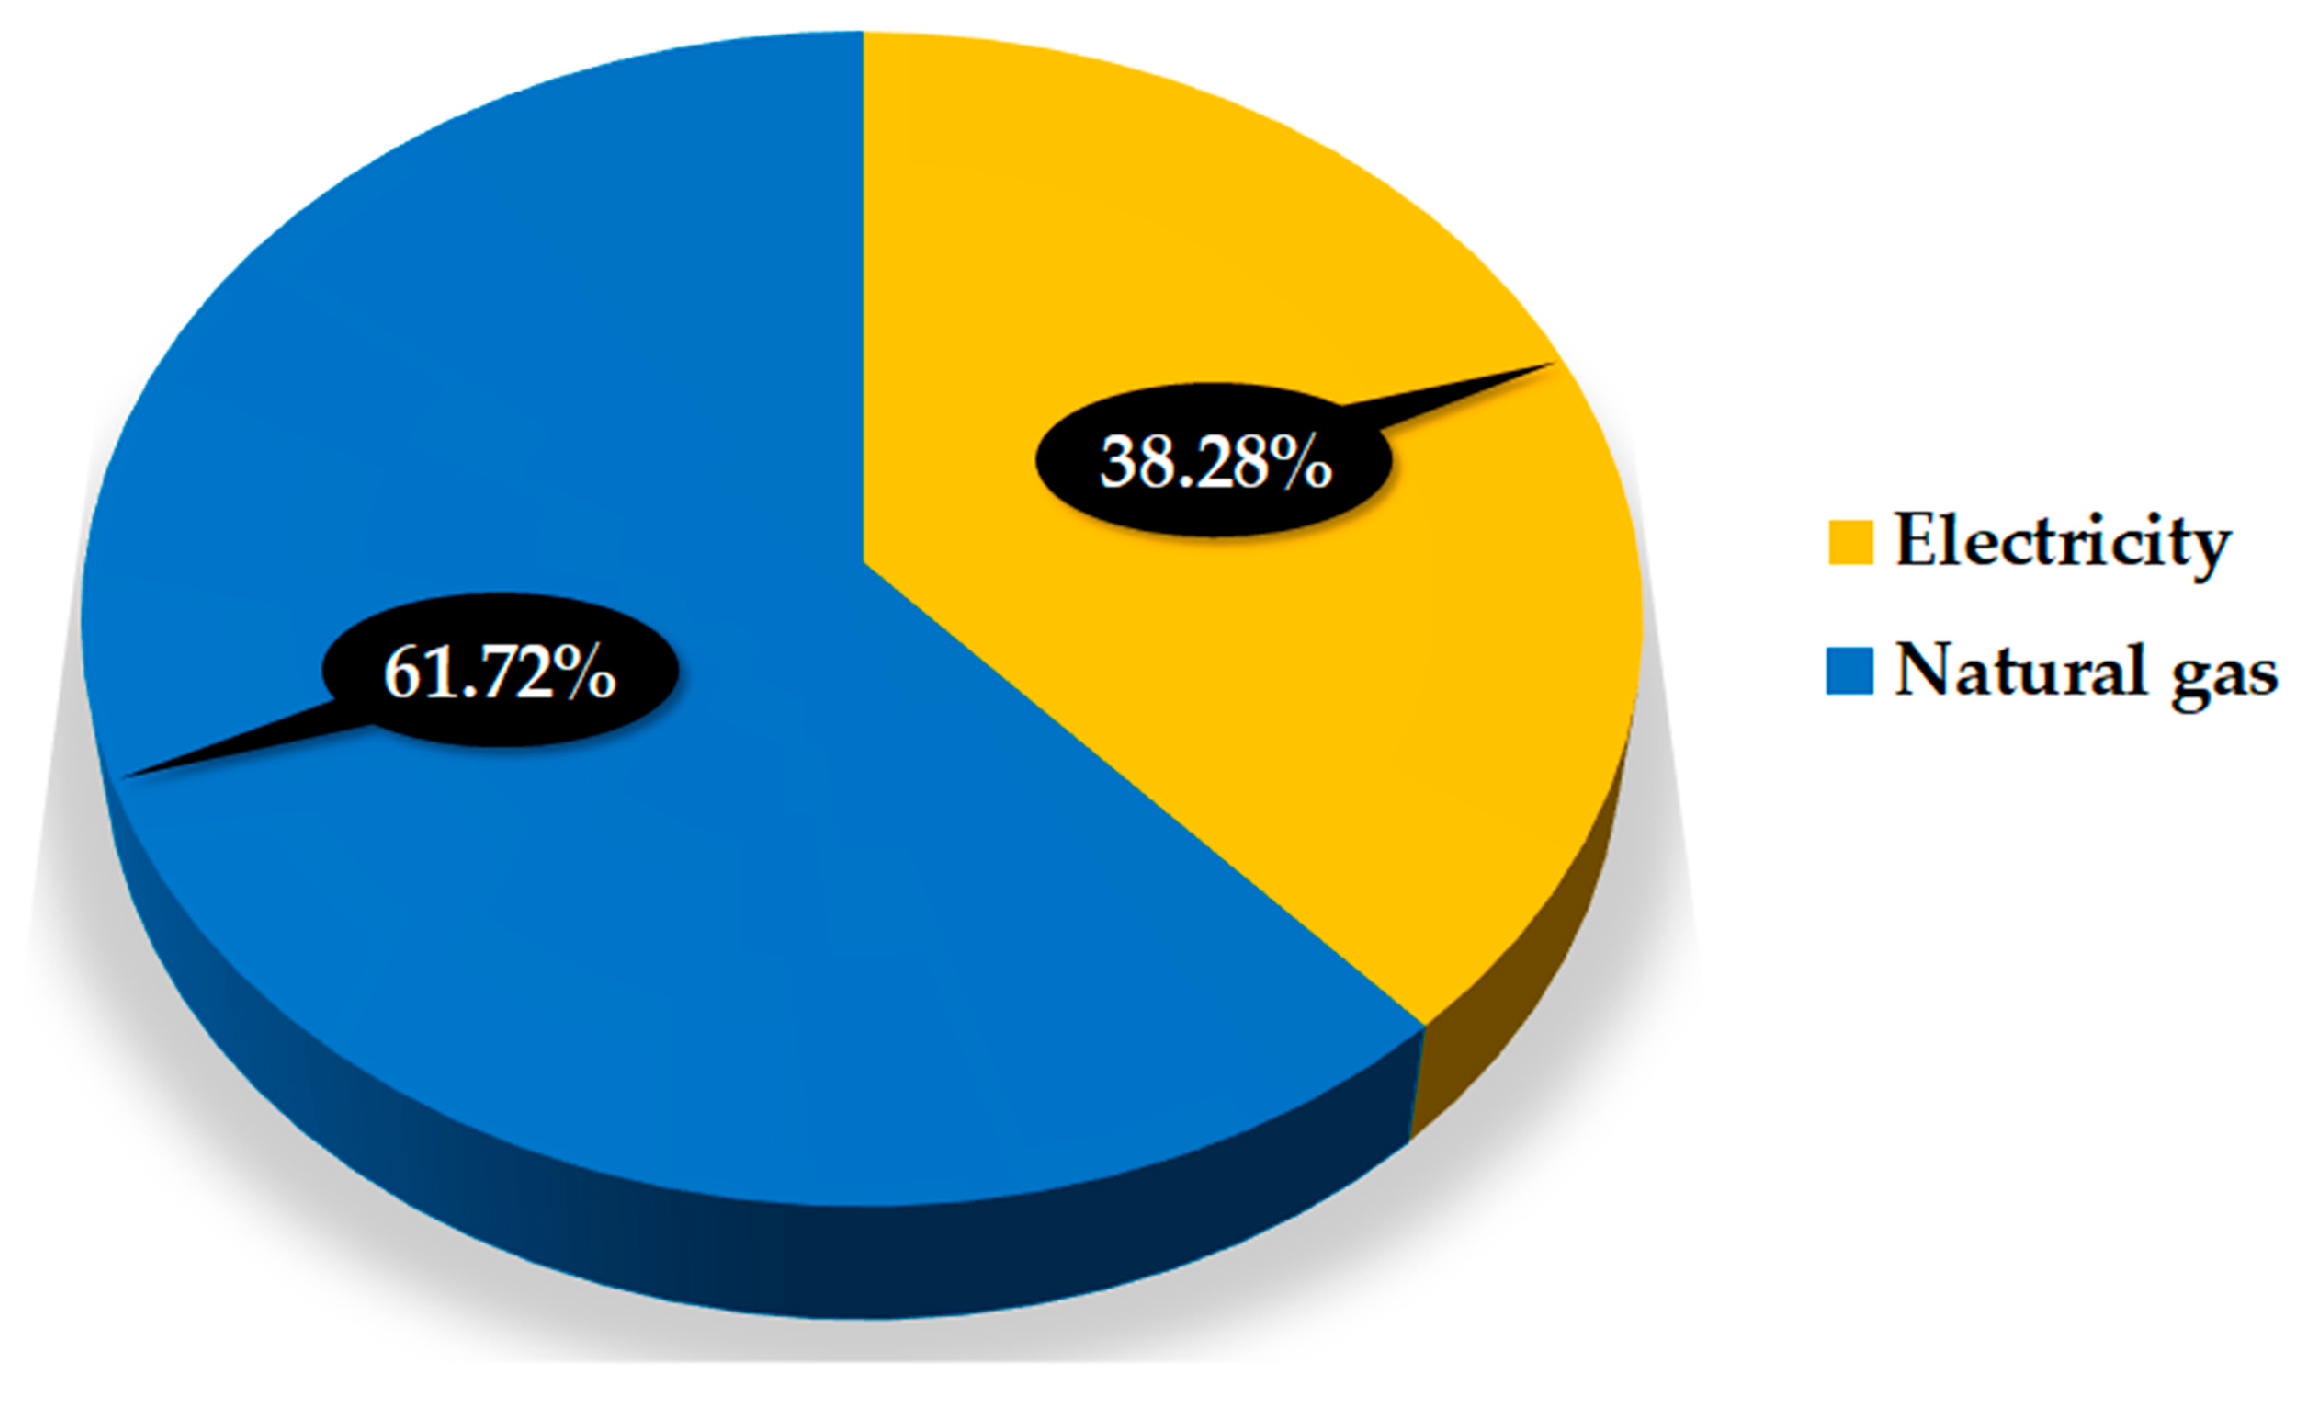
The simulation, conducted using the OneClick LCA software (
https://oneclicklca.com/), yielded a global warming potential of 120,199.82 kg CO
2e/year and 27.09 kg CO
2e/m
2/year for the facility. Of this, 46,007.57 kg CO
2e was attributed to electricity consumption, while 74,192.25 kg CO
2e was attributed to natural gas consumption. As illustrated in
Figure 9, most operational energy emissions are related to the consumption of gas to heat the building, accounting for 61.72% of the total. In contrast, the emissions from electricity consumption represent only 38.28% of the total operational energy emissions.
A comprehensive assessment of the environmental impact indicators (
Figure 10) reveals that emissions resulting from the consumption of natural gas are the primary contributor to the indicators GWP, ODP, ADPE, ADPF, and PENRT. Conversely, the consumption of electricity has a high impact on the indicators AP, EP, POCP, PERE, PERT, and FW.
4. Discussion
4.1. Indoor Environmental Quality
The provision of an adequate IEQ in university buildings is of critical importance given the substantial amount of time students spend in classroom environments. This exposure can have a considerable effect on their well-being. The affected areas include cognitive performance, physical health, comfort, satisfaction, and mental health [
7,
51]. The high density of occupants in these environments significantly affects fluctuations in temperature, relative humidity, CO
2 levels, and noise levels [
34]. Furthermore, the pervasive use of personal laptops contributes to increased heat generation, which may result in deviations between the target and observed thermal conditions. Inefficient heating or cooling systems may adversely impact student well-being by influencing their cognitive function, stress levels, productivity, health, and ultimately academic performance [
16,
27].
Standards offer guidance on the environmental conditions in classrooms, including ventilation rates (ASHRAE 62.1 [
52]), temperature and humidity ranges (ASHRAE 55, ISO 7730 [
44,
53]), lighting levels (EN 12464-1 [
46]), and acoustic parameters (ANSI/ASA S12.60 [
54]). However, a comprehensive analysis of these factors within university classrooms is notably lacking. Specifically, there is limited research that has simultaneously evaluated thermal comfort, lighting, indoor air quality, and acoustics in these settings [
55].
This study adopts a holistic approach by investigating all four IEQ factors by comparing measurements against the established standards. The IEQ conditions in the educational building, monitored through an academic year, generally aligned with the thermal comfort criteria specified in international and national regulations [
44,
56] for the heating season. These standards typically recommend temperatures in the range of 20 °C to 24 °C, relative humidity from 30% to 70%, air velocity below 0.2 m/s, CO
2 concentrations under 1000 ppm, and lighting levels from 300 lx to 500 lx.
The European Standard EN 15251 [
45] defines thermal comfort categories with varying temperature ranges: Category 1 (higher comfort) specifies 21–23 °C in the heating season and 23.5–25.5 °C in summer, while Category 3 (moderate comfort) allows 19–25 °C in winter and 22–27 °C in the cooling season. Our field study, the results of which are illustrated in
Figure 4, demonstrated that the educational facility adhered to the Category 1 thermal comfort criteria for 33.3% of the year, specifically from November to February. This period coincided with the heating season and effective temperature control within the building, resulting in a mean indoor air temperature of 22.95 °C. During another 33.3% of the year, encompassing March to May and October, the building’s indoor temperatures fell within the Category 3 criteria for thermal comfort. This period was marked by an average indoor air temperature of 25.72 °C. It is noteworthy that even though the heating system remained operational, the temperatures observed in March and April surpassed the upper limit specified for Category 1 of thermal comfort due to the heat gained due to solar irradiation. During the summer months (June, July, August, and even September), the indoor temperatures surpassed the recommended comfort limits, reaching a mean value of 30.65 °C. This exceedance is attributed to the facility’s lack of a centralized air conditioning system.
In terms of relative humidity, EN 15251 classifies 30–50% as Category 1 and 25–60% as Category 2.
Figure 4 reveals that the building maintained relative humidity within the Category 1 range for over 91.6% of the monitored period (from November 2023 to September 2024) and fell within the Category 2 range for the remaining 8.3% (in October 2023).
EN 15251 sets a CO
2 concentration limit of 800 parts per million (ppm) for Category 1 and 1200 ppm for Category 3. These limits are based on the idea that higher CO
2 levels can negatively impact occupants’ comfort and potentially their cognitive performance. In this study, although the educational building lacked a mechanical ventilation system, the CO
2 levels measured in this building fell within the more stringent Category 1 limits (800 ppm) for 50% of the year, specifically from May to October. The relatively favorable IAQ observed during these months is likely attributable to the natural ventilation provided by opening windows. For 33% of the year (November to March), the CO
2 levels were within the less strict Category 3 limits (1200 ppm), indicating acceptable, though perhaps not optimal, ventilation. However, during April and May, the CO
2 concentrations exceeded even the Category 3 limit, as shown in
Figure 5. This exceedance suggests inadequate ventilation during these two months, leading to a poorer IAQ and potential discomfort for the occupants.
In terms of acoustic comfort, EN 15251 specifies recommended sound levels in the range of 30–40 dB. However, our measurements, as detailed in
Table 2 and illustrated in
Figure 5, reveal that this recommended threshold was consistently exceeded throughout the entire year. This persistent exceedance likely stems from a combination of factors. These include the building’s proximity to an intensely circulated road, noise generated by occupants (conversations, movement, and the use of personal laptops), and, maybe the most significant, ongoing rehabilitation work near the building during the measurement period.
The illuminance requirements for classrooms, according to EN 12464-1, are 500 lx. EN 15,251 further specifies daylight factor criteria for lighting comfort: >5% on average for Category 1 and >2% for Category 3. Our findings (
Figure 4) showed that the 500 lx target was not achieved in any month. Despite the classrooms having large windows (three 2.10 m × 2.50 m windows each), students frequently used the window blinds to block direct sunlight, resulting in lighting conditions that, based on EN 15251’s criteria for adjustable shading devices, aligned with Category 3 comfort.
The field investigation carried out in Romania by Catalina et al. [
34] focused on measuring environmental parameters like CO
2, noise levels, and thermal comfort. Their results were similar to ours, indicating variations in CO
2 levels throughout the day and average temperatures around 23 °C. It was observed there, as well as in this research, that the sound levels exceeded the established threshold limits. Yet another study performed in Romania [
33] revealed concerning results during winter. These findings indicated that the CO
2 levels often exceeded the recommended threshold, reaching as high as 3.600 ppm, while indoor temperatures typically failed to achieve the minimum comfort level of 19 °C.
The monitored educational building generally met the thermal comfort criteria during the heating season, suggesting effective temperature regulation mechanisms. However, a comprehensive analysis of the full academic year revealed significant seasonal variations in the IEQ parameters, highlighting several areas for improvement.
During the summer months, elevated temperatures were consistently observed, likely due to increased solar radiation and insufficient passive or active cooling strategies. The building’s orientation and glazing characteristics may have contributed to solar heat gain [
57]. Fluctuating CO
2 concentrations, which intermittently exceeded the recommended limits, were primarily associated with periods of high occupancy and inadequate ventilation. This suggests that the existing natural ventilation is not sufficient for dynamic occupancy levels.
Consistent exceedance of the sound level thresholds was recorded throughout the year, indicating potential issues with sound insulation and noise generation from building systems or external sources. This exceedance was particularly pronounced during periods of high activity, such as class transitions or group work. Furthermore, insufficient illuminance levels, attributed to the frequent use of window blinds to mitigate the solar heat gain and glare, were observed across all seasons. This practice, while it addresses thermal concerns, compromises natural daylighting and increases the reliance on artificial lighting.
A detailed analysis of these seasonal trends suggests a complex interplay of factors, including building design, operational strategies, and occupancy patterns. The observed IEQ challenges underscore the need for targeted interventions. For instance, enhanced ventilation strategies, improved solar shading solutions, and optimized lighting controls could mitigate these issues. Further investigation into the building’s thermal mass, air leakage, and acoustic performance is also warranted to develop comprehensive strategies for the optimization of IEQ and to enhance occupant comfort and well-being.
4.2. Energy Use
Energy consumption is one of the most pressing concerns today, and it requires a thorough understanding of the consumption patterns for each building. The primary factor that generates these patterns is a building’s destination and usage. Educational buildings exhibit distinct patterns due to the repetitive structure of the academic year, facilitating smarter and more efficient management of their energy consumption.
To manage a comparison between several buildings, performance indicators such as energy use intensity and energy performance index can be used. The EUI is dependent on the total annual energy consumption, which varies based on several criteria, including geographical position, building design, occupancy and usage, and operational hours. These factors influence the EUI and should be considered in any comparative analysis [
58].
The building under consideration has a primary function as an educational facility and is situated in Eastern Europe. An analysis of its EUI can be effectively benchmarked against similar educational structures in other European countries, allowing for a comprehensive evaluation of its energy performance relative to the regional standards. In certain European countries, the EUI for educational buildings ranges from 65 to 225 kWh/m
2/year [
59,
60,
61,
62,
63,
64]. The EUI of this educational facility, calculated at 90.19 kWh/m
2/year, is below the average but still falls within this established range. This indicates that while the building demonstrates a commendable level of energy efficiency, there remains potential for further optimization.
While the EUI calculated for this building aligns with the values observed in various European countries, it is notably lower when compared to the statistics from the United States (U.S.). In the U.S., the national median site EUI for university educational buildings is reported at 84.3 kBtu/ft
2/year, equivalent to approximately 265.94 kWh/m
2/year. Furthermore, the national median source EUI for the same category is significantly higher, at 180.6 kBtu/ft
2/year, which translates into around 569.74 kWh/m
2/year [
65]. This disparity highlights the comparatively efficient energy performance of this educational building relative to its U.S. counterparts. However, the EUI values for different educational campuses can vary markedly, spanning from 61.3 to 731.09 kBtu/ft
2/year. This considerable range is largely influenced by geographical factors, including climate, regional energy sources, and architectural styles [
66]. Such variability underscores the importance of contextualizing energy performance metrics within the specific environmental and operational conditions of each campus.
One potential factor contributing to this discrepancy is that the case study building features an air conditioning system exclusively within one amphitheater. This limited use of air conditioning significantly reduces its overall electricity consumption compared to buildings that are fully air-conditioned, further supporting its lower EUI. This highlights the impact of specific HVAC configurations on the energy performance across different educational facilities.
Another relevant metric is the energy performance index, which is frequently utilized in India to assess energy efficiency [
67]. The EPI value for the building under study is approximately 75.16 kWh/m
2/year, positioning it within the average range as indicated by recent studies [
50,
67]. This places the building’s energy performance in a favorable context, suggesting that it meets acceptable standards for energy efficiency in educational settings.
In Romania, according to the national Methodology for Calculating the Energy Performance of Buildings [
68], the source EUI for refurbished educational buildings in the specific climate zone of the studied building is 82.7 kWh/m
2/year. For the building in question, the source EUI calculated for the academic year is approximately 113.77 kWh/m
2/year. This value suggests the need for energy-saving measures and the implementation of renewable energy solutions. Moreover, the methodology specifies that at least 10% of the total primary energy consumed by existing buildings undergoing major renovations must come from renewable sources, including those on site or within 30 km of a building’s GPS coordinates, if technically and economically feasible.
Considering both indicators, it can be established that the educational building studied has a satisfactory energy performance. However, since it lacks a centralized HVAC system, its energy efficiency is offset by thermal discomfort during the warm season.
4.3. Environmental Impact Assessment
The building sector represents a substantial contributor to global energy consumption and pollution, accounting for 30% of the total global energy use and 26% of global energy-related emissions, distributed as 8% directly from buildings and 18% from heat production and electricity [
69]. Thus, building operations present the major opportunity to lower their adverse effects on the environment. Evaluating the environmental impact of building operations is therefore essential for developing sustainable strategies to decrease energy use and carbon footprint.
Numerous studies [
70,
71,
72,
73,
74,
75,
76] have confirmed that the operational phase of a building is responsible for the most significant environmental impact. Furthermore, a review of the life cycle carbon emissions for a substantial number of residential and non-residential buildings, including educational facilities, conducted by Huang et al. [
77] indicated that their operational carbon emissions accounted for approximately 75% of their total life cycle carbon emissions.
Given that operational carbon emissions are a consequence of the direct combustion of fossil fuels and the indirect acquisition of electricity and heat during the operational phase of a building [
72,
73,
74,
78], the ratio of operational carbon to total lifecycle carbon emissions is strongly correlated with a building’s operational energy consumption [
72].
Operational carbon emission factors are subject to variation depending on the energy source. While fossil fuel emission factors (e.g., for natural gas) are fixed values determined by the relevant authorities, those for purchased electricity are influenced by the local energy generation mix [
72].
The educational facility under study was assessed over the 2023–2024 academic year, with consideration limited to the operational phase. Energy consumption data were disaggregated by resource type, namely electricity and natural gas. In the baseline scenario (S0), the following carbon emission factors were employed in the analysis, sourced from OneClick LCA: “electricity-Romania 2021” with a GWP of 0.44 kg CO2e/kWh and “natural gas-world” with a GWP of 0.25 kg CO2e/kWh.
As Romania’s electricity mix stands out within the European Union for its balanced distribution between different energy sources [
79], hydropower, nuclear, coal, natural gas, and wind all played a significant and relatively equal role in electricity production in 2022. By 2023, the share of renewables increases to more than 7% due to the shift towards cleaner energy sources, contributing to a reduction in the carbon intensity of electricity production (from 298 to 241 g CO
2e/kWh) [
80]. However, in accordance with the national legislation, the emission conversion factors for electricity and natural gas are 0.265 kg CO
2e/kWh and 0.205 kg CO
2e/kWh, respectively [
81].
In the context of educational buildings, it is imperative to prioritize the consideration of students’ capacity to acclimatize to colder temperatures during the winter months [
82]. Taking this into account, it is possible to establish temperature standards that strike a balance between comfort and energy savings [
83,
84]. A reduction in indoor temperatures by a minimal one degree Celsius has been found to result in a substantial annual decrease of 7% in the heating energy consumption [
84,
85,
86]. Given the average indoor temperatures of 22.95 °C from November to February and 25.72 °C from March to April, implementing energy-efficient measures could effectively lower energy consumption while still ensuring a comfortable indoor environment. Consequently, a reduction in natural gas consumption will affect a corresponding decrease in emissions. To mitigate the environmental impact by diminishing the consumption of natural gas, an alternative scenario (scenario 1) was analyzed in which the indoor temperature was reduced by one degree, leading to a seven percent reduction in the natural gas consumption.
The Paris Agreement, a global pact to protect our planet from the worst impacts of climate change, has set ambitious temperature targets (to hold the global average temperature increase to well below 2 °C above pre-industrial levels and pursue efforts to limit warming to 1.5 °C) and called for rapid and deep cuts to greenhouse gas emissions to ensure a sustainable future for all [
87].
Therefore, to explore potential reductions in the operational emissions for the building under study, two scenarios were evaluated, using the baseline scenario (S0) as a point of comparison:
Scenario 1 (S1): A 7% reduction in natural gas consumption, achieved through a decrease in the indoor temperature of 1 °C;
Scenario 2 (S2): Using an average future energy scenario for Romania (2023–2072) for electricity for a global warming target of 1.5 °C for office buildings with a global warming potential of 0.44 kg CO2e/m2 and a 7% reduction in the natural gas consumption.
Figure 11 presents the GWP of the total operational energy by floor area for all scenarios. The findings of this research demonstrated a decline from 27.09 kg CO
2e/m
2/year in the baseline scenario to a minimum of 15.99 kg CO
2e/m
2/year in the second scenario, which was consistent with the mean value of 13 kg CO
2e/m
2/year obtained in the review by Huang et al. for non-residential buildings in the EU [
77].
As Mohammed et al. [
73] highlighted, the rapid growth of new renewable energy technologies and improvements in energy efficiency practices contribute to promising opportunities to reduce the operational emissions of buildings. Roux et al. [
88] and Ramon et al. [
89] shared that the selection of the energy mix and the impact of climate change within the context of a life cycle assessment study typically exert a pronounced influence on the resultant findings.
A comparative analysis of the reductions for all 12 LCA indicators, with reference to the baseline scenario (
Figure 12), demonstrates that incorporating a reduction of 1 °C for heating with natural gas and a prospective scenario for electricity to reach the objective of achieving a temperature increase of 1.5 °C will result in the most significant decreases for all LCA indicators. The most substantial reductions were observed in the utilization of renewable primary energy and fresh water, followed by the eutrophication and acidification potentials.
The projections indicate a decrease in both the carbon intensity of the energy supply and the energy intensity of building operations in coming decades, leading to an anticipated decline in the operational emissions from buildings [
90].
4.4. The Interplay of IEQ, Energy Use, and Environmental Impacts
Educational institutions hold the responsibility to provide spaces that nurture intellectual and personal growth. By prioritizing IEQ, schools and universities create environments where their students and staff can thrive mentally and physically. However, balancing energy efficiency with IEQ presents a considerable challenge, as these objectives can occasionally be at odds. Therefore, it is mandatory to adopt a comprehensive technique that simultaneously considers energy performance, environmental impacts, and IEQ. This strategy ensures that initiatives aiming to enhance energy efficiency do not undermine IEQ or other important aspects of a building’s performance.
Prior to analyzing the interactions between factors, we assessed the data normality using Shapiro–Wilk tests. The statistical results for indoor temperature (0.89772,
p = 0.14823), CO
2 (0.90298,
p = 0.17331), lighting level (0.92209,
p = 0.30366), sound level (0.95615,
p = 0.72779), energy use (0.86406,
p = 0.05498), and GWP (0.87597,
p = 0.07784) showed no significant deviation from normality (
p > 0.05). This validates the assumption of normality for subsequent analyses. To provide a comprehensive overview of the relationship between the IEQ, energy consumption, and environmental impacts, an overlap graph illustrating these parameters was created and is shown in
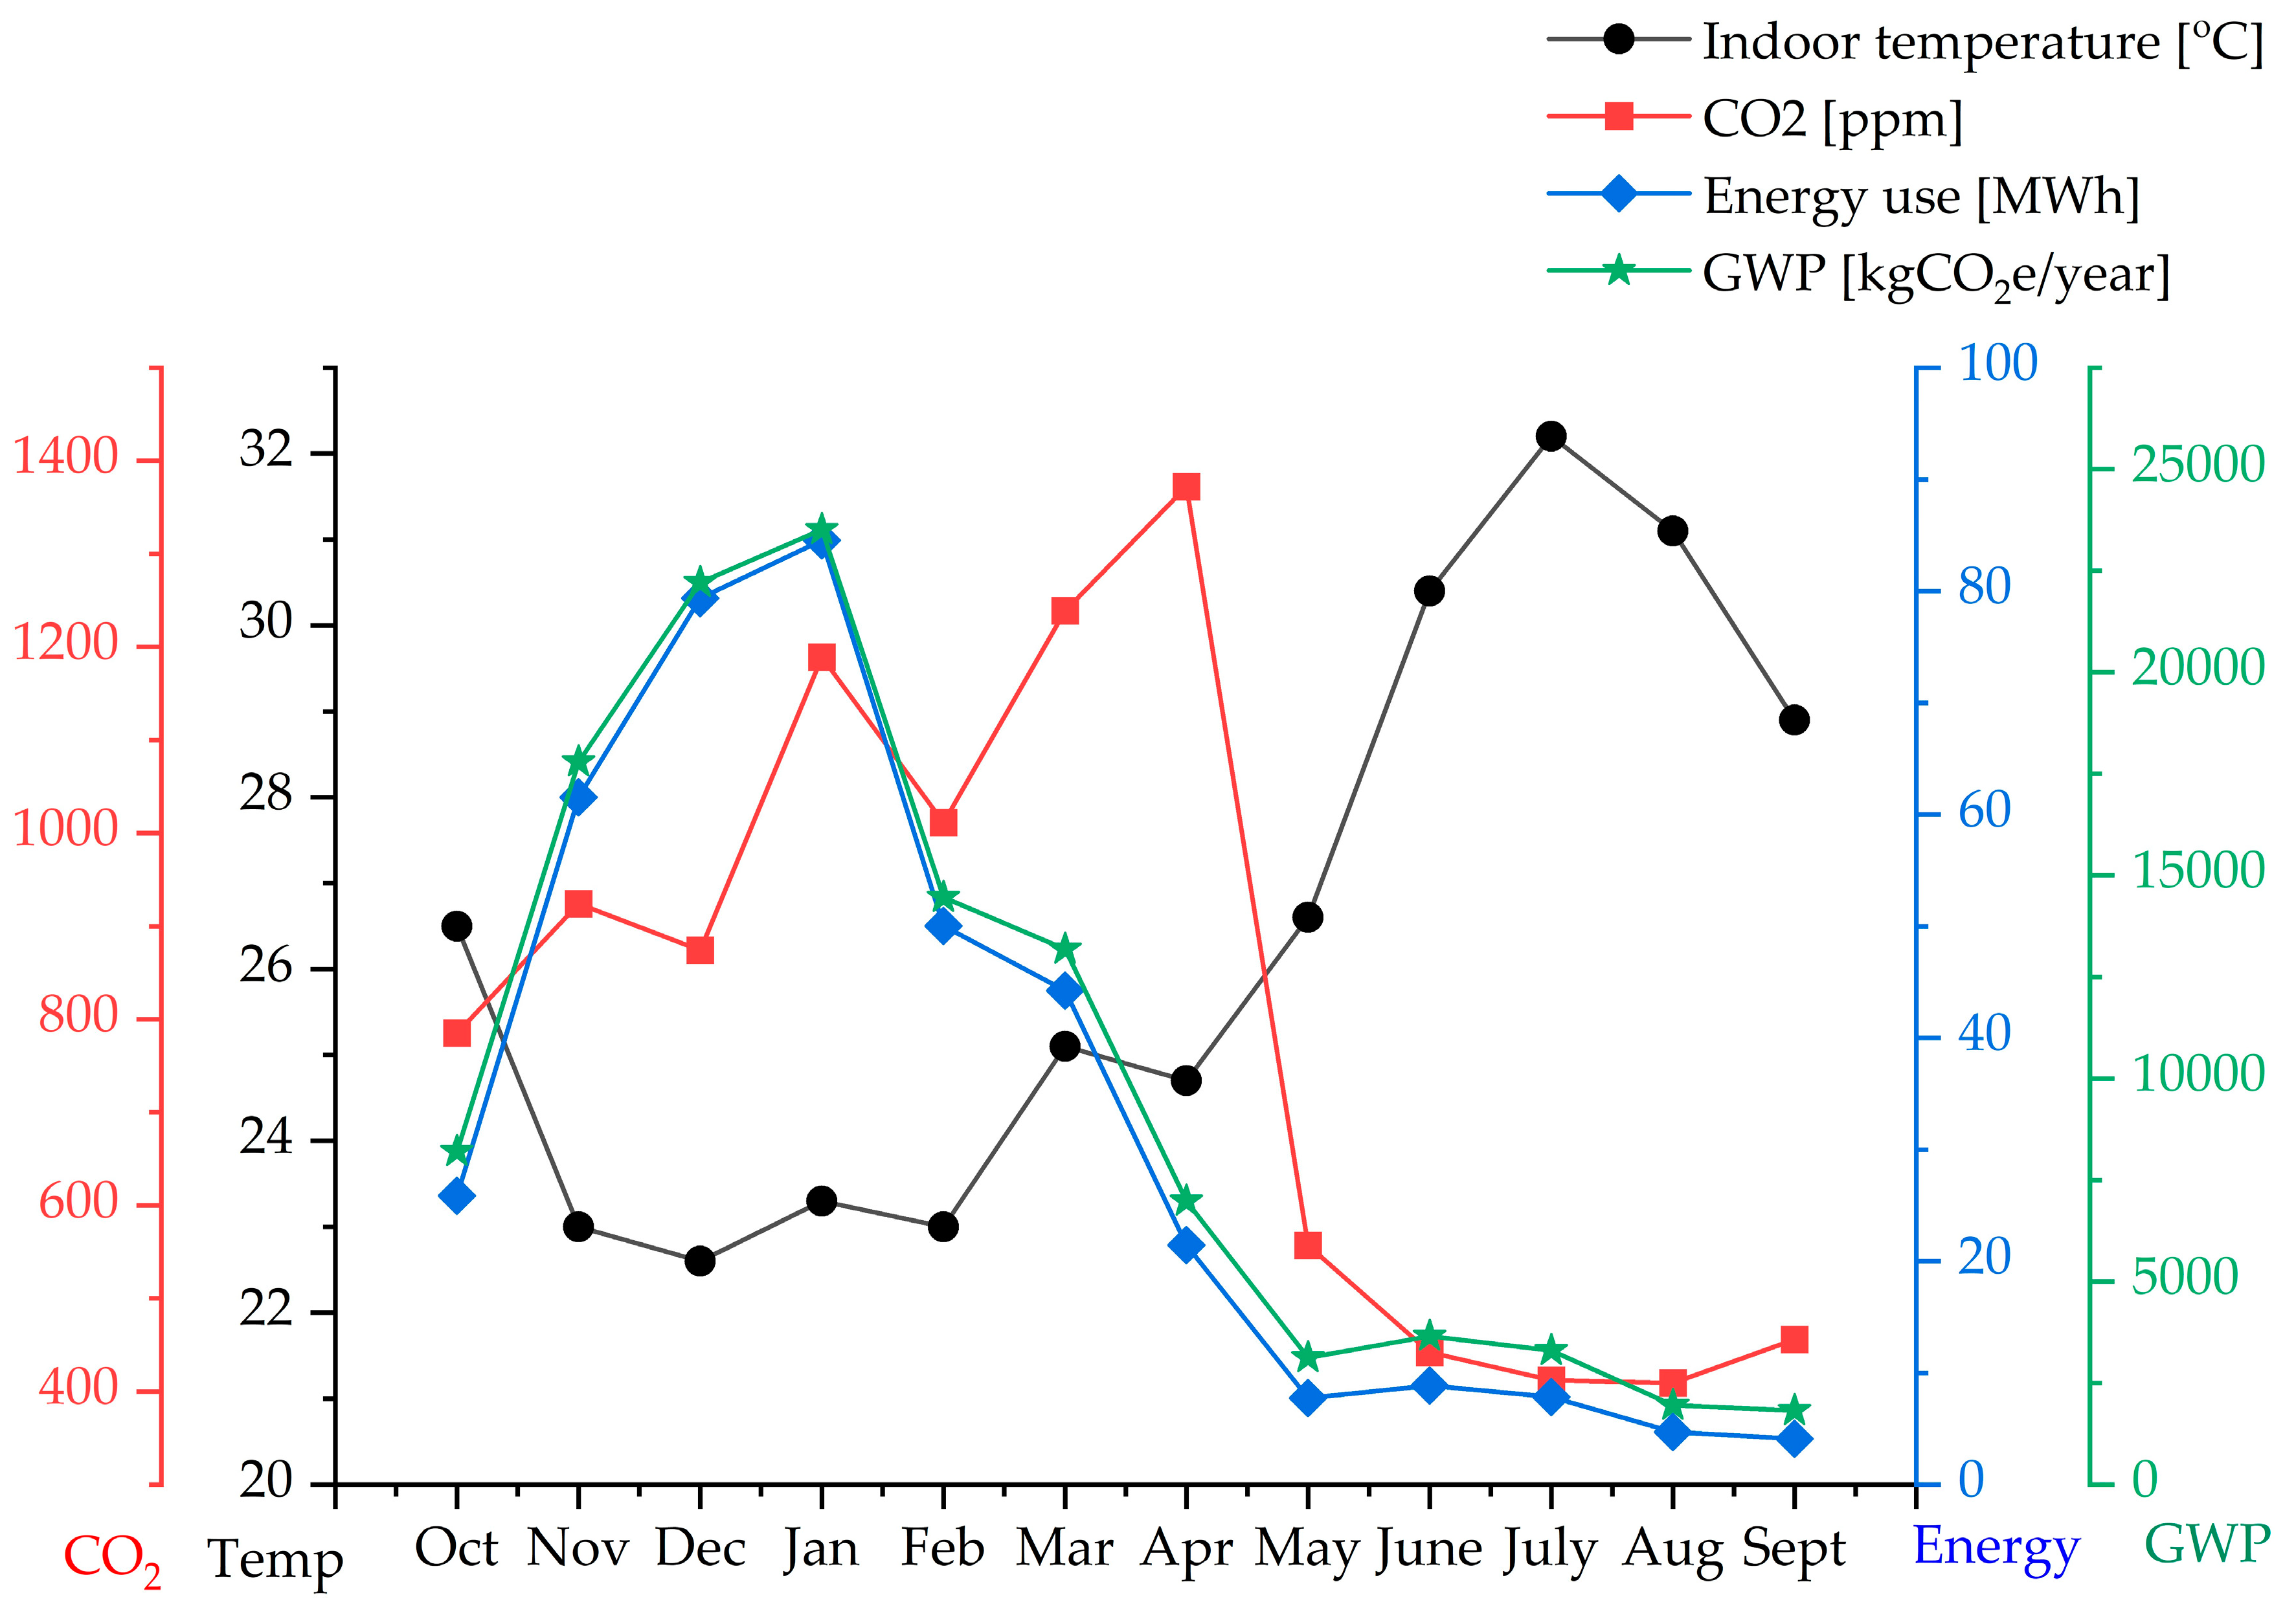
Figure 13. For clarity, the sound and illumination levels were excluded from the graph despite them being discussed in the preceding section.
As indicated in
Figure 13, winter is characterized by significant environmental impacts due to the elevated energy consumption, correlated with high CO
2 concentrations, although the ambient temperatures fall into Category 1 of thermal comfort. During the summer months, the dynamics shift: we observe elevated temperatures, accompanied by lower CO
2 levels, reduced energy use, and diminished environmental impacts. To understand the interdependencies between the factors studied, we performed a Pearson’s correlation analysis. The resulting correlation coefficients and
p-values are presented in
Table 3.
The analysis revealed several key correlational patterns among the variables studied. Notably, a strong negative correlation was observed between indoor temperature and both energy use (−0.8371, p < 0.0006) and GWP (−0.8401, p < 0.0006). This implies that as indoor temperatures rise, there is a significant tendency for energy consumption and the associated GWP to decrease. This could be attributed to reduced heating demands in warmer indoor environments. Similarly, a strong negative correlation was found between indoor temperature and CO2 levels (−0.8025, p = 0.00168), suggesting that increased indoor temperatures are associated with lower CO2 concentrations. This may be linked to ventilation patterns, reduced occupancy during warmer periods, or opening windows. Conversely, a significant positive correlation was identified between CO2 levels and both energy use (0.6524, p = 0.0214) and GWP (0.6607, p = 0.0193), indicating that higher CO2 levels are associated with increased energy consumption and GWP. Furthermore, an exceptionally strong positive correlation was observed between energy use and GWP (0.9995, p < 0.0001), reflecting a near-perfect linear relationship. This suggests that energy consumption is a highly reliable predictor of GWP, and vice versa, likely due to the direct relationship between energy production and the associated greenhouse gas emissions. In contrast, lighting levels and sound levels exhibited weak or statistically insignificant correlations with the other variables, as evidenced by the p-values exceeding 0.05. This suggests that any observed linear relationship between these factors and the others is likely attributable to random variation rather than a systematic association.
The contrasting seasonal behavior underscores the complex interactions between these variables and highlights the necessity for strategic energy management throughout the year. In this context, a notable performance gap has emerged due to the complexity and fragmentation of building control system control. In this educational building, the strategies implemented to manage building services proved to be inadequately adaptive to the fluctuating demand levels. This was particularly evident during periods of partial occupancy or outside of the standard operating hours, leading to situations where the systems continued to heat unoccupied spaces. Such inefficiencies contributed to unnecessary energy consumption, exacerbating the environmental impacts outlined in the previous analysis.
This disconnect not only highlights the need for better synchronization between energy management strategies and occupancy patterns but also emphasizes the importance of integrating intelligent control systems [
4,
91]. By enhancing their responsiveness to actual usage, buildings can optimize their energy efficiency while maintaining IEQ. Addressing this performance gap is essential for aligning energy use with the sustainability goals identified in the graph, ultimately fostering a more efficient and comfortable building environment.
To bridge this performance gap, it is essential to implement more sophisticated control systems capable of dynamic adjustment to real-time occupancy and environmental conditions. Implementing a more refined Building Management System (BMS), besides the existing BEMS, with capabilities such as demand-controlled ventilation and zoned heating could significantly enhance its responsiveness [
92,
93]. These systems can detect occupancy using sensors and adjust the energy usage accordingly, ensuring that only occupied areas receive heating, thereby optimizing energy efficiency. Additionally, integrating smart technologies, such as AI-driven analytics, within the BMS could enhance its predictive capabilities further, allowing the system to anticipate occupancy patterns and adjust its settings proactively [
4,
92,
93,
94]. This would not only reduce unnecessary energy use but also extend the lifespan of the building’s technical infrastructure. Moreover, fostering collaboration between the buildings’ managers, occupants, and system designers would ensure that the control strategies aligned closely with the actual user behavior, further minimizing the discrepancies between the predicted and actual energy use. By embracing these advanced strategies and engaging in continuous monitoring, educational institutions can significantly close performance gaps, both achieving cost efficiency and reducing their environmental impact. Additionally, sustainable practices in educational buildings extend beyond immediate benefits. They set a precedent for environmental stewardship, influencing students and staff to adopt sustainable habits in their daily lives. Through a commitment to a comprehensive perspective that prioritizes the interconnectedness of energy, the environment, and occupants’ health, educational facilities can become buildings that not only meet the performance targets but also foster thriving learning environments. This balanced approach will result in sustainable, resilient buildings that serve their users effectively while minimizing their ecological footprint.
5. Conclusions
This study explored the interplay between the IEQ, energy consumption, and environmental impacts in an educational building over an academic year. Its findings reveal a complex interrelationship between these factors, highlighting seasonal variations in the IEQ parameters and energy consumption. While the building generally met the thermal comfort standards during the heating season (Category 1 for 33.3% and Category 3 for another 33.3%), significant challenges emerged in summer due to high temperatures and insufficient cooling. The lack of a mechanical ventilation system resulted in the CO2 concentrations frequently exceeding the recommended levels, with values up to 1372 ppm. The noise levels consistently exceeded the acceptable limits, with a mean value of 51 dB. The lighting levels also fell short of the recommended standards, under 500 lx, due to the occupants’ use of window blinds to block direct sunlight.
The building’s energy use intensity was 90.19 kWh/m2/year, and its energy performance index was 75.16 kWh/m2/year, falling within the average range for similar facilities in Europe but being significantly lower than its US counterparts. The life cycle assessment revealed a global warming potential of 120,199.82 kg CO2e/year, with natural gas consumption contributing 61.72% of this total. This underscores the need for integrated intelligent control systems, balanced approaches to optimizing IEQ and energy efficiency, and approaches to lowering the building’s overall carbon footprint.
Addressing the identified performance gap requires a more comprehensive, integrated approach. Implementing smart technologies within Building Management Systems to optimize the responsiveness to the actual building use and occupancy patterns is essential to enhancing energy efficiency while maintaining an acceptable IEQ. Furthermore, strategies for reducing the reliance on natural gas for heating (such as adopting renewable energy sources), improving natural ventilation, and optimizing lighting should be considered. These improvements could simultaneously reduce the energy consumption and environmental impacts and contribute to a more productive, comfortable, and healthy learning environment for its occupants.
This research underscores the importance of holistic sustainability strategies for educational facilities, integrating IEQ, energy efficiency, and environmental considerations for the optimal outcomes.


