Article

PerMSCA-YOLO: A Perceptual Multi-Scale Convolutional Attention Enhanced YOLOv8 Model for Rail Defect Detection

1
School of Information Engineering, Wuhan University of Technology, Wuhan 430070, China
2
Hubei Key Laboratory of Broadband Wireless Communication and Sensor Networks, Wuhan University of Technology, Wuhan 430070, China
*
Author to whom correspondence should be addressed.
Appl. Sci. 2025, 15(7), 3588; https://doi.org/10.3390/app15073588
Submission received: 26 February 2025 / Revised: 22 March 2025 / Accepted: 24 March 2025 / Published: 25 March 2025

Abstract

:
With the widespread application of high-speed and heavy-load railways, the real-time detection of track surface defects has become increasingly crucial. To address the challenges in rail defect detection, this study proposes the PerMSCA-YOLO model, which aims to overcome the limitations of traditional object detection models in multi-scale, small target, and complex background scenarios. By incorporating the lightweight FasterNet backbone network, a multi-scale convolutional attention module, and perceptual loss, the proposed model significantly enhances the detection accuracy and robustness of track defects. Experimental results show that PerMSCA-YOLO achieves an mAP@0.5 of 0.856, an F1-score of 0.79, and an inference frame rate of 142 FPS, demonstrating superior detection accuracy and real-time performance compared to other mainstream models like YOLOv8n. Furthermore, the model exhibits strong adaptability and efficiency when dealing with complex track defects, such as microcracks and corrosion patches, indicating its broad practical application potential. The innovative contribution of this research lies in its effective strategy for improving detection accuracy and real-time performance through multi-scale feature fusion and deep semantic alignment mechanisms, providing a solution that balances both precision and efficiency for defect detection in complex track environments, with substantial engineering application potential.

1. Introduction

With the continuous increase in railway transportation speed and load, steel rails are highly susceptible to defects such as cracks, spalling, and corrosion due to prolonged and repetitive exposure to train movements [1]. In high-intensity applications like high-speed rail and heavy-load railways, track surface defects not only affect the service life of railway equipment but also directly pose a threat to train operational safety. Due to the immense pressure exerted by trains on the rails, coupled with the effects of weather, temperature variations, and track wear, these defects can gradually worsen if not promptly detected and repaired, potentially leading to catastrophic railway safety incidents, including train derailments and track fractures [2]. As a result, efficient and accurate detection and diagnosis of track defects has become a critical research topic for railway maintenance and safety assurance. With the ongoing expansion of railway networks and increasing safety requirements, the development of technologies capable of providing efficient, real-time, and precise detection has become an urgent priority.
Traditional track defect detection methods primarily rely on manual visual inspection or large specialized detection equipment, such as ultrasonic, eddy current, and flux leakage-based non-destructive testing (NDT) techniques [3]. While these methods have improved detection accuracy and efficiency to some extent, they still face several challenges. Firstly, manual inspection depends on the experience and intuition of maintenance personnel and is influenced by fatigue and subjective factors, making detection accuracy unreliable. This issue is especially pronounced in large-scale track inspections, where human inspection is inefficient and difficult to sustain over long periods. Secondly, although non-destructive testing equipment, including large detection vehicles, can provide relatively accurate results, they are costly; time-consuming; and cannot meet the long-term, continuous, and real-time monitoring needs of the railway. Furthermore, traditional detection methods often suffer from the risks of missed or false detections in complex track environments, particularly in scenarios with narrow cracks, small defects, and intricate surface textures. This issue is particularly prominent in high-speed rail environments [4]. For example, small defects like cracks or corrosion may be difficult to identify using traditional detection technologies, thereby compromising train safety. Consequently, the use of emerging technologies such as computer vision, deep learning, machine learning, and wireless sensor networks for high-frequency, real-time, and precise detection of track surface defects has become a focal point for both academia and industry.
In recent years, deep learning has achieved remarkable results in computer vision tasks such as object detection, image classification, and semantic segmentation, offering new approaches to solve issues such as the diversity, complexity, and varying target sizes encountered in track surface defect detection. In the field of track inspection, researchers have proposed methods for detecting track cracks, spalling, and fatigue defects based on deep convolutional neural networks [4]. Compared to traditional handcrafted feature-based detection algorithms, deep networks demonstrate superior robustness and generalization capabilities when dealing with complex lighting, background interference, and large-scale data [5,6]. Moreover, with the rise of mobile and edge computing, lightweight deep models designed for track surface defect detection have emerged, capable of performing real-time inference while maintaining detection accuracy.
In practical applications, track defect detection still faces multiple challenges: firstly, deep networks often have a large number of parameters, making it difficult to balance inference speed and accuracy, especially for real-time detection in resource-constrained environments; secondly, due to the wide variety of defect types and sizes, small targets are often missed, and traditional convolutional networks are prone to losing fine-grained information unless sufficient multi-scale feature fusion is applied; thirdly, track cracks are often narrow and scattered, requiring a larger receptive field and attention mechanism to capture complex textures and long-distance edges. Existing methods still fall short in these areas [7]. To address these challenges, this paper proposes the PerMSCA-YOLO model, built upon the YOLOv8 framework, with a focus on three core issues: “lightweight real-time detection, multi-scale target enhancement, and precise capture of narrow cracks/complex surface features.” The specific contributions of this research are summarized as follows:
  • A lightweight FasterNet backbone network is introduced, reducing the model’s parameter count and computational load through operations like grouped and depthwise convolutions, while achieving real-time detection without compromising feature representational power.
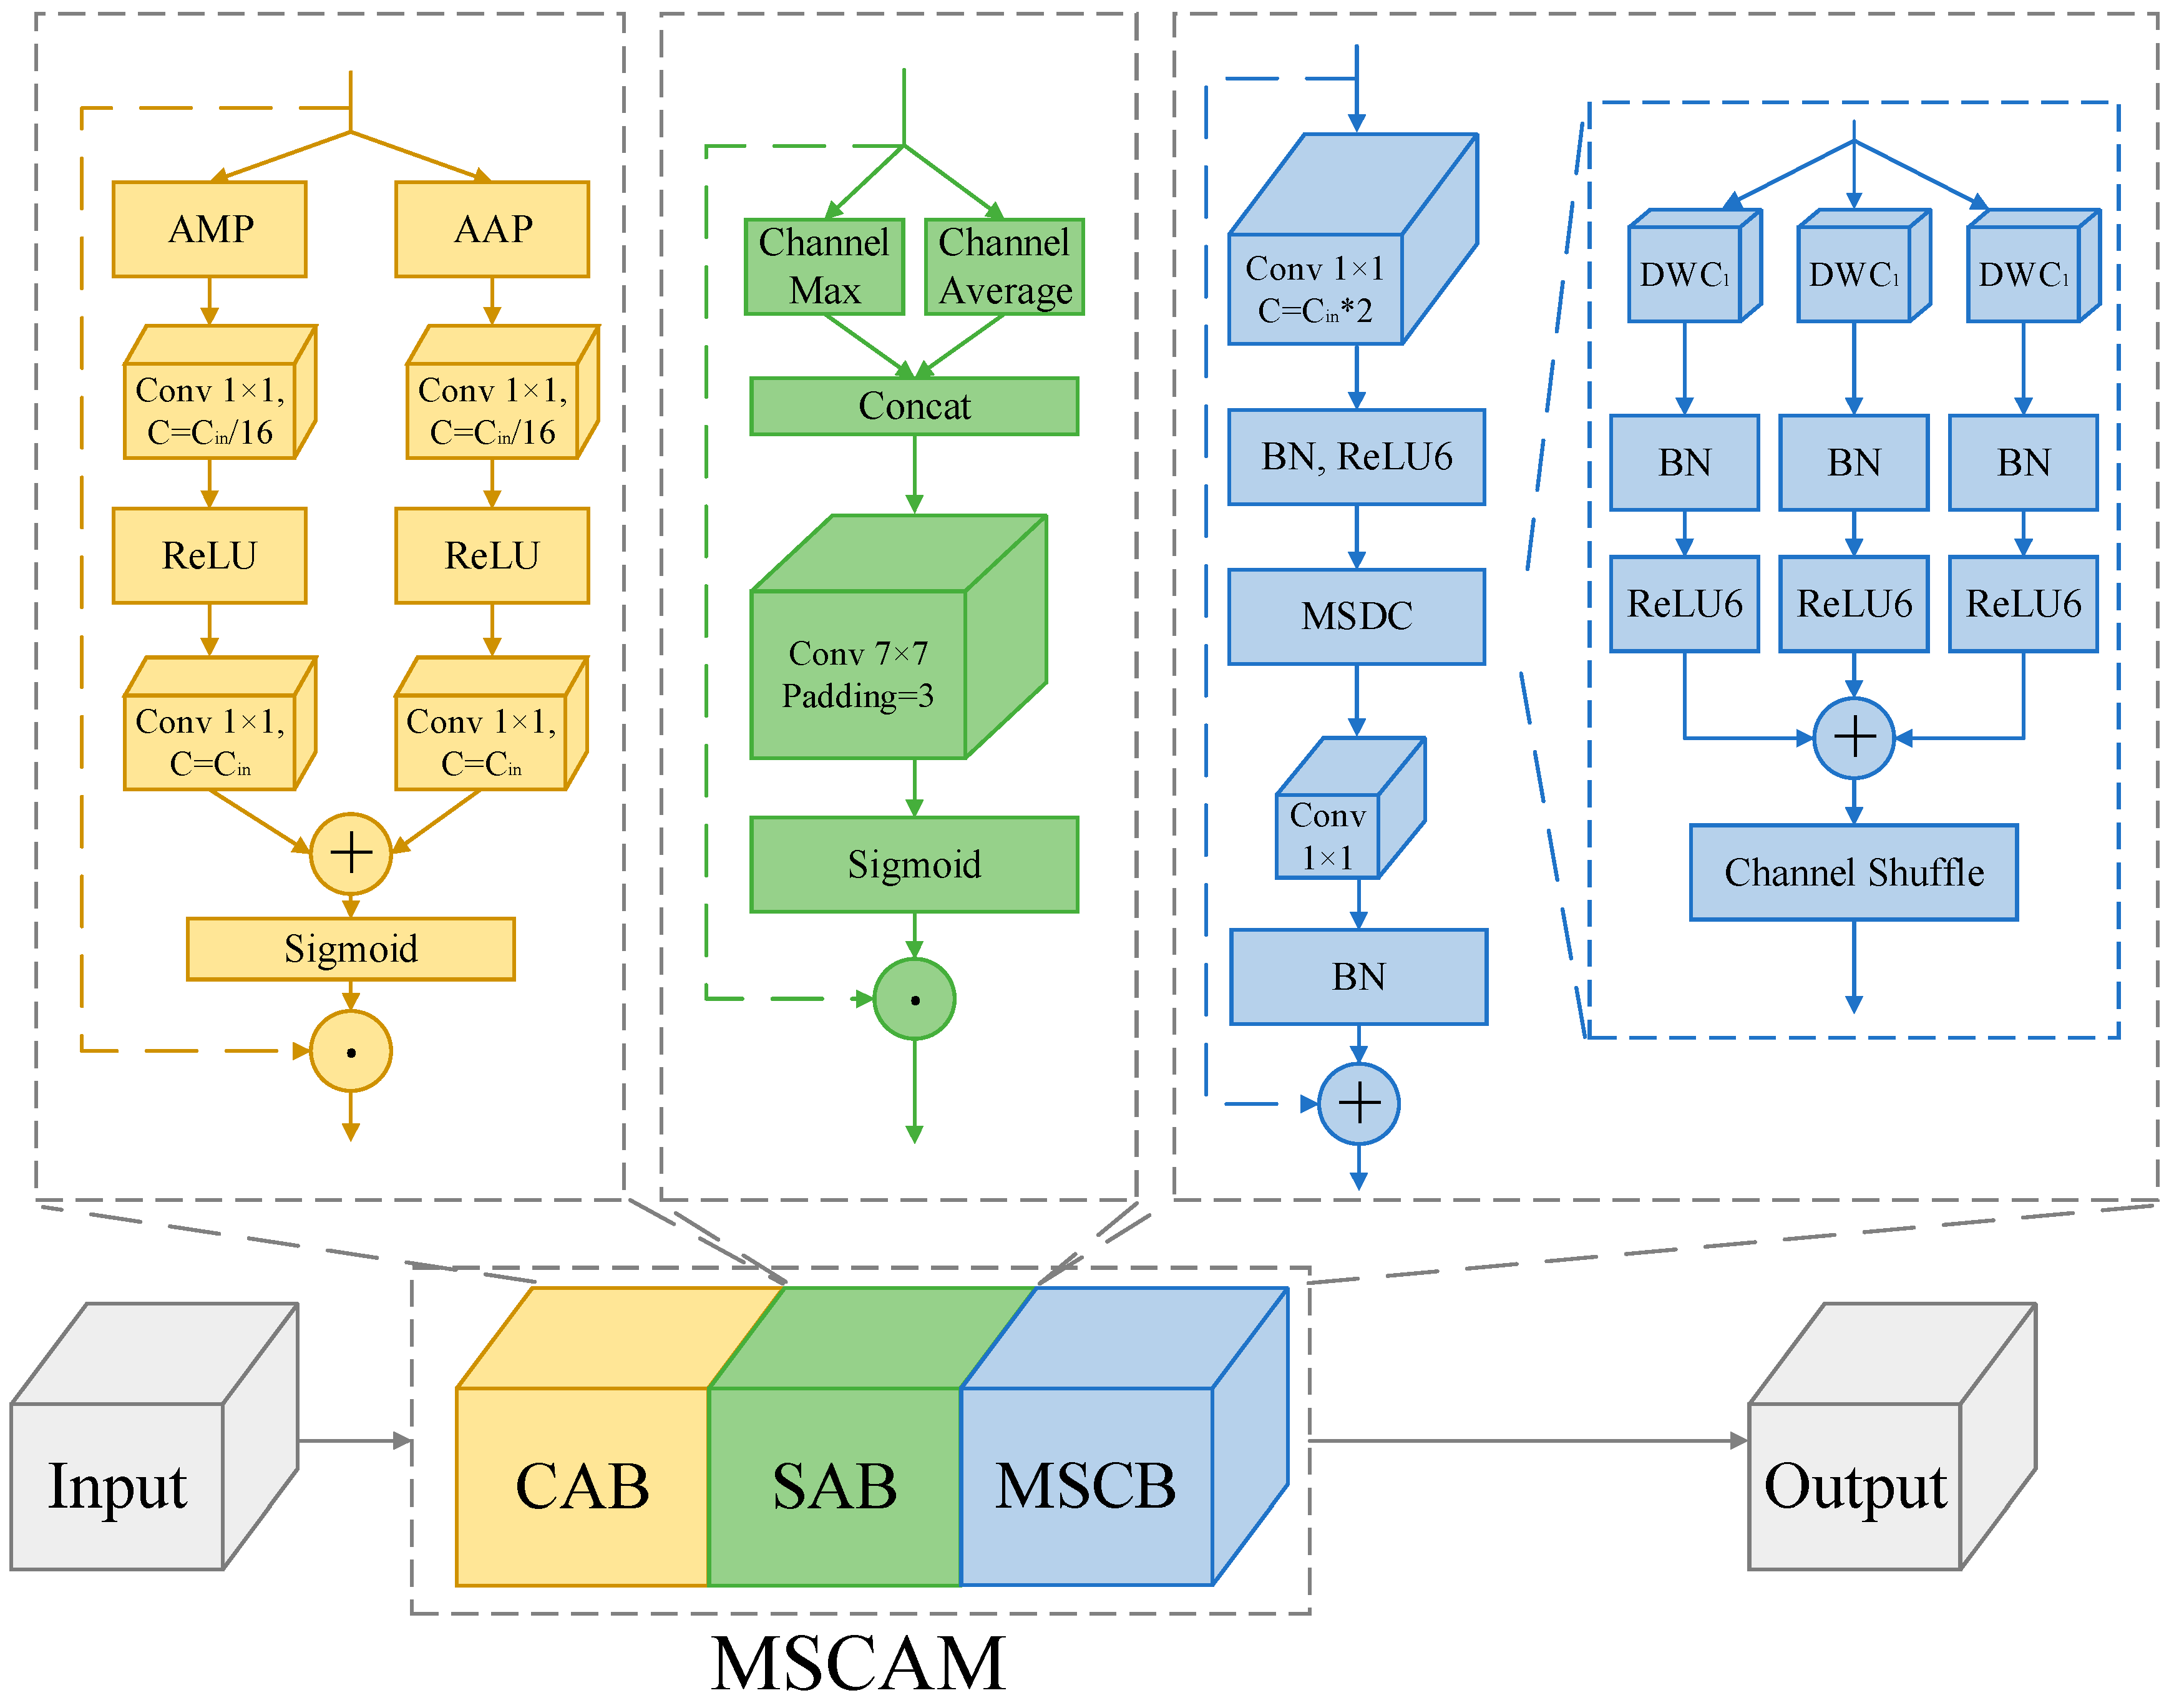
  • A multi-scale convolutional attention module (MSCAM) is integrated into the feature extraction phase, combining large receptive fields with channel and spatial attention mechanisms to enhance the recognition ability for defects of varying sizes, particularly small targets and narrow cracks.
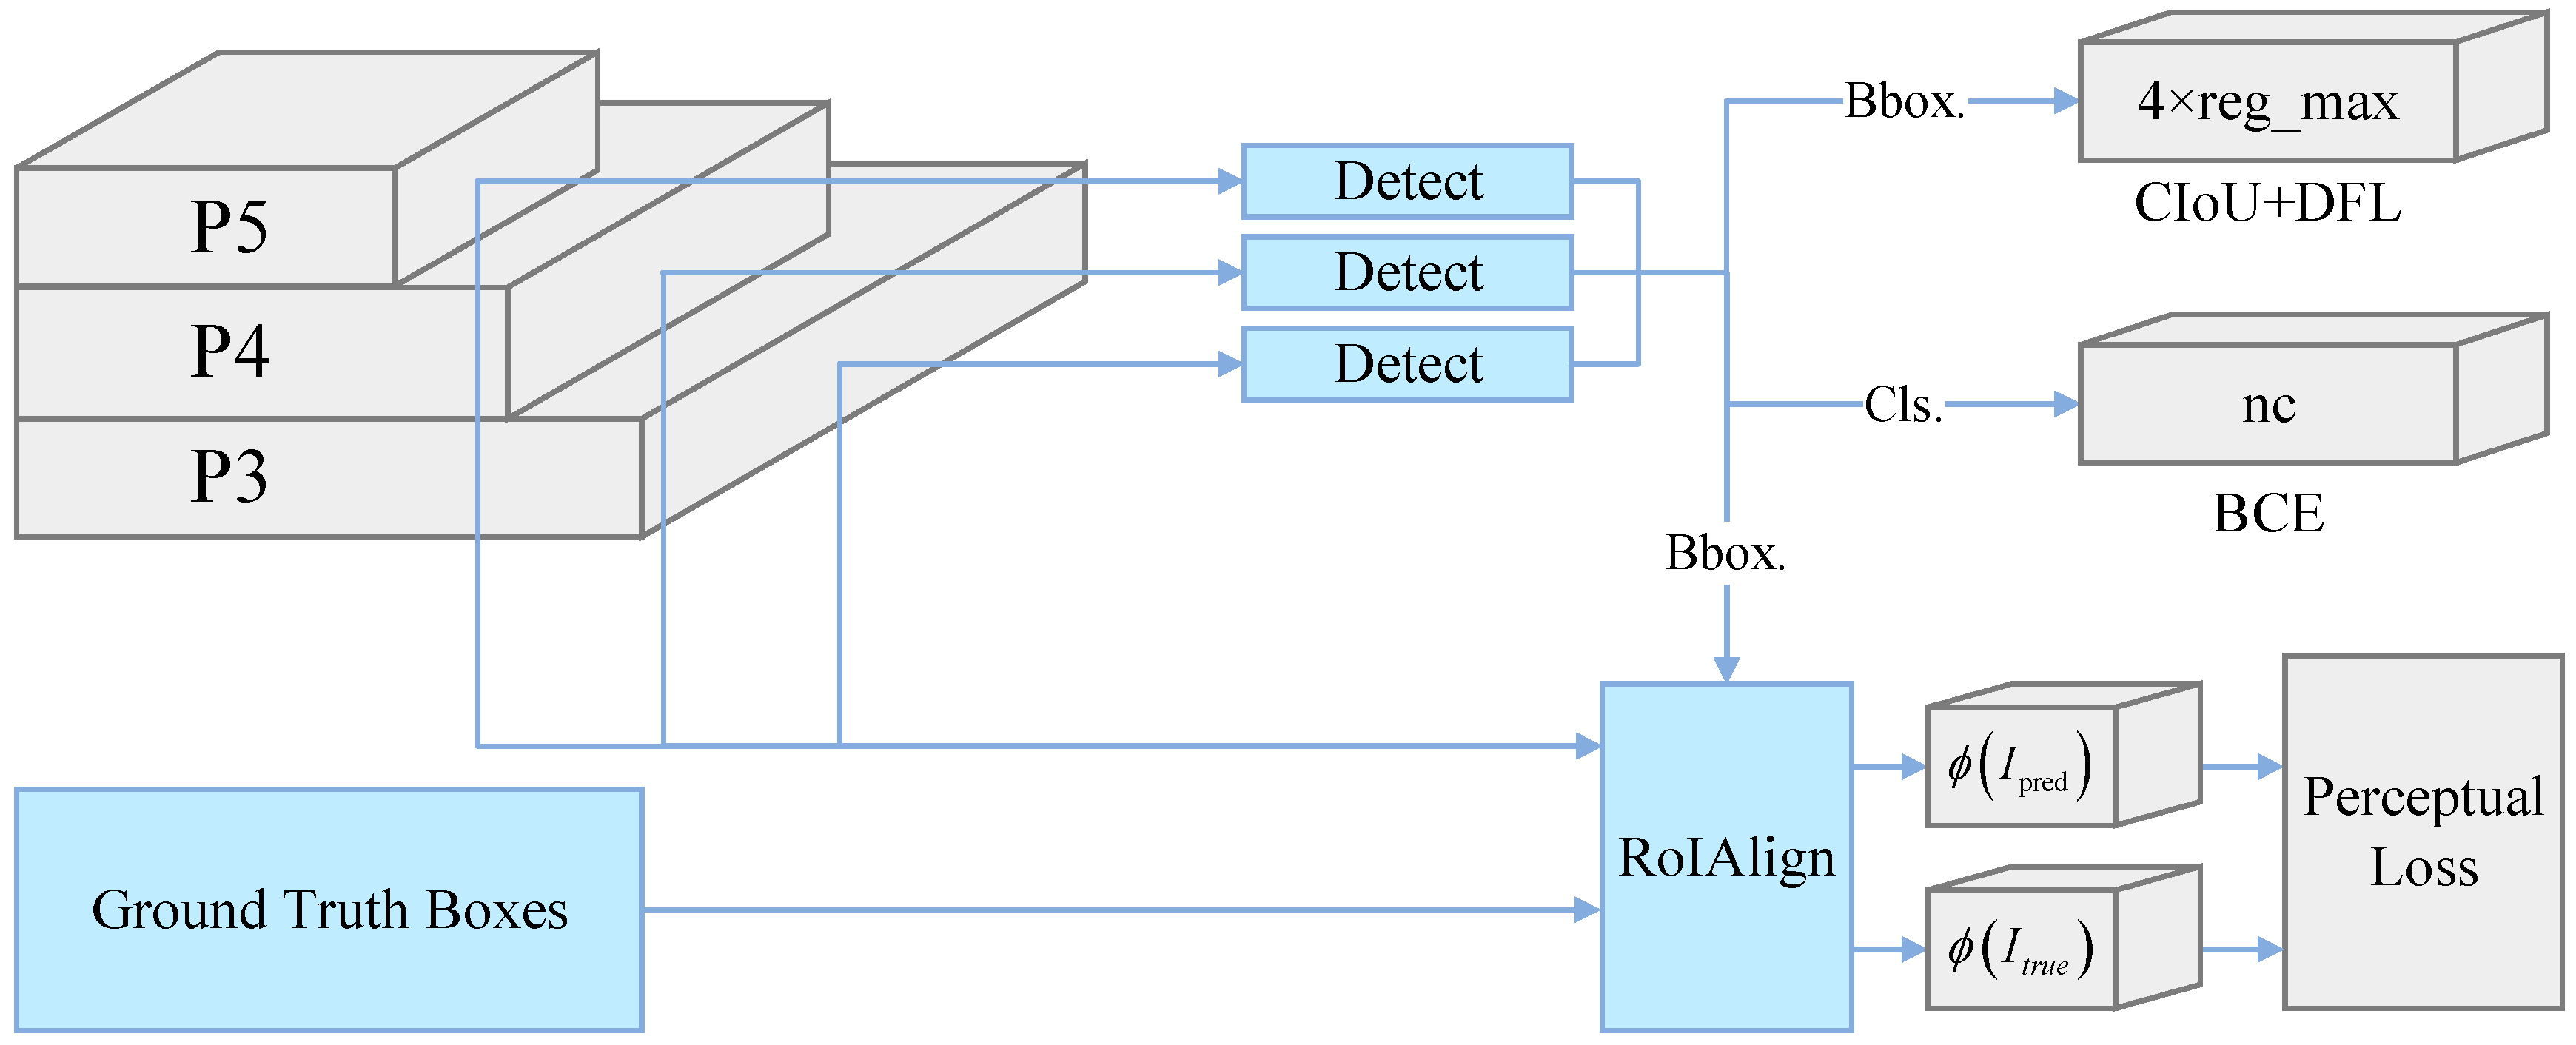
  • To address common challenges such as complex textures and noise on track surfaces, perceptual loss is incorporated into the YOLOv8 loss function, aligning detection targets in the deep feature space to further improve the model’s robustness in capturing and distinguishing fine defects.
These improvements enable the model to achieve more precise detection of various track defects while maintaining high inference speed, thereby meeting the online detection requirements for high-speed and heavy-load railway scenarios and providing robust technical support for the safe operation and maintenance of railways.

2. Related Work

2.1. Traditional Methods

In the early stages of railway defect detection, the process predominantly relied on manual inspection and basic non-destructive testing (NDT) techniques for periodic track evaluation. Manual inspections were typically conducted by maintenance personnel using visual observation or simple mechanical tools to inspect track surfaces. While intuitive, this method is inefficient and heavily influenced by subjective factors, making it unsuitable for long-distance or high-intensity track inspection scenarios. Consequently, researchers have explored various traditional NDT approaches to enhance automation and detection accuracy, with notable techniques including infrared thermography, eddy current testing, ultrasonic testing, and electromagnetic testing.
Infrared thermography detects defect locations and sizes based on the temperature distribution of the target surface, typically using passive or active heating methods. Tomita et al. [8] noted that IRT has shown promising results in layer-wise detection of buildings and infrastructure and has also provided valuable insights for detecting track surface delamination and cracks. Its advantages include large-area real-time coverage and non-contact detection. However, when defects are deep or temperature changes are minimal, signals are often affected by environmental factors such as humidity, wind speed, and ambient temperature, leading to unstable detection results.
Eddy current testing is an electromagnetic method that induces eddy currents on a metal surface using alternating current and identifies defects by measuring impedance changes in a sensor coil. Alvarenga et al. [9] developed an embedded system-based track defect detection and classification method using eddy currents, combining continuous wavelet transform with convolutional neural networks (CNNs) to automatically identify and classify welding defects, pits, and joints. Park et al. [10] further proposed a multi-channel eddy current detection algorithm that generates 2D and 3D defect images in real time, supporting field-based quantitative assessments. However, ECT is prone to signal distortion when applied to complex curved surfaces or high-speed testing, necessitating optimized sensor arrangements and data post-processing techniques to improve robustness.
Ultrasonic testing primarily detects internal or surface defects such as cracks and inclusions by emitting and receiving short pulse waves. Traditional contact-based ultrasonic testing requires the application of a coupling agent to the track surface, making it unsuitable for rapid or large-scale inspections. Abbas et al. [11] highlighted the advantages of ultrasonic guided wave (UGW) technology for detecting surface cracks in metal structures, noting its remote diagnostic capabilities and adaptability to complex structures, which is beneficial in fields such as railways and pipelines. Yunjie et al. [12] studied a laser ultrasonic-based track surface defect detection model, demonstrating the superior performance of high-frequency ultrasound in detecting small-scale cracks. Nonetheless, ultrasonic testing faces challenges in terms of coupling effectiveness, sensor placement, and detection speed when implemented on high-speed trains or large-scale tracks.
In addition to eddy current and ultrasonic methods, electromagnetic testing includes techniques such as direct current electromagnetic methods and flux leakage. Yuan et al. [13] utilized the interaction between DC magnetic fields and motion-induced eddy currents to quantify the depth of track cracks in high-speed electromagnetic NDT, using numerical simulations to determine optimal detection positions and enhance sensitivity. Similarly, De Melo et al. [14] and other researchers often combine mechanical and electromagnetic models in systematic evaluations of track degradation, offering a comprehensive approach to diagnosing track structures and their components. Moreover, some traditional methods employ technologies like lasers, radar, and manual calibration, though these are generally applied for localized or point-based inspections and are ill-suited for large-scale, real-time track monitoring.
Overall, traditional detection methods, through a “manual + equipment” combination, have partially met the safety requirements of conventional operational tracks. However, relying on manual inspections or single detection techniques is no longer adequate to keep pace with the rapid development of high-speed and heavy-load railways. These methods still exhibit significant shortcomings in detection efficiency, accuracy, and the identification of complex defects, necessitating the integration of emerging technologies such as computer vision and intelligent algorithms to achieve higher automation and greater robustness for online detection.

2.2. Computer Vision Methods

With the continuous improvement in image sensor and processor performance, computer-vision-based track surface defect detection methods have gradually emerged as a research hotspot. Compared to traditional manual inspections or single sensor detection techniques, computer vision approaches leverage high-definition cameras, drones, and structured light to capture comprehensive track surface information, followed by multi-stage or hierarchical algorithms for defect recognition and localization.
To address the diversity of track surface defects and complex background noise, Yu et al. [15] proposed a coarse-to-fine model (CTFM) that performs defect filtering and localization at the sub-image, region, and pixel levels, significantly reducing background interference and false detection rates. Similarly, Gan et al. [16] developed a layered extractor framework that first removes irrelevant regions with a coarse extractor, then focuses on defect features with a fine extractor, achieving high detection accuracy and speed across multiple public datasets and real-world scenarios. Zhang et al. [17] combined curvature filtering with an improved Gaussian mixture model to adaptively filter noise on track surfaces, achieving enhanced defect segmentation accuracy. A common feature of these multi-stage detection approaches is the combination of broad-range searching and local refinement, which effectively improves detection efficiency and precision.
With the rapid application of drone technology in traffic monitoring and engineering inspections, Wu et al. [18] explored the use of drones to capture track surface images, proposing the LWLC-GSME image enhancement and threshold segmentation method. Their core idea was to first correct uneven lighting using local Weber contrast (LWLC) and then apply gray-scale stretching maximum entropy (GSME) to segment defect regions, achieving high detection recall rates. These methods significantly expand the scope of track inspections and are suitable for rapid detection in mountainous areas, over rivers, or other regions that are difficult for human access. However, challenges remain in terms of drone flight time, GPS accuracy, and robustness under complex meteorological conditions.
In addition to 2D images, some scholars have focused on the three-dimensional morphology of track surfaces to more accurately quantify crack depth or shape. Cao et al. [19] proposed a 3D point cloud reconstruction method based on line-structured light, allowing high-precision measurements of track surfaces, followed by curve fitting models for dynamic online detection. Compared to traditional 2D images, 3D data help reduce the impact of surface texture differences or lighting variations. However, this method requires high hardware specifications and presents challenges in real-time processing of 3D point clouds, demanding more efficient algorithms.
Morphological operations and filters continue to play a significant role in the design of visual detection algorithms. Nieniewski [20] proposed a fast detection system based on morphological operations, extracting and matching track surface defect shapes using a multi-resolution morphological pyramid, balancing both detection speed and accuracy. Ni et al. [21] employed adaptive block segmentation based on boundary edge features, combined with an edge growth strategy, successfully addressing the interference caused by uneven lighting and complex backgrounds. Mandriota et al. [22] conducted studies on filter feature selection, comparing Gabor filters with discrete wavelets, finding that Gabor filters excel in waveform detection scenarios due to their superior time-frequency localization capabilities. Deutschl et al. [23] earlier proposed a spectral image differential method, differentiating light sources of different wavelengths to highlight surface cracks and delamination regions, effectively combining online and offline detection. Resendiz et al. [24] and other researchers have also explored signal processing techniques like frequency-domain analysis and texture filtering to enhance the robustness of track component detection.
Computer vision methods in track defect detection are rapidly evolving: from early single-stage morphological or filtering analyses to comprehensive algorithms based on multi-stage detection, 3D reconstruction, or drone-assisted techniques. These approaches offer high visualization, flexibility in recognizing diverse defects, and ease of integration with deep learning technologies. However, they also face challenges related to large-scale data collection, lighting and noise interference, real-time performance, and hardware costs. Striking a balance between high accuracy, speed, and applicability remains a key ongoing focus in the research of visual detection algorithms in track scenarios.

2.3. Deep Learning Methods

With the rapid advancements in deep learning for image recognition and object detection, an increasing number of researchers have applied convolutional neural networks (CNNs) and their derivatives to the task of track defect detection. These methods typically eliminate the need for manual feature design, instead relying on end-to-end training with vast amounts of data to automatically learn high-level features that exhibit strong discriminative power for defect identification. In practice, researchers often incorporate lightweight or multi-scale strategies to improve mainstream detection frameworks, such as YOLO, SSD, and Faster R-CNN, balancing the diversity of track defects with the need for real-time detection.
Masci et al. [25] achieved notable improvements in steel defect classification using a max-pooling convolutional neural network, laying both theoretical and practical foundations for subsequent CNN applications in track defect detection. Zheng et al. [26] proposed a two-stage detection framework based on deep convolutional networks for detecting defects on track surfaces and fasteners: initially, a fully convolutional network is employed to quickly identify candidate defect regions, followed by refinement using a residual network for precise classification and localization, achieving high accuracy in surface and fastener defect detection. Bai et al. [27], addressing the issue of excessive parameter count in the YOLOv4 model, integrated MobileNetv3 into the backbone network and employed depthwise separable convolutions, successfully reducing model size and improving inference speed. Additionally, their improved model demonstrated significant enhancement in railway surface defect detection accuracy. In a similar vein, Bai et al. [28] incorporated the Support Vector Data Description (SVDD) algorithm into Faster R-CNN to perform secondary classification of misaligned fasteners, effectively reducing detection errors caused by angular shifts, showcasing the powerful scalability of deep learning for fastener detection.
Within the YOLO series models, some researchers have focused on overcoming challenges such as detecting small target defects and suppressing complex backgrounds. Wang et al. [29] introduced the SPD-Conv module and the Focal-SIoU loss function into YOLOv8 to enhance the network’s ability to capture small defects on track surfaces, integrating a lightweight attention mechanism to ensure practicality. Teng et al. [30], addressing concrete crack detection, analyzed the compatibility of YOLOv2 with various CNN feature extractors, demonstrating that selecting the appropriate shallow or mid-layer network can significantly improve detection efficiency in data-limited scenarios. For industrial metal base defect detection, Liu et al. [31] proposed the YOLO-SO algorithm, which incorporated the Convolutional Block Attention Module (CBAM) and random paste-mosaic data augmentation, increasing sensitivity to small defects.
For the detection of critical components such as high-speed rail fasteners, Hu et al. [32] designed a defect detection model based on the improved YoLoX-Nano, utilizing coordinate attention (CA) mechanisms and adaptive spatial feature fusion (ASFF) to achieve precise localization and real-time detection of track fasteners. Additionally, Giben et al. [33] proposed a multi-task learning strategy from the perspectives of material classification and semantic segmentation, allowing simultaneous detection and segmentation of track regions, ballast, and fasteners, offering valuable insights for subsequent defect identification. Wei et al. [34] made improvements to the original YOLOv3 by introducing pruning and dense connections, constructing a lightweight model for multi-target track defect detection, which meets the demands of high-speed inspection.
In scenarios with complex noise, occluded targets, or severe background interference, researchers often leverage attention mechanisms or prior knowledge to enhance the network’s focus on defect regions. Zhang et al. [35] proposed PKAMNet, combining a prior knowledge transfer model with a coordinate attention module to achieve precise detection of high-voltage transmission line insulator faults; this approach can similarly be adapted to railway component detection to improve attention allocation and discrimination capabilities in complex environments. Zhang et al. [36] introduced image enhancement and BiFPN feature fusion in an improved YOLOX, further reducing missed and false detections through the NAM attention mechanism, demonstrating high detection stability across multiple experimental batches.
To provide more accurate descriptions of defect morphology or edge contours, some research has shifted towards instance segmentation or semantic segmentation networks. Wang et al. [37] utilized Mask R-CNN to perform multi-scale fusion of track surface defects and enhanced the region proposal network, improving defect localization and segmentation accuracy. This end-to-end instance segmentation approach is particularly advantageous for detecting curved cracks or irregular delamination. Another approach for detecting small or irregular targets involves further improving SSD or adding specific regularization and feature fusion, as demonstrated by Zhang et al. [38] in surface defect detection of rare-earth magnetic materials, offering valuable insights for track defect detection. Even prior to the large-scale application of deep learning, Wang et al. [39], Niu et al. [40], and Zhang et al. [41] explored track defect detection with limited samples, weak labels, and 3D stereo data, focusing on low-rank sparse representation, unsupervised saliency detection, and row-level annotations, respectively. Their common conclusion is that, even with constrained data, appropriate network structure optimization and feature fusion can still achieve high accuracy and robust detection performance.
While existing studies have demonstrated high detection accuracy and feasibility across various scenarios, there remain several challenges. Firstly, most deep models have a high dependency on the scale and diversity of data annotations, and they lack robustness in weakly labeled or data-limited environments. Moreover, when confronted with complex distributions, diverse defect types, and significant noise on track surfaces, maintaining high accuracy while ensuring real-time performance remains a major hurdle. To address these shortcomings, the PerMSCA-YOLO model proposed in this study introduces perceptual loss in conjunction with multi-scale feature extraction and attention mechanisms, enhancing deep feature alignment, thereby enabling more efficient and accurate defect recognition in resource-constrained and complex track defect detection tasks.

3. Methodology

3.1. Overall Architecture of PerMSCA-YOLO

In this study, PerMSCA-YOLO is built upon the YOLOv8 framework [42] and designed to meet the requirements of multi-scale defect detection on track surfaces. It establishes a progressive three-tiered system that balances high accuracy with real-time performance: feature extraction, feature fusion, and object detection. The overall workflow, as shown in Figure 1, comprises the following key stages: First, the input image undergoes adaptive pyramid scaling for multi-resolution normalization. Then, the lightweight FasterNet backbone extracts multi-level features in a layer-wise manner, generating a hierarchical representation ranging from shallow textures to deep semantics. Following this, the Multi-Scale Convolutional Attention Module (MSCAM) integrates channel attention, spatial attention, and parallel convolutions to highlight defects of varying sizes, such as cracks and corrosion patches, while suppressing interference. Finally, the enhanced features are mapped to candidate bounding boxes and classification channels through the detection head, and perceptual loss is applied to align the texture of the target region, further enhancing the model’s ability to differentiate small targets and defects in complex backgrounds.
Unlike traditional YOLO-based models, PerMSCA-YOLO emphasizes lightweight design and multi-scale interaction at each stage. The FasterNet backbone optimizes operators to reduce redundant computations, ensuring real-time performance in resource-constrained environments. MSCAM employs attention reconstruction and parallel multi-core convolutions to effectively capture narrow cracks and diverse defects. Perceptual loss plays a crucial role in deep feature alignment, preventing performance degradation due to missed or false detections. Through the synergy of these three components, PerMSCA-YOLO significantly enhances both defect localization and classification on complex track surfaces, while maintaining high detection speed.

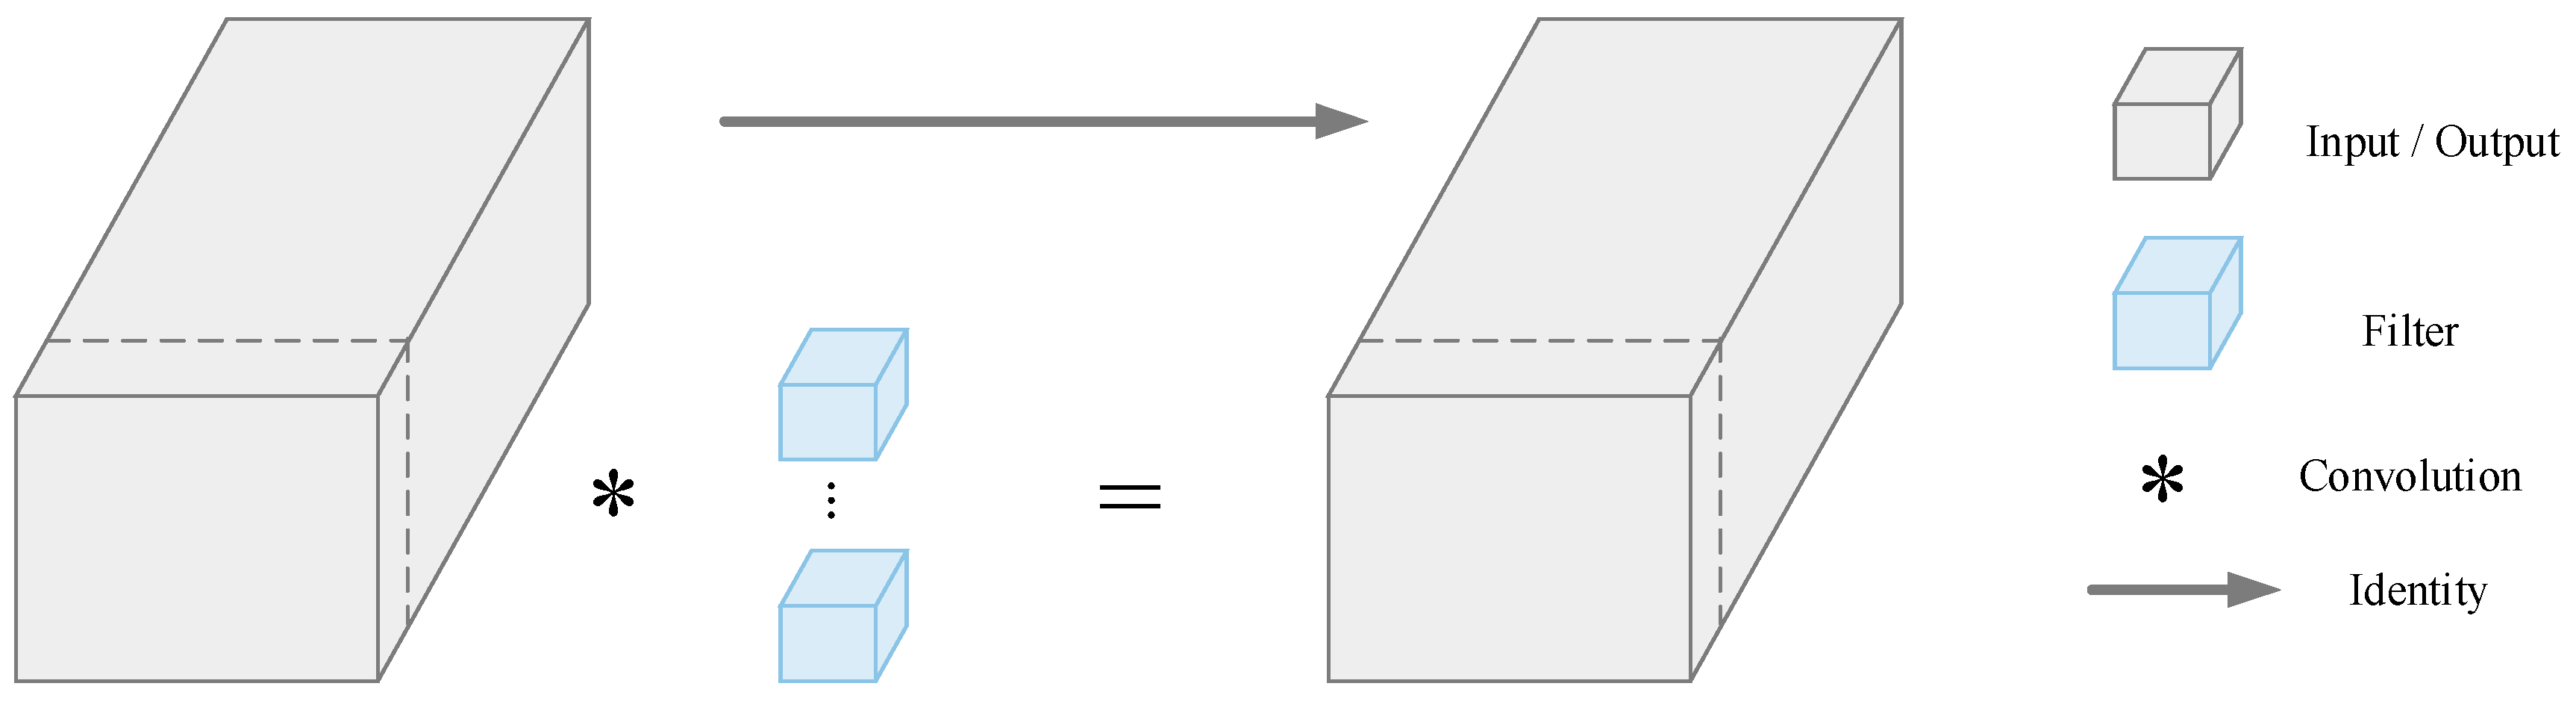
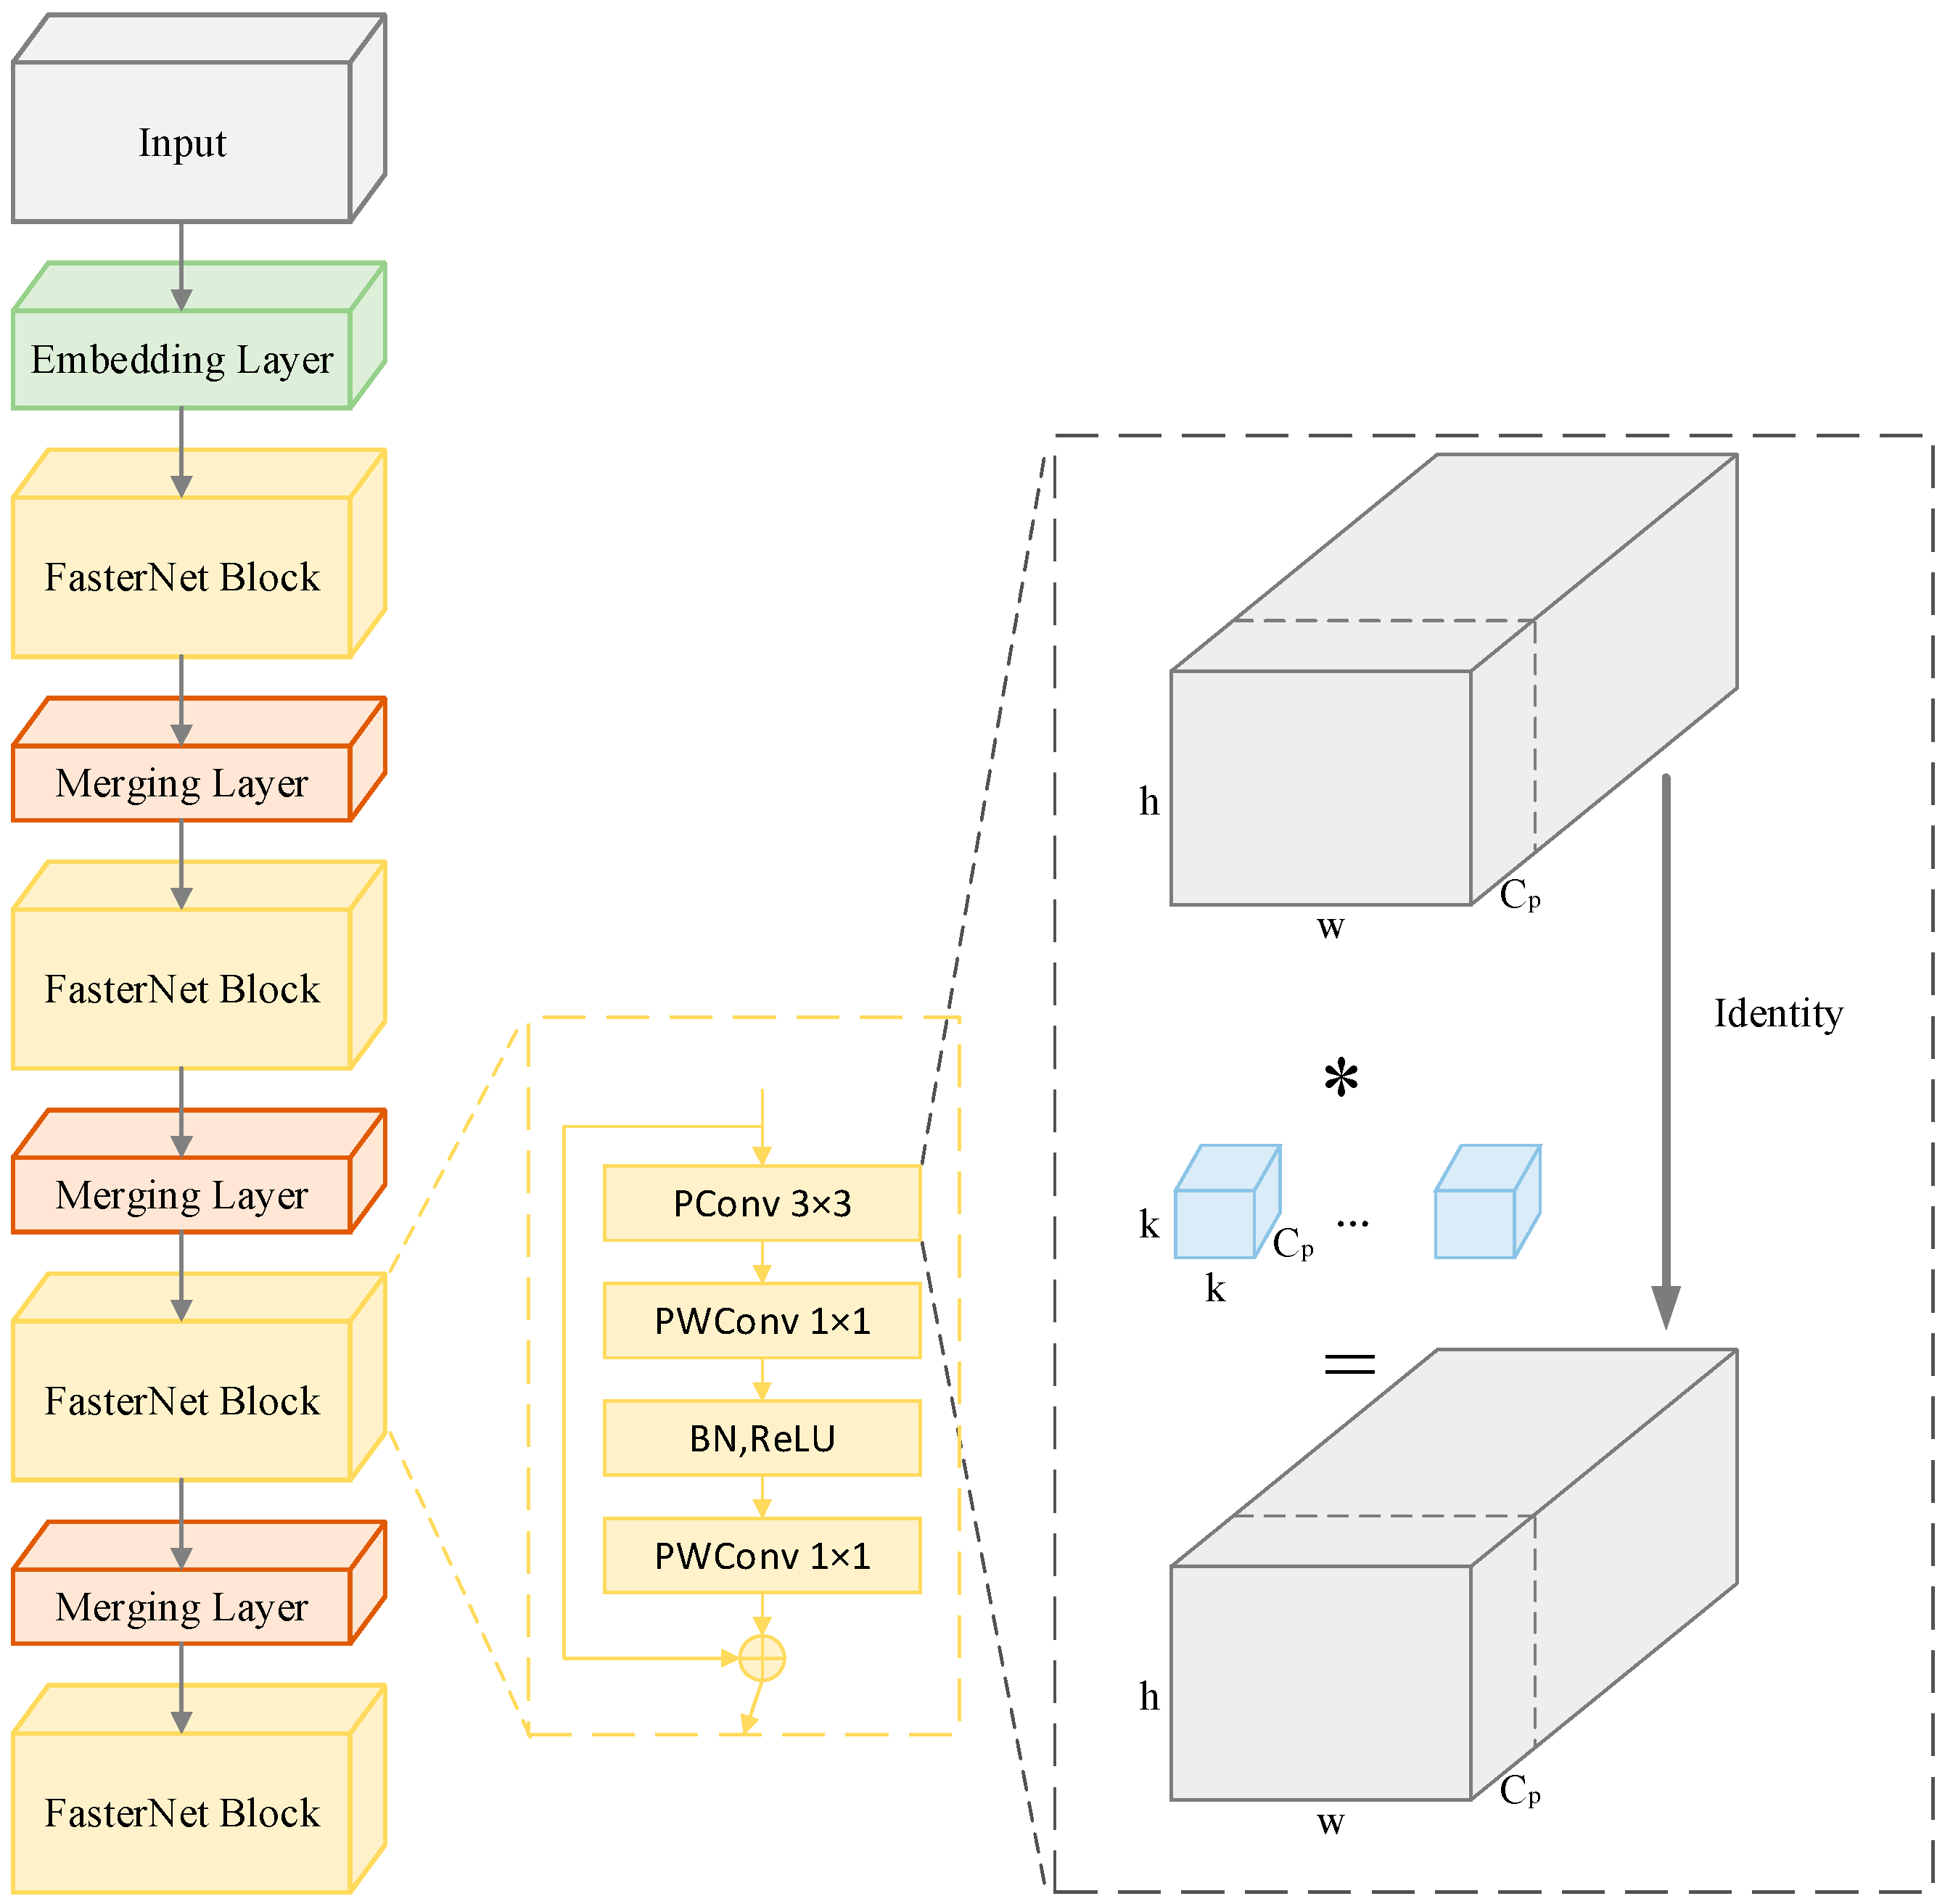
3.2. FasterNet Backbone

In the design of rail defect detection models, both the efficiency of feature extraction and the capacity for multi-scale representation in the backbone network profoundly influence the system’s real-time performance and robustness. This work adopts FasterNet—optimized via a coordinated use of Partial Convolution (PConv) and Pointwise Convolution (PWConv)—as the backbone. The core principle hinges on systematically optimizing operators and hierarchically aggregating features to balance efficient computation and high-discriminability feature expression under constrained computational resources.
PConv selectively applies standard convolutions to a subset of input channels, thereby significantly reducing computational redundancy and memory access. More concretely, only a small set of consecutive channels is processed spatially, while other channels remain identity-mapped. This strategy preserves global feature integrity while cutting FLOPs for conventional convolution and mitigating I/O bandwidth limitations. Figure 2 illustrates the PConv module structure.
To further integrate channel information, the local features produced by PConv undergo PWConv for global channel interaction. By exploiting the linear combination property of a 1 × 1 convolution kernel, PWConv dynamically fuses spatial features extracted by PConv with channels skipped during convolution, generating composite representations that unite spatially focused and channel-complete attributes. This mechanism offsets any feature loss introduced by partial convolution, while parameter sharing markedly decreases the complexity of traditional “T”-shaped convolutions, enhancing both computational efficiency and representational strength. Figure 3 depicts the comparison between the PConv + PWConv approach and the conventional T-shaped convolution.
FasterNet’s overall structure comprises multiple FasterNet Blocks, each containing one PConv layer and two PWConv layers to form a “T”-type convolution arrangement, as shown in Figure 4.
The architecture leverages a hierarchical design, employing an Embedding Layer (a 4 × 4 convolution with stride 4) and a Merging Layer (a 2 × 2 convolution with stride 2) to sequentially downsample spatial dimensions while expanding channels, producing a four-stage feature pyramid. Within each stage, multiple FasterNet Blocks are stacked, with each block forming an inverted residual structure with one PConv layer and dual PWConv layers. The middle layer broadens channels to augment nonlinearity, while identity shortcuts ensure stable gradient propagation. Batch normalization (BN) and ReLU activation function only act on intermediate PWConv layers, thus preventing excessive normalization from undermining feature diversity and allowing for fused BN–convolution operations that accelerate inference. Notably, the final two stages receive additional compute resources based on empirical findings indicating that deeper layers, having reduced spatial dimensions, feature lower memory access density and can thus accommodate denser computation at higher FLOPs.
Integrating FasterNet into PerMSCA-YOLO delivers two primary advantages: first, the PConv-PWConv synergy substantially reduces inference latency without compromising feature discriminability, providing a feasible hardware deployment path for real-time rail defect detection; second, its hierarchical multi-scale extraction seamlessly complements the subsequent Multi-Scale Convolutional Attention Module (MSCAM), reinforcing the model’s capacity to capture elongated cracks and fine spalling defects. From a computational complexity theory perspective, FasterNet’s refinements can be seen as a profound restructuring of the neural network’s computational graph. By eliminating unnecessary memory accesses and compressing redundant operators, FasterNet realizes a more efficient tensor dataflow within the computation graph. This not only aligns with contemporary processor architectures’ reliance on memory locality but also offers a theoretical blueprint for synergistic optimization between models and hardware in edge computing scenarios.

3.3. Multi-Scale Convolutional Attention Module

The Multi-Scale Convolutional Attention Module (MSCAM) significantly augments the model’s ability to identify complex defects on railway surfaces by synergizing channel attention, spatial attention, and multi-scale convolution. As illustrated in Figure 5, MSCAM sequentially chains a Channel Attention Block (CAB), a Spatial Attention Block (SAB), and a Multi-Scale Convolution Block (MSCB) to adaptively highlight informative feature map regions while suppressing background interference.
Given an input feature map F in R C × H × W , the data first enter the channel attention block. Through adaptive max pooling P max and average pooling P avg , channel-level descriptors are formed and subsequently compressed and restored via two 1 × 1 convolutions, ultimately producing the channel weight map A c R C × 1 × 1 . The calculation of A c is shown in Equation (1):
A c = σ Conv 1 × 1 ReLU Conv 1 × 1 P max F i + Conv 1 × 1 ReLU Conv 1 × 1 P avg F in
where σ denotes the Sigmoid activation and Conv 1 × 1 is the 1 × 1 convolution operator. Channel weights A c are then multiplied across F in channel by channel, resulting in F C A B = A c F in , thereby accentuating channels critical for detecting subtle cracks and corrosion deposits.
Subsequently, the feature map F C A B moves through the spatial attention block, where maximum pooling C max and average pooling C avg are performed along the channel dimension. These single-channel spatial descriptors are concatenated and convolved with a 7 × 7 kernel to capture extended spatial dependencies, yielding the spatial weight A s R 1 × H × W . The calculation of A s is shown in Equation (2):
A s = σ Conv 7 × 7 Concat C max F C A B , C avg F C A B
This weight map is multiplied pixel-wise with F C A B , producing F S A B = A s F CAB . The wide receptive field of the 7 × 7 convolution effectively captures elongated crack edges and attenuates noise arising from uneven illumination or rusted surfaces.
Finally, the Multi-Scale Convolution Block (MSCB) applies parallel depthwise separable convolutions at 1 × 1, 3 × 3, and 5 × 5 scales to extract both local details and broader context. The resulting feature maps F 1 , F 2 , F 3 undergo a channel shuffle operation to facilitate cross-group information exchange, followed by a 1 × 1 convolution for fusion and a residual connection to the input. The final output F MSCB is computed as shown in Equation (3):
F MSCB = B N Conv 1 × 1 Shuffle Concat F 1 , F 2 , F 3 + F S A B
where BN denotes batch normalization and Shuffle represents the channel shuffle process. This design yields robust representations of both micro-level cracks and extensive spalling without imposing significant computational overhead.
By integrating three complementary attention mechanisms—channel, spatial, and multi-scale—MSCAM suppresses irrelevant background noise while enhancing multi-resolution defect features. The CAB filters salient channels, the SAB emphasizes pivotal spatial regions, and the MSCB captures both localized and global contexts through parallel convolutions. Together, these modules maintain high computational efficiency and greatly improve robustness in detecting elongated cracks, corroded segments, or spalling damage on rail surfaces. Compared to conventional single-kernel or single-attention strategies, MSCAM sustains strong discriminative power and stability amid complex textures and background clutter, thus providing a solid foundation for reliable defect detection.

3.4. Loss Function Design

In rail defect detection, the primary loss function in YOLOv8 comprises classification and bounding-box regression objectives, optimizing both category discrimination and positional accuracy for defect targets. Given the stringent localization requirements for small defects (such as pit corrosion and micro-cracks) on rail surfaces, this study augments the original YOLOv8 loss with a perceptual loss component to heighten the model’s attention to fine-grained texture details in defect regions.
To enhance the precision of class predictions, YOLOv8 leverages Binary Cross Entropy (BCE) to measure the divergence between the predicted class distribution and ground-truth labels. In the simplest binary detection scenario “defect or non-defect”, a probability p i is assigned to each target and compared to its corresponding label y i { 0,1 } . Let N represent the number of samples, and σ · be the Sigmoid function; the classification loss is calculated by Equation (4):
L cls = 1 N i = 1 N y i log σ ( p i ) + 1 y i log 1 σ ( p i )
In real-world rail inspections, diverse defect types may co-occur within the same region, forming a multi-class or multi-label setting. Typically, YOLOv8 computes the BCE for each output channel representing a specific defect class, summing or averaging these to yield a final classification loss. If K classes of defects exist and each target is associated with a K-length probability vector { p i , 1 , p i , 2 , p i , K } , then the classification loss is expressed in Equation (5):
L c l s m u l t i c l a s s = 1 N × K i = 1 N k = 1 K y i , k log σ ( p i , k ) + 1 y i , k log 1 σ ( p i , k )
where y i , k = 1 indicates that the ii-th target belongs to the k-th defect category, and y i , k = 0 otherwise.
For bounding-box regression, YOLOv8 employs the Complete IoU (CIoU) loss and Distribution Focal Loss (DFL) to optimize overlap and shape alignment between predicted boxes and ground truth. CIoU takes into account the Intersection over Union (IoU), center distance, and aspect ratio discrepancies. Let ρ 2 b , b g t be the squared Euclidean distance between predicted and ground-truth centers, and c the diagonal of the smallest enclosing region covering both boxes. Denote v as the measure of aspect ratio consistency; α the balancing coefficient; and (w, h), ( w g t t, h g t ) the predicted and ground-truth box dimensions, respectively. CIoU loss is formulated in Equations (6) and (7):
L CIoU = 1 I o U + ρ 2 b , b g t c 2 + α v
α = v 1 IoU + v , v = 4 π 2 arctan w g t h g t arctan w h 2
Meanwhile, DFL introduces a probabilistic model between predicted and actual coordinate values, improving regression precision. Let y lie between two adjacent discrete points y i and y i + 1 , with corresponding predicted probabilities S i and S i + 1 . The DFL loss function is given by Equation (8):
L DFL = i = 0 n 1 y i + 1 y log S i + y y i log S i + 1
where n is the number of discrete points, y [ y i , y i + 1 ] denotes the ground-truth coordinate interval, and S 0 , S 1 ,     , S n is the model-predicted coordinate distribution. Compared with regressing a single coordinate value, DFL enables a smoother approximation of the true value. This approach particularly benefits small or subtly distinct defects, as it incrementally aligns the predicted coordinate with the actual one by weighting the two nearest discrete points.
By default, YOLOv8’s total loss combines these sub-losses with respective weights, as shown in Equation (9):
L YOLOv 8 = λ cls L cls + λ box L CIoU + λ DFL L DFL
where λ cls , λ box , and λ DFL are the weights for classification, CIoU, and DFL losses, respectively. By default, λ cls = 0.5, λ box = 7.5, and λ DFL = 1.5.
Conventional pixel- or boundary-level losses often struggle to adequately constrain the network’s focus on the intricate textures and boundaries of small defects, especially under noise from oil or rust. In response, this paper integrates a perceptual loss term to enhance the network’s attention to subtle texture details within defect regions by aligning predicted and ground-truth bounding boxes in high-level feature space.
The implementation employs Region of Interest Align (RoIAlign) to accurately sample the feature regions corresponding to predicted and ground-truth boxes on the backbone’s deep feature maps. Bilinear interpolation removes quantization artifacts and maps floating-point coordinates onto a uniform grid of aligned feature patches, preserving the fragile edges and textures of defects. Let ϕ I pred and ϕ I true denote the high-level feature representations of the predicted and ground-truth boxes post-RoIAlign, respectively. The perceptual loss is calculated in Equation (10):
L perceptual = 1 W H x = 1 W y = 1 H ϕ I true x , y ϕ I pred x , y 2 2
where W and H are the widths and heights of the extracted feature patches, and ϕ represents the backbone’s deep feature mapping function. By compelling the network to maintain consistency in the semantic structure within defect regions—rather than merely relying on pixel- or geometry-level similarity—this perceptual loss bolsters the detection of small, ambiguous boundaries.
Incorporating this perceptual loss term into YOLOv8’s overall objective (Equation (11)) establishes a joint training target:
L total = L YOLOv 8 + λ perc L perceptual  
where the hyperparameter λ perc controls the balance between the detection and feature alignment tasks. The architecture implementing perceptual loss is illustrated in Figure 6.
By compensating for the shortcomings of pixel- and boundary-level losses regarding detail preservation, perceptual loss maintains superior texture and shape consistency in smaller defect areas. Because it focuses on the divergence of high-level features, the network becomes more attuned to internal textures and edges, enhancing accuracy in complex or multi-defect scenarios. While rail surfaces often exhibit non-defect noise, the perceptual loss guides the model to ignore extraneous interference, yielding greater robustness for various defect types, including cracks, spalling, and corrosion.

4. Experiments

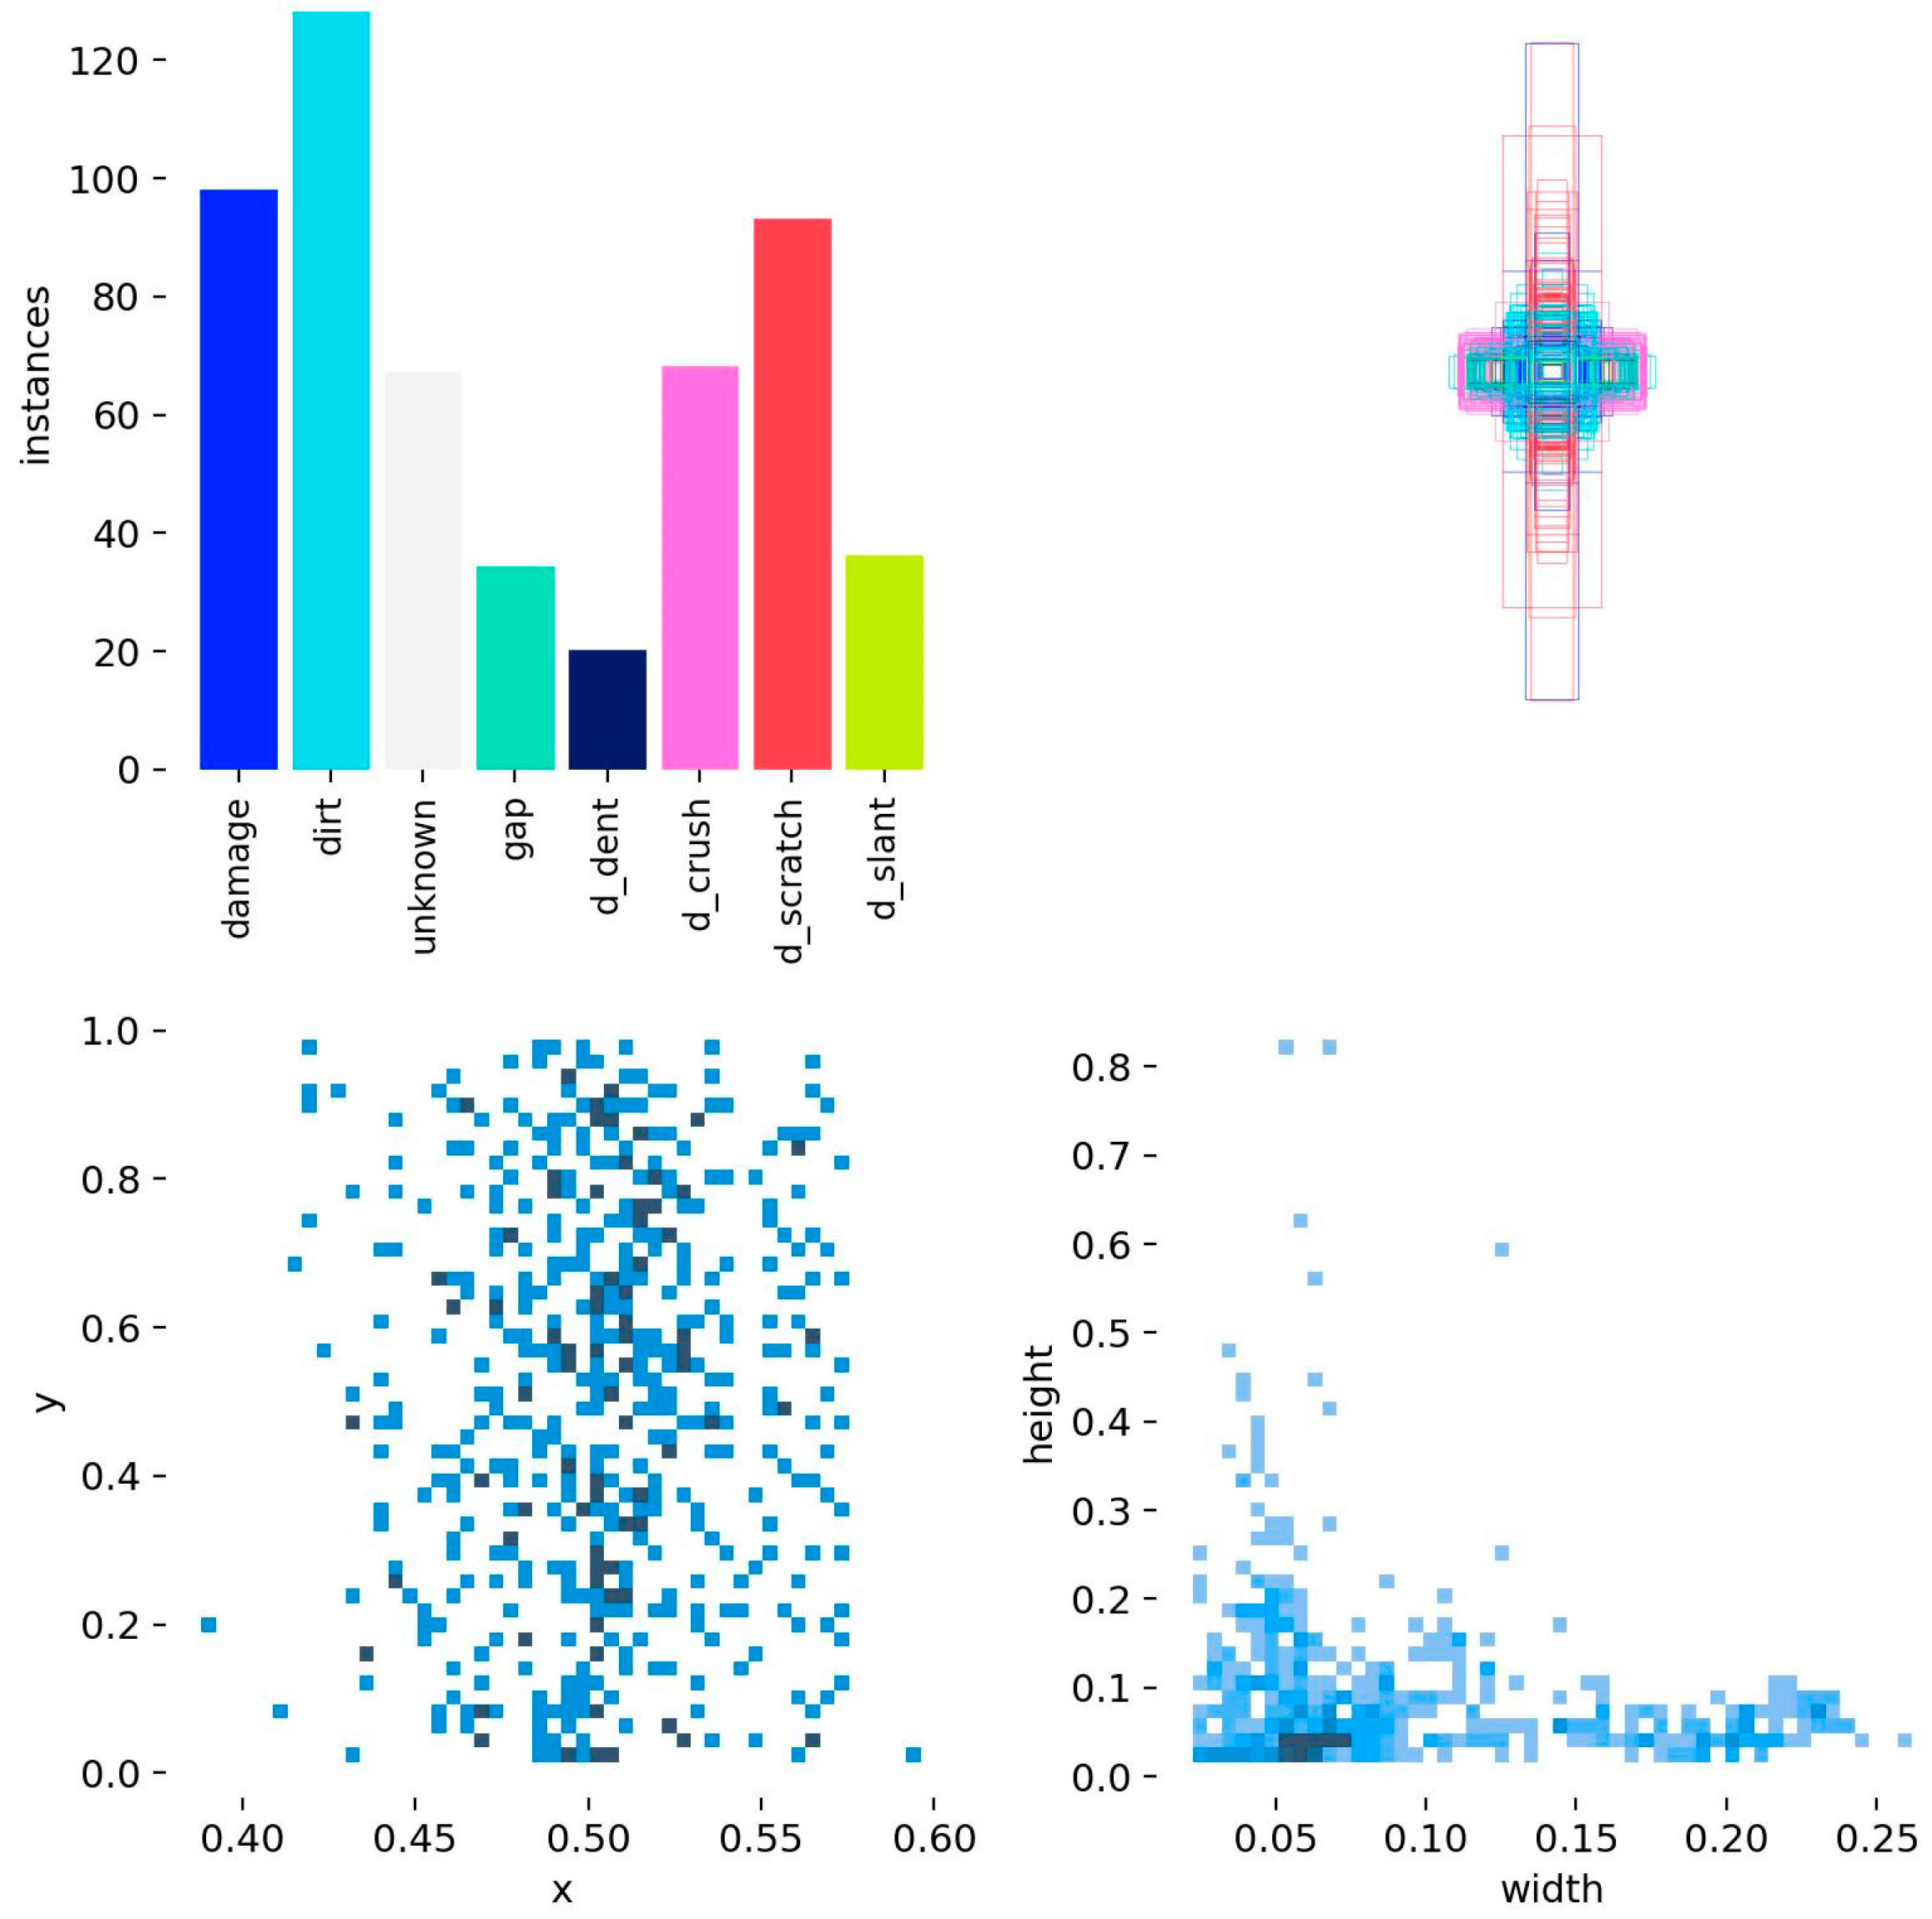
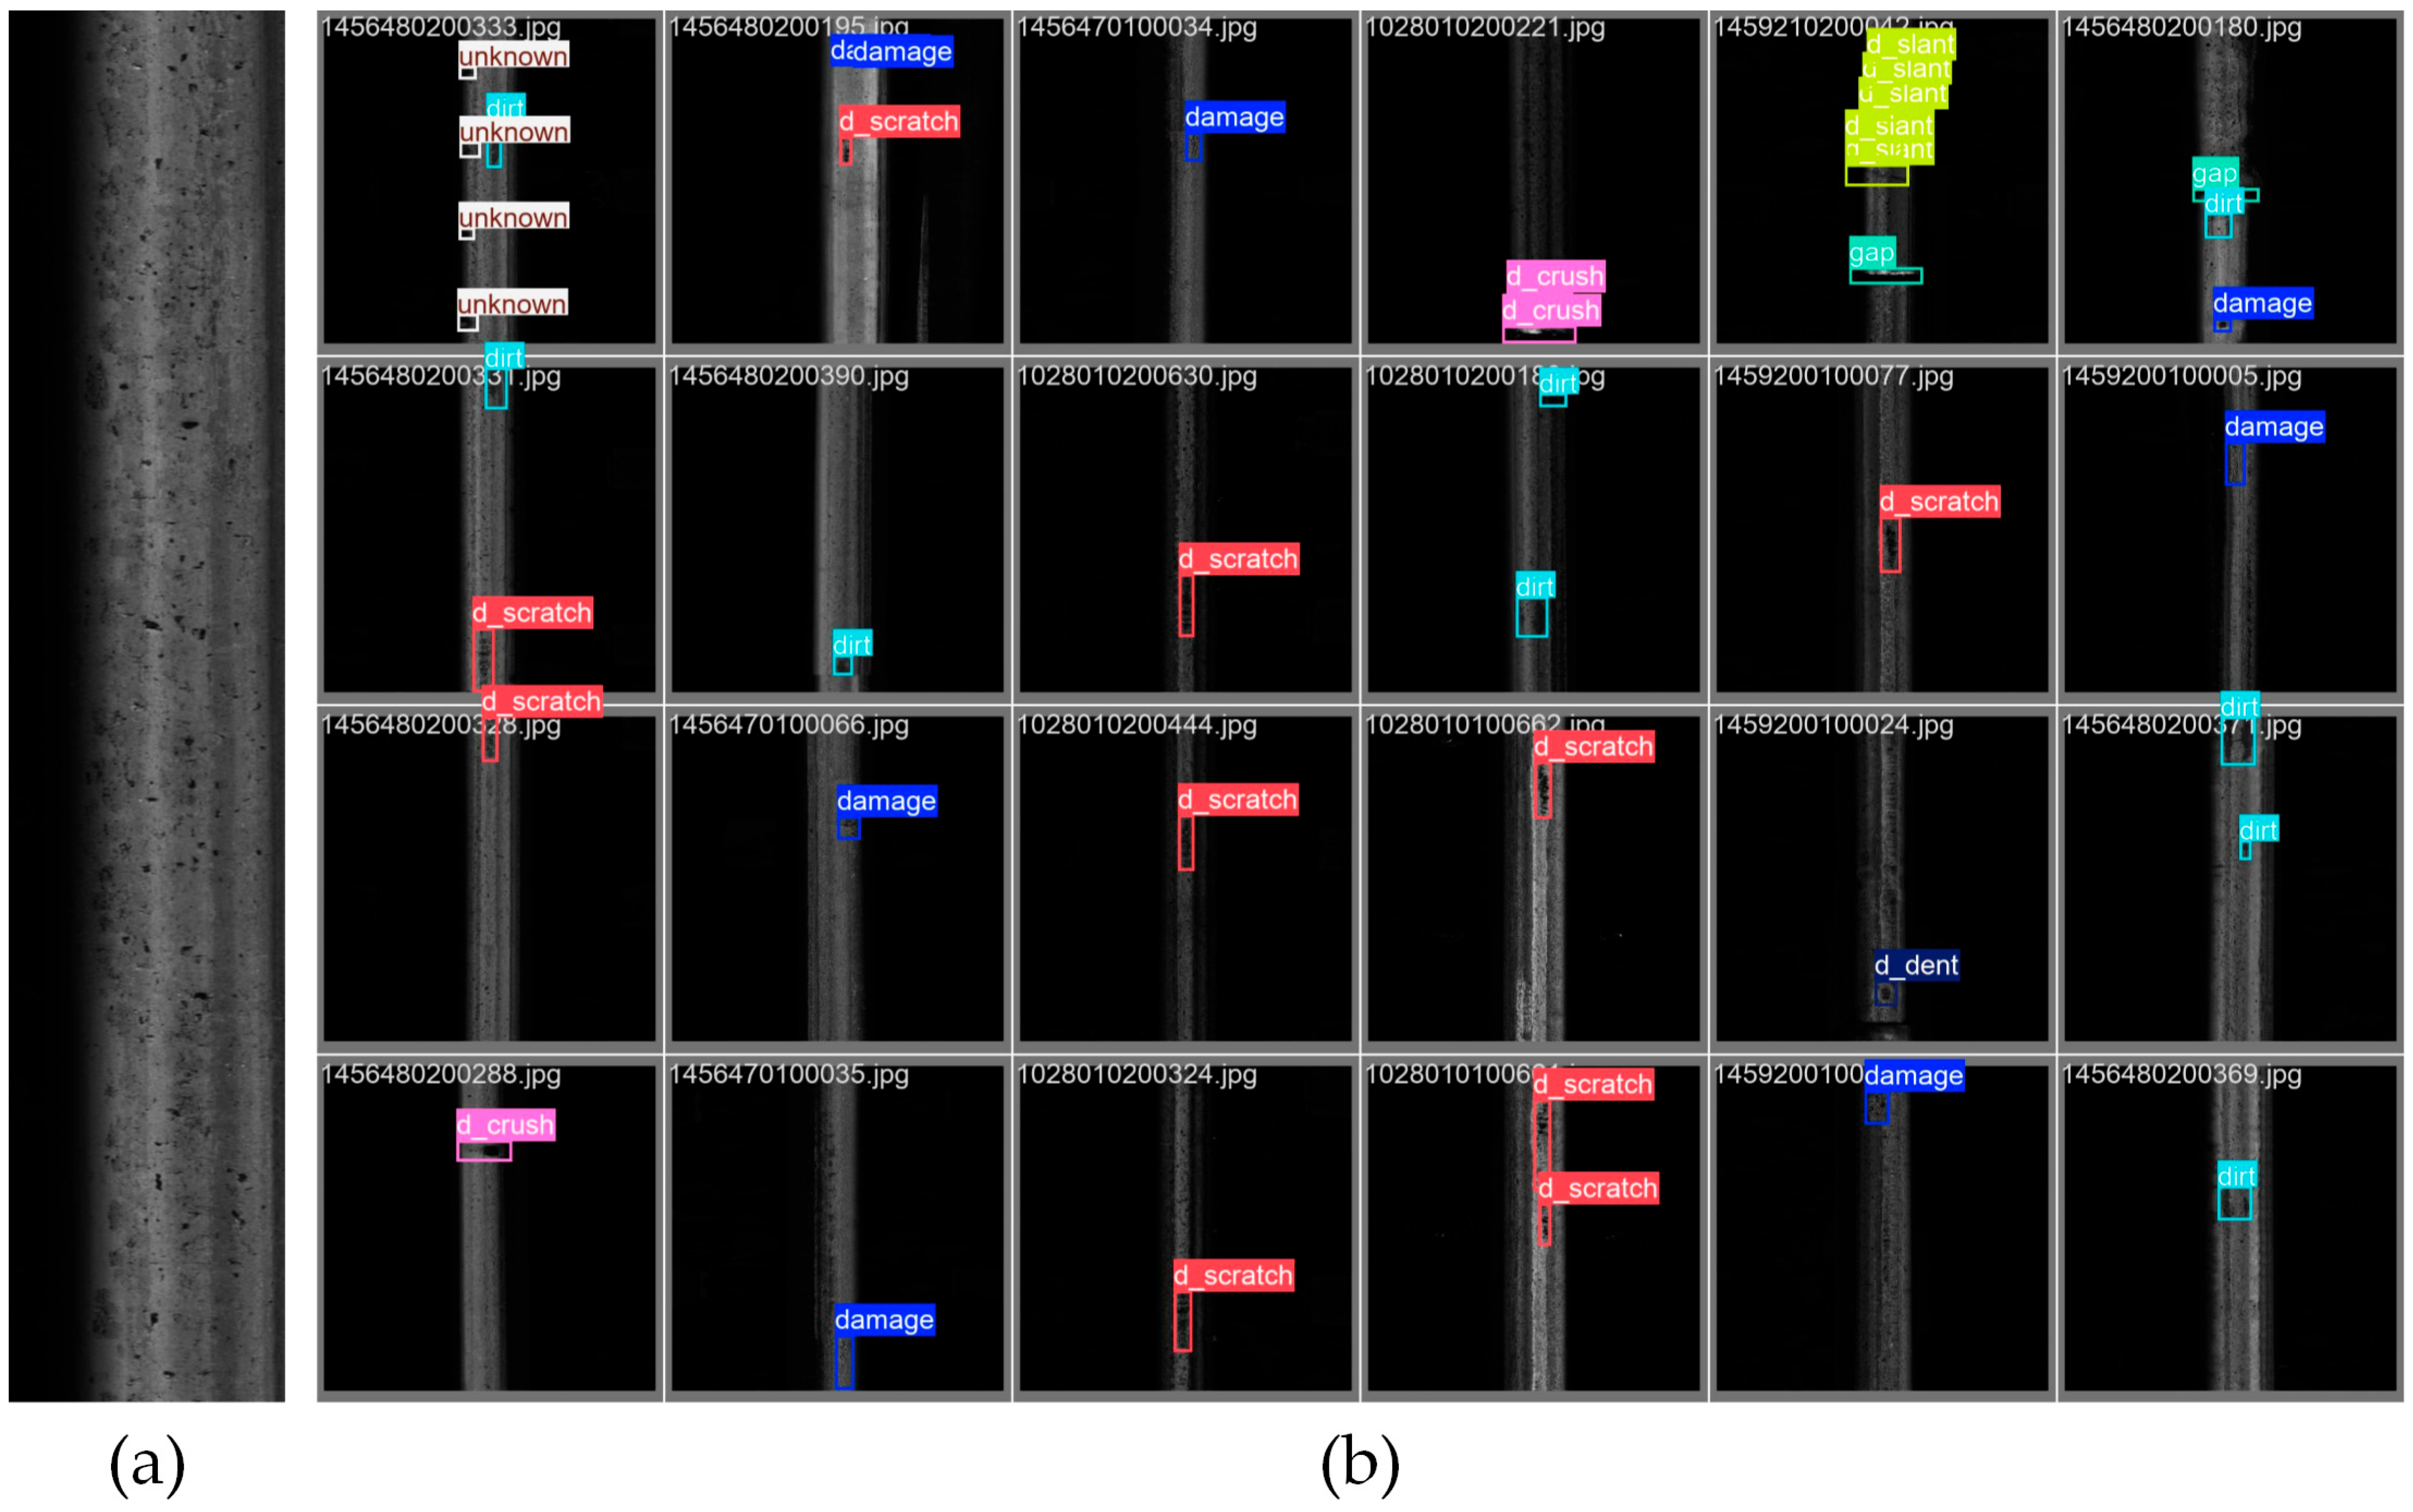
4.1. Experimental Setup and Dataset

This study establishes a multidimensional experimental validation system for track surface defect detection, encompassing hardware platforms, software frameworks, dataset construction, and model training strategies. The experimental configuration is shown in Table 1, employing a high-performance computing platform equipped with an NVIDIA RTX 4090 GPU (NVIDIA Corporation, Santa Clara, CA, USA), an AMD R9 9900X CPU (Advanced Micro Devices, Inc., Santa Clara, CA, USA), and 64 GB DDR5 6000 MHz memory (Asgard, a brand of Powev Electronic Technology Co., Limited, Shenzhen, China), enabling large-scale parallel data processing. The software environment is built upon the PyTorch 2.2.1 deep learning framework, utilizing CUDA 12.7 and cuDNN 8.7.0 for GPU operator optimization, while the operating system is Windows 10 Professional to ensure hardware driver compatibility.
To ensure training stability and efficiency, the training hyperparameters are set as shown in Table 2.
These parameter settings contribute to achieving optimal convergence speed and accuracy during training. The SGD optimizer effectively adjusts the learning rate, enabling the model to gradually minimize errors over prolonged training periods. The learning rate decay and warm-up strategies effectively mitigate early training instability, ensuring balanced training results at various stages.
In this study, the dataset used is the railway surface defect dataset collected on a 9 km railway test loop built by the National Academy of Railway Sciences Test Center. These data were acquired using a line-scan camera installed on a high-speed train [43]. Throughout the data collection process, a total of 400 images containing defects were gathered. After annotation, all images were utilized for model training, validation, and testing. The annotation details are illustrated in Figure 7.
The dataset employed in this study specifically focuses on detecting and classifying defects on rail surfaces, encompassing various typical types of rail damage. During the construction of this dataset, special attention was paid to the diversity and representativeness of the samples, striving to capture different morphologies and variations of rail surface defects. This approach enhances the model’s adaptability to real-world scenarios. In total, the dataset contains eight defect categories, each representing a potential typical rail surface defect. These categories include dent, crush, scratch, slant, damage, dirt, gap, and unknown. Each defect category is defined and classified in detail based on its specific visual characteristics. A dent typically appears as an elliptical depression in a localized area, whereas a crush is a deeper depression across the rail surface and may be accompanied by irregular black pits. Scratches and slants usually manifest as linear scrapes or patterns along the longitudinal direction of the rail, both of which can affect the rail’s load-bearing capacity and operational safety. The damage category refers to defects whose specific type is indeterminate but still jeopardizes the rail’s structural integrity. Dirt indicates relatively shallow and orderly stains on the rail surface and often preserves some surface texture. Gap refers to fissures or voids that appear on the rail surface due to joint gaps. The unknown category comprises features that cannot be recognized as any of the aforementioned defects, nor can they be identified as stains or gaps. Since such unknown defects typically require additional manual inspection, they can also be viewed as a special type of defect.
Consequently, the collected railway surface defect dataset can be utilized to perform eight-category defect detection tasks. Every label in the dataset has been precisely annotated, ensuring clear identification and classification of each defect type. Examples of both the dataset and its annotations can be found in Figure 8.
To guarantee the model’s generalizability and accuracy, defects were meticulously labeled and distributed so that each category is adequately represented. The dataset is divided into training, validation, and testing sets with a ratio of 7:2:1, thereby maximizing data utility during training while ensuring robust performance assessment and model resilience at validation and testing.
Evaluation of model performance in this research draws upon a comprehensive set of commonly used metrics, each examining various aspects of system capability on complex tasks. First, precision (P) measures the accuracy of positive (defect) predictions, as shown in Equation (12):
P = TP TP + FP
where TP (True Positive) denotes the number of real defects correctly identified by the model, and FP (False Positive) indicates non-defective instances incorrectly labeled as defective. Higher precision reflects a model’s ability to reduce false alarms, which is especially relevant when minimizing over-detection is critical.
In contrast, recall (R), or sensitivity, quantifies the model’s capacity to capture actual defects, as expressed in Equation (13):
R = TP TP + FN
where FN (False Negative) represents actual defects overlooked by the model. A higher recall suggests improved coverage of existing defects, although it may introduce more false positives. Consequently, recall serves as an essential gauge of defect coverage in scenarios where overlooking flaws carries significant risk.
Average Precision (AP) offers a unified view of the trade-off between precision and recall by integrating precision over multiple recall thresholds, typically via an integral-based approach. Its computation is outlined in Equation (14):
A P = 0 1 p r d r
where p r is the precision value at a particular recall r. AP gauges model performance comprehensively under varied detection thresholds, ensuring thorough evaluation. For multi-category tasks, mean Average Precision (mAP) aggregates the AP values across all classes, providing a holistic measure of performance Equation (15):
m A P = 1 K k = 1 K AP k
where K represents the number of classes, and AP k is the average precision for class k. By accommodating diverse classes, mAP guards against excessive model bias toward specific defect categories, affording a more inclusive appraisal of detection accuracy.
The F1-score, defined as the harmonic mean of precision and recall, offers a succinct metric for balancing accuracy and completeness, as Equation (16) indicates:
F 1 = 2 × P · R P + R
F1-score is particularly relevant in defect detection scenarios where class distributions may be imbalanced.
Lastly, Frames Per Second (FPS) quantifies the model’s inference efficiency, calculated via Equation (16):
F P S = Total   Frames Inference   Time
where Total Frames represents the number of frames processed over a given period, and Inference Time is the duration required for their analysis. FPS directly reflects practical throughput, particularly crucial in real-time rail defect detection that necessitates swift responses over large-scale data.

4.2. Ablation Experiments

To further investigate the contribution of each module in the PerMSCA-YOLO model and the synergistic effects within its overall performance, a series of ablation experiments were conducted. By incrementally incorporating each module into the YOLOv8n model and performing comparative analyses, we gained a deeper understanding of how each module independently and collaboratively enhances the model’s accuracy, inference efficiency, and robustness. Using the YOLOv8n model as the baseline, we evaluated the impact of each modification. Table 3 illustrates that the introduction of each module results in significant variations in various performance metrics, providing strong evidence for the rationality and effectiveness of the model’s design. In the table, bold values indicate the best performance among the compared models, and underlined values represent the second-best.
After incorporating the FasterNet backbone, the model’s accuracy slightly decreased, with the mAP dropping from 0.831 to 0.822. This indicates that while the FasterNet backbone optimized the computational efficiency of the model, it slightly compromised detection accuracy. However, this reduction was marginal, and the inference frame rate improved significantly from 134 FPS to 185 FPS, demonstrating FasterNet’s substantial contribution to enhancing inference speed. This improvement highlights FasterNet’s advantage in minimizing computational redundancy while maintaining a high inference speed, which is particularly significant for resource-constrained applications in track defect detection tasks.
Following the introduction of the MSCAM module, mAP increased to 0.847, signifying that MSCAM effectively enhanced the model’s ability to perceive multi-scale defects. By utilizing channel attention, spatial attention, and multi-scale convolutions in a cascading mechanism, MSCAM improved the model’s capability to recognize complex defects such as narrow cracks and corrosion patches (Figure 9’s heatmap corroborates this). However, due to the multi-branch convolutions and channel shuffling operations involved in MSCAM, the inference speed decreased, with FPS dropping to 112. This result underscores the trade-off between increased detection accuracy and the computational overhead introduced by MSCAM.
With the addition of perceptual loss, both mAP@0.5 and F1-score improved to 0.842 and 0.77, respectively, and the optimal F1-score confidence threshold increased to 0.660. Perceptual loss aligns predicted and ground-truth bounding boxes in the deep feature space, strengthening the model’s focus on defect textures (such as the continuity of crack edges) and reducing false positives caused by surface rust or oil stains. Although the impact of perceptual loss on accuracy was relatively modest, its primary function was to optimize texture alignment, enhancing the model’s ability to discern fine details of defects.
In the combined module experiments, the results further revealed the synergistic interactions between the components and the associated performance trade-offs. When FasterNet and MSCAM were used together, mAP rose to 0.839, and the inference frame rate reached 164 FPS. MSCAM compensated for FasterNet’s shortcomings in shallow feature extraction and suppressed background noise interference, thus improving detection accuracy while maintaining high inference speed, demonstrating the synergistic effect between the two. The combination of MSCAM and perceptual loss achieved peak accuracy, with mAP reaching 0.861 and F1 at 0.79, but the inference speed dropped to 109 FPS. This combination notably enhanced the model’s response strength in the central regions of defects, with reduced edge misdetections, suggesting that perceptual loss optimized MSCAM’s attention focusing, improving the precision of defect edge capture.
The PerMSCA-YOLO model, integrating FasterNet, MSCAM, and perceptual loss, strikes an optimal balance between mAP and FPS. FasterNet’s lightweight design mitigates the computational load introduced by MSCAM and perceptual loss, while MSCAM’s multi-scale feature enhancement and perceptual loss’s texture alignment create a complementary synergy. This enables the model to achieve higher detection accuracy and robustness while retaining real-time performance. The model’s test results are shown in Figure 9.
To further analyze the impact of the different modules on the regions of interest, we employed Grand-CAM to generate heatmaps that illustrate the differences in response intensity in the defect regions across models. The heatmap in Figure 10 clearly demonstrates that after incorporating MSCAM and perceptual loss, the model’s response to key areas of track defects became more concentrated, validating the effectiveness of the multi-scale convolutional attention module and perceptual loss in improving the model’s attention precision. These results convincingly show that MSCAM enhances the model’s ability to capture diverse defects, such as fine cracks and corrosion deposits on the track surface, by reinforcing the expression of features across different scales. Additionally, perceptual loss further bolstered the model’s robustness against complex backgrounds and irregular defects.

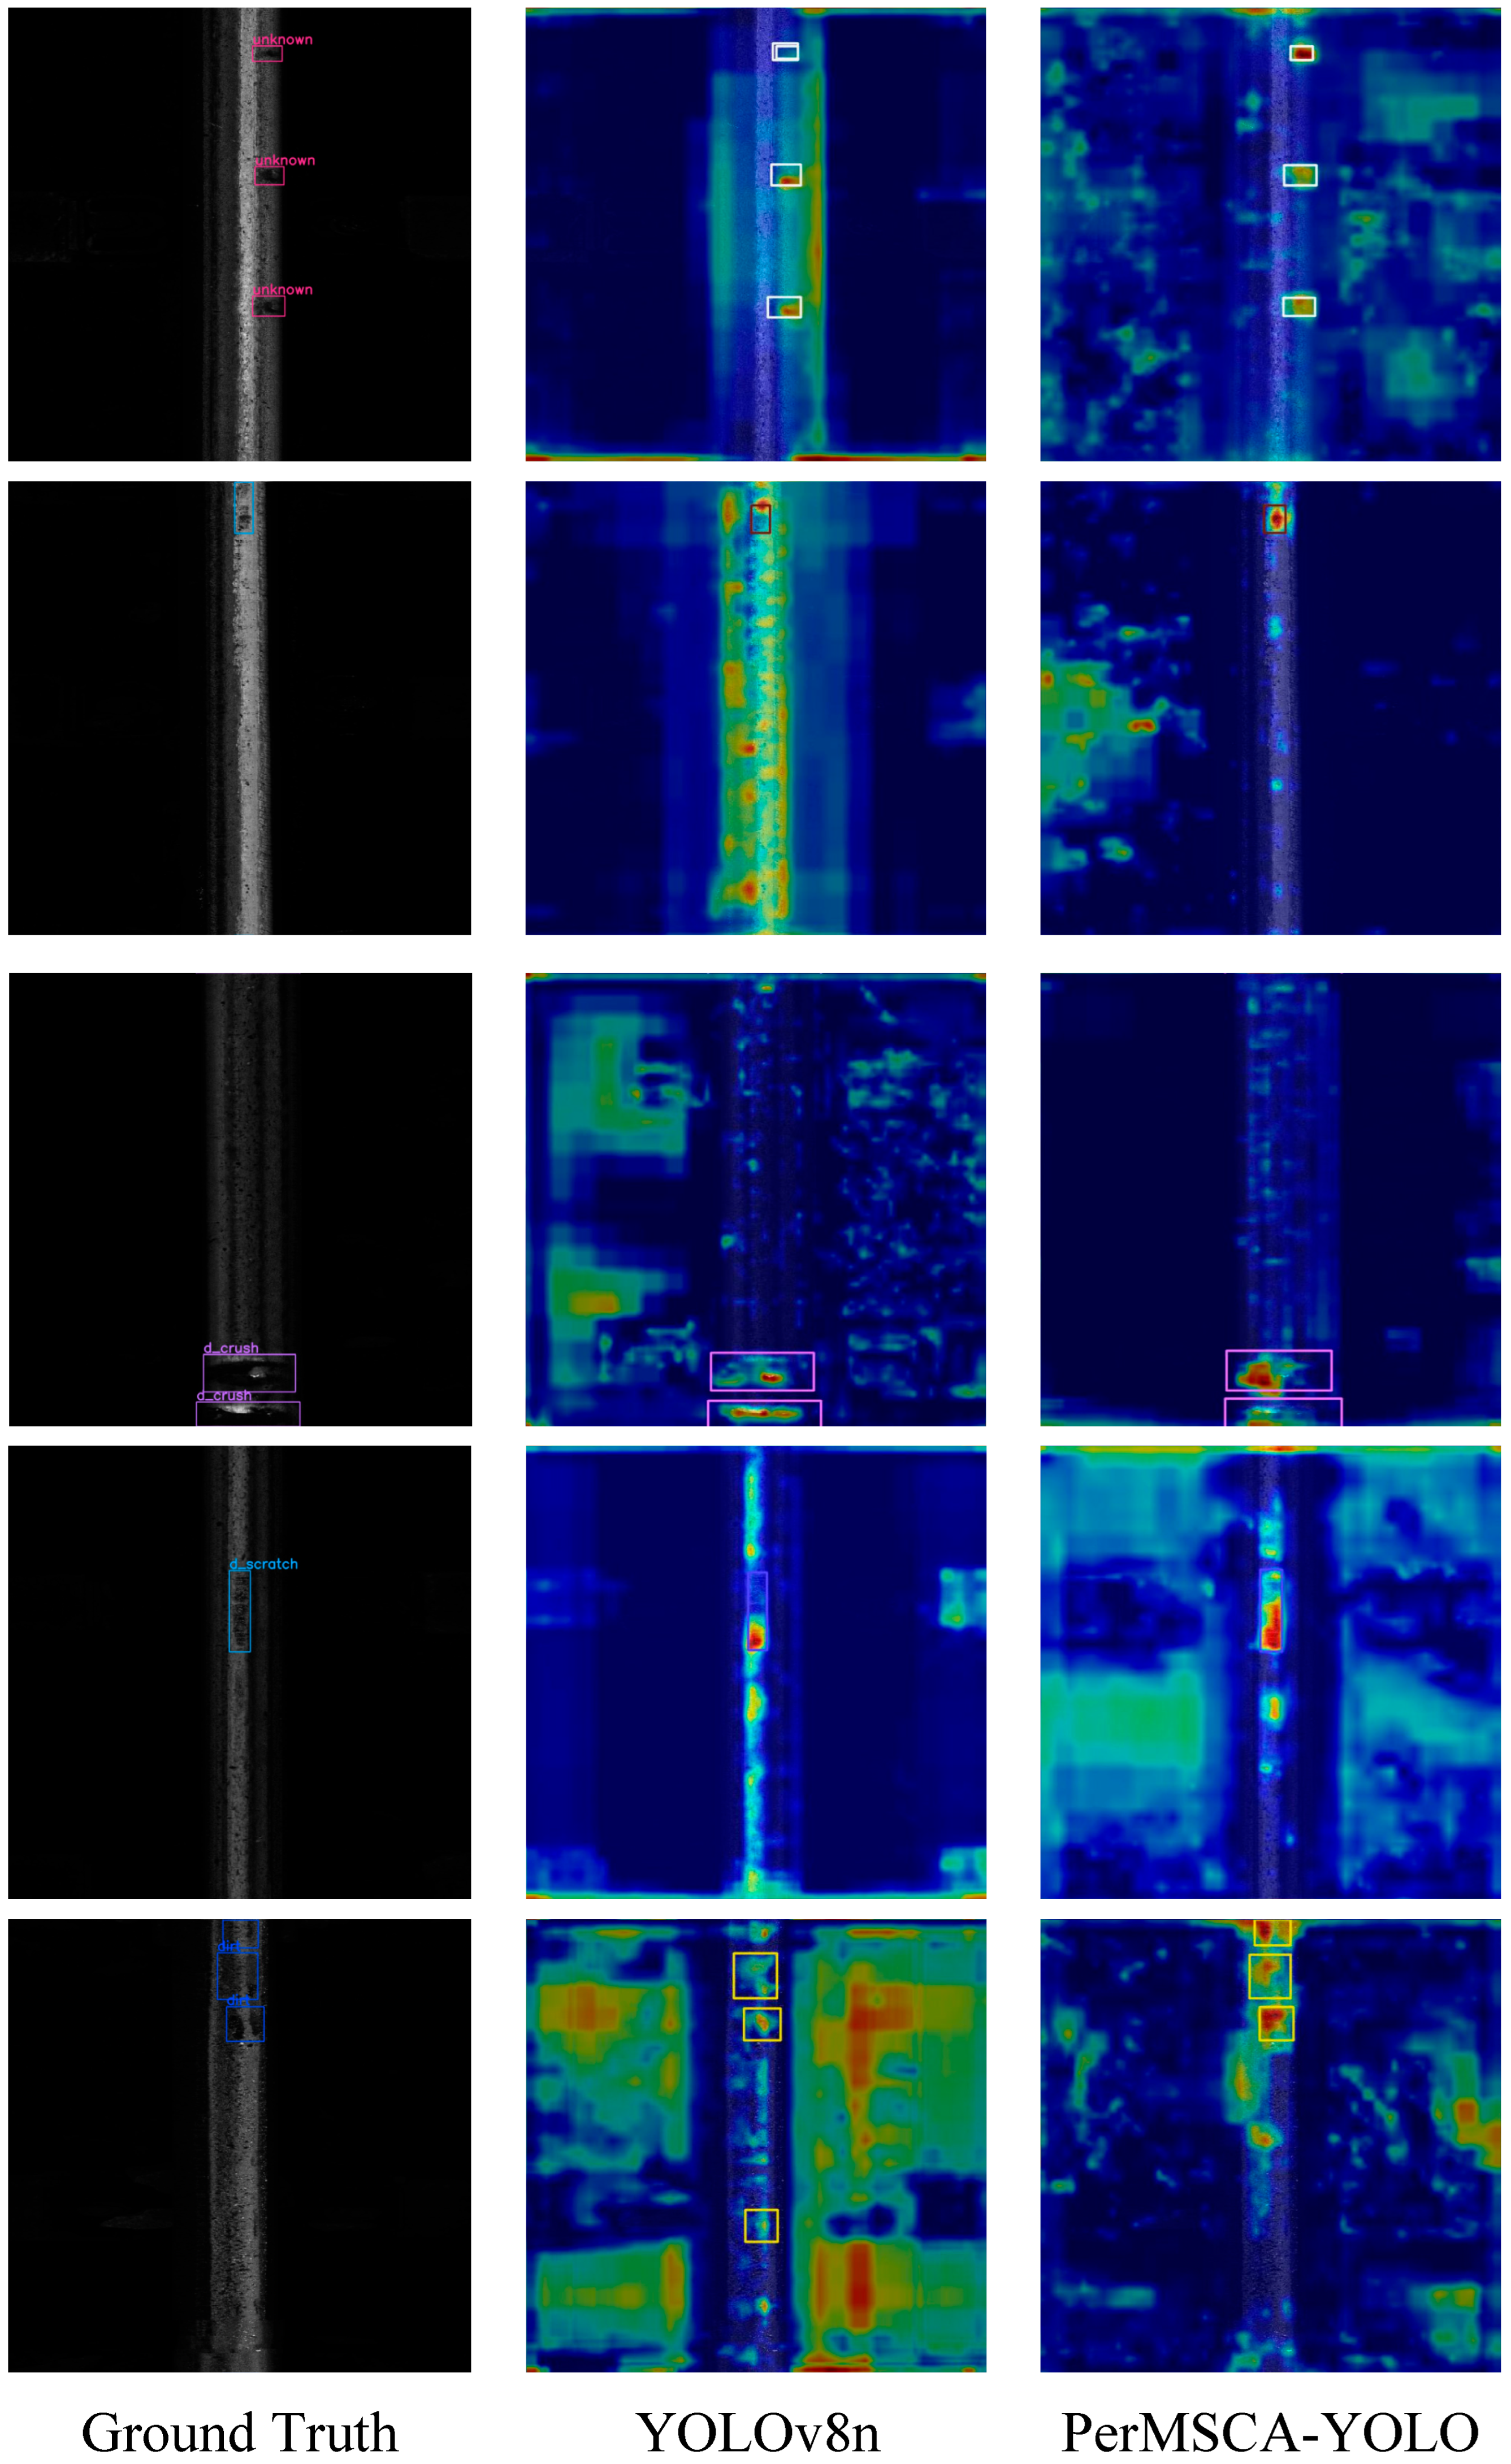
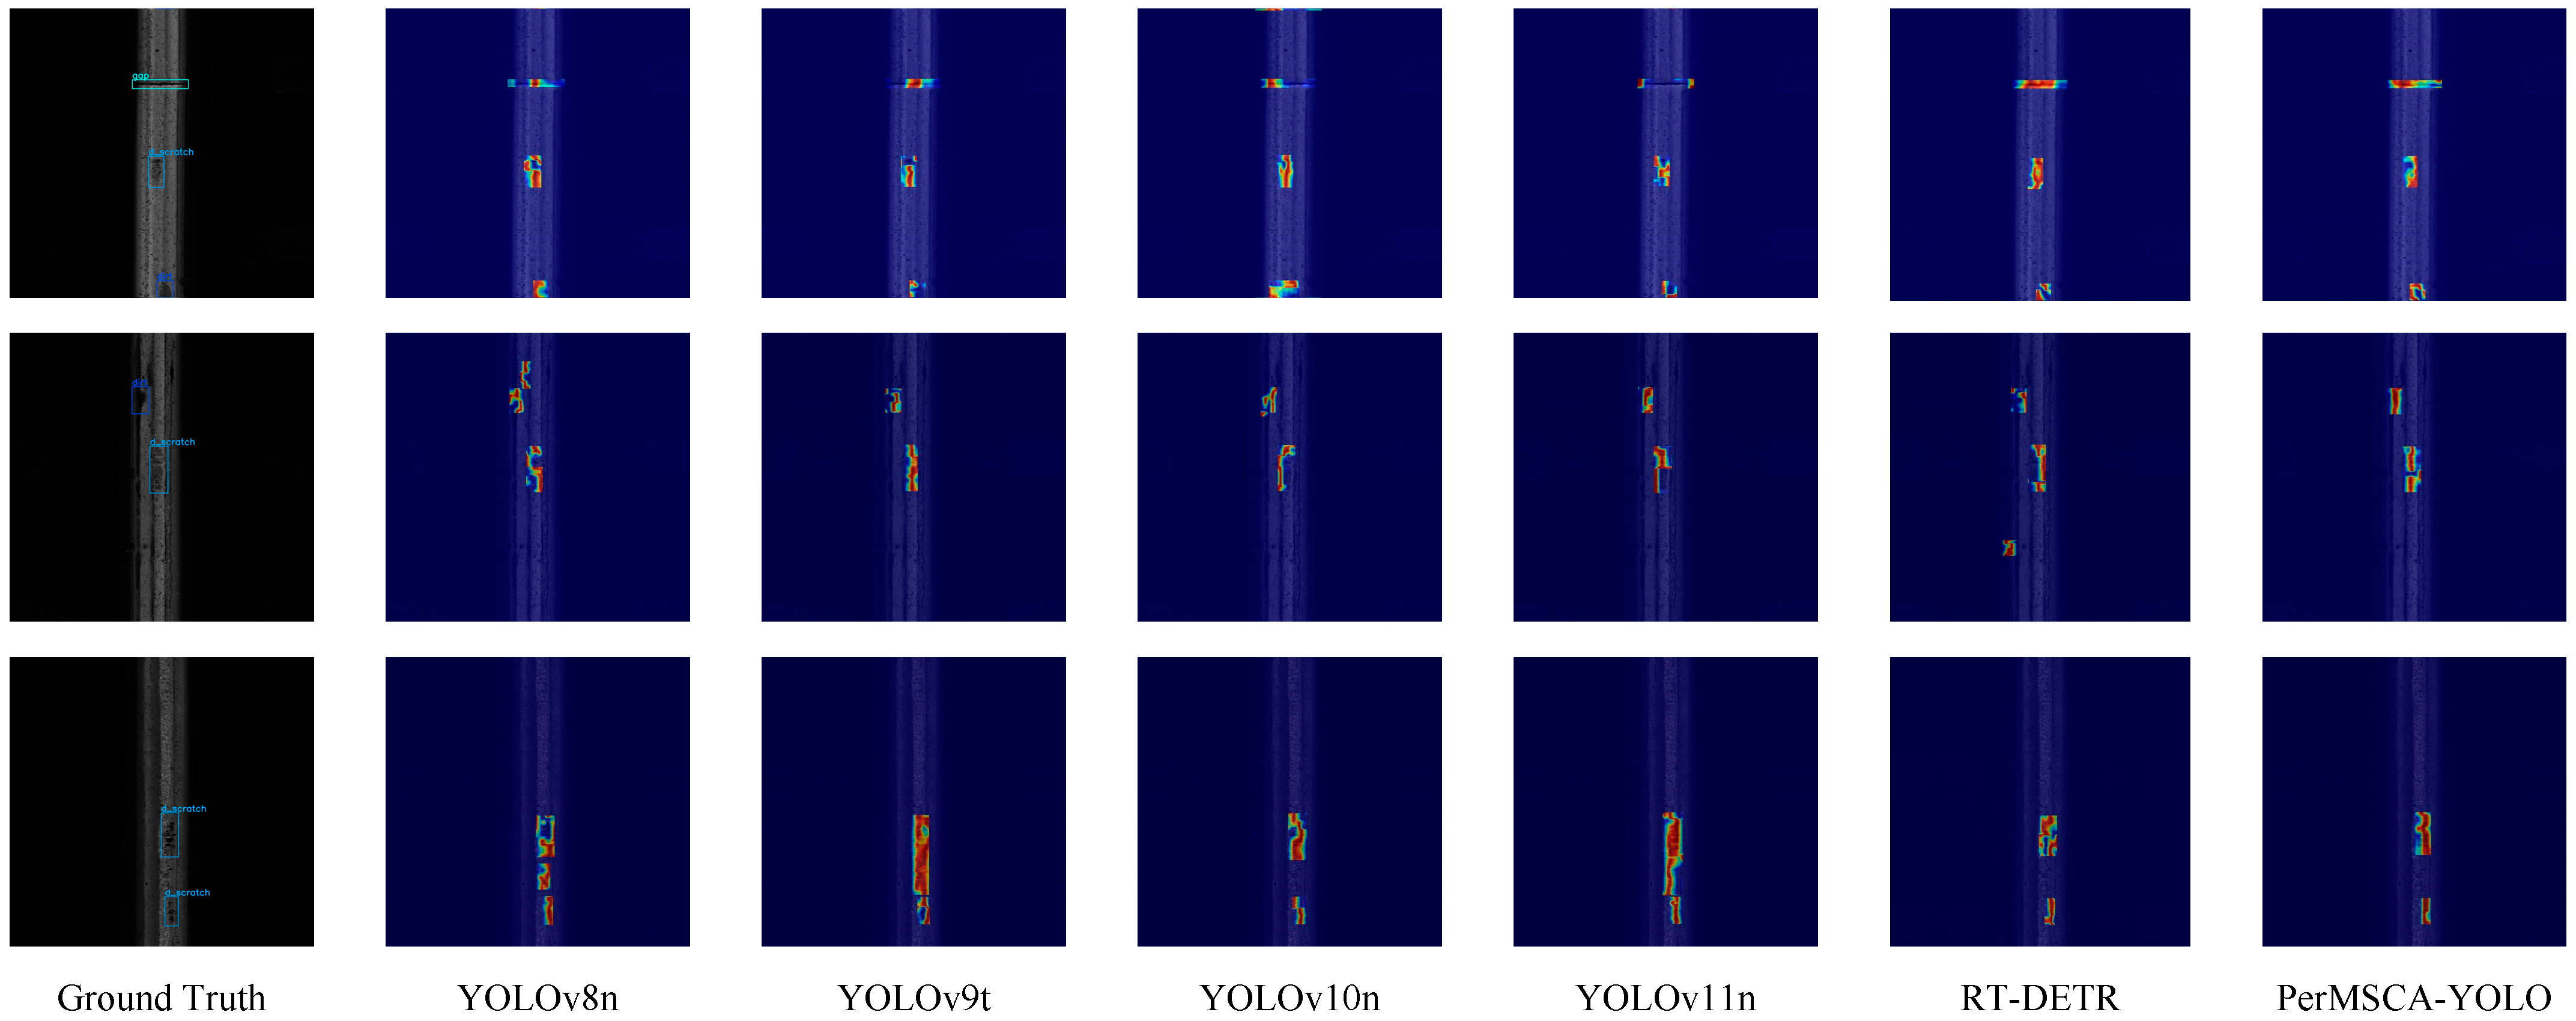
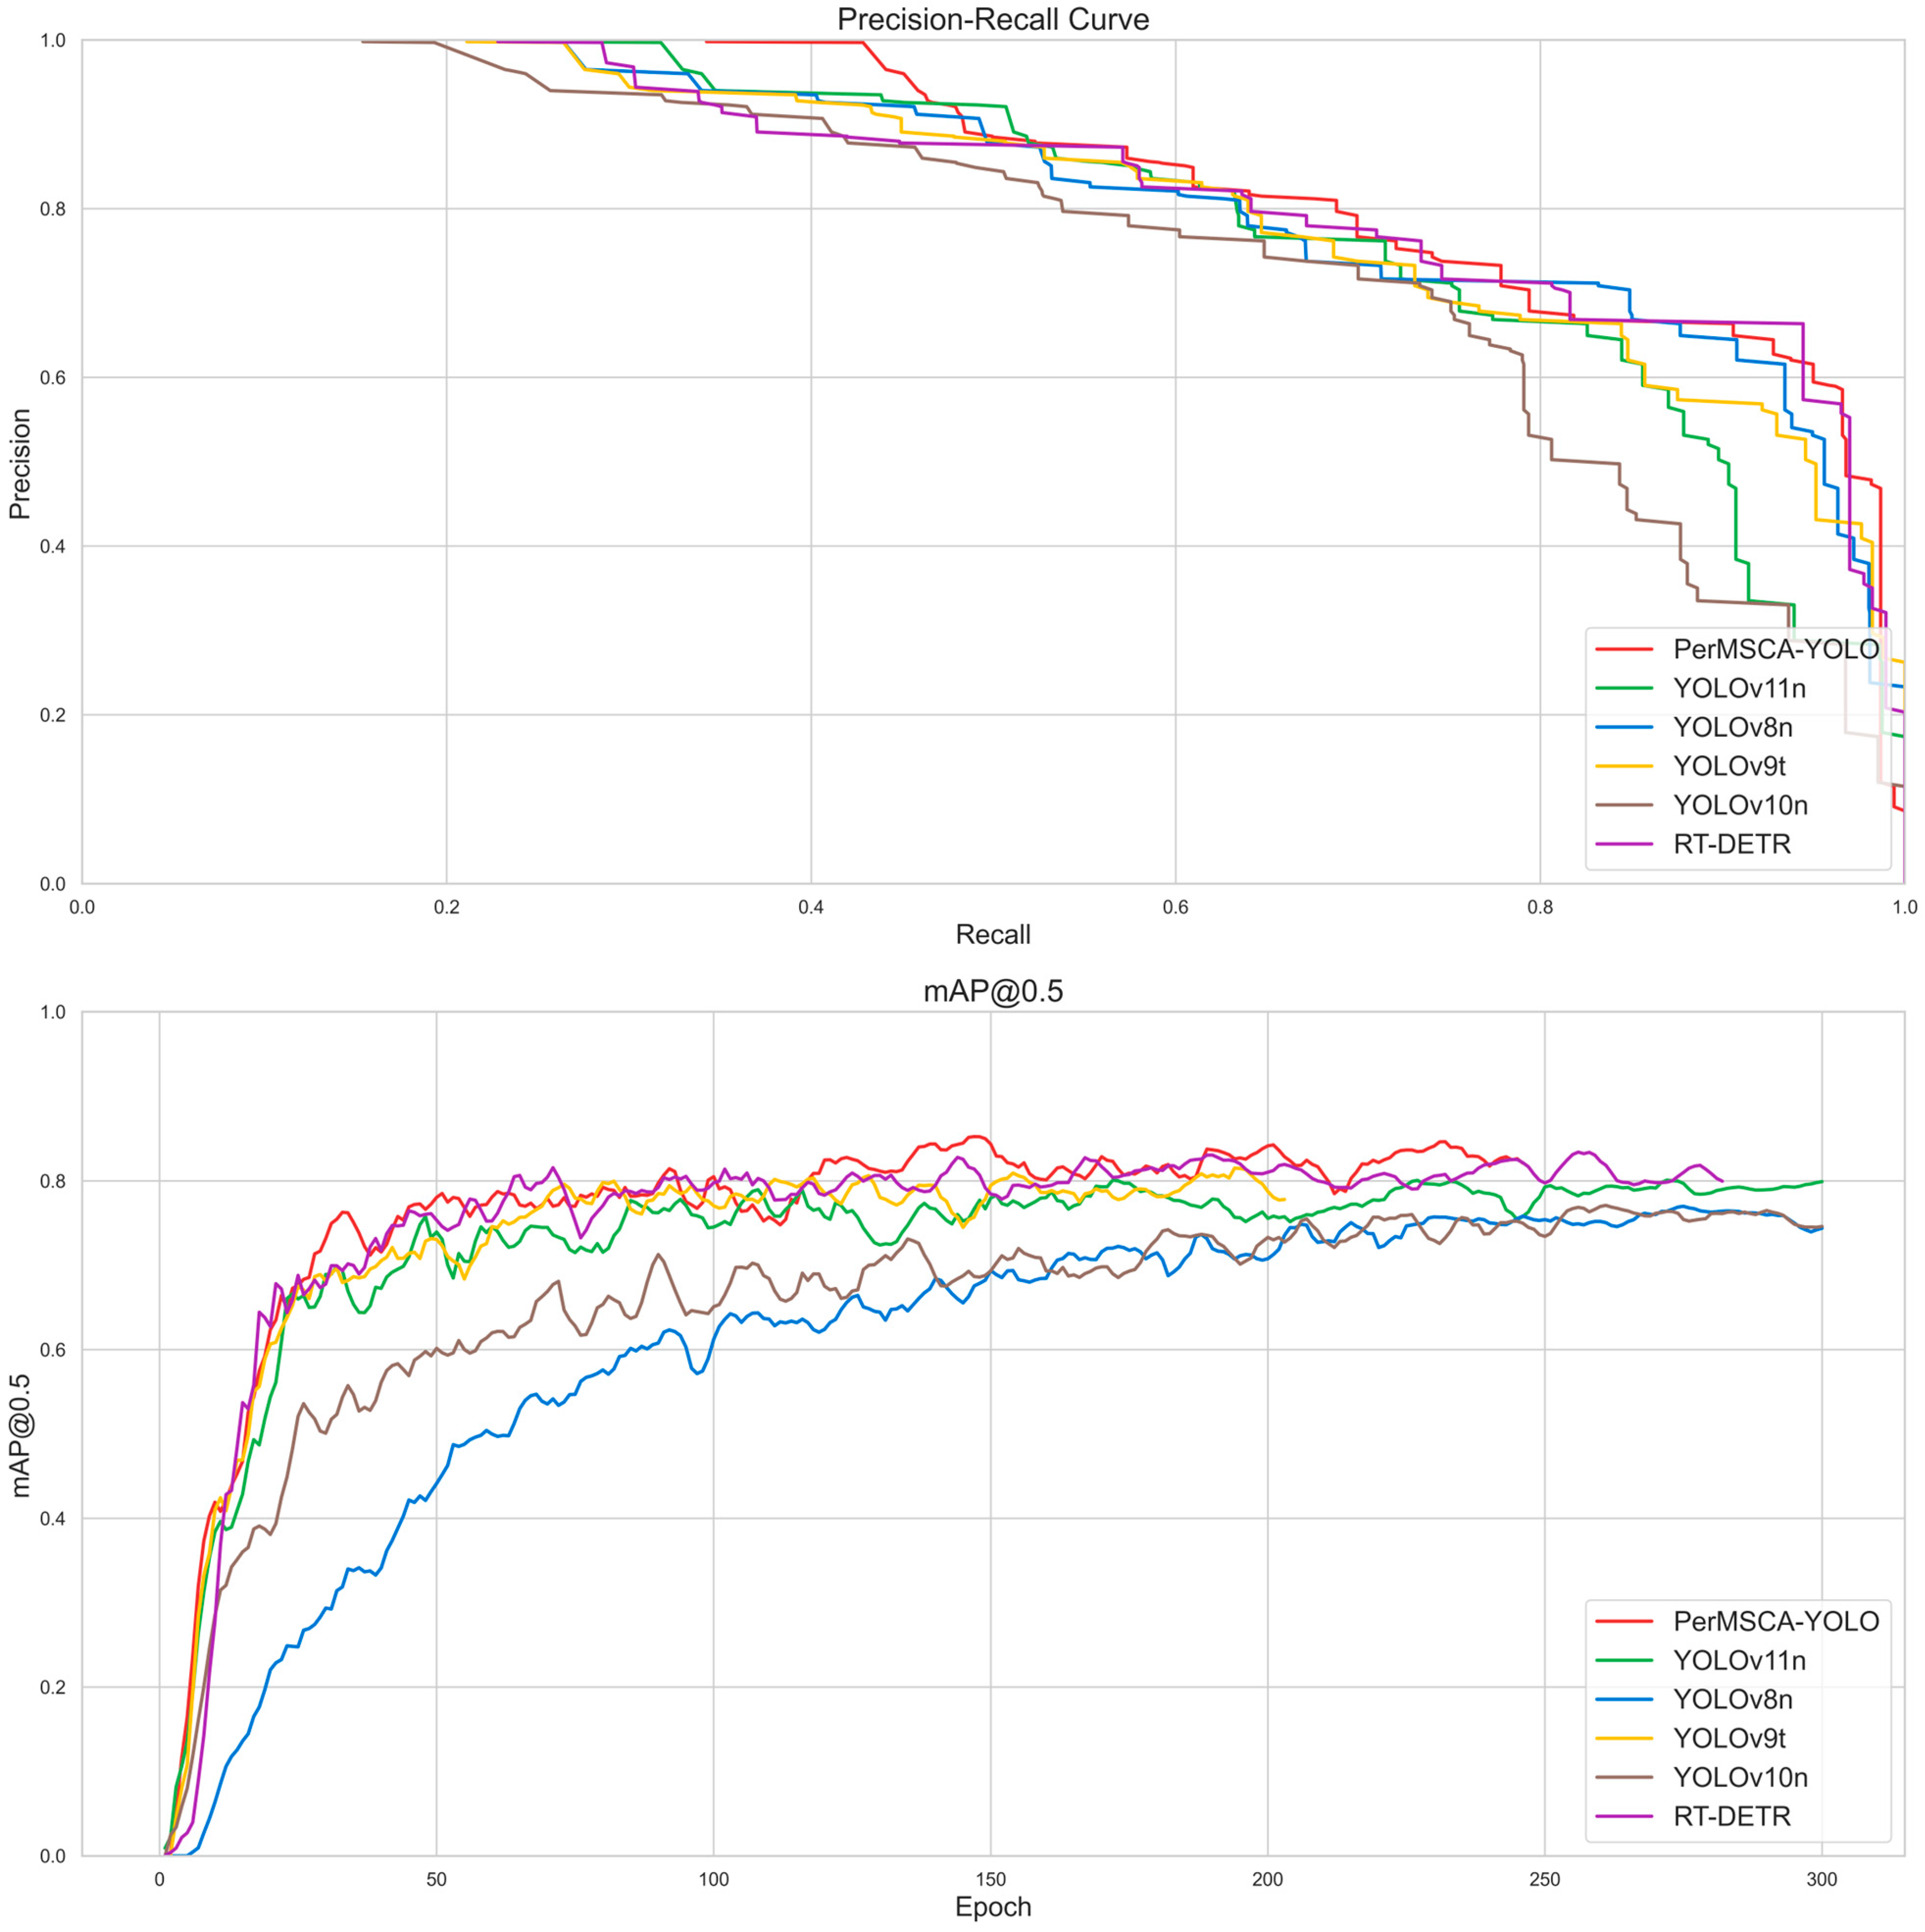
4.3. Comparative Experiments

In this section, we evaluate the performance of the PerMSCA-YOLO model against the YOLO series of object detection models and the RT-DETR model under the same dataset and training conditions, in order to validate the proposed model’s adaptability, robustness, and overall performance advantages in multi-class rail defect detection tasks. Table 4 summarizes the quantitative results of each detection model in terms of mAP@0.5, F1-score, and FPS. In the table, bold values indicate the best performance among the compared models, and underlined values represent the second-best.
From Table 4, it is evident that YOLOv8n, serving as the baseline model, achieves a mAP@0.5 of 0.831, an F1-score of 0.75, and a speed of 134 FPS. YOLOv9t and YOLOv11n produce similar accuracy, with mAP@0.5 values of 0.824 and 0.813, and F1-scores of 0.76 and 0.75, respectively. By contrast, although YOLOv10n demonstrates superior inference speed, its mAP@0.5 and F1-score drop to 0.774 and 0.71, respectively, indicating that an extreme lightweight design can lead to a noticeable compromise in accuracy. Meanwhile, RT-DETR achieves outstanding detection performance, with a mAP@0.5 of up to 0.838 and an F1-score of 0.82; however, it operates at only 61 FPS, meaning its higher accuracy comes at the cost of greater computational overhead. Compared to these models, PerMSCA-YOLO excels in overall performance, attaining a mAP@0.5 of 0.856 and an F1-score of 0.79, while still maintaining 142 FPS. This highlights its ability to balance accuracy and inference speed.
Figure 11 presents a comparison of different models’ detection outcomes. As shown, PerMSCA-YOLO exhibits stronger robustness and detection accuracy when dealing with complex defects such as micro-cracks and corrosion spots. From the visualized bounding boxes and corresponding confidence scores, PerMSCA-YOLO provides more precise localization and more complete target recognition. In contrast, while YOLOv10n leads in inference speed, it struggles to maintain adequate accuracy on rail surfaces with high texture complexity. RT-DETR is also competitive in terms of precision and recall; however, it is constrained by its relatively low inference speed of 61 FPS, making it less suitable for scenarios that demand high real-time performance.
In Figure 12, we present a comparative analysis of heatmaps generated by various models when detecting track defects. These heatmaps visually represent the regions of interest each model focuses on, providing an intuitive view of their response intensities to potential defect areas. It can be observed that PerMSCA-YOLO demonstrates superior accuracy and stronger focus when identifying complex defects. Specifically, the heatmaps for PerMSCA-YOLO illustrate its ability to more precisely concentrate on the finer details of defect regions, distributing its response across multiple scales. This indicates that, through its integration of the multi-scale convolutional attention mechanism and perceptual loss, PerMSCA-YOLO is more adept at maintaining high precision in intricate backgrounds and detecting small targets.
By comparison, YOLOv10n, while exhibiting faster inference speeds, appears to generate relatively diffuse and less discriminative heatmaps in high-texture regions, indicating potential difficulty in capturing the full extent of certain subtle defects. The heatmaps of RT-DETR, on the other hand, display high-intensity responses in localized areas, reflecting its advanced ability to detect defects with strong cues. However, RT-DETR’s focus may exhibit slight fragmentation in certain complex scenarios, potentially leading to incomplete detection of diffuse defect patterns. Despite this, its heatmaps still showcase a robust capacity for highlighting defect areas, albeit at a cost to inference speed. Consequently, PerMSCA-YOLO stands out as a model that not only maintains balanced focus across diverse defect scales and shapes but also preserves real-time detection capability, thereby offering a comprehensive performance advantage for track defect detection.
To comprehensively evaluate model performance, Figure 13 also shows the Precision–Recall (PR) curves of all models across varying recall ranges, along with comparisons of mAP@0.5 during training. The PR curves indicate that PerMSCA-YOLO maintains a high precision even at large recall values, demonstrating superior robustness in handling small targets and complex background noise. Furthermore, in high-recall regions, it effectively reduces false positives, ensuring comprehensive detection of defects. From the training curves, PerMSCA-YOLO’s mAP continues to improve and becomes stable over more extensive iterations, whereas YOLOv9t, YOLOv8n, and other models show limited accuracy gains at later training stages. Although RT-DETR can also achieve competitive detection accuracy, its computational cost during training and inference is relatively high. If the model is deployed in environments requiring high real-time performance, its low inference speed may pose a bottleneck.
In object detection tasks, particularly in track defect detection, both precision and recall are critical. Although YOLOv10n has an advantage in FPS, its lower mAP@0.5 and F1-score reveal its inadequacies when handling small cracks and irregular surface textures on tracks. In contrast, PerMSCA-YOLO not only optimizes detection accuracy but also achieves efficient detection with reasonable inference speed, making it especially suitable for real-world scenarios requiring both real-time performance and precision. Across different confidence thresholds, PerMSCA-YOLO demonstrated a superior balance between precision and recall. This advantage is particularly important because track defect detection typically involves various defect types, with significant variability in defect size and form. Through a comparative analysis of mAP@0.5 and F1-score, PerMSCA-YOLO consistently maintains high detection accuracy while ensuring a solid recall rate, thus sustaining stable detection performance across diverse and complex track environments.

5. Conclusions

This study proposes a lightweight, multi-scale detection model, PerMSCA-YOLO, addressing the demands of track surface defect detection in high-speed and heavy-load railways. By incorporating the FasterNet backbone network to reduce computational redundancy and integrating the Multi-Scale Convolutional Attention Module (MSCAM) to enhance the model’s ability to detect narrow cracks and minor defects, the model achieves a remarkable balance between accuracy and inference speed. Experimental results demonstrate that PerMSCA-YOLO reaches an mAP@0.5 of 0.856, an F1-score of 0.79, and an inference frame rate of 142 FPS, showcasing its advantages over YOLOv8n and other comparable models in terms of detection accuracy and real-time performance. In particular, in the presence of multi-scale defects and complex background interference, PerMSCA-YOLO effectively improves defect recognition capabilities, highlighting its broad potential for deployment in high-speed and heavy-load railway environments.
Despite the outstanding performance of PerMSCA-YOLO in terms of accuracy and inference speed, there remain several areas where further optimization is warranted. First, when processing higher-resolution rail images or handling extremely complex scenarios, the inference speed may be affected to some extent. Second, although the use of perceptual loss significantly enhances the detection of subtle defects, its contribution to improving overall accuracy still requires deeper investigation. Moreover, current research places insufficient emphasis on environmental factors such as lighting, reflection, varying capture distances, and train-induced vibrations—factors that can significantly influence model stability and accuracy in high-speed and heavy-load railway detection tasks.
Looking ahead, we plan to integrate additional heterogeneous data sources with the PerMSCA-YOLO model to achieve multimodal data fusion. This integration will further expand the model’s ability to detect internal rail defects [44] and increase its precision and robustness under complex railway conditions. In addition, we will explore self-supervised pretraining strategies, enabling iterative optimization through large-scale unlabeled or weakly labeled data on top of a small, precisely annotated dataset, thereby reducing reliance on costly labeling processes [45]. With ongoing advances in edge computing, one pressing topic is how to deploy this model on low-power devices while maintaining real-time performance and high accuracy. Future research may also examine the model’s adaptability to extreme climate conditions and heavily loaded operational environments, thus providing more comprehensive technical support for railway safety inspections. Meanwhile, by incorporating advanced data augmentation strategies and network structure enhancements, further improvements to transfer learning frameworks can be pursued, thereby boosting the model’s resilience in high-speed scenarios and complex defect detection [46]. Overall, despite the sound balance between accuracy and efficiency exhibited by PerMSCA-YOLO in rail surface defect detection, more extensive and diverse application contexts call for additional research. As semi-supervised, self-supervised, and novel deep learning architectures continue to emerge, complemented by more comprehensive datasets and deployment approaches, rail defect detection technology will make even greater strides in safety and reliability, thus contributing to the intelligent operation and maintenance of high-speed and heavy-load railways.

Author Contributions

Conceptualization, J.Z. and H.Z.; Methodology, J.Z.; Software, R.Z. and F.L.; Validation, H.Z.; Formal analysis, F.L.; Investigation, J.Z., R.Z. and H.Z.; Resources, J.Z.; Data curation, F.L.; Writing—original draft, J.Z. and R.Z.; Writing—review & editing, J.Z., F.L. and H.Z.; Visualization, R.Z.; Supervision, H.Z.; Project administration, H.Z. All authors have read and agreed to the published version of the manuscript.

Funding

This research received no external funding.

Institutional Review Board Statement

Not applicable.

Informed Consent Statement

Not applicable.

Data Availability Statement

Data is contained within the article.

Conflicts of Interest

The authors declare no conflict of interest.

References

  1. Oh, K.; Yoo, M.; Jin, N.; Ko, J.; Seo, J.; Joo, H.; Ko, M. A review of deep learning applications for railway safety. Appl. Sci. 2022, 12, 10572. [Google Scholar] [CrossRef]
  2. Zhao, Y.; Liu, Z.; Yi, D.; Yu, X.; Sha, X.; Li, L.; Sun, H.; Zhan, Z.; Li, W.J. A review on rail defect detection systems based on wireless sensors. Sensors 2022, 22, 6409. [Google Scholar] [CrossRef] [PubMed]
  3. Gong, W.; Akbar, M.F.; Jawad, G.N.; Mohamed, M.F.P.; Ab Wahab, M.N. Nondestructive testing technologies for rail inspection: A review. Coatings 2022, 12, 1790. [Google Scholar] [CrossRef]
  4. Feng, J.H.; Yuan, H.; Hu, Y.Q.; Lin, J.; Liu, S.W.; Luo, X. Research on deep learning method for rail surface defect detection. IET Electr. Syst. Transp. 2020, 10, 436–442. [Google Scholar]
  5. Faghih-Roohi, S.; Hajizadeh, S.; Núñez, A.; Babuska, R.; De Schutter, B. Deep convolutional neural networks for detection of rail surface defects. In Proceedings of the 2016 International joint conference on neural networks (IJCNN), Vancouver, BC, Canada, 24–29 July 2016; IEEE: Piscataway, NJ, USA, 2016; pp. 2584–2589. [Google Scholar]
  6. Gibert, X.; Patel, V.M.; Chellappa, R. Deep multitask learning for railway track inspection. IEEE Trans. Intell. Transp. Syst. 2016, 18, 153–164. [Google Scholar]
  7. García, D.F.; Usamentiaga, R. Rail surface inspection system using differential topographic images. IEEE Trans. Ind. Appl. 2021, 57, 2994–3003. [Google Scholar]
  8. Tomita, K.; Chew, M.Y.L. A review of infrared thermography for delamination detection on infrastructures and buildings. Sensors 2022, 22, 423. [Google Scholar] [CrossRef]
  9. Alvarenga, T.A.; Carvalho, A.L.; Honorio, L.M.; Cerqueira, A.S.; Filho, L.M.A.; Nobrega, R.A. Detection and classification system for rail surface defects based on Eddy current. Sensors 2021, 21, 7937. [Google Scholar] [CrossRef]
  10. Park, J.W.; Lee, T.G.; Back, I.C.; Park, S.J.; Seo, J.M.; Choi, W.J.; Kwon, S.G. Rail surface defect detection and analysis using multi-channel eddy current method based algorithm for defect evaluation. J. Nondestruct. Eval. 2021, 40, 83. [Google Scholar]
  11. Abbas, M.; Shafiee, M. Structural health monitoring (SHM) and determination of surface defects in large metallic structures using ultrasonic guided waves. Sensors 2018, 18, 3958. [Google Scholar] [CrossRef]
  12. Zhong, Y.; Gao, X.; Luo, L.; Pan, Y.; Qiu, C. Simulation of laser ultrasonics for detection of surface-connected rail defects. J. Nondestruct. Eval. 2017, 36, 70. [Google Scholar]
  13. Yuan, F.; Yu, Y.; Liu, B.; Li, L. Investigation on optimal detection position of DC electromagnetic NDT in crack characterization for high-speed rail track. In Proceedings of the 2019 IEEE International Instrumentation and Measurement Technology Conference (I2MTC), Auckland, New Zealand, 20–23 May 2019; IEEE: Piscataway, NJ, USA, 2019; pp. 1–6. [Google Scholar]
  14. De Melo, A.L.O.; Kaewunruen, S.; Papaelias, M.; Bernucci, L.L.B.; Motta, R. Methods to monitor and evaluate the deterioration of track and its components in a railway in-service: A systemic review. Front. Built Environ. 2020, 6, 118. [Google Scholar]
  15. Yu, H.; Li, Q.; Tan, Y.; Gan, J.; Wang, J.; Geng, Y.-A.; Jia, L. A coarse-to-fine model for rail surface defect detection. IEEE Trans. Instrum. Meas. 2018, 68, 656–666. [Google Scholar]
  16. Gan, J.; Li, Q.; Wang, J.; Yu, H. A hierarchical extractor-based visual rail surface inspection system. IEEE Sens. J. 2017, 17, 7935–7944. [Google Scholar]
  17. Zhang, H.; Jin, X.; Wu, Q.M.J.; Wang, Y.; He, Z.; Yang, Y. Automatic visual detection system of railway surface defects with curvature filter and improved Gaussian mixture model. IEEE Trans. Instrum. Meas. 2018, 67, 1593–1608. [Google Scholar] [CrossRef]
  18. Wu, Y.; Qin, Y.; Wang, Z.; Jia, L. A UAV-based visual inspection method for rail surface defects. Appl. Sci. 2018, 8, 1028. [Google Scholar] [CrossRef]
  19. Cao, X.; Xie, W.; Ahmed, S.M.; Li, C.R. Defect detection method for rail surface based on line-structured light. Measurement 2020, 159, 107771. [Google Scholar]
  20. Nieniewski, M. Morphological detection and extraction of rail surface defects. IEEE Trans. Instrum. Meas. 2020, 69, 6870–6879. [Google Scholar]
  21. Ni, X.; Liu, H.; Ma, Z.; Wang, C.; Liu, J. Detection for rail surface defects via partitioned edge feature. IEEE Trans. Intell. Transp. Syst. 2021, 23, 5806–5822. [Google Scholar]
  22. Mandriota, C.; Nitti, M.; Ancona, N.; Stella, E.; Distante, A. Filter-based feature selection for rail defect detection. Mach. Vis. Appl. 2004, 15, 179–185. [Google Scholar]
  23. Deutschl, E.; Gasser, C.; Niel, A.; Werschonig, J. Defect detection on rail surfaces by a vision based system. In Proceedings of the IEEE Intelligent Vehicles Symposium 2004, Parma, Italy, 14–17 June 2004; IEEE: Piscataway, NJ, USA, 2004; pp. 507–511. [Google Scholar]
  24. Resendiz, E.; Hart, J.M.; Ahuja, N. Automated visual inspection of railroad tracks. IEEE Trans. Intell. Transp. Syst. 2013, 14, 751–760. [Google Scholar] [CrossRef]
  25. Masci, J.; Meier, U.; Ciresan, D.; Schmidhuber, J.; Fricout, G. Steel defect classification with max-pooling convolutional neural networks. In Proceedings of the 2012 International Joint Conference on Neural Networks (IJCNN), Brisbane, Australia, 10–15 June 2012; IEEE: Piscataway, NJ, USA, 2012; pp. 1–6. [Google Scholar]
  26. Zheng, D.; Li, L.; Zheng, S.; Chai, X.; Zhao, S.; Tong, Q.; Wang, J.; Guo, L. A defect detection method for rail surface and fasteners based on deep convolutional neural network. Comput. Intell. Neurosci. 2021, 2021, 2565500. [Google Scholar] [PubMed]
  27. Bai, T.; Gao, J.; Yang, J.; Yao, D. A study on railway surface defects detection based on machine vision. Entropy 2021, 23, 1437. [Google Scholar] [CrossRef] [PubMed]
  28. Bai, T.; Yang, J.; Xu, G.; Yao, D. An optimized railway fastener detection method based on modified Faster R-CNN. Measurement 2021, 182, 109742. [Google Scholar]
  29. Wang, Y.; Zhang, K.; Wang, L.; Wu, L. An improved YOLOv8 algorithm for rail surface defect detection. IEEE Access 2024, 12, 44984–44997. [Google Scholar]
  30. Teng, S.; Liu, Z.; Chen, G.; Cheng, L. Concrete crack detection based on well-known feature extractor model and the YOLO_v2 network. Appl. Sci. 2021, 11, 813. [Google Scholar] [CrossRef]
  31. Liu, J.; Zhu, X.; Zhou, X.; Qian, S.; Yu, J. Defect detection for metal base of TO-Can packaged laser diode based on improved YOLO algorithm. Electronics 2022, 11, 1561. [Google Scholar] [CrossRef]
  32. Hu, J.; Qiao, P.; Lv, H.; Yang, L.; Ouyang, A.; He, Y.; Liu, Y. High speed railway fastener defect detection by using improved YoLoX-Nano Model. Sensors 2022, 22, 8399. [Google Scholar] [CrossRef]
  33. Giben, X.; Patel, V.M.; Chellappa, R. Material classification and semantic segmentation of railway track images with deep convolutional neural networks. In Proceedings of the 2015 IEEE International Conference on Image Processing (ICIP), Quebec City, QC, Canada, 27–30 September 2015; IEEE: Piscataway, NJ, USA, 2015; pp. 621–625. [Google Scholar]
  34. Wei, X.; Wei, D.; Suo, D.; Jia, L.; Li, Y. Multi-target defect identification for railway track line based on image processing and improved YOLOv3 model. IEEE Access 2020, 8, 61973–61988. [Google Scholar]
  35. Hao, S.; An, B.; Ma, X.; Sun, X.; He, T.; Sun, S. PKAMNet: A transmission line insulator parallel-gap fault detection network based on prior knowledge transfer and attention mechanism. IEEE Trans. Power Deliv. 2023, 38, 3387–3397. [Google Scholar]
  36. Zhang, C.; Xu, D.; Zhang, L.; Deng, W. Rail surface defect detection based on image enhancement and improved YOLOX. Electronics 2023, 12, 2672. [Google Scholar] [CrossRef]
  37. Wang, H.; Li, M.; Wan, Z. Rail surface defect detection based on improved Mask R-CNN. Comput. Electr. Eng. 2022, 102, 108269. [Google Scholar]
  38. Zhang, B.; Fang, S.; Li, Z. Research on Surface Defect Detection of Rare-Earth Magnetic Materials Based on Improved SSD. Complexity 2021, 2021, 4795396. [Google Scholar]
  39. Wang, J.; Li, Q.; Gan, J.; Yu, H.; Yang, X. Surface defect detection via entity sparsity pursuit with intrinsic priors. IEEE Trans. Ind. Inform. 2019, 16, 141–150. [Google Scholar]
  40. Niu, M.; Song, K.; Huang, L.; Wang, Q.; Yan, Y.; Meng, Q. Unsupervised saliency detection of rail surface defects using stereoscopic images. IEEE Trans. Ind. Inform. 2020, 17, 2271–2281. [Google Scholar]
  41. Zhang, D.; Song, K.; Wang, Q.; He, Y.; Wen, X.; Yan, Y. Two deep learning networks for rail surface defect inspection of limited samples with line-level label. IEEE Trans. Ind. Inform. 2020, 17, 6731–6741. [Google Scholar]
  42. Sohan, M.; Ram, T.S.; Reddy, C.V.R. A review on yolov8 and its advancements. In Proceedings of the International Conference on Data Intelligence and Cognitive Informatics, Tirunelveli, India, 18–20 November 2024; Springer: Singapore, 2024; pp. 529–545. [Google Scholar]
  43. Li, H.; Wang, F.; Liu, J.; Song, H.; Hou, Z.; Dai, P. Ensemble model for rail surface defects detection. PLoS ONE 2022, 17, e0268518. [Google Scholar]
  44. Arain, A.; Mehran, S.; Shaikh, M.Z.; Kumar, D.; Chowdhry, B.S.; Hussain, T. Railway track surface faults dataset. Data Brief 2024, 52, 110050. [Google Scholar]
  45. Ozdemir, R.; Koc, M. On the enhancement of semi-supervised deep learning-based railway defect detection using pseudo-labels. Expert Syst. Appl. 2024, 251, 124105. [Google Scholar]
  46. Rodríguez-Abreo, O.; Quiroz-Juárez, M.A.; Macías-Socarras, I.; Rodríguez-Reséndiz, J.; Camacho-Pérez, J.M.; Carcedo-Rodríguez, G.; Camacho-Pérez, E. Automatic Detection of Railway Faults Using Neural Networks: A Comparative Study of Transfer Learning Models and YOLOv11. Infrastructures 2024, 10, 3. [Google Scholar] [CrossRef]
Figure 1. Overall architecture of the PerMSCA-YOLO model. The design of this architecture follows the standard paradigm of the YOLO series, which includes a backbone feature extraction network, a feature fusion network, and an output detection head. In the proposed approach, the input image undergoes preliminary down-sampling and channel expansion in the Embedding Layer, followed by alternating stacks of multi-stage FasterNet Blocks and the Merging Layer to efficiently extract both local and global features. Next, MSCAM is introduced at each scale to further focus on track defects and suppress noise. This is then combined with operations such as C2f, Conv, Upsample, and Concat to fuse shallow textures with deep semantics. Finally, perceptual loss is incorporated to constrain the consistency between predicted and ground-truth bounding boxes in the deep feature space, yielding multi-scale defect detection results.
Applsci 15 03588 g001
Figure 2. PConv module structure.
Applsci 15 03588 g002
Figure 3. Comparison between PConv + PWConv and T-shaped convolution. In the figure, k denotes the convolution kernel size, and C and Cₚ represent the number of channels. In our design, Cₚ < C, indicating that the PConv module performs standard convolution operations on only a subset of the input channels.
Applsci 15 03588 g003
Figure 4. FasterNet overall architecture. In the figure, h and w are the spatial dimensions of the feature map, while C and Cₚ denote the number of channels. Similarly, the PConv operation is applied to only a subset of the input channels, thereby effectively reducing memory access overhead.
Applsci 15 03588 g004
Figure 5. MSCAM architecture.
Applsci 15 03588 g005
Figure 6. Implementation of perceptual loss.
Applsci 15 03588 g006
Figure 7. Dataset annotation overview. The upper-left corner shows a bar chart reflecting the frequency or proportion of each target (defect) category in the dataset. The upper-right corner is a visualization of all bounding boxes overlaid in a normalized coordinate system, enabling a direct view of where boxes are located in the image space, as well as their sizes, shapes, and center distributions. The lower-left corner is a scatter plot of center coordinates, indicating the positions at which targets appear within the image. The lower-right corner is a scatter plot of target width and height (both normalized), which allows us to observe the distribution of target sizes.
Applsci 15 03588 g007
Figure 8. Representative samples from the railway surface defect dataset. (a) Example of a defect-free rail surface image. (b) Annotated examples of the eight typical defect categories: dent, crush, scratch, slant, damage, dirt, gap, and unknown. Each sample is labeled to reflect its specific visual characteristics.
Applsci 15 03588 g008
Figure 9. Test results of the PerMSCA-YOLO model. From these test results, it can be observed that the PerMSCA-YOLO model is capable of effectively detecting various types of rail damage.
Applsci 15 03588 g009
Figure 10. Comparison of heatmaps between PerMSCA-YOLO and baseline.
Applsci 15 03588 g010
Figure 11. Performance comparison of different models.
Applsci 15 03588 g011
Figure 12. Heatmap comparison between different models.
Applsci 15 03588 g012
Figure 13. PR curve comparison between different models and mAP@0.5 progression during training.
Applsci 15 03588 g013
Table 1. Hardware and software environment.
EnvironmentParametersValue
HardwareCPUAMD R9 9900X
GPUNVIDIA RTX 4090
MemoryDDR5 6000 MHz 64 G
SoftwareOperating systemWindows 10
Development languagePython 3.9
Deep learning frameworkPytorch 2.6.0
Computing platformCUDA 12.7 + cuDNN 9.5.1
Table 2. Model training hyperparameters.
ParametersValue
Epoch300
Batch size16
Workers8
Lr00.01
Lrf0.01
Momentum0.937
Weight decay0.0005
Warmup epochs3.0
Warmup momentum0.8
Warmup bias lr0.1
OptimizerSGD
Data augmentationMosaic, Close mosaic = 10
Table 3. Ablation experiment results.
BaselineFasterNetMSCAMPerceptual LossmAP@0.5F1FPS
YOLOv8n 0.8310.75 (conf = 0.449)134
0.8220.78 (conf = 0.596)185
0.8470.80 (conf = 0.556)112
0.8420.77 (conf = 0.660)135
0.8390.76 (conf = 0.532)164
0.8340.75 (conf = 0.517)181
0.8610.79 (conf = 0.487)109
0.8560.79 (conf = 0.462)142
Note: Bold values indicate the best performance among all models, underlined values represent the second-best, and √ denotes the use of the corresponding module in the model.
Table 4. Comparative experimental results.
ModelmAP@0.5F1FPS
YOLOv8n0.8310.75 (conf = 0.449)134
YOLOv9t0.8240.76 (conf = 0.575)133
YOLOv10n0.7740.71 (conf = 0.298)187
YOLOv11n0.8130.75 (conf = 0.582)155
RT-DETR0.8380.82 (conf = 0.778)61
PerMSCA-YOLO0.8560.79 (conf = 0.462)142
Disclaimer/Publisher’s Note: The statements, opinions and data contained in all publications are solely those of the individual author(s) and contributor(s) and not of MDPI and/or the editor(s). MDPI and/or the editor(s) disclaim responsibility for any injury to people or property resulting from any ideas, methods, instructions or products referred to in the content.

