Article

Weighting Optimization for Fuel Cell Hybrid Vehicles: Lifetime-Conscious Component Sizing and Energy Management

by
Xuanyu Xiao
1,
Chen Shu
1,
Huaiwei Dong
1,
Yujun Tang
1,
Jinfeng Feng
1,
Hao Yuan
2,
Shuzhan Bai
1,*,
Sipeng Zhu
1,3,* and
Guoxiang Li
1
1
School of Nuclear Science, Energy and Power Engineering, Shandong University, Jinan 250061, China
2
Department of Mechanical Engineering, University of Bath, Bath BA2 7AY, UK
3
Shenzhen Research Institute of Shandong University, Shenzhen 518057, China
*
Authors to whom correspondence should be addressed.
Appl. Sci. 2025, 15(7), 3586; https://doi.org/10.3390/app15073586
Submission received: 4 March 2025 / Revised: 20 March 2025 / Accepted: 21 March 2025 / Published: 25 March 2025

Abstract

:

Featured Application

We develop an integrated framework for component sizing and energy management in FCEVs; integrate economic and durability metrics using a weighting factor approach; analyze the impact of battery capacity and weighting factors on system performance; and evaluate the influence of battery pricing on fuel economy and system durability.

Abstract

Fuel economy and system durability are critical yet interdependent performance metrics for fuel cell hybrid vehicles (FCHVs). This paper devises an integrated framework for optimizing component sizing and energy management in a fuel cell/battery hybrid passenger vehicle. A unified cost function is proposed, combining fuel economy and system durability through a weighting coefficient, based on a comprehensive model of the hydrogen consumption and degradation characteristics of fuel cells and batteries. Utilizing the dynamic programming (DP) algorithm, the total cost is optimized to derive the optimal weighting factors and component sizing, effectively addressing the multi-objective optimization problem and balancing efficiency and durability. Furthermore, the impact of power prices on the optimal parameters is carefully examined. The simulation results indicate that a battery capacity of 44 Ah and a fuel cell maximum power of 80 kW represent the optimal sizing configuration. A weighting factor of 0.5 achieves the minimum equivalent total cost by effectively balancing fuel economy and system durability for the light-duty fuel cell passenger vehicle. Additionally, the battery price affects the weighting factor, indicating that future reductions in power source costs will shift focus away from system durability to fuel economy in FCHV optimization. These findings provide recommendations for FCHV manufacturers to advance the application of fuel cells in passenger vehicles.

1. Introduction

The pollutants released by conventional fuel vehicles have driven manufacturers to explore alternative energy sources [1]. To achieve a reduction in carbon emissions in the transportation sector, utilizing hydrogen (H2) as a primary fuel has become a key strategy [2]. As the electric vehicle (EV) market is experiencing unprecedented growth [3], fuel cell hybrid vehicles (FCHVs) present a viable solution for zero-carbon transportation [4], as they convert the chemical energy in hydrogen and oxygen into electricity, avoiding the limitations of the Carnot cycle, producing no pollutant gases, and operating without noise [5]. Among fuel cell technologies, proton exchange membrane fuel cells (PEMFCs) are the most advanced, offering a high power density, efficiency, low operating temperature, and rapid startup [6].
The powertrain system of an FCHV typically includes a battery package and a fuel cell stack (FCS) [7]. This configuration extends the operational lifespan of the fuel cell while also meeting dynamic power demands and facilitating regenerative braking energy recovery. Depending on their design, some vehicles operate primarily as battery electric vehicles with a fuel cell system serving as a range extender, while others use an FCS with a stack power output comparable to the electric motor’s power level. Effectively coordinating these two energy sources, optimizing energy flow allocation, and minimizing system costs have become critical challenges that need to be addressed.
In hybrid systems, an energy management strategy (EMS) is developed to achieve optimal power allocation. EMSs are generally classified into the following three categories: rule-based, optimization-based, and learning-based approaches [8]. Rule-based EMSs typically rely on engineering expertise, offering a straightforward structure, strong real-time performance, and notable robustness [9]. Common examples include the fuzzy logic strategy [10], the wavelet transform strategy [11], and the charge–depletion–charge–sustain (CDCS) strategies [12]. However, these designs largely depend on engineering experience and lack rigorous mathematical validation, which may limit their performance in complex hybrid systems [13]. Meanwhile, learning-based approaches, such as deep reinforcement learning, have been employed to develop EMSs for FCHVs [14]. Some methods have integrated environmental and look-ahead road information [15]. Nevertheless, these methods require extensive driving data and substantial onboard computing power to adapt to various driving conditions [16]. Optimization-based EMSs provide improved vehicle optimization, as they guarantee optimality. Commonly used methods include Pontryagin’s minimum principle (PMP) [17], convex programming [18], and dynamic programming (DP) [19]. The DP algorithm is a widely employed optimization method. However, its high computational complexity restricts its direct application in real-time control. During the phase of vehicle design, specifically in component sizing, the driving cycle is typically assumed to be fully known [20]. Therefore, employing DP to solve the EMS problem offline is deemed suitable in this context.
The specification of the objective function in the DP algorithm is critical for optimization. Hydrogen consumption is widely recognized in the literature as a key performance indicator for FCHV energy management and is often chosen as the objective function. Dominguez et al. [21] optimized fuel cell sizing using DP with fuel consumption as the objective function. However, the finite lifespan of power components introduces additional constraints. An improved system durability often comes at the cost of a reduced fuel economy. Highlighting the interdependence between these indicators, both fuel economy and system durability are considered as optimization objectives. Thus, balancing fuel economy and durability is essential for effective optimization. Hu et al. [22] addressed this by considering both factors and applying DP to achieve optimal results, which were implemented in real time using a soft-run strategy. Chen et al. [23] developed an EMS for FCHVs using an improved DP method and air supply optimization. By modifying the EMS cost function based on the energy allocation between the fuel cell and optimized air supply conditions, the study achieved minimal hydrogen consumption.
Achieving the optimal system design involves determining the appropriate sizes for the fuel cell stack and battery to minimize the total costs. Various methods have been developed based on vehicle performance requirements, offering robust solutions that align with industry standards. Xu et al. [24] proposed a theoretical model describing the relationship between powertrain parameters and vehicle performance. The study concluded the following effective methods for minimizing hydrogen consumption: reducing auxiliary power, recovering braking energy, improving fuel cell efficiency, and lowering battery resistance. KoteswaraRao et al. [25] introduced an optimal sizing approach for fuel cell electric vehicles within MATLAB/Simulink’s Advanced Vehicle Simulator (ADVISOR), which achieved approximately a 10.5% improvement in gradeability performance as compared to a benchmark fuel-cell-powered vehicle. Focusing on fuel cell/supercapacitor hybrid vehicles, Diego et al. [26] developed a power-based sizing methodology that was based on static and dynamic driving conditions. This suggests that it is better to adopt a trade-off solution, instead of a solution corresponding to the minimum consumption.
The performance of a propulsion system depends on its operation, which is governed by the EMS. The EMS directly influences the optimal sizing of system components, while the component sizes, in turn, affect the EMS performance, creating a coupling effect. To achieve the optimal vehicle performance, it is crucial to integrate the EMS design with component sizing, ensuring efficient power allocation and a balance between fuel economy and durability. Molina et al. [27] optimized the EMS of a range-extender fuel cell vehicle (FCREx) using PMP, identifying a 30 kWh battery and an 80 kW fuel cell as the most cost-effective configuration. Tazelaar et al. [28] employed the Equivalent Consumption Minimization Strategy (ECMS) to determine fuel cell and battery control setpoints, demonstrating that sizing based solely on average or peak power demand does not ensure the optimal hydrogen consumption. Hu et al. [29] simultaneously optimized the component sizing and power management for a fuel cell/battery hybrid bus, showing that the optimal fuel cell size depends on the average and standard deviation of power demand, while the optimal battery size is influenced by the range of regenerative power. Jeongwoo et al. [30] proposed a dual-loop framework combining sequential quadratic programming (SQP) and vehicle performance constraints, improving fuel economy by 14%. Xu et al. [31] integrated fuel economy and durability into a dual-loop framework to identify Pareto-optimal solutions, recommending a battery capacity of 150 Ah and an FCS maximum net output power of 40 kW. Wu et al. [18] incorporated durability costs into energy management and component sizing optimization using convex programming, determining that the optimal battery rated power and energy capacity for a plug-in fuel cell city logistics vehicle were approximately 54 kW and 29 kWh, independent of driving cycle variations.
Previous analyses suggest that the optimization of component sizing is strongly coupled with the design of the EMS. But these EMSs may only focus on fuel economy or fail to account for the fact that fuel economy and system durability vary with different sizing configurations. In terms of component sizing, researchers often caution against oversized batteries due to cost implications. However, most existing analyses remain qualitative and fail to quantify the economic impact of an increased battery capacity. Limited research has quantitatively addressed the balance between fuel efficiency and system durability.
It is essential to design an optimization framework that reintegrates the interdependent parameters in component sizing and energy management, where optimization variables include both the power source size and weighting factor. Additionally, a quantitative assessment of potential cost variations over time must be considered to ensure accurate results. This paper proposes an optimization framework for the optimal component sizing and energy management of an FCHV. The structure of the weighted multi-objective optimization is shown in Figure 1. The sizing problem determines the fuel cell size based on vehicle system design goals, effectively reducing the component sizing issue to a single-parameter representation of the battery size’s impact on the power source capacity. To transform the multi-objective optimization into a single-objective form, a cost function is developed to unify economic and durability metrics by weighting factors, and the weighted total cost is optimized to derive the optimal weighting factors and component sizing.
The remainder of this paper is organized as follows: Section 2 introduces mathematical models for fuel economy, system durability, and the powertrain of the FCHV. Section 3 defines the component sizing problem and details the energy management strategy, highlighting the use of DP to optimize the weighting factor and evaluate its impact under various powertrain configurations. Section 4 presents the simulation results, including a comparison of optimization outcomes with different sizing parameters and a sensitivity analysis of power source parameters and energy costs across various power source prices. Finally, Section 5 provides a summary of the key findings.

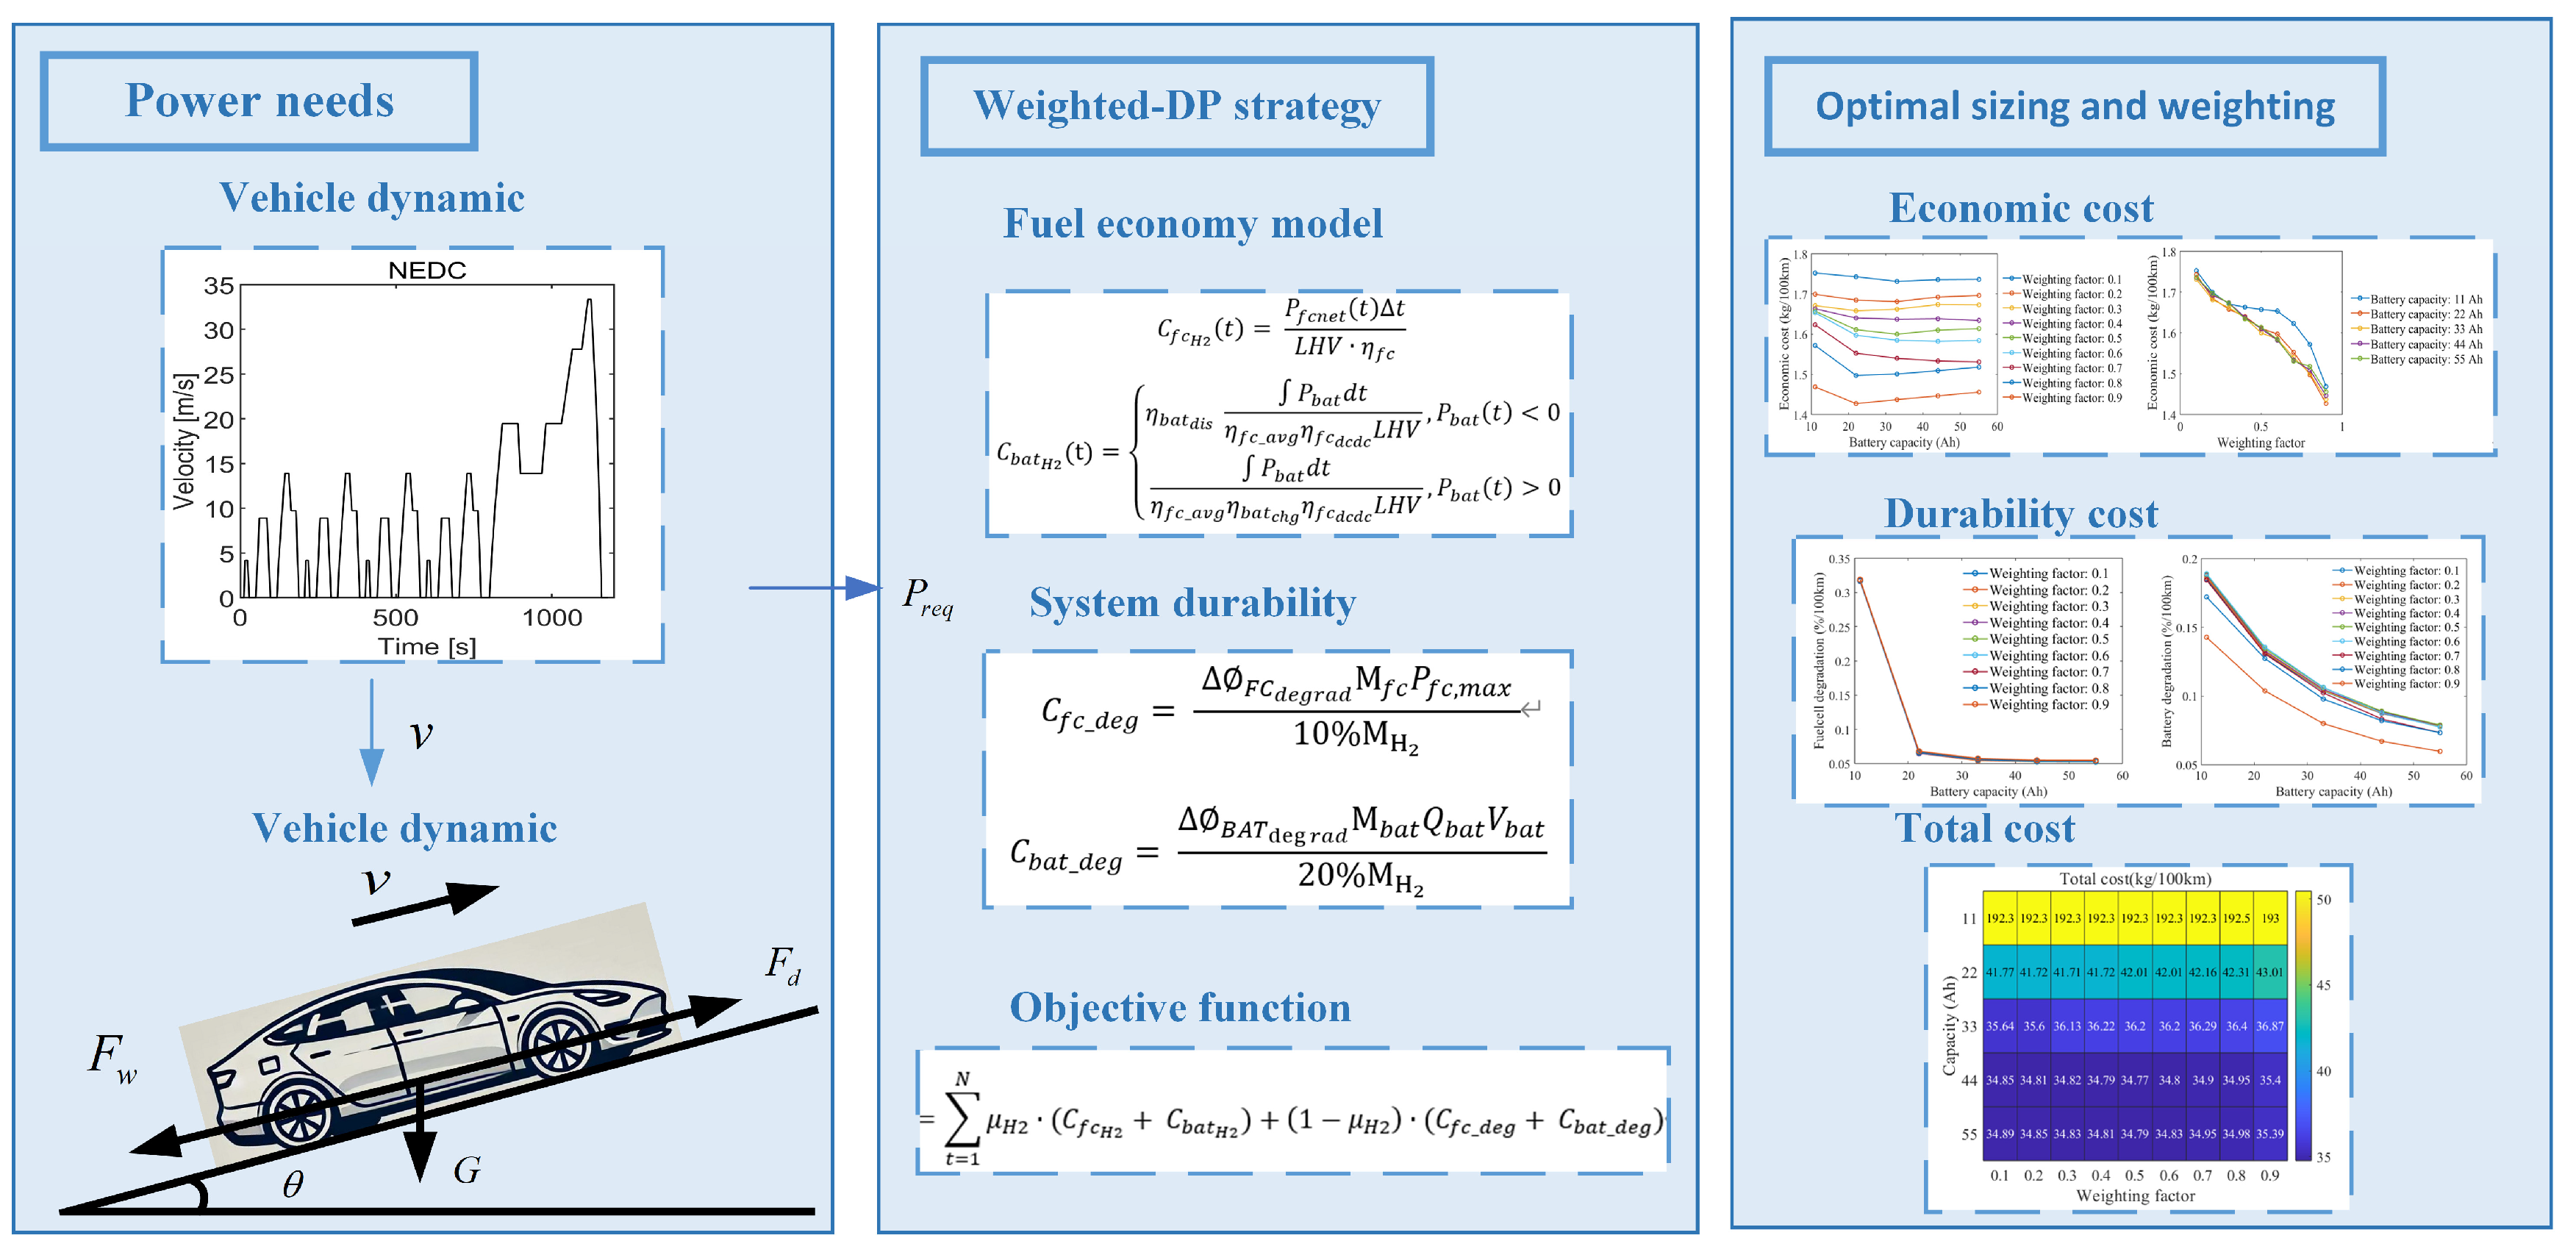
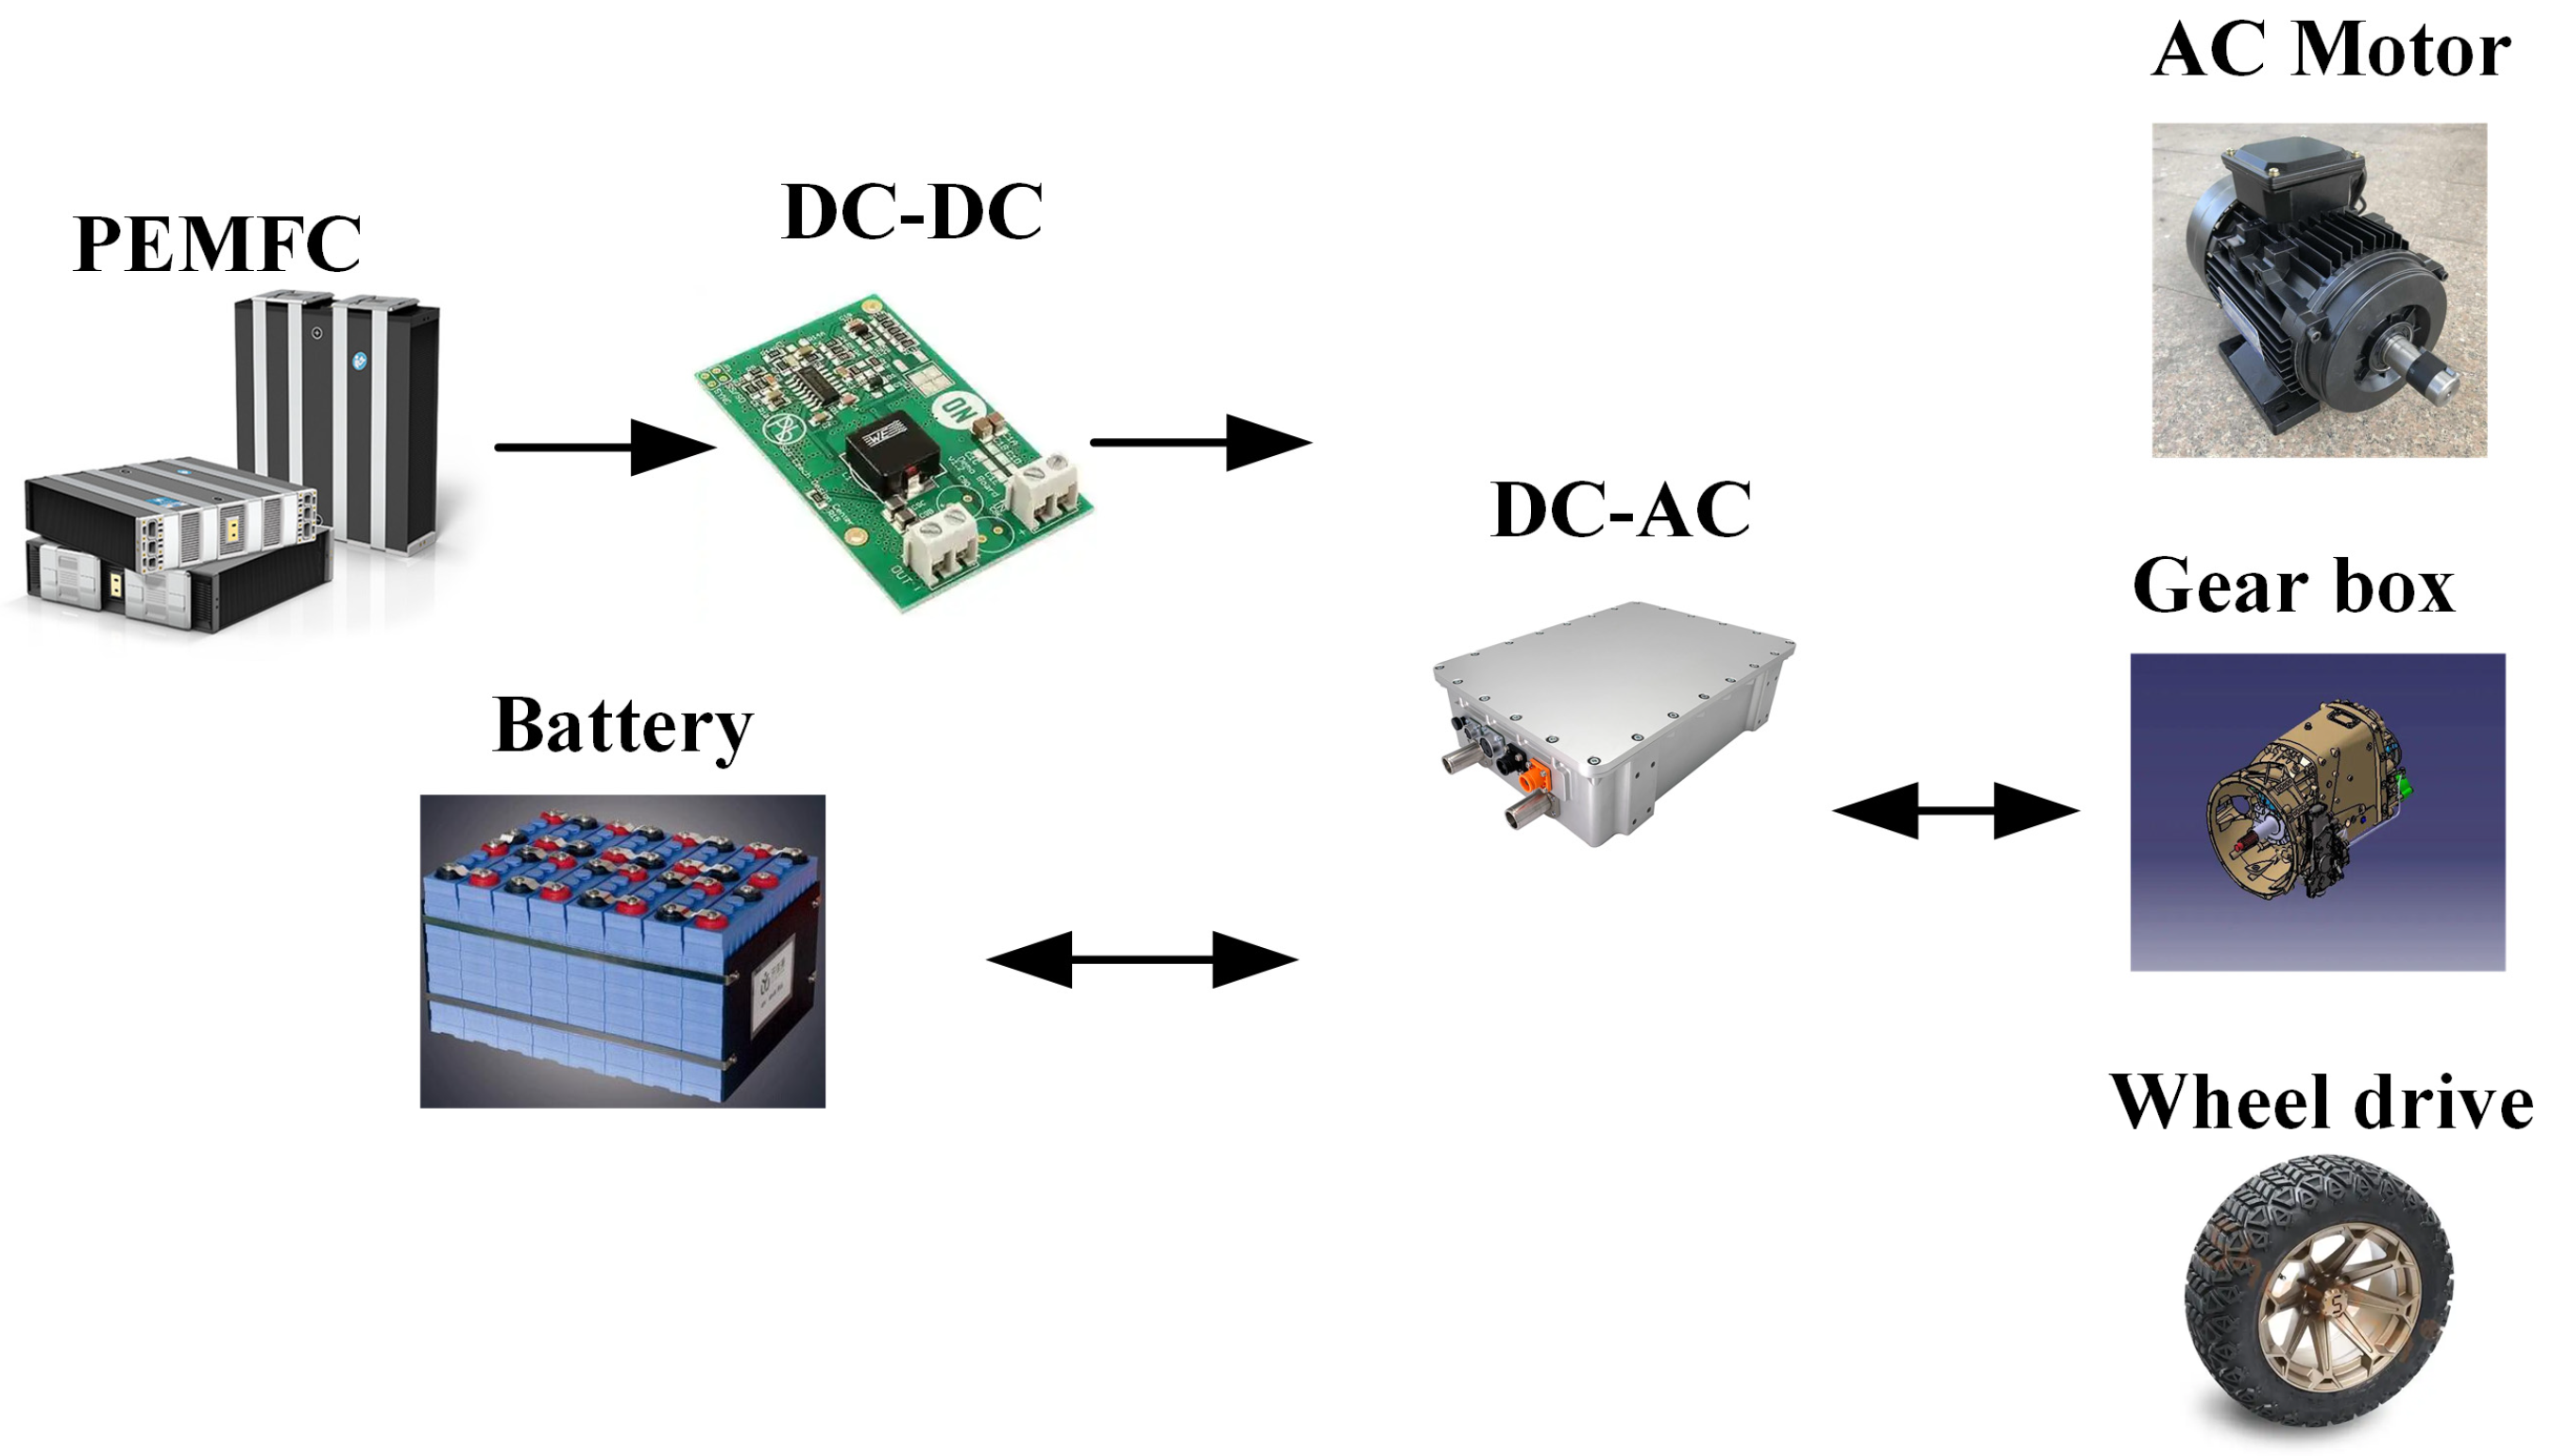
2. System Model Description

For FCHVs, developing an accurate powertrain model and clearly defining optimization objectives are critical for effective analysis. In this study, the primary modeling focus is on fuel economy and system durability, as these factors significantly influence the performance and longevity of the system.

2.1. Vehicle Longitudinal Dynamic Model

The hybrid power system in this study consists of a PEMFC and a Li battery. A DC–DC converter regulates the current output from the FCS to the DC bus, which is connected in parallel with the Li battery, ensuring a stable power distribution. The DC power is then converted into AC power to drive the electric motor, providing vehicle propulsion. Figure 2 presents a schematic of the system architecture, highlighting the energy flow and the key components of the hybrid system.
During the operation of the FCHV, it is essential to satisfy the dynamic equations governing the driving process. The input conditions must be converted into the required power for the vehicle using Equation (1).
P v e h i c l e t = v t m v g s i n θ + f c o s θ + 1 2 C d ρ F v t 2 + m v d v t d t
where v t is the velocity at the current time, m v is the vehicle mass, g is gravitational acceleration, θ is the road grade, μ is the rolling resistance coefficient, C d is the drag coefficient, ρ is the air density, and F is the frontal area of the vehicle. The vehicle mass can be expressed as follows in Equation (2):
m v = m v , b + P f c , m a x γ f c + Q b a t U b a t β b a t
where m v , b is the basic vehicle mass (excluding energy sources), P f c , m a x is the maximum output power of the fuel cell, Q b a t represents the rated capacity of the battery, Q b a t is the voltage value of the battery, γ f c is the power-to-weight ratio of the fuel cell, and β b a t is the specific energy of the battery.
Since the battery can recover energy during braking, when the power requirements are negative, this is considered as charging the battery. Additionally, due to losses in the motor and converter, the energy provided by the power sources must exceed the power demand of the operating conditions. Therefore, the demand power is represented as follows in Equation (3):
P r e q t =                             P v e h i c l e t η                                     P v e h i c l e t 0       η · η r e c o v e r y ·   P v e h i c l e t           P v e h i c l e t < 0
where η = η G B η m η d c a c accounts for the losses in the motor and converter, η G B , η m , and η d c a c are the efficiencies of the transmission, motor, and DC–AC converter, respectively, and η r e c o v e r y is the regenerative braking efficiency. These parameters are all considered as fixed constants. The total power demand from the power sources can be expressed as follows in Equation (4):
P r e q t = P b a t + η f c _ d c d c P f c n e t
where P b a t represents the output power of the battery, P f c n e t represents the output power of the FCS, and η f c _ d c d c represents the conversion efficiency of the fuel cell’s DC–DC converter, responsible for regulating and boosting the power delivered to the vehicle.
The key parameters of the FCHV are listed in Table 1. The parameters of the power sources, including the rated power of the FCS and the energy capacity of the battery pack, need to be matched and optimized.

2.2. Fuel Economy Model

The energy consumption of an FCHV includes both hydrogen and electric energy. To facilitate assessment, the energy consumption of the battery system is converted into equivalent hydrogen energy. This approach assumes an equal state of charge (SOC) at the beginning and end of the driving cycle, ensuring that the energy exchanged by the battery is accurately represented as hydrogen energy. Thus, fuel economy is defined as the hydrogen consumption of both the fuel cell and the battery during the driving cycle.
In the driving cycle simulation, the hydrogen consumption of the fuel cell system is treated as a discrete variable, and the hydrogen consumption can be calculated as follows in Equation (5):
C f c H 2 t = P f c n e t t t L H V · η f c
where L H V denotes the lower heating value of hydrogen, which is 120 MJ/kg. The index t corresponds to the time step within the driving cycle, while t represents the time increment for each step in the cycle. The FCS efficiency, η f c , is determined as a function of the FCS net power output using a lookup table.
The hydrogen consumption for the battery in this study is determined using an equivalent hydrogen consumption model.
C b a t H 2 ( t ) = η b a t d i s   P b a t d t η f c _ a v g η f c d c d c L H V , P b a t t < 0   P b a t d t η f c _ a v g η b a t c h g η f c d c d c L H V , P b a t t > 0
where η b a t c h g , η b a t d i s is the battery charge/discharge efficiency and η f c d c d c is the average efficiency of the fuel cell’s DC–DC converter. These efficiency parameters are all treated as constants.
In the power system of an FCHV, the battery functions as an auxiliary power source. The battery model adopted in this study is the Rint model, which characterizes the relationship between internal resistance, current, and voltage as described by Equation (7).
I b a t ( t ) = U b a t t U b a t 2 t 4 P b a t ( t ) R b a t ( t ) 2 R b a t
where I b a t ( t ) and R b a t ( t ) represent the current and resistance values of the battery at a given time step, respectively.
The state of charge (SOC) of the battery is calculated using Equation (8). The SOC decreases during power output and increases during regenerative braking, reflecting the dynamic energy flow within the system.
S O C t = S O C i n t η b a t Q b a t 0 t I b a t t d t
where S O C i n t denotes the initial state of charge and η b a t refers to the average efficiency of the battery during charging and discharging.

2.3. System Durability Model

After prolonged operation, adverse conditions such as idling, start–stop cycles, load variations, and high power loads can lead to voltage degradation in the fuel cell system. Similarly, the power battery undergoes irreversible degradation due to repetitive charge and discharge cycles over its operational lifespan. The modeling of system durability focuses on the degradation of both power sources.
Following the empirical formula presented by Pei in [32], the degradation of performance in an FCS F C deg r a d is described as follows:
F C d e g r a d e = K p k 1 t 1 + k 2 n 1 + k 3 t 2 + k 4 t 3
where F C d e g r a d e represents the performance degradation due to adverse operating conditions. t 1 , t 2 , and t 3 are the duration of adverse operating conditions and n 1 is the number of complete start–stop cycles. Other parameters are degradation coefficients, with specific meanings and values detailed in Table 2.
The battery also incurs performance losses during operation, and the performance degradation of the lithium battery is defined as the percentage of capacity loss. According to the study in [33], the formula for calculating the percentage of battery loss is given by Equation (10), as follows:
B A T d e g r a d e = A · e E a + B C R R g T A h z
where E a is the activation energy, C R is the current flux, R g is the gas constant, T is the absolute temperature, A h is the Ah-throughput, and Z is the power law factor.
In simulations, the inherently discrete nature of the data introduces deviations between the simulated Ah values per unit time and the experimental results obtained using the continuous formula. To enhance computational accuracy, the continuous equation is reformulated into a discrete form suitable for numerical analysis. The discretized model is expressed through Equations (10)–(12), as follows:
B A T d e g r a d e = A h z A 1 z · e E a + B C R z R g T B A T d e g r a d e z 1 z
A h = 1 3600 t p t p + 1 I b a t  
where B A T d e g r a d e is treated as a constant, and temperature T is assumed to remain constant during calculations.

2.4. Equivalent Degradation Model

Fuel economy and system durability are generally treated as a multi-objective optimization problem. To simplify the analysis, this study converts the durability metric into an economic indicator for assessment. The equivalent hydrogen consumption due to fuel cell degradation is expressed as follows:
C f c _ d e g =   F C d e g r a d M f c P f c , m a x   10 % M H 2
where M f c is the price of the fuel cell price per kilowatt and M H 2 is the price of hydrogen. The 10% represents the maximum allowable performance degradation of the fuel cell.
For battery degradation, a similar approach can be adopted. However, considering that changes in battery capacity affect the battery price, it is important to note that the battery price does not increase linearly with capacity. As the battery capacity increases, the cost growth rate tends to diminish. Therefore, a price decay factor is introduced, allowing the battery cost to be expressed as follows in Equation (14):
C b a t _ d e g = B A T deg r a d M b a t Q b a t V b a t 20 % M H 2
where M b a t is the price of the battery per kWh, with the price parameters detailed in Table 3. The specific pricing data are based on [18], which remain accurate for the costs of both batteries and hydrogen. However, as the price of an FCS has significantly decreased since the publication of the reference, according to [34], the cost of fuel cells decreases by approximately 5% annually. To align with current market trends, slightly lower values are adopted in this study to account for the ongoing reduction in fuel cell prices.

2.5. Dynamic Programming

The DP algorithm calculates the minimum cost between state points using a backward iteration process. It then determines the optimal path through a forward-solving approach. This method transforms the multi-stage decision-making process into a single-stage optimization, thereby substantially enhancing computational efficiency.
Specifically, starting from the last moment T of the driving cycle, the algorithm calculates the possible costs associated with each different SOC at that moment. The cost value depends on the input variables at that time and the minimum cost is determined, as summarized in Equation (15).
L T , o p t S O C N = min L T P b a t , i
Once the costs for all SOC levels at the current time are computed, the same method is employed to calculate the costs at the previous moment L T 1 , o p t . It is important to note that there exists a transition relationship between the SOC values at these two time points, which reflects how the battery’s SOC varies with changes in the input variables, as described by Equation (4). At this stage, the cost function must also incorporate the terminal cost, as summarized in Equation (16).
L T 1 , o p t S O C N = min ( L T 1 P b a t , i + L T , o p t S O C n e x t )
After iterating through all time points, the algorithm will yield an optimal input variable matrix and a cost matrix for each state point at every moment. By inputting the initial SOC, the minimum total cost at that time can be computed. Thus, the optimization problem of the algorithm can be expressed as follows:
min J = t = 1 T L x t , u t  

3. Power Sizing and Energy Management Strategy

The energy management strategy plays a pivotal role in distributing power output between the fuel cell and the battery, directly influencing the economic performance and durability of fuel cell vehicles. By optimizing hydrogen consumption efficiency and mitigating the degradation of energy sources, this strategy extends the overall system lifespan. However, its effectiveness is highly dependent on the sizing parameters of the power sources, highlighting the importance of determining optimal parameter configurations.

3.1. Component Sizing Problem

The sizing of energy sources in a vehicle’s power system is a critical factor influencing its performance, efficiency, and overall cost. Selecting appropriate dimensions is essential, as undersized energy sources may fail to meet performance demands, while oversized ones result in increased manufacturing costs.
In light-duty passenger vehicles where the FCS serves as the primary power source rather than functioning as a range extender and in plug-in hybrid configurations, it is imperative that the FCS satisfies the performance specifications of the powertrain. Predefining the FCS dimensions based on these operational requirements presents a pragmatic design strategy. This is particularly critical, as the concurrent optimization of multiple interdependent parameters—including fuel cell stack sizing, battery capacity sizing, economy, and system durability—introduces significant computational complexity. The proposed sizing methodology not only guarantees compliance with powertrain performance constraints, but also streamlines the multi-objective optimization process through design space reduction. Consequently, it enables an enhanced system-level trade-off analysis between energy economy and component durability.
The proposed methodology focuses on meeting power requirements as the foundation for sizing. To determine the fuel cell parameters, a testing-based method is utilized, aiming to ensure that the performance criteria are met. Specifically, the maximum power outputs of the fuel cell and the battery capacity are determined according to the approach in [26].
The fuel cell’s maximum power output is evaluated using the following two key tests: (1) it must sustain the vehicle’s maximum speed and (2) it must maintain speed under a constant road grade. The parameters used for the described tests are collected in Table 4.
Test 1: P b a t = 0 , v = v s 1 , a = 0 , α = 0 .
P f c , 1 = P r e q t η f c d c d c
Test 2: P b a t = 0 , v = v s 2 , a = 0 , α = α s .
P f c , 2 = P r e q t η f c d c d c
To ensure that the vehicle maintains a sufficient power reserve, a reserve power coefficient of 1.2 is incorporated into the calculations.
P f c , m a x = 1.2 m a x P f c , 1 , P f c , 2  
Both P f c , m a x and Q b a t are initially unknown when calculating the required power. As the energy source sizes increase, the required power correspondingly grows. To resolve this, the battery capacity is initially set to its minimum value and the maximum fuel cell power is iteratively updated until the difference between the assumed and final values converges to 10 6 .
Through simulation experiments, the maximum power output of the fuel cell is determined to be 80.6 kW.
The selection of battery capacity will be determined in conjunction with the EMS, as detailed in Section 3.2. It is important to note in advance that variations in battery capacity will be achieved by parallelizing battery cells. In this study, a single L i F e P O 4 battery cell with a capacity of 11 Ah is used.

3.2. Optimization Problem Formulation

The EMS is implemented using a dynamic programming algorithm to optimize the objective function over the driving cycle. A multi-objective optimization problem combining component sizing and the EMS is defined as follows:
min J x = t = 1 N μ H 2 · ( C f c H 2 +   C b a t H 2 ) + 1 μ H 2 · ( C f c _ d e g +   C b a t _ d e g )
s . t . x = μ H 2 , Q b a t T U v = v c y c l e t   t 0 , N 1 S O C L S O C S O C H S O C 0 S O C e n d S O C P b a t , m i n P b a t P b a t , m a x 0 P f c P f c , m a x  
where J represents the total cost, comprising the following two main components: the economic cost, which accounts for the hydrogen consumption of the FCS and battery, and the durability cost, which reflects the degradation of both the FCS and battery. μ H 2 represents the economic cost coefficient, which signifies the weight in the energy management strategy. Specifically, when μ H 2 = 0.5 , it indicates an equal weighting between the fuel economic cost and the system durability cost. If μ H 2 is greater than 0.5, it indicates that the energy management strategy prioritizes the minimization of hydrogen consumption. The NEDC (New European Driving Cycle) is used as the speed demand profile. U is the optimization space, as follows:
U = Q b a t   11,22,33,44,55 A h μ H 2 0.1,0.2,0.3,0.4,0.5,0.6,0.7,0.8,0.9  
In FCHVs, the battery voltage is typically boosted to match the bus voltage V b u s , which significantly impacts driving efficiency. The bus voltage is generally set in the range of 300–400 V. The maximum power limit of the battery is defined as follows:
P b a t m i n =   V b u s m a x     V o c v V b u s m a x R b a t c h g P b a t m a x =   V b u s m i n     V o c v V b u s m i n R b a t d i s
where V o c v is the open-circuit voltage of the battery, V b u s m a x and V b u s m i n represent the upper and lower limits of the bus voltage, and R b a t c h g and R b a t d i s correspond to the battery’s charging resistance and discharging resistance.
To ensure that the parameters remain within the specified constraints, a penalty function should be employed to increase the cost associated with exceeding these constraints. For SOC, the primary consideration is to keep it within the defined limits, meaning that it should not be overcharged or excessively discharged. The next step is to ensure that the SOC at the final time point equals that at the initial time point. Therefore, a penalty function is designed by the principles outlined in reference [5], as follows:
C s o c = 1 + α S O C S O C H + 1 2 , S O C S O C H , 1 0 , S O C S O C L , S O C H 1 + α S O C L S O C + 1 2 , S O C 0 , S O C L  
C s o c , e n d = 1 + α S O C S O C e n d + 1 2 , S O C 0 , S O C e n d ε 0 , S O C S O C e n d ε , S O C e n d + ε 1 + α S O C e n d S O C + 1 2 , S O C S O C e n d + ε , 1
where k l i m l i t is a sufficiently large penalty coefficient, typically set to 105, and ε represents the discretization step size of the SOC matrix. This approach enables the transformation of the constrained optimization problem defined in Equation (21) into an unconstrained optimization problem, as shown in Equations (26) and (27).
L x t , u t ´ = μ H 2 · ( C f c H 2 +   C b a t H 2 ) + 1 μ H 2 · ( C f c _ d e g +   C b a t _ d e g )                               + C s o c , e n d                                                                                                                                                        
min J x = t = 1 N L x t , u t ´  

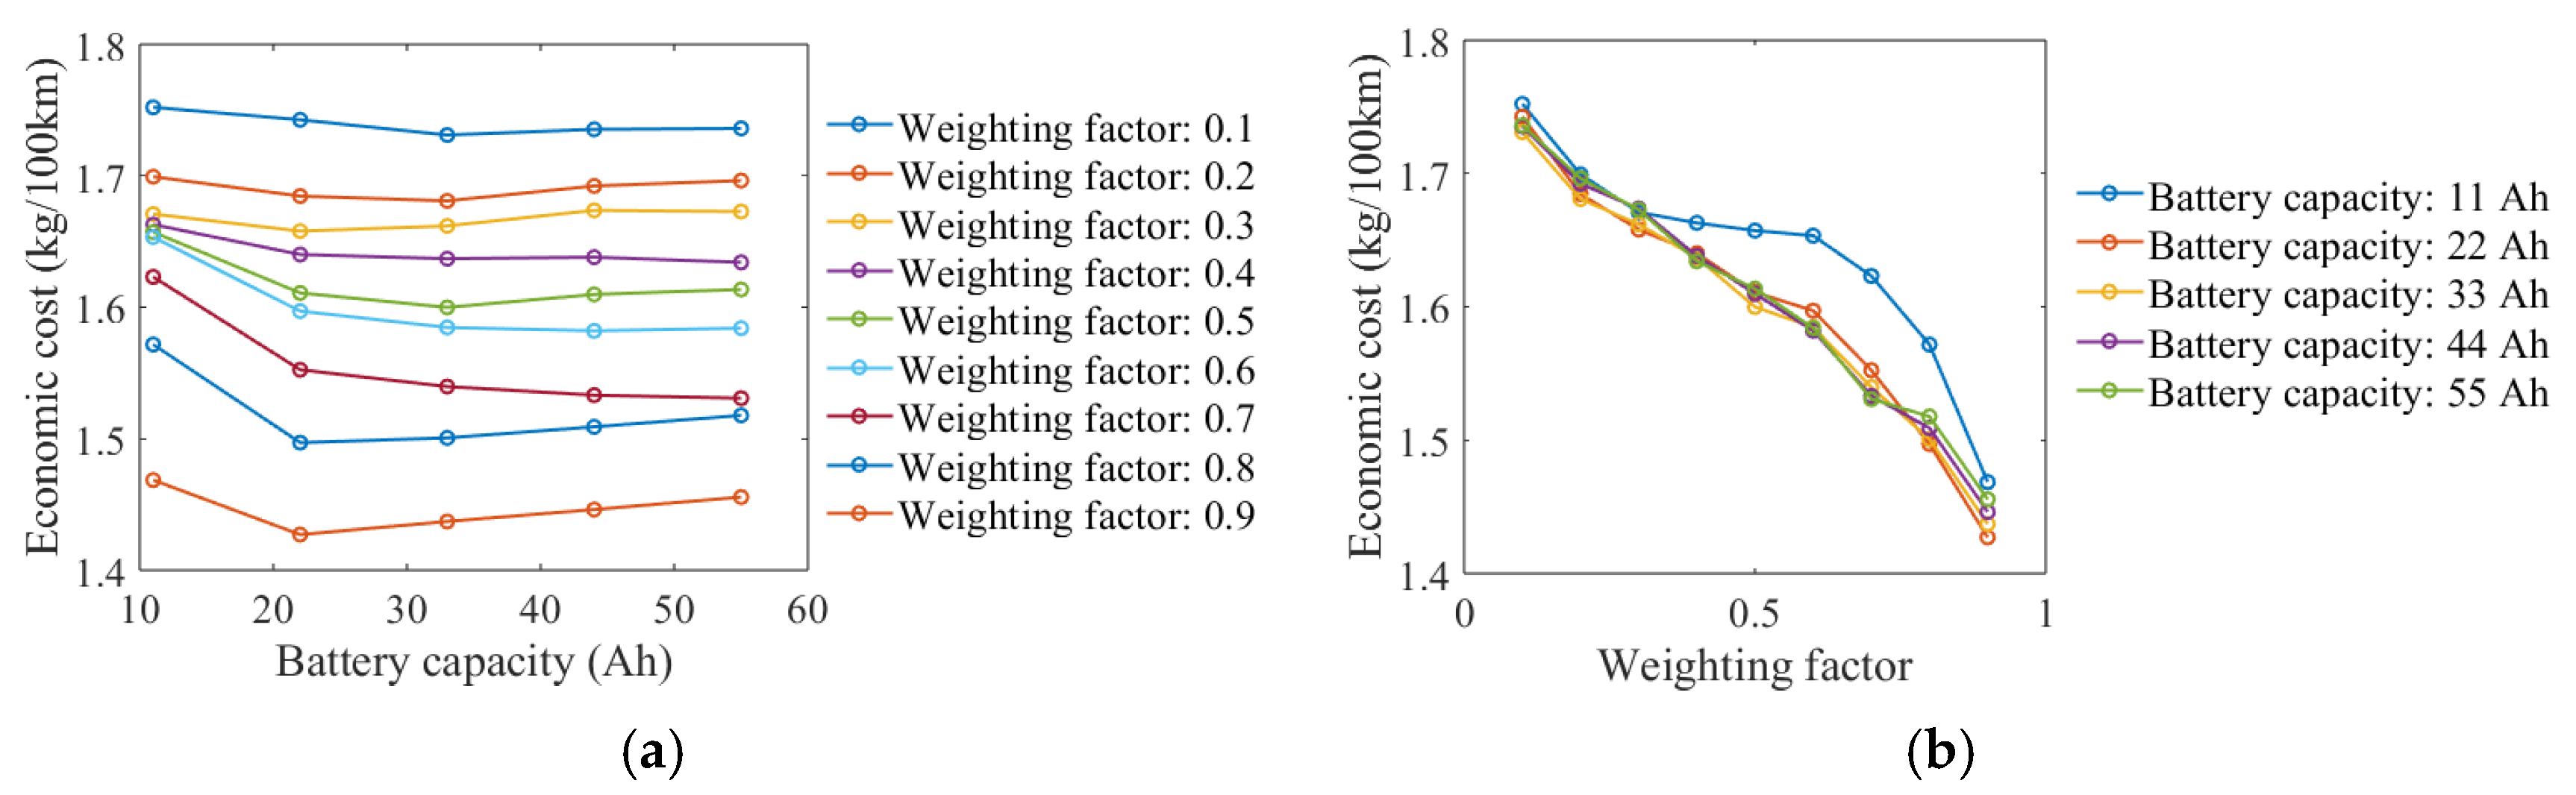
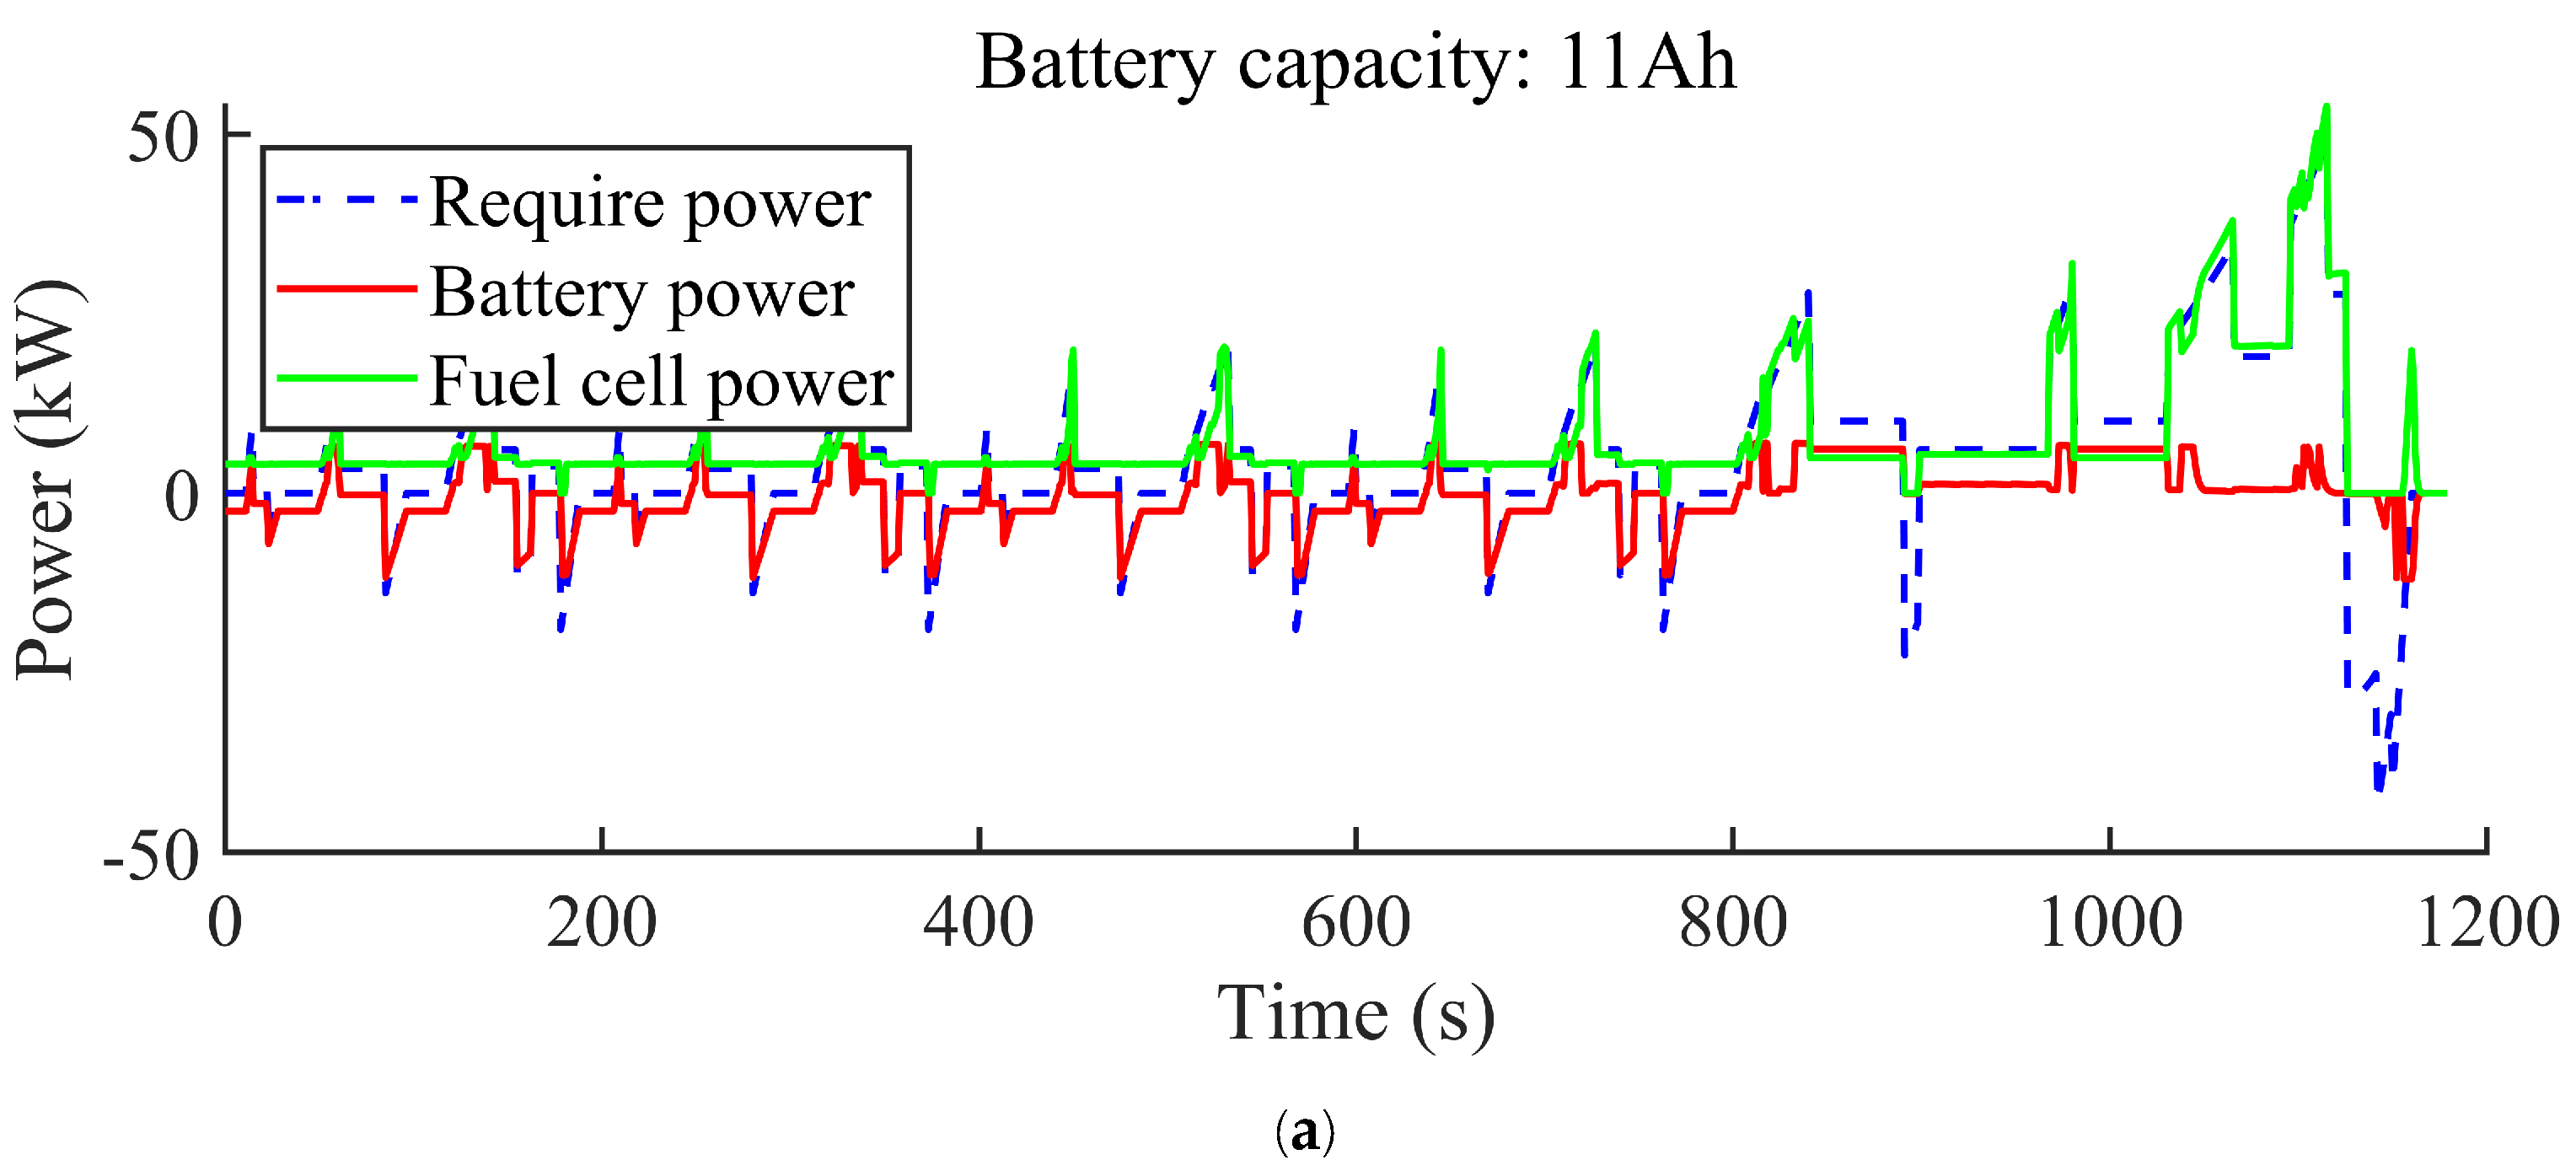
4. Results and Discussion

In this section, the dynamic programming algorithm is utilized to optimize each parameter. The results are subsequently compared and analyzed to validate the effectiveness of the algorithm and evaluate the influence of parameter selection.

4.1. Fuel Economic

Figure 3 illustrates the variation in economic costs concerning battery capacity and the weighting factor. As illustrated in Figure 3a, as the battery capacity increases, the economic cost initially decreases and rises, demonstrating a non-linear trend. Additionally, it can be observed that, as the weighting factor increases, the turning point gradually shifts to a smaller value.
As illustrated in Figure 4, the increase in economic costs under an insufficient battery capacity arises from the critical role of the battery in regenerative braking and dynamic power supply. A limited battery capacity prevents the system from fully utilizing braking energy and providing adequate dynamic power, reducing energy efficiency and incurring higher economic costs. In Figure 4a, it is evident that, during certain periods, the FCS does not maintain its minimum output, but rather shuts down. This occurs because the battery, due to an insufficient capacity, cannot absorb additional regenerative braking energy, preventing the fuel cell from recharging, and, thus, it must be deactivated. In contrast, as the battery capacity increases, as shown in Figure 4b, the fuel cell remains operational without shutting down.
An increase in battery capacity enhances the maximum charge and discharge power, enabling the battery to absorb more regenerative braking energy and provide an improved dynamic response. While the increased absorption of braking energy reduces costs, the improved dynamic response incurs additional costs. This combined effect initially leads to a net reduction in economic costs. As shown in Figure 4b,c, although the 33 Ah battery outputs slightly more than the 22 Ah version, this difference is marginal and does not significantly affect the overall trend.
However, once the battery capacity exceeds a certain threshold, the system reaches a point where the battery can fully absorb all braking energy, and its dynamic response performance is optimized. Beyond this point, further increases in battery capacity contribute to additional system weight, leading to a higher power demand and ultimately increasing the total economic cost. Additionally, it is important to note that, in the final stages of braking, where rapid deceleration occurs, the battery does not fully absorb all of the regenerative braking energy. This is due to the high braking power in these final moments, which exceeds the battery’s maximum power output, limiting its ability to absorb the full amount of regenerative energy.
As shown in Figure 3b, economic cost exhibits a relatively lower sensitivity to variations in battery capacity compared to changes in the weighting coefficient. The figure reveals a significant reduction in economic cost with an increasing weighting factor, driven by the EMS’s prioritization of routes with a lower hydrogen consumption.
Although both the weighting coefficient and battery capacity influence energy distribution by altering the FC output power, their underlying mechanisms are fundamentally different. An insufficient battery capacity restricts dynamic power supply, limiting the system’s ability to meet transient demands and forcing the FC to deliver high power to compensate. Conversely, a low weighting factor drives the EMS to prioritize fuel economy by favoring FC operation within higher-efficiency regions. This strategy also requires the FC to sustain a high power output, even under less favorable operating conditions. These contrasting mechanisms underscore their distinct impacts on energy management strategies.
The changes induced by the weighting factor are more distinct compared to those resulting from battery capacity, as evidenced in Figure 5. It is clear that, when the weighting factor is set to 0.1, as shown in Figure 5a, he output power of the FCS closely matches the demand power. This indicates that, at this weighting factor, the EMS prioritizes durability, ensuring that the fuel cell remains active to provide stable power and avoid entering unfavorable operational conditions while minimizing battery degradation before such conditions arise.
As the weighting factor increases to 0.3 and 0.5, as shown in Figure 5b,c, a noticeable reduction in fuel cell output power occurs. In these scenarios, the battery plays a more significant role in alleviating dynamic power demands. When the weighting factor reaches 0.7, as depicted in Figure 5d, fuel cell shutdowns begin to occur. This is because the EMS increasingly emphasizes economic efficiency, determining that recharging the battery via the fuel cell results in economic losses. Finally, when the weighting factor is set to 0.9, as shown in Figure 5e, fuel cell shutdowns become more frequent. At this point, the system only seeks to meet the required power demand, without regard for whether the fuel cell is operating under unfavorable conditions.

4.2. System Durability Cost

From a durability perspective, a limited battery capacity intensifies the dynamic power demands on the FCS, as the reduced power output from the battery is insufficient to effectively buffer these fluctuations. Consequently, the FCS is forced to operate under suboptimal conditions, accelerating its degradation. In contrast, when the battery has sufficient capacity to accommodate dynamic power demands, the durability cost is significantly reduced and eventually stabilizes.
From the perspective of durability costs, the primary concern is the specific degradation of energy sources. Increasing the battery capacity helps to mitigate this issue by reducing the duration for which the FCS operates under unfavorable conditions, thereby significantly lowering fuel cell degradation, as shown in Figure 6a. At a battery capacity of 11 Ah, fuel cell degradation is particularly pronounced. When the battery capacity is too small, the fuel cell must frequently shut down, and the associated start–stop cycles lead to substantial degradation, making the degradation at 11 Ah significantly higher than that in other scenarios.
At a battery capacity of 44 Ah, the fuel cell system operates under near-optimal conditions, where degradation is minimized. Beyond this point, further increases in battery capacity result in diminishing returns in terms of reducing degradation. Additionally, larger battery capacities reduce the current demand per cell for equivalent power outputs, leading to lower discharge rates and further mitigating battery degradation costs, as shown in Figure 6b.
As previously mentioned, increasing the weighting coefficient reduces economic costs. However, this comes at the expense of higher durability costs. FC degradation is the primary contributor to durability costs, as shown in Figure 7a. In contrast, BAT degradation exhibits a declining trend at lower weighting factors, as shown in Figure 7b. This behavior arises because, under these conditions, the EMS prioritizes system durability. Given the higher cost of the FC compared to the BAT, the EMS minimizes unfavorable operating conditions for the FC, resulting in the BAT handling more dynamic power demands. Consequently, the BAT experiences relatively higher degradation, as its power output is ultimately derived from the FC, incurring additional economic costs. As the weighting factor increases, the emphasis on economic costs grows. Compared to durability degradation, the economic losses associated with the BAT power output change more rapidly. In the intermediate range of weighting factors, the BAT power output increases to balance economic and durability trade-offs, leading to a slight rise in durability degradation. However, at higher weighting factors, where economic cost considerations dominate, the EMS places a greater emphasis on minimizing the economic losses associated with the BAT power output. As a result, the BAT power output decreases, and the FC assumes a greater share of the dynamic power demands.

4.3. Total Cost

Figure 8 presents the total costs, comprising economic costs and durability costs, under varying battery capacities and weighting coefficients, with the maximum fuel cell power predefined. The results show that, as the weighting coefficient increases, the total cost first decreases and then increases. Similarly, with an increasing battery capacity, the total cost first decreases and then increases. The total system cost exhibits a significantly higher sensitivity to variations in battery capacity compared to changes in the weighting factor. The analysis reveals that the minimum total cost is achieved when the weighting coefficient is set to 0.5 and the battery capacity is 44 Ah.
To demonstrate that using the weighting factor to normalize fuel economy and system durability into a single objective function effectively reduces total costs, a comparison is made between scenarios considering only fuel economy, only system durability, and the use of Pareto front analysis. The comparison evaluates the selection of the minimum economic cost with an appropriate durability cost, as well as the minimum economic cost with a suitable durability cost, as shown in Table 5.
It can be found that using the weighting factor minimizes the total cost and reduces the economic cost by 1%, the FC decay level by 1%, and the BAT decay level by 13%, but reduces the total cost by 1%, as compared to using the Pareto frontier to consider the optimal system durability.

4.4. Price Impact

According to [35], the price of batteries declines at a rate of around 11% per year. Therefore, this section will discuss the relationship between power source price and the economic cost coefficient.
Figure 9 illustrates the variation in the total costs with an increase in years and the weighting factor. It can be observed that the total costs gradually decrease as the years increase. In the first three years, the minimum cost is reached when the weighting factor is 0.5. However, in the fourth year, after the battery price drops for the third time, the minimum cost occurs at a weighting factor of 0.6. This indicates that system durability is no longer the primary limiting factor. In the future, it will be crucial to consider the actual operating conditions and make specific price adjustments to optimize the economic cost coefficient, thereby minimizing the total system costs.

5. Conclusions

This paper proposes an integrated framework for optimizing component sizing and energy management in a fuel cell/battery hybrid passenger vehicle. The framework integrates fuel economy and system durability into a single objective function through a weighting coefficient. It examines the variation in costs under different weighting factors and considers the impact of component sizing by the DP algorithm. Furthermore, the effects of power prices on the optimal parameters are systematically investigated. The key findings are summarized as follows:
(1)
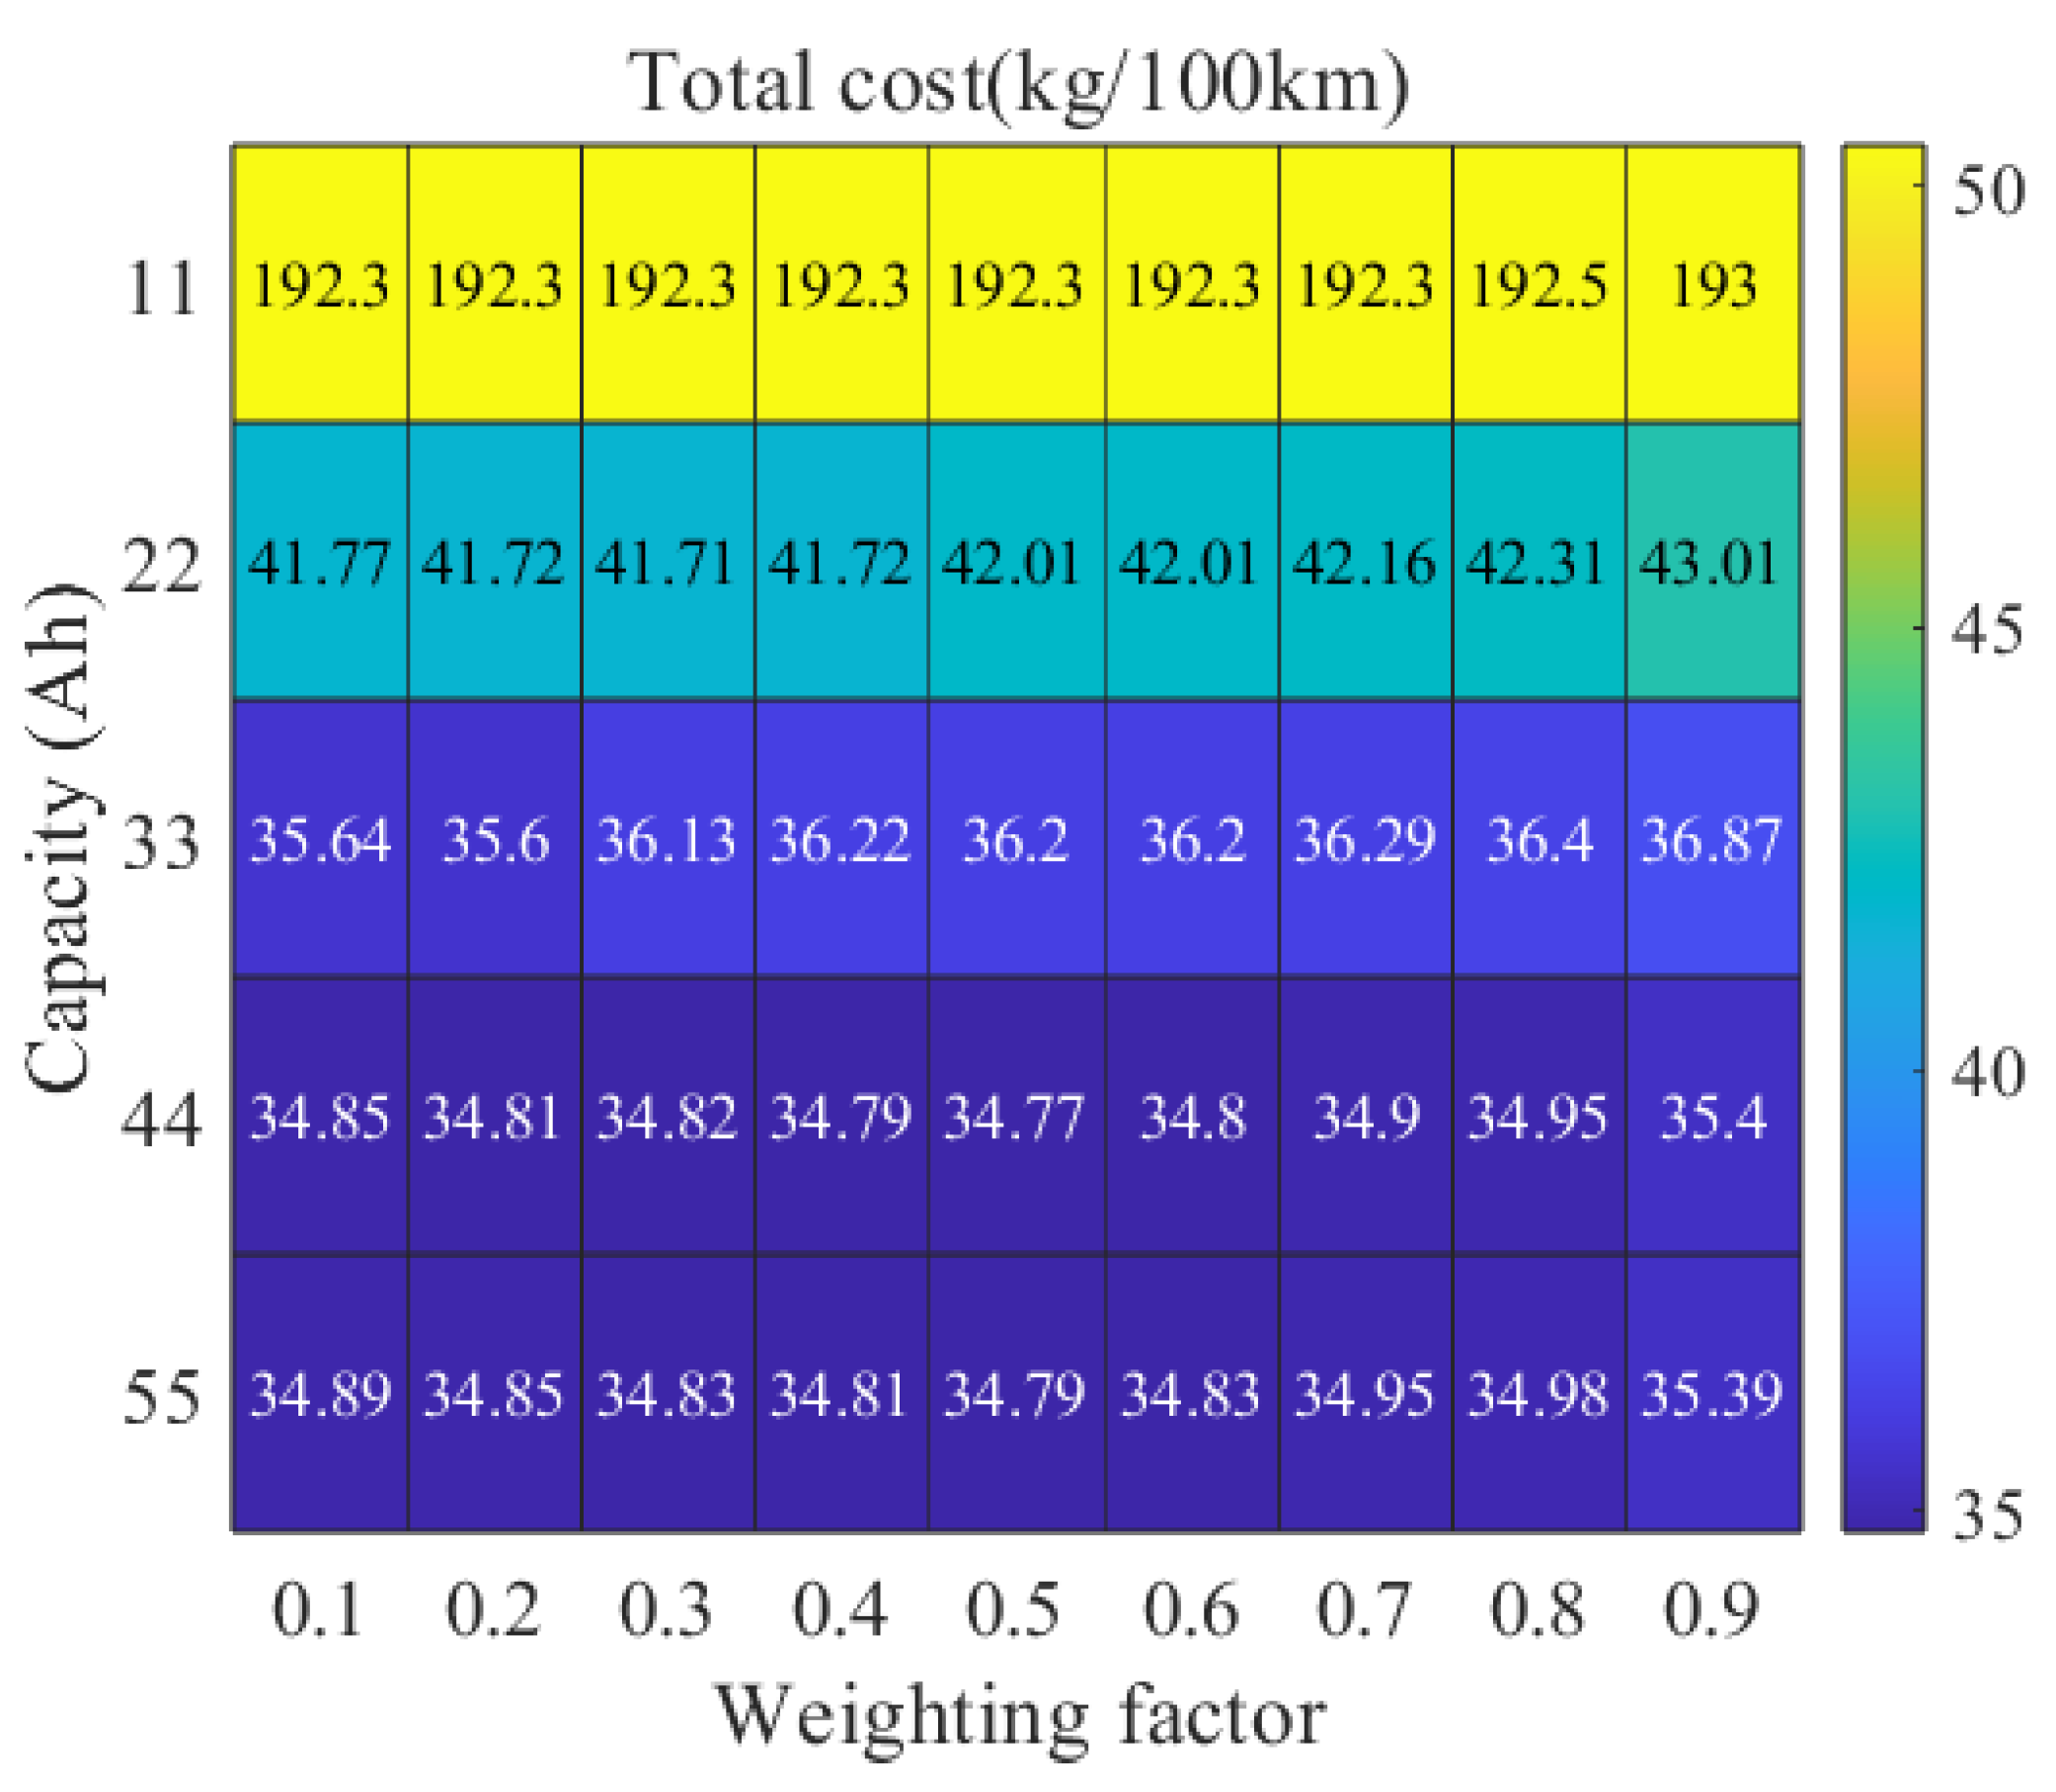
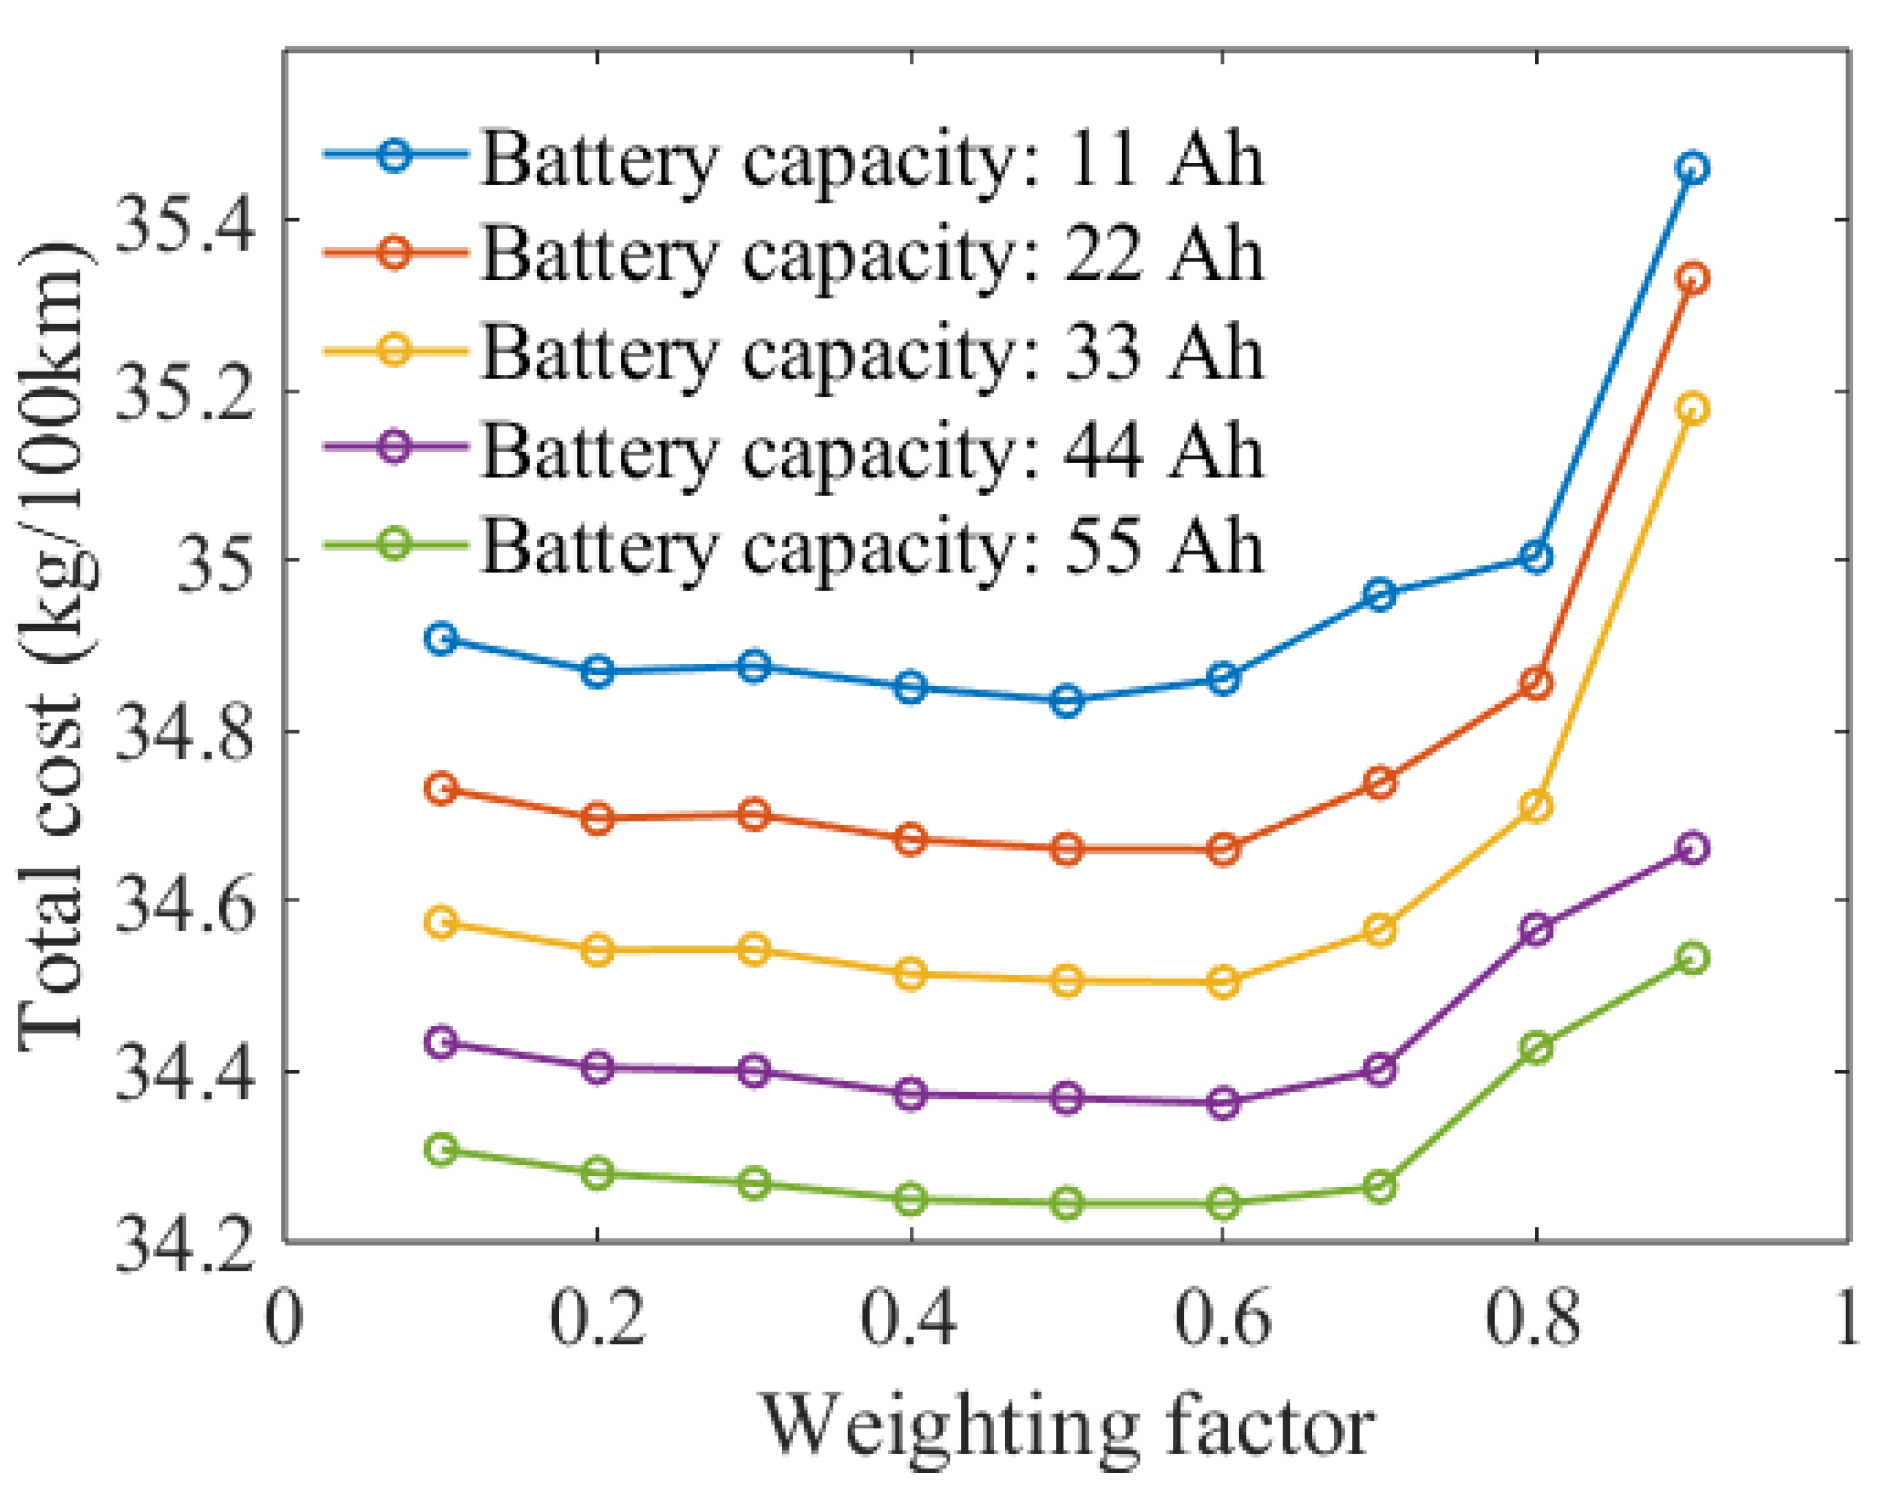
Based on the NEDC, a battery capacity of approximately 44 Ah, a maximum fuel cell power of 80 kW, and a weighting factor of 0.5 achieve an optimal balance between fuel economy and system durability in light-duty fuel cell passenger vehicles. Total costs are reduced by 1% compared to selecting the optimal system durability using the Pareto frontier.
(2)
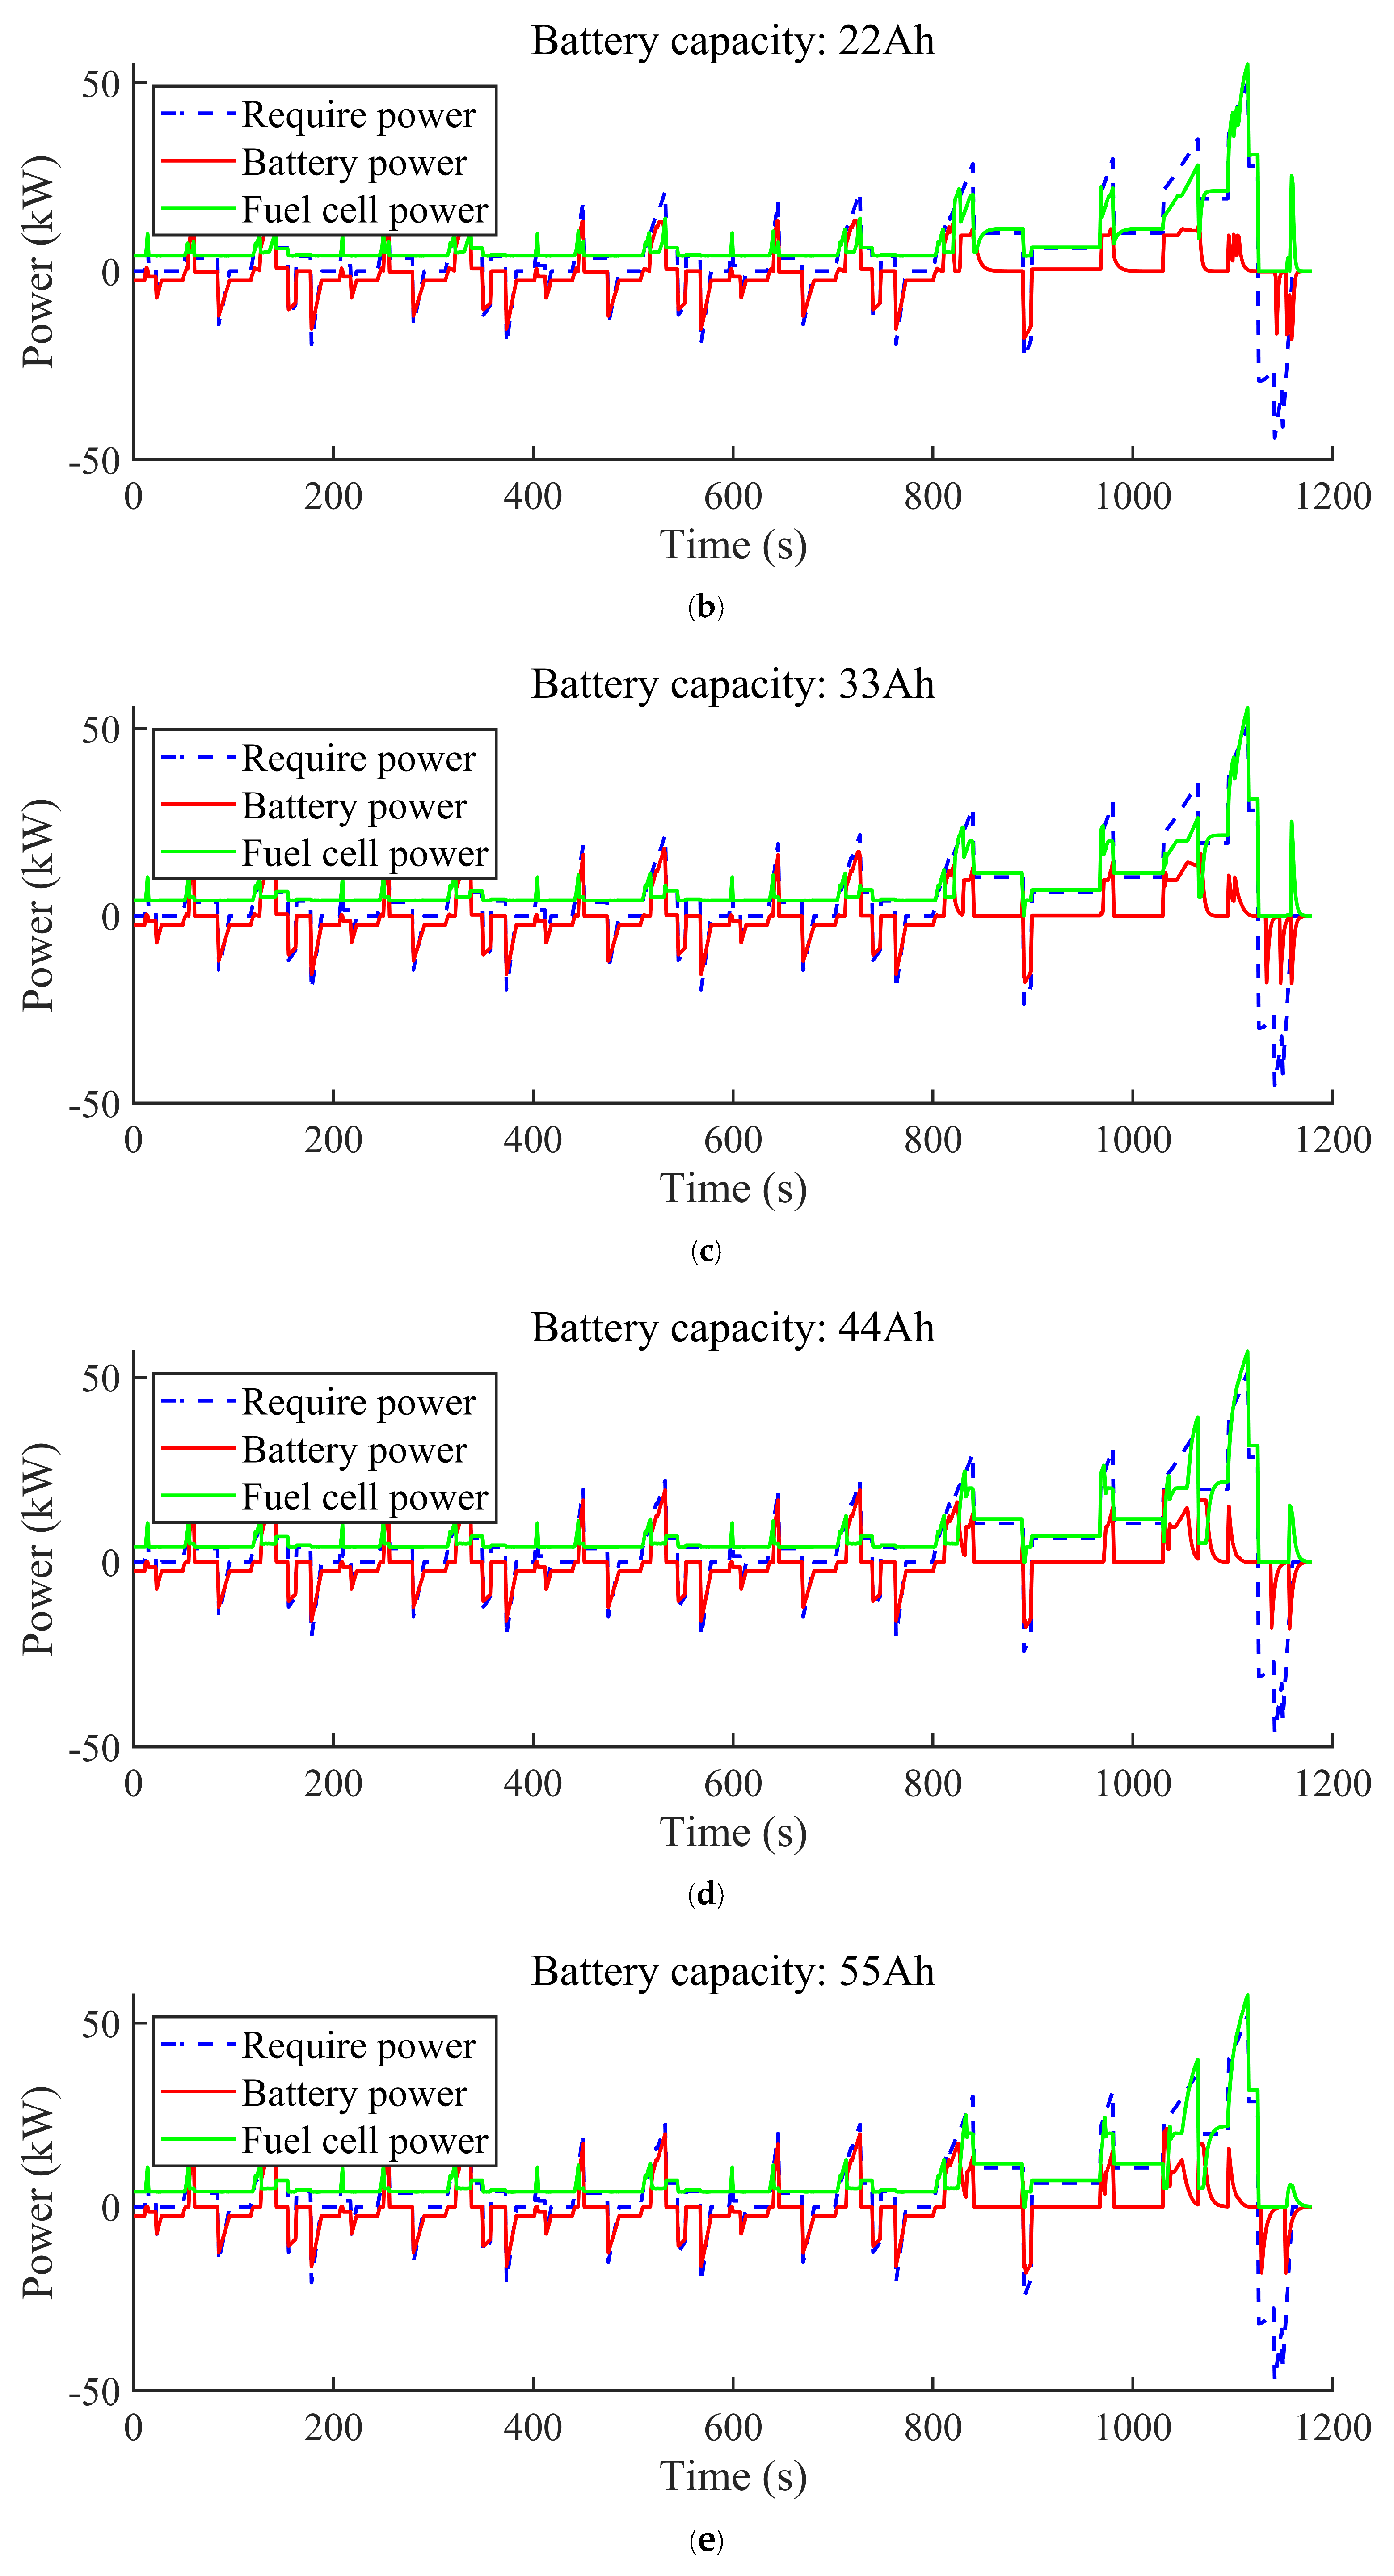
Increasing the battery capacity can effectively reduce the total operational costs of FCHVs by minimizing per kilometer battery degradation and providing sufficient dynamic power. However, once the battery capacity reaches a level sufficient to deliver optimal dynamic power, further increases in capacity lead to a higher price and weight, thereby raising the total costs.
(3)
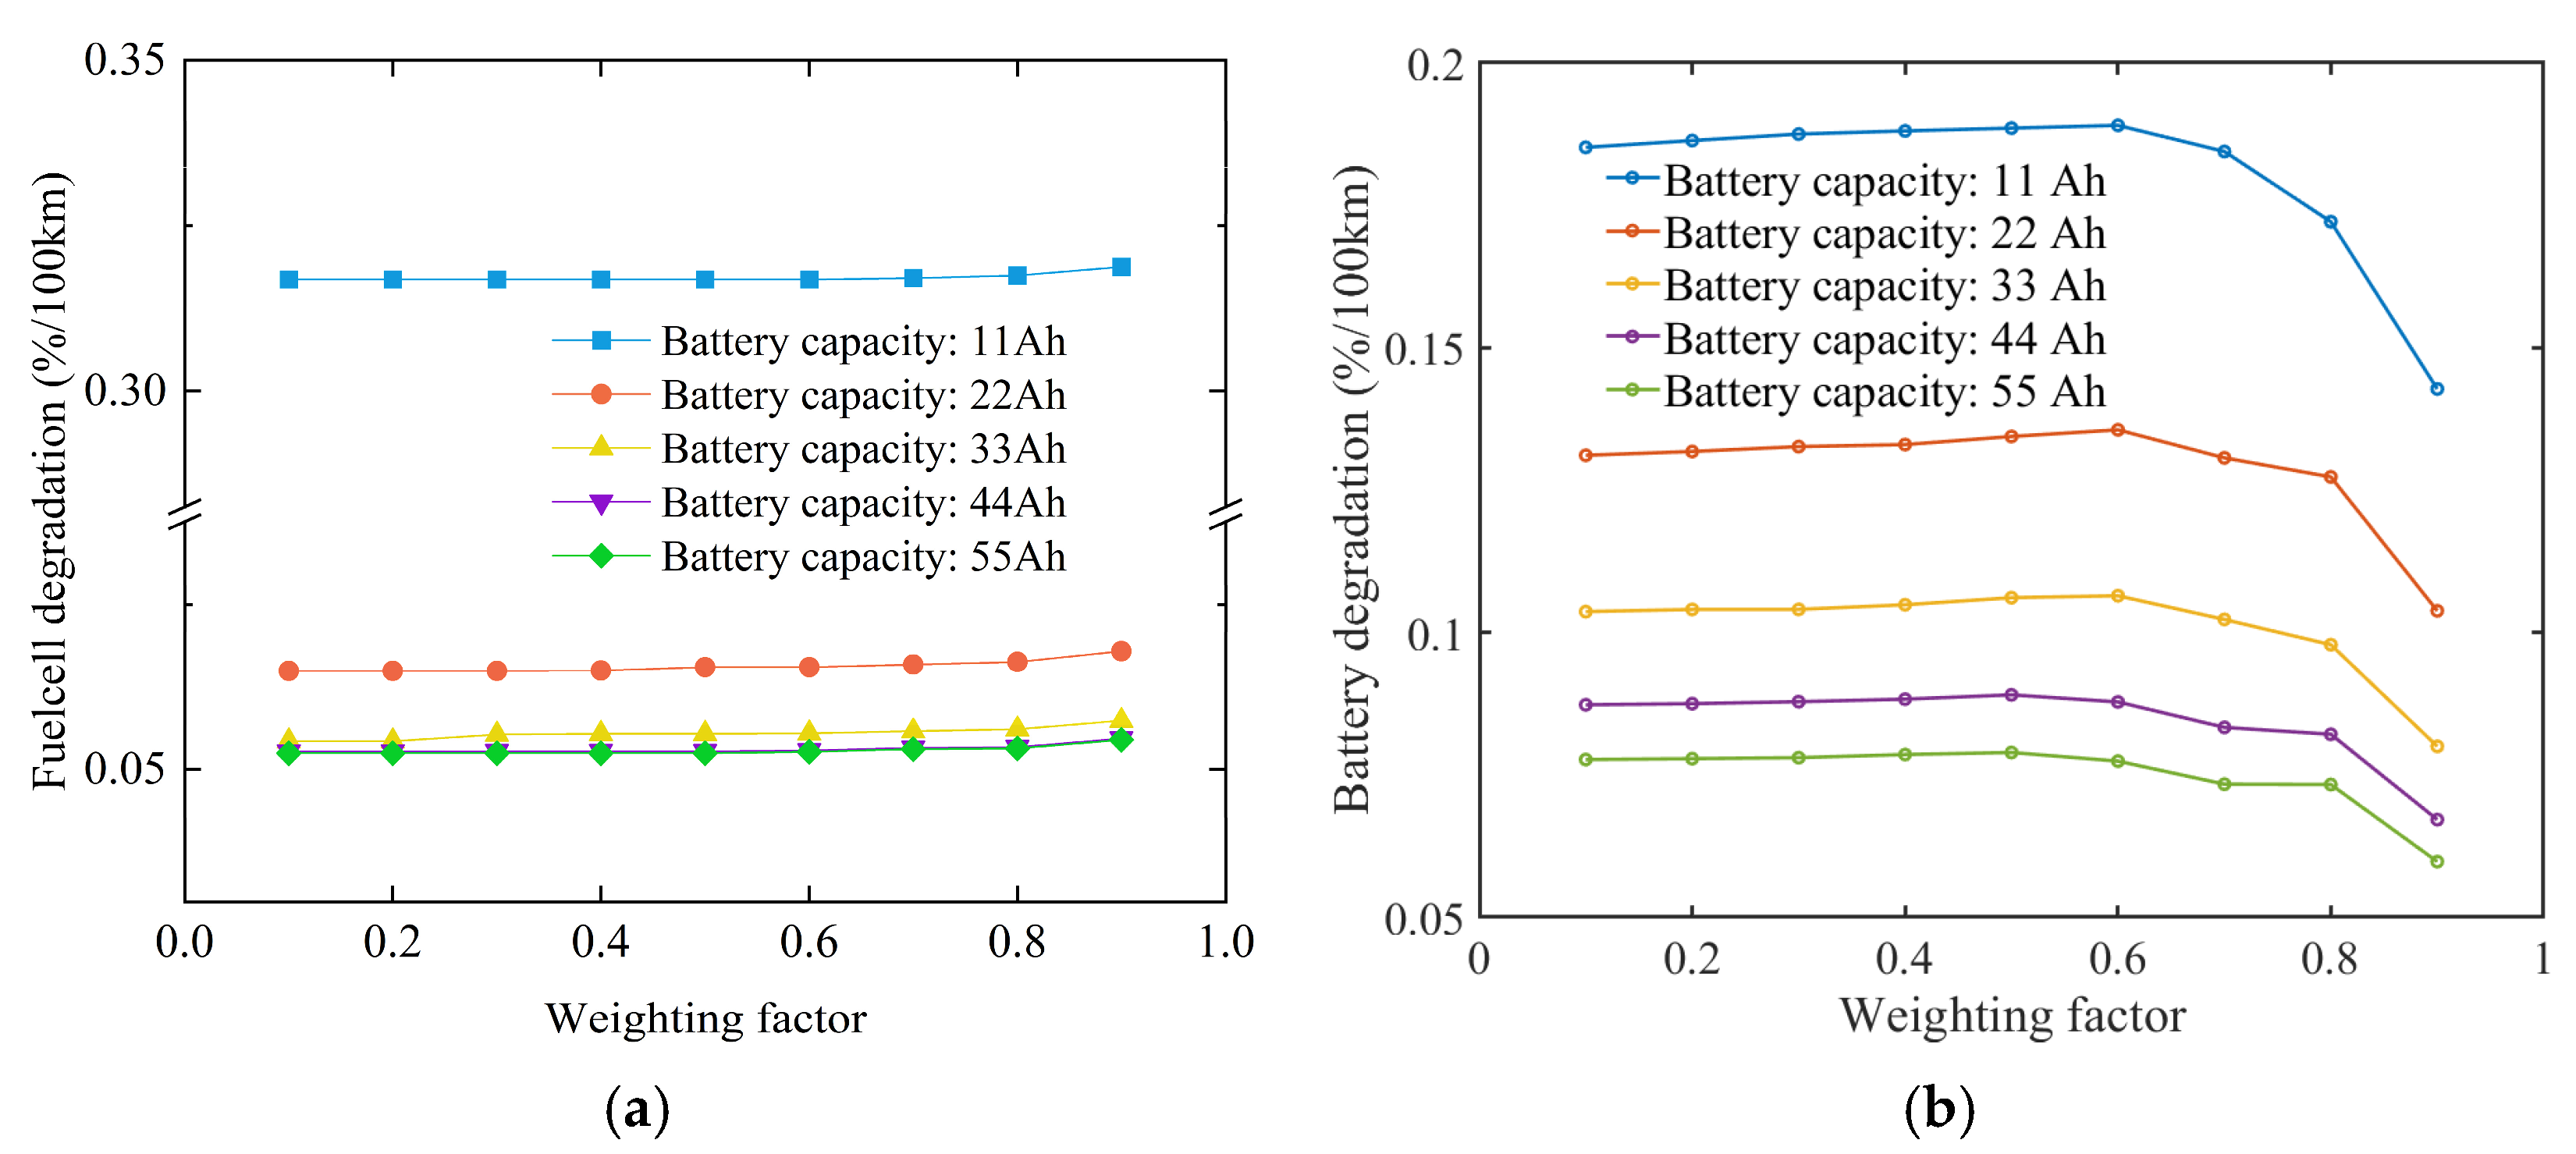
The weighting factor significantly influences the trade-off between fuel economy and system durability costs by altering energy distribution strategies. As the weighting factor increases, fuel economy costs decrease while durability costs rise, and vice versa. This effect differs fundamentally from that of changing the battery capacity. At present, fuel economy and system durability are equally important considerations. However, as power source prices decrease in the future, system durability may become less critical for fuel cell hybrid systems, with fuel economy optimization emerging as the primary focus.

Author Contributions

Conceptualization, X.X. and S.Z.; methodology, X.X. and S.Z.; software, X.X.; validation, X.X.; formal analysis, X.X.; investigation, X.X., C.S., H.D., Y.T. and J.F.; resources, H.Y., S.B., S.Z. and G.L.; data curation, X.X.; writing—original draft preparation, X.X.; writing—review and editing, X.X., Y.T. and S.Z.; visualization, X.X.; supervision, X.X.; project administration, H.Y., S.B., S.Z. and G.L.; funding acquisition, H.Y., S.B., S.Z. and G.L. All authors have read and agreed to the published version of the manuscript.

Funding

The authors would like to acknowledge the Guangdong Basic and Applied Basic Research Foundation (2024A1515030057) and Natural Science Foundation of Shandong Province (2022HWYQ-018, ZR2023ME198) for grants and support.

Institutional Review Board Statement

Not applicable.

Informed Consent Statement

Not applicable.

Data Availability Statement

The original contributions presented in this study are included in the article. Further inquiries can be directed to the corresponding author.

Conflicts of Interest

The authors declare no conflict of interest.

Nomenclature

A h Ah-throughput [Ah]
B Battery degradation coefficient [-]
C Equivalent hydrogen consumption [kg]
C d Drag coefficient [-]
C R Current flux [C]
E a Activation energy [J/mol]
F Frontal area of the vehicle [m2]
g Gravitational acceleration [m/s2]
I Current [A]
JTotal cost [kg]
k i Fuel cell degradation coefficients [%/h]
L T Cost at time T [-]
L H V Lower heating value
m Mass [kg]
M Price [$]
P Power [kW]
Q Capacity (Ah)
R g Gas constant [J/(kg·K)]
R Resistance [Ω]
t Time [s]
T Temperature [K]
U Voltage [V]
v Velocity [m/s]
Z Power law factor [-]
Subscripts
v Vehicle
b Basic
d Drag
f c Fuel cell
b a t Battery
r e q Require
G B Gearbox
m Motor
d c a c DC–AC converter
d c d c DC–DC converter
o p t Optimal
o c v Open-circuit voltage
a v g   Average
d i s Discharge
c h g Charge
Greek symbols
α Penalty coefficient [-]
β Specific energy of the battery [ W h / k g ]
γ Power-to-weight ratio of the fuel cell [ k W / k g ]
ε Discretization step [s]
θ Road grade [-]
f Rolling resistance coefficient [-]
η Efficiency [-]
Degradation [%]
ρ Air density [ N * s 2 / m 4 ]
Abbreviations
ADVISORAdvanced Vehicle Simulator
CDCSCharge–Depletion–Charge–Sustain
DPDynamic Programming
ECMSEquivalent Consumption Minimization Strategy
EMSEnergy Management Strategy
FCHVFuel Cell Hybrid Vehicle
FCRExRange-Extender Fuel Cell Vehicle
FCSFuel Cell Stack
H2Hydrogen
NEDCNew European Driving Cycle
PEMFCProton Exchange Membrane Fuel Cells
PMPPontryagin’s Minimum Principle
SQPSequential Quadratic Programming
SOCState of Charge

References

  1. Aminudin, M.; Kamarudin, S.; Lim, B.; Majilan, E.; Masdar, M.; Shaari, N. An overview: Current progress on hydrogen fuel cell vehicles. Int. J. Hydrogen Energy 2023, 48, 4371–4388. [Google Scholar]
  2. Desantes, J.; Molina, S.; Novella, R.; Lopez-Juarez, M. Comparative global warming impact and NOX emissions of conventional and hydrogen automotive propulsion systems. Energy Convers. Manag. 2020, 221, 113137. [Google Scholar]
  3. Li, D.; Leung, M.F.; Tang, J.; Wang, Y.; Hu, J.; Wang, S. Generative Self-Supervised Learning for Cyberattack-Resilient EV Charging Demand Forecasting. IEEE Trans. Intell. Transp. Syst. 2025, 1–10. [Google Scholar] [CrossRef]
  4. Desantes, J.; Novella, R.; Pla, B.; Lopez-Juarez, M. A modeling framework for predicting the effect of the operating conditions and component sizing on fuel cell degradation and performance for automotive applications. Appl. Energy 2022, 317, 119137. [Google Scholar] [CrossRef]
  5. Lü, X.; Qu, Y.; Wang, Y.; Qin, C.; Liu, G. A comprehensive review on hybrid power system for PEMFC-HEV: Issues and strategies. Energy Convers. Manag. 2018, 171, 1273–1291. [Google Scholar]
  6. Wang, S.; Jiang, S.P. Prospects of fuel cell technologies. Natl. Sci. Rev. 2017, 4, 163–166. [Google Scholar]
  7. Alpaslan, E.; Karaoğlan, M.U.; Colpan, C.O. Investigation of drive cycle simulation performance for electric, hybrid, and fuel cell powertrains of a small-sized vehicle. Int. J. Hydrogen Energy 2023, 48, 39497–39513. [Google Scholar]
  8. Yuan, H.-B.; Zou, W.-J.; Jung, S.; Kim, Y.-B. Optimized rule-based energy management for a polymer electrolyte membrane fuel cell/battery hybrid power system using a genetic algorithm. Int. J. Hydrogen Energy 2022, 47, 7932–7948. [Google Scholar]
  9. Li, Q.; Meng, X.; Gao, F.; Zhang, G.; Chen, W. Approximate Cost-Optimal Energy Management of Hydrogen Electric Multiple Unit Trains Using Double Q-Learning Algorithm. IEEE Trans. Ind. Electron. 2022, 69, 9099–9110. [Google Scholar]
  10. Gao, D.; Jin, Z.; Lu, Q. Energy management strategy based on fuzzy logic for a fuel cell hybrid bus. J. Power Sources 2008, 185, 311–317. [Google Scholar]
  11. Erdinc, O.; Vural, B.; Uzunoglu, M. A wavelet-fuzzy logic based energy management strategy for a fuel cell/battery/ultra-capacitor hybrid vehicular power system. J. Power Sources 2009, 194, 369–380. [Google Scholar]
  12. Teng, Y.-T.; Wang, F.-C. Cost Analyses and Optimization of a PEMFC Electric Vehicle Model. In Proceedings of the 2016 IEEE/SICE International Symposium on System Integration (SII), Sapporo, Japan, 13–15 December 2016; pp. 887–892. [Google Scholar]
  13. Jalil, N.; Kheir, N.A.; Salman, M. A rule-based energy management strategy for a series hybrid vehicle. In Proceedings of the American Control Conference, Albuquerque, NM, USA, 6 June 1997. [Google Scholar]
  14. Zhang, Y.; Zhang, C.; Fan, R.; Huang, S.; Yang, Y.; Xu, Q. Twin delayed deep deterministic policy gradient-based deep reinforcement learning for energy management of fuel cell vehicle integrating durability information of powertrain. Energy Convers. Manag. 2022, 274, 116454. [Google Scholar] [CrossRef]
  15. Jia, C.; Zhou, J.; He, H.; Li, J.; Wei, Z.; Li, K. Health-conscious deep reinforcement learning energy management for fuel cell buses integrating environmental and look-ahead road information. Energy 2024, 290, 130146. [Google Scholar]
  16. Song, K.; Huang, X.; Xu, H.; Sun, H.; Chen, Y.; Huang, D. Model predictive control energy management strategy integrating long short-term memory and dynamic programming for fuel cell vehicles. Int. J. Hydrogen Energy 2024, 56, 1235–1248. [Google Scholar] [CrossRef]
  17. Xu, L.; Ouyang, M.; Li, J.; Yang, F.; Lu, L.; Hua, J. Application of Pontryagin’s Minimal Principle to the energy management strategy of plugin fuel cell electric vehicles. Int. J. Hydrogen Energy 2013, 38, 10104–10115. [Google Scholar]
  18. Wu, X.; Hu, X.; Yin, X.; Li, L.; Zeng, Z.; Pickert, V. Convex programming energy management and components sizing of a plug-in fuel cell urban logistics vehicle. J. Power Sources 2019, 423, 358–366. [Google Scholar]
  19. Xu, L.; Ouyang, M.; Li, J.; Yang, F. Dynamic Programming Algorithm for minimizing operating cost of a PEM fuel cell vehicle. In Proceedings of the 2012 IEEE International Symposium on Industrial Electronics, Hangzhou, China, 28–31 May 2012; pp. 1490–1495. [Google Scholar]
  20. Kim, M.-J.; Peng, H. Power management and design optimization of fuel cell/battery hybrid vehicles. J. Power Sources 2007, 165, 819–832. [Google Scholar]
  21. Dominguez, R.; Solano, J.; Jacome, A. Sizing of Fuel Cell—Ultracapacitors Hybrid Electric Vehicles Based on the Energy Management Strategy. In Proceedings of the 2018 IEEE Vehicle Power and Propulsion Conference (VPPC), Chicago, IL, USA, 27–30 August 2018. [Google Scholar]
  22. Hu, Z.; Li, J.; Xu, L.; Song, Z.; Fang, C.; Ouyang, M.; Dou, G.; Kou, G. Multi-objective energy management optimization and parameter sizing for proton exchange membrane hybrid fuel cell vehicles. Energy Convers. Manag. 2016, 129, 108–121. [Google Scholar]
  23. Chen, J.; He, H.; Wang, Y.X.; Quan, S.; Zhang, Z.; Wei, Z.; Han, R. Research on energy management strategy for fuel cell hybrid electric vehicles based on improved dynamic programming and air supply optimization. Energy 2024, 300, 131567. [Google Scholar] [CrossRef]
  24. Xu, L.; Ouyang, M.; Li, J.; Yang, F.; Lu, L.; Hua, J. Optimal sizing of plug-in fuel cell electric vehicles using models of vehicle performance and system cost. Appl. Energy 2013, 103, 477–487. [Google Scholar]
  25. Molina, S.; Novella, R.; Pla, B.; Lopez-Juarez, M. Optimization and sizing of a fuel cell range extender vehicle for passenger car applications in driving cycle conditions. Appl. Energy 2021, 285, 116469. [Google Scholar] [CrossRef]
  26. Feroldi, D.; Carignano, M. Sizing for fuel cell/supercapacitor hybrid vehicles based on stochastic driving cycles. Appl. Energy 2016, 183, 645–658. [Google Scholar] [CrossRef]
  27. KoteswaraRao, K.V.; Srinivasulu, G.N.; Rahul, J.R.; Velisala, V. Optimal component sizing and performance of Fuel Cell—Battery powered vehicle over world harmonized and new european driving cycles. Energy Convers. Manag. 2024, 300, 117992. [Google Scholar] [CrossRef]
  28. Tazelaar, E.; Shen, Y.; Veenhuizen, P.; Hofman, T.; Bosch, P.v.D. Sizing Stack and Battery of a Fuel Cell Hybrid Distribution Truck. Oil Gas Sci. Technol.-Rev. D Ifp Energ. Nouv. 2012, 67, 563–573. [Google Scholar] [CrossRef]
  29. Hu, X.; Murgovski, N.; Johannesson, L.M.; Egardt, B. Optimal dimensioning and power management of a fuel cell/battery hybrid bus via convex programming. IEEE-ASME Trans. Mechatron. 2015, 20, 457–468. [Google Scholar] [CrossRef]
  30. Han, J.; Kokkolaras, M.; Papalambros, P.Y. Optimal Design of Hybrid Fuel Cell Vehicles. J. Fuel Cell Sci. Technol. 2008, 5, 041014. [Google Scholar] [CrossRef]
  31. Xu, L.; Mueller, C.D.; Li, J.; Ouyang, M.; Hu, Z. Multi-objective component sizing based on optimal energy management strategy of fuel cell electric vehicles. Appl. Energy 2015, 157, 664–674. [Google Scholar] [CrossRef]
  32. Pei, P.; Chang, Q.; Tang, T. A quick evaluating method for automotive fuel cell lifetime. Int. J. Hydrogen Energy 2008, 33, 3829–3836. [Google Scholar] [CrossRef]
  33. Wang, J.; Liu, P.; Hicks-Garner, J.; Sherman, E.; Soukiazian, S.; Verbrugge, M.; Tataria, H.; Musser, J.; Finamore, P. Cycle-life model for graphite-LiFePO4 cells. J. Power Sources 2011, 196, 3942–3948. [Google Scholar] [CrossRef]
  34. Kittner, N.; Lill, F.; Kammen, D.M. Energy storage deployment and innovation for the clean energy transition. Nat. Energy 2017, 2, 17125. [Google Scholar] [CrossRef]
  35. Fuel Cell System Cost-2016, DOE Hydrogen and Fuel Cells Program Record; Rec. No. 16020; U.S. Department of Energy: Washington, DC, USA, 2016.
Figure 1. The structure of weighted multi-objective optimization.
Applsci 15 03586 g001
Figure 2. Fuel cell electric vehicle powertrain.
Applsci 15 03586 g002
Figure 3. Relationship between economic cost, battery capacities and weighting factor: (a) economic cost vs. battery capacities and (b) economic cost vs. weighting factor.
Applsci 15 03586 g003
Figure 4. Different EMS power distributions for PEMFC and battery under different battery capacities (weighting factor = 0.5): (a) battery capacity: 11 Ah, (b) battery capacity: 22 Ah, (c) battery capacity: 33 Ah, (d) battery capacity: 44 Ah, and (e) battery capacity: 55 Ah.
Applsci 15 03586 g004aApplsci 15 03586 g004b
Figure 5. Different EMS power distributions for PEMFC and battery under different weighting factors (battery capacity = 44 Ah): (a) weighting factor: 0.1, (b) weighting factor: 0.3, (c) weighting factor: 0.5, (d) weighting factor: 0.7, and (e) weighting factor: 0.9.
Applsci 15 03586 g005aApplsci 15 03586 g005b
Figure 6. Per kilometer performance degeneration percentage of fuel cell and battery under different battery capacities: (a) fuel cell and (b) battery.
Applsci 15 03586 g006
Figure 7. Per kilometer performance degeneration percentage of fuel cell and battery under different weighting factors: (a) fuel cell and (b) battery.
Applsci 15 03586 g007
Figure 8. Total costs under different battery capacities and weighting factors.
Applsci 15 03586 g008
Figure 9. Total costs under different battery prices and economic cost coefficients.
Applsci 15 03586 g009
Table 1. Parameters of the research FCHV.
ParameterSymbolValueUnit
Mass m v , b 1848kg
Coefficient of friction f 0.015-
Drag coefficient C d 0.3-
Air density ρ 1.025 k g / m 3
Frontal area F 2.79m2
Power-to-weight ratio of the fuel cell γ f c 0.157 k W / k g
Specific energy of the battery β b a t 70 W h / k g
Transmission efficiency η G B 0.95-
Motor efficiency η m 0.95-
DC–AC converter efficiency η d c a c 0.95-
Fuel cell DC–DC converter efficiency η f c d c d c 0.95-
Brake energy recovery rate η r e c o v e r y 0.6-
Table 2. Coefficients for performance degradation model.
CoefficientValues (Unit)Definitions
k 1 0.00126 (%/h)Output power less than 5% of max power
k 2 0.00196 (%/cycle)One full start–stop
k 3 0.0000593 (%/h)Absolute value of load variations rate is larger than 10% of max power per second
k 4 0.00147 (%/h)Higher than 90% of maximal power
K p 1.47-
Table 3. Parameters for price.
ParametersValueUnit
M b a t 147 U S D / k W h
M f c 411 U S D / k W
M H 2 5.88 U S D / k g
Table 4. Parameters for drivability requirements.
ParameterValueUnit
v s 1 180 k m / h
v s 2 80 k m / h
α s 6.5%
Table 5. Comparison of different strategies.
MethodEconomic Cost
(kg/100 km)
Fuel Cell Degradation
(%/100 km)
Battery Degradation
(%/100 km)
Total Cost
(kg/100 km)
Battery Capacity
(Ah)
Weighting factor1.56790.05270.087734.772144
Fuel economy only1.26680.99160.089597.015922
System durability only1.81220.05260.086934.921144
Pareto for economic1.55340.05530.104736.204233
Pareto for durability1.57390.05260.076534.793255
Disclaimer/Publisher’s Note: The statements, opinions and data contained in all publications are solely those of the individual author(s) and contributor(s) and not of MDPI and/or the editor(s). MDPI and/or the editor(s) disclaim responsibility for any injury to people or property resulting from any ideas, methods, instructions or products referred to in the content.

