1. Introduction
A geo-mechanical model test is a method of conducting scaled-down studies of specific engineering geological problems based on the principles of similarity. It is mainly used in geotechnical engineering to study the deformation patterns, stability, safety factors, and failure mechanisms of structures such as high slopes, underground caverns, and tunnels under external loads [
1,
2,
3,
4,
5,
6]. Rock masses are highly complex and anisotropic heterogeneous materials with complicated physical and mechanical properties. Key parameters such as density, elastic modulus, uniaxial compressive strength, cohesion, and friction angle are often used to control the physical and mechanical behaviours of these materials. The success of similarity model tests heavily depends on the mechanical properties of similar materials, particularly those simulating weak rock masses, as failures in tunnels and support systems frequently occur in such conditions. The preparation of similar materials involves selecting appropriate aggregates and binders, with a mixture of fine and coarse aggregates often used to achieve high density and strong friction characteristics. Commonly used coarse aggregates include river sand and quartz sand, while fine aggregates may consist of iron powder and barite powder. Binders such as paraffin, gypsum, cement, and rosin–alcohol solutions are also employed [
7,
8,
9,
10].
Extensive proportioning tests are the prerequisite for achieving the satisfying physical and mechanical parameters of similar materials. Numerous researchers have investigated the effects and correlations of different proportions on the mechanical parameters of similar materials. For example, Xu et al. [
11] found that as the barite content increased, the density of the material significantly increased, and the strength of the material increased with an increase in binder content [
11,
12]. The concentration of the binder can effectively enhance the strength and elastic modulus of the material [
12]. Additionally, the type of binder also has a significant influence on the strength and elastic modulus of the material but has less noticeable effects on the internal friction angle of the material [
13]. Current studies present a similar result; the strength and elastic modulus of the material can be effectively adjusted by modifying the binder ratio [
14]. However, it was found that current studies have different opinions on the influence of the aggregate ratio to similar materials. Based on numerous tests, Shi et al. observed that higher proportions of fine aggregates in the aggregate mixture result in higher material strength [
15]. Fan et al. concluded that the angle of the internal friction of the material, as well as the cohesion, gradually decreases when the content of fine aggregate is greater [
16]. Xu et al. [
17] found that with the increase in fine aggregate content, the internal friction angle of the material showed a tendency of decreasing, while the cohesion showed a tendency of increasing and then decreasing. These findings indicate that further investigation is required to understand the impact of aggregate ratios on the mechanical properties of similar materials.
Currently, many proportioning tests have qualitatively investigated the influences of different component proportions of similar materials on mechanical behaviour. To solve this, several studies proposed a qualitative relationship between component proportion (i.e., proportions of fine and coarse aggregates, binder content, binder concentration) and the mechanical property (i.e., density, uniaxial compressive strength, elastic modulus, cohesion, and internal friction angle) [
18,
19,
20]. However, as repetitive proportioning tests require a significant investment of time and financial resources, these empirical equations often only apply to specific sets of components and lack generality. Their results fall short of meeting the detailed requirements of model materials for prototypes in wide ranges. Discrete element analysis provides a convenient method for analysing the mechanical behaviour of granular materials [
21]. This allows for optimisation of the design of component proportions of similar materials by simulating the components as granular materials. However, most discrete element analyses focus on either the materials with high cohesive strength, such as asphalt and cement, or materials with nearly nil cohesive strength, such as soil [
22,
23,
24,
25]. Similar materials simulating weak surrounding rock in geo-mechanical model tests are weakly cohesive materials, which fall between these two categories, high cohesive strength and nil cohesive strength. There are limited studies on discrete element simulation of weakly cohesive, similar materials.
In summary, the drawbacks of the current studies are as follows: (1) further investigation is needed to discuss the influence of aggregate proportioning on the mechanical properties of similar materials; (2) as repetitive proportioning tests require a significant investment of time and financial resources, most empirical equations often only apply to specific sets of components and lack generality; and (3) most current studies using discrete element analysis focus on either highly cohesive materials or non-cohesive materials, ignoring weakly cohesive materials such as similar materials simulating weak surrounding rock.
In order to overcome these drawbacks, in this study, several specimens with different RFCAs were created to simulate weak surrounding rock. Uniaxial compression tests (UCTs) were conducted on these specimens, which were simulated by discrete element analysis. Some key parameters were calibrated by comparing the results from the discrete element analysis and the compression tests. Based on the calibrated parameters, the effect of RFCAs on the mechanical properties of similar materials was investigated. The mathematical relationships between the RFCAs and the mechanical properties, such as elastic modulus, cohesion, and internal friction angle, were proposed. The variations in particle contact forces and crack propagation patterns in similar materials with different RFCAs were discussed from a microscopic perspective. The purpose of this study is to provide an optimum RFCA for similar materials simulating weak surrounding rock and to present a convenient and efficient numerical method to determine this optimum RFCA in geo-mechanical model tests. This study is intended to be a preliminary investigation into the effects of RFCA on the mechanical properties of similar materials. The findings presented here should be considered as foundational and indicative of potential trends, rather than definitive conclusions.
2. Uniaxial Compression Tests of Similar Materials
2.1. Test Materials
In a majority of the existing studies, similar materials that simulate weak surrounding rock are composed of coarse aggregate, fine aggregate, and binder [
7,
8,
9,
10]. Coarse aggregate is sourced from either river sand or quartz sand. Fine aggregates, including barite powder and iron ore powder, are selected due to their relatively high dry density, contributing to enhancing the unit weight of the similar materials used. Fly ash, whose density is similar to that of quartz sand, is selected as the fine aggregate. This selection aims to minimise the influence of density differences on the test outcomes. The binder used is consistently a mixture of gypsum and water.
Considering these details, test specimens are prepared. The process involves mixing fly ash (serving as the fine aggregate with a particle size range of 0.04–0.05 mm), quartz sand (serving as the coarse aggregate with a particle size range of 0.6–0.9 mm), and a binder composed of gypsum and water.
2.2. Test Procedure
To investigate the effect of RFCA on the mechanical properties of similar materials, the contents of gypsum and water were constant, and five groups of specimens with different RFCAs were prepared.
UCTs were conducted on the specimens with five distinct ratios. Notably, RFCA was characterised by the percentage of fine aggregate, denoted as
H. The value of
H is calculated using the following equation:
where
mf represents the mass of fine particles, and
mc is the mass of coarse particles.
To ensure the accuracy of the tests, three specimens were prepared for each group of tests. The specimens had a diameter of 50 mm and a height of 100 mm. The apparent density of the specimens was 2.2 g/cm
3, and their mass was approximately 436 g, which was determined from the density and volume of the mould. A method of layered compaction was employed during specimen preparation, with the similar material being filled into the mould in five increments to ensure its density and uniformity.
Figure 1 displays the mould and specimens.
After specimen preparation, the specimens were subjected to 24 h of curing under natural conditions and then demoulded, followed by 24 h of curing in a temperature-controlled environment at 70 °C.
UCTs were performed at a loading rate of 0.05 mm/min, and the uniaxial compressive strength and elastic modulus were measured. The damage diagram of the specimens is shown in
Figure 2, and the test results are presented in
Table 1.
3. Discrete Element Analysis
This study analysed the macroscopic mechanical properties, such as the uniaxial compressive strength and elastic modulus, of similar materials through UCTs. A mesoscopic interpretation of these tests was obtained using Particle Flow Code 2D (PFC2D) software (v.6.0) for discrete element analysis. Seven groups, labelled A through G, were modelled with different RFCAs. The RFCAs for groups A through E corresponded to those utilised in the laboratory tests (
Table 1) and served as the control group. RFCAs for groups F and G were additional numerical simulation cases, extending beyond those acquired from the laboratory tests.
Given that water in the materials evaporates during the sample preparation process, the mass of gypsum is relatively small; thus, the volume of gypsum was omitted in the discrete element analysis. Only the formation of fine and coarse aggregates was taken into consideration. The fly ash particles, with a smaller diameter (particle size of 0.04–0.05 mm), represented the fine aggregate, while the quartz particles, with a larger diameter (particle size of 0.6–0.9 mm), represented the coarse aggregate. A parallel bonding model was employed to simulate the adhesion caused by the mixture of gypsum and water.
Since the ratio of the combined mass of gypsum and water to the total mass was constant across all groups in the laboratory tests, it was assumed that each group experienced the same cementing effect due to the hydration reaction triggered by gypsum and water. Thus, a fixed set of mesoscopic parameters was selected to calibrate the parameters of each model group, with the focus solely on the effect of RFCA.
3.1. Numerical Modelling Method
Fly ash and quartz sand serve as the fine and coarse aggregates, respectively, in the proportioning test for the similar material. Insights from previous numerical modelling indicate that the method of particle size expansion exerts a negligible impact on the mechanical behaviour of granular materials [
26,
27]. To enhance calculation efficiency, the particle diameter is uniformly increased by three times. Accordingly, in the numerical model, the particle diameters of the fine and coarse aggregates are set to ranges of 0.12–0.15 mm and 1.8–2.7 mm, respectively.
Due to the similar densities of fly ash and quartz, it is assumed that all particles have the same density. As a result, the mass proportions of different fine and coarse particles are equivalent to their area proportions on a unit area. The number of particles in similar materials in different ratios can be approximated by Equations (2) and (3).
where
AF denotes the area occupied by fine particles;
AC represents the area occupied by coarse particles;
A signifies the total area of the numerical specimen;
stands for the porosity of the numerical specimen;
H symbolises the percentage of fine aggregates, i.e., the ratio of the area occupied by fine particles to the total area of the numerical specimen;
NF represents the number of fine particles;
NC denotes the number of coarse particles;
signifies the minimum radius of fine particles;
is the maximum radius of fine particles;
symbolises the minimum radius of coarse particles; and
stands for the maximum radius of coarse particles.
To determine the number of particles in the numerical specimen under various ratios, the porosity of the numerical specimen was initially computed. This was achieved by generating particles randomly in a rectangular wall with a width of 50 mm and a height of 100 mm, following the same RFCA as seen in the laboratory tests. Subsequently, the density of the numerical specimen was adjusted until it approximated that of the laboratory test specimens, leading to the final determination of the corresponding porosities. Finally, the number of particles in the numerical specimen for each RFCA was computed, and these numbers are presented in
Table 2.
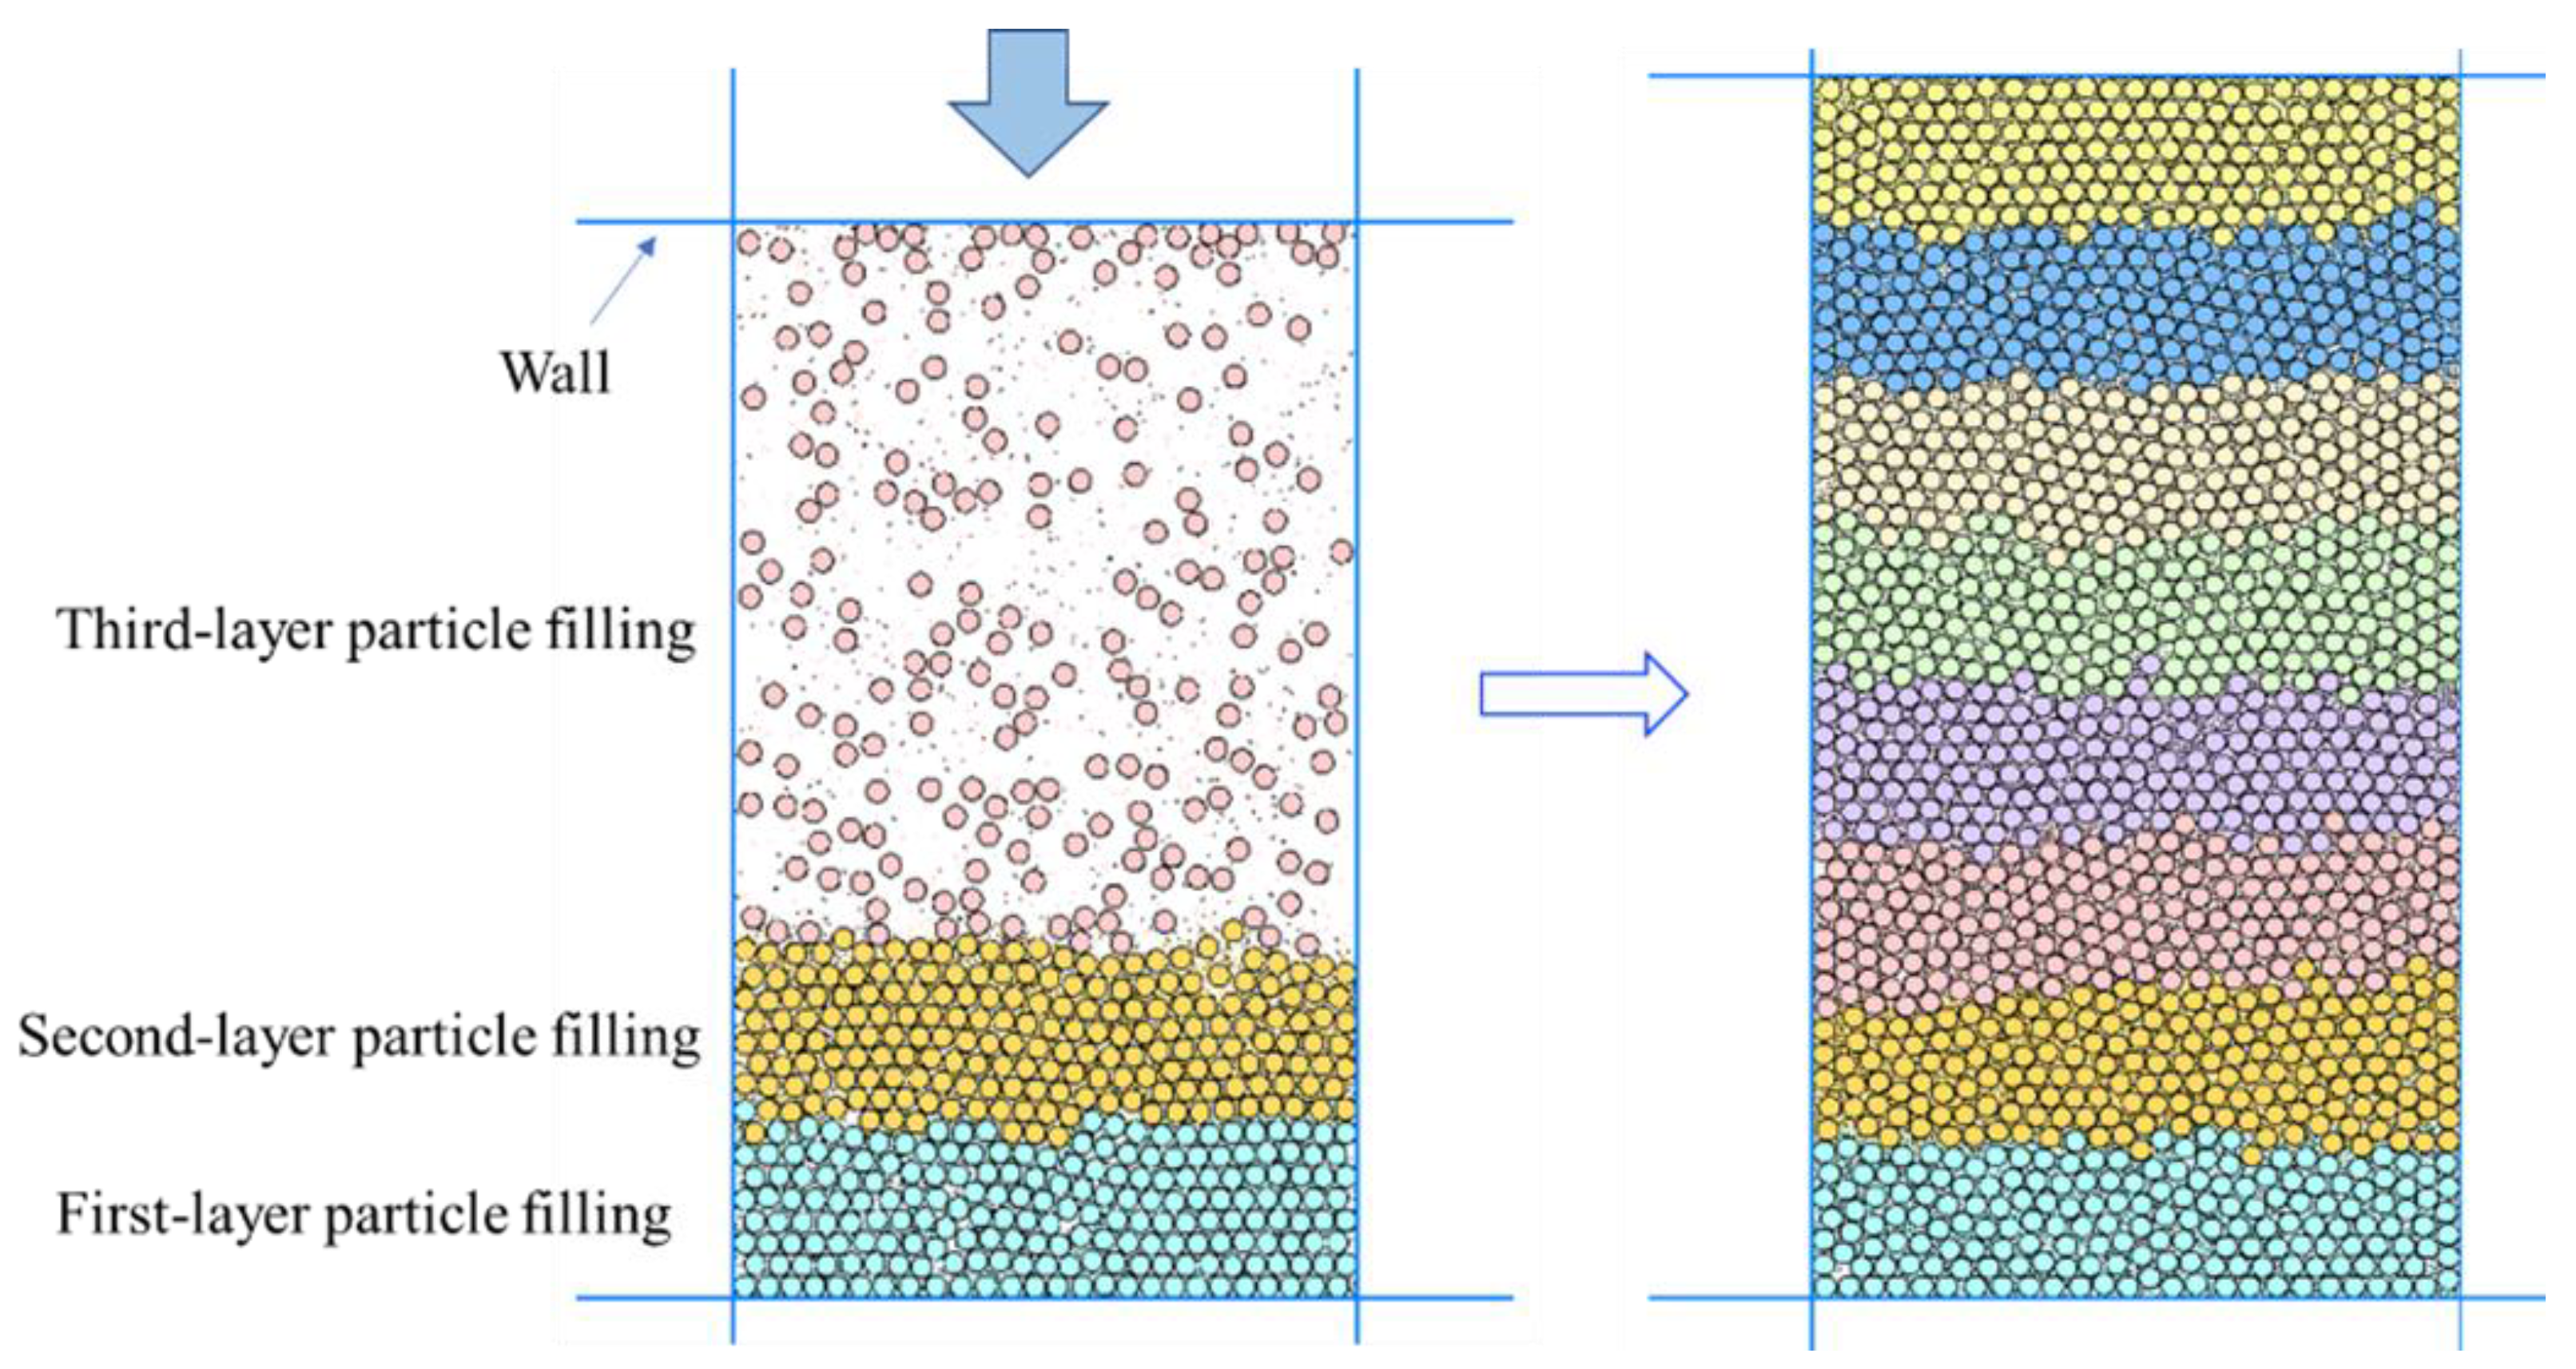
After determining the number of particles in the numerical specimen for each RFCA, a layered compression method was employed to fill the numerical specimen with particles, resulting in uniform numerical specimens devoid of particle overlap, as depicted in
Figure 3. Initially, the wall area was expanded to 50 mm × 500 mm (width × height) for particle filling, which was divided eight times according to the porosity. The upper wall compacted the numerical specimen after each filling. Once the target porosity was achieved, compaction was halted, and the next particle filling was executed, repeating this process until sample preparation was complete.
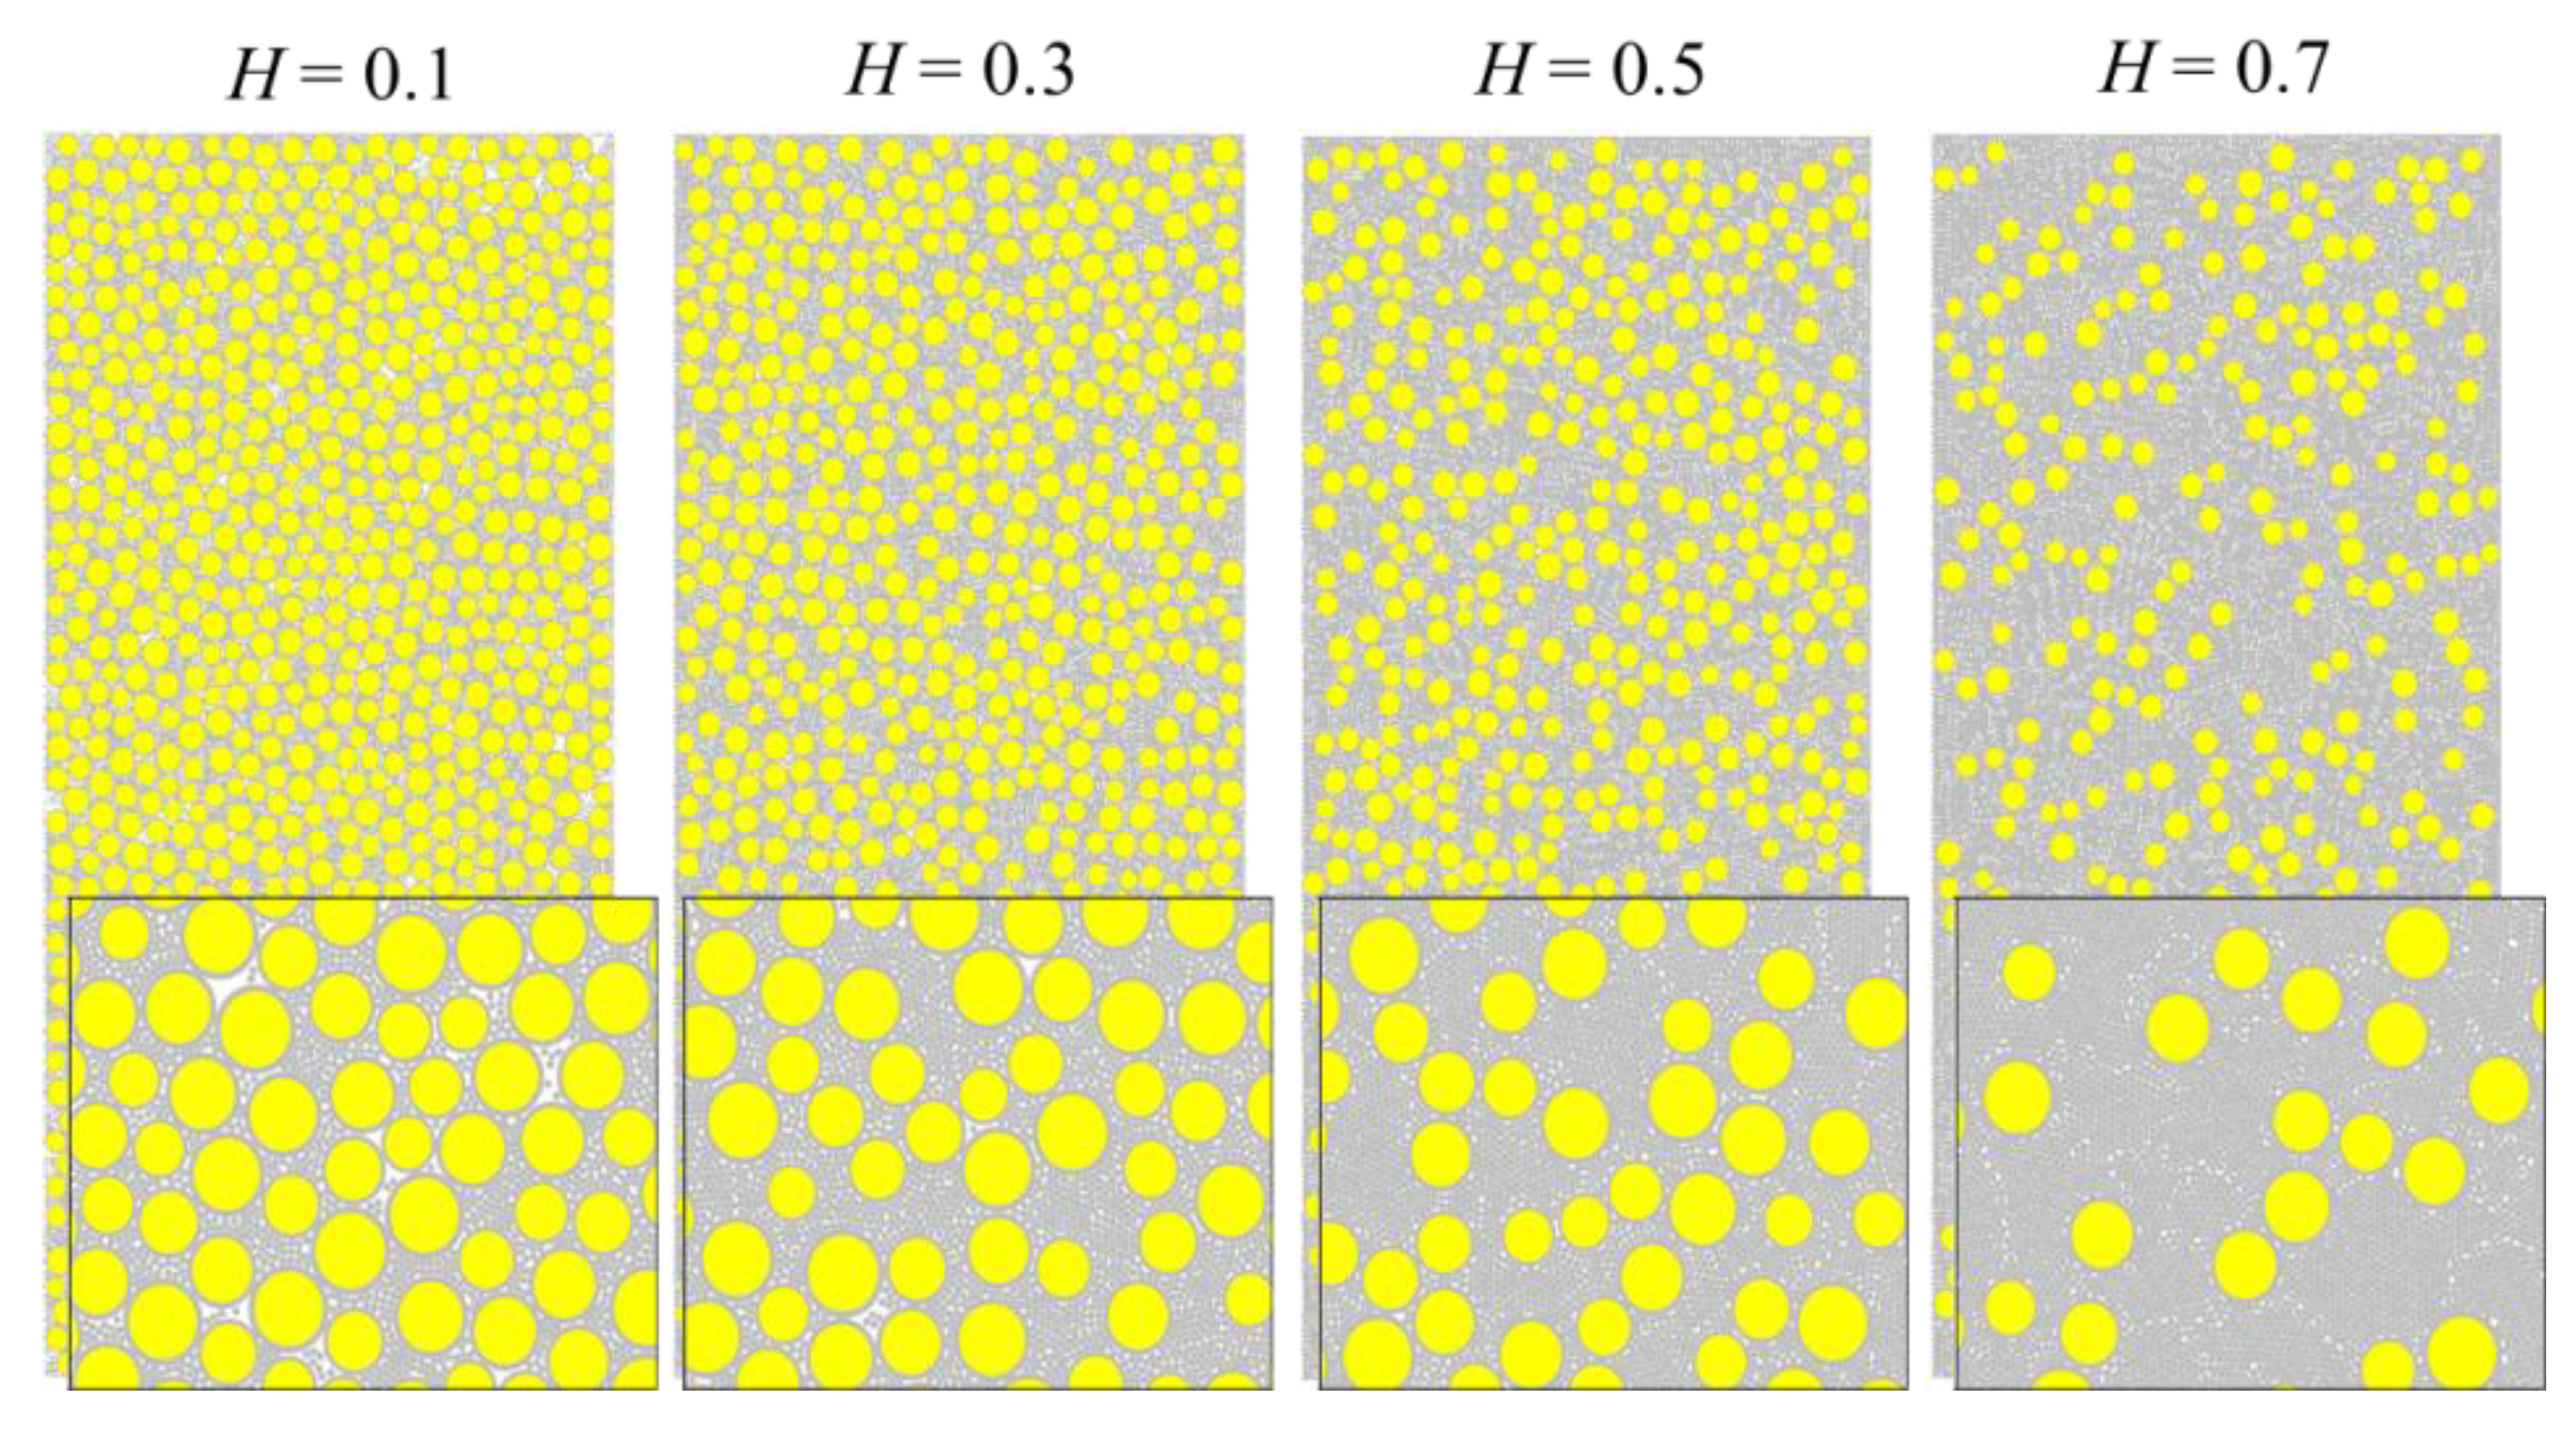
Figure 4 shows the numerical model corresponding to four RFCAs, i.e., H = 0.1, 0.3, 0.5, and 0.7, respectively.
3.2. Comparison of Results by Numerical Modelling and Laboratory Tests
In this study, numerical specimens with H = 0.3 were selected for both UCTs and direct tensile tests. These results were then compared with those obtained from laboratory UCTs. Parameter calibration was conducted, and a parallel bonding model was chosen to simulate the bonding force generated by the hydration reaction between gypsum and water.
According to studies by Xu et al. [
11], the internal friction angle of similar materials simulating Class IV surrounding rocks is estimated to range from 25° to 40°. Therefore, a value of 30° was selected as the internal friction angle of similar materials. The parallel bonding component influences the sample under both tension and compression, while the linear contact component acts solely under compression and has no effect under tension. Therefore, during mesoscopic parameter calibration, a direct tensile test was first simulated for the numerical specimen. The parallel modulus of adhesion was calibrated based on the elastic modulus obtained from the laboratory test. The linear contact modulus was then calibrated by simulating the UCT. Finally, mesoscopic parameters such as cohesion and tensile stress of the numerical specimen were calibrated, in accordance with the stress–strain curve of the laboratory test. The specific values are tabulated in
Table 3.
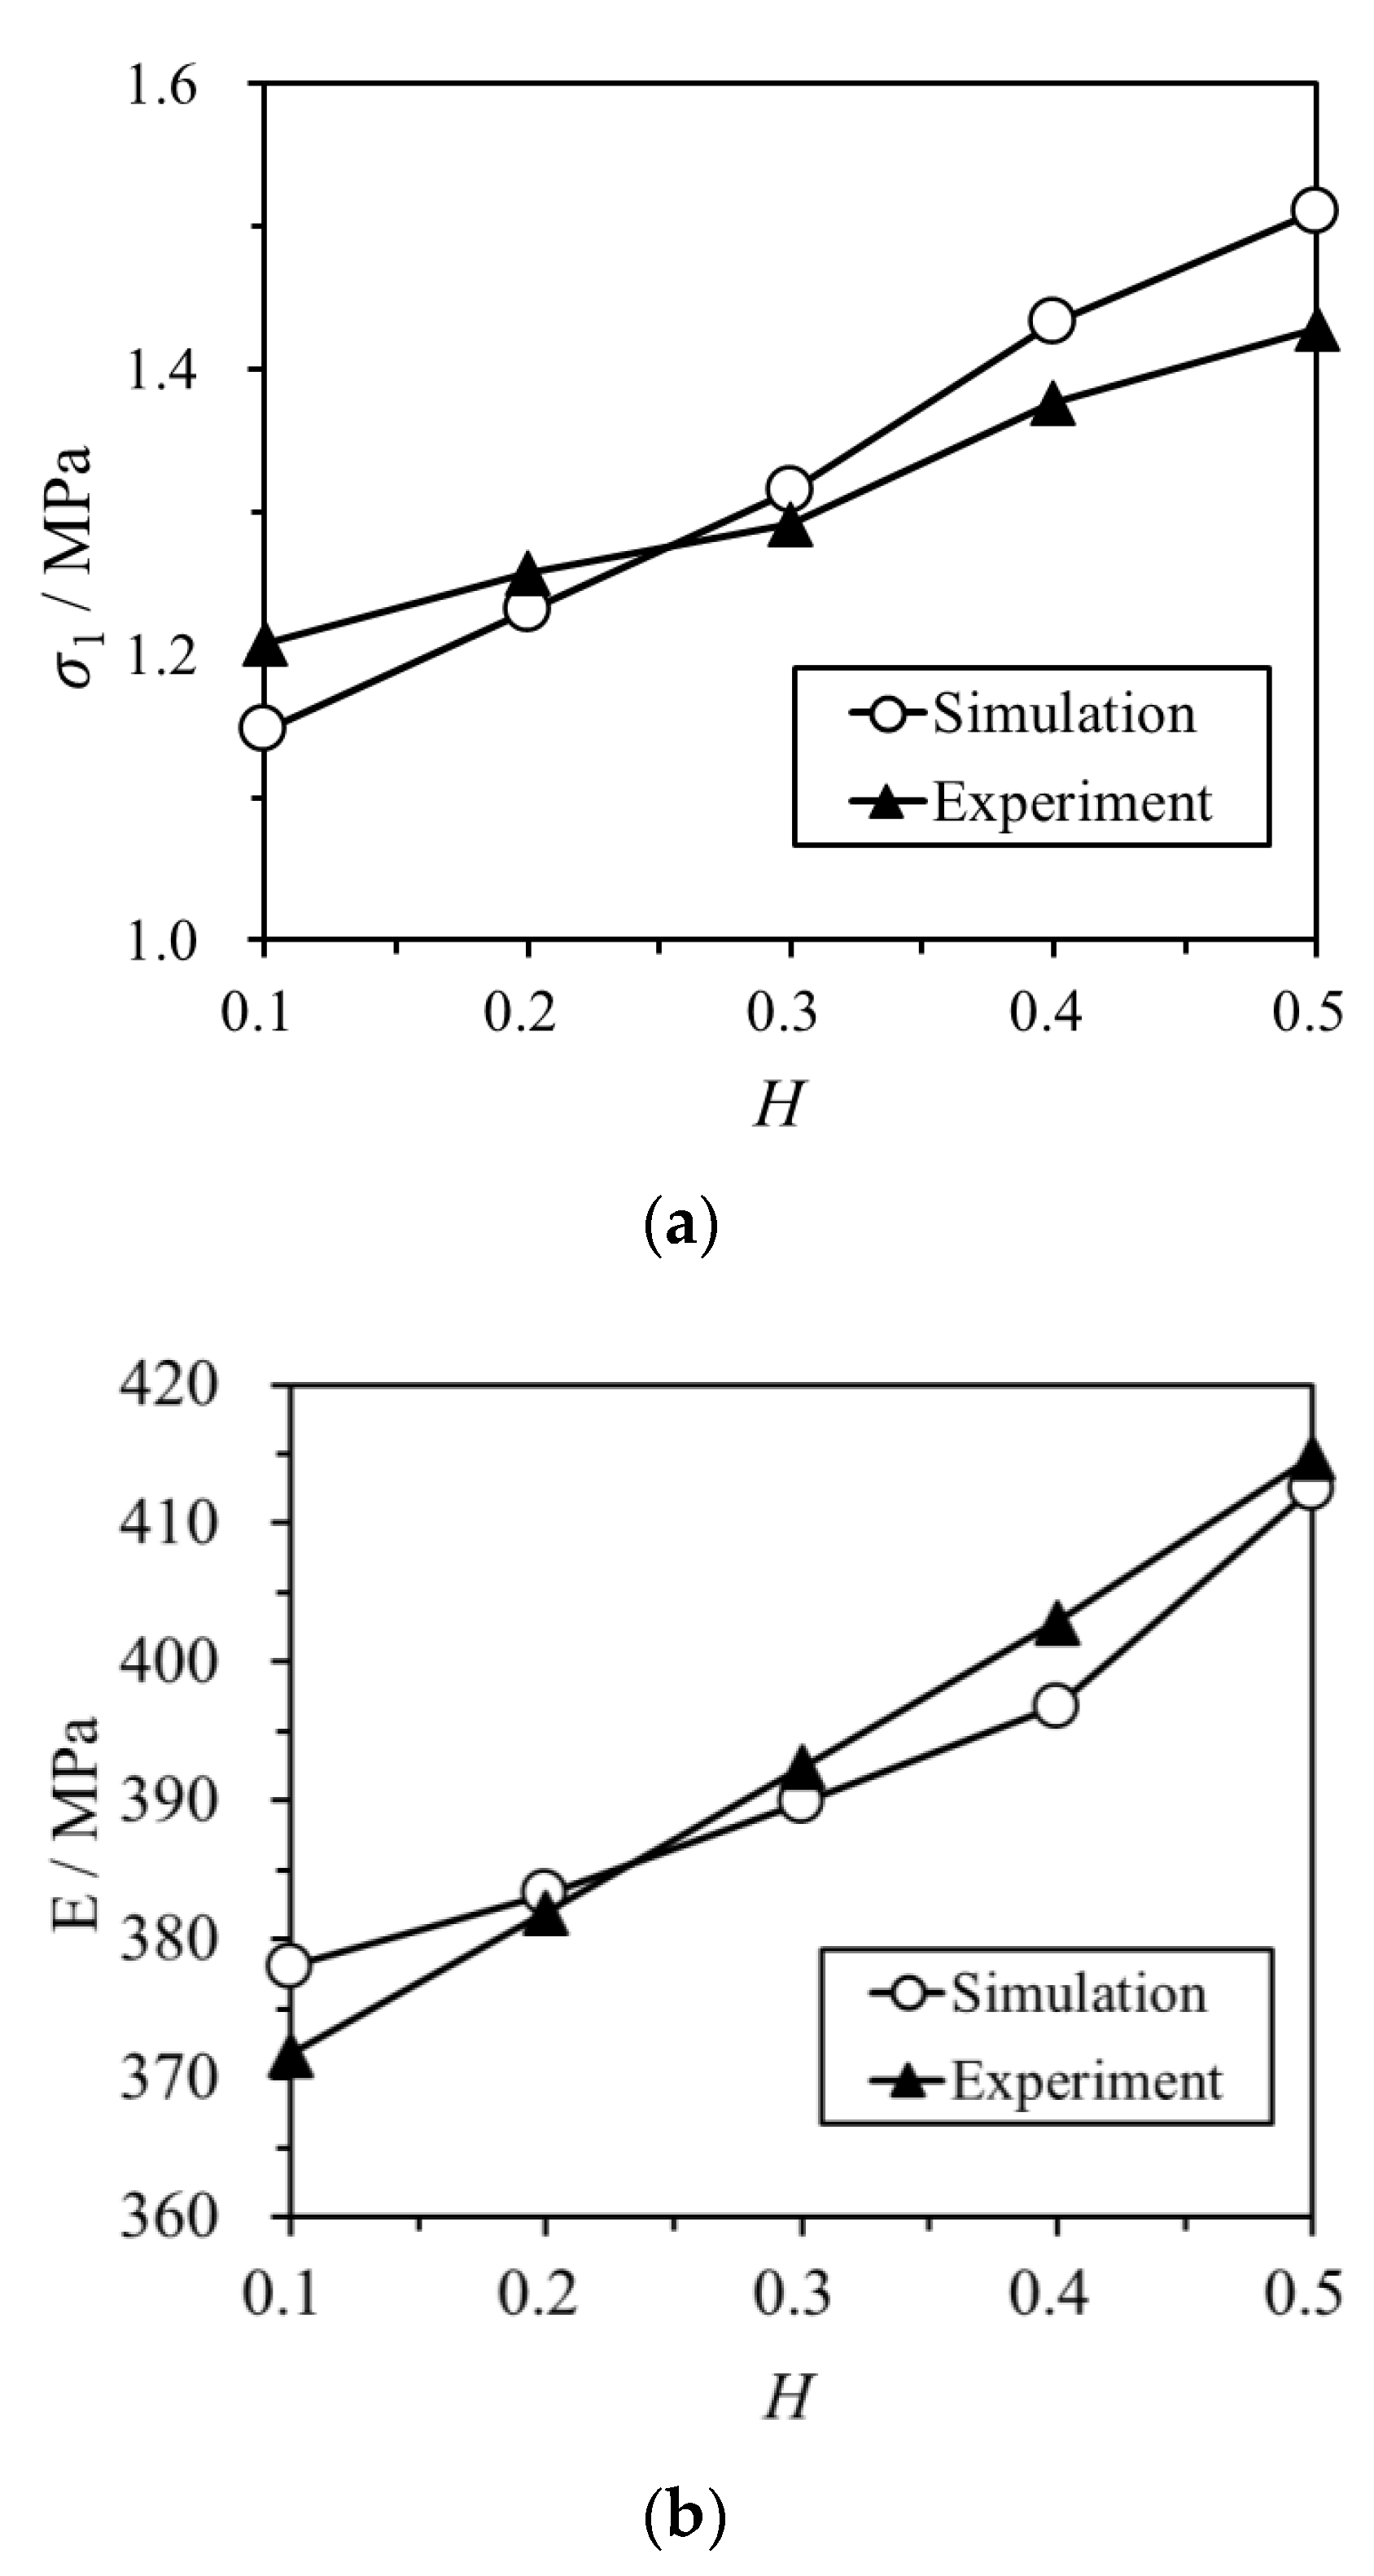
Figure 5 shows a comparison between the simulated results and the experimental results of UCTs. To facilitate comparison with laboratory test results,
Figure 5a displays a comparison between the numerical simulation and laboratory test results for peak stress, while
Figure 5b presents a comparison for the elastic modulus. By comparing these figures, it can be observed that the peak stress and elastic modulus of the numerical specimen closely match the laboratory test results. This outcome validates the feasibility of this simulation and the rationality of calibrating micro-scale parameters, allowing for further analysis of the simulation results of the triaxial compression tests.
4. Numerical Simulation Results
This section details the numerical modelling of the triaxial compression test, performed to assess the effects of confining stress and RFCA on the stress–strain curve, elastic modulus, and strength parameters of the similar material simulating the weak surrounding rocks.
Using discrete element software, triaxial compression tests were conducted on numerical specimens with seven different RFCAs. By applying servo loading to the lateral walls, stable confining stress was maintained for the numerical samples. Subsequently, the upper and lower walls were loaded at a rate of 0.5 mm/min to yield the stress–strain curve of the numerical specimen. Based on these stress–strain curves under different confining stresses, the elastic modulus and strength parameters of the similar material could be derived.
4.1. Stress–Strain Curves
Figure 6 shows the stress–strain curves of the numerical specimen with different RFCAs, with the confining stresses set at 0.2 MPa and 0.6 MPa. As shown in
Figure 6, the stress–strain curves of the numerical specimen under different confining stresses can generally be divided into four phases: compaction, elastic deformation, pre-peak yielding, and post-peak destruction. Under low confining stress (0.2 MPa), all numerical specimens exhibit pronounced brittle characteristics, i.e., when the load applied to the specimens reaches the maximum strength, the specimens fail, and their strength decreases rapidly. When the confining stress increases to 0.6 MPa, the stress–strain curves of the numerical specimens can be divided into two types based on the proportion of fine aggregates. Specifically, when the proportion of fine aggregates in the numerical specimen is less than or equal to 0.3, i.e., H ≤ 0.3, the stress–strain curve shows a more obvious softening characteristic after reaching the peak; i.e., the strength decreases slowly with the increase in strain after the load applied to the specimens reaches the peak strength. However, when
H > 0.3, the stress–strain curve still shows brittle characteristics. It can be concluded that the stress–strain curves of similar materials are jointly affected by the confining stress and the amount of fine aggregate. In other words, an increase in confining stress and a decrease in the amount of fine aggregate will both weaken the brittle properties of similar materials.
4.2. Elastic Modulus
4.2.1. Elastic Modulus Under Different RFCAs and Confining Stresses
The elastic modulus represents the ability of the material to resist elastic deformation and is a key parameter in geo-mechanical model tests.
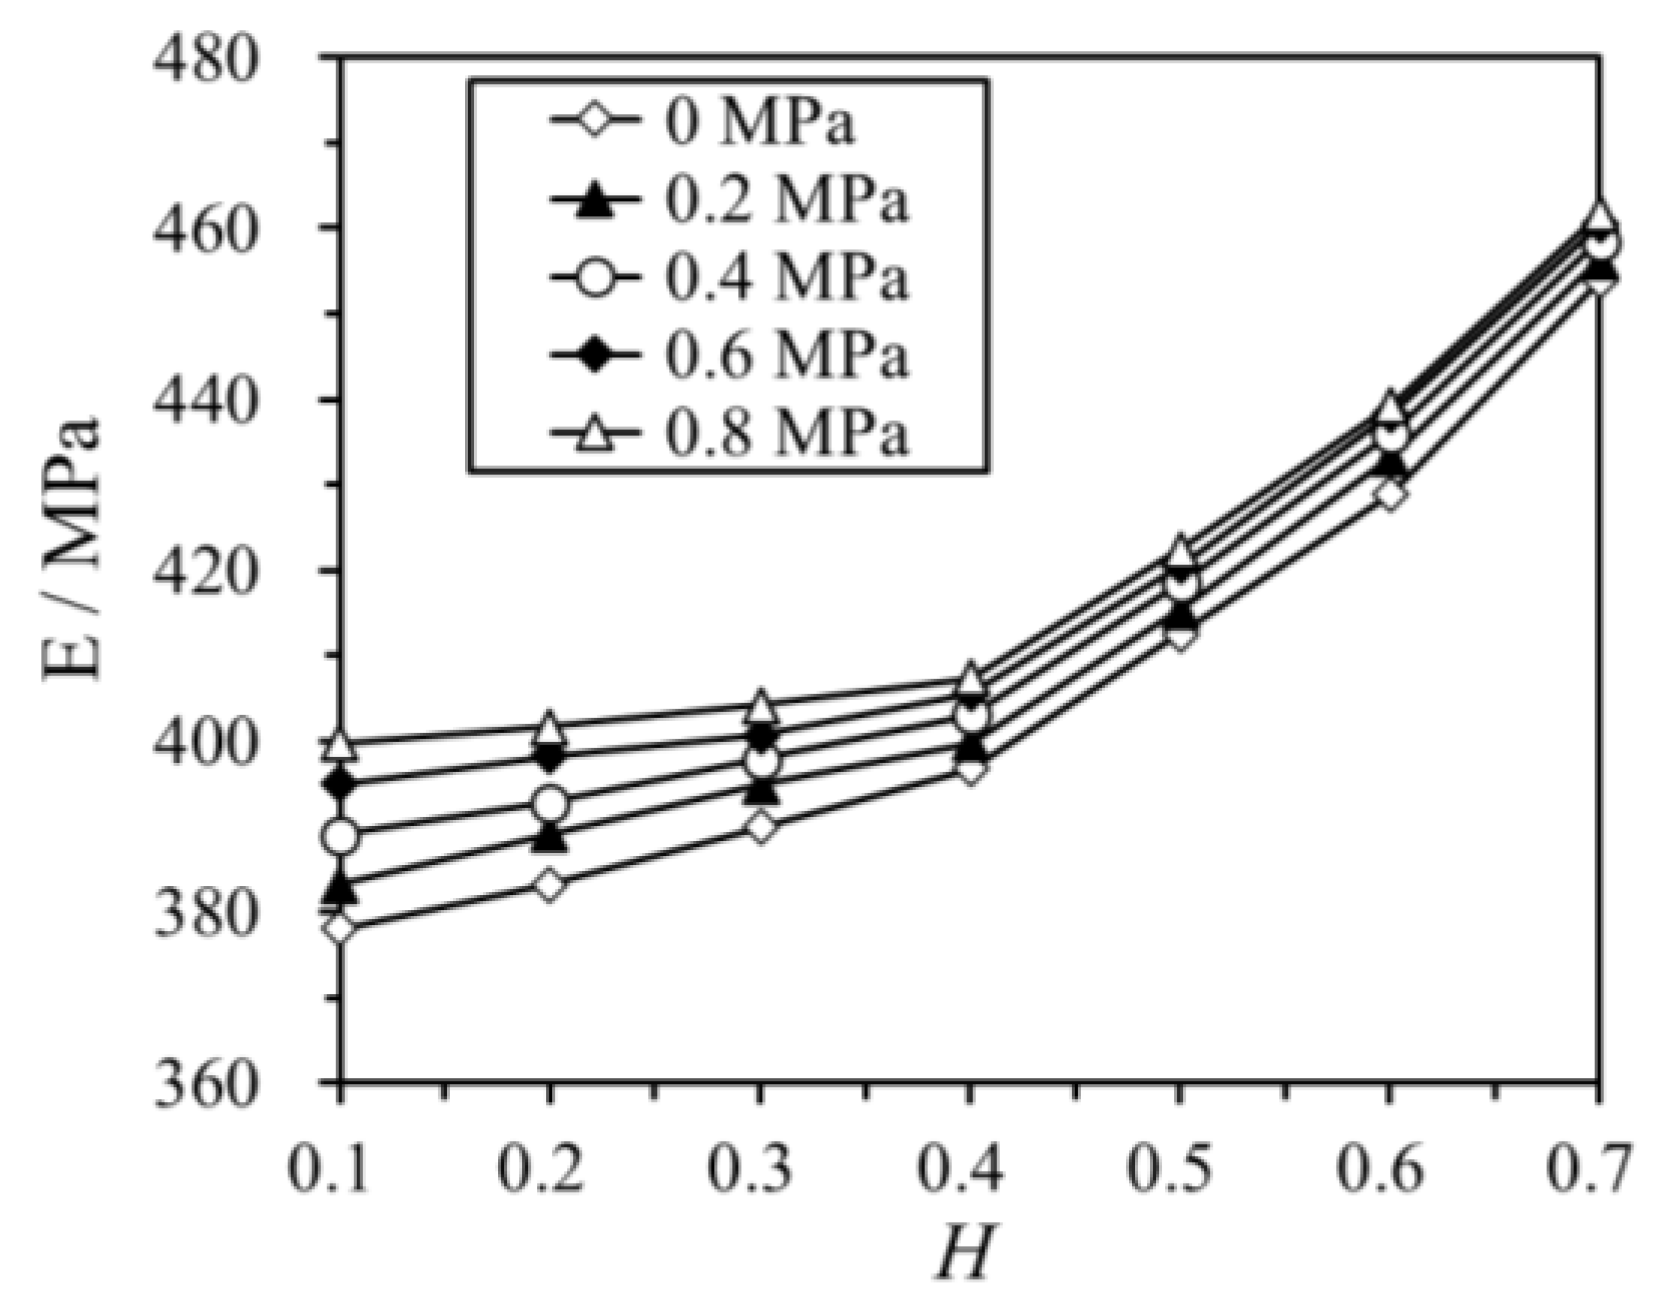
Figure 7 plots the flow rule of the elastic modulus under different RFCAs and confining stresses.
Under uniaxial compression, the elastic modulus of the numerical specimen increases by 20.1% from 378.34 MPa for H = 0.1 to 453.83 MPa for H = 0.7. This is similar to the laboratory UCT results, by which the elastic modulus of the specimen increases from 371.7 MPa to 418.80 MPa when H grows from 0.1 to 0.5. This indicates that the numerical result agrees well with the laboratory UCT results.
For the uniaxial compression condition, the elastic modulus escalates as the RFCA grows both from numerical and laboratory results, which is consistent with the conclusion drawn by Xu et al. [
11]. The reason is that as the value of
H increases, resulting in a higher percentage of fine aggregates, the specimen material becomes denser due to the filling of pores between coarse aggregates. This consequently leads to a noticeable increase in the elastic modulus.
In comparison, when the confining stress is at 0.8 MPa, the elastic modulus of the numerical specimen is 399.82 MPa at H = 0.1 and increases to 461.68 MPa at H = 0.7, a rise of 15.5%. Compared to the uniaxial compressive condition, the influence of RFCA on the elastic modulus weakens under higher confining stresses. This is because, under the exertion of high confining stress, the pores in the numerical specimen compress. Under elevated stress conditions, the sample becomes denser, effectively reducing the pore spaces available for the filling of fine aggregate. Consequently, this diminishes the sensitivity of the sample’s elastic modulus to RFCA.
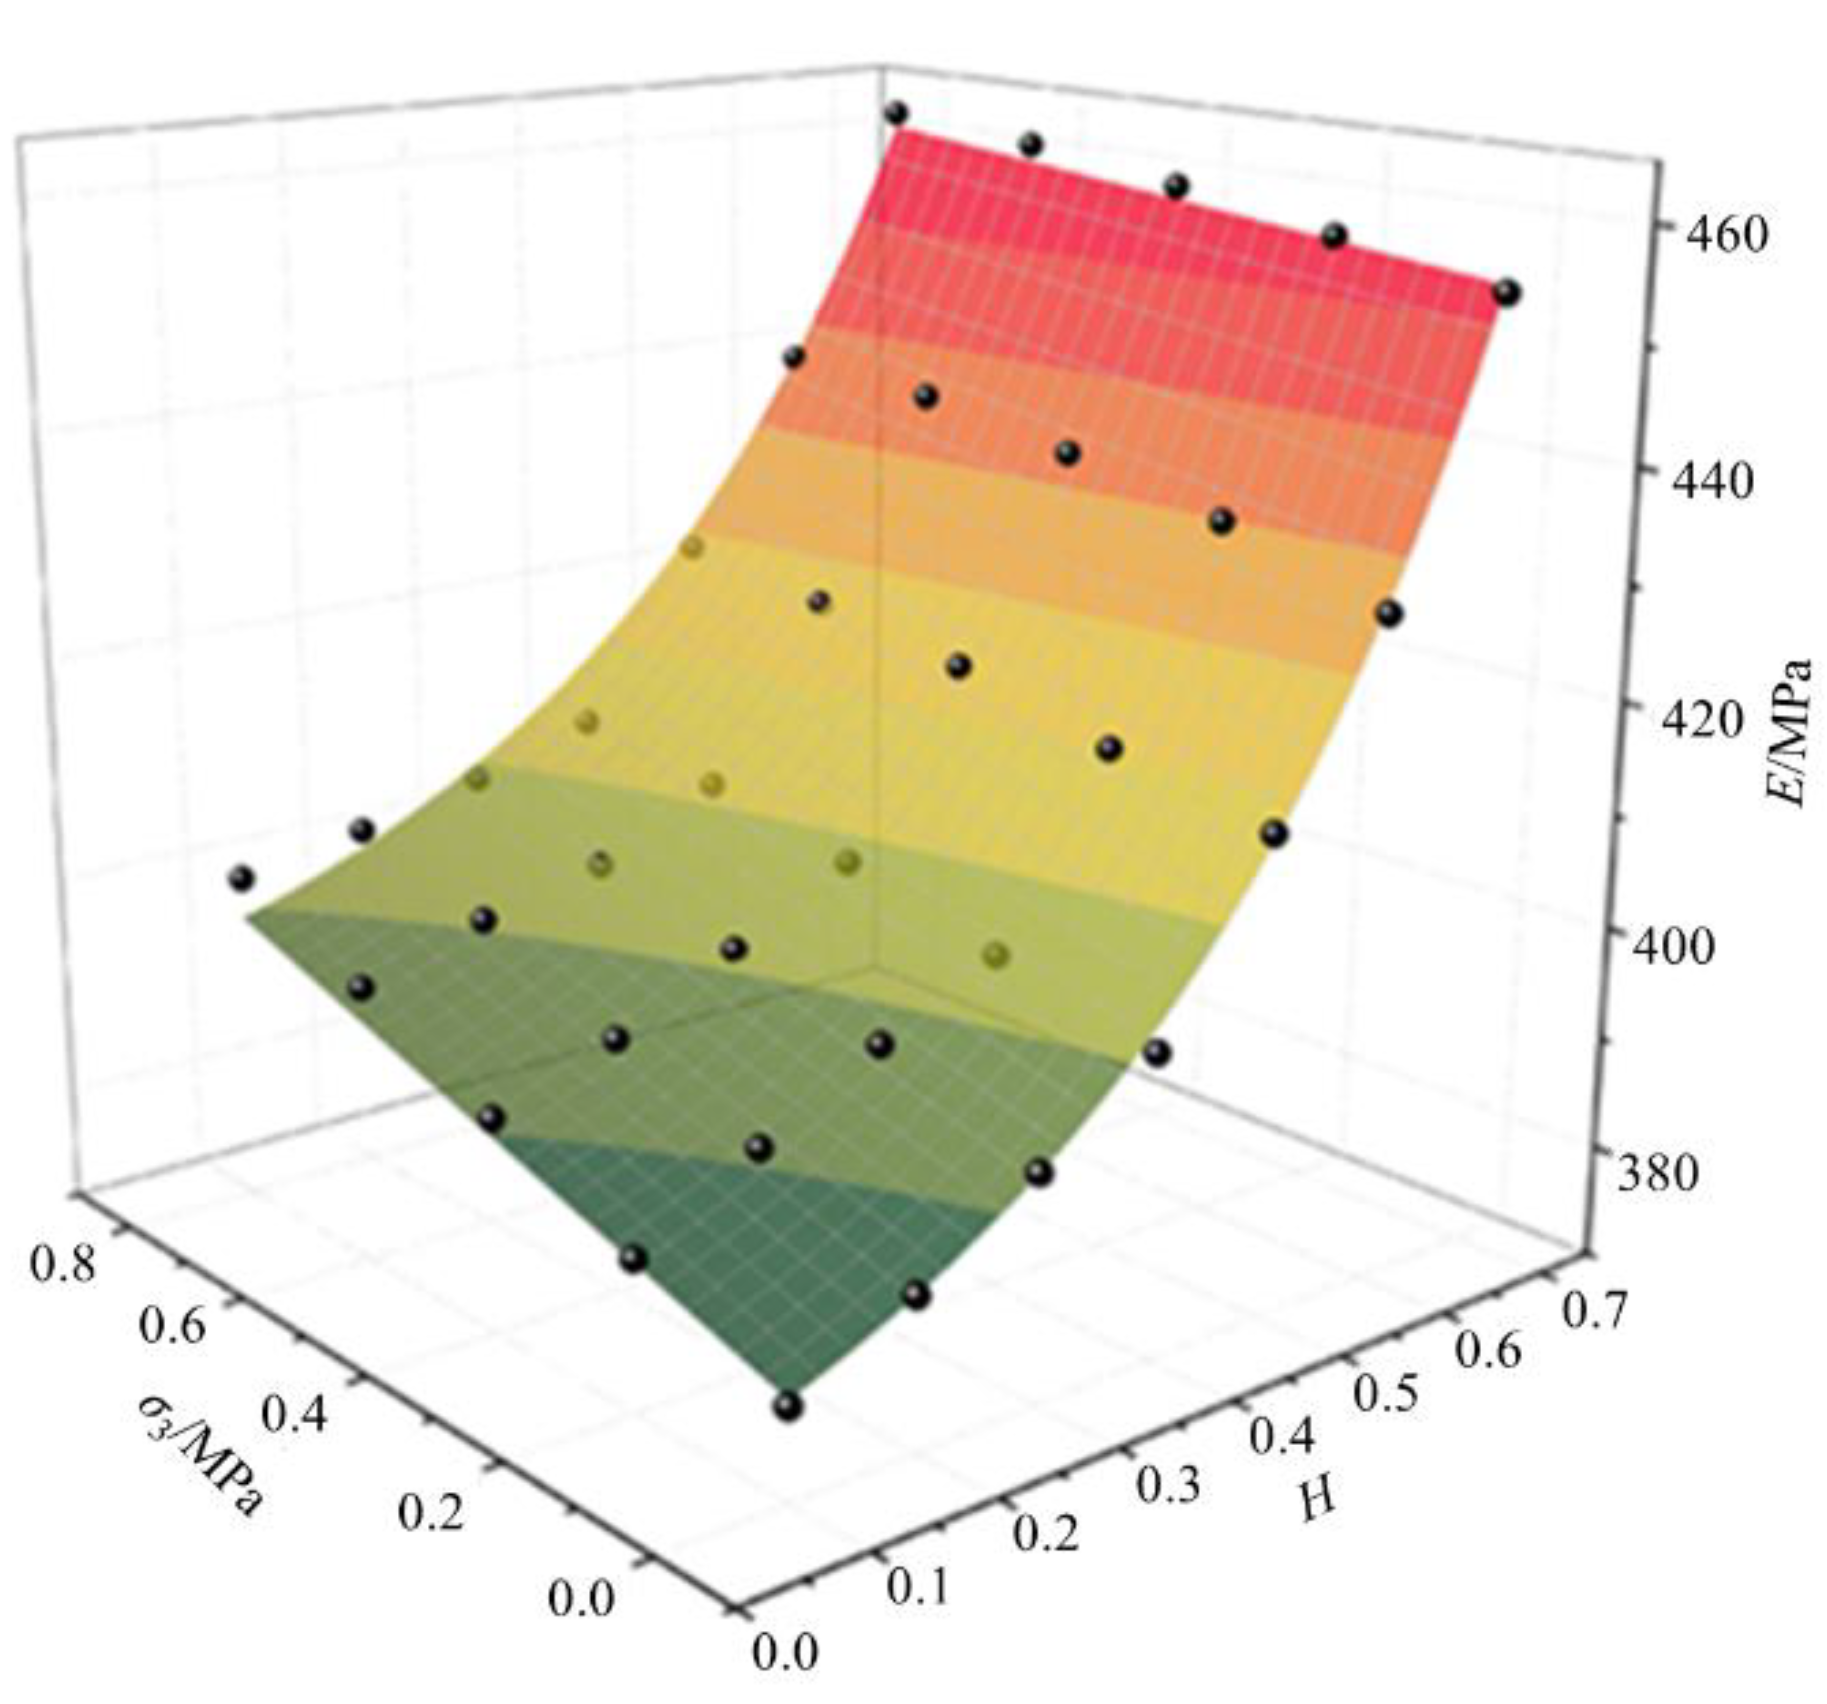
4.2.2. Nonlinear Equation of Elastic Modulus Influenced by RFCA and Confining Stress
Based on the above analysis, a nonlinear equation for the elastic modulus as a function of RFCA and confining stress is fitted as follows:
where
E denotes the elastic modulus,
σ3 represents the confining stress, and
a1,
a2,
a3,
a4, and
a5 are fitting coefficients. The elastic modulus increases exponentially with the increase in RFCA and rises linearly with the confining stress. The fitting coefficients are provided in
Table 4, and the results of the fitting surfaces are depicted in
Figure 8.
4.3. Strength Parameters
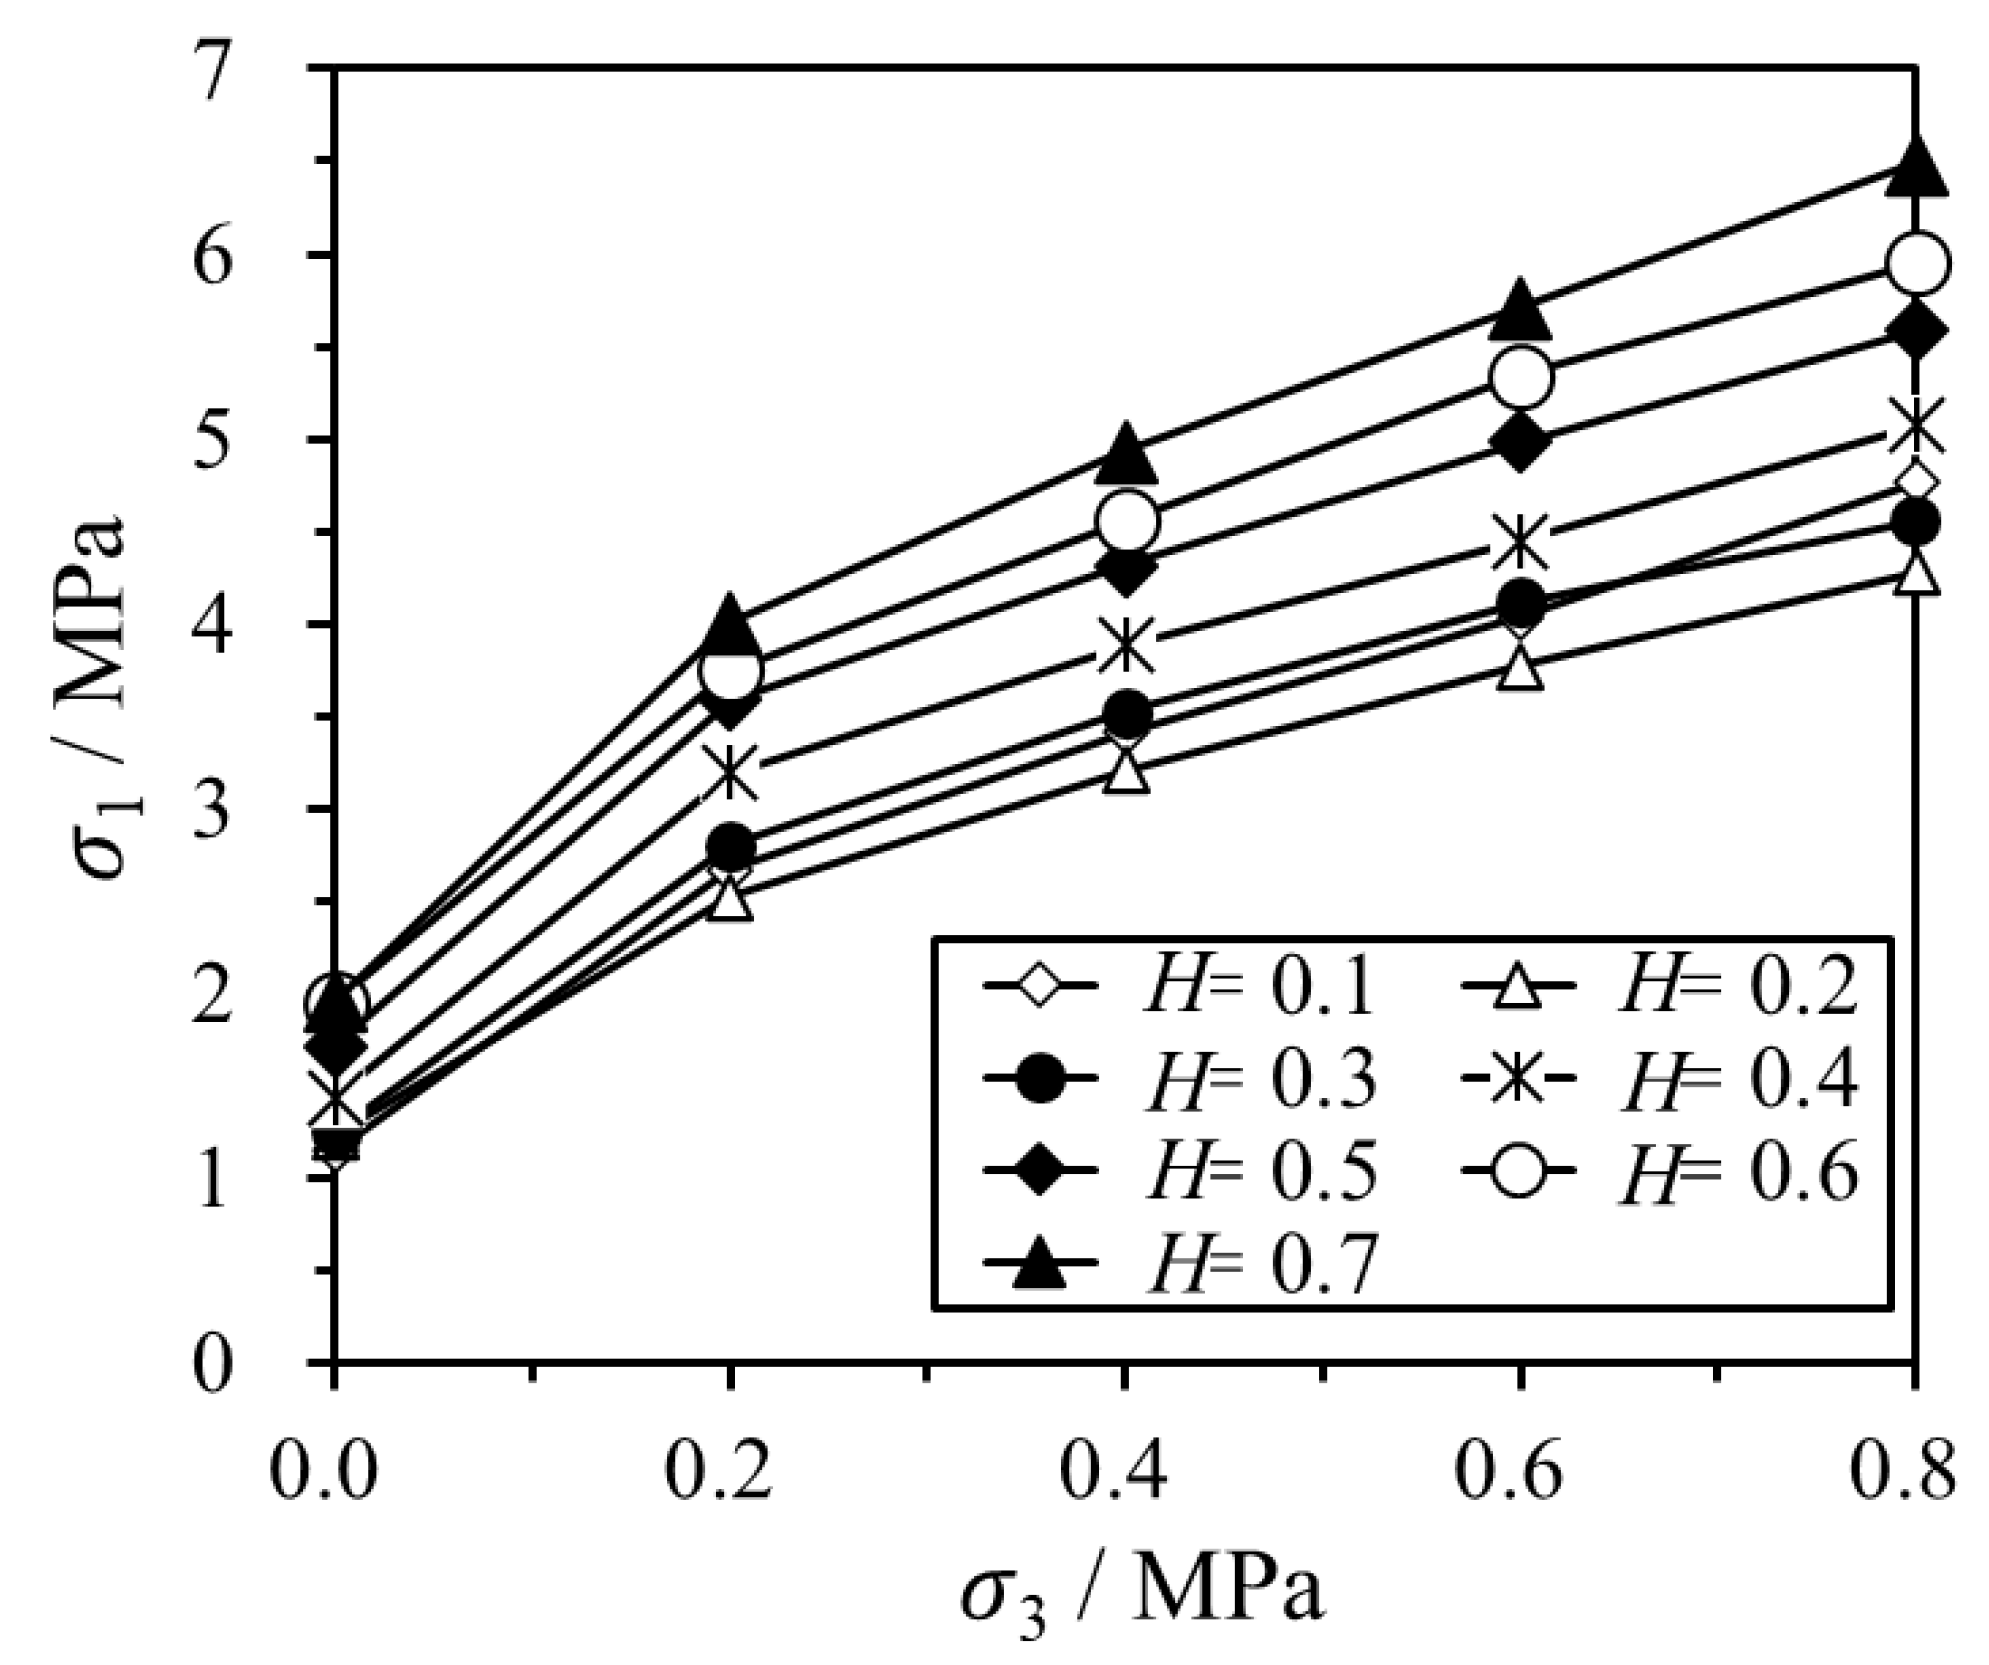
4.3.1. Peak Strength Influenced by RFCA and Confining Stress
Figure 9 illustrates the peak stress of the numerical specimen, highlighting the influence of RFCA and confining stress. As depicted in
Figure 9, the peak strength of the numerical specimen increases with the increase in
H under the same confining stress. For instance, at a confining stress of 0, the peak strength ascends from 1.15 MPa at
H = 0.1 to 1.95 MPa at
H = 0.7, marking a 70.2% increase. Under a confining stress of 0.8 MPa, the peak strength increases from 4.76 MPa at
H = 0.1 to 6.49 MPa at
H = 0.7, indicating a 36.4% increase. This suggests that a higher RFCA results in greater peak strength of the similar material. Moreover, this effect is more pronounced under smaller confining stresses.
To further quantify the effect of RFCA on the strength of similar materials, the Mohr–Coulomb strength criterion was introduced as follows:
where
σ1 signifies the maximum principal stress,
σ3 represents the minimum principal stress,
σc denotes the uniaxial compressive strength, and
K is the influence coefficient of the rock on the strength.
σc and
K can be represented by the internal friction angle
φ and cohesion
c, i.e.,
In this analysis,
c and
φ in the Mohr–Coulomb strength criterion are fitted according to the results of the curve of the principal maximum stress and principal minimum stress;
σc and
K with each RFCA can be initially fitted by Equation (5). As
σc and
K are solved, the internal friction angle
φ and cohesion
c with each RFCA can then be by solved by Equation (6). The fitting results of
σc,
K,
c, and
φ are tabulated in
Table 5.
Based on the obtained results in
Table 5, the relationship between
c and
H, as well as that between
φ and
H, can be fitted. The fitted linear equations are expressed in Equations (7) and (8), and the fitted results are plotted in
Figure 10 and
Figure 11.
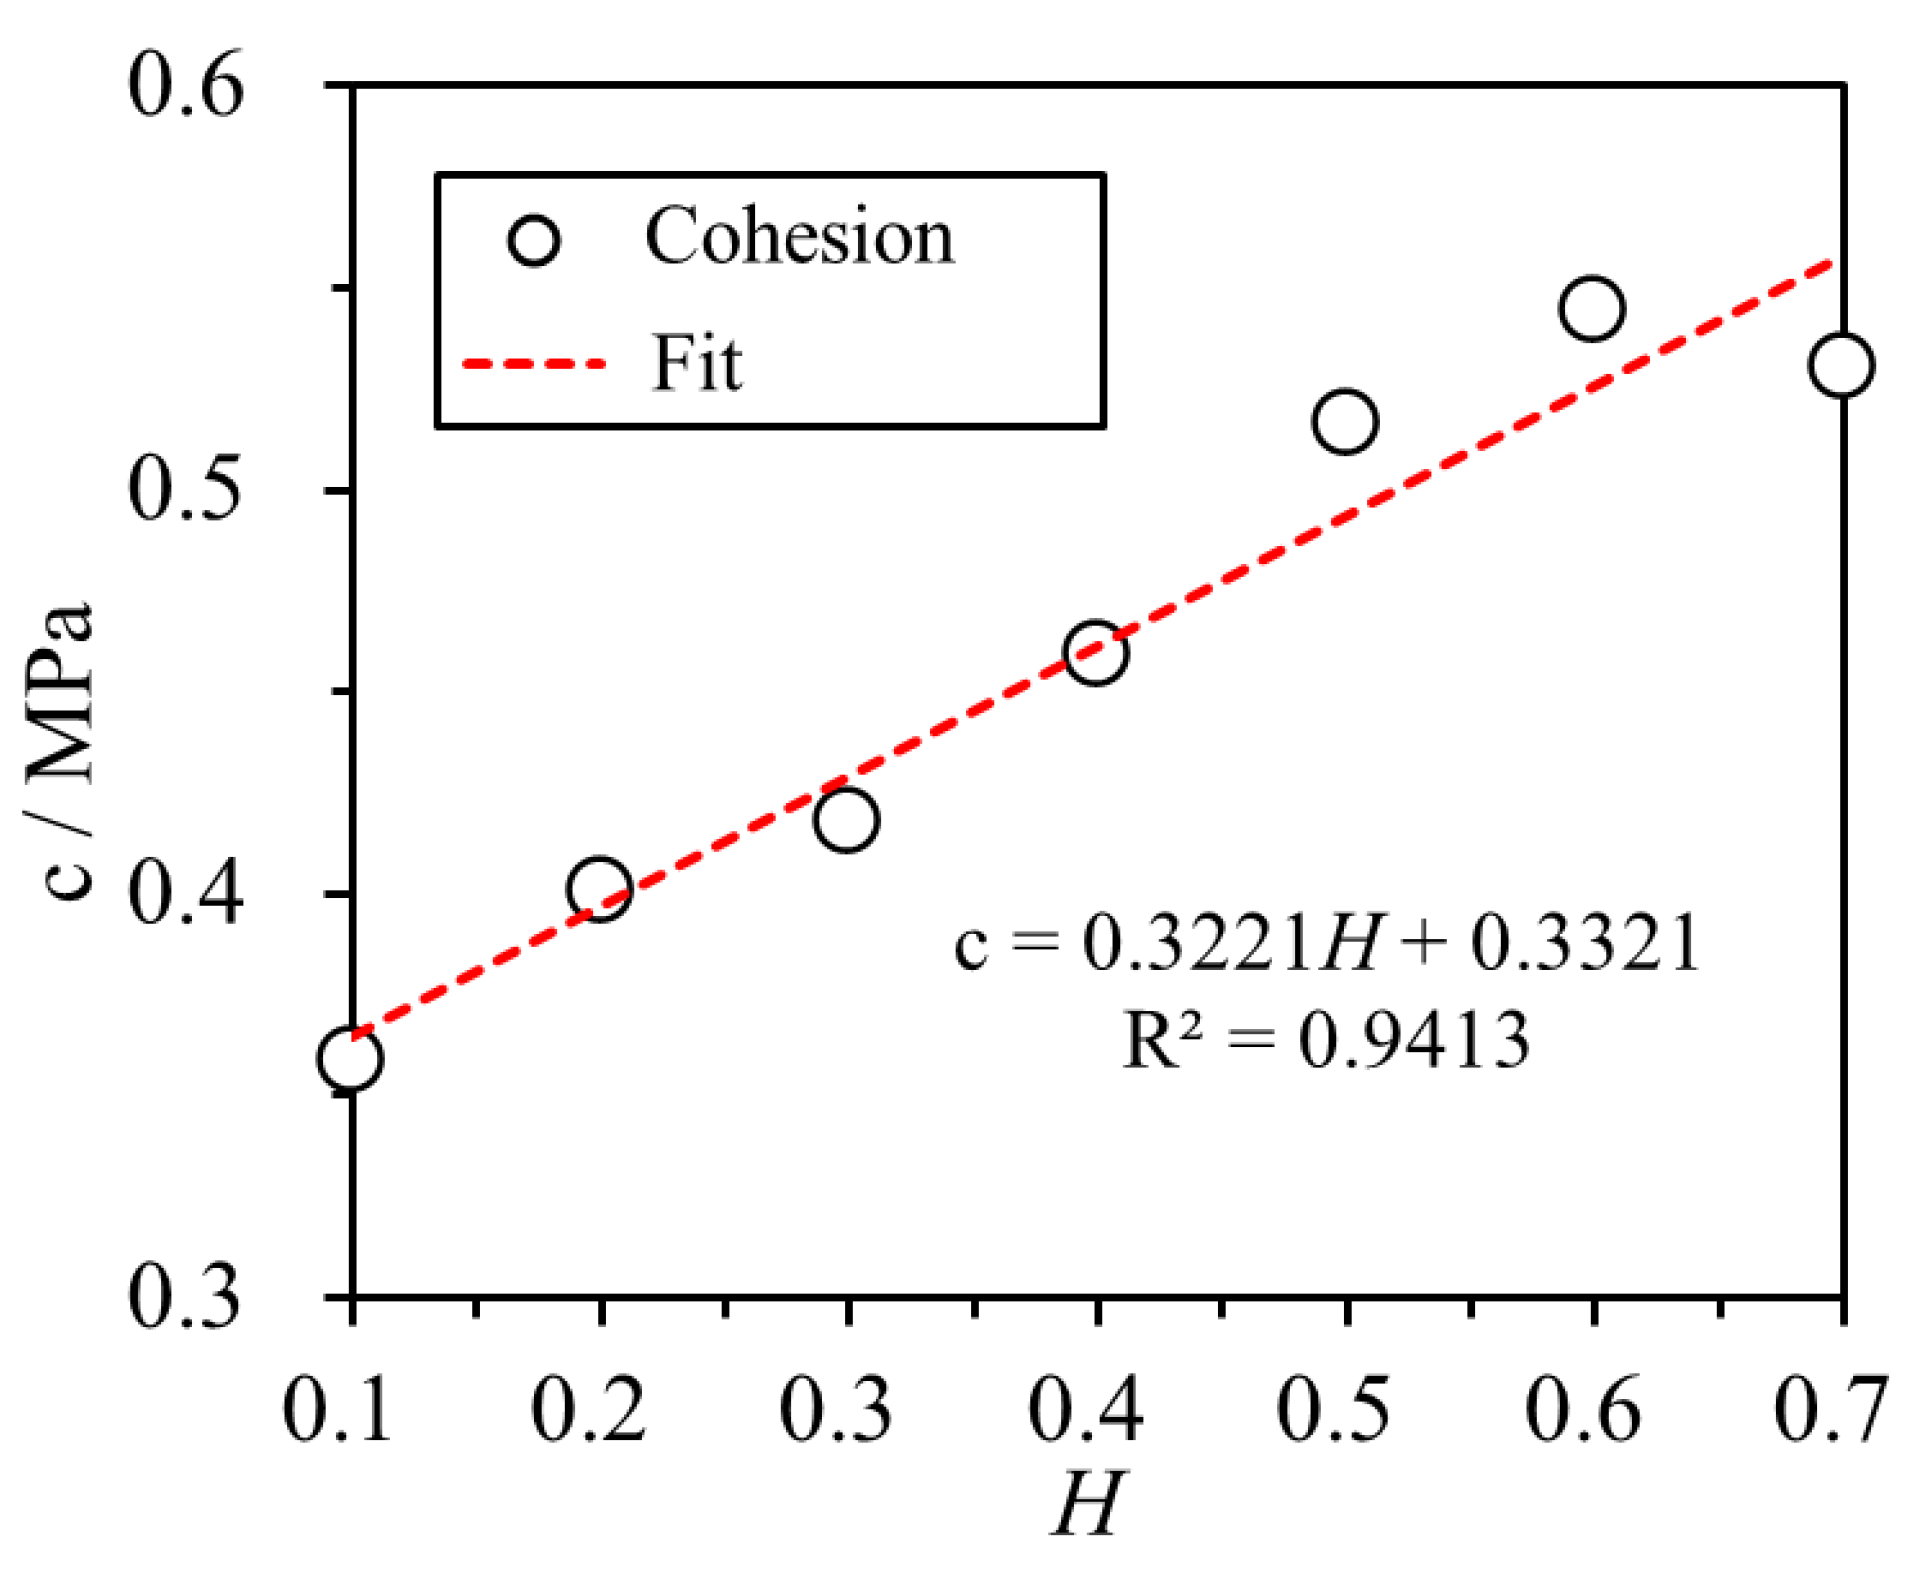
4.3.2. Relationship Between Cohesion and RFCA
Figure 10 reveals that there is a positive linear relationship between
c and
H. As
H increases from 0.1 to 0.7,
c also increases from 0.359 MPa to 0.530 MPa, representing a 32.5% improvement. This highlights the significance of RFCA in affecting the cohesion of the numerical specimen. The cohesion of the similar material is influenced by the cementation process of the interstitial cementing particles. As
H increases, the fine aggregate particles begin to fill the spaces among the skeleton of the coarse aggregate particles, resulting in a denser model with a higher degree of particle involvement in the cementation process. This triggers a gradual increase in
c of the similar material as
H increases.
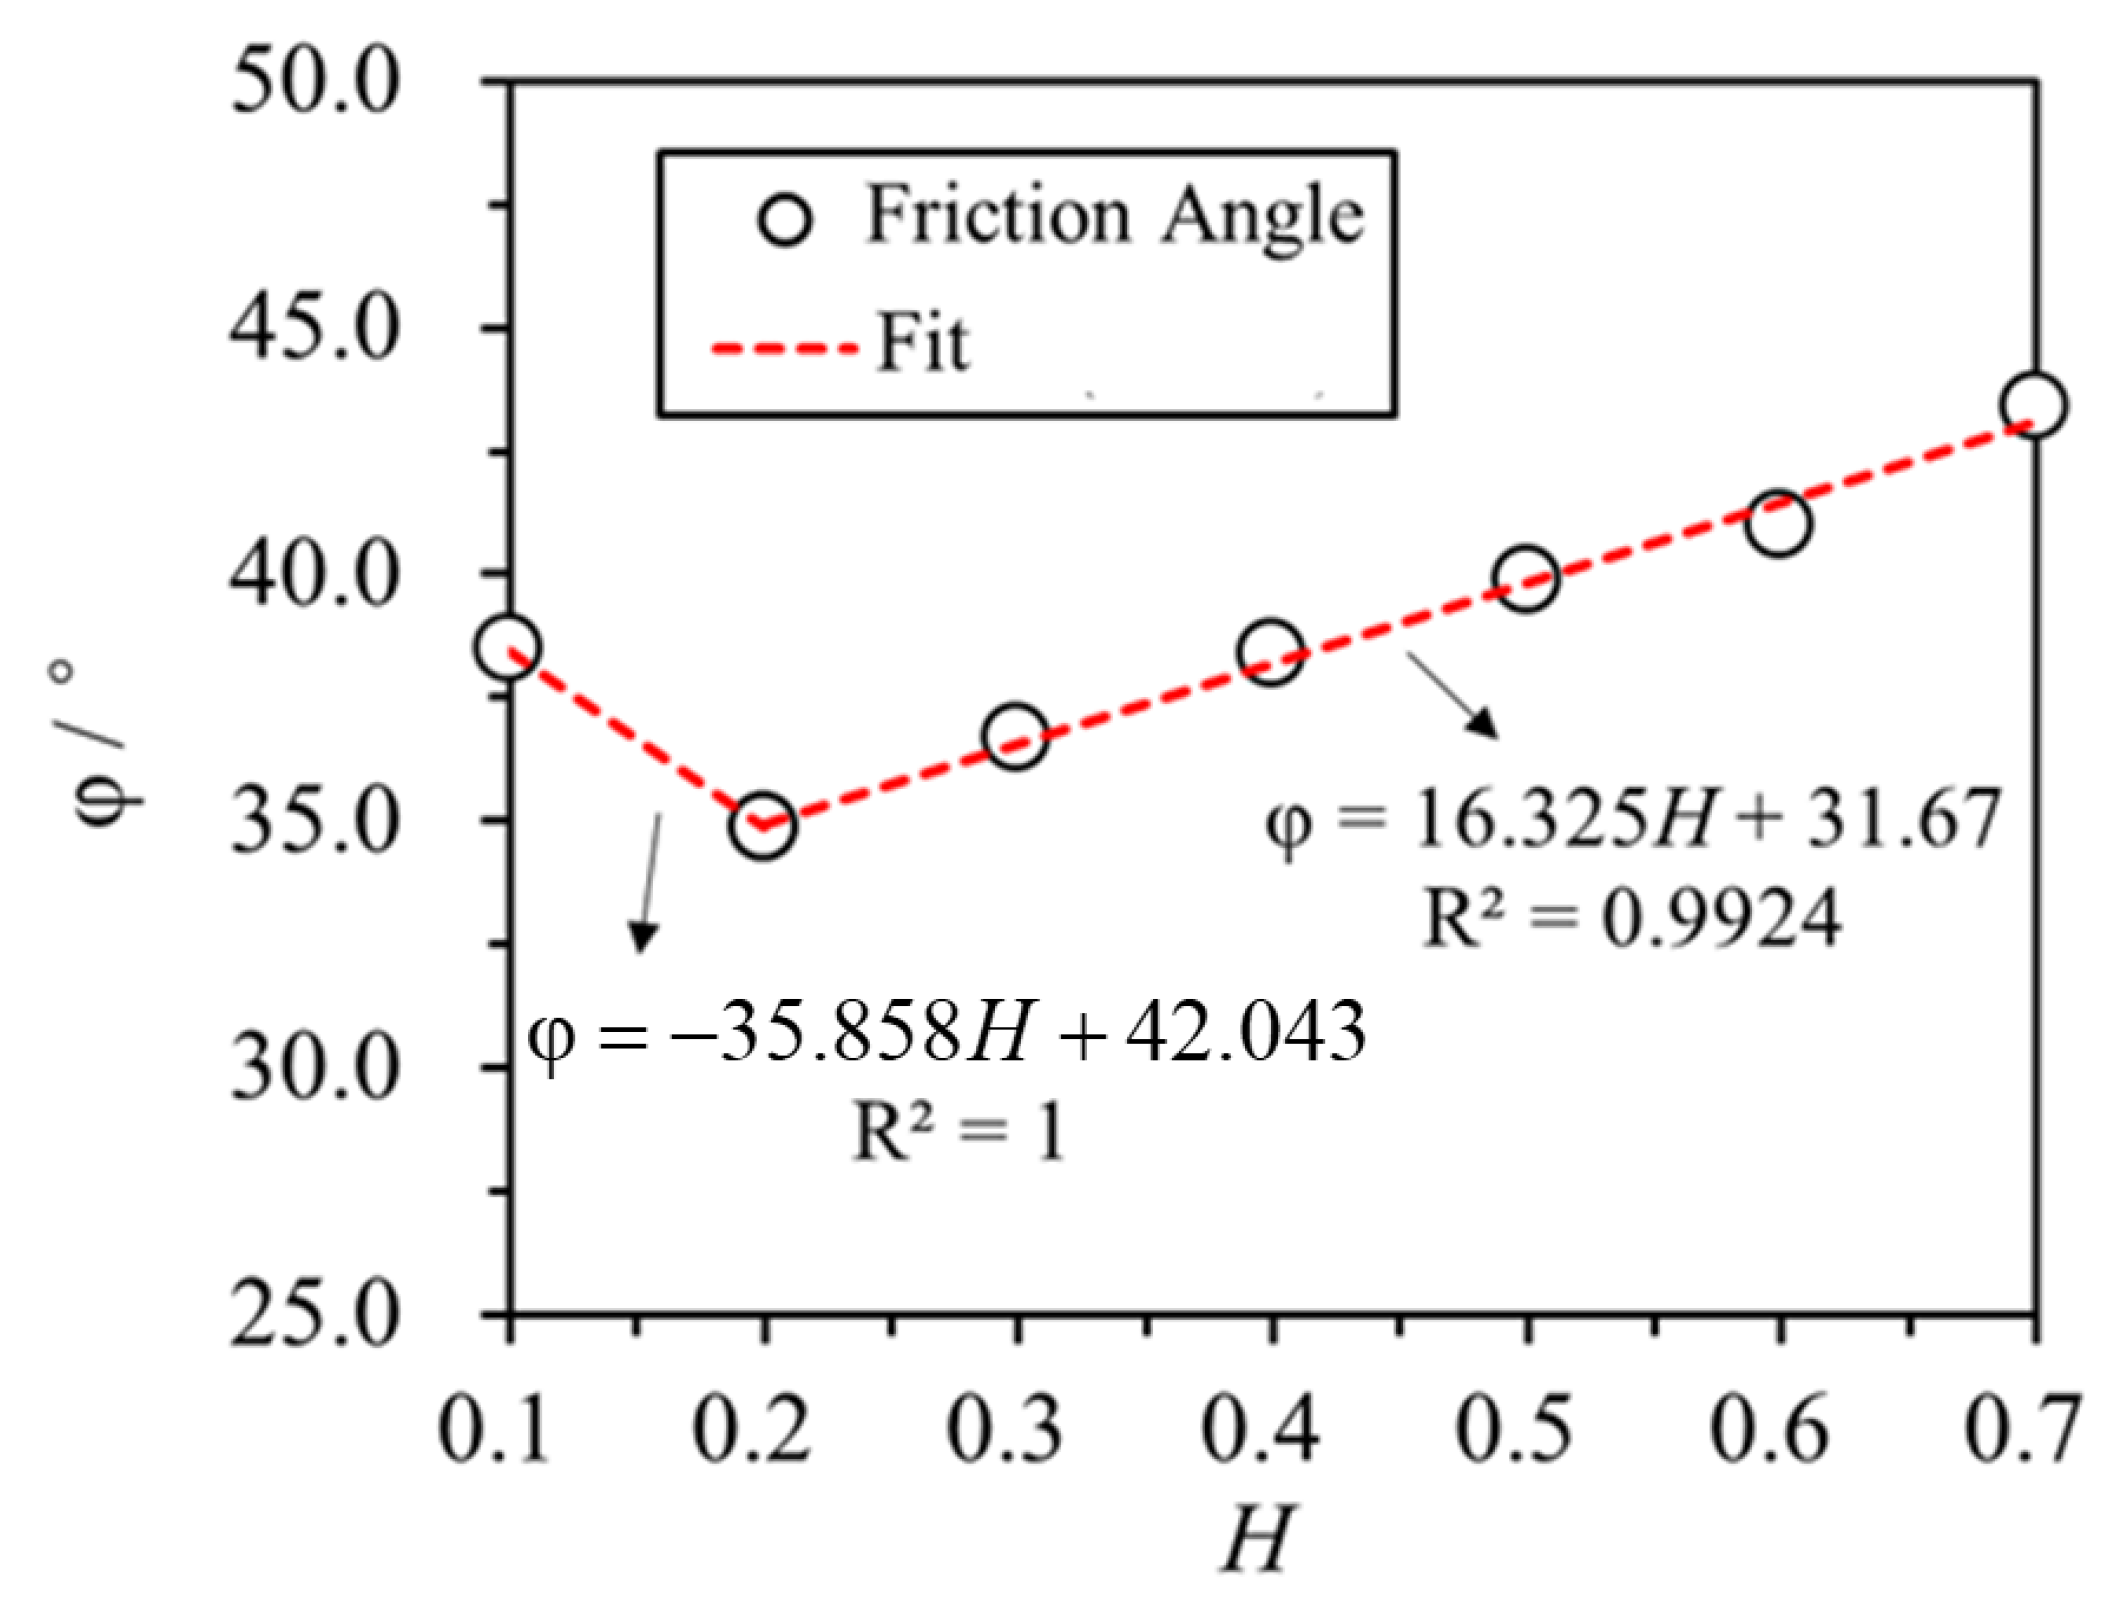
4.3.3. Relationship Between Internal Friction Angle and RFCA
It is observed from
Figure 11 that
φ exhibits a trend of decreasing and then increasing as
H increases. Particularly, when
H ≤ 0.2,
φ is linearly negatively correlated with
H. Conversely, when
H > 0.2,
φ is linearly positively correlated with
H, as per Equation (8).
When H ≤ 0.2, φ is predominantly regulated by the occlusal friction between coarse aggregate particles. As H progressively increases, the skeleton effect between particles diminishes. However, when H > 0.2, with a gradual increase in the fine aggregate percentage, the skeleton effect between particles continues to decrease. Consequently, φ transforms from occlusal friction, provided by coarse aggregates, to sliding friction imparted by fine aggregates. As H continues to augment, the number of fine aggregate particles significantly grows, causing the sliding friction to progressively increase, and, subsequently, φ also rises.
4.4. Mesoscopic Analysis of the Similar Material
4.4.1. Mesoscopic Contact Force of the Similar Material
In the discrete element analysis, particles are interconnected via mutual contacts, with local areas influencing the whole and reflecting various mechanical behaviours of mesoscopic material [
28]. The contact force is represented by the line of centroid between particles, with a thicker line denoting a greater contact force.
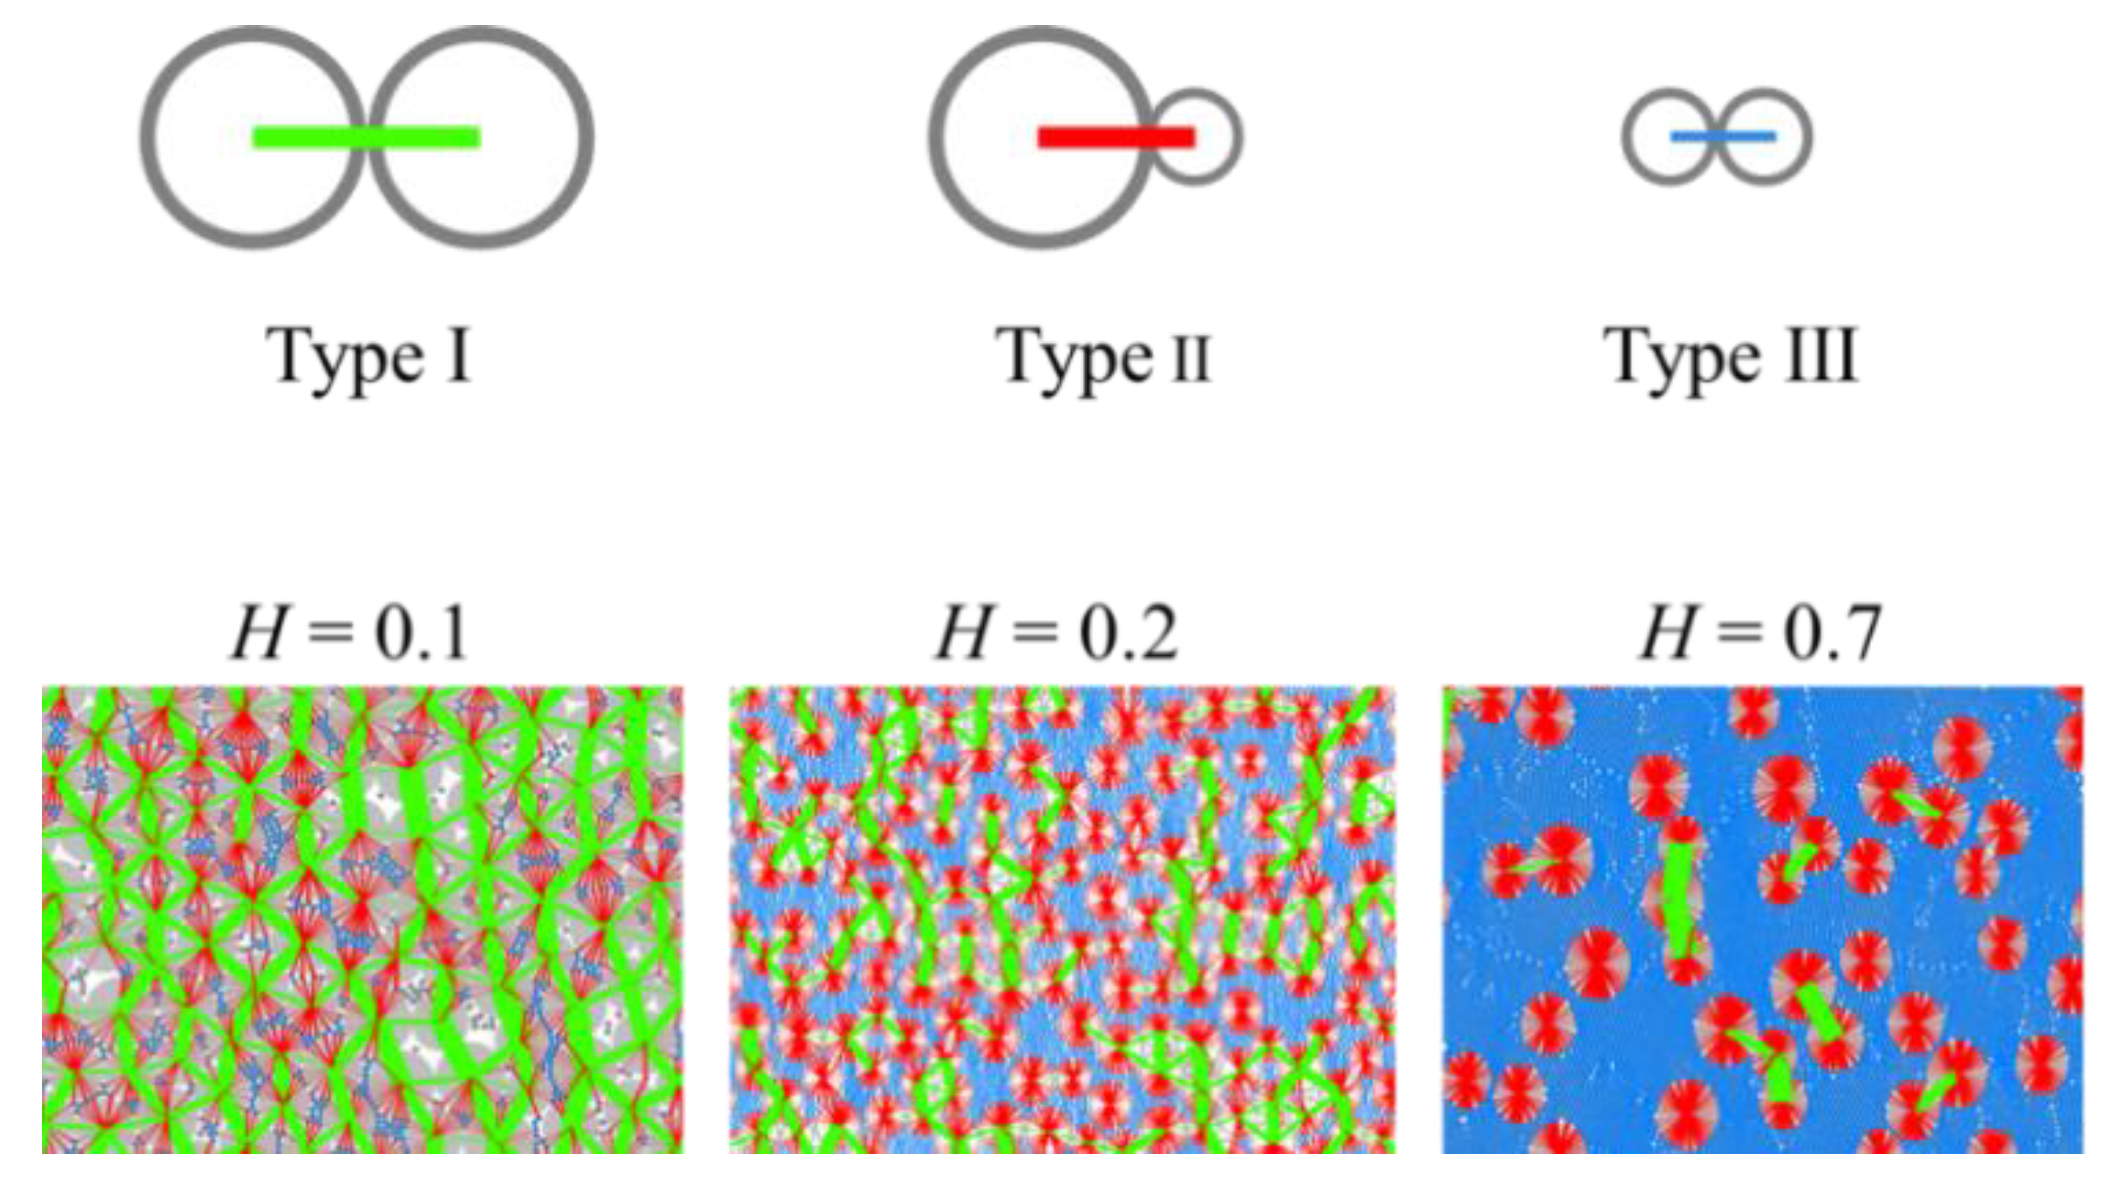
To clearly demonstrate the contact between fine and coarse particles, this analysis classifies the contact between particles into Green Type I, Red Type II, and Blue Type III, based on the particle size at both ends of the contact. Green Type I contact denotes the contact between coarse particles, Red Type II contact represents the interaction between fine and coarse particles, and Blue Type III contact symbolises the contact between fine particles. These classifications are illustrated in
Figure 12.
Figure 12 displays the contact force distribution of the numerical specimen with varying RFCAs (
H = 0.1, 0.2, and 0.7) under the uniaxial compressive stress of 0.5 MPa. At
H = 0.1, an evident green contact network forms between the particles, with the interaction between the particles primarily governed by the Green Type I contact. The skeleton effect between coarse particles is clear. At
H = 0.2, the number of Red Type II contacts and Blue Type III contacts incrementally increases. The fine particles begin to fill the spaces between the coarse particles, fragmenting the skeleton of coarse particles. Consequently, the skeleton effect between coarse particles lessens. With a further increase in
H, the number of Blue Type III contacts rises considerably. The skeleton effect between coarse particles continues to weaken as the material is predominantly filled by fine particles. At
H = 0.7, the contact within the similar material is fundamentally controlled entirely by Blue Type III.
4.4.2. Mesoscopic Contact Number of the Similar Material
In order to provide a more quantitative description of the contact between particles, information on the number of contacts in the particle system was extracted using the FISH language, and the average number of contacts (coordination number) was calculated. It is an important parameter to evaluate whether a model is dense or not and can reflect the state of the specimen to some extent. The average number of contacts in the specimen is calculated by Equation (9).
where
Nc represents the number of actual contacts (normal contact force greater than zero) in the specimen, and
NP is the total number of contacts in the specimen.
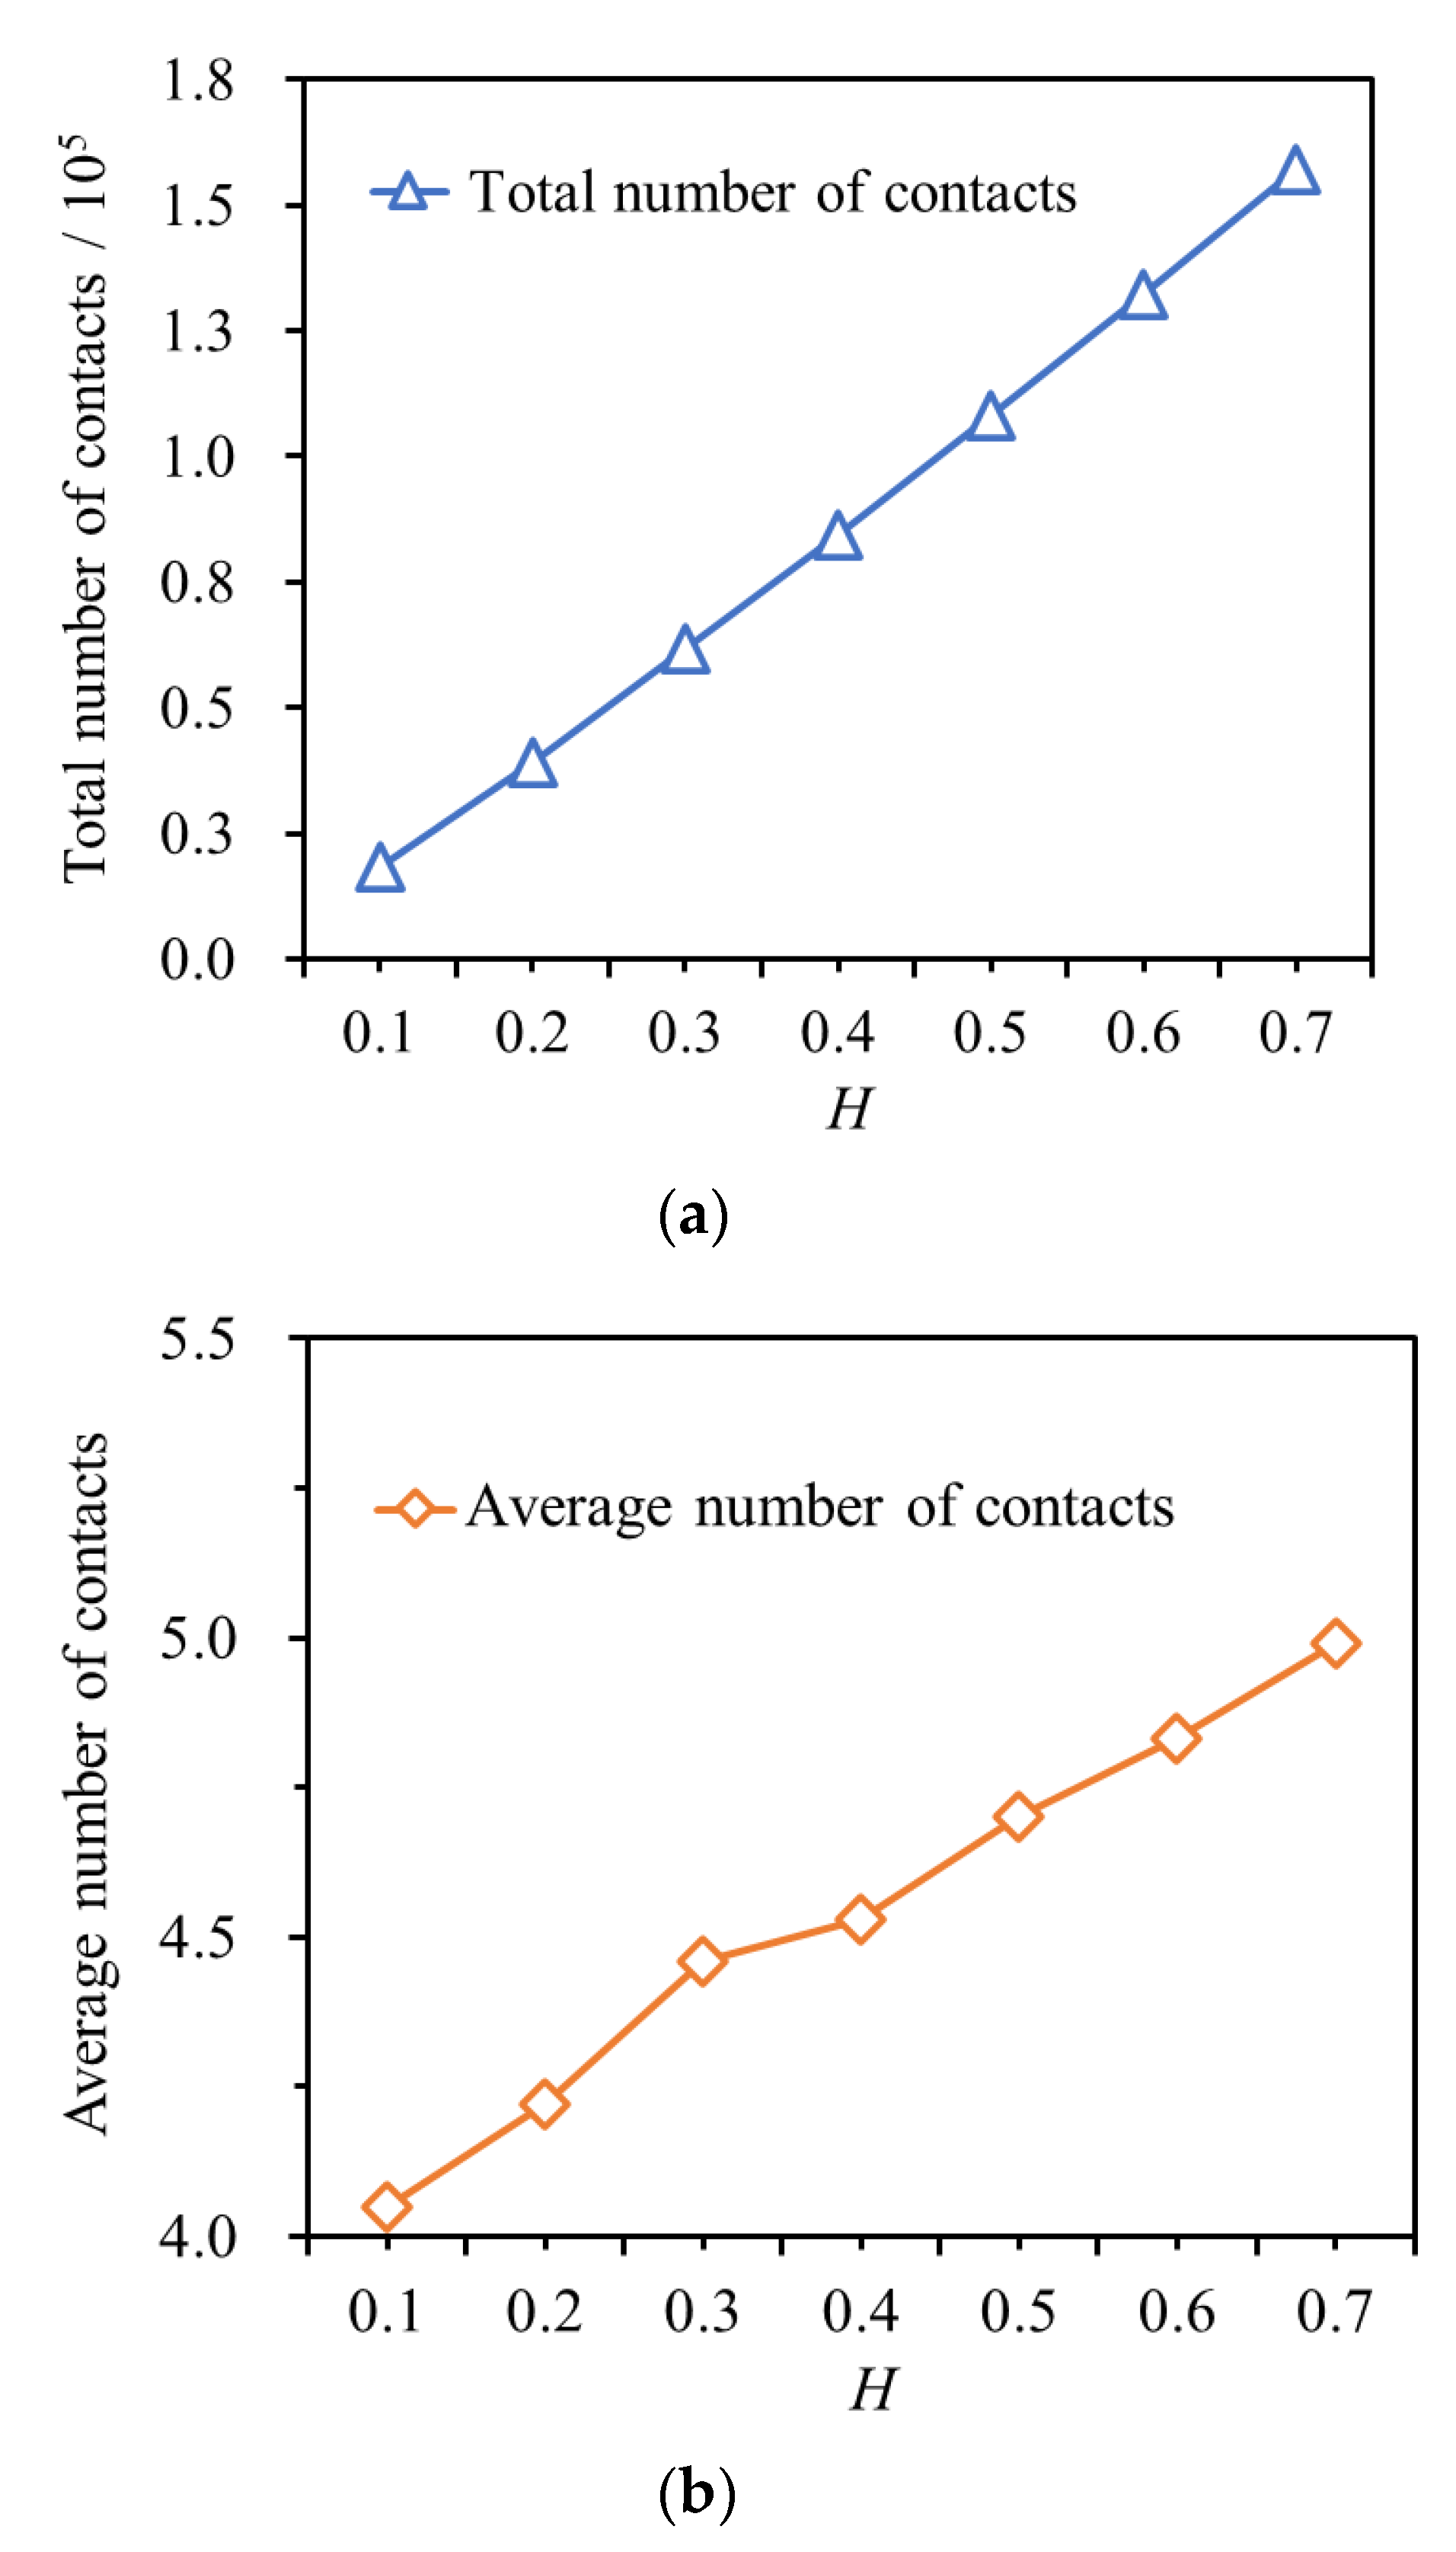
The number of mesoscopic contacts in the numerical specimen with varying RFCAs is depicted in
Figure 13. As shown, the total number of contacts in the specimen is 18,279, with an average number of contacts of 4.05 when
H = 0.1. When
H = 0.7, the total number of contacts in the numerical specimen increases to 157,113, representing an increase of 759.5%, and the average number of contacts increases to 4.99, a rise of 23.4%. The comparison shows that the increase in
H increases the total number of contacts and the average number of mesoscopic contacts in the numerical specimen.
On a mesoscopic level, an increase in the total number of contacts implies that a greater number of particles in the sample are involved in sharing the applied load. Consequently, the overall contact area between particles increases, and the sample’s cohesion is likely to rise with the increasing H. Furthermore, an increase in the average number of contacts signifies that the sample becomes denser, with each individual particle experiencing a rise in the number of surrounding particles it contacts. This is consistent with the above analysis. The internal friction angle φ is mainly controlled by the skeleton between coarse particles when H ≤ 0.2.
As H increases, the skeleton between coarse particles weakens, and the internal friction angle φ is gradually controlled by the sliding friction between the particles. When H > 0.2, the average number of contacts between particles increases, which increases the resistance to relative sliding between particles and renders it more difficult for particles to slide against each other. Consequently, the internal friction angle φ increases.
4.4.3. Mesoscopic Evolution of the Similar Material
Discrete element analysis allows for a more visual representation of the distribution and morphology of macroscopic cracks in the numerical specimen through its discrete fragment network (DFN). The cracks in the specimens are formed due to contact fractures between the particles. They are represented by coloured line segments. The blue colour indicates an earlier occurrence of the crack, while the red colour represents a later appearance of the crack.
Figure 14 shows the macroscopic crack expansion in the numerical specimen with different RFCAs when the uniaxial compression reaches the failure stage and compares it with the specimens from laboratory UCTs. As evidenced by
Figure 14, micro-cracks initially appear near the upper and lower loading plates, as well as in proximity to the coarse aggregate. As the axial stress increases, these micro-cracks extend along the edges of the coarse aggregate, ultimately coalescing to form macroscopic cracks.
When H is small (H ≤ 0.3), the percentage of fine aggregates is comparatively low. Thus, the propagation of micro-cracks between fine aggregates is readily impeded by the presence of coarse aggregate. Consequently, these micro-cracks tend to extend around the edges of the coarse aggregate. The direction of crack propagation undergoes a shift as it manoeuvres around the edge of the coarse aggregate, making it more conducive to the formation of macroscopic shear cracks. However, when H is relatively high (H > 0.3), the expansion of microcracks between fine aggregates is less influenced by the coarse aggregate. The expansion tends to occur vertically along the edge of the fine aggregates, ultimately forming vertical macroscopic cracks. The macroscopic crack patterns and angles observed in the simulation are similar to those found in indoor experimental results.
5. Method to Prepare Similar Materials Simulating Weak Rock Mass
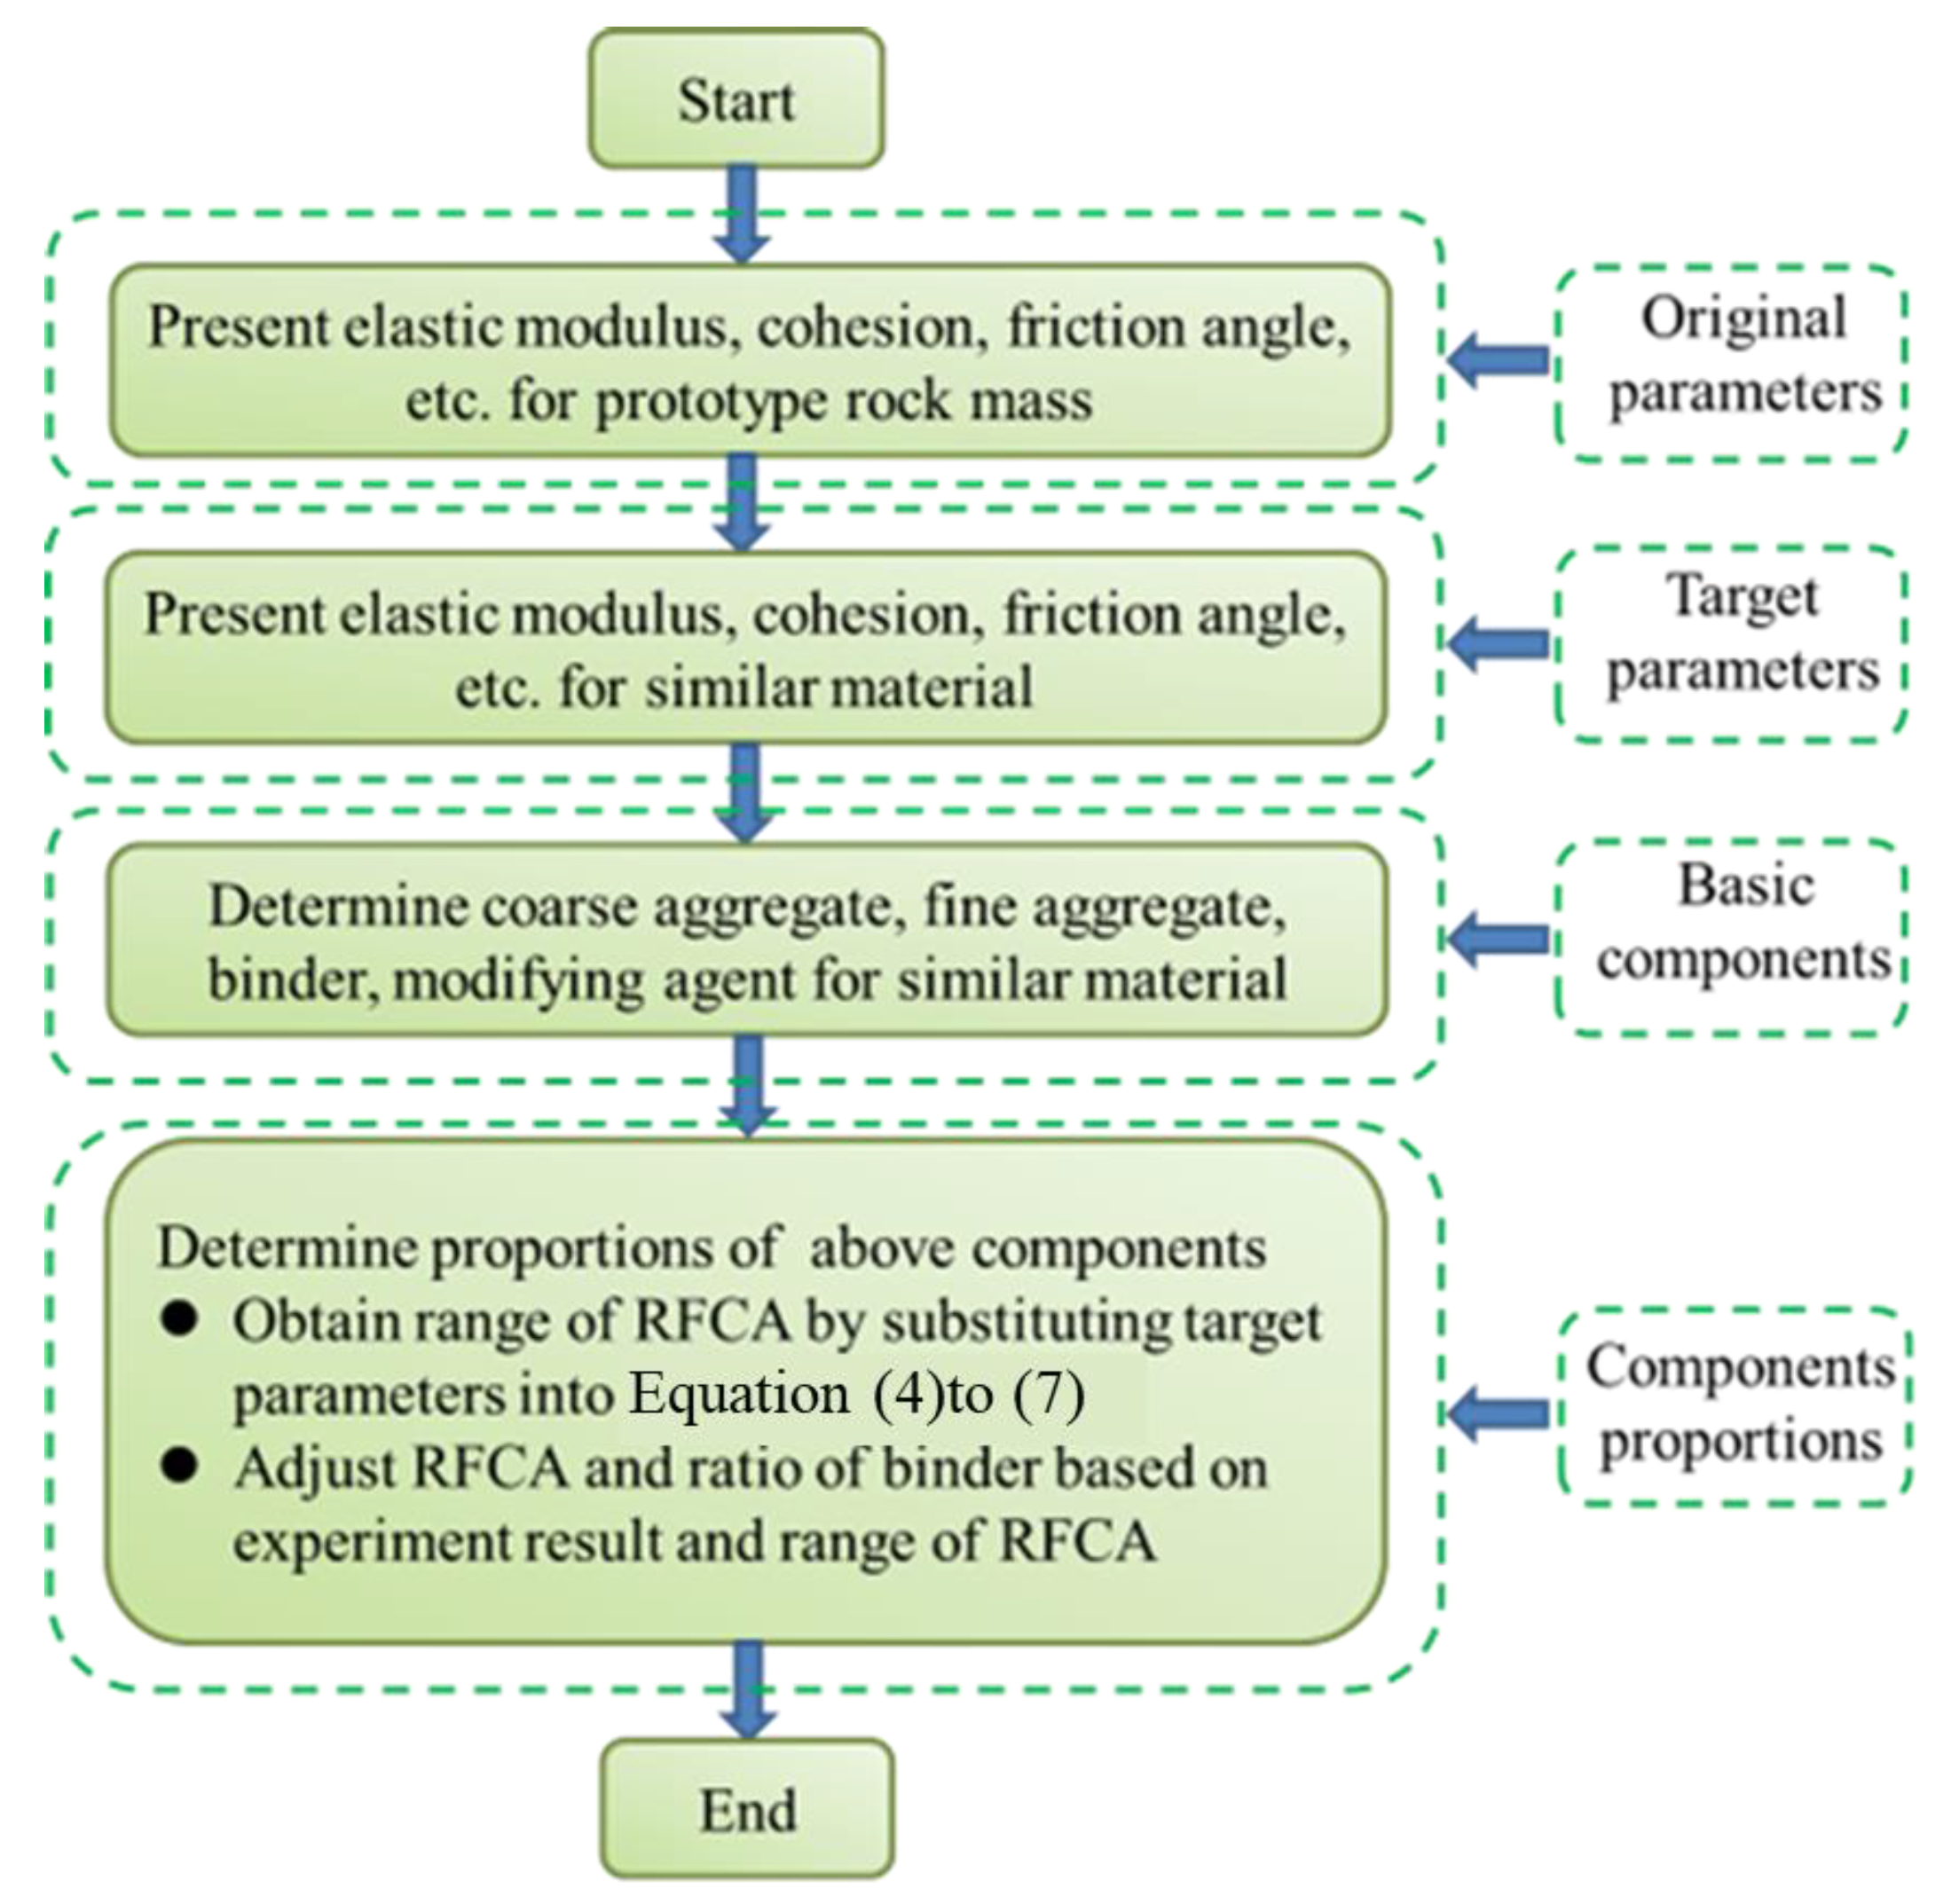
Via discrete element analysis, the mathematical relationships between the RFCA and mechanical properties such as elastic modulus, cohesion, and internal friction angle were proposed. According to this, a method to prepare the similar material is presented. The flowchart of the method is shown in
Figure 15.
- (1)
Obtain the original parameters of weak surrounding rock mass:
Mechanical parameters such as elastic modulus, cohesion, friction angle, etc., for prototype rock mass are usually obtained from the field measurements, laboratory tests, or empirical methods.
- (2)
Derive the target parameters of similar materials by the similarity principle:
The target parameters of similar materials can be solved by the similarity principle on the basis of the original parameters. Gravity, Poisson’s ratio, and the internal friction angle of the similar material are equivalent to those of the prototype rock mass, whereas the elastic modulus and cohesion are solved by dividing the stress geometric similarity scale.
- (3)
Select the basic components of similar materials:
The basic components of similar materials simulating weak rock mass are proposed, and a summary is shown in
Table 6. As in
Table 6, the similar material for the rock mass is mostly composed of three parts: aggregates, binder, and modifying agent. Aggregates are produced by barytes, sand and iron powder, etc. The binder refers to a white emulsion, gypsum, cement, epoxy resin, silicone rubber, rosin, et al. The modifying agent refers to water, alcohol, and gasoline. The main purpose of the modifying agent is to mix the proportions of the similar materials.
Referencing
Table 6, the coarse aggregate of the similar material is sourced from quartz sand, and barytes are selected as fine aggregates. The binder and modifying agent are gypsum and water, respectively.
- (4)
Determine the proportions of the components of similar materials:
Several sets of compression tests for different RFCAs and the ratio of the binder should be conducted. Based on the test results, coefficients of Equations (4), (7), and (8) are derived. Hence, relationships between the elastic modulus, cohesion, friction angle, and RFCA are obtained. Substituting the target mechanical parameters into the relationships, the range of the RFCAs can be obtained. It should be noted that the unit weight of the similar material depends heavily on barite power. Thus, the unit weight should be an important parameter to determine the exact proportion of the barite power, which influences the RFCA. Furthermore, the ratio of the binder can be gained by combining the experiment results and the results of the range of RFCA.
It should be noted that both the experiments and the mathematical equations should be employed when seeking the optimum RFCA and proportions of other components, such as the binder or the modifying agent. Although the numerical method presents the mathematical equations herein, reasonable proportions of the components still need the assistance of experimental results. The advantage of this study is that it can greatly reduce repetitive proportioning tests and save much time and financial resources.
6. Conclusions
In this analysis, the effect of RFCA on the mechanical properties of similar materials simulating weak rock mass was analysed by UCTs. The influence rule of RFCA on the contact force and failure evolution of the similar materials from a mesoscopic perspective by discrete element analysis was discussed. The following conclusions were obtained:
- (1)
Based on the results of discrete element analysis, nonlinear fitting equations of the elastic modulus correlating with the fine aggregate percentage and confining stress were proposed. The nonlinear fitting equations of the friction angle and cohesion correlating to the fine aggregate percentage were presented. This provides a method for evaluating the strength and deformation parameters by the aggregate percentage for similar materials.
- (2)
Different RFCAs significantly affect the stress–strain curves of similar materials under compression. As the fine aggregate percentage decreases, the stress–strain curve reaches the pre-peak yielding stage at an earlier point, and the post-peak softening stage is more ductile. Conversely, as the fine aggregate percentage increases, the specimens become more resistant to yielding, and the post-peak softening stage is more brittle.
- (3)
With the increase in RFCA, the internal friction angle presents a trend of initial decreasing and then increasing. When the proportion of fine aggregate is less than or equal to 0.2, the internal friction angle, regulated by occlusal friction, is predominantly controlled by the skeleton between coarse particles. With the proportion of fine aggregate increases, the skeleton effect between particles becomes weak, and the friction decreases. When the proportion of fine aggregate is over 0.2, the method of friction transforms from occlusal friction to sliding friction. As the number of fine aggregate particles significantly keeps augmenting due to the increase in the proportion of fine aggregate, the sliding friction subsequently increases, resulting in the growth of the internal friction angle.
- (4)
When the proportion of fine aggregate is low, the propagation of microcracks between fine aggregates is easily hindered by the presence of coarse aggregates. Furthermore, the microcracks expand around the edge of the coarse aggregate, and the direction of the crack growth will change with the rotation around the edge of the coarse aggregate, making it more conducive to form macroscopic shear cracks. When the proportion of fine aggregate is high, the microcrack propagation between fine aggregate is slightly influenced by coarse aggregate, which tends to expand vertically along the edge of fine aggregate, ultimately forming vertical macroscopic cracks. The simulated macroscopic crack patterns and angles are similar to those captured from the results of laboratory tests.
- (5)
The results of this study provide valuable insights into the effects of RFCA on the mechanical properties of similar materials. However, the limited number of samples tested suggests that these findings should be treated as preliminary. Future work should focus on expanding the dataset through additional experiments to validate and refine the relationships established here.
- (6)
The findings of this research on the mechanical properties of similar materials simulating weak surrounding rocks provide a robust scientific basis for enhancing geotechnical engineering practices. By identifying the optimal ratio of fine-to-coarse aggregate (RFCA) and its impact on key mechanical properties such as elastic modulus, cohesion, and internal friction angle, this study offers valuable insights for the design of more accurate and reliable geotechnical models. These findings can be applied to optimise the design of model tests, thereby reducing the need for extensive experimental trials and saving significant time and resources. Additionally, the detailed insights into the microstructural behaviour of the materials, obtained through discrete element analysis, enhance the understanding of how changes in RFCA affect particle contact forces and crack propagation patterns. This knowledge allows for better prediction of failure mechanisms and deformation behaviour at the macroscopic level. Furthermore, the ability to tailor material properties by adjusting the RFCA enables engineers to match specific engineering requirements, such as enhancing cohesion or reducing brittleness, thereby improving the overall stability and safety of geotechnical structures. In summary, the results of this study not only advance the fundamental understanding of weak rock mechanics but also provide practical guidance for the design and analysis of geotechnical structures in weak rock environments.


