Article

Effect of Thermal and Non-Thermal Pretreatments and Fermentation on the Amino Acid and Biogenic Amine Content of Oyster Mushroom

by
György Kenesei
1,
Meltem Boylu-Kovács
1,
Albert Gashi
2,
Zsuzsanna Mednyánszky
2,
Krisztina Takács
2,* and
Livia Simon-Sarkadi
2
1
Department of Livestock Products and Food Preservation Technology, Institute of Food Science and Technology, Hungarian University of Agriculture and Life Sciences, Ménesi út 43-45, 1118 Budapest, Hungary
2
Department of Nutrition, Institute of Food Science and Technology, Hungarian University of Agriculture and Life Sciences, Somlói út 14-16, 1118 Budapest, Hungary
*
Author to whom correspondence should be addressed.
Appl. Sci. 2025, 15(7), 3509; https://doi.org/10.3390/app15073509
Submission received: 25 February 2025 / Revised: 18 March 2025 / Accepted: 21 March 2025 / Published: 23 March 2025
(This article belongs to the Special Issue Food Fermentation: New Advances and Applications)

Abstract

:
Pleurotus ostreatus, or oyster mushroom, is the most widely consumed and studied species. Because of its high protein and amino acid content, it can be used as a meat substitute. Food quality and composition can be improved by utilizing various technologies, including emerging thermal and non-thermal techniques. The study aim was to determine the effect of various pretreatment technologies on the amino acid and biogenic amine content of fresh and fermented oyster mushrooms. An automatic amino acid analyzer was used to perform a chromatographic analysis on free amino acids and biogenic amines. Significant differences were found between fresh and fermented mushroom samples: the fresh samples showed an increased FAA value (+57%), while blanching and microwaving them stabilized the FAA content. In the other groups, a 9–17% reduction was observed. The total biogenic amine composition increased 11- and 15-fold in the fresh and UV-treated samples (1.89 and 5.05 mg/g, respectively). The blanched samples showed no major change while the other groups increased by two to five times. The results of our study provide an excellent basis for the development of oyster-mushroom-based food products, whether for use in meat products or novel vegan products.

1. Introduction

1.1. Importance of Proteins, Amino Acids, and Biogenic Amines to Food Quality

The consumption of high-quality protein is vital to optimal nutrition. EFSA recommendations specify the daily intake of well-balanced essential amino acids for an average adult in mg per kg of body weight per day. Histidine is recommended at 10 mg/kg, isoleucine at 20 mg/kg, leucine at 39 mg/kg, lysine at 30 mg/kg, and combined methionine and cysteine at 15 mg/kg. Similarly, phenylalanine and tyrosine together are recommended at 25 mg/kg, threonine at 15 mg/kg, tryptophan at 4 mg/kg, and valine at 26 mg/kg [1]. Most proteins derived from animal sources have high bioavailability, ensuring efficient absorption and utilization by the body [2]. In contrast, proteins derived from plant sources typically have lower bioavailability due to the presence of antinutritive factors such as tannins, lectins, and protease inhibitors, which necessitate varying degrees of food processing to mitigate their adverse effects. Moreover, plant proteins are less accessible because their cell walls are only partially digestible in the human gastrointestinal tract [3]. While some plant-based foods provide a complete source of protein (such as quinoa and soybeans), many are deficient or limited in one or more essential amino acids, particularly methionine and lysine. A beneficial approach when designing a meat alternative would be to combine different protein sources to ensure a complete amino acid profile [4]. On the other hand, most meat substitutes are cholesterol-free and typically low in saturated fat and calories. They also provide a good source of fiber, folate, and manganese. However, to match the nutritional quality of meat products, their nutritional profiles should be enhanced by adding iron, calcium, zinc, and B12 vitamins [5].
The protein content of edible mushroom ranges from 19% to 40% on a dry basis; however, this can vary significantly depending on the mushroom species and the conditions under which they are grown [6]. The amino acid profile of mushroom proteins is comparable to that of animal proteins, offering a valuable alternative to reduce the reliance on animal-based food sources, particularly in developed countries [7,8]. Edible mushroom proteins offer a full spectrum of amino acids, with the eight essential amino acids making up 25–45% of the total. Research has shown that edible fungi are particularly rich in lysine and leucine, in contrast to their lower levels in grains [9,10].
Besides amino acids, their derivatives such as biogenic amines are also common constituents of high-protein foods. Mushrooms should be considered as food products that may contain high levels of biogenic amines (BAs). The most significant biogenic amines found in foods include tyramine (precursor: tyrosine), histamine (precursor: histidine), spermidine and spermine (derived from putrescine), putrescine (precursors: arginine and agmatine), agmatine (precursor: arginine), and cadaverine (precursor: lysine) [11]. Their main origin is the decarboxylation of free amino acids during processes like fermentation, spoilage, or putrefaction [12]. BA accumulation in food is influenced by precursor availability, the presence of decarboxylase-positive microorganisms and free amino acids, and a variety of intrinsic, technological, and environmental factors that facilitate microbial growth and enzyme production [13]. The presence of biogenic amines not only poses a risk but also serves as an indicator of food quality. Specifically, cadaverine and putrescine are regarded as markers of freshness and overall food quality. Histamine and tyramine are among the most physiologically active components, and both are vasoactive substances. Histamine, commonly referred to as scombroid poisoning, occurs from consuming spoiled fish, whereas tyramine is linked to the “cheese reaction”, originally attributed to the intake of aged cheeses [11,14]. The Good Manufacturing Practice sets the histamine limit for fish and fish products at 100–200 mg/kg. While consuming 50 mg of histamine and 600 mg of tyramine is generally safe for healthy individuals, these amounts can cause severe poisoning or death in people with metabolic disorders or those on monoamine oxidase inhibitors (an intake of antidepression medicines). Although histamine regulations exist for fish, specific limits for other biogenic amines in food are generally lacking, with some recommendations for tyramine (100–800 mg/kg) and 2-phenylethylamine (30 mg/kg). Putrescine and cadaverine may increase adverse effects of other amines, including histamine. The no-observed-adverse-effect levels for putrescine, spermidine, and spermine are 180, 83, and 19 mg/kg body weight, respectively [11,15,16,17]. The overall biogenic amine content in food should remain below 750–900 mg/kg [13].

1.2. Oyster Mushroom (Pleurotus ostreatus)

The genus Pleurotus (Fr.) P. Kumm. (Basidiomycota, Pleurotaceae), commonly referred to as “white rot fungi”, is characterized by its white mycelium and typical cultivation on non-composted lignocellulosic substrates, such as agro-industrial by-products. Pleurotus spp. are native to tropical and subtropical rainforests and cultivated both on large and small scales as one of the most diversified medicinal and edible mushrooms. These species feature a basidiocarp that is shell- or oyster-shaped and can be in a range of colors, including white, cream, yellow, light brown, pink, and grey, leading to their common name, oyster mushrooms. [18].
In this genus, Pleurotus ostreatus, or the oyster mushroom, is the most extensively consumed and researched species and is noted for its distinct taste, texture, and aroma. It is characterized by having a high moisture content, low calorie count, many nutraceutical benefits, and bioactive compounds with antibacterial and antioxidant activity. Its chitin-rich cell walls provide dietary fiber, and it contains vitamins (B1, B2, B12, C, D, and E), various micro and macro elements, carbohydrates, secondary metabolites like betalains, alkaloids, glycoproteins, and polysaccharides, minimal fat, and almost no cholesterol [19,20]. P. ostreatus ranked among the top producers of Vitamin B12 out of 38 edible mushrooms, and a concentration of 0.6 μg per 100 g dry weight was reported [21]. In addition to its high protein content (7.3% to 53.3% dry weight), P. ostreatus serves as a significant vegan protein source thanks to its protein quality and its supply of nine essential amino acids and nitrogen, vital for diverse bodily functions. The Amino Acid Score (AAS) of P. ostreatus fulfills the nutritional needs for all essential amino acids in adults. P. ostreatus shows exceptional protein digestibility, with its Protein Digestibility-Corrected Amino Acid Score (PDCAAS) matching the quality of casein (100), eggs (100), and soy protein isolate (100) [22,23]. Amino acid profiling of Pleurotus spp. has revealed that it contains all essential amino acids, with leucine, aspartic acid, phenylalanine, and lysine being the most prevalent. Additionally, umami amino acids and non-essential amino acids like gamma-aminobutyric acid and ornithine were also detected [9,24]. Pleurotus spp. are recognized as some of the richest mushrooms in umami-tasting amino acids, which resembles the taste of meat.
The quality and composition of food can be enhanced by using different technologies including emerging thermal and non-thermal techniques, such as high hydrostatic pressure, irradiation, innovative packaging, ultrasound, microbial modeling, and the addition of amine-negative starter cultures or preservatives [25].

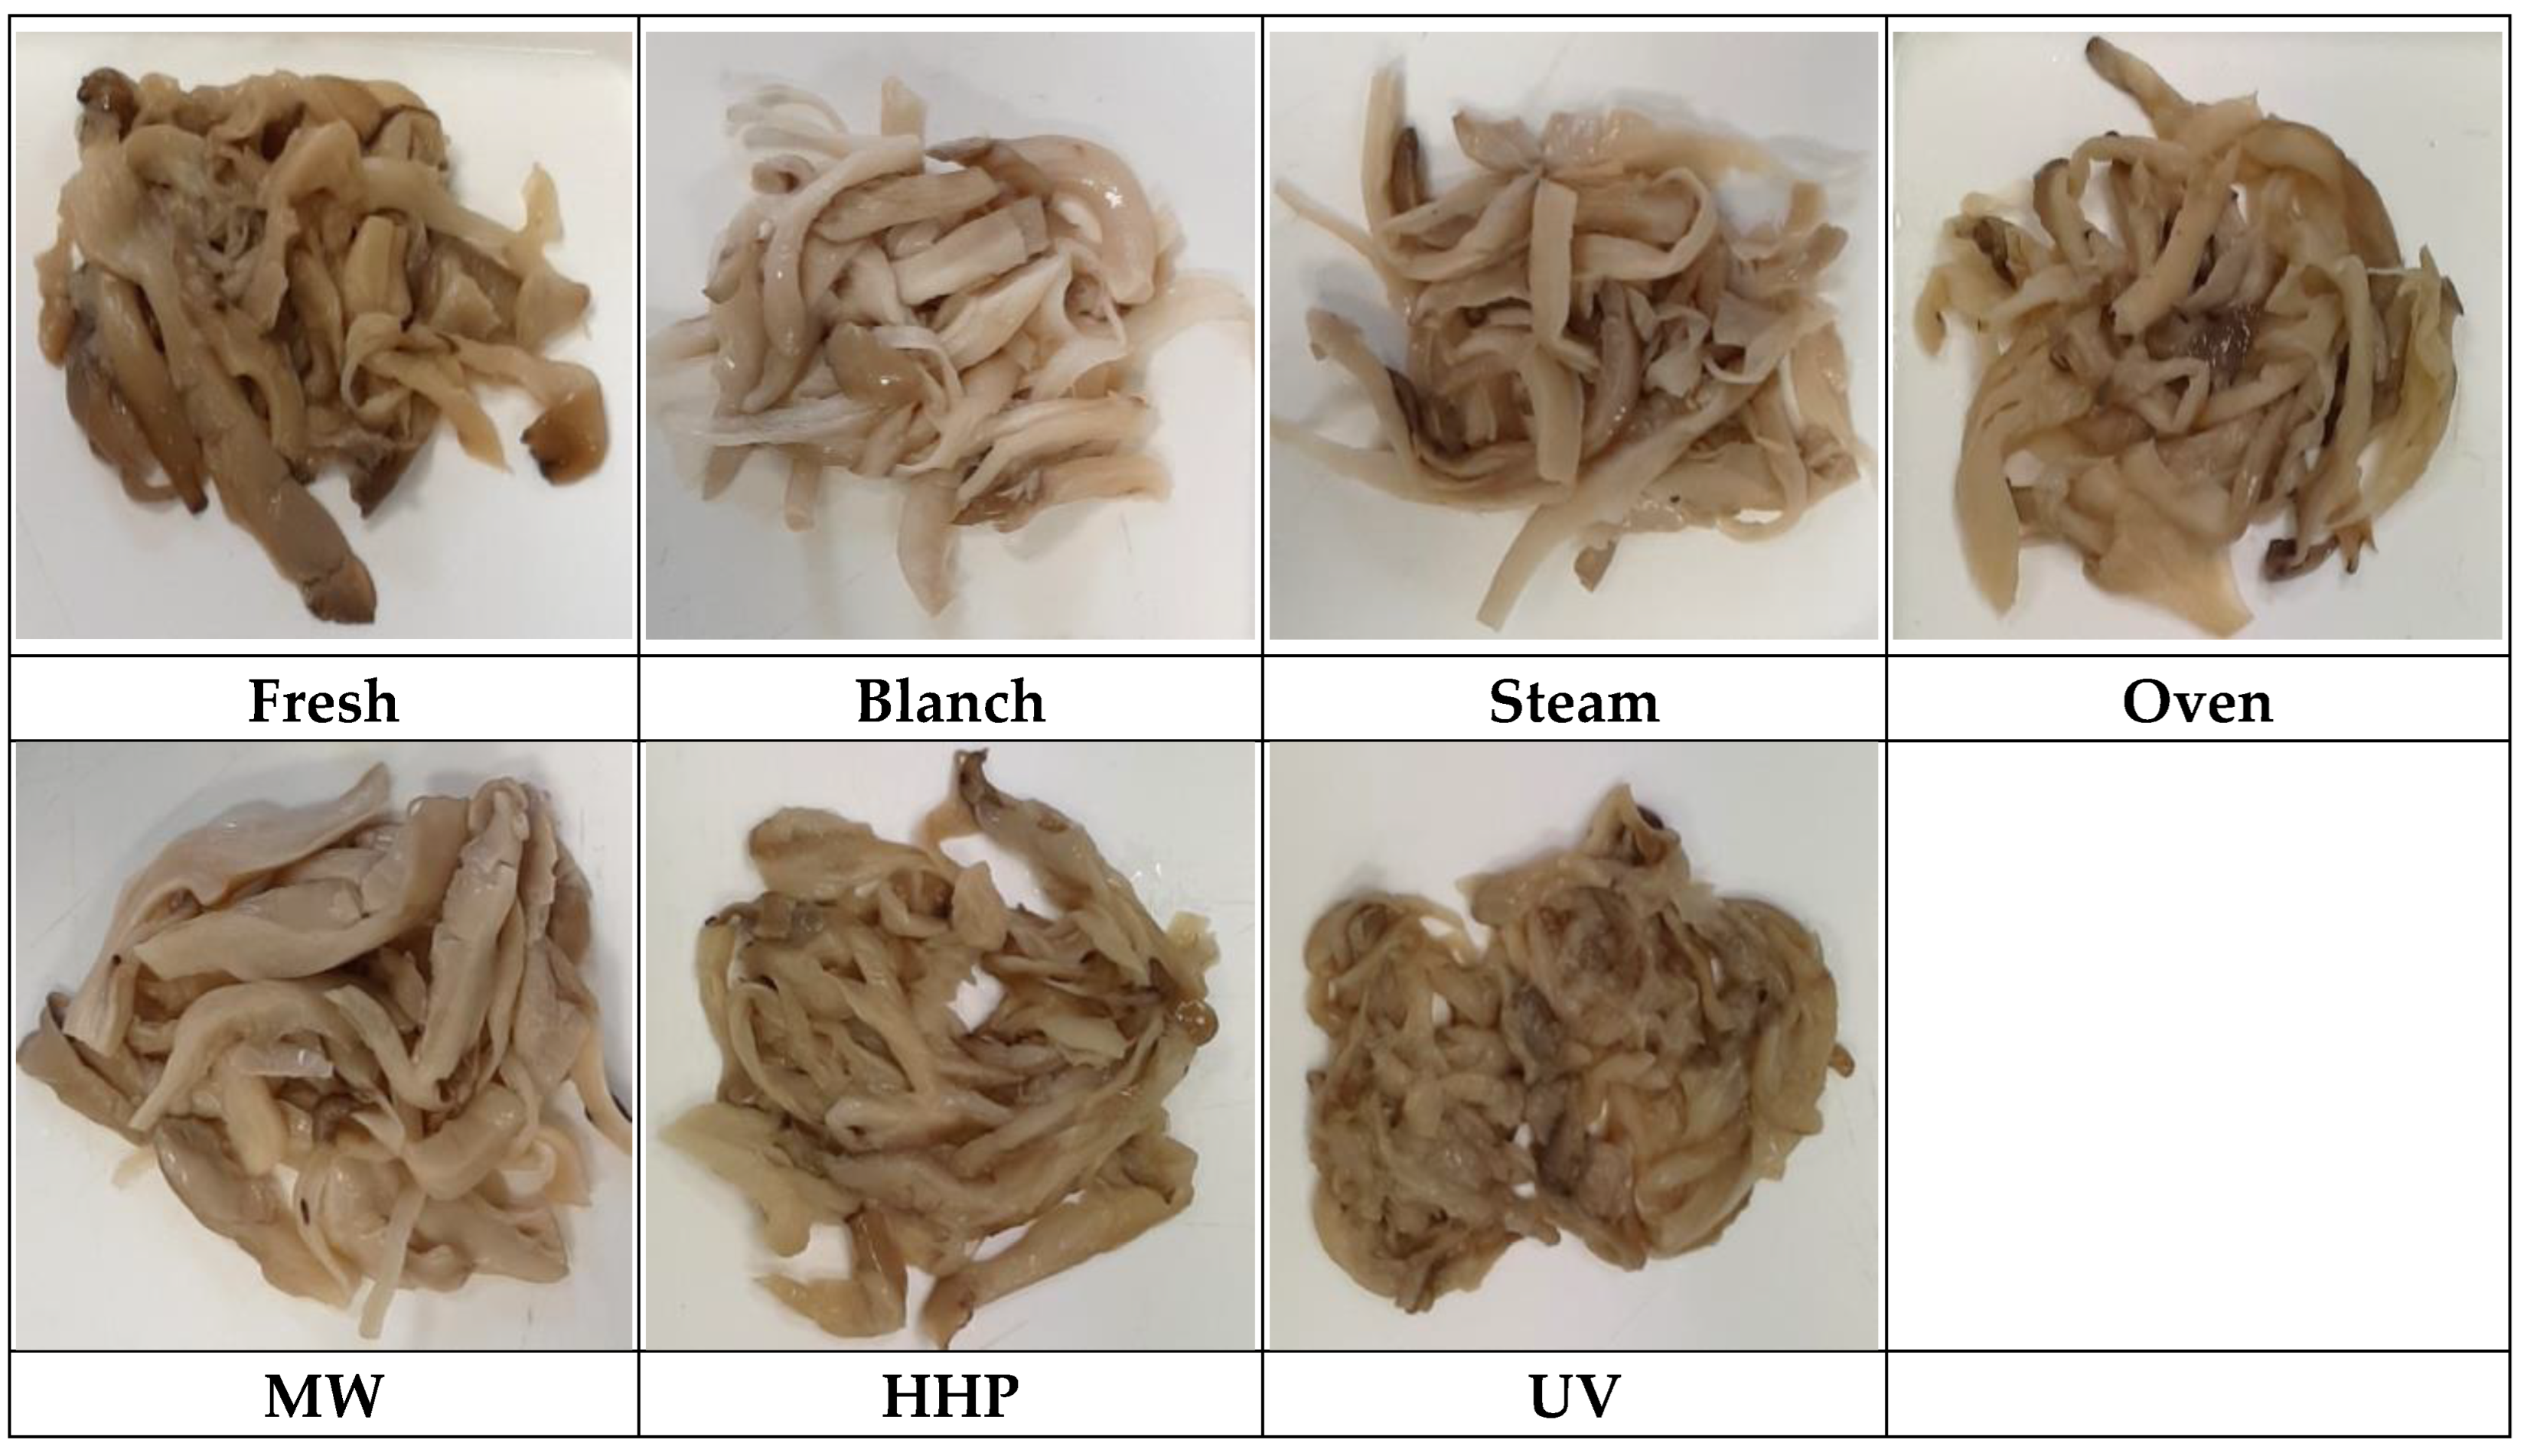
1.3. Pretreatment of Mushrooms

Pretreatment is a crucial phase in mushroom processing, significantly affecting the final product’s quality. Pretreatments usually start with washing to remove dirt and contaminants and with blanching to inactivate mushroom enzymes [26,27]. Enzymes play a significant role in altering the mushroom’s color (polyphenol oxidase), smell, and flavor (peroxidase and protease) and cause texture softening (cellulase and protease).

1.3.1. Blanching (In Water)

Blanching involves immersing mushrooms in boiling water (with or without added chemicals) for 2 to 5 min to remove excess air, inactivate enzymes (polyphenol oxidase and peroxidase), minimize non-enzymatic browning reactions, decrease the microbial load, improve their texture, and enhance their quality before further processing steps [28]. It is often associated with the leaching of water-soluble nutrients such as vitamins, flavors, minerals, carbohydrates, sugars, proteins, electrolytes, and secondary metabolites to the blanching water and partial biochemical changes that can alter their aroma [29,30].

1.3.2. Steaming

Superheated steam is widely used as a pretreatment due to its high enthalpy, which efficiently transfers heat to the product. Steam blanching is more cost-effective and retains more minerals and water-soluble components compared to water blanching. However, steam blanching can cause tissue softening and quality degradation if the heating time is too long, as steam transfers heat less efficiently than hot water. Also, it can lead to weight loss and the formation of a dried layer on the product’s surface due to water evaporation [31].

1.3.3. Oven Pretreatment

Although ovens are primarily designed for cooking, oven blanching as a thermal pretreatment was included in the research to compare its effects with a microwave pretreatment. In this process, heated air is used to briefly treat food before further processing, primarily aiming to deactivate enzymes and prepare the food for subsequent steps like fermentation [32].

1.3.4. Microwave Pretreatment

A key feature of microwave blanching is its direct interaction between the electromagnetic field and food materials, which facilitates the generation of heat with fast volumetric heating, low nutrient loss, a reduced processing time, and enhanced heating efficiency. The primary advantage of a microwave blanching system is its ability to generate heat internally and achieve a greater penetration depth. However, a key limitation in applying microwave heating to blanching processes is the heating uniformity [33,34].

1.3.5. Pretreatment with High Hydrostatic Pressure

High-hydrostatic-pressure processing (HHP) is an emerging non-thermal physical treatment that improves the safety and shelf life of a wide range of food products by deactivating enzymes and microorganisms. Due to the isostatic nature of HHP, pressure is applied uniformly and instantly to products, leading to changes in proteins, polysaccharides, and lipids [35]. HHP can maintain the quality of fresh foods like mushrooms and preserve bioactive compounds, with minimal impact on the nutritional and sensory qualities of the food.

1.3.6. Ultraviolet Light (UV) Pretreatment

UV treatment is an emerging non-thermal disinfection method widely used for specific applications such as treating food-contact surfaces and disinfecting water and air, inactivating microorganisms. This process utilizes radiation from the electromagnetic spectrum with wavelengths ranging from 100 to 400 nm [36]. The effectiveness of the treatment mainly depends on the treatment time, intensity, and distance from the UV source.

1.4. Fermentation of Mushrooms

Fresh mushrooms have a limited shelf life at ambient temperatures, primarily due to their high moisture content (87–95%), fast metabolic processes, enzyme activity, and sensitivity to bacterial growth. This leads to a decline in quality, including moisture loss, discoloration, changes in texture and flavor, and reduced nutrient levels. To prolong their shelf life, several preservation methods like drying, boiling, cooking, marinating, freezing, pickling, frying, gamma irradiation, and fermentation have been investigated and applied [37].
The transformation of substrates and the production of bioactive or bioavailable compounds during fermentation results in a higher nutritional value in addition to a longer shelf life [38,39]. Microorganisms play a crucial role in the development of fermented foods, metabolizing certain compounds in food, leading to distinctive flavors in the fermented product and potentially offering various health benefits. Currently, the microorganisms most utilized in vegetable fermentation include bacteria, notably lactic acid (LAB) and acetic acid bacteria. Among these, Lactobacillus plantarum is a frequently employed lactic acid bacterium in food fermentation, particularly foods with a plant origin [40]. Lactic acid fermentation is an anaerobic biological process in which glucose and other six-carbon sugars, including disaccharides like sucrose and lactose, are converted into cellular energy, lactic acid, and smaller amounts of other acids, resulting in a pH decrease [41]. Lactic acid fermentation can spontaneously occur in raw vegetables and fruits when favorable conditions—such as proper moisture, water activity, temperature, and salt concentration—are present for the growth of native lactic acid bacteria. The addition of salt and sugar or immersing vegetables in brine enhances this environment, promoting LAB growth by protecting the vegetables from light and oxygen. Physical air exclusion and the depletion of oxygen by plant cells during the early stages of fermentation helps establish the anaerobic conditions required for LAB to thrive [42].
Lactic fermentation is a traditional method employed to preserve both wild and cultivated edible mushrooms in various regions of the world such as Southeast Asia, Japan, and India. Various fungi species have been salted and lacto-fermented by Eastern Slavs, Estonians, and Poles, serving as a primary method for preserving mushrooms during the winter months [43]. Fermented mushrooms may also be used as meat replacement due to their physico-chemical and organoleptical properties [44]. While mushroom fermentation holds considerable promise for innovation, product diversification, and sustainable development across multiple industries, research on the lactic acid fermentation of edible mushroom fruiting bodies remains relatively limited [26,28,45].
The aim of the study was to investigate the effect of different pretreatment technologies on the amino acid and biogenic amine content of fresh and fermented oyster mushroom.

2. Materials and Methods

2.1. Mushroom Pretreatments and Fermentation

Fresh oyster mushrooms (Sylvan HK 35 grown on straw substrate; moisture content: 89.78 ± 0.77%; protein: 144.34 ± 1.82 mg/g in dry mushroom) were obtained from Magyar Gombakertész Kft. (3395 Demjén 0173/7/A/1 Hungary). The mushrooms were harvested on the 36th day after plantation and stored at 4 °C until their utilization. Cultivation method of Sylvan HK 35 was as follows. First, there is an intercropping period of 17–21 days (heat-treated straw with mycelium of the fungus). The core temperature of the blocks is 30–32 °C. Post-planting humidity is 92–95%. After interweaving, the temperature is reduced from 30 °C to 16 °C in 6 days. Temperature of the substrate is reduced from 20 °C to 13 °C, and relative humidity is reduced from 95% to 83%.
The pretreatment steps were carried out at the pilot facility of the Department of Livestock Products and Food Preservation Technology, Hungarian University of Agriculture and Life Sciences. After discarding any damaged and unwanted parts of the mushrooms, the remaining were thoroughly cleaned and longitudinally sliced (5–10 mm thickness) to be utilized for pretreatments and fermentation. For each pretreatment group, 2 kg of fresh oyster mushrooms was used. In addition to fresh oyster mushrooms (Fresh), six pretreatment methods were applied prior to mushroom fermentation: blanching in water (Blanch), steaming (Steam), oven cooking (Oven), microwaving (MW), high hydrostatic pressure (HHP), and ultraviolet light treatment (UV) (Figure 1). Pretreated mushrooms were allowed to cool down on perforated stainless-steel trays until further processing. The experiment was repeated two times.
Blanching in water: Blanching was performed by immersing oyster mushrooms in boiling water (V = 7 L, mushroom:water ratio was 1:3) at 100 °C for 3 min.
Steaming: Steaming was performed at 100 °C for 3 min in a multifunctional oven (Lainox VE051P, Lainox, Vittorio Veneto, Italy) using the steam function. Mushroom monolayer on the stainless-steel tray was 10–15 mm thick.
Oven pretreatment: Oven pretreatment was performed at 100 °C for 3 min in a multifunctional oven (Lainox VE051P, Lainox, Vittorio Veneto, Italy) using the oven cooking function without steam. Mushroom monolayer on the perforated stainless-steel tray was 10–15 mm thick.
Microwave pretreatment: For the microwave pretreatment, mushroom samples were divided into 300 g portions and were subjected to 85 °C at 100 W for 3 min using the vegetable program (A3) setting in a microwave oven (SHARP R722STWE, Sharp Electronics Europe Ltd., Middlesex, UK).
HHP pretreatment: High-hydrostatic-pressure (HHP) treatment was applied at 20 °C and 300 MPa, with a holding time of 3 min (RESATO PU-100-2000, Resato International B.V., Assen, The Netherlands), in sealed plastic pouches (90 μm PA/PE poach, (20 μm PA–70 μm PE, AMCO Kft., Budapest, Hungary).
UV light pretreatment: During UV light pretreatment, mushrooms were irradiated with a 30 W UV light at 312 nm (VL-115.M, Vilber Lourmat, Marne La Vallee, France) for 15 min at 20 °C. To ensure even irradiation, 0.5–1 cm mushroom layer was placed evenly on an open shelf, 20 cm below the light source.

2.2. Mushroom Fermentation

Fermentation was started after the pretreatments based on the method described by Jablonská-Rys et al. [46], with slight modifications. The mushrooms were subjected to 8-day spontaneous anaerobic fermentation at a temperature of 21–22 °C. This process took place in sealed pouches, each containing 2% (w/w) salt, 1% (w/w) sucrose, and 70 mL of a 2% salt solution using distilled water. The fermentation medium was not sterilized. Upon completion of fermentation, the fermented mushrooms were stored at 4 °C for a week for maturation. Before the analyses, the sealed pouches were opened, and the mushrooms were drained to eliminate excess water. Images of the fermented oyster mushrooms are given in Figure 2.

2.3. Determination of the Essential Amino Acids and Proteinogenic (Total) Amino Acids

The mushroom samples were freeze-dried using a Christ Alpha 2–4 lyophilizer (Martin Christ GmbH, Osterode am Harz, Germany). For the determination of proteinogenic (total) amino acid content, 0.1 g of powdered oyster mushroom sample was weighed accurately and placed into hydrolysis tubes (KUTESZ, Budapest, Hungary). Ten milliliters of 6 M hydrochloric acid was added to the samples, which were then bubbled with nitrogen for 30 s. The hydrolysis tubes were sealed with Teflon-lined caps and hydrolyzed at 110 °C for 24 h in a block thermostat (FALC Instruments, Treviglio, Italy). After cooling, the samples were rinsed with distilled water and placed into 25 mL volumetric flasks. The mixture was neutralized by adding 10 mL of 4 M NaOH solution, and the flasks were filled with distilled water to a total volume of 25 mL. The solutions were filtered first through pleated Whatman 1001-090 filter paper (Merck KGaA, Darmstadt, Germany) and then through a 0.22 μm syringe filter (FilterBio® CA Syringe Filter Nantong City, Jiangsu P.R China). The homogenized samples were transferred to 1.5 mL Eppendorf tubes and stored in a deep freezer until amino acid analysis. The analysis of amino acids was carried out using an AAA 400 Automatic Amino Acid Analyzer (Ingos Ltd., Praha 4—Komořany, Czech Republic). The device operates on the principle of ion-exchange column chromatography, with post-column derivatization using ninhydrin. Detection was performed at 570 nm, with an additional measurement at 440 nm for proline, using a flow-through cuvette detector. Each sample was measured in duplicate.

2.4. Free Amino Acids and Biogenic Amines

For the analysis of free amino acids and biogenic amines, 0.5 g of powdered oyster mushroom sample was weighed with analytical precision into a 50.0 mL Erlenmeyer flask. Six mL of 10% trichloroacetic acid was added, and the samples were extracted for 1 h at 100 rpm using a Laboshake shaker (Gerhard, Königswinter, Germany). The extracts were filtered first through standard filter paper and then through a 0.22 μm syringe filter (FilterBio® CA Syringe Filter, Nantong City, Jiangsu, P.R China) into 1.5 mL Eppendorf tubes. They were stored frozen in a deep freezer until analysis. The analysis of free amino acids and biogenic amines was carried out using the same equipment as described in Section 2.3. Each sample was measured in duplicate. The measurement parameters of the device are detailed in Table 1.

2.5. Statistical Evaluation of the Data

IBM SPSS software (Version 29, SPSS Inc. Chicago, IL, USA) for Windows was used to perform analysis of variance (normality was tested with Kolmogorov–Smirnov test, homogenity of variance was tested by Levene test, and Tukey’s post hoc test was performed to detect significant differences between groups). Principal component analysis (PCA), a multivariate statistical method, was also used to evaluate the results. The non-supervised method is based on extracting substantial information with dimension reduction to detect similarities of the samples. Levels for significant differences were set at p < 0.05 in all cases.

3. Results

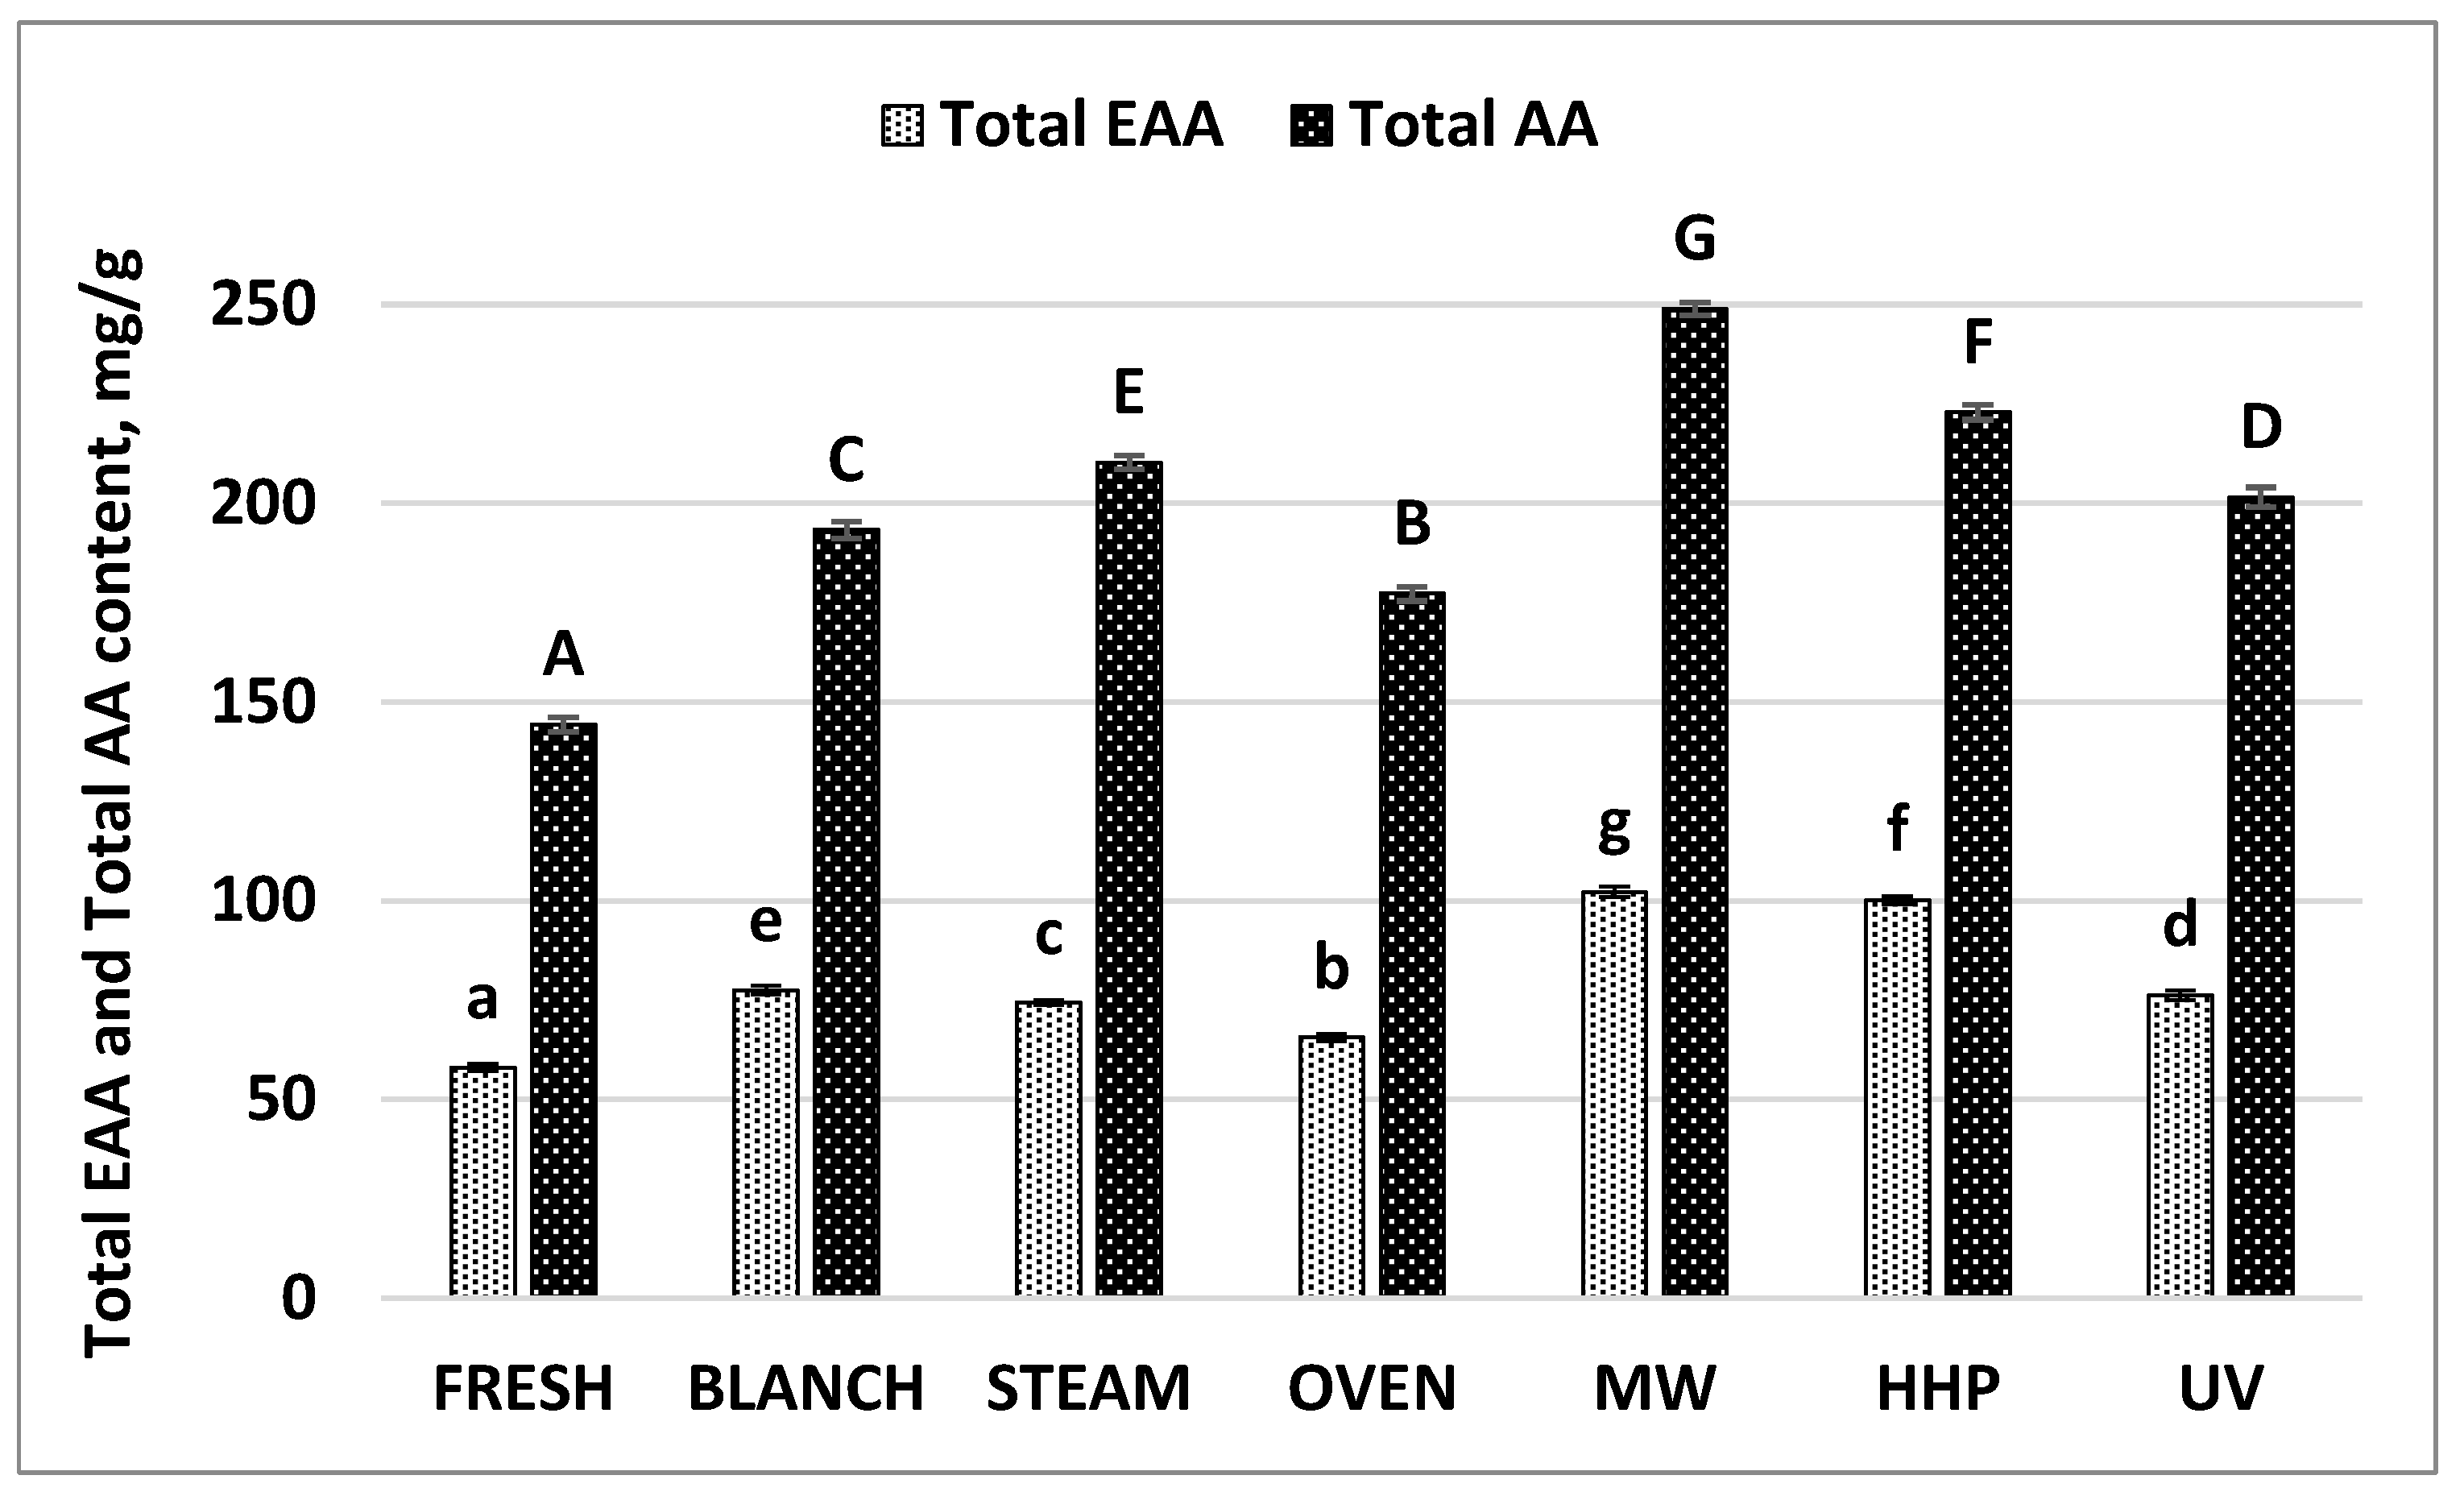
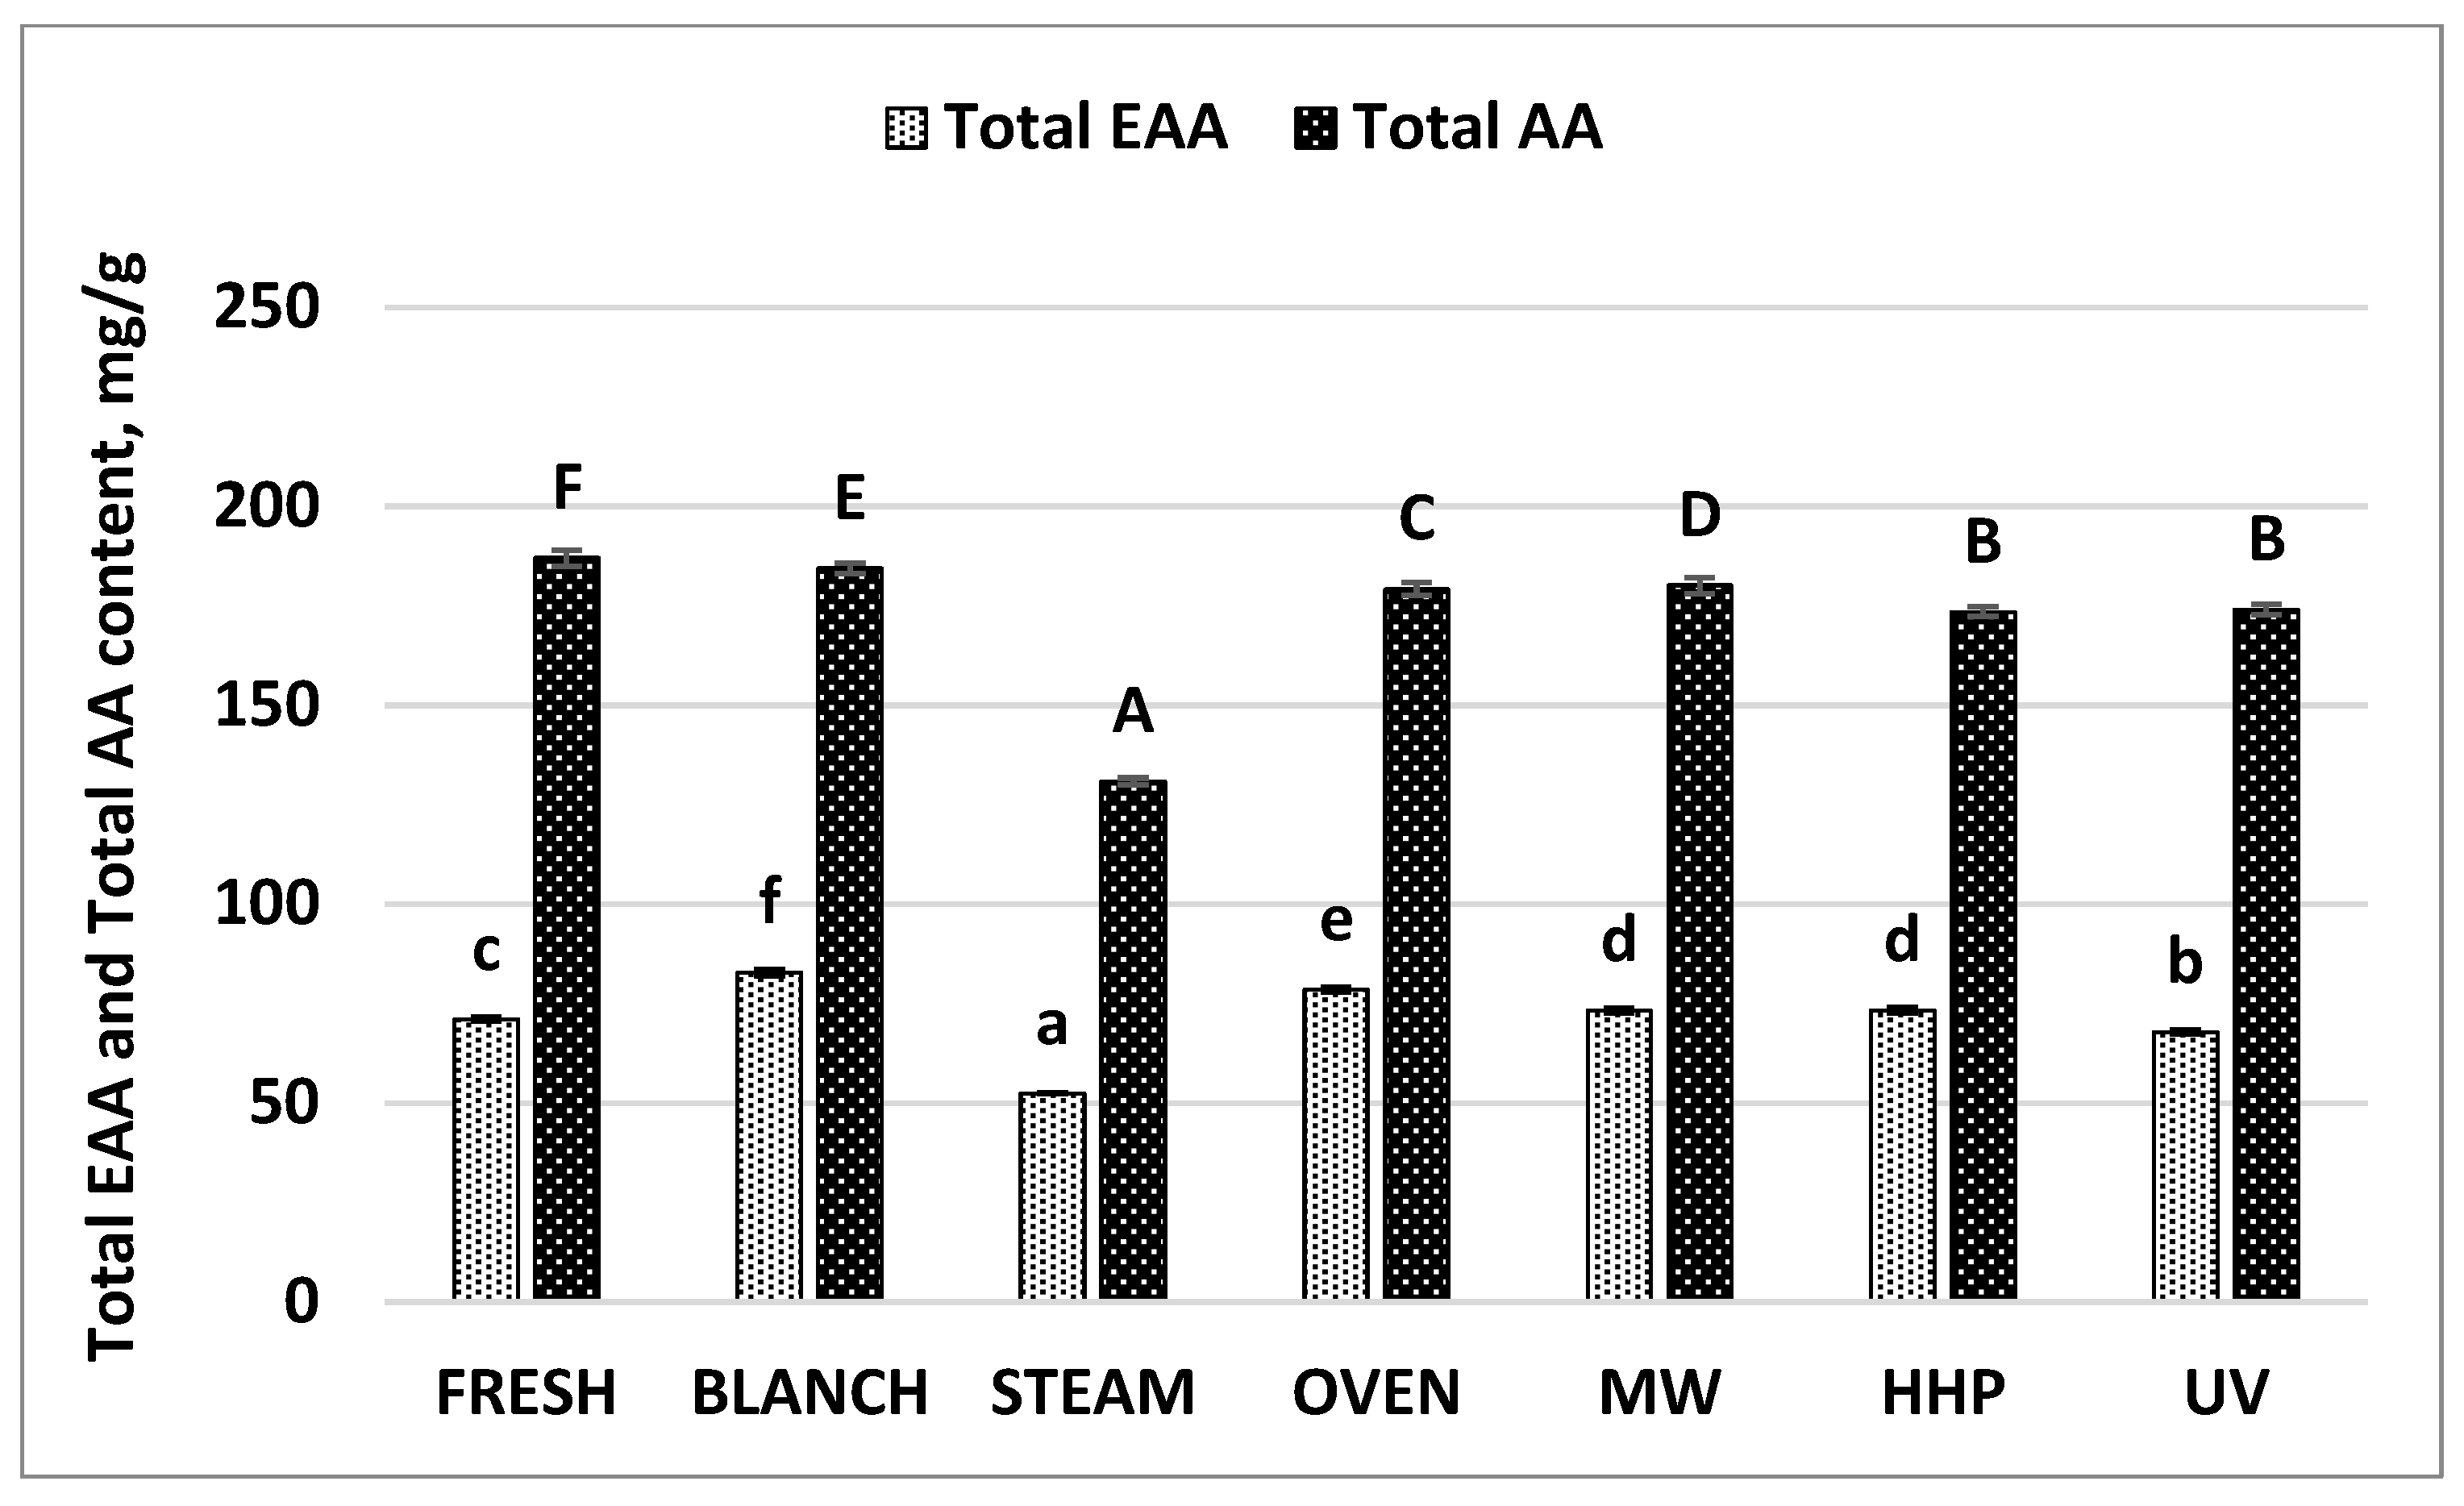
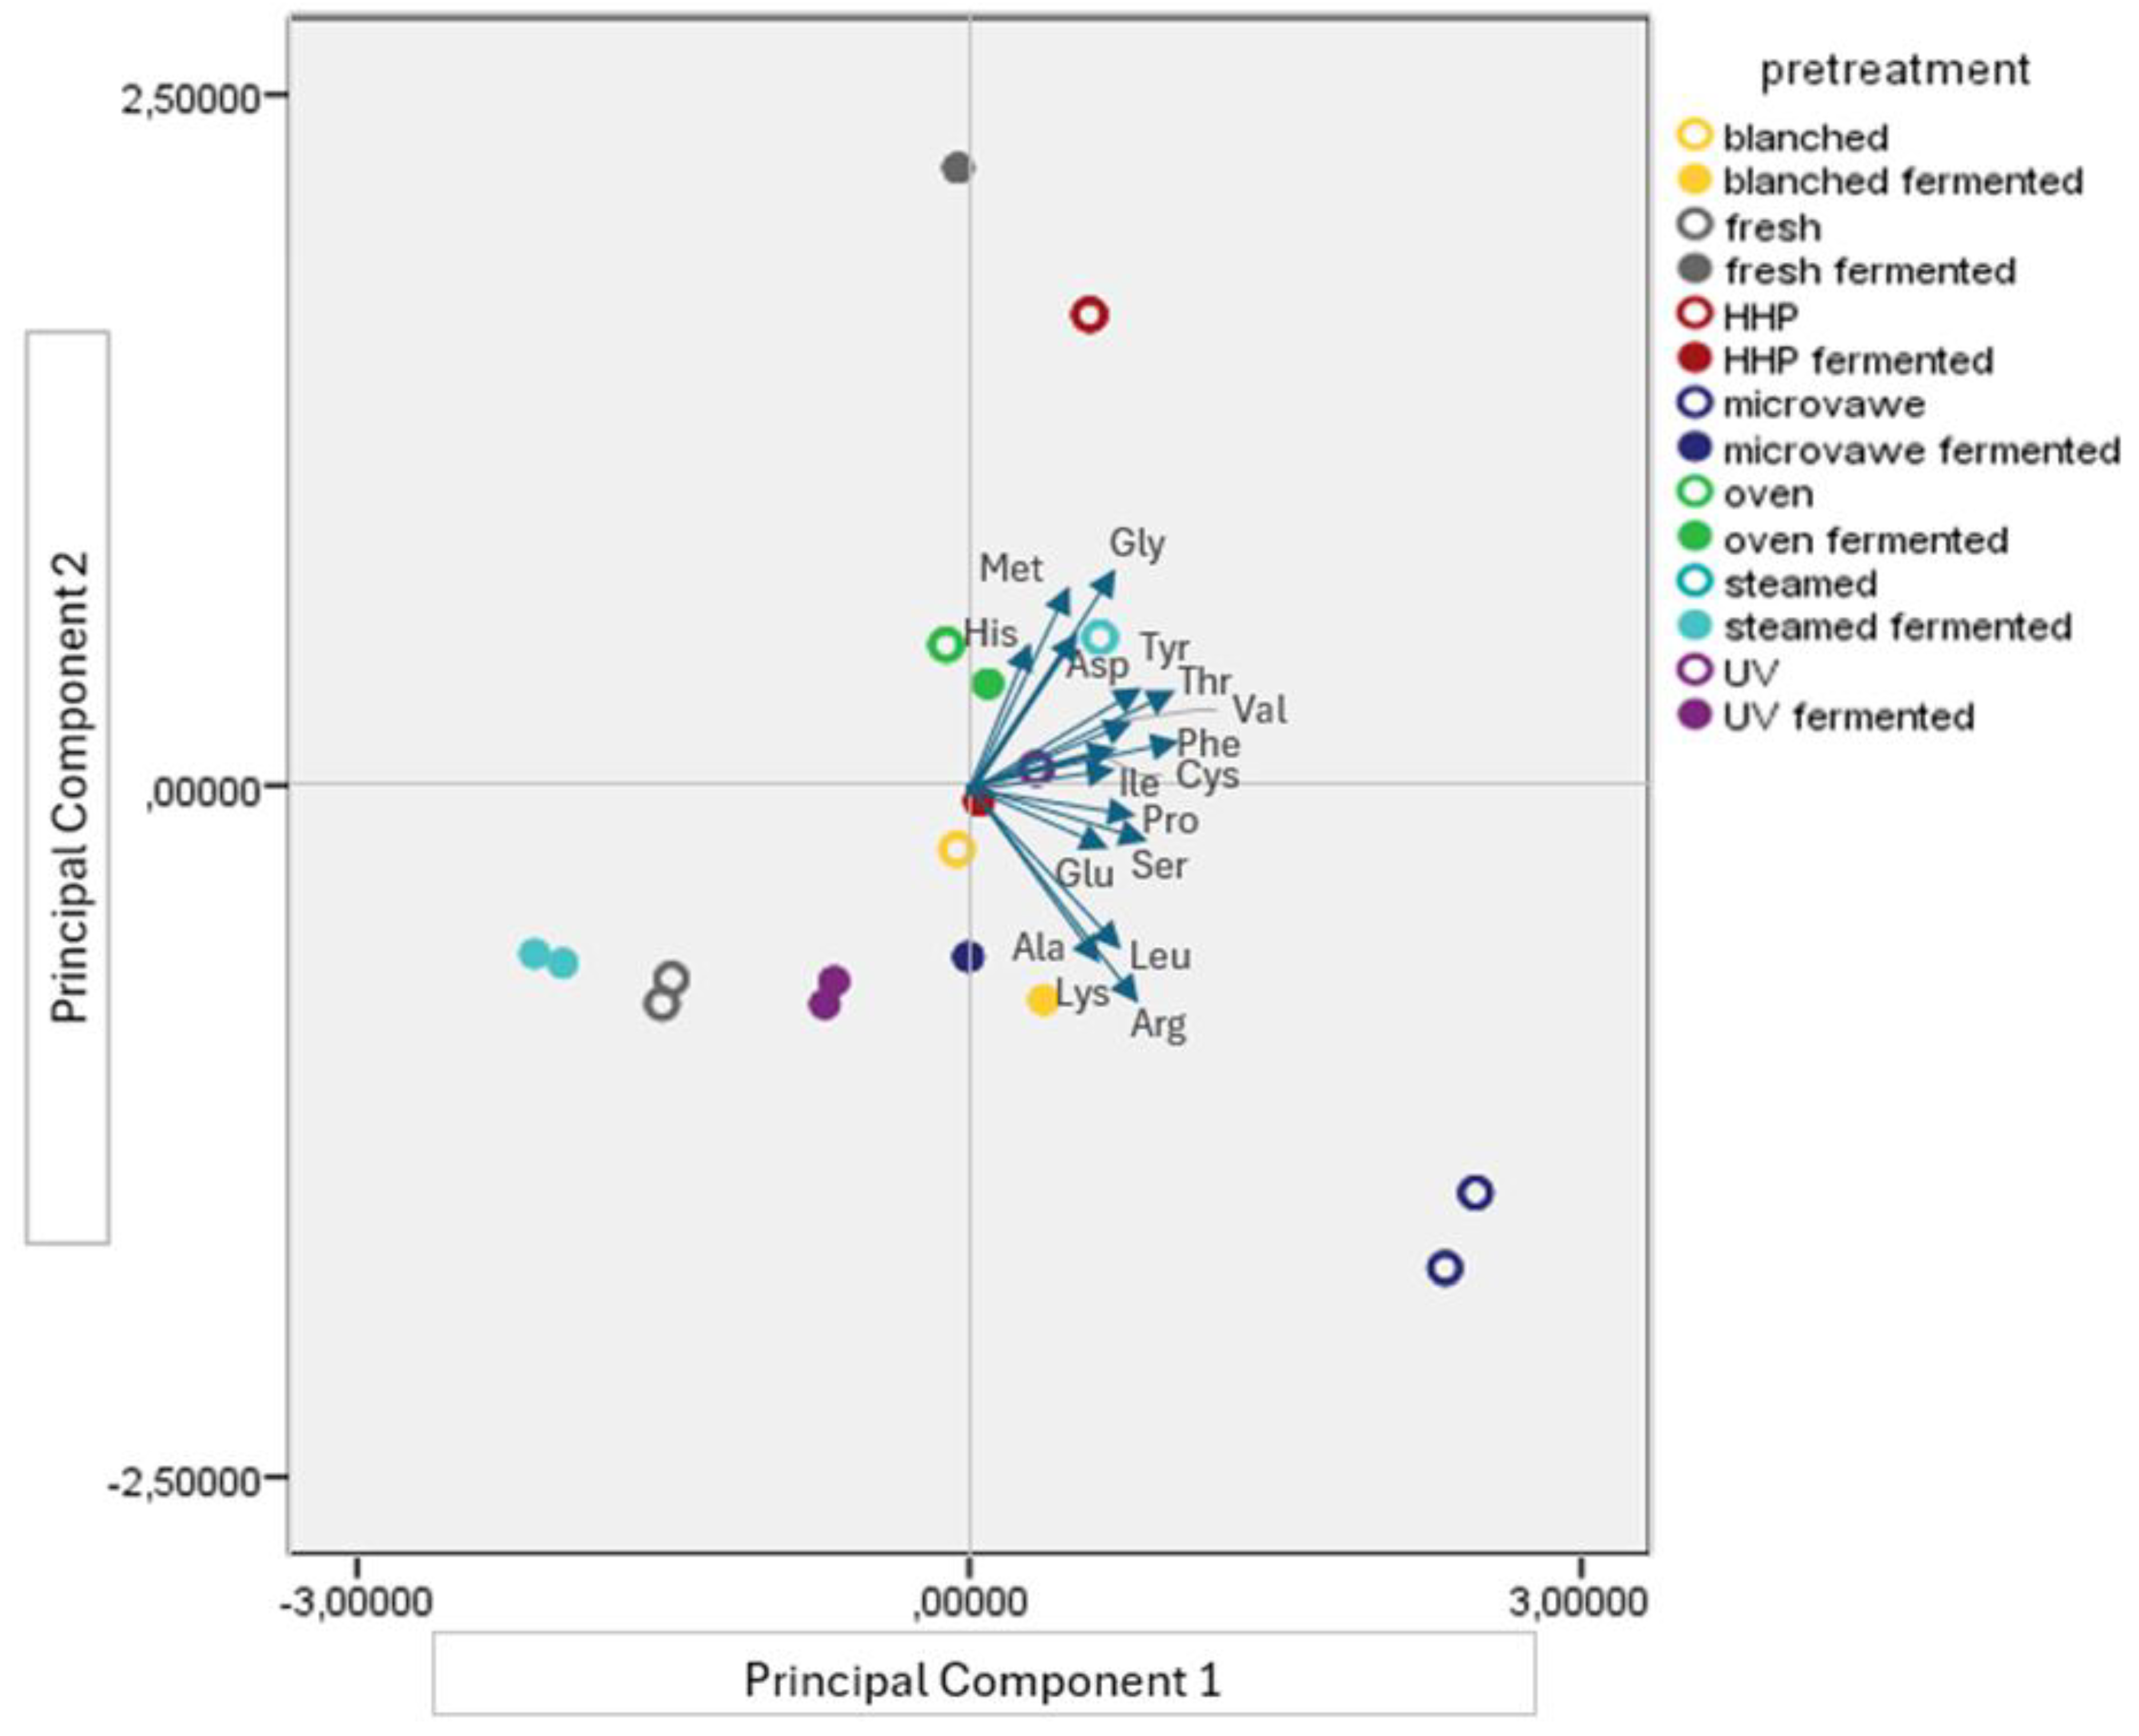
3.1. Essential Amino Acid and Proteinogenic Amino Acid Profile of the Mushroom Samples

The total essential amino acid and proteinogenic amino acid contents of the pretreated mushroom samples are presented in Figure 3. The oyster mushroom samples contained 17 protein-building amino acids, with their total amounts ranging from 144.34 (fresh oyster mushroom) to 248.91 mg/g for the pretreated mushroom samples (Appendix A). The essential amino acid content (including arginine) constituted 35–44% of the total amino acids in the mushroom samples, indicating excellent protein quality. All pretreatment methods caused a significant increase in the essential amino acid and total amino acid content of the mushroom samples (p < 0.05). Among these, the microwave pretreatment increased the amino acid concentration the most (72.4%), reaching 248.91 mg/g. Similarly, the essential amino acid content showed the highest increase in the microwaved samples, rising from 58.05 mg/g to 102.22 mg/g.
The total essential amino acid and proteinogenic amino acid contents of the pretreated fermented mushroom samples are presented in Figure 4. In general, fermentation reduced the total amino acid content of the pretreated samples, except in the case of the fresh fermented ones. The total amount of protein-building amino acids in the pretreated fermented samples ranged from 130.86 to 186.96 mg/g (Appendix B). Among these, the fresh fermented oyster mushrooms had the highest total amino acid content at 186.96 mg/g, followed by the blanched fermented samples at 184.36 mg/g, while the steamed fermented samples showed the lowest at 130.86 mg/g. Fermentation affected the essential amino acid content of the mushroom samples differently, causing an increase for the fresh, blanched, and oven-pretreated samples and decrease for others. Among these, the blanched fermented samples showed the highest essential amino acid ratio (44.92%) reaching 82.81 mg/g. Notably, among all the samples, only the steamed fermented ones exhibited a lower essential amino acid content compared to both their pretreated counterparts and the fresh oyster mushrooms. The essential amino acid content (including arginine) constituted 38–45% of the total amino acids in the pretreated fermented mushroom samples.
The amino acid profile of the mushroom samples was evaluated using a principal component analysis, as shown in Figure 5 and Figure 6. The first two principal components accounted for 54.12% of the variance, while the first three principal components accounted for 65.80% of the total variance, representing the majority of the dataset’s variation.
In Figure 5, the upper-right quadrant contains markers corresponding to four samples: the HHP-pretreated, steamed, UV-light-pretreated, and oven-treated fermented mushrooms. Among the samples, the fresh fermented, HHP-pretreated, microwave-pretreated, and steamed fermented samples were the furthest from their starting point, indicating that their amino acid profile differs significantly from the others. Most of the fermented samples are farther from their starting point compared to their pretreated counterparts, demonstrating that fermentation generally increases variability in amino acid profiles. Glycine is present in relatively higher concentrations in the fresh fermented, HHP-pretreated, steamed, UV-pretreated, and oven-treated fermented mushrooms, whereas arginine is more concentrated in the microwaved and blanched fermented mushrooms. On the other hand, principal component 3 accounts for additional variability not captured by the first two components, revealing further differences among the samples (Figure 6). For instance, in the first plot (PC1 vs. PC2), the HHP-pretreated fermented sample remains closer to its starting point, indicating minimal separation along these components, while in the second plot (PC1 vs. PC3), it is strongly separated along PC3, highlighting distinct amino acid changes due to high hydrostatic pressure and fermentation interaction. Proline and serine are significant contributors to the variations captured by this plot. The multivariate analysis confirmed that the pretreatments, fermentation, and their interaction had significant effects on the amino acid profile of the mushroom samples (p < 0.05).

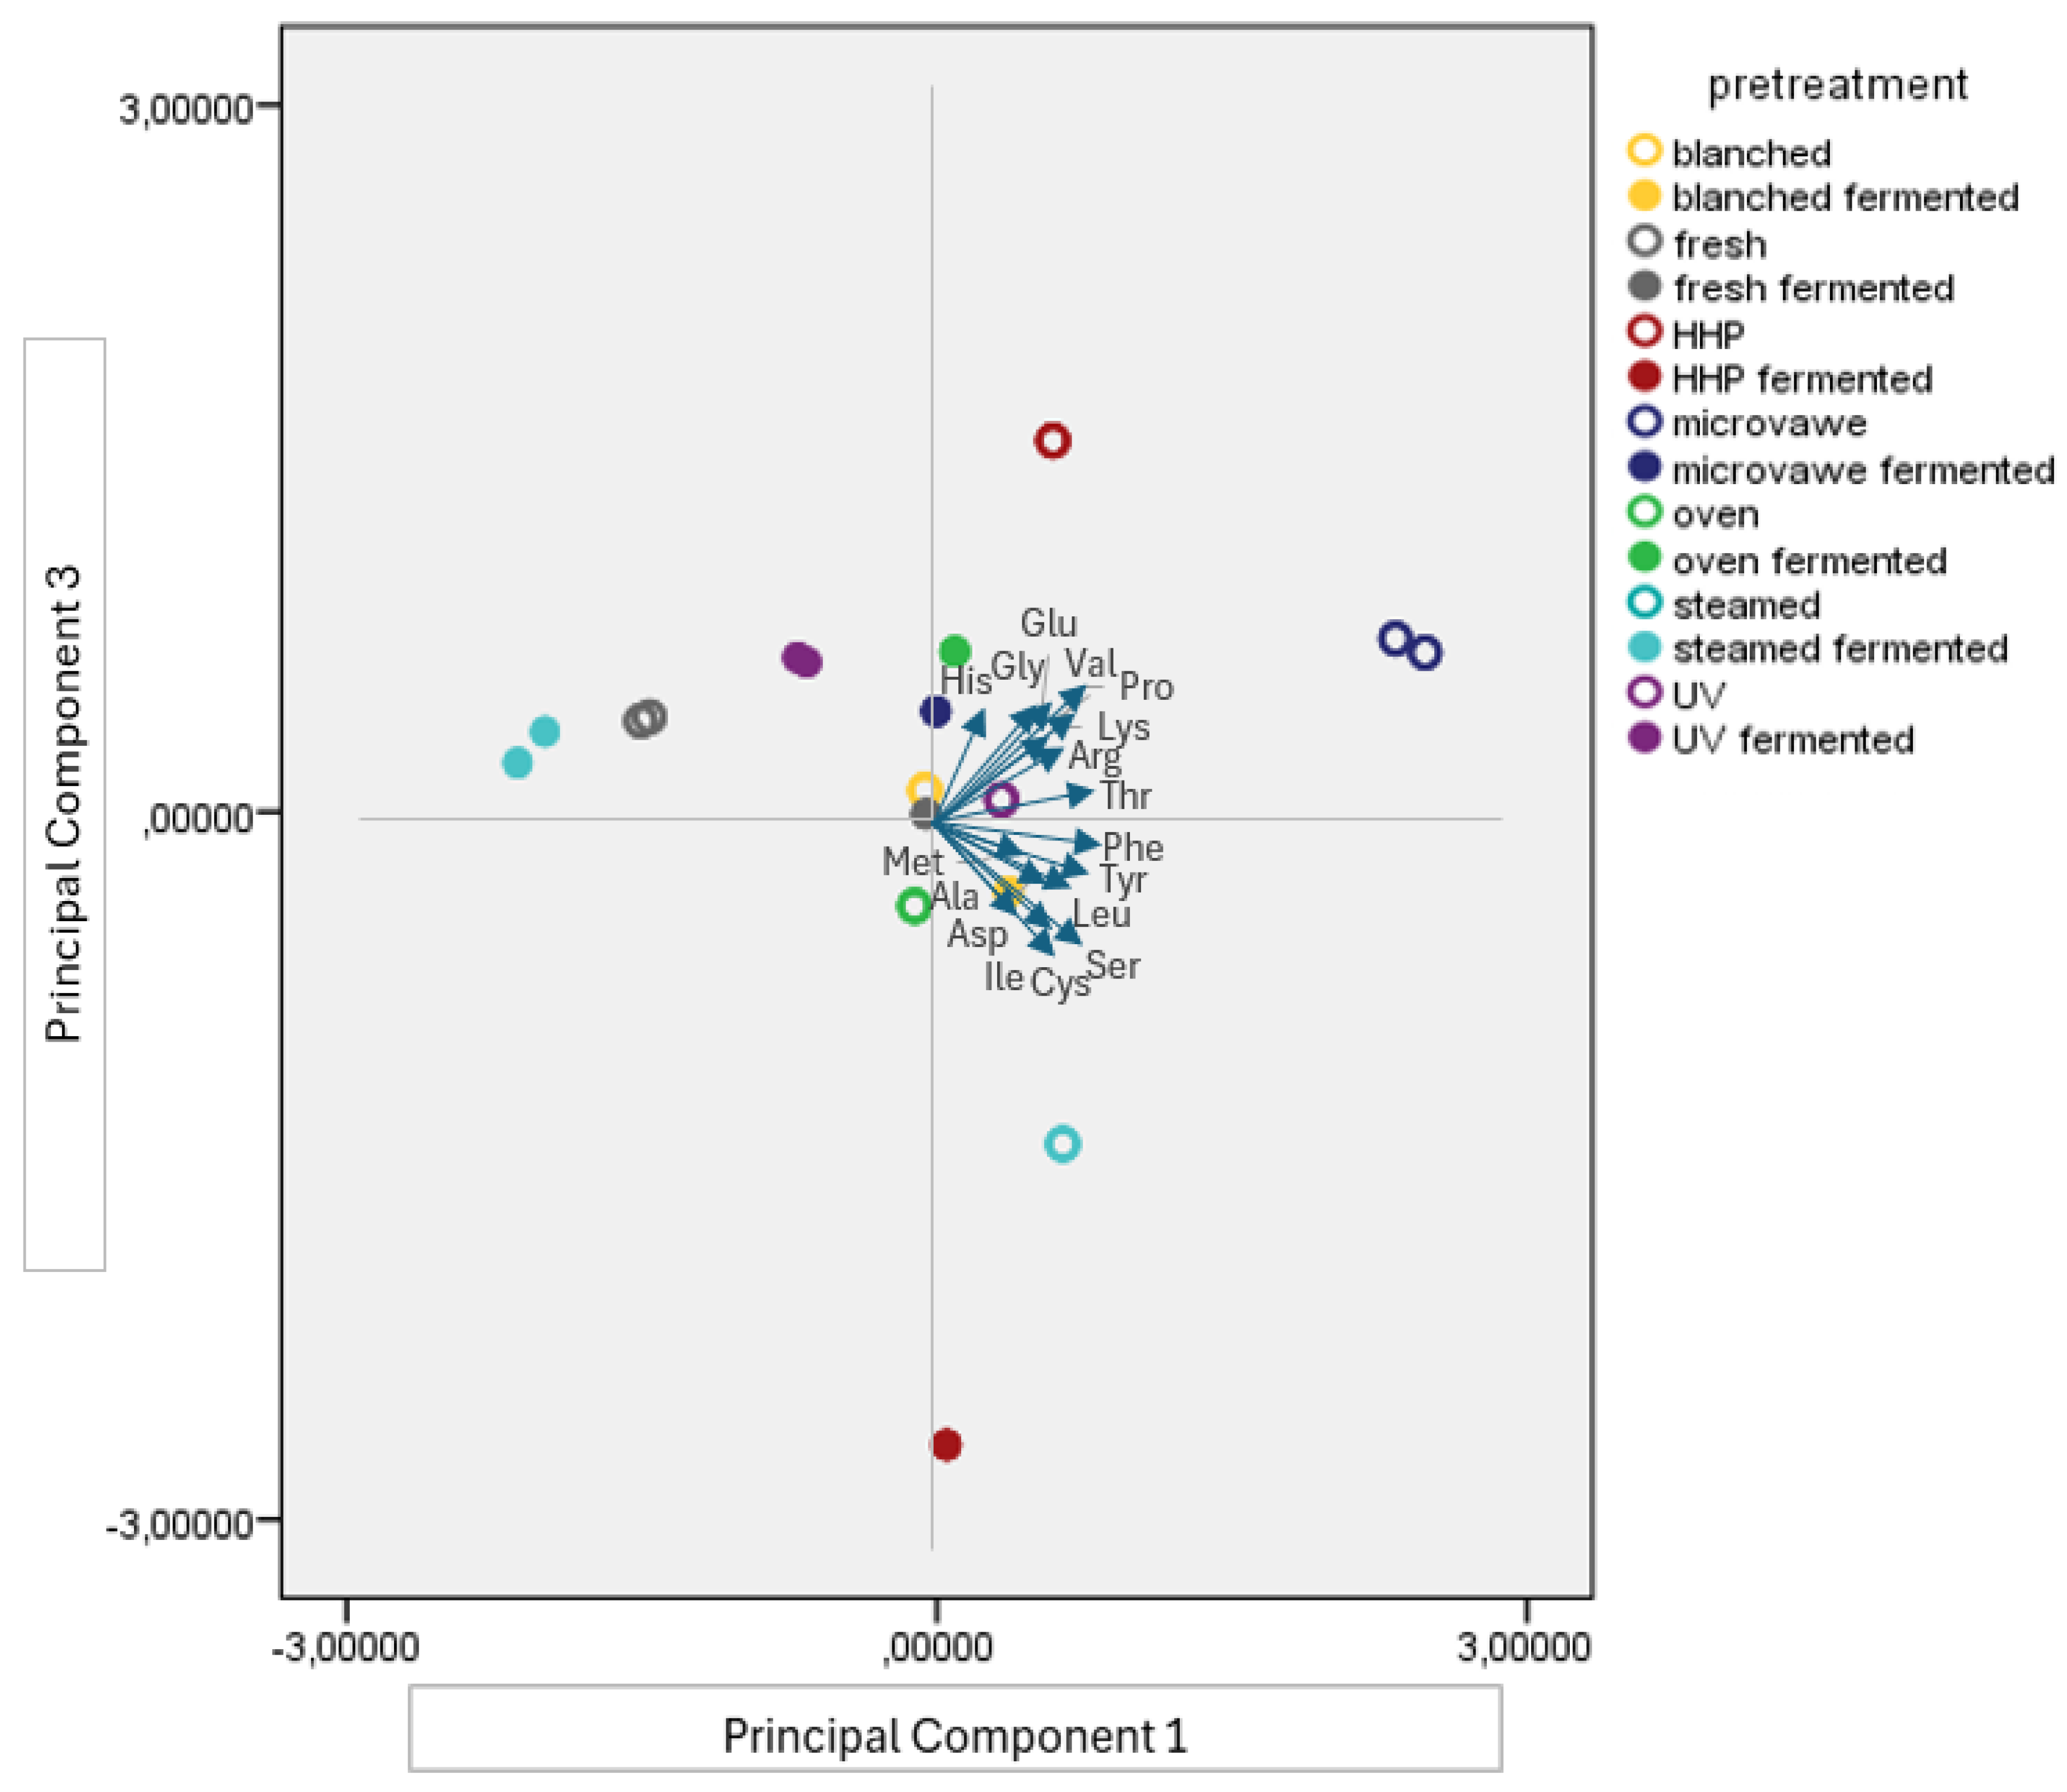
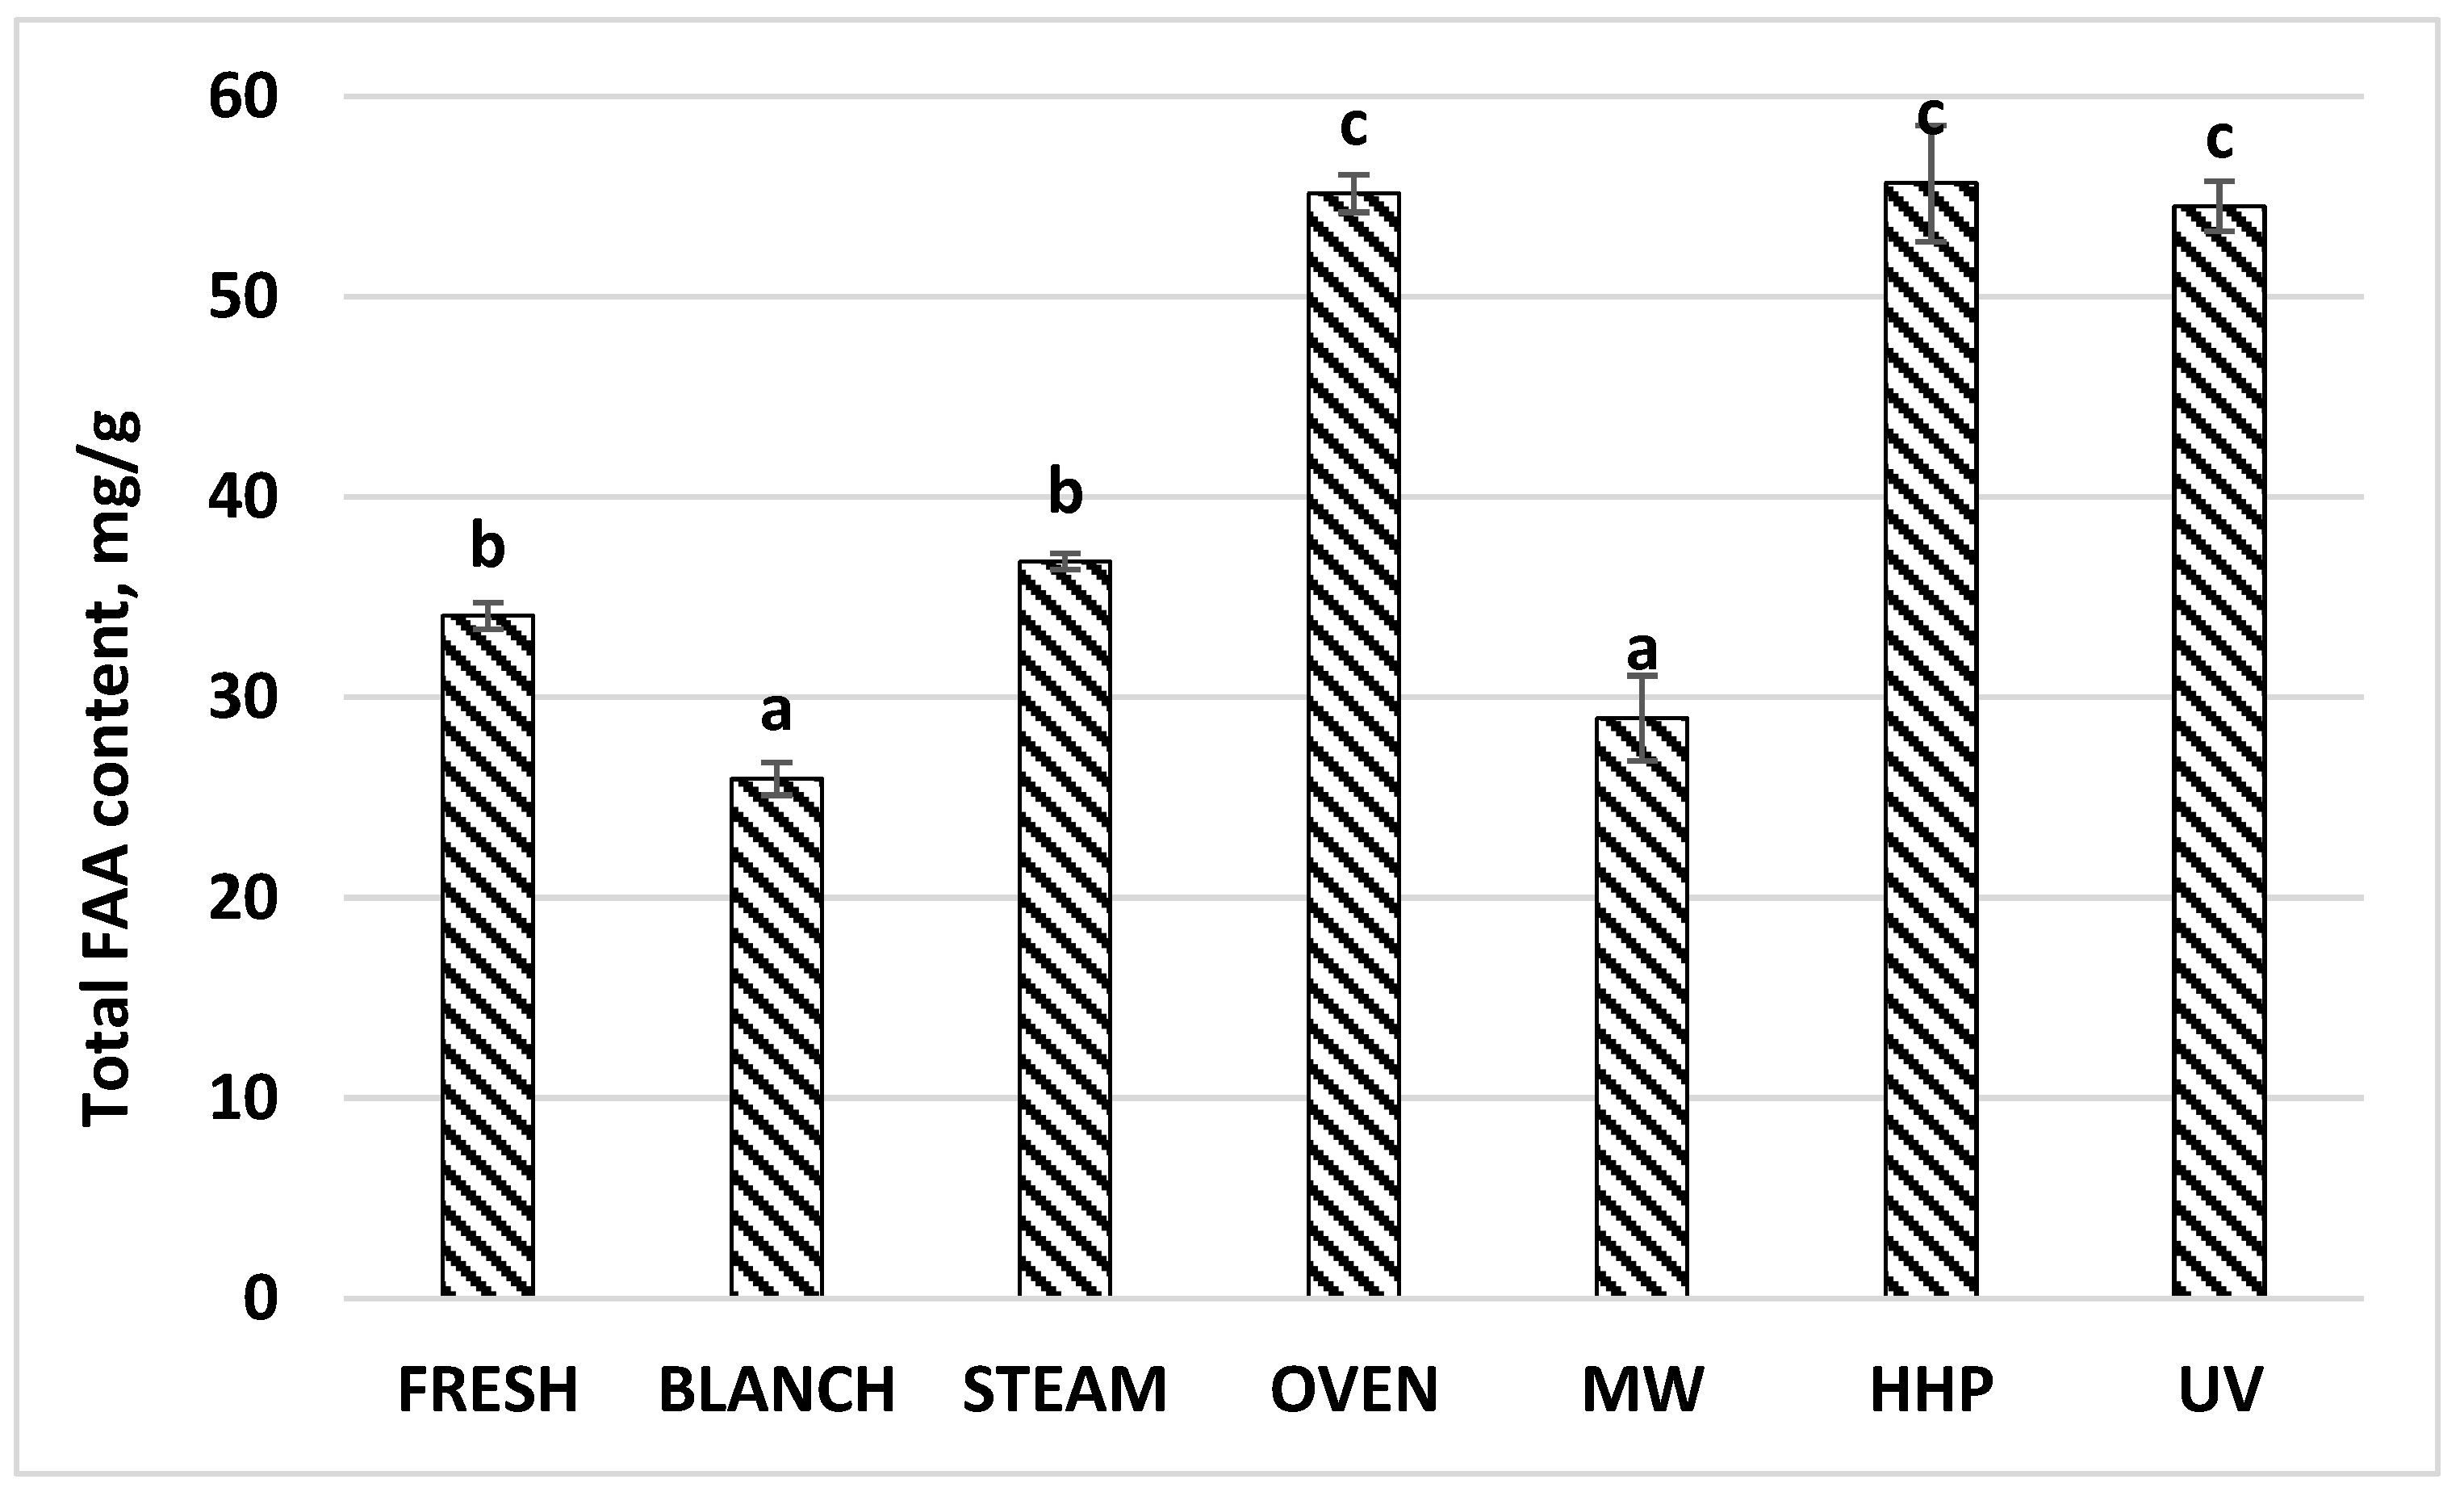
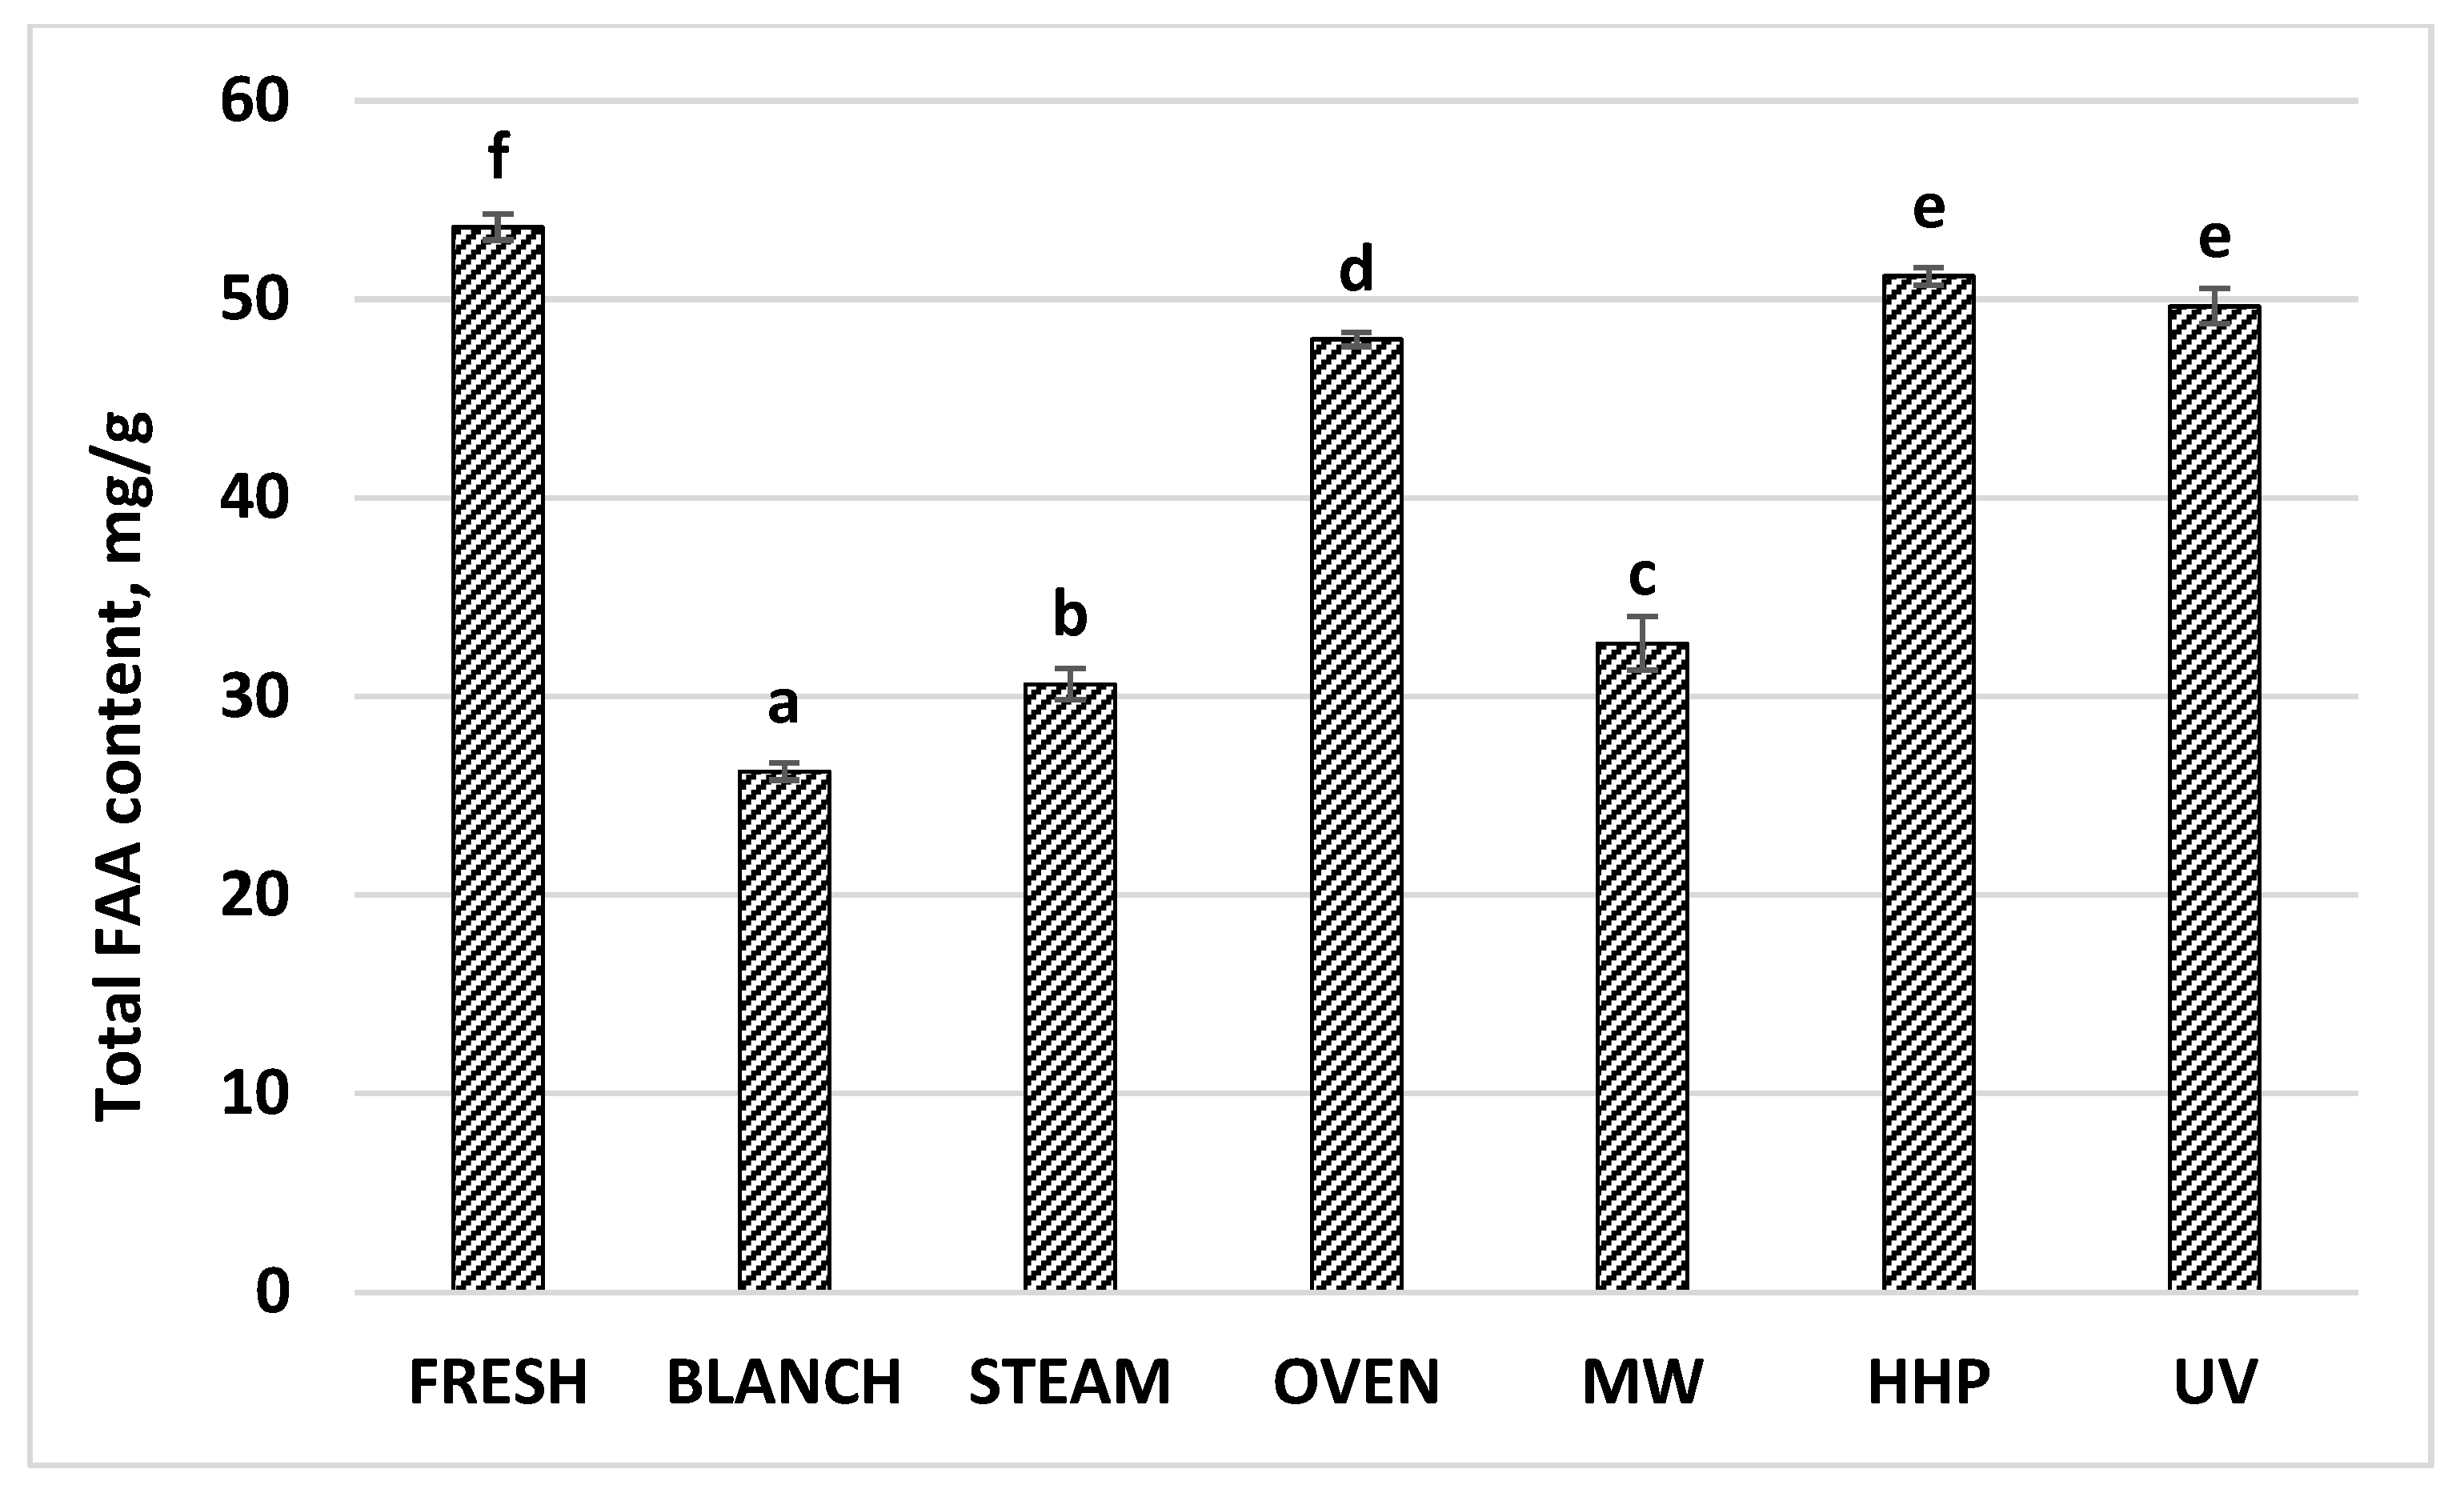
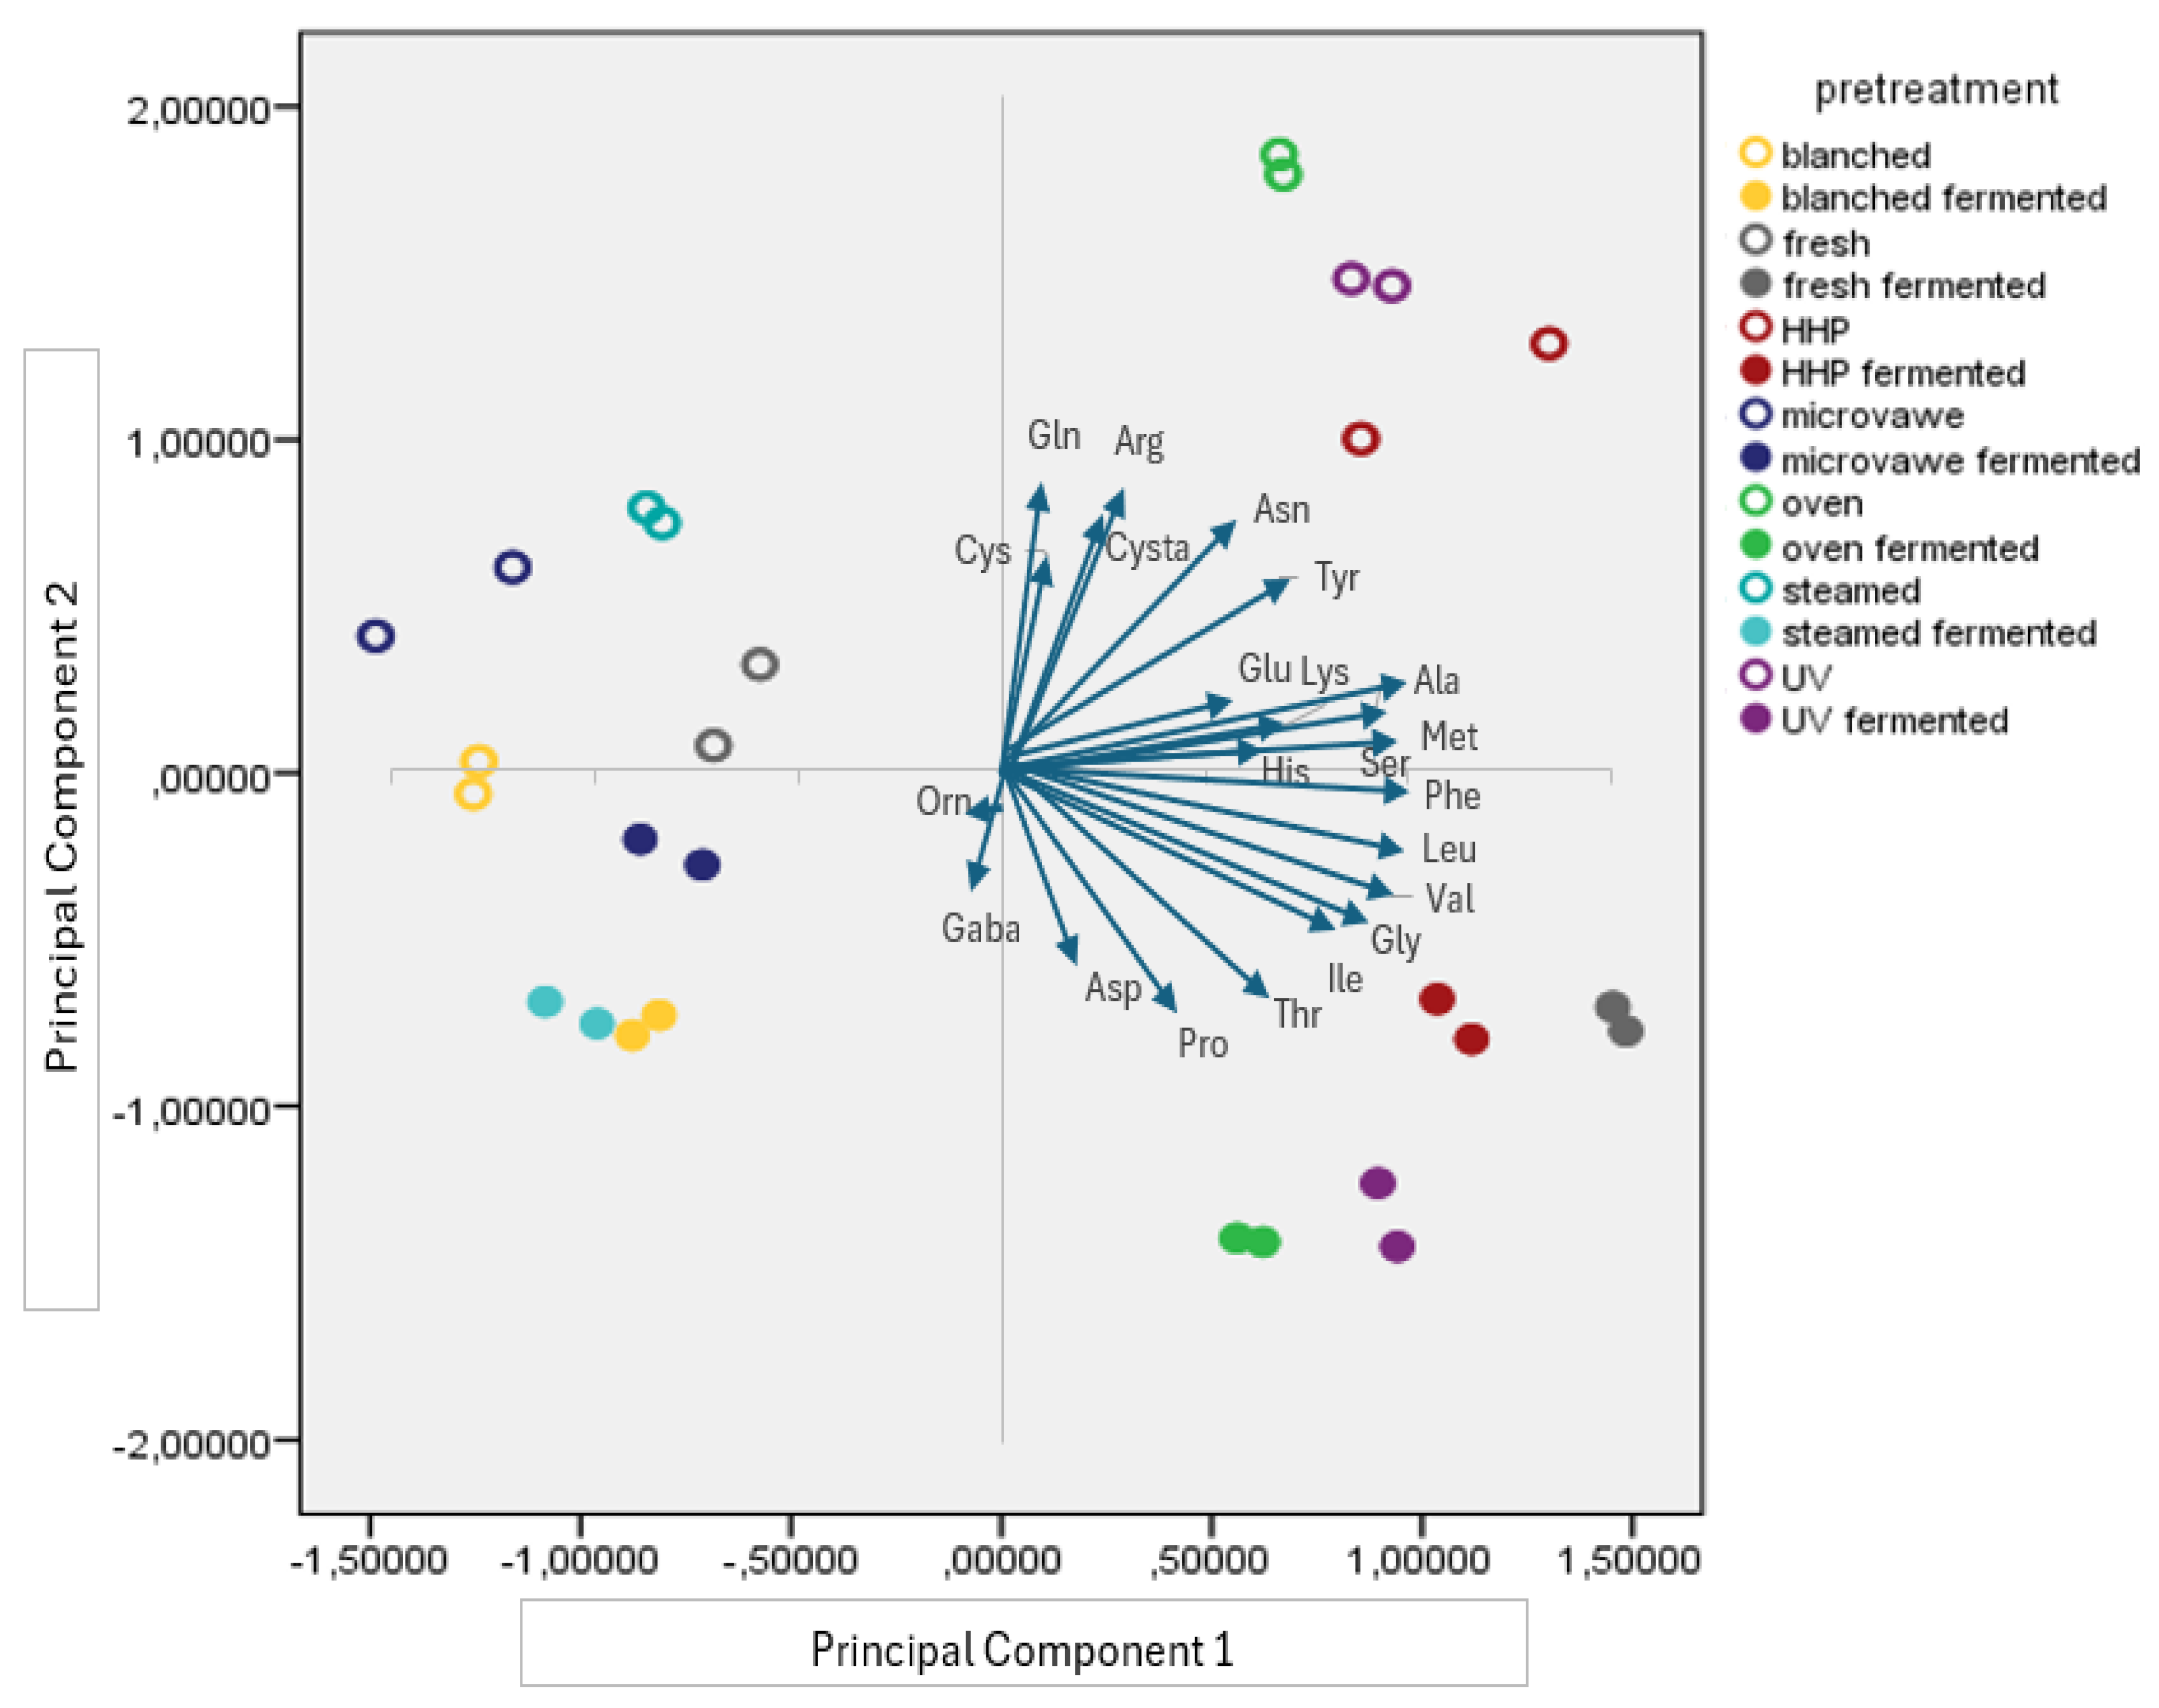
3.2. Free Amino Acid Profile of the Mushroom Samples

The total free amino acid contents of the pretreated mushroom samples are presented in Figure 7. The oyster mushroom samples contained 22 free amino acids, with their total amounts ranging from 25.95 to 55.68 mg/g for the pretreated samples (Appendix C). The total free amino acid content of the fresh oyster mushroom was 34.07 mg/g. The blanching (23.8%) and microwaving (14.9%) pretreatments caused a significant decrease in the free amino content of the mushroom samples, while the HHP (63.4%), oven (61.9%), UV light (60.1%), and steam (8.0%) pretreatments caused an increase (p < 0.05). Among these, the HHP pretreatment increased the free amino acid concentration the most, reaching 55.68 mg/g.
In the fermented sample group (Figure 8), the fresh fermented samples exhibited the highest free amino acid content at 53.64 mg/g, while the blanched fermented samples showed the lowest content at 26.23 mg/g. This suggests that fermentation alone significantly increases the total free amino acid content, underscoring the importance of pretreatments before fermentation. The blanching, steaming, and microwaving pretreatments followed by fermentation led to lower free amino acid contents compared to not only the other pretreatments but also the fresh oyster mushrooms themselves (p < 0.05). However, the oven-, HHP-, and UV-pretreated fermented samples retained their high free amino acid contents with a slight reduction compared to their pretreated counterparts (Appendix D).
The free amino acid profile of mushroom samples was evaluated using a principal component analysis, as shown in Figure 9. The first two principal components accounted for 66.3% of the variance, representing the majority of the dataset’s variation.
In Figure 9, the upper-right quadrant contains markers corresponding to four samples: oven-, UV-light-, and HHP-pretreated mushrooms, while the lower-right quadrant features markers for these samples’ fermented counterparts and the fresh fermented samples. The upper-left quadrant contains four samples: microwaved, steamed, fresh, and blanched mushrooms, while the lower-left quadrant contains their fermented counterparts. The clear separation of pretreated and fermented samples in principal component 2 highlights the significant impact of fermentation on the free amino acid profiles of the samples. Additionally, principal component 1 distinctly differentiates the various pretreatments. Samples located in the same quadrant (oven/UV/HHP and microwave/blanched/steamed) indicate similarities in their amino acid profiles, with the degree of similarity being reflected by their proximity to one another, forming distinct clusters. The greater distance between fermented samples and their pretreated counterparts in the oven-, UV-light-, and HHP-pretreated groups suggests that these samples underwent more substantial changes in their free amino acid composition compared to the other samples. Notably, the fresh mushroom samples exhibited the most significant change in composition, shifting from the upper-left quadrant to the lower-left quadrant upon fermentation, indicating that the application of fermentation without any pretreatments causes a pronounced alteration in the free amino acid profile. The arrows represent the free amino acids’ contribution to the principal components. The fresh, HHP-pretreated, and UV-light-pretreated fermented samples are positioned further along the positive PC1 axis, suggesting high levels of free amino acids such as glycine, valine, leucine, and isoleucine. The glutamine, arginine, and cysteine arrows point upward, indicating that these amino acids are the most influential in principal component 2, affecting the oven-pretreated samples. Although present in relatively low amounts, ornithine was most abundant in the microwave-pretreated samples, which was reflected in their position on the plot.

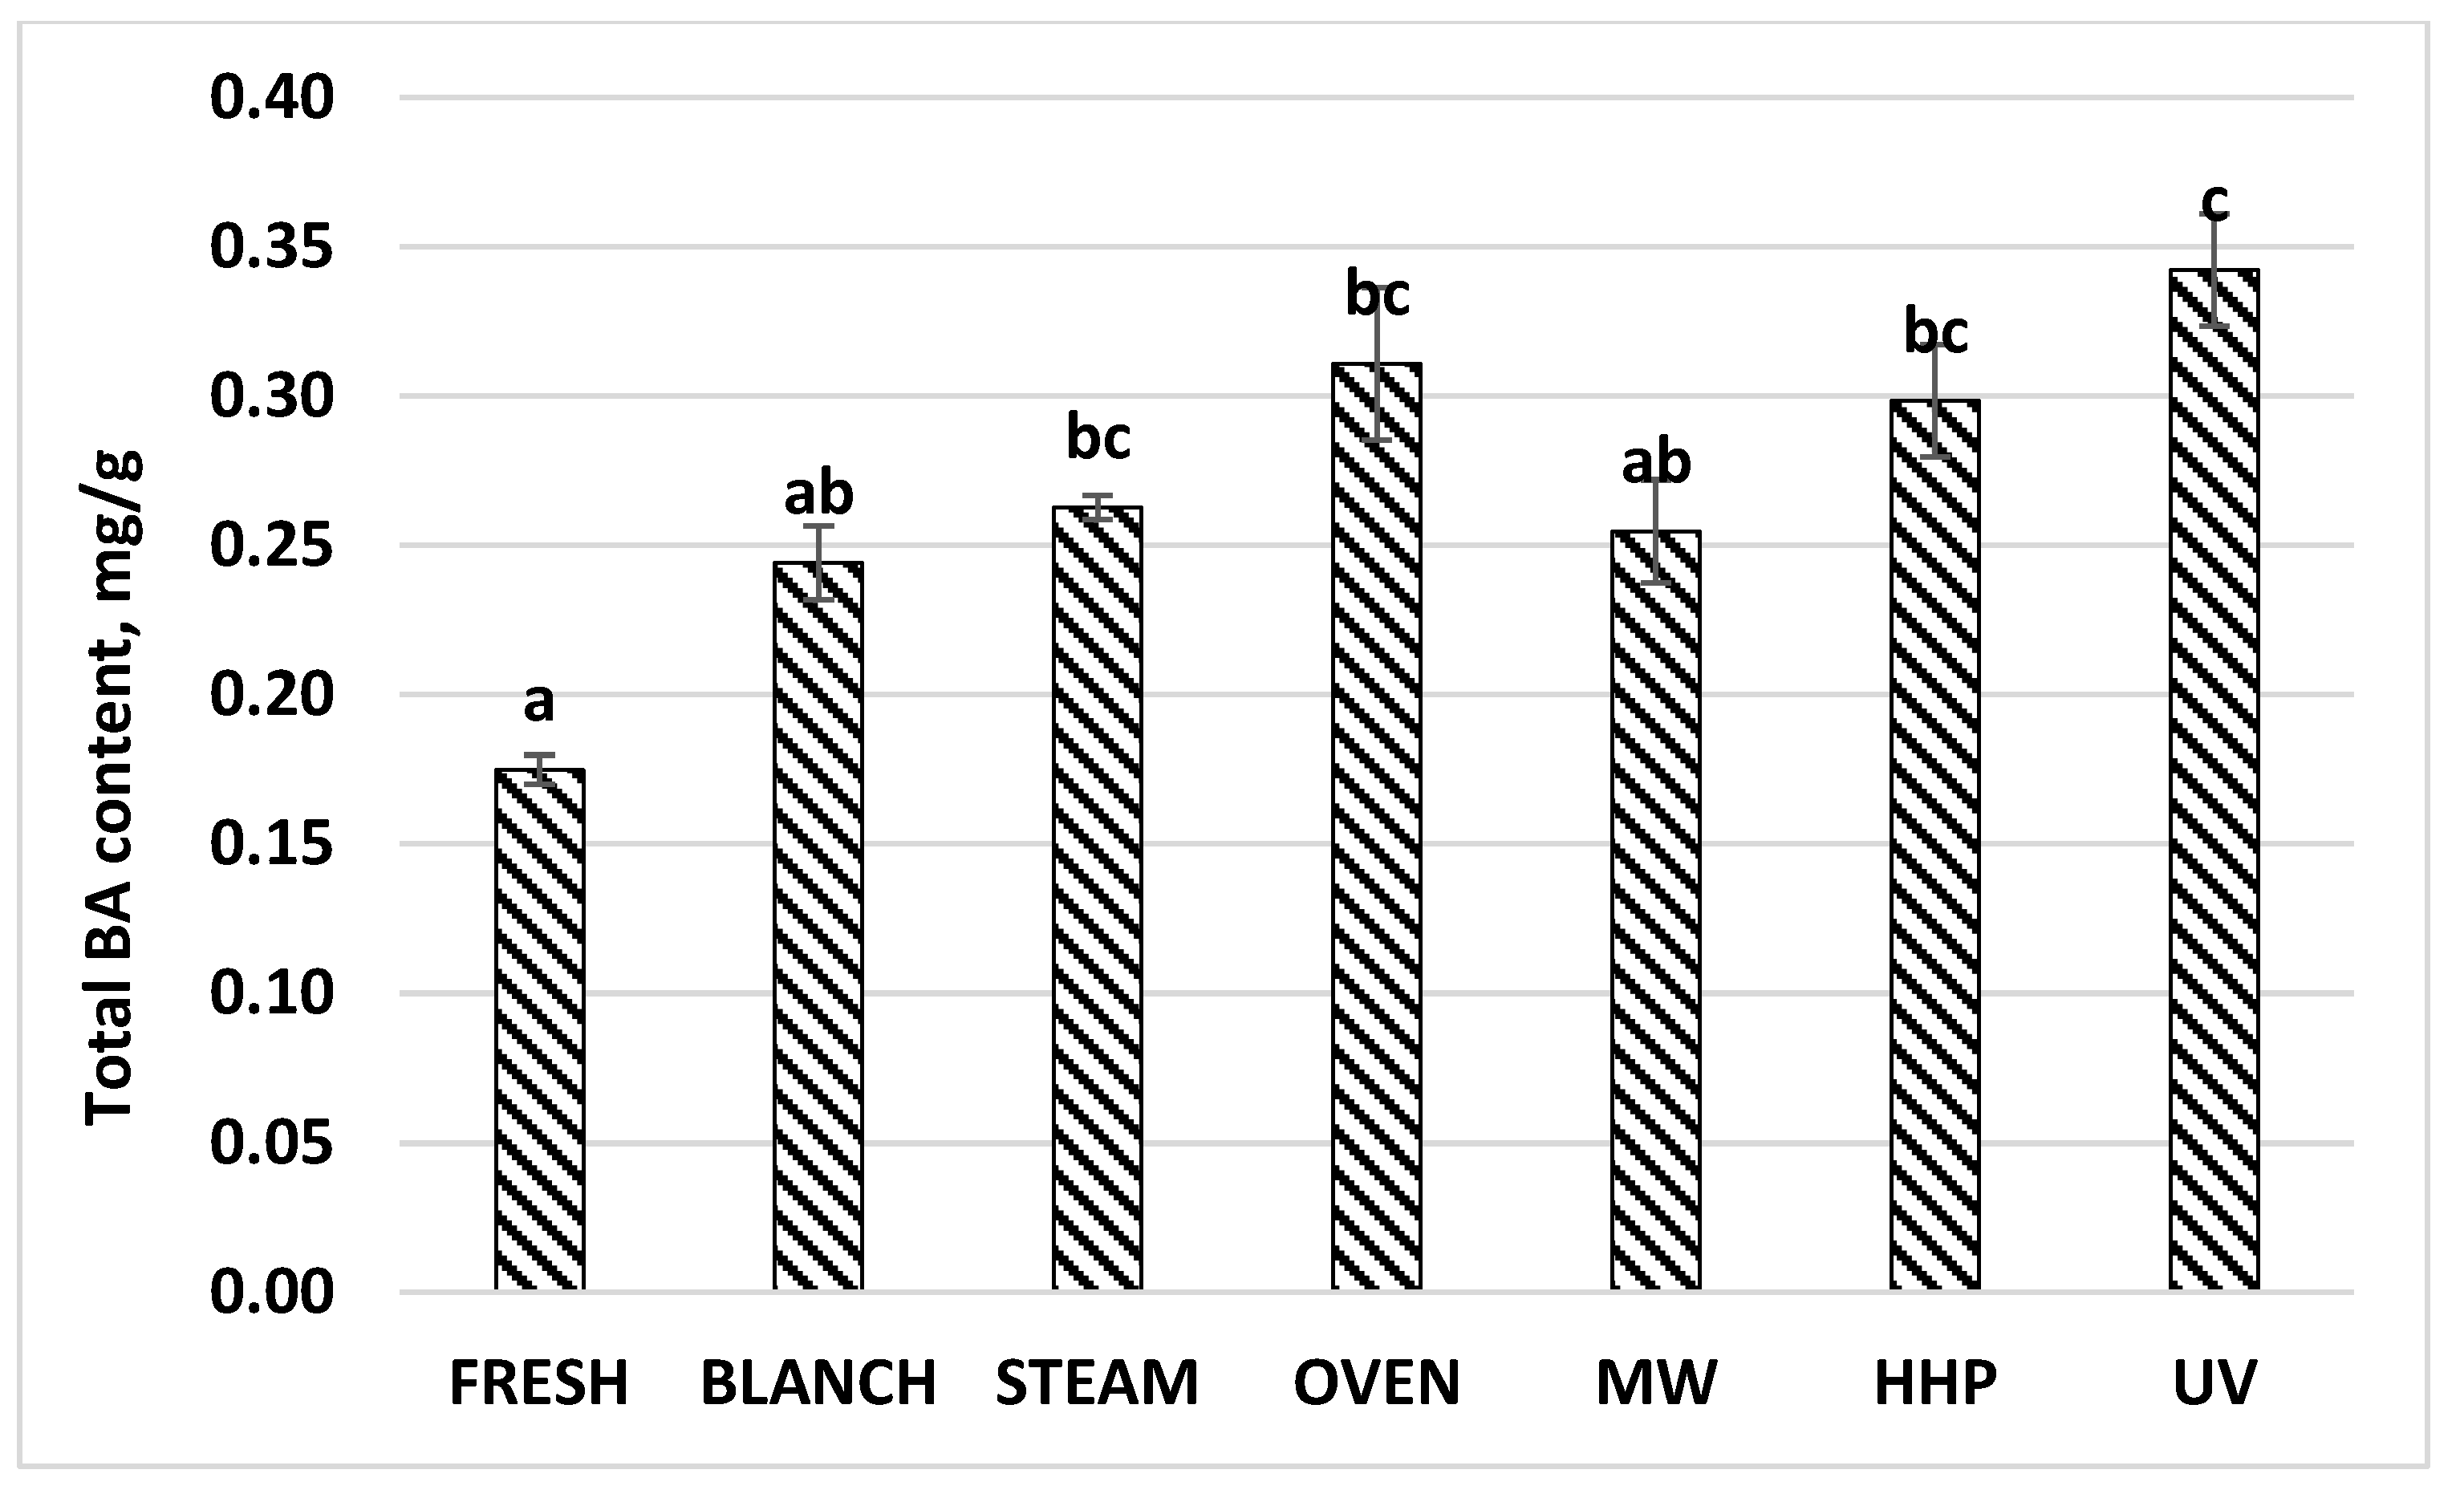
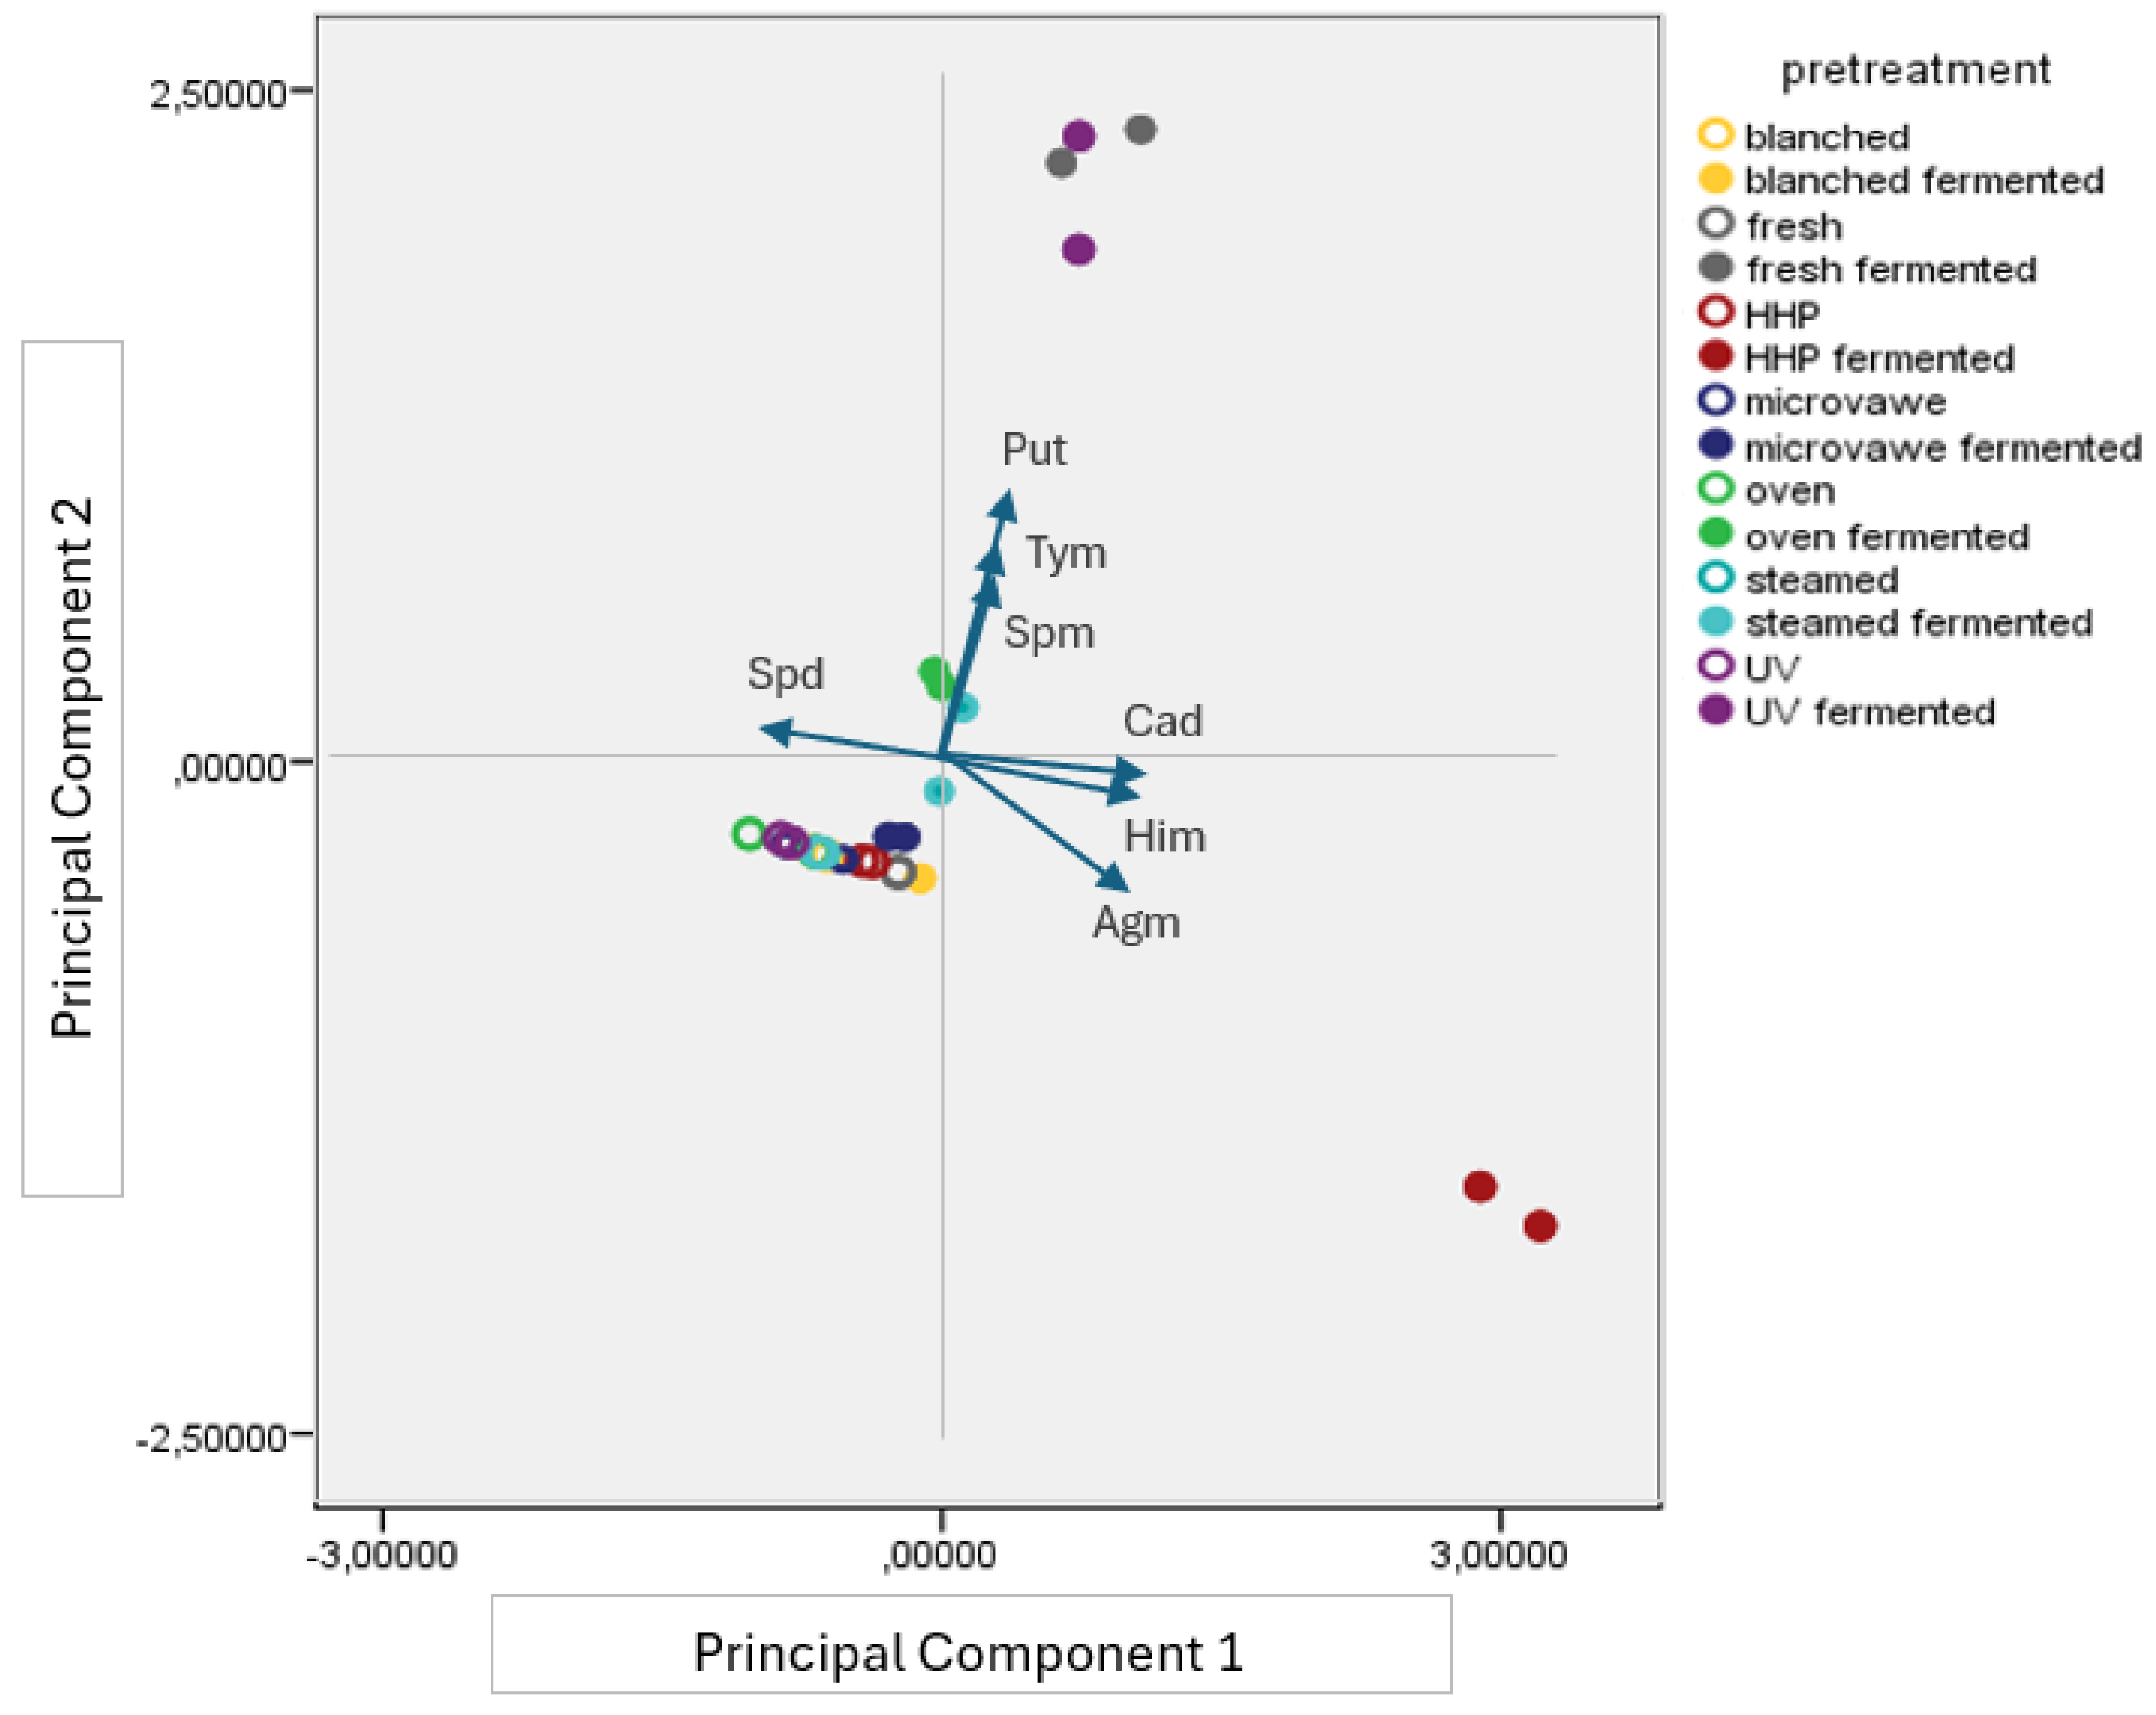
3.3. Biogenic Amine Profile of the Mushroom Samples

The total biogenic amine contents formed from the free amino acids of the pretreated mushroom samples are presented in Figure 10. The oyster mushroom samples contained seven biogenic amines. In the pretreated sample group, the total biogenic amine content ranged from 0.17 to 0.34 mg/g, with an average of 0.27 mg/g. The limit for the total biogenic amine content is 0.75–0.9 mg/g food (EU Commission 2017, EFSA, 2011 [15,16]). The lowest biogenic amine content was observed in the fresh samples (0.17 mg/g), while the highest was in the UV-light-pretreated (0.34 mg/g) samples. Compared to the fresh samples, all the pretreated samples showed increased biogenic amine levels: the UV-light-pretreated samples by 95.7%, the oven-pretreated samples by 77.7%, the HHP-pretreated samples by 70.6%, the steamed samples by 50.2%, the microwave-pretreated samples by 45.6%, and the blanched samples by 39.6%. However, the increase was not significant for the blanched and microwaved samples (p > 0.05).
In the pretreated fermented sample group (Figure 11), the biogenic amine content ranged from 0.14 to 5.05 mg/g. The biogenic amine content in most cases exceeded the limit value for the total biogenic amine content (0.75–0.9 mg/g food) [15,16]. The UV-light-pretreated fermented oyster mushrooms exhibited the highest biogenic amine content (5.05 mg/g), while the lowest was observed in the blanched fermented samples (0.14 mg/g). The fermented samples generally displayed higher biogenic amine levels (5.72 times higher than their pretreated counterparts overall) except for the blanched fermented samples. This result is not surprising, as the microbes involved in fermentation produce biogenic amines from free amino acids through decarboxylase activity. However, the disproportionately high contribution of the UV-light-pretreated fermented samples to this overall increase should not be neglected. Among the fermented samples, only the UV-light-pretreated samples had a higher biogenic amine concentration (2.7 times) compared to the fresh fermented samples. In all other cases, a reduction in biogenic amine content was observed within the fermented group: the blanched samples decreased by 92.8%, the microwave-pretreated samples by 76.0%, the steamed samples by 57.3%, the oven-treated samples by 52.1%, and the HHP-pretreated samples by 17.6%. These reductions highlight the effectiveness of the pretreatments in mitigating biogenic amine production during fermentation.
In the fresh oyster mushrooms, small amounts of spermidine (0.15 mg/g) and cadaverine (0.02 mg/g) were detected. In the pretreated samples, three biogenic amines were identified: spermidine, cadaverine, and tyramine. Spermidine (0.24–0.31 mg/g) was the dominant biogenic amine in the pretreated samples, accounting for 94% of the total biogenic amine content. Spermidine and putrescine are reported as typical fungal polyamines, often occurring in higher concentrations compared to other biogenic amines in mushrooms [46]. Additionally, cadaverine was present in small amounts (0.01–0.04 mg/g) in the fresh, steamed, and HHP-pretreated samples, contributing to 4% of the total biogenic amine content. Tyramine was detected only in the UV-light-pretreated oyster mushrooms (0.04 mg/g), making up 2% of the total biogenic amine content (Appendix E). In the fermented samples, seven biogenic amines were identified: histamine, tyramine, putrescine, cadaverine, spermidine, agmatine, and spermine. Histamine was the most abundant, ranging between 0.15 and 1.23 mg/g, constituting 28% of the total biogenic amine content (Appendix F). It was present in all fermented samples except the blanched ones, with notably high levels (1.23 mg/g) observed in the HHP-pretreated fermented samples. Tyramine was the second most abundant biogenic amine (0.08–4.1 mg/g), representing 48% of the total biogenic amine content. It was detected in all of the fermented samples except the blanched and microwave-pretreated ones, with an exceptionally high amount (4.1 mg/g) in the UV-light-pretreated fermented sample. Spermidine ranged between 0.12 and 0.21 mg/g across the six pretreatments but was undetectable in the HHP-pretreated samples. Putrescine (0.01–0.27 mg/g) was present in all samples except the blanched ones, contributing an average of 9.1% to the total biogenic amine content. Cadaverine accounted for 3.0% of the total biogenic amine content, with the highest concentration observed in the HHP-pretreated fermented samples (0.15 mg/g). Spermine was only detected in the fresh fermented samples (0.48 mg/g), while agmatine (0.08 mg/g) was only found in the HHP-pretreated fermented samples. In a study on button mushrooms, three biogenic amines, spermidine, putrescine, and tyramine, were identified. Putrescine (ranging from 0.58 to 10.11 mg/kg) and tyramine (ranging from 1.44 to 69.04 mg/kg) were only present in fermented mushroom samples, while histamine was not detected in Jabłońska-Ryś et al.’s study [46]. The biogenic amine profile of mushroom samples was also evaluated using a principal component analysis, as shown in Figure 12. The first two principal components accounted for 75.7% of the variance, representing the majority of the dataset’s variation.
In Figure 12, the upper-right quadrant contains markers corresponding to the fresh fermented and UV-light-treated fermented mushrooms, forming a distinct cluster differing from the other sample groups, indicating similarities in their biogenic amine profiles. The lower-right quadrant features markers only for the HHP-pretreated fermented samples, located far from all the other sample groups, suggesting a unique biogenic amine composition. The markers for the oven-treated fermented and steamed fermented samples are located near the center of the plot, indicating that their biogenic amine profiles closely resemble the overall dataset average. The lower-left quadrant includes all of the pretreated samples along with the blanched fermented and microwave-treated fermented samples. This distinct clustering of pretreated samples highlights the minimal impact of pretreatments on their biogenic amine profiles, which are predominantly characterized by spermidine and show an absence of other biogenic amines. Notably, the blanched fermented and microwave-treated fermented samples exhibit similar profiles, suggesting that fermentation had a limited effect on altering their biogenic amine composition, in contrast to the fresh fermented, UV-light-treated fermented, and HHP-treated fermented samples, which showed more pronounced changes. The arrows represent the biogenic amines’ contribution to the principal components. The fresh fermented and UV-light-treated fermented samples are positioned further along the positive PC 2 axis, indicating elevated levels of biogenic amines such as putrescine, spermine, and notably tyramine in the UV-light-treated fermented samples. In addition to agmatine being exclusively detected in the HHP-pretreated fermented samples, histamine was also most abundant in these samples, a factor that influenced their distinct positioning on the plot.

4. Discussion

The feasibility of integrating advanced technologies, such as HHP, microwave, and UV light, alongside traditional methods like steaming, oven cooking, and water blanching prior to mushroom fermentation, was investigated. A total of 22 free amino acids were identified in the oyster mushroom samples. Three types of biogenic amines—spermidine, cadaverine, and tyramine—were detected in the pretreated control samples, while fermentation additionally produced histamine, putrescine, spermine, and agmatine. The total and essential amino acid contents of the pretreated samples were significantly higher than that of the fresh oyster mushrooms, with the microwave-pretreated samples exhibiting the most substantial improvement. All essential amino acids, except tryptophan, were detected in the mushroom samples. Essential amino acids, including arginine, comprised 35–44% of the total amino acids in the pretreated mushroom samples, indicating that the oyster mushrooms maintained high protein quality regardless of the pretreatment applied.
The blanching and microwave pretreatments reduced the free amino acid content, whereas the steaming, oven, HHP, and UV light pretreatments increased it compared to fresh oyster mushrooms (34.07 mg/g). When the pretreatments were combined with fermentation, a decrease in free amino acid content was observed only in the blanched samples.
The measured values are determined from the dry matter content; therefore, the loss of weight (yield) during treatments has a significant influence and may explain the reduction in TAA content after fermentation in the steamed, microwaved, HHP-, and UV-treated samples. In the case of UV treatment (that has almost no weight loss at the pretreatment) retained its proteins. This combined with the degradation of peptides and proteins due to the UV treatment may explain the high biogenic amine content after fermentation.
The amino acid content, as measured on a dry matter basis, is higher in the fermented samples. The yield values resulting from the various pretreatment methods were 91.00% in the blanched, 92.33% in the steamed, 94.12% in the oven-pretreated, 80.00% in the microwaved, 98.65% in the HHP-treated, and 99.71% the UV-light-pretreated samples (the fresh untreated samples have a value of 100% as a reference). Following fermentation (the pretreated mushroom samples were the reference), the highest yield was observed in the microwaved samples (95.46%), followed by the blanched (92.32%) and steamed (89.59%) samples. The HHP and UV samples had the lowest yields post-fermentation, with 68.70% and 69.41%, respectively. These have a major effect on the results and also underscore the significance of pretreatment methods in influencing the yield during fermentation.
The increased values of the BA content measured in this study may have multiple explanations. In the fresh fermented samples (i), there was no pretreatment and, thus, the cell count was higher. In the case of the HHP-pretreated samples, there was a perforated membrane structure (ii), leading to the higher accessibility of the substrates. The UV-light-pretreated fermented samples showed a considerably higher BA content. The bactericidal effect is limited to the surface, so between the gills, its lethality is minimal, which allows for (iii) the survival of a higher active cell count in the sample. As the UV light accelerates protein degradation, resulting in a higher FAA content, (iv) it also promotes the degradation of essential amino acids, which are the precursors of BA formation.
There are only limited reports of similar research in the literature. The biogenic amine content of putrescine and histidine after the fermentation of white and brown button mushrooms with individual lactobacillus species showed similar negative, undetectable results [46]. Cadaverine was detectable in our fresh, steamed, and high-pressure-pretreated laska samples. It is important to note that none of the mushrooms without a pretreatment contained cadaverine. Tyramine was also detectable after fermentation with three species of lactobacillus; yet, in our case, only the UV-light-treated samples contained tyramine. In terms of total biogenic amine content, the UV treatment significantly increased BA compared to the pressure and thermal pretreatments. The lowest value was observed in the blanched sample preboiled in boiling water, which could be due to the aqueous medium as a solvent and the strong thermal effect due to the efficient heat transfer. Although we have tried to apply the same heat load as in the heat treatments, its efficiency needs to be improved.

5. Conclusions

The results of our study provide a background for the development of food products based on oyster mushroom, either for its use in meat products or innovative vegan products. According to research findings, the protein/amino acid composition of oyster mushrooms is high in value and consistent with a balanced human nutrition in terms of protein and amino acid components.
The amino acid composition and biogenic amine content of the final product may be influenced by the pretreatment method used.
The presence of water as a solvent, the destructive effects of UV light, the polar excitation heating of the microwave, and the structural modification and membrane damage resulting from high hydrostatic pressure all modify the results, partly because these effects modify the tissue structure differently and partly because they generate very different weight loss values and thus also differences in dry matter content. By analyzing the liquid losses reported in this study as weight loss, we could obtain a more accurate view of the impact of pretreatments on amino acids and on the mechanism of their transformation to biogenic amines. So, further studies should focus on better understanding the links between weight loss and solubilized amino acid content. The thermal treatments form a distinct group with heat having an observable effect. The non-thermal treatments, such as UV light and pressure treatment, were also distinct in the results. Further research is strongly recommended, complemented by a microbiological study, which could further narrow down and clarify the effects of the treatments and their mechanisms.
Based on the experience of our research, we would like to concentrate on carrying out fermentation with known lactobacillus species to reduce the uncertainty of auto-fermentation.
The comparability of the results can be further improved by performing an experiment with the above modifications.

Author Contributions

Conceptualization, G.K. and M.B.-K.; methodology, L.S.-S.; software, G.K. and K.T.; validation, L.S.-S., Z.M. and G.K.; formal analysis, L.S.-S., G.K., M.B.-K. and A.G.; investigation, M.B.-K. and A.G.; resources, L.S.-S., Z.M. and K.T.; data curation, Z.M., M.B.-K., G.K. and A.G.; writing—original draft preparation, M.B.-K. and G.K.; writing—review and editing, G.K. and L.S.-S.; visualization, M.B.-K.; supervision, L.S.-S. and G.K.; project administration, K.T.; funding acquisition, G.K. All authors have read and agreed to the published version of the manuscript.

Funding

This research received no external funding.

Institutional Review Board Statement

Not applicable.

Informed Consent Statement

Not applicable.

Data Availability Statement

Data are available on request.

Acknowledgments

The support of Tempus Public Foundation (Stipendium Hungaricum Scholarship) and the Doctoral School of the Hungarian University of Agriculture and Life Sciences is highly appreciated. The authors would like to thank András Misz for his assistance in the procurement of the mushrooms.

Conflicts of Interest

The authors declare no conflicts of interest.

Appendix A. The Proteinogenic Amino Acid Profile of Pretreated Mushroom Samples (Mean ± SE, n = 4) (*: Essential Amino Acid)

Amino Acid
(mg/g)
FreshBlanchedSteamedOvenMicrowaveHHPUV
Mean±SEMean±SEMean±SEMean±SEMean±SEMean±SEMean±SE
Asp24.370.8036.270.0451.900.0126.630.0037.501.0630.910.0034.170.04
Thr *6.700.128.340.008.910.016.040.0111.070.489.270.017.940.00
Ser1.470.032.130.023.160.011.930.003.150.102.310.002.550.01
Glu29.160.0043.480.0241.120.0039.440.0052.450.3945.760.0051.480.00
Pro5.190.074.840.027.470.016.460.008.380.067.650.005.900.00
Gly8.360.2110.430.0611.210.0013.660.0114.460.1015.700.0011.410.02
Ala12.530.2212.260.0412.350.0014.670.0022.360.2412.450.0010.510.01
Val *7.220.3411.940.009.710.038.530.0113.470.3614.800.0113.820.00
Cys1.430.031.950.013.170.002.130.002.330.022.320.002.490.00
Met *1.980.093.680.002.830.013.680.003.290.113.830.002.300.03
Ile *4.220.044.960.008.480.028.940.008.100.256.360.004.460.04
Leu *11.830.1518.580.0015.260.0310.410.0121.150.1311.220.0018.040.07
Tyr3.780.204.500.005.550.026.780.006.080.055.650.006.790.01
Phe *5.810.007.200.007.940.017.470.0110.430.247.690.008.820.00
Lys *8.380.019.160.007.360.027.650.0014.800.228.170.008.940.00
His *3.660.194.280.045.560.034.500.006.570.0631.500.014.740.01
Arg *8.250.059.320.058.300.008.340.0013.340.137.310.007.210.00
Total AA144.341.82193.320.09210.290.02177.260.2248.911.55222.900.00201.570.02
Total EAA *58.050.8677.460.0174.350.0065.560.00102.220.79100.150.0076.270.00

Appendix B. The Proteinogenic Amino Acid Profile of Pretreated Fermented Mushroom Samples (Mean ± SE, n = 4) (*: Essential Amino Acid)

Amino Acid
(mg/g)
Fresh FermentedBlanched FermentedSteamed FermentedOven FermentedMicrowave FermentedHHP FermentedUV Fermented
Mean±SEMean±SEMean±SEMean±SEMean±SEMean±SEMean±SE
Asp53.790.1628.450.1022.220.4827.720.0027.330.0136.270.0632.890.74
Thr *10.360.017.300.015.040.117.990.008.030.007.650.026.370.21
Ser1.070.001.920.031.300.111.890.011.900.003.170.031.330.03
Glu20.400.0827.590.0027.150.2332.460.1238.020.0022.300.0835.610.26
Pro5.180.006.810.004.530.357.010.057.670.004.380.036.530.08
Gly16.820.009.690.017.570.1313.110.018.870.007.020.039.750.16
Ala11.240.0119.290.0011.320.0812.710.0015.340.0118.780.0914.880.04
Val *11.950.0014.520.017.150.2715.640.0011.610.008.760.039.440.00
Cys1.430.001.670.001.160.011.710.002.380.002.820.021.470.00
Met *3.870.002.370.002.000.093.790.002.050.003.810.032.580.04
Ile *6.200.009.120.024.260.227.210.005.260.008.010.015.580.10
Leu *10.560.0017.780.0011.050.0014.620.0013.070.0217.180.0513.680.06
Tyr5.900.026.130.003.090.104.080.005.330.005.420.033.700.16
Phe *9.740.018.930.005.530.078.600.008.530.008.680.087.270.01
Lys *7.540.028.830.007.830.138.560.028.760.017.670.019.720.07
His *3.940.044.800.002.890.023.740.006.760.004.810.024.320.02
Arg *6.970.129.160.076.750.108.370.009.160.006.770.048.890.11
Total AA186.960.41184.360.02130.860.85179.210.18180.070.41173.500.34174.020.35
Total EAA *71.130.3082.810.2152.500.3178.520.2273.230.3473.340.2567.870.40

Appendix C. The Free Amino Acid Profile of Pretreated Mushroom Samples (Mean ± SE, n = 4)

Free
Amino Acid
(mg/g)
FreshBlanchedSteamedOvenMicrowaveHHPUV
Mean±SEMean±SEMean±SEMean±SEMean±SEMean±SEMean±SE
Asp1.360.021.430.022.770.031.600.011.520.191.790.091.480.03
Thr0.710.000.600.010.770.030.700.020.530.040.870.011.000.05
Ser1.730.271.390.021.500.222.660.041.130.312.460.362.820.07
Asn3.640.042.100.082.690.418.060.272.600.096.560.146.040.16
Glu3.620.023.110.115.140.124.220.174.640.104.440.117.680.22
Gln2.530.092.160.085.890.006.590.083.590.124.390.143.460.12
Pro0.620.030.570.050.540.050.540.010.610.030.710.000.590.04
Gly0.940.050.500.020.710.010.970.050.560.071.200.241.600.06
Ala3.800.151.950.132.630.055.430.403.210.316.840.226.670.11
Val1.350.241.140.201.280.012.290.020.950.212.510.192.260.08
Cys0.340.070.300.020.440.000.480.040.580.050.500.050.730.05
Met0.740.030.230.020.340.000.890.030.190.051.290.161.060.08
Cysta0.620.070.410.011.080.001.190.050.840.191.040.101.360.06
Ile1.030.171.010.020.670.001.300.010.550.091.590.111.310.02
Leu2.620.031.480.081.670.003.580.061.420.215.230.453.700.02
Tyr1.520.090.890.021.240.072.370.020.920.132.790.282.480.05
Phe1.300.041.320.051.090.081.980.040.890.112.830.212.140.04
Gaba1.620.041.330.031.230.021.730.031.270.041.490.011.310.02
Orn0.510.120.390.010.850.001.170.090.830.120.670.061.200.08
Lys1.330.021.240.041.930.003.160.080.810.112.720.091.980.04
His0.770.100.800.010.710.001.660.010.470.091.270.101.610.06
Arg1.380.301.610.221.650.032.630.030.890.182.460.262.070.08
Total FAA34.070.8225.950.2436.800.4855.170.3928.982.5855.683.1654.540.58

Appendix D. The Free Amino Acid Profile of Pretreated Fermented Mushroom Samples (Mean ± SE, n = 4)

Free Amino Acid
(mg/g)
Fresh FermentedBlanched FermentedSteamed FermentedOven FermentedMicrowave FermentedHHP FermentedUV Fermented
Mean±SEMean±SEMean±SEMean±SEMean±SEMean±SEMean±SE
Asp2.120.202.190.042.250.053.230.151.790.041.560.103.190.06
Thr1.710.081.100.111.270.022.000.020.480.072.000.021.520.03
Ser3.740.061.080.111.090.042.050.071.000.092.630.222.610.05
Asn2.140.041.690.011.720.022.340.161.160.104.320.193.040.06
Glu6.400.071.200.011.270.067.010.034.350.377.000.022.180.12
Gln2.370.051.410.011.270.081.380.031.400.121.680.021.550.04
Pro0.980.050.850.040.680.120.750.010.820.070.800.070.860.06
Gly2.280.021.020.050.830.052.000.020.990.082.010.012.110.06
Ala6.570.041.240.062.750.015.130.233.490.235.160.186.130.19
Val3.200.031.690.041.420.013.310.051.590.073.220.113.170.06
Cys0.470.030.400.010.330.010.290.020.530.010.260.050.390.02
Met1.110.030.330.020.340.010.800.000.450.011.010.041.110.05
Cysta0.800.010.790.020.760.070.450.010.720.030.480.020.790.02
Ile2.100.021.730.040.680.032.200.070.720.172.200.012.120.10
Leu5.360.331.870.041.690.065.350.082.320.105.010.045.570.16
Tyr1.430.090.800.020.850.001.290.140.660.062.630.050.870.05
Phe2.960.061.000.021.000.042.060.101.260.042.460.082.570.14
Gaba1.110.171.120.064.850.091.680.042.290.181.240.034.260.14
Orn0.590.020.700.001.420.161.500.031.860.110.890.020.650.05
Lys3.520.081.340.272.090.131.300.042.600.202.150.062.740.14
His1.590.031.730.041.100.080.780.090.990.071.390.101.390.01
Arg1.110.030.960.090.980.061.100.001.190.071.040.010.840.17
Total FAA53.650.6926.240.5630.640.9348.000.4132.681.6751.170.5349.670.29

Appendix E. The Biogenic Amine Profile of Pretreated Mushroom Samples (Mean ± SE, n = 4) (n.d.: Not Detected)

Biogenic Amine
(mg/g)
FreshBlanchedSteamedOvenMicrowaveHHPUV
Mean±SEMean±SEMean±SEMean±SEMean±SEMean±SEMean±SE
Himn.d.n.d.n.d.n.d.n.d.n.d.n.d.n.d.n.d.n.d.n.d.n.d.n.d.n.d.
Tymn.d.n.d.n.d.n.d.n.d.n.d.n.d.n.d.n.d.n.d.n.d.n.d.0.040.01
Putn.d.n.d.n.d.n.d.n.d.n.d.n.d.n.d.n.d.n.d.n.d.n.d.n.d.n.d.
Cad0.020.00n.d.n.d.0.010.00n.d.n.d.n.d.n.d.0.040.01n.d.n.d.
Spd0.150.000.240.020.260.010.310.080.250.070.260.010.300.01
Agmn.d.n.d.n.d.n.d.n.d.n.d.n.d.n.d.n.d.n.d.n.d.n.d.n.d.n.d.
Spmn.d.n.d.n.d.n.d.n.d.n.d.n.d.n.d.n.d.n.d.n.d.n.d.n.d.n.d.
Total BA0.170.010.240.020.260.000.310.080.250.070.300.020.340.02

Appendix F. The Biogenic Amine Profile of Pretreated Fermented Mushroom Samples (Mean ± SE, n = 4) (n.d.: Not Detected)

Biogenic Amine
(mg/g)
Fresh FermentedBlanched FermentedSteamed FermentedOven FermentedMicrowave FermentedHHP FermentedUV Fermented
Mean±SEMean±SEMean±SEMean±SEMean±SEMean±SEMean±SE
Him0.150.02n.d.n.d.0.460.070.440.000.240.031.230.120.500.07
Tym0.760.19n.d.n.d.0.080.010.110.00n.d.n.d.0.100.024.100.44
Put0.270.01n.d.n.d.0.100.050.150.010.030.000.010.000.260.03
Cad0.080.030.020.00n.d.n.d.n.d.n.d.n.d.n.d.0.150.000.030.00
Spd0.160.010.120.010.170.030.210.010.180.01n.d.n.d.0.170.03
Agmn.d.n.d.n.d.n.d.n.d.n.d.n.d.n.d.n.d.n.d.0.080.01n.d.n.d.
Spm0.480.10n.d.n.d.n.d.n.d.n.d.n.d.n.d.n.d.n.d.n.d.n.d.n.d.
Total BA1.900.060.140.010.810.050.910.020.450.021.560.155.050.57

References

  1. EFSA Panel on Dietetic Products, Nutrition and Allergies (NDA). Scientific Opinion on Dietary Reference Values for protein. EFSA J. 2012, 10, 2557. [Google Scholar] [CrossRef]
  2. Wu, G.; Wu, Z.; Dai, Z.; Yang, Y.; Wang, W.; Liu, C.; Wang, B.; Wang, J.; Yin, Y. Dietary requirements of “nutritionally non-essential amino acids” by animals and humans. Amino Acids 2013, 44, 1107–1113. [Google Scholar] [CrossRef]
  3. Elmadfa, I.; Meyer, A.L. Animal Proteins as Important Contributors to a Healthy Human Diet. Annu. Rev. Anim. Biosci. 2017, 5, 111–131. [Google Scholar] [PubMed]
  4. Bohrer, B.M. An investigation of the formulation and nutritional composition of modern meat analogue products. Food Sci. Hum. Wellness 2019, 8, 320–329. [Google Scholar] [CrossRef]
  5. Andreani, G.; Sogari, G.; Marti, A.; Froldi, F.; Dagevos, H.; Martini, D. Plant-Based Meat Alternatives: Technological, Nutritional, Environmental, Market, and Social Challenges and Opportunities. Nutrients 2023, 15, 452. [Google Scholar] [CrossRef] [PubMed]
  6. Rangel-Vargas, E.; Rodriguez, J.A.; Domínguez, R.; Lorenzo, J.M.; Sosa, M.E.; Andrés, S.C.; Rosmini, M.; Pérez-Alvarez, J.A.; Teixeira, A.; Santos, E.M. Edible Mushrooms as a Natural Source of Food Ingredient/Additive Replacer. Foods 2021, 10, 2687. [Google Scholar] [CrossRef]
  7. Ayimbila, F.; Keawsompong, S. Nutritional Quality and Biological Application of Mushroom Protein as a Novel Protein Alternative. Curr. Nutr. Rep. 2023, 12, 290–307. [Google Scholar]
  8. Guillamón, E.; García-Lafuente, A.; Lozano, M.; D’Arrigo, M.; Rostagno, M.A.; Villares, A.; Martínez, J.A. Edible mushrooms: Role in the prevention of cardiovascular diseases. Fitoterapia 2010, 81, 715–723. [Google Scholar]
  9. Quintieri, L.; Nitride, C.; De Angelis, E.; Lamonaca, A.; Pilolli, R.; Russo, F.; Monaci, L. Alternative Protein Sources and Novel Foods: Benefits, Food Applications and Safety Issues. Nutrients 2023, 15, 1509. [Google Scholar] [CrossRef]
  10. Zhang, Y.; Wang, D.; Chen, Y.; Liu, T.; Zhang, S.; Fan, H.; Liu, H.; Li, Y. Healthy function and high valued utilization of edible fungi. Food Sci. Hum. Wellness 2021, 10, 408–420. [Google Scholar]
  11. Sarkadi, L.S. Amino acids and biogenic amines as food quality factors. Pure Appl. Chem. 2019, 91, 289–300. [Google Scholar] [CrossRef]
  12. Costa, M.P.; Rodrigues, B.L.; Frasao, B.S.; Conte-Junior, C.A. Chapter 2—Biogenic Amines as Food Quality Index and Chemical Risk for Human Consumption. In Food Quality: Balancing Health and Disease; Holban, A.M., Grumezescu, A.M., Eds.; Academic Press: Cambridge, MA, USA, 2018; pp. 75–108. [Google Scholar]
  13. Bartkiene, E.; Zokaityte, E.; Starkute, V.; Mockus, E.; Klupsaite, D.; Lukseviciute, J.; Bogomolova, A.; Streimikyte, A.; Ozogul, F. Biopreservation of Wild Edible Mushrooms (Boletus edulis, Cantharellus, and Rozites caperata) with Lactic Acid Bacteria Possessing Antimicrobial Properties. Foods 2022, 11, 1800. [Google Scholar] [CrossRef]
  14. Ruiz-Capillas, C.; Herrero, A.M. Impact of Biogenic Amines on Food Quality and Safety. Foods 2019, 8, 62. [Google Scholar] [CrossRef] [PubMed]
  15. EFSA Panel on Biological Hazards (BIOHAZ). Scientific Opinion on risk based control of biogenic amine formation in fermented foods. EFSA J. 2011, 9, 2393. [Google Scholar] [CrossRef]
  16. EU Commission Regulation. Commission Regulation (EU) No 1019/2013 of 23 October 2013 Amending Annex I to Regulation (EC) No 2073/2005 as Regards Histamine in Fishery Products Text with EEA Relevance; European Commission: Brussels, Belgium, 2015. [Google Scholar]
  17. Jabłońska-Ryś, E.; Sławińska, A.; Stachniuk, A.; Stadnik, J. Determination of biogenic amines in processed and unprocessed mushrooms from the Polish market. J. Food Compos. Anal. 2020, 92, 103492. [Google Scholar] [CrossRef]
  18. Sharma, A.; Sharma, A.; Tripathi, A. Biological activities of Pleurotus spp. polysaccharides: A review. J. Food Biochem. 2021, 45, e13748. [Google Scholar] [CrossRef]
  19. Bellettini, M.B.; Fiorda, F.A.; Maieves, H.A.; Teixeira, G.L.; Ávila, S.; Hornung, P.S.; Júnior, A.M.; Ribani, R.H. Factors affecting mushroom Pleurotus spp. Saudi J. Biol. Sci. 2019, 26, 633–646. [Google Scholar] [CrossRef] [PubMed]
  20. Torres-Martínez, B.d.M.; Vargas-Sánchez, R.D.; Torrescano-Urrutia, G.R.; Esqueda, M.; Rodríguez-Carpena, J.G.; Fernández-López, J.; Perez-Alvarez, J.A.; Sánchez-Escalante, A. Pleurotus Genus as a Potential Ingredient for Meat Products. Foods 2022, 11, 779. [Google Scholar] [CrossRef]
  21. Lavelli, V.; Proserpio, C.; Gallotti, F.; Laureati, M.; Pagliarini, E. Circular reuse of bio-resources: The role of Pleurotus spp. in the development of functional foods. Food Funct. 2018, 9, 1353–1372. [Google Scholar] [CrossRef]
  22. Carrasco-González, J.A.; Serna-Saldívar, S.O.; Gutiérrez-Uribe, J.A. Nutritional composition and nutraceutical properties of the Pleurotus fruiting bodies: Potential use as food ingredient. J. Food Compos. Anal. 2017, 58, 69–81. [Google Scholar] [CrossRef]
  23. Bach, F.; Helm, C.V.; Bellettini, M.B.; Maciel, G.M.; Haminiuk CW, I. Edible mushrooms: A potential source of essential amino acids, glucans and minerals. Int. J. Food Sci. Techn. 2017, 52, 2382–2392. [Google Scholar]
  24. Mumpuni, A.; Ekowati, N.; Purnomowati, P.; Purwati, E.S. Growth and Protein Content Establishment of Pleurotus ostreatus on Liquid and Solid Medium. Biosaintifika J. Biol. Biol. Educ. 2017, 9, 572. [Google Scholar]
  25. Naila, A.; Flint, S.; Fletcher, G.; Bremer, P.; Meerdink, G. Control of Biogenic Amines in Food—Existing and Emerging Approaches. J. Food Sci. 2010, 75, R139–R150. [Google Scholar] [PubMed]
  26. Sangeeta Sharma, D.; Ramniwas, S.; Mugabi, R.; Uddin, J.; Nayik, G.A. Revolutionizing Mushroom processing: Innovative techniques and technologies. Food Chem. X 2024, 23, 101774. [Google Scholar]
  27. Ritota, M.; Manzi, P.; Ritota, M.; Manzi, P. Edible mushrooms: Functional foods or functional ingredients? A focus on Pleurotus spp. AIMS Agric. Food 2023, 8, 391–439. [Google Scholar]
  28. Jabłońska-Ryś, E.; Skrzypczak, K.; Sławińska, A.; Radzki, W.; Gustaw, W. Lactic Acid Fermentation of Edible Mushrooms: Tradition, Technology, Current State of Research: A Review. Compr. Rev. Food Sci. Food Saf. 2019, 18, 655–669. [Google Scholar] [CrossRef]
  29. Jambrak, A.R.; Mason, T.J.; Paniwnyk, L.; Lelas, V. Ultrasonic effect on pH, electric conductivity, and tissue surface of button mushrooms, Brussels sprouts and cauliflower. Czech J. Food Sci. 2007, 25, 90–100. [Google Scholar] [CrossRef]
  30. Li, J.; Li, S.; Wang, A.; Chen, J.; Tian, G. Appropriate water blanching treatment to keep quality and color of Agaricus bisporus slices. Trans. Chin. Soc. Agric. Eng. 2014, 30, 268–273. [Google Scholar]
  31. Reis, F.R. (Ed.) New Perspectives on Food Blanching; Springer International Publishing: Cham, Switzerland, 2017; pp. 7–48. ISBN 3319839896. [Google Scholar]
  32. Murphy, R.Y.; Johnson, E.R.; Duncan, L.K.; Clausen, E.C.; Davis, M.D.; March, J.A. Heat Transfer Properties, Moisture Loss, Product Yield, and Soluble Proteins in Chicken Breast Patties During Air Convection Cooking. Poult. Sci. 2001, 80, 508–514. [Google Scholar]
  33. Bernaś, E.; Jaworska, G. Effect of microwave blanching on the quality of frozen Agaricus bisporus. Food Sci. Technol. Int. 2015, 21, 245–255. [Google Scholar]
  34. Ranjan, S.; Dasgupta, N.; Walia, N.; Thara Chand, C.; Ramalingam, C. Microwave Blanching: An Emerging Trend in Food Engineering and its Effects on Capsicum annuum L. J. Food Process Eng. 2017, 40, e12411. [Google Scholar] [CrossRef]
  35. Kenesei, G.; Jónás, G.; Salamon, B.; Dalmadi, I. Thermograms of the combined High Hydrostatic Pressure and Sous-vide treated Longissimus dorsi of pork. J. Phys. Conf. Ser. 2017, 950, 042007. [Google Scholar] [CrossRef]
  36. Riganakos, K.A.; Karabagias, I.K.; Gertzou, I.; Stahl, M. Comparison of UV-C and thermal treatments for the preservation of carrot juice. Innov. Food Sci. Emerg. Technol. 2017, 42, 165–172. [Google Scholar]
  37. Nketia, S.; Buckman, E.S.; Dzomeku, M.; Akonor, P.T. Effect of processing and storage on physical and texture qualities of oyster mushrooms canned in different media. Sci. Afr. 2020, 9, e00501. [Google Scholar] [CrossRef]
  38. Marco, M.L.; Heeney, D.; Binda, S.; Cifelli, C.J.; Cotter, P.D.; Foligné, B.; Gänzle, M.; Kort, R.; Pasin, G.; Pihlanto, A.; et al. Health benefits of fermented foods: Microbiota and beyond. Curr. Opin. Biotechnol. 2017, 44, 94–102. [Google Scholar] [PubMed]
  39. Rhee, S.J.; Lee, J.-E.; Lee, C.-H. Importance of lactic acid bacteria in Asian fermented foods. Microb. Cell Factories 2011, 10, S5. [Google Scholar] [CrossRef] [PubMed]
  40. Chen, Z.; Gao, H.; Wu, W.; Chen, H.; Fang, X.; Han, Y.; Mu, H. Effects of fermentation with different microbial species on the umami taste of Shiitake mushroom (Lentinus edodes). LWT-Food Sci. Technol. 2021, 141, 110889. [Google Scholar]
  41. Liu, Y.; Xie, X.; Ibrahim, S.A.; Khaskheli, S.G.; Yang, H.; Wang, Y.; Huang, W. Characterization of Lactobacillus pentosus as a starter culture for the fermentation of edible oyster mushrooms (Pleurotus spp.). LWT-Food Sci. Technol. 2016, 68, 21–26. [Google Scholar] [CrossRef]
  42. Di Cagno, R.; Filannino, P.; Gobbetti, M. Vegetable and Fruit Fermentation by Lactic Acid Bacteria. In Biotechnology of Lactic Acid Bacteria; John Wiley & Sons, Ltd.: Hoboken, NJ, USA, 2015; pp. 216–230. [Google Scholar]
  43. Sõukand, R.; Pieroni, A.; Biró, M.; Dénes, A.; Dogan, Y.; Hajdari, A.; Kalle, R.; Reade, B.; Mustafa, B.; Nedelcheva, A.; et al. An ethnobotanical perspective on traditional fermented plant foods and beverages in Eastern Europe. J. Ethnopharmacol. 2015, 170, 284–296. [Google Scholar] [CrossRef]
  44. Boylu, M.; Hitka, G.; Kenesei, G. Sausage Quality during Storage under the Partial Substitution of Meat with Fermented Oyster Mushrooms. Foods 2024, 13, 2115. [Google Scholar] [CrossRef]
  45. Boylu, M.; Hitka, G.; Kenesei, G. Effect of alternative pre-treatments and fermentation on quality characteristics of oyster mushrooms. Prog. Agric. Eng. Sci. 2023, 19 (Suppl. S1), 35–45. [Google Scholar] [CrossRef]
  46. Jabłońska-Ryś, E.; Sławińska, A.; Skrzypczak, K.; Kowalczyk, D.; Stadnik, J. Content of Biogenic Amines and Physical Properties of Lacto-Fermented Button Mushrooms. Appl. Sci. 2022, 12, 8957. [Google Scholar] [CrossRef]
Figure 1. Images of the pretreated oyster mushrooms (50 g) (Fresh—fresh; Blanch—blanched; Steam—steamed; Oven—oven pretreated; MW—microwave pretreated; HHP—HHP pretreated; UV—UV light pretreated).
Applsci 15 03509 g001
Figure 2. Images of the fermented oyster mushrooms (50 g) (Fresh—fresh; Blanch—blanched; Steam—steamed; Oven—oven pretreated; MW—microwave pretreated; HHP—HHP pretreated; UV—UV light pretreated).
Applsci 15 03509 g002
Figure 3. Total essential amino acid (EAA, grey column) and total proteinogenic amino acid (AA, black column) content of the oyster mushroom samples after pretreatments (mean ± SE, n = 4). Values with different letters (a–g) differ significantly among total EAA values. Mean values with different capital letters (A–G) differ significantly among total AA values (p < 0.05).
Applsci 15 03509 g003
Figure 4. Total essential amino acid (grey column) and total proteinogenic amino acid (black column) content of the pretreated oyster mushroom samples after fermentation (mean ± SE, n = 4). Values with different letters (a–f) differ significantly among total EAA values; different capital letters (A–F) differ significantly among total AA values (p < 0.05).
Applsci 15 03509 g004
Figure 5. PCA combined plot (PC 1 vs. PC 2) of total amino acid profile of mushroom samples.
Applsci 15 03509 g005
Figure 6. PCA combined plot (PC 1 vs. PC 3) of total amino acid profile of mushroom samples.
Applsci 15 03509 g006
Figure 7. Total free amino acid content of the pretreated oyster mushroom samples (mean ± SE, n = 4). Values with different letters (a–c) show significant differences (p < 0.05).
Applsci 15 03509 g007
Figure 8. Total free amino acid content of the pretreated and fermented oyster mushroom samples (mean ± SE, n = 4). Values with different letters (a–f) show significant differences (p < 0.05).
Applsci 15 03509 g008
Figure 9. PCA plot (PC 1 vs. PC 2) of free amino acid profile of mushroom samples.
Applsci 15 03509 g009
Figure 10. Total biogenic amine content of the oyster mushroom samples after pretreatments (mean ± SE, n = 4). Values with different letters (a–c) differ significantly among total BA values after pretreatments (p < 0.05).
Applsci 15 03509 g010
Figure 11. Total biogenic amine content of the pretreated oyster mushroom samples after fermentation (mean ± SE, n = 4). Values with different letters (a–e) differ significantly among total BA values after fermentation (p < 0.05) (overall biogenic amine content limit: 0.75–0.9 mg/g food [15,16]).
Applsci 15 03509 g011
Figure 12. PCA plot (PC 1 vs. PC 2) of biogenic amine profile of mushroom samples.
Applsci 15 03509 g012
Table 1. Measurement parameters of the automatic amino acid analyzer.
Proteinogenic and Free Amino AcidsBiogenic Amines
Cation exchange column typeIONEX OSTION LCP5020OSTION LG ANB
Column size200 mm × 3.7 mm60 mm × 3.7 mm
Column temperature55 °C and 65 °C55 °C and 65 °C
Reactor temperature121 °C121 °C
Eluent flow rate0.30 cm3/min0.30 cm3/min
Ninhydrin flow rate0.25 cm3/min0.25 cm3/min
Sample volume injected100 µL100 µL
Detection wavelength440 nm (proline) and 570 nm570 nm
BuffersLi-citrate buffersNa/K-citrate buffers
Analysis time200 min97 min
Detection limit0.5 µmol/dm30.5 µmol/dm3
Standard deviation2–5%2–5%
Disclaimer/Publisher’s Note: The statements, opinions and data contained in all publications are solely those of the individual author(s) and contributor(s) and not of MDPI and/or the editor(s). MDPI and/or the editor(s) disclaim responsibility for any injury to people or property resulting from any ideas, methods, instructions or products referred to in the content.

