Article

Environmental Life Cycle Assessment of Class A Biosolids Production Using Conventional and Low-Cost, Low-Tech Processes at Small Water Resource Recovery Facilities

1
Department of Civil, Environmental, and Geospatial Engineering, Michigan Technological University, 1400 Townsend Dr., Houghton, MI 49931, USA
2
Department of Chemical Engineering, Michigan Technological University, 1400 Townsend Dr., Houghton, MI 49931, USA
*
Author to whom correspondence should be addressed.
Appl. Sci. 2025, 15(7), 3482; https://doi.org/10.3390/app15073482
Submission received: 7 January 2025 / Revised: 5 March 2025 / Accepted: 19 March 2025 / Published: 22 March 2025
(This article belongs to the Special Issue New Approaches to Water Treatment: Challenges and Trends)

Abstract

:
Producing Class A biosolids that can be distributed or land-applied without restriction is a beneficial way to reuse wastewater treatment solids. For small water resource recovery facilities (WRRFs) in particular, low-cost, low-tech (LCLT) processes may be an appealing alternative to conventional technologies for producing Class A biosolids, such as processes to further reduce pathogens (PFRPs). Conventional Class A biosolids treatment processes tend to be energy-intensive and involve complex equipment and operations. However, a systematic comparison of the overall sustainability of conventional processes and LCLT alternatives for producing Class A biosolids to aid decision makers in selecting treatment processes is not readily available. Therefore, this study used life cycle assessments to compare five Class A biosolids treatment processes, including three conventional processes—Composting, Direct Heat Drying, and temperature-phased anaerobic digestion (TPAD)—and two LCLT processes—Air Drying, and long-term Lagoon Storage followed by Air Drying—on the basis of their environmental impacts. The environmental impacts were normalized to facilitate a comparison of the processes. The results indicate that Composting and Direct Heat Drying had the most significant environmental impacts, primarily from the biogenic emissions during Composting and the natural gas requirements for Direct Heat Drying. In comparison, TPAD and Air Drying had the lowest environmental impacts, and Lagoon Storage had intermediate impacts. Thus, LCLT processes may be more sustainable than some, but not all, conventional PFRPs.

1. Introduction

Water resource recovery facilities (WRRFs) produce treated organic solids known as biosolids. Biosolids have characteristics that make them valuable for beneficial reuse via land application. For example, biosolids are a good source of organic matter (30–40%) and, depending on the treatment technology, they can be rich in nutrients like nitrogen (3%), phosphorus (1.5%), and potassium (0.7%) [1]. Biosolids can also improve soil structure and provide the soil with additional iron [1].
Consistent with these benefits, a survey conducted in 2018 found that 53% of wastewater solids produced in the United States are treated and beneficially reused as land-applied biosolids, primarily on agricultural lands [2]. According to the survey, of the remaining biosolids that are not land applied, 30% are landfilled and 15% are incinerated. Thus, the land application of biosolids has the added benefit of conserving landfill space [1]. Small WRRFs are more likely to landfill biosolids because they deem it too difficult to set up a beneficial use program [3].
Many communities are interested in producing biosolids that are classified as Class A biosolids, which must meet stringent regulations for pathogen and indicator organism (PIO) levels and organic stabilization. Conventional processes for producing Class A biosolids include processes to further reduce pathogens (PFRPs), which include Composting, Heat Drying, Heat Treatment, Thermophilic Aerobic Digestion, Beta Ray Irradiation, Gamma Ray Irradiation, and Pasteurization [4]. With the possible exception of Composting, these are all expensive, high-maintenance processes, and most are energy-intensive. Unfortunately, many WRRFs serving small communities (defined as having a population of ≤10,000 people and wastewater flow rates of <1 × 10⁶ gal/day [5]) lack the capital resources and personnel and other operating requirements for implementing a PFRP. Increasingly, these WRRFs are interested in pursuing technologies that minimize the capital, operational, and maintenance costs associated with biosolids production, as well as the overall energy footprint [6,7]. Fortunately, low-cost, low-technology (LCLT) alternatives are available and being used successfully at WRRFs in the U.S. and elsewhere. LCLT Class A biosolids treatment processes that are currently being used in full-scale treatment systems include long-term Lagoon Storage, Air Drying, Lagoon Storage Plus Air Drying, and Cake Storage [8].
LCLT processes are attractive to small WRRFs due to their low capital costs and simple designs. However, are LCLT alternatives better for the environment than PFRPs? The overall goal of this study was to examine the sustainability of conventional and LCLT processes at small WRRFs. Specifically, this investigation is part of a broader study that evaluated the sustainability of five Class A biosolids treatment processes, including three conventional processes—Composting, Direct Heat Drying, and temperature-phased anaerobic digestion (TPAD)—and two LCLT processes—Air Drying and long-term Lagoon Storage followed by Air Drying (hereafter referred to as Lagoon Storage). This article presents the results obtained when the processes were compared on the basis of their environmental impacts using a life-cycle assessment (LCA) approach and is intended to provide guidance to smaller WRRFs that are interested in the environmental implications of their decision to select one of these processes.

2. Methodology

2.1. Goal, Scope, Functional Unit, and Process Selection

All LCA work completed in this research was consistent with International Organization for Standardization (ISO) 14040 guidance [9] and conducted using SimaPro software (PRé Consultants, version 9.3). The goal of these LCAs was to quantify the environmental impacts of each of the selected processes for producing biosolids and to identify the inputs within each process that most contributed to the suite of environmental impacts under study. This evaluation was performed by determining the percentage of impacts associated with fuel consumption, material inputs, infrastructure, and biogenic sources, as well as the composition of biogenic emissions.
This study is a gate-to-gate evaluation, which begins after biosolids are generated in a conventional anaerobic digestion system and dewatered via a belt filter press (with the exception of TPAD) and ends after the biosolids are transported to a land application site (Figure 1). The processes ‘upstream’ of the system boundary are assumed to be similar for all five biosolids treatment processes according to the particular wastewater treatment system producing the biosolids. The land application of the resulting Class A biosolids would also generate similar impacts in each scenario. Therefore, these upstream and downstream processes were not included in the system boundary, keeping the focus of this study on the impacts of the decisions surrounding biosolids production.
The functional unit used in this study is an annual production of 200 dry tons of finished Class A biosolids. This functional unit is typical of a small WRRF, which is the focus of this study. The five biosolids treatment processes illustrated in Figure 1 were selected for the following reasons: Composting and thermal stabilization (e.g., Direct Heat Drying) are among the most common conventional biosolids treatment technologies currently in use [2]. Although full-scale TPAD operations are much less common than Composting and thermal stabilization treatment systems, there is currently a lot of interest in TPAD because of its potential to improve the production of methane and destroy volatile solids within a small footprint relative to anaerobic digestion at a single temperature [10].
Composting is a conventional process that utilizes aerobic conditions to enhance the biological degradation of the biosolids organic matter. The biological degradation processes increase the temperature to the pasteurization range, destroy volatile solids, and increase the percent of total solids [11]. Direct Heat Drying can take many forms, but this study focused on the rotary dryer system. During Direct Heat Drying, hot gases are used to remove water from the biosolids, which increases the percentage of total solids to 90–95% [11]. There are numerous TPAD configurations. In this study, we chose to evaluate a two-stage system in which wastewater solids are treated via mesophilic digestion, followed by thermophilic digestion. The combination of mesophilic and thermophilic conditions decreases the solids retention time (SRT) and increases the efficiency of volatile suspended solids (VSS) destruction by 15–20% more than what can be accomplished with a single-stage mesophilic digester [11].
Based on the NEBRA study [2], the most common biosolids treatment process that falls in the LCLT category is long-term storage (also known as Lagoon Storage). Lagoon Storage holds biosolids for one or more years and allows the organic matter to decompose under a combination of aerobic and anaerobic conditions. This study specifically focused on a high solids sludge processing train (HSSPT) Lagoon Storage, where mechanical dewatering of biosolids occurs before being placed in the lagoons. In this study, we examined long-term Lagoon Storage coupled with Air Drying (hereafter referred to simply as Lagoon Storage) because this treatment process has been successfully utilized for many years by the Metropolitan Water Reclamation District of Greater Chicago at their Calumet and Stickney WRRFs [12]. After removing biosolids from the lagoons, the biosolids are placed on Air-Drying pads for ten weeks. In that time, the percentage of total solids reaches 60% [8]. Air Drying is an LCLT process in which biosolids are placed on impervious or porous sand surfaces in windrows or spread in layers and dried to 50–70% total solids [8]. It was included as a standalone Class A biosolids treatment process for evaluation in this study because it is being implemented at a number of WRRFs, and therefore, there are available data on full-scale Air-Drying operations. In Air Drying, the evaporation of water and the degradation of organic solids occurs when mixing creates an aerobic environment. In this study, it was assumed that biosolids are dried in windrows on an impervious surface.
The five stabilization processes included in this study were also selected because they each incorporate three to five chemical, physical, or biological stressors that contribute to the destruction of pathogenic bacteria, viruses, protozoa, and helminths. Treatment processes that incorporate multiple stressors are more likely to achieve consistent pathogen destruction under a wide range of conditions.

2.2. Life Cycle Input and Output Data for Each Biosolids Production Process

Tables of inputs and outputs were created for each process to facilitate the LCA. Detailed calculations and embedded assumptions are shown in the Supplemental Information, but the most critical features of each process are described below in the text and accompanying tables for each biosolids process. Unless otherwise noted, all input data are modeled using ecoprofiles from the Ecoinvent version 3 database that is available within the SimaPro LCA modeling software version 9.3 [13]. The US average electricity mix used within the Ecoinvent profiles was updated according to the most recent electricity grid mix available from the U.S. EPA eGrid database [14].
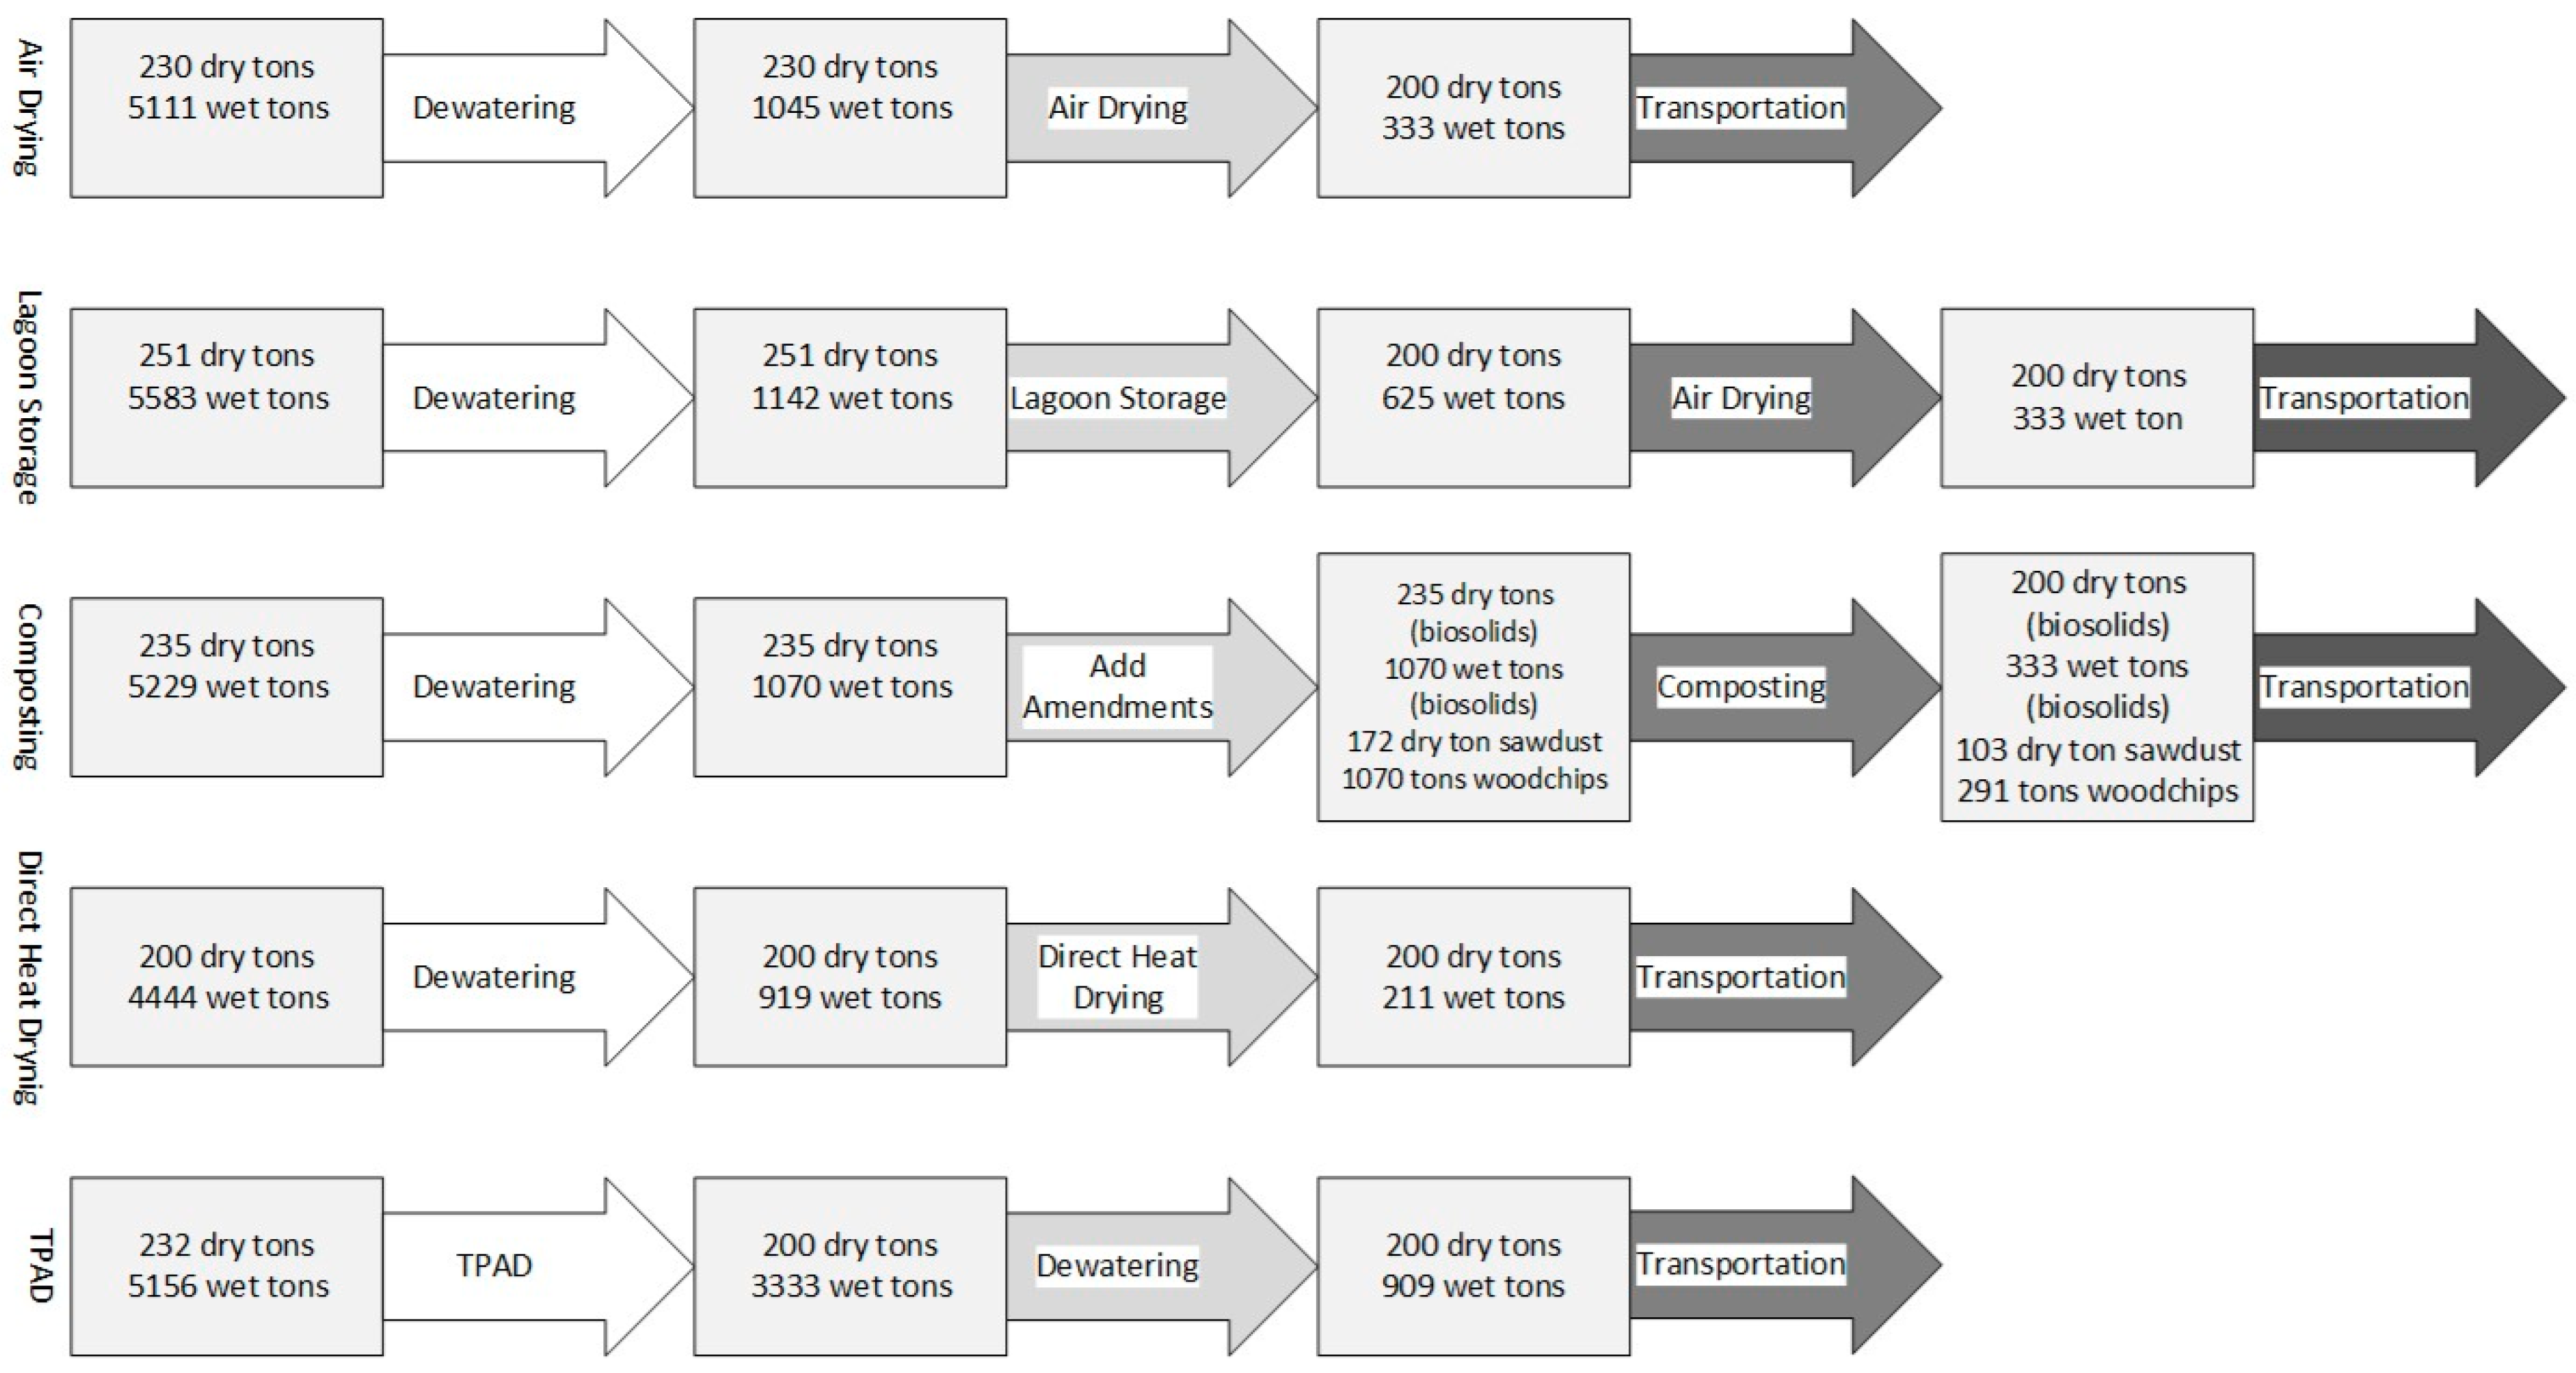
Importantly, each process assumes a slightly different mass flow of material through the process to generate the common functional unit of 200 dry tons of Class A biosolids produced per year (Figure 2). Varying amounts of material are needed to produce the same amount of biosolids because of the differences in volatile solids destruction achieved by the various treatment trains and the addition of a carbon source and bulking agent amendments in the Composting process (Figure 2).

2.2.1. Air Drying

The inputs and outputs for Air Drying are summarized in Table 1. Air Drying begins with a belt filter press (Figure 1), which increases the biosolids to 22% total solids (Figure 2). The belt filter press requires the addition of a water-soluble polymer to increase the performance of mechanical dewatering by flocculating suspended solids and colloidal material [11]. The most commonly used polymers in mechanical dewatering are cationic polyacrylamide (PAM) polymers. Acrylonitrile was chosen to represent PAM within the Ecoinvent database because it is used to manufacture acrylamide [15]. The amount of electricity required for dewatering was determined from the empirical relationship outlined in [16].
There are three sources of wastewater from a belt filter press that must be treated: (1) water for cleaning the belt, (2) water to dilute the dry polymer to 0.5%, and (3) water removed from biosolids. The LCA includes the inputs associated with the treatment of this wastewater within a small WRRF.
Diesel fuel is needed to transport biosolids from the belt filter press to the Air-Drying pad in a dump truck, form windrows with a front-end loader, and mix the windrows each week. To calculate the amount of diesel fuel needed, it was assumed that the Air-Drying pad is 2000 ft away from the belt filter press. The diesel fuel requirement for the windrow mixing equipment came from [17]. It was assumed that the windrows are mixed once a week using a windrow turner machine. Diesel consumption and combustion from transportation to the Air-Drying pad were estimated using the assumed distance, driving speed, and fuel consumption of the equipment used (Supplemental Information).
The impervious surface used for Air Drying is assumed to be an asphalt mixture of 10% bitumen and 90% gravel. The energy required to pave the pad was estimated using paving equipment data [18]. The quantity of asphalt was determined by calculating the size of the impervious pad needed to accommodate the volume of biosolids in windrows. The assumed depth of asphalt was 0.5 feet. It was assumed that the lifetime of the asphalt pad is 25 years. The environmental impacts of the asphalt pad were distributed equally to all of the biosolids produced within the lifetime of the pad.
Round-trip transportation (100 miles total) to the biosolids land application site was also included as an input within the system boundary for all processes under study to evaluate the effects of the moisture content of the end product and the addition of amendments on transport requirements and ultimate environmental impacts. In fact, the distances that WRRFs must transport biosolids varies widely. For example, the Portage Lake Water & Sewage Authority WRRF in Houghton, Michigan, transports biosolids to a maximum of approximately 10 miles one way to a land application site. In comparison, utilities in California generally transport biosolids hundreds of miles to Arizona, Nevada, and Oregon [19] to be applied to land, become landfilled, or become composted. To examine the impact of these variations in transportation distances on the LCA results, a sensitivity analysis was conducted using 0, 20, 100, 200, and 400 miles as round-trip transport distances.
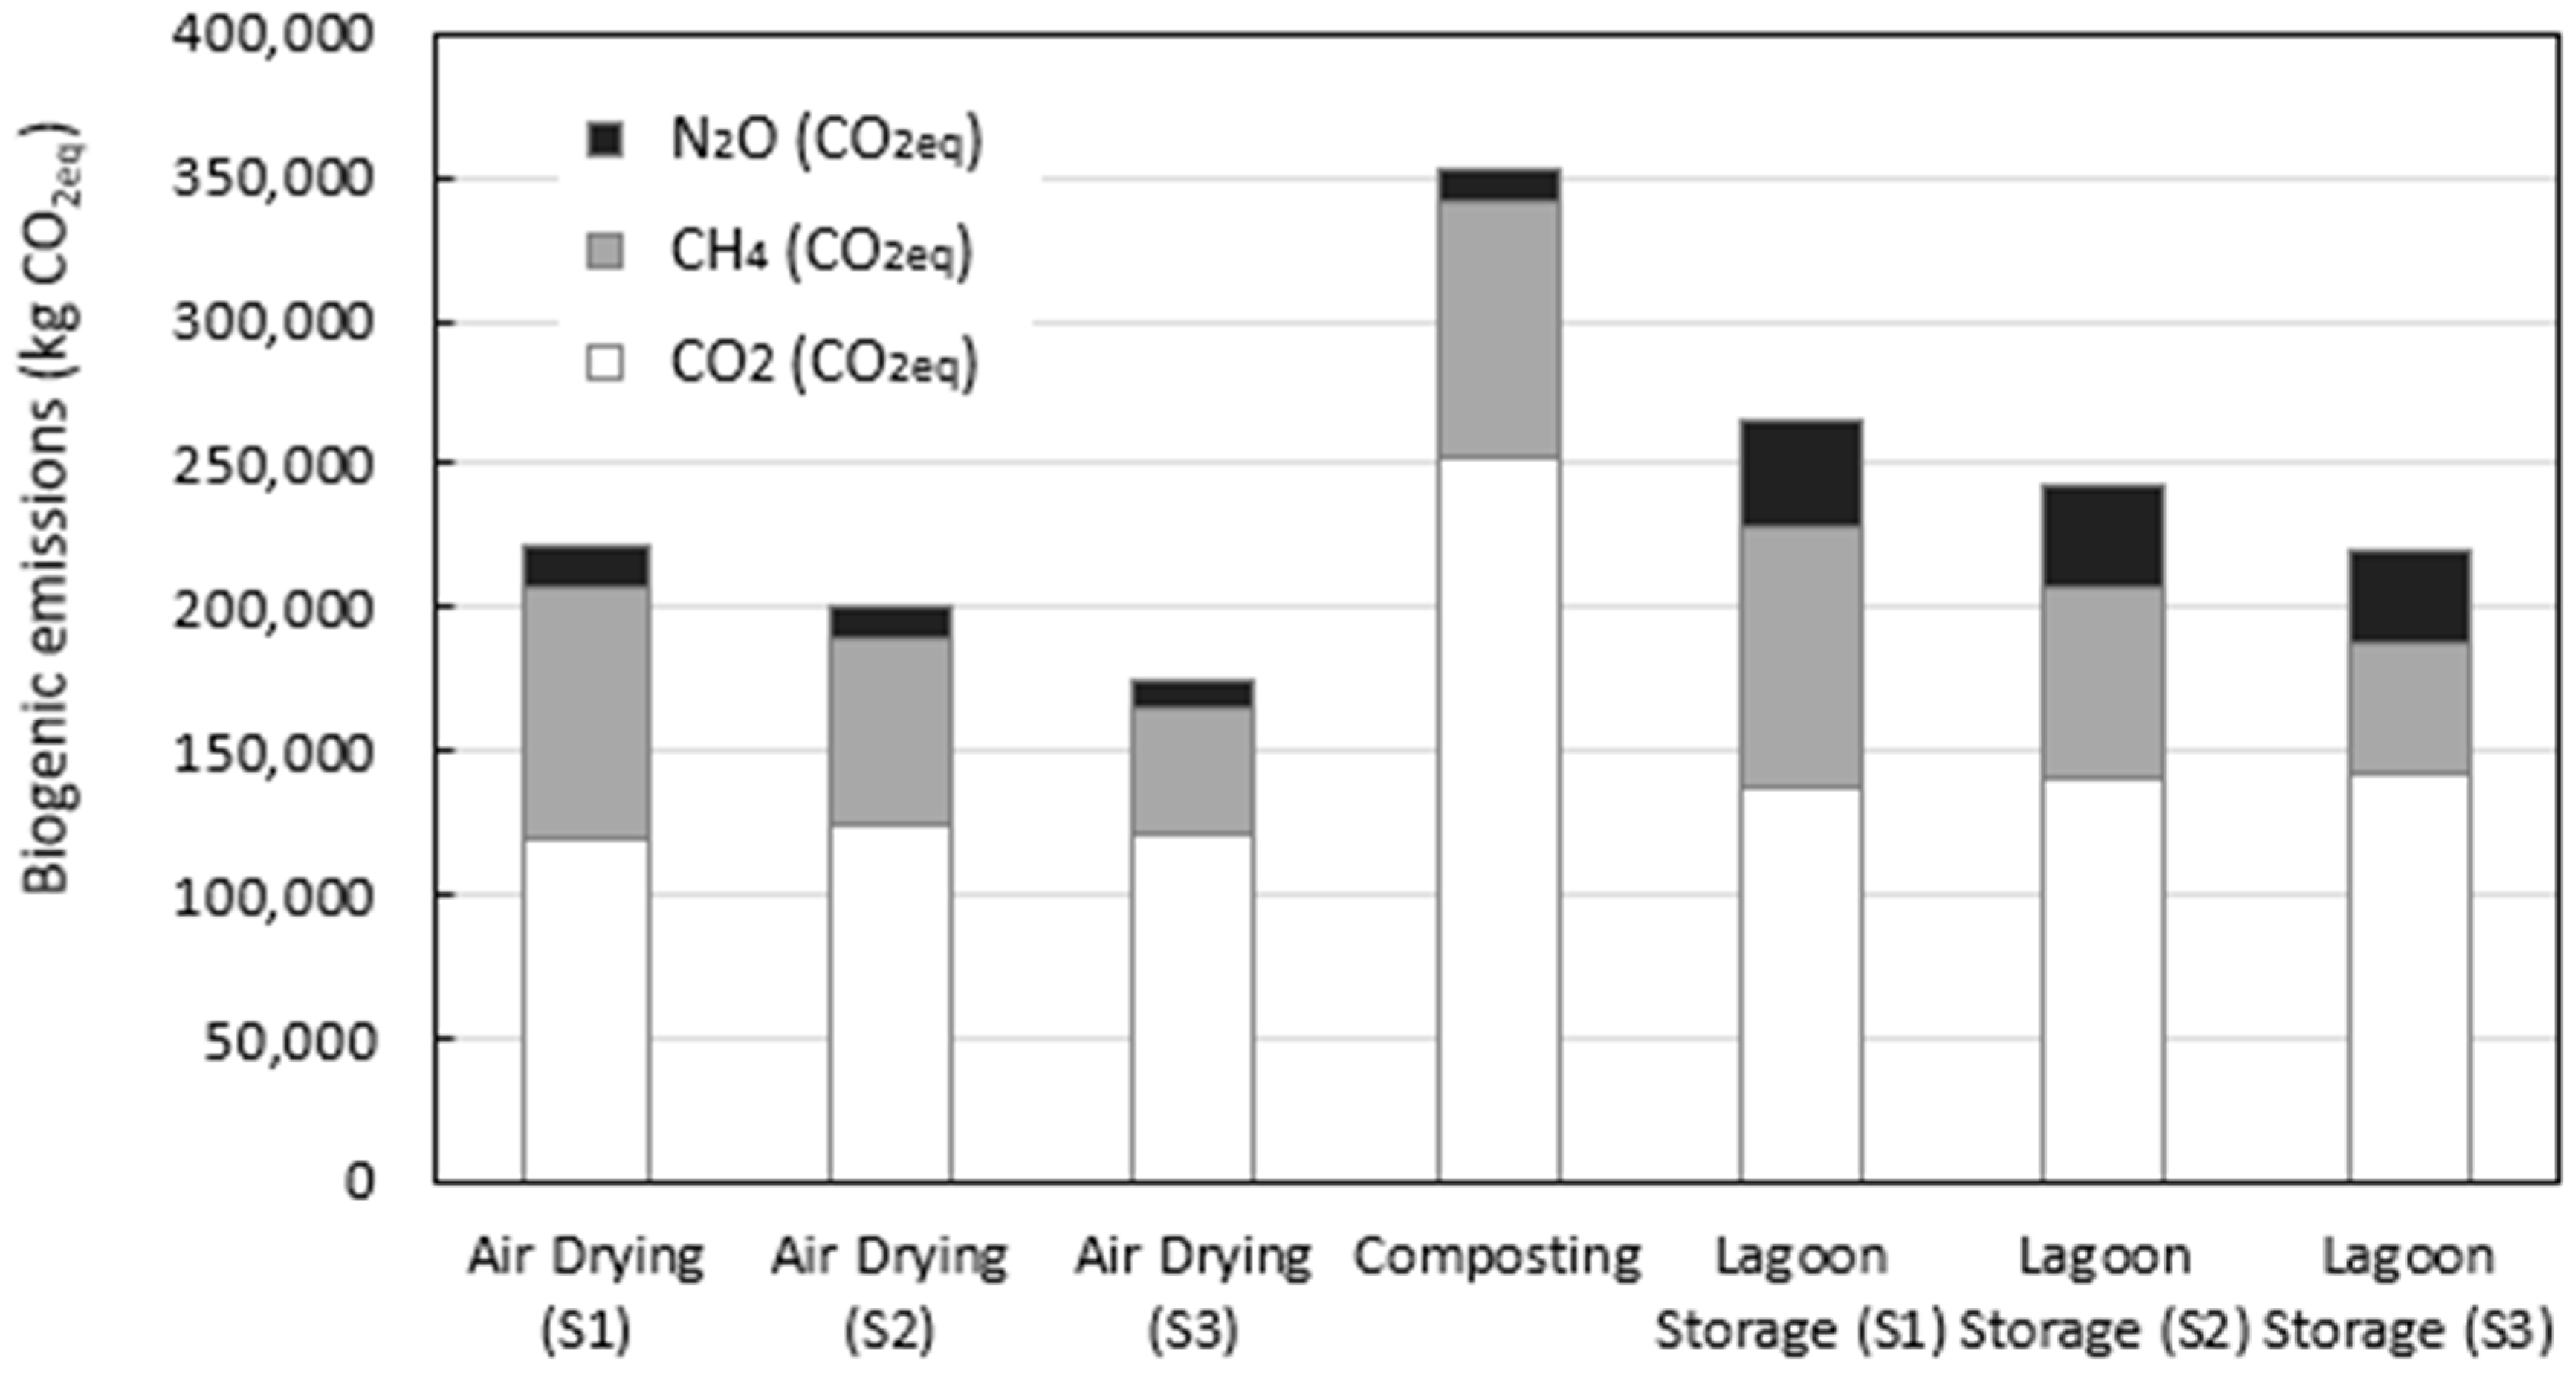
The output emissions from the Air-Drying process are listed in Table 1. There is little available information on the biogenic emissions from Air Drying. Therefore, a sensitivity analysis was conducted to illustrate the impacts of the uncertainty in these key emissions data. For the sensitivity analysis, the percentage of the initial biosolids carbon emitted as methane and the percentage of initial biosolids nitrogen emitted as nitrous oxide were varied in three scenarios. For the baseline case (Scenario 1), the percentage of initial carbon emitted as methane (3.8%) and the percentage of initial nitrogen emitted as nitrous oxide (0.87%) were selected to simulate a relatively inefficient aerobic process based on the findings of Yamulki [20], who studied how CH4 and N2O emissions can change in response to shifting C:N ratios in composted manure piles (Table 2). Compared to Composting, the Air-Drying process has a lower C/N ratio and less aeration due to less mixing. The C/N ratio for digested solids is 15.7, and the percentage of nitrogen is 1.88% [21]. A small C/N ratio results in higher emissions of CH4 and N2O [22]. At the other extreme, Scenario 3 assumed the same emissions as those generated by the Composting process (discussed below) to simulate a case in which significant aerobic activity is occurring in the Air-Drying pile. In Scenario 3, 1.9% of initial carbon was emitted as methane, and 0.6% of initial N was emitted as N2O. Finally, Scenario 2 represents an intermediate case between Scenario 1 and Scenario 3, where 2.85% of the initial carbon was emitted as methane and 0.74% of the initial N was emitted as N2O.

2.2.2. Lagoon Storage

The inputs and outputs for Lagoon Storage are presented in Table 3. In the Lagoon Storage case, mechanical dewatering with a belt filter press occurs first (Figure 1), which includes similar inputs and outputs as the Air-Drying scenario: dewatering electricity, polymer and water, and the wastewater to be treated. The slight differences in inputs are a result of different amounts of solids at this beginning stage in the process. After dewatering, it is assumed that the biosolids (22% total solids content) are transported by a diesel-powered dump truck 2000 feet to the lagoons. The dump truck places the biosolids next to the lagoons, where a front-end loader then distributes the biosolids in the lagoon.
The lagoons were assumed to be constructed using clay and a 40 mil. High-density polyethylene (HDPE) liner. The quantities of clay and HDPE were determined by sizing the lagoons based on the volume of biosolids requiring storage. The lagoon was assumed to have a clay layer with a thickness of 0.5 feet, a biosolids depth of 5 feet, and a freeboard (additional wall height) of 2 feet. The soil excavated for the lagoons was assumed to have a useful purpose on the site, such as building berms, so no off-site soil transportation was included. After two years of storage, the biosolids were removed using a front-end loader and transported 500 feet to the Air-Drying pad. Once at the pad, the biosolids were formed into small windrows and mixed periodically for about ten weeks. The biosolids were then transported to their final destination. The quantity of diesel fuel used in the process was estimated using the assumed distances, use time, and the equipment manufacturers’ information.
With respect to outputs from the process, the biogenic emissions from the lagoons were estimated based on a study that examined the emissions produced by rectangular stockpiles of biosolids [23] along with the assumed quantities of biosolids and lagoon storage times. The one- to three-year-old lagoon emissions rates (CO2 flux = 3.92 kg CO2 eq/m2 month, CH4 flux = 0.8 kg CO2 eq/m2 month, and N2O flux = 3.75 kg CO2 eq/m2 month) reported by Majumder et al. [23] were used to represent half of the first year of storage, the second year of storage, and the two months used for removing the biosolids from the lagoons. The <1-year-old lagoon emissions (CO2 flux = 2.75 kg CO2 eq/m2 month, CH4 flux = 0.1 kg CO2 eq/m2 month, and N2O flux = 5.55 kg CO2 eq/m2 month) reported in [23] were used to represent the lagoon during six months of filling time and half of the first year of storage. However, it is important to note that the treatment process preceding the long-term storage of biosolids in Majumder et al.’s [23] article is different from the process being modeled in this study. The WRRF in the comparison study [23] placed the biosolids on Air-Drying pans first rather than putting them into a lagoon. The Air-Drying process allows the biosolids to lose carbon, nitrogen, and moisture, which may cause the reported emission rates in the comparison study to under-represent the values that might be expected to occur in our case. Nevertheless, despite these differences in study conditions, these data are the best currently available for emissions during Lagoon Storage.
To produce 200 dry tons of final biosolids each year, a WRRF requires four lagoons and an Air-Drying pad, as illustrated in the Supplemental Information. Having four lagoons optimizes the process by allowing for the continuous production of Class A biosolids: there is one lagoon in the filling phase with dewatered biosolids being continually added for six to nine months; two lagoons are in the un-fed storage phase for a total of two years; and there is one lagoon from which the biosolids are being removed over a two-month period. Once removed from the lagoon, the biosolids are placed on an Air-Drying pad for ten weeks. The emissions from all four stages must be included in the LCA to simulate two years of biosolids processing in this scenario. The use of front-end loaders for loading and removing biosolids from a lagoon is generally discouraged because they can damage the lagoon liners. However, the use of smaller-scale technology is more consistent with this study’s focus on smaller municipalities. Thus, it was assumed that a front-end loader was used when estimating the energy consumption for biosolids removal.
The Air-Drying component of the Lagoon Storage process has inputs and outputs similar to those discussed above for Air Drying as a stand-alone operation. The distance from the lagoon to the Air-Drying pad was assumed to be 500 feet. The size of the pad is different than that used for Air Drying alone because the moisture content after Lagoon Storage is lower, but the biogenic emissions factors are assumed to be the same as those for the Air-Drying process. The transportation of the final product includes 200 dry tons of biosolids at 60% total solids.

2.2.3. Composting

As with other processes, the Composting process (Table 4) begins with mechanical dewatering using a belt filter (Figure 1). The composted biosolids are transported via dump truck to the Composting pad. Composting is similar to Air Drying regarding the formation of windrows on an impervious surface. However, Composting utilizes both nutrient and structural amendments to increase the biosolids C/N ratio and to increase the stability of the windrows, respectively. Sawdust is added to the biosolids to increase the C/N ratio to 30 from a typical value of 15.7 [24]. Woodchips were added as a bulking agent to allow for bigger, more stable windrows and increased aeration. The woodchips are added at a 2:1 volume ratio to biosolids [25]. It is assumed that woodchips are strictly a structural amendment and do not contribute any nutrients to the Composting process.
The Composting asphalt pad is assumed to be constructed using the same mixture as the Air Drying pad’s impervious surface, but a smaller quantity of pad construction material is required for Composting because the Composting windrows are double the height and thus have a smaller footprint compared to the Air-Drying windrows. A front-end loader is used to mix the biosolids and amendments and form windrows. After being formed into windrows, the compost is turned three times per week using a mechanical turner for 21 days and then cured in place for an additional 30 days. The cured compost is processed using a trommel screen, which is powered by electricity [17]. The screen removes 70% of the woodchips, which are reused in subsequent cycles [24]. A front-end loader is required to move and mix the amendments and biosolids and to move the compost to the trommel screen.
The final input is the transportation of the final product, which includes more than 200 dry tons of biosolids at 60% solids (Figure 2), 30% of woodchips that were not screened out, and the added sawdust. It is assumed that the volume of sawdust, like that of biosolids [11], decreases by 40% during Composting.
With respect to outputs, the biogenic emissions are calculated using values in the literature. Specifically, it is assumed that nitrogen is reduced by 33% [26], with 0.6% of the initial nitrogen released as nitrous oxide [27]. It is assumed that the remaining amount of lost nitrogen is released in the form of ammonia. The carbon content is assumed to be reduced by 57%, with 1.9% of the initial carbon being released as methane [27]. Detailed calculations are provided in the Supplemental Information. The production and management of leachate has been neglected in this work, as it is likely to be highly site-specific based on local climatic conditions. Some analyses indicate that the organic compounds contained in compost leachate are moderately to highly resistant to microbial degradation [28], but this may require additional study.

2.2.4. Direct Heat Drying

The inputs and outputs for Direct Heat Drying are summarized in Table 5. The Direct Heat Drying process begins with dewatering biosolids with a belt filter before moving the biosolids to a natural gas-powered rotary dryer (Figure 1). The energy needed by the dryer is estimated at 1400 to 1700 BTU per pound of water evaporated [29]. It is possible to use other fuel sources, such as biogas from digesters and woodchips. If biogas is used, the environmental impacts are likely to decrease, but the biogas may already be used on site for some other purpose, which would need to be accounted for. The final biosolids product contains 95% solids, which reduces the transportation input relative to treatment processes that result in a product with a higher moisture content. It is assumed that no destruction of volatile solids occurs in the rotary dryer.

2.2.5. TPAD

Inputs and outputs for the TPAD process are summarized in Table 6. TPAD is a multistage process that can be arranged with mesophilic digestion followed by thermophilic digestion or thermophilic digestion followed by mesophilic digestion. By assuming that the process is mesophilic followed by thermophilic for this study (Figure 1), the system boundary only includes the thermophilic digestion stage. In this way, it is consistent with the other processes, which exclude the mesophilic anaerobic digestion process from the system boundaries. TPAD includes mechanical dewatering; however, unlike the other processes, dewatering follows TPAD treatment. Nevertheless, the inputs of mechanical dewatering are similar to those for the other processes. The biosolids produced contain 22% of solids, which is relatively low and increases transportation requirements compared to the other processes in the study (Figure 2).
Other TPAD inputs include electricity, which is necessary for pumping and mixing the thermophilic digester, and heat, which is required to heat the digester to the thermophilic temperature range. Consistent with previous LCAs focusing on anaerobic digestion, it was assumed that the biogas produced from the digestion is sufficient for heating the digester [30]. The gas released to the atmosphere after biogas combustion is assumed to be 99% carbon dioxide.

2.3. Impact Assessment

Life cycle modeling in this study was performed using the LCA software SimaPro (PRé Consultants, version 8.0.3.14). The IMPACT 2002+ method [31] was utilized to characterize the environmental impacts across multiple indicators, but the method was also modified to better represent the goal of the study. Specifically, the global warming potentials (GWP) used in IMPACT 2002+ are the 500-year time horizon GWPs from the Intergovernmental Panel on Climate Change (IPCC). This time frame may be appropriate for certain decisions; however, due to this study’s focus on more immediate decisions that can affect sustainability, a shorter time horizon was deemed more appropriate. Therefore, the GWPs were modified to include the 100-year time horizon GWP reported by the IPCC’s Fifth Assessment Report. As a result, the GWP for methane increased from 10.35 to 28, and the GWP for nitrous oxide increased from 156 to 256 when switching from 500-year to 100-year time horizon GWPs [32].

3. Results and Discussion

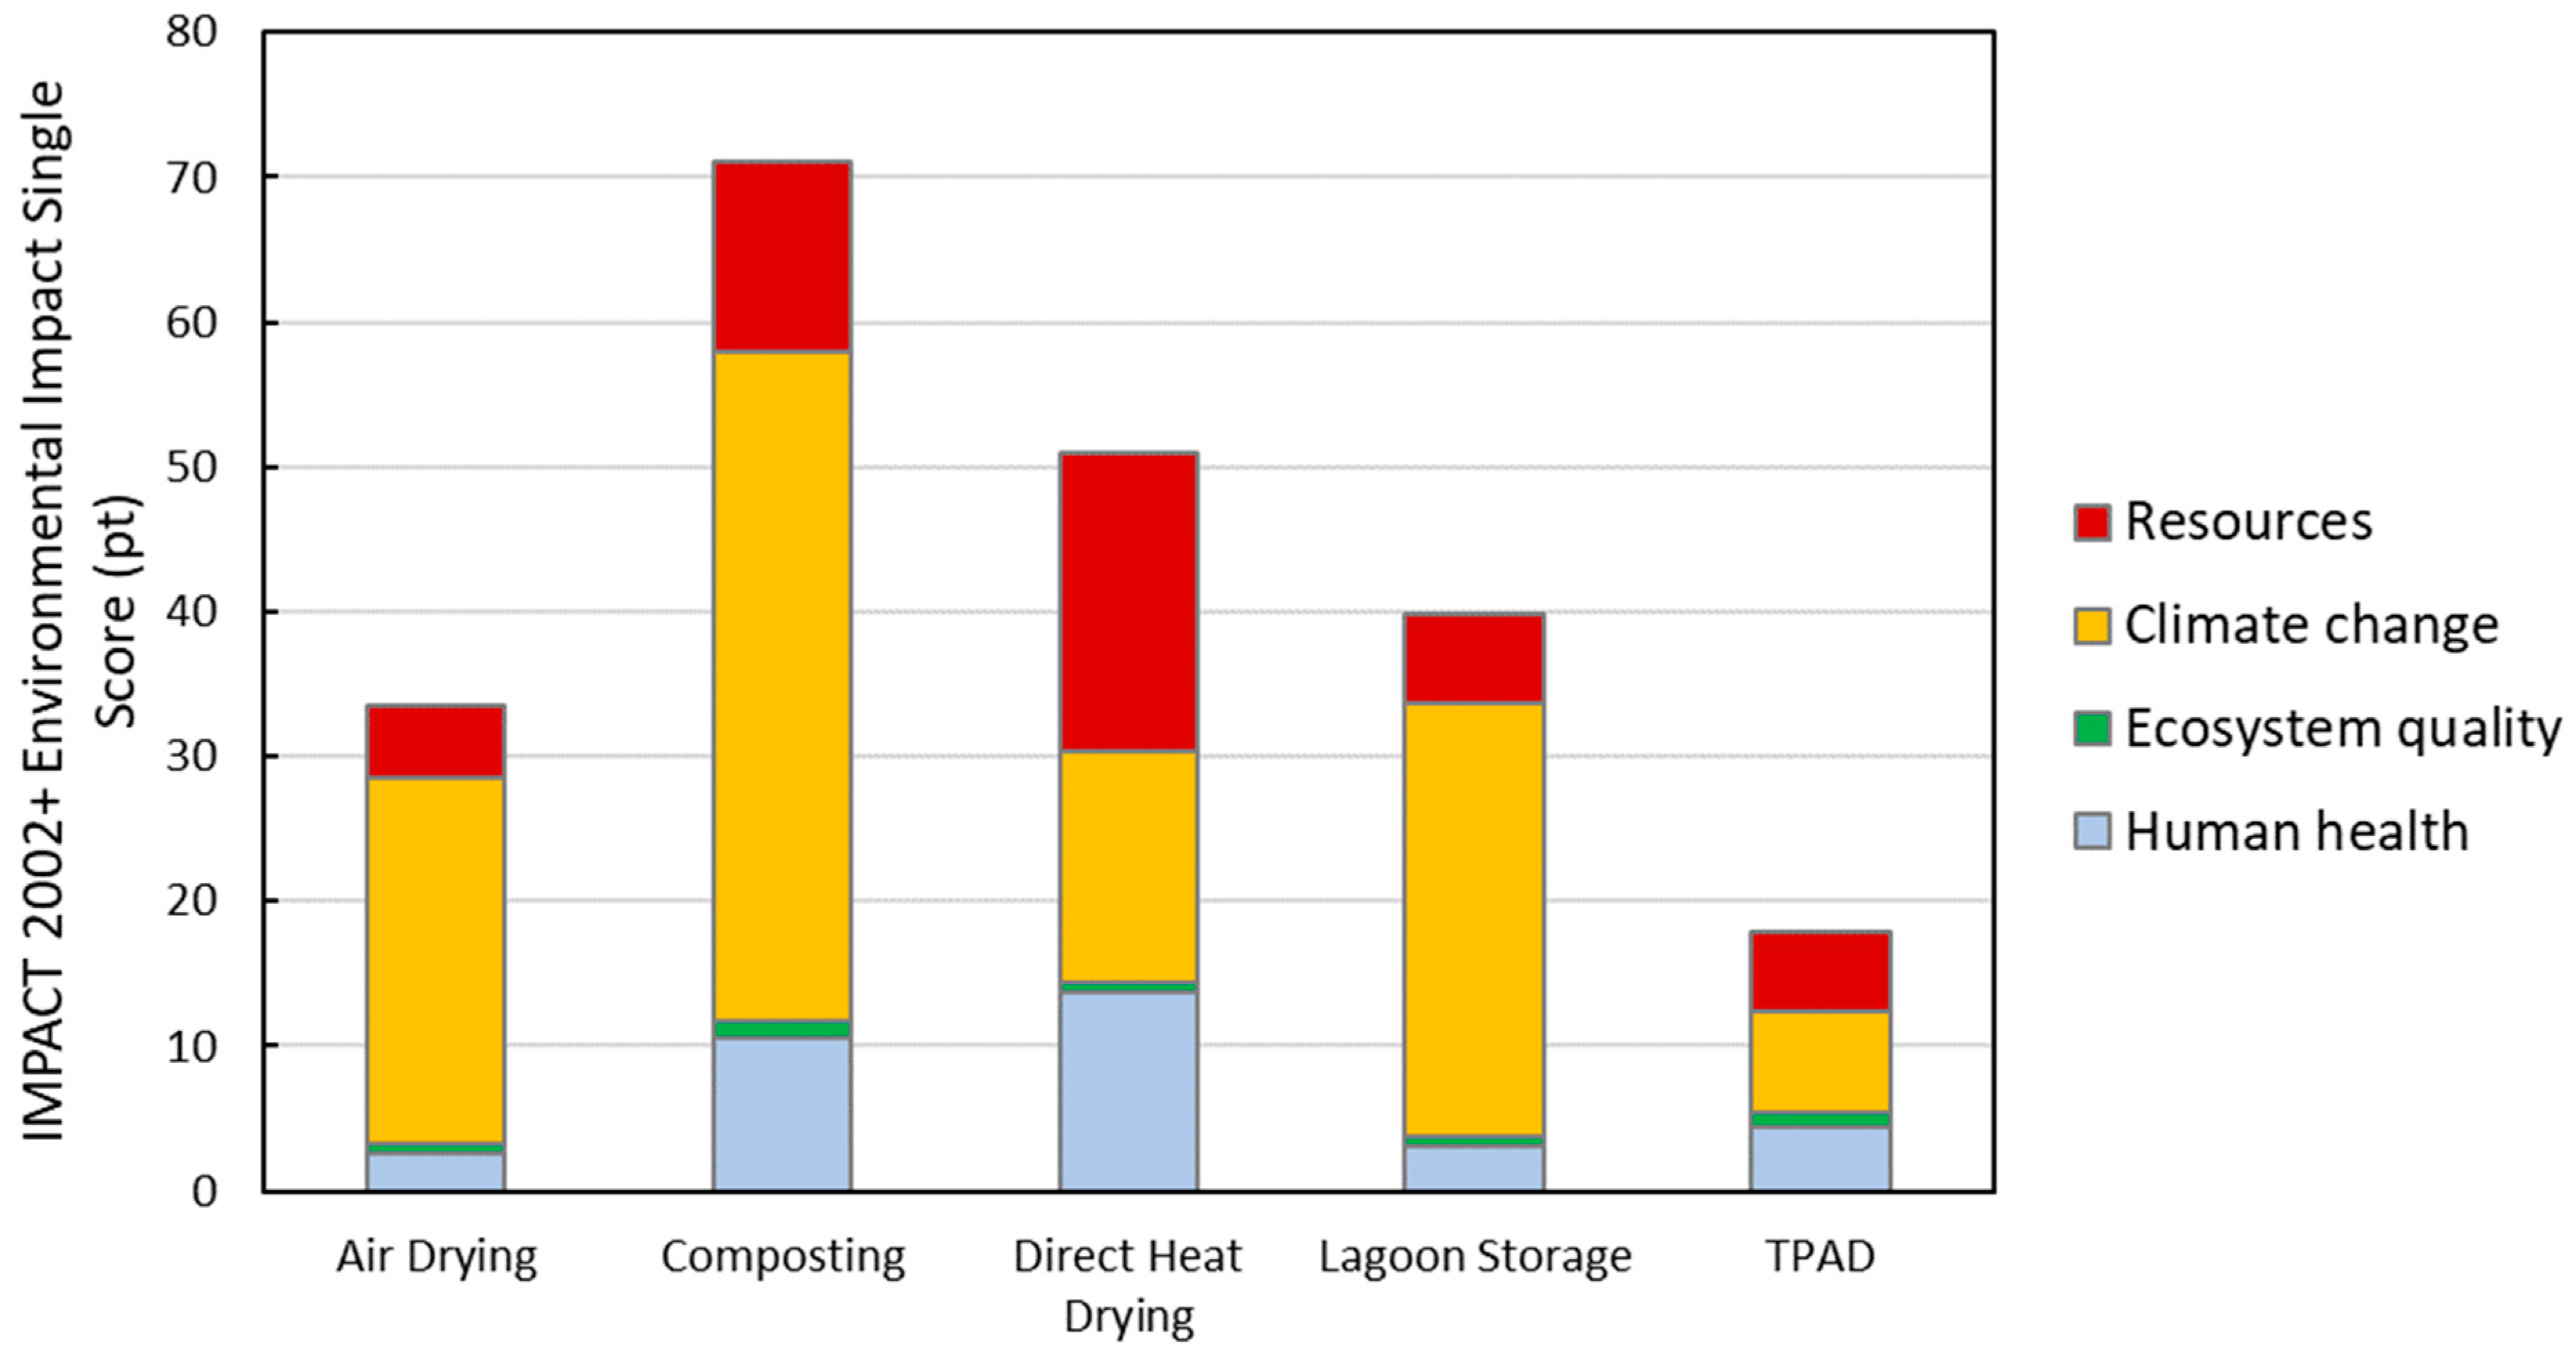
The environmental impacts presented for each process are the sum of the four damage categories used within IMPACT 2002+: resources (non-renewable energy and extracted minerals), climate change, ecosystem quality, and human health, expressed as dimensionless unit points (pt.). Of these categories (Figure 3), climate change was the largest contributor to the overall combined environmental impact score for each of the processes, except Direct Heat Drying, for which resource use (primarily natural gas) was the biggest contributor to the overall environmental impact. On the other extreme, the ecosystem quality damage category contributed minimally to the overall environmental impact of all processes. Comparing the environmental impacts results between processes (Figure 3), Composting had the greatest environmental impacts at 71.1 pt., followed by Direct Heat Drying and Lagoon Storage at 50.9 pt. and 39.8 pt., respectively. TPAD had the lowest overall environmental impact score of all of the processes (18.0 pt.), followed by Air Drying (33.5 pt.). Detailed analyses of these scores are provided below.

3.1. Air Drying Results

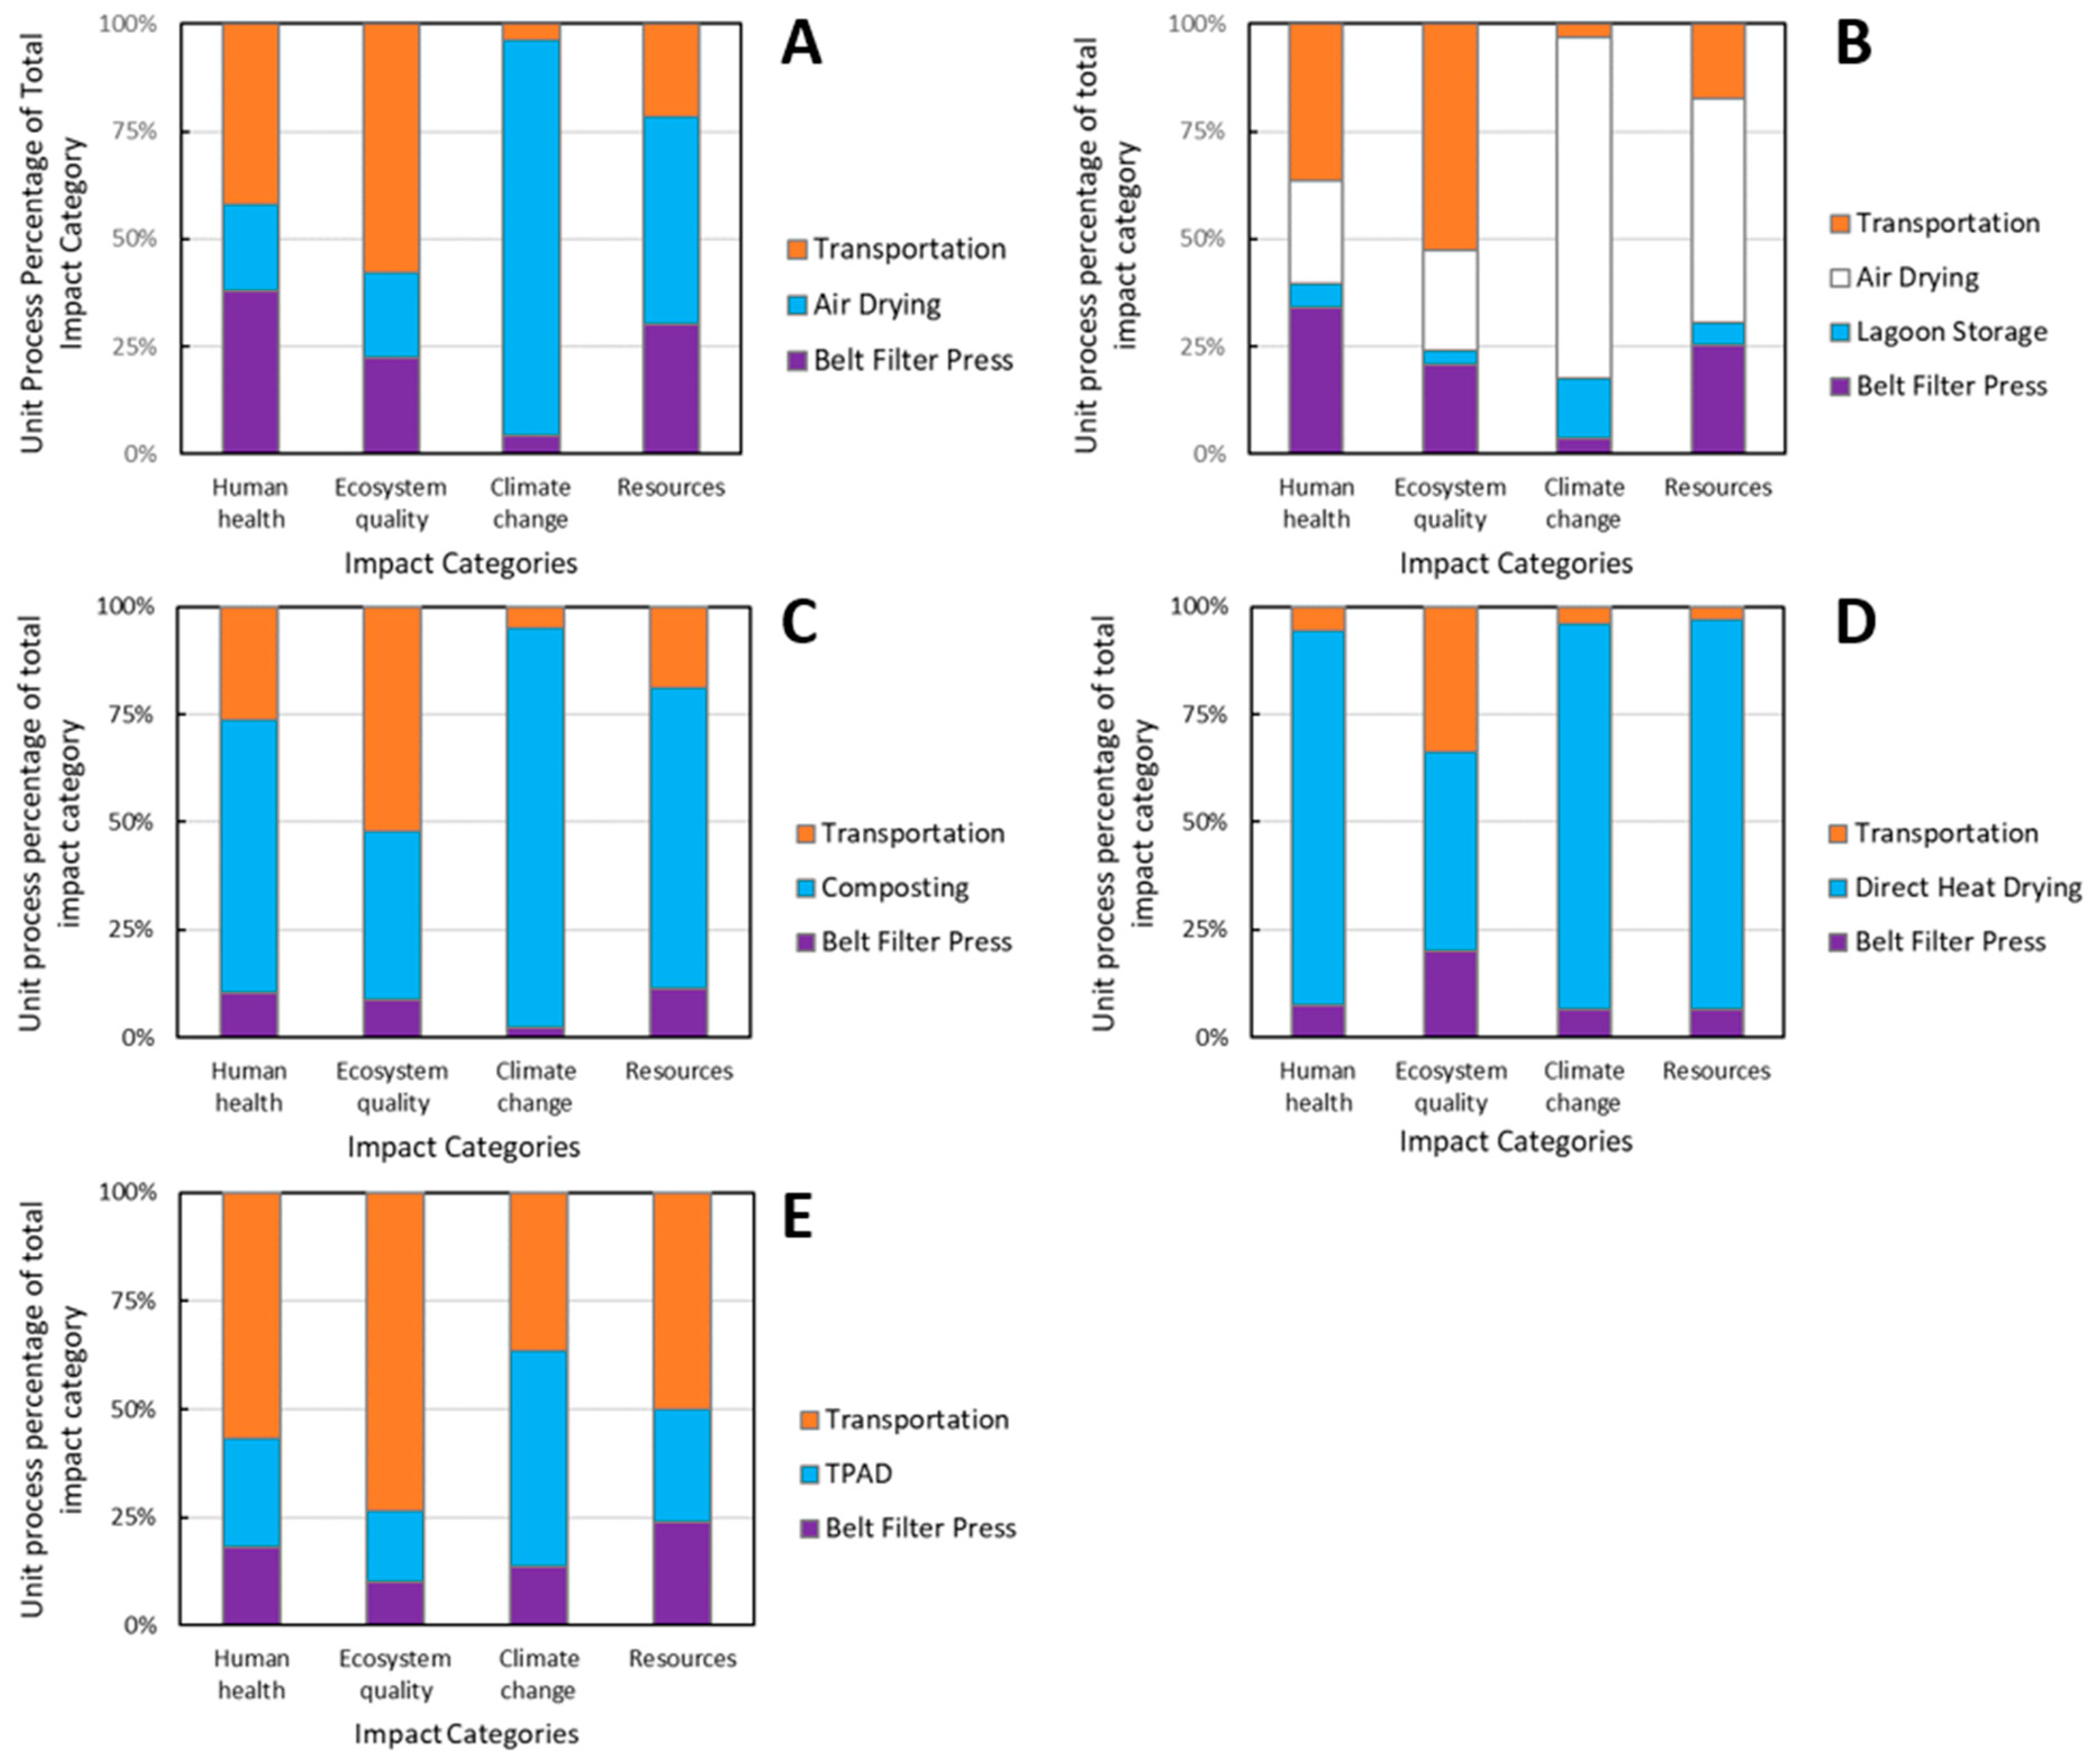
The majority of the environmental impacts for Air Drying are in the climate change category, as shown in Figure 3. The scores for each of the damage categories produced by individual unit processes in the Air-Drying treatment train (dewatering, air drying, and transportation) are displayed in Figure 4A. Clearly, the Air-Drying step itself, which includes placing biosolids in windrows and turning them once a week, contributes the most to the climate change and resources impact categories. The biogenic emissions of carbon dioxide and methane account for roughly 90% of the impacts in the climate change category. In comparison, transportation contributes the most to the impacts in the human health and ecosystem quality categories.
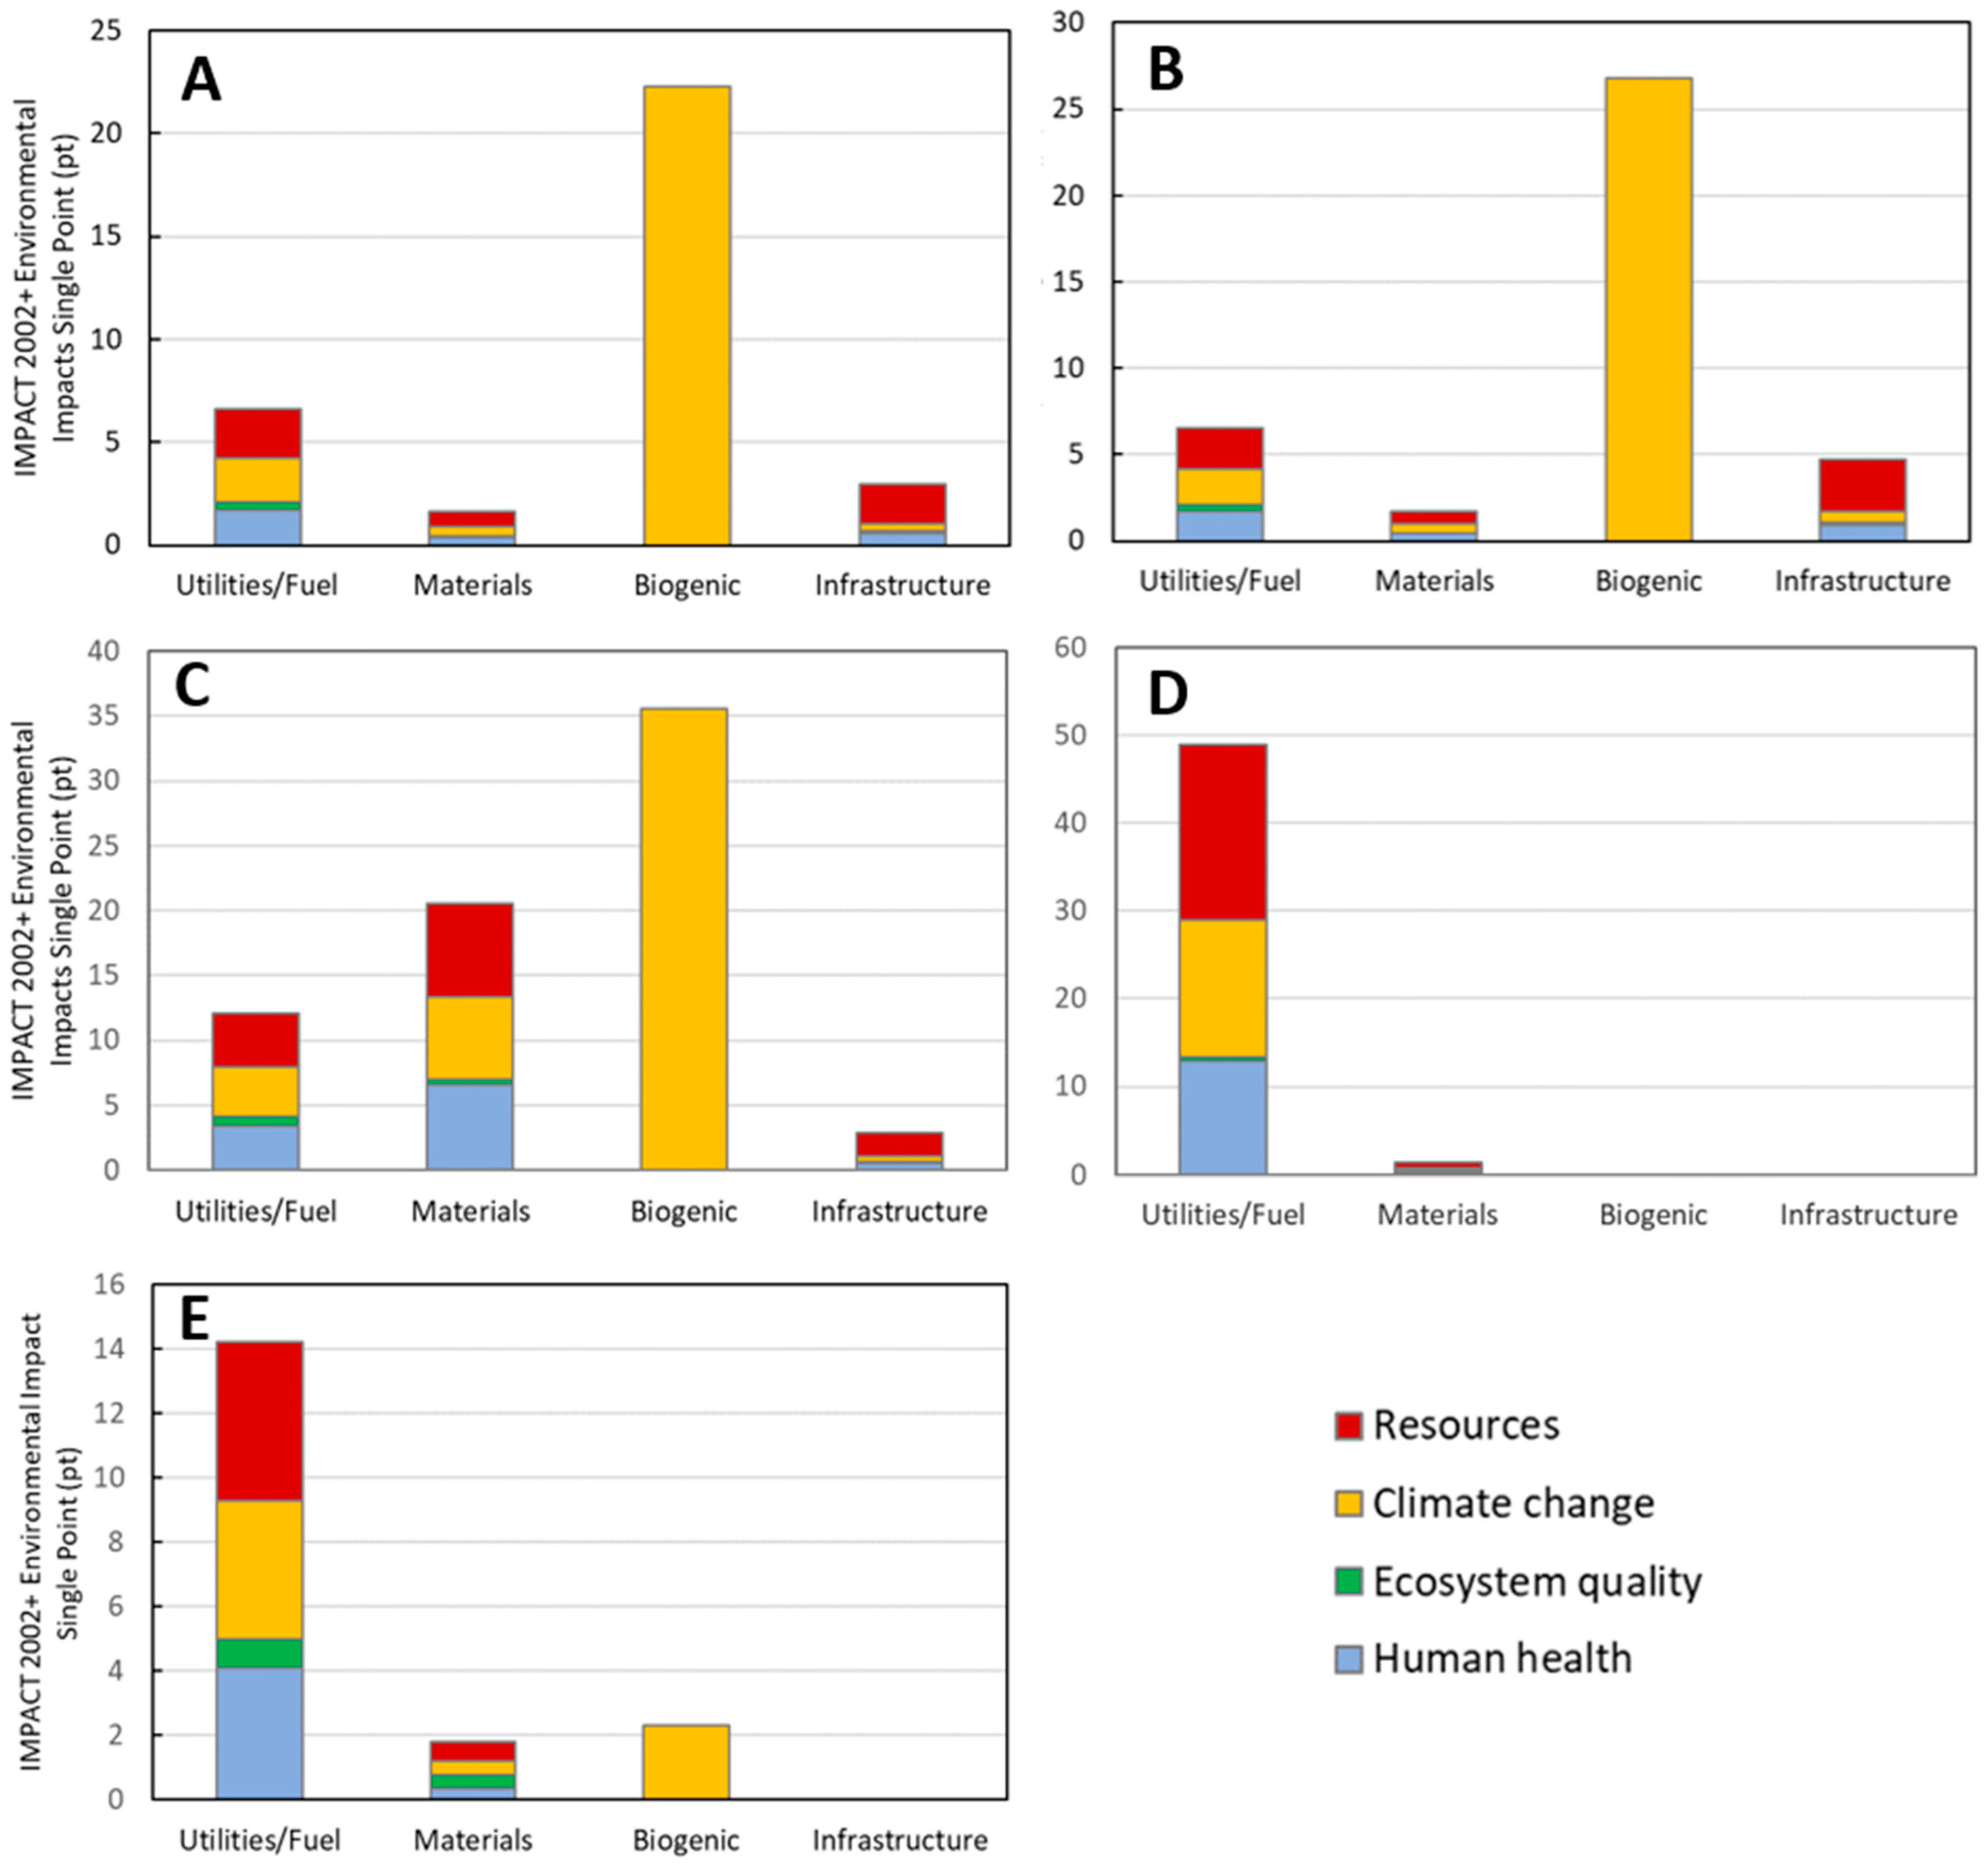
The environmental impacts of Air Drying in Figure 3 are further categorized in terms of their sources (utilities/fuel, materials, biogenic emissions, and infrastructure), as shown in Figure 5A. Biogenic emissions account for the majority of impacts for Air Drying, followed by utilities/fuel, which comprises the electricity required for dewatering and the diesel needed for moving and turning biosolids.

Sensitivity Analysis—Biogenic Emissions

As described in Methods, Section 2.2.1, a sensitivity analysis was conducted on the effects of Air Drying emissions on environmental impacts due to the lack of available experimental emissions data. Altering the percentage of initial carbon and nitrogen released as methane and nitrous oxide, respectively, as described above created final environmental impacts that ranged from 33.5 pt. (Scenario 1) to 29.1 pt. (Scenario 3). This range of values would not result in a change in the rankings of the processes in terms of their overall environmental impacts, but it highlights the significance of the contributions of biogenic emissions to the potential impacts of Air Drying and the need for further research in this area to better quantify these emissions. Presumably, altering the percentage of initial carbon and nitrogen released as methane and nitrous oxide would have similar effects on the overall environmental impacts of Lagoon Storage as well, because that process train ends with an Air-Drying stage.

3.2. Lagoon Storage Results

A total of 75% of the environmental impacts associated with Lagoon Storage are in the climate change category, as illustrated in Figure 3. The climate change and environmental impacts in other damage categories associated with dewatering, Lagoon Storage, Air Drying, and transportation operations are presented in Figure 4. As noted for Air Drying as a standalone treatment process, most of the climate change and resources impacts are associated with the Air-Drying step itself, although the Lagoon Storage treatment phase also contributes substantially to climate change impacts. In contrast, transportation contributes the most to the human health and ecosystem quality impact categories.
The sources of the environmental impacts associated with Lagoon Storage are shown in Figure 5B. Biogenic emissions account for the majority of impacts, followed distantly by ‘utilities/fuel’, i.e., the electricity for dewatering and diesel for moving and turning biosolids.

3.3. Composting Results

Roughly 65% of the environmental impacts of Composting are in the climate change category, as shown in Figure 3. Figure 4C displays the score for each of the damage categories associated with individual Composting unit processes (dewatering, composting, and transportation). The Composting process, which includes placing biosolids and amendments in windrows, turning them once a week, and then screening the final product, contributes the most to climate change, human health, and resource damages. The biogenic emissions of carbon dioxide and methane and the use of sawdust account for over 90% of the climate change category impact score. In comparison, transportation contributes the most to ecosystem quality damage.
The sources of Composting’s environmental impacts are shown in Figure 5C. Biogenic emissions account for the majority of impacts, which are high due to the decomposition of added carbon amendments. Because it was assumed that relatively large amounts of sawdust and woodchips would be consumed as composting amendments, the embodied environmental burdens associated with those materials are also substantial for composting. Depending on the specific operations of the municipality, it may be possible to substitute waste wood or other resources for sawdust and/or woodchips, which could decrease the environmental burden associated with composting. Utilities and fuel use are higher in the Composting process than in the similar Air-Drying process due to the increased rate of turning and manipulation of the material in Composting. More biogenic emissions also occur during Composting in comparison to Air Drying because the active aeration and biological amendments added to the Composting windrows increases biological decomposition relative to the more passive Air-Drying operations.

3.4. Direct Heat Drying Results

A substantial fraction (40%) of the environmental impacts associated with Direct Heat Drying fall into the resources category (Figure 3). The Heat-Drying process itself, which includes burning natural gas to produce hot air to dry the biosolids, contributes the most out of the three unit operations (dewatering, heat drying, and transportation) to all four damage categories. Transportation was a smaller contributor to all of the damage categories due to the very high percentage of solids in the end product. The lower water content of the biosolids means there is less mass to transport.
The utilities/fuel category clearly accounts for the majority of the environmental impacts associated with Direct Heat Drying (Figure 5D). The utilities and fuel consumed in Direct Heat Drying include the electricity used in mechanical dewatering, the natural gas used in the rotary dryer, and the fuel required for transportation. The polymer used in mechanical dewatering accounts for a small amount of materials contributing to environmental impacts. A key assumption made in this analysis was that no volatile solids were destroyed during the Direct Heat Drying process (Figure 2) because generally, the temperatures achieved during the Heat Drying of biosolids are not high enough to achieve the oxidation of organic matter [33]. Therefore, in this study, it was also assumed that no biogenic emissions of carbon dioxide, methane, or nitrous oxide occurred during Direct Heat Drying. However, if a dryer were to generate temperatures that are sufficiently high to achieve the oxidation of organic matter, then it would be necessary to account for the environmental impacts of Direct Heat Drying in the climate change damage category. Therefore, the validity of the assumption regarding volatile solids destruction and biogenic emissions should be evaluated for each Heat Drying operation.

3.5. TPAD Results

As noted above, the conventional TPAD technology had the least environmental impacts overall, and these were distributed fairly evenly among the climate change (39%), human heath (25%), and resources (31%) categories (Figure 3). The scores for each of the damage categories associated with the individual TPAD unit processes (dewatering, TPAD, and transportation) are displayed in Figure 4E. The TPAD unit process, which utilizes a thermophilic digester that is heated via the combustion of biogas and electric mixers and pumps, contributes the most to the climate change damage category, whereas transportation is the greatest contributor to the remaining categories. The environmental impacts associated with transportation are substantial for TPAD because the final dewatering step in the overall process produces a biosolids product containing 22% of solids, whereas the other Class A treatment processes generate a final product containing ≥60% of solids.
TPAD’s environmental impacts were analyzed further by examining the sources of the impacts, as shown in Figure 5E. The utilities/fuel category accounts for the majority of the environmental impacts. This includes the electricity used in mechanical dewatering and in TPAD for mixing and pumping, as well as the fuel used in transportation. The small environmental impact associated with materials is a result of the polymer used in mechanical dewatering.

3.6. Transportation Sensitivity Analysis

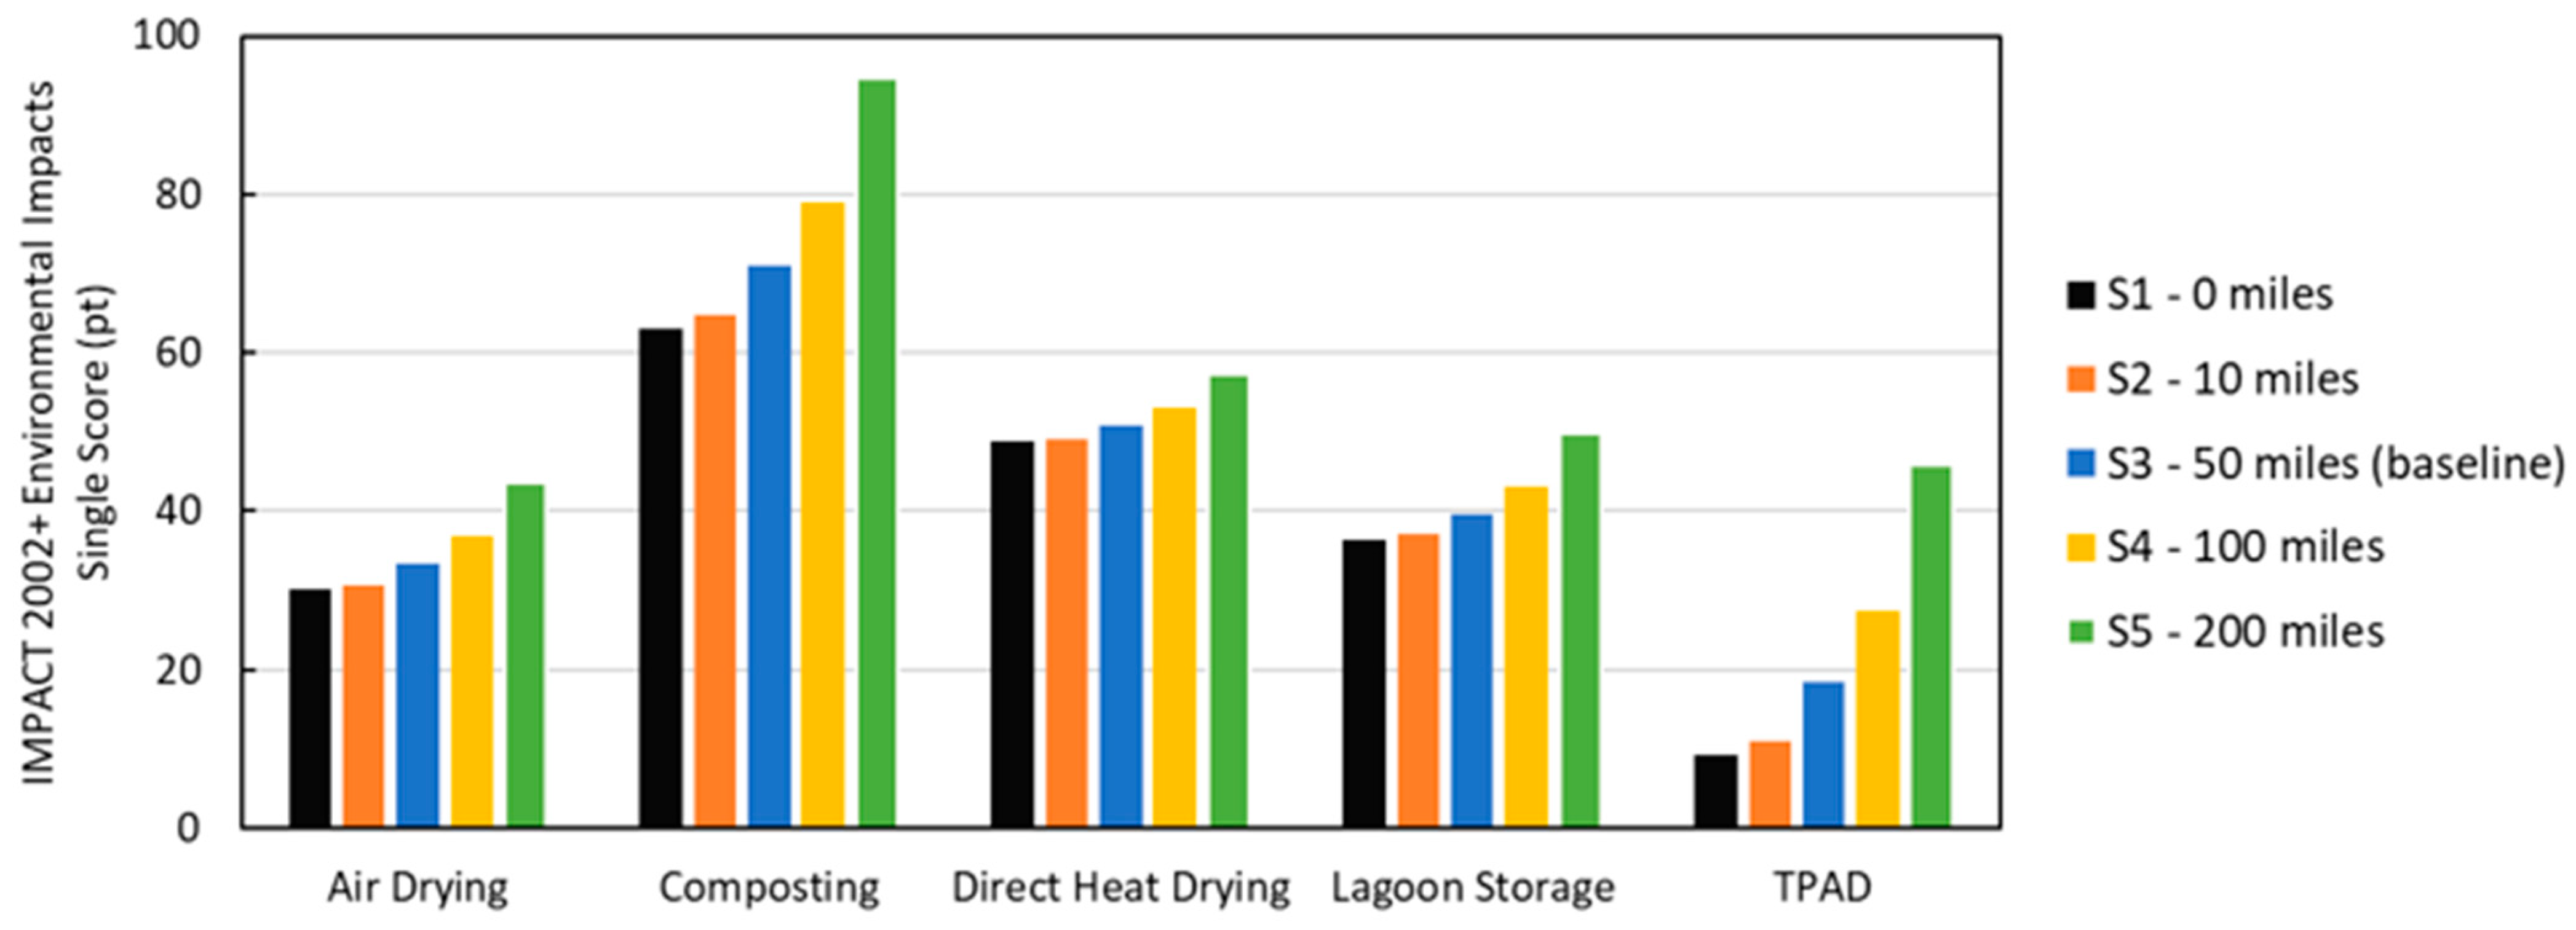
As illustrated in the discussion above, the transportation of Class A biosolids can have substantial environmental impacts. Five transportation scenarios were considered to illustrate the impacts of biosolids transport. Scenario 1 represents a WRRF that distributes biosolids on-site rather than performing land application, which effectively requires no transportation. Scenario 2 is representative of a rural WRRF in which biosolids can be applied to land within ~10 miles of the utility. In Scenario 3, biosolids land application sites are ~50 miles from treatment utilities. This situation is the baseline included in the analyses above and may apply to utilities located in smaller cities or suburban locations in states where Class A biosolids application is allowed. Scenarios 4 (100 miles) and 5 (200 miles) are representative of WRRFs that have to transport their biosolids out of state, such as in California. In accounting for transportation impacts, both the mass of the final Class A product and the transport distance affect the environmental impacts. The cumulative environmental impacts for the five biosolids transportation distances are summarized for the five treatment processes and shown in Figure 6.
Direct Heat Drying produces a final biosolids product with a very high percentage of solids. Consequently, varying the transportation distance also has relatively little effect on the environmental impacts of Heat Drying (Figure 6). On the other hand, the biosolids produced by TPAD contain a low percentage of total solids, and the total mass of biosolids that must be transported is relatively high. Accordingly, changing the transportation distance has a substantial effect on the overall environmental impacts of biosolids treatment by TPAD. Interestingly, whereas TPAD has the lowest overall environmental impacts when a one-way travel distance of 10 miles is assumed, the environmental impacts of TPAD exceed those of Air Drying in Scenario 5 (200-mile one-way travel distance). Transportation also has a substantial effect on the environmental impacts of composted biosolids, except that in this case, the additional mass and volume of biosolids that must be transported is not due to moisture. Instead, it is due to the additions of sawdust and woodchips to biosolids during the Composting process and what proportion of those amendments is actually retained in the final biosolids product. For these calculations, it is assumed that the volume of sawdust will be reduced by 40% during composting, and the woodchips are screened out with 70% efficiency.

3.7. Greenhouse Gas Emissions Comparison

There are many factors that affect the composition of the biogenic emissions from the production of Class A biosolids, including oxygen availability, moisture content, the activity of methanotrophic bacteria, and the C/N ratio of the biosolids. Oxygen levels can be increased during Composting by adding a bulking agent to the biosolids and by turning Composting and Air Drying windrows. The resulting increase in oxygen availability leads to greater aerobic and less anaerobic microbiological activity and is thus associated with lower methane emissions and greater carbon dioxide emissions. Methanotrophic bacteria oxidize methane to carbon dioxide using oxygen as an electron acceptor, and their activity is also stimulated by increased oxygen availability [34]. Composting and Air Drying methane emissions are also dependent on the level of moisture present in the windrows because as the windrows dry, a greater percentage of the pore spaces is filled with air rather than water [34]. In addition, Yamulki [20] showed that as the C/N ratio of manure increased, less methane and nitrous oxide were produced.
The estimated composition and quantity of biogenic emissions from Class A biosolids treatment via Air Drying, Composting, and Lagoon Storage are summarized in Figure 7. Air Drying produces more nitrous oxide compared to Composting, presumably because biosolids treated via Air Drying are not amended with a carbon feedstock and thus have a lower C/N ratio compared to biosolids that are amended with sawdust and composted. Methane is present in Air Drying and Composting because the two processes are not completely aerobic [11]. For example, anaerobic conditions may develop within biosolids aggregates. The emissions from Lagoon Storage Plus Air Drying are dominated by the carbon dioxide and methane produced during the Air-Drying stage. This explains why the total emissions and their composition are so similar for Air Drying and Lagoon Storage Plus Air Drying. It should be noted that, in general, there is relatively little information available in the literature on biogenic gas emissions from biosolids during treatment via Air Drying or Lagoon Storage Plus Air Drying. Therefore, data were used from a study [23] in which the operating conditions and parameters were most consistent with the assumptions made in the current study. Even so, there were some key differences between the two studies. First, the comparison study [23] maintained biosolids in stockpiles that were 20 ft to 30 ft deep, while the current study assumed the biosolids were stored in lagoons that are 5 feet deep. Furthermore, in the comparison study, the biosolids were treated sequentially in anaerobic and aerobic lagoons before being air-dried and then stockpiled. Finally, the percentage of solids in the stockpiles used by the comparison study was twice as great as the percentage of solids assumed for Lagoon Storage in this research. Thus, to improve the accuracy of future LCA studies in this area, more data on emissions from biosolids under a wide range of treatment and storage conditions are needed. Unfortunately, obtaining comprehensive emissions data will be challenging given the many environmental and biosolids characteristics (e.g., carbon and nitrogen content, moisture, and temperature) that vary from one WRRF to another and affect the composition of the emissions from Class A biosolids treatment processes.
The results of this study have important implications for stakeholders involved in, and impacted by, decisions about technologies for the treatment and recovery of resources from wastewater [35]. For stakeholders who are concerned about the environmental impacts of WRRFs that are located within <100 miles of biosolids land application sites and have the financial resources needed upfront to cover high capital costs [36], TPAD appears to be the best choice among Class A biosolids treatment technologies. However, for stakeholders engaged with WRRFs that have more limited financial resources but have the workforce needed to maintain a more labor-intensive treatment process, Air Drying is a close second in terms of minimizing the environmental impacts of Class A biosolids treatment. Moreover, Air Drying should be considered by WRRFs that are >100 miles from land application sites because the low moisture content of Class A biosolids products minimizes the negative impacts of transportation on the environment.

4. Conclusions

LCLT processes, such as Air Drying and Lagoon Storage, offer small WRRFs an alternative approach for producing Class A biosolids that are less energy-intensive and costly than conventional PFRP treatment processes. However, the question remains as to whether or not LCLT alternatives are more sustainable in a broader sense than conventional PFRPs. To answer this question, this study used an LCA approach to compare the sustainability of three conventional processes—Composting, Direct Heat Drying, and TPAD—and two LCLT processes—Air Drying and long-term Lagoon Storage—on the basis of their environmental impacts. Composting and Direct Heat Drying had the greatest environmental impacts due to Composting’s biogenic emissions of carbon dioxide, methane, and nitrous oxide and Direct Heat Drying’s natural gas requirements. In comparison, TPAD and Air Drying were the technologies that offered the lowest environmental impacts. An analysis of Air Drying emissions sensitivity showed that small changes in the assumed amount of methane and nitrous oxide emissions can decrease or increase the overall impact by 4 pt., or roughly 12% of the overall impact. A transportation sensitivity analysis showed that TPAD and Composting are especially vulnerable to changing the distance between the WRRF and the land application site.

Supplementary Materials

The following supporting information can be downloaded at https://www.mdpi.com/article/10.3390/app15073482/s1. References [37,38,39,40,41,42,43,44,45,46,47] are cited in the supplementary materials.

Author Contributions

J.L.B. led the data collection and LCA modeling and performed the initial writing. R.M.H. supervised LCA modeling and the interpretation of the results and contributed to writing. J.G.B. and E.A.S. developed the initial study design, provided guidance on data collection, participated in the interpretation of the results, and contributed to writing. All authors have read and agreed to the published version of the manuscript.

Funding

This work was supported by U.S. EPA Grant Number 00E01979 (EPA Environmental Finance Center for the Great Lakes Region (EPA Region 5)).

Institutional Review Board Statement

Not applicable.

Informed Consent Statement

Not applicable.

Data Availability Statement

The data are contained within the article or Supplementary Materials.

Conflicts of Interest

All authors declare that no competing financial interests exist related to this work.

References

  1. Elgarahy, A.M.; Eloffy, M.; Priya, A.; Yogeshwaran, V.; Yang, Z.; Elwakeel, K.Z.; Lopez-Maldonado, E.A. Biosolids management and utilizations: A review. J. Clean. Prod. 2024, 451, 141974. [Google Scholar]
  2. Beecher, N.; Beecher, J.; Burke-Wells, J.; Lono-Batura, M.; Goldstein, N.; Kester, G.; Toffey, W. National Biosolids Data Project: Biosolids management in the U. S. 2022. Available online: https://www.biosolidsdata.org (accessed on 18 March 2025).
  3. NEBRA. Options for Biosolids Use or Disposal in New England & Eastern Canada; North East Biosolids and Residuals Association: Hope, RI, USA, 2011. [Google Scholar]
  4. U.S. EPA. 40 CFR Part 503, Standards for the Use or Disposal of Sewage Sludge. Fed. Regist. 1993, 58, 9248–9387. [Google Scholar]
  5. U.S. EPA. Small Wastewater Systems Research. 2024. Available online: https://www.epa.gov/water-research/small-wastewater-systems-research (accessed on 15 September 2024).
  6. Becker, J.G.; Seagren, E.A. A Blueprint for High-Tech Analysis of Low-Tech Methods for Sustainable Class A Biosolids Production: Phase 1; The Water Environment & Reuse Foundation: Alexandria, VA, USA, 2017; 42p. [Google Scholar]
  7. Becker, J.G.; Seagren, E.A. High-Tech Analysis of Low-Tech Methods for Sustainable Class A Biosolids Production: Phase 2; The Water Research Foundation: Alexandria, VA, USA; Denver, CO, USA, 2019; 48p. [Google Scholar]
  8. Farrell, J.B.; Merrill, D.; Schafer, P. Producing Class A Biosolids with Low-Cost, Low-Technology Treatment Processes; Water Environment Research Foundation (WERF) Report 95-REM-2; IWA Publishing: London, UK, 2004. [Google Scholar]
  9. ISO 14040:2006; Environmental Management—Life Cycle Assessment—Principles and Framework. International Organization for Standardization (ISO): Geneva, Switzerland, 2006. Available online: https://www.iso.org/standard/37456.html (accessed on 10 October 2023).
  10. Nabaterega, R.; Kumar, V.; Khoei, S.; Eskicioglu, C. A review on two-stage anaerobic digestion options for optimizing municipal wastewater sludge treatment process. J. Environ. Chem. Eng. 2021, 9, 105502. [Google Scholar]
  11. Metcalf and Eddy. Wastewater Engineering: Treatment and Resource Recovery; McGraw-Hill Education: Boston, MA, USA, 2014. [Google Scholar]
  12. MWRD. Metropolitan Water Reclamation District of Greater Chicago (MWRD), Report No. 20-28: Annual Biosolids Management Report for 2019. 2020. Available online: https://mwrd.org/sites/default/files/documents/20-28%20Annual%20Biosolids%20Management%20Report%20for%202019.pdf (accessed on 15 December 2024).
  13. Wernet, G.; Bauer, C.; Steubing, B.; Reinhard, J.; Moreno-Ruiz, E.; Weidema, B. The ecoinvent database version 3 (part I): Overview and methodology. Int. J. Life Cycle Assess. 2016, 21, 1218–1230. [Google Scholar]
  14. U.S. EPA. Emissions and Generation Resource Integrated Database (eGRID); U.S. Environmental Protection Agency (U.S. EPA): Washington, DC, USA, 2023. Available online: https://www.epa.gov/egrid (accessed on 10 October 2023).
  15. Hospido, A.; Moreira, T.; Martín, M.; Rigola, M.; Feijoo, G. Environmental Evaluation of Different Treatment Processes for Sludge from Urban Wastewater Treatments: Anaerobic Digestion versus Thermal Processes. Int. J. Life Cycle Assess. 2005, 10, 336–345. [Google Scholar] [CrossRef]
  16. Shammas, N.K.; Wang, L.K. Belt Filter Presses. In Biosolids Treatment Processes; Springer: Berlin/Heidelberg, Germany, 2007; pp. 519–539. Available online: https://link.springer.com/chapter/10.1007/978-1-59259-996-7_17 (accessed on 15 September 2024).
  17. Komilis, D.P.; Ham, R.K. Life-Cycle Inventory of Municipal Solid Waste and Yard Waste Windrow Composting in the United States. J. Environ. Eng. 2004, 130, 1390–1400. [Google Scholar] [CrossRef]
  18. Li, Z.; Zhang, K.; Pang, K.; Di, B. A fuel-based approach for emission factor development for highway paving construction equipment in China. J. Air Waste Manag. Assoc. 2016, 66, 1214–1223. [Google Scholar] [PubMed]
  19. SCAP. California Biosolids Use and Disposal in 2015. Southern California Alliance of Publicly Owned Treatment Works. 2016. Available online: https://cleanwatersocal.org/media/acfupload/reference/California_Biosolids_Use_and_Disposal_for_2015.pdf (accessed on 10 July 2024).
  20. Yamulki, S. Effect of straw addition on nitrous oxide and methane emissions from stored farmyard manures. Agric. Ecosyst. Environ. 2006, 112, 140–145. [Google Scholar] [CrossRef]
  21. Rynk, R.; Van de Kamp, M.; Willson, G.B.; Singley, M.E.; Richard, T.L.; Kolega, J.J.; Gouin, F.R.; Laliberty, L.; Kay, D.; Murphy, D.; et al. On-Farm Composting Handbook (NRAES 54). Northeast Regional Agricultural Engineering Service (NRAES). 1992. Available online: https://ecommons.cornell.edu/items/c66de614-e524-46a3-a4cb-031c9a1e7e11 (accessed on 3 September 2024).
  22. Nordahl, S.L.; Preble, C.V.; Kirchstetter, T.W.; Scown, C.D. Greenhouse gas and air pollutant emissions from composting. Environ. Sci. Technol. 2023, 57, 2235–2247. [Google Scholar] [CrossRef] [PubMed]
  23. Majumder, R.; Livesley, S.J.; Gregory, D.; Arndt, S.K. Biosolid stockpiles are a significant point source for greenhouse gas emissions. J. Environ. Manag. 2014, 143, 34–43. [Google Scholar] [CrossRef] [PubMed]
  24. Spellman, F.R. Wastewater Biosolids to Compost; Technomic Publishing Company: Lancaster, PA, USA, 1997. [Google Scholar]
  25. Shammas, N.K.; Wang, L.K. Biosolids Composting. In Biosolids Treatment Processes; Springer: Berlin/Heidelberg, Germany, 2007; pp. 645–687. Available online: https://link.springer.com/chapter/10.1007/978-1-59259-996-7_21 (accessed on 15 September 2024).
  26. Poulsen, T.G.; Hansen, J.A. Strategic environmental assessment of alternative sewage sludge management scenarios. Waste Manag. Res. J. Sustain. Circ. Econ. 2003, 21, 19–28. [Google Scholar]
  27. Brown, S.; Kruger, C.; Subler, S. Greenhouse Gas Balance for Composting Operations. J. Environ. Qual. 2008, 37, 1396–1410. [Google Scholar] [CrossRef] [PubMed]
  28. Roy, D.; Benkaraache, S.; Azaïs, A.; Drogui, P.; Tyagi, R.D. Leachate treatment: Assessment of the systemic changes in the composition and biodegradability of leachates originating in an open co-composting facility in Canada. J. Environ. Chem. Eng. 2019, 7, 103056. [Google Scholar] [CrossRef]
  29. U.S. EPA. Biosolids Technology Fact Sheet: Heat Drying; U.S. Environmental Protection Agency (U.S. EPA): Washington, DC, USA, 2006. Available online: https://www.epa.gov/sites/production/files/2018-11/documents/heat-drying-factsheet.pdf (accessed on 10 October 2023).
  30. ANL. Greenhouse Gases, Regulated Emissions, and Energy Use in Transportation (GREET) Model; Argonne National Laboratory, Energy Systems Division: DuPage County, IL, USA, 2018. [Google Scholar]
  31. Jolliet, O.; Margni, M.; Charles, R.; Humbert, S.; Payet, J.; Rebitzer, G.; Rosenbaum, R. IMPACT 2002+: A New Life Cycle Impact Assessment Methodology. Int. J. Life Cycle Assess. 2003, 8, 324–330. [Google Scholar] [CrossRef]
  32. IPCC. Climate Change 2013: The Physical Science Basis. Contribution of Working Group I to the Fifth Assessment Report of the Intergovernmental Panel on Climate Change; Stocker, T.F., Qin, D., Plattner, G.-K., Tignor, M., Allen, S.K., Boschung, J., Nauels, A., Xia, Y., Bex, V., Midgley, P.M., Eds.; Cambridge University Press: Cambridge, UK; New York, NY, USA, 2013; p. 1535. [Google Scholar]
  33. WEF. Drying of Wastewater Biosolids Fact Sheet; Water Environment Federation Residuals and Biosolids Committee Bioenergy Technology Subcommittee; Water Environment Federation (WEF): Alexandria, VA, USA, 2014; Available online: http://www.wrrfdata.org/NBP/DryerFS/Drying_of_Wastewater_Solids_Fact_Sheet_January2014.pdf (accessed on 1 September 2024).
  34. SYLVIS. The Biosolids Emissions Assessment Model (BEAM): A Method for Determining Greenhouse Gas Emissions from Canadian Biosolids Management Practices. Winnipeg, Manitoba, Canadian Council of Ministers of the Environment. 2009. Available online: http://faculty.washington.edu/slb/docs/CCME_final_report.pdf (accessed on 10 October 2023).
  35. Cornejo, P.K.; Becker, J.; Pagilla, K.; Mo, W.; Zhang, Q.; Mihelcic, J.R.; Chandran, K.; Sturm, B.; Yeh, D.; Rosso, D. Sustainability metrics for assessing water resource recovery facilities of the future. Water Environ. Res. 2019, 91, 45–53. [Google Scholar] [PubMed]
  36. Pfeffer, K.; Porter, J.; Lisk, B.; Bullard, M.; Guzman, K.; Chiavaroli, M. Selecting an Advanced Anaerobic Digestion Configuration and Biogas Management Strategy for the City of Tampa. Proc. Water Environ. Fed. 2019, 2018, 688–714. [Google Scholar] [CrossRef]
  37. CAPA. Asphalt Tonnage Calculator. 2019. Available online: https://co-asphalt.com/resources/asphalt-tonnage-calculator/ (accessed on 6 May 2019).
  38. Caterpiller. 924K, 930K, 938K Wheel Loaders. 2012. Available online: https://s7d2.scene7.com/is/content/Caterpillar/C737355 (accessed on 6 May 2019).
  39. Harris, R.A.; Phillips, D.R. Density of Selected Wood Fuels; Georgia Forest Research Paper; Georgia Forestry Commission: Macon, GA, USA, 1986. [Google Scholar]
  40. Jackson, T. The Owning and Operating Costs of Dump Trucks. 2010. Available online: https://www.equipmentworld.com/owning-and-operating-costs-8/ (accessed on 6 May 2019).
  41. Myhre, G.; Shindell, D.; Bréon, F.-M.; Collins, W.; Fuglestvedt, J.; Huang, J.; Koch, D.; Lamarque, J.-F.; Lee, D.; Mendoza, B.; et al. Chapter 8: Anthropogenic and Natural Radiative Forcing. In Climate Change 2013: The Physical Science Basis. Contribution of Working Group I to the Fifth Assessment Report of the Intergovernmental Panel on Climate Change; Intergovernmental Panel on Climate Change: Cambridge, UK, 2013. [Google Scholar]
  42. Puchajda, B.; Oleszkiewicz, J. Impact of sludge thickening on energy recovery from anaerobic digestion. Water Sci. Technol. 2008, 57, 395–401. [Google Scholar] [CrossRef] [PubMed]
  43. Riau, V.; De la Rubia, M.Á.; Pérez, M. Temperature-Phased Anaerobic Digestion (TPAD) to Obtain Class A Biosolids: A Semi-Continuous Study. Bioresour. Technol. 2010, 101, 2706–27112. [Google Scholar] [PubMed]
  44. Suh, Y.-J.; Rousseaux, P. An LCA of Alternative Wastewater Sludge Treatment Scenarios. Resour. Conserv. Recycl. 2002, 35, 191–200. [Google Scholar] [CrossRef]
  45. Tiquia, S.M.; Richard, T.L.; Honeyman, M.S. Carbon, nutrient, and mass loss during Composting. Nutr. Cycl. Agroecosyst. 2002, 62, 15–24. [Google Scholar] [CrossRef]
  46. U.S. EPA. Biosolids Technology Fact Sheet: Multi-Stage Anaerobic Digestion; Environmental Protection Agency: Washington, DC, USA, 2006. Available online: https://www.epa.gov/biosolids/fact-sheet-multi-stage-anaerobic-digestion (accessed on 10 October 2023).
  47. Wang, L.K.; Shammas, N.K.; Hung, Y.T. Biosolids Treatment Processes; Humana Press: Totowa, NJ, USA, 2007. [Google Scholar]
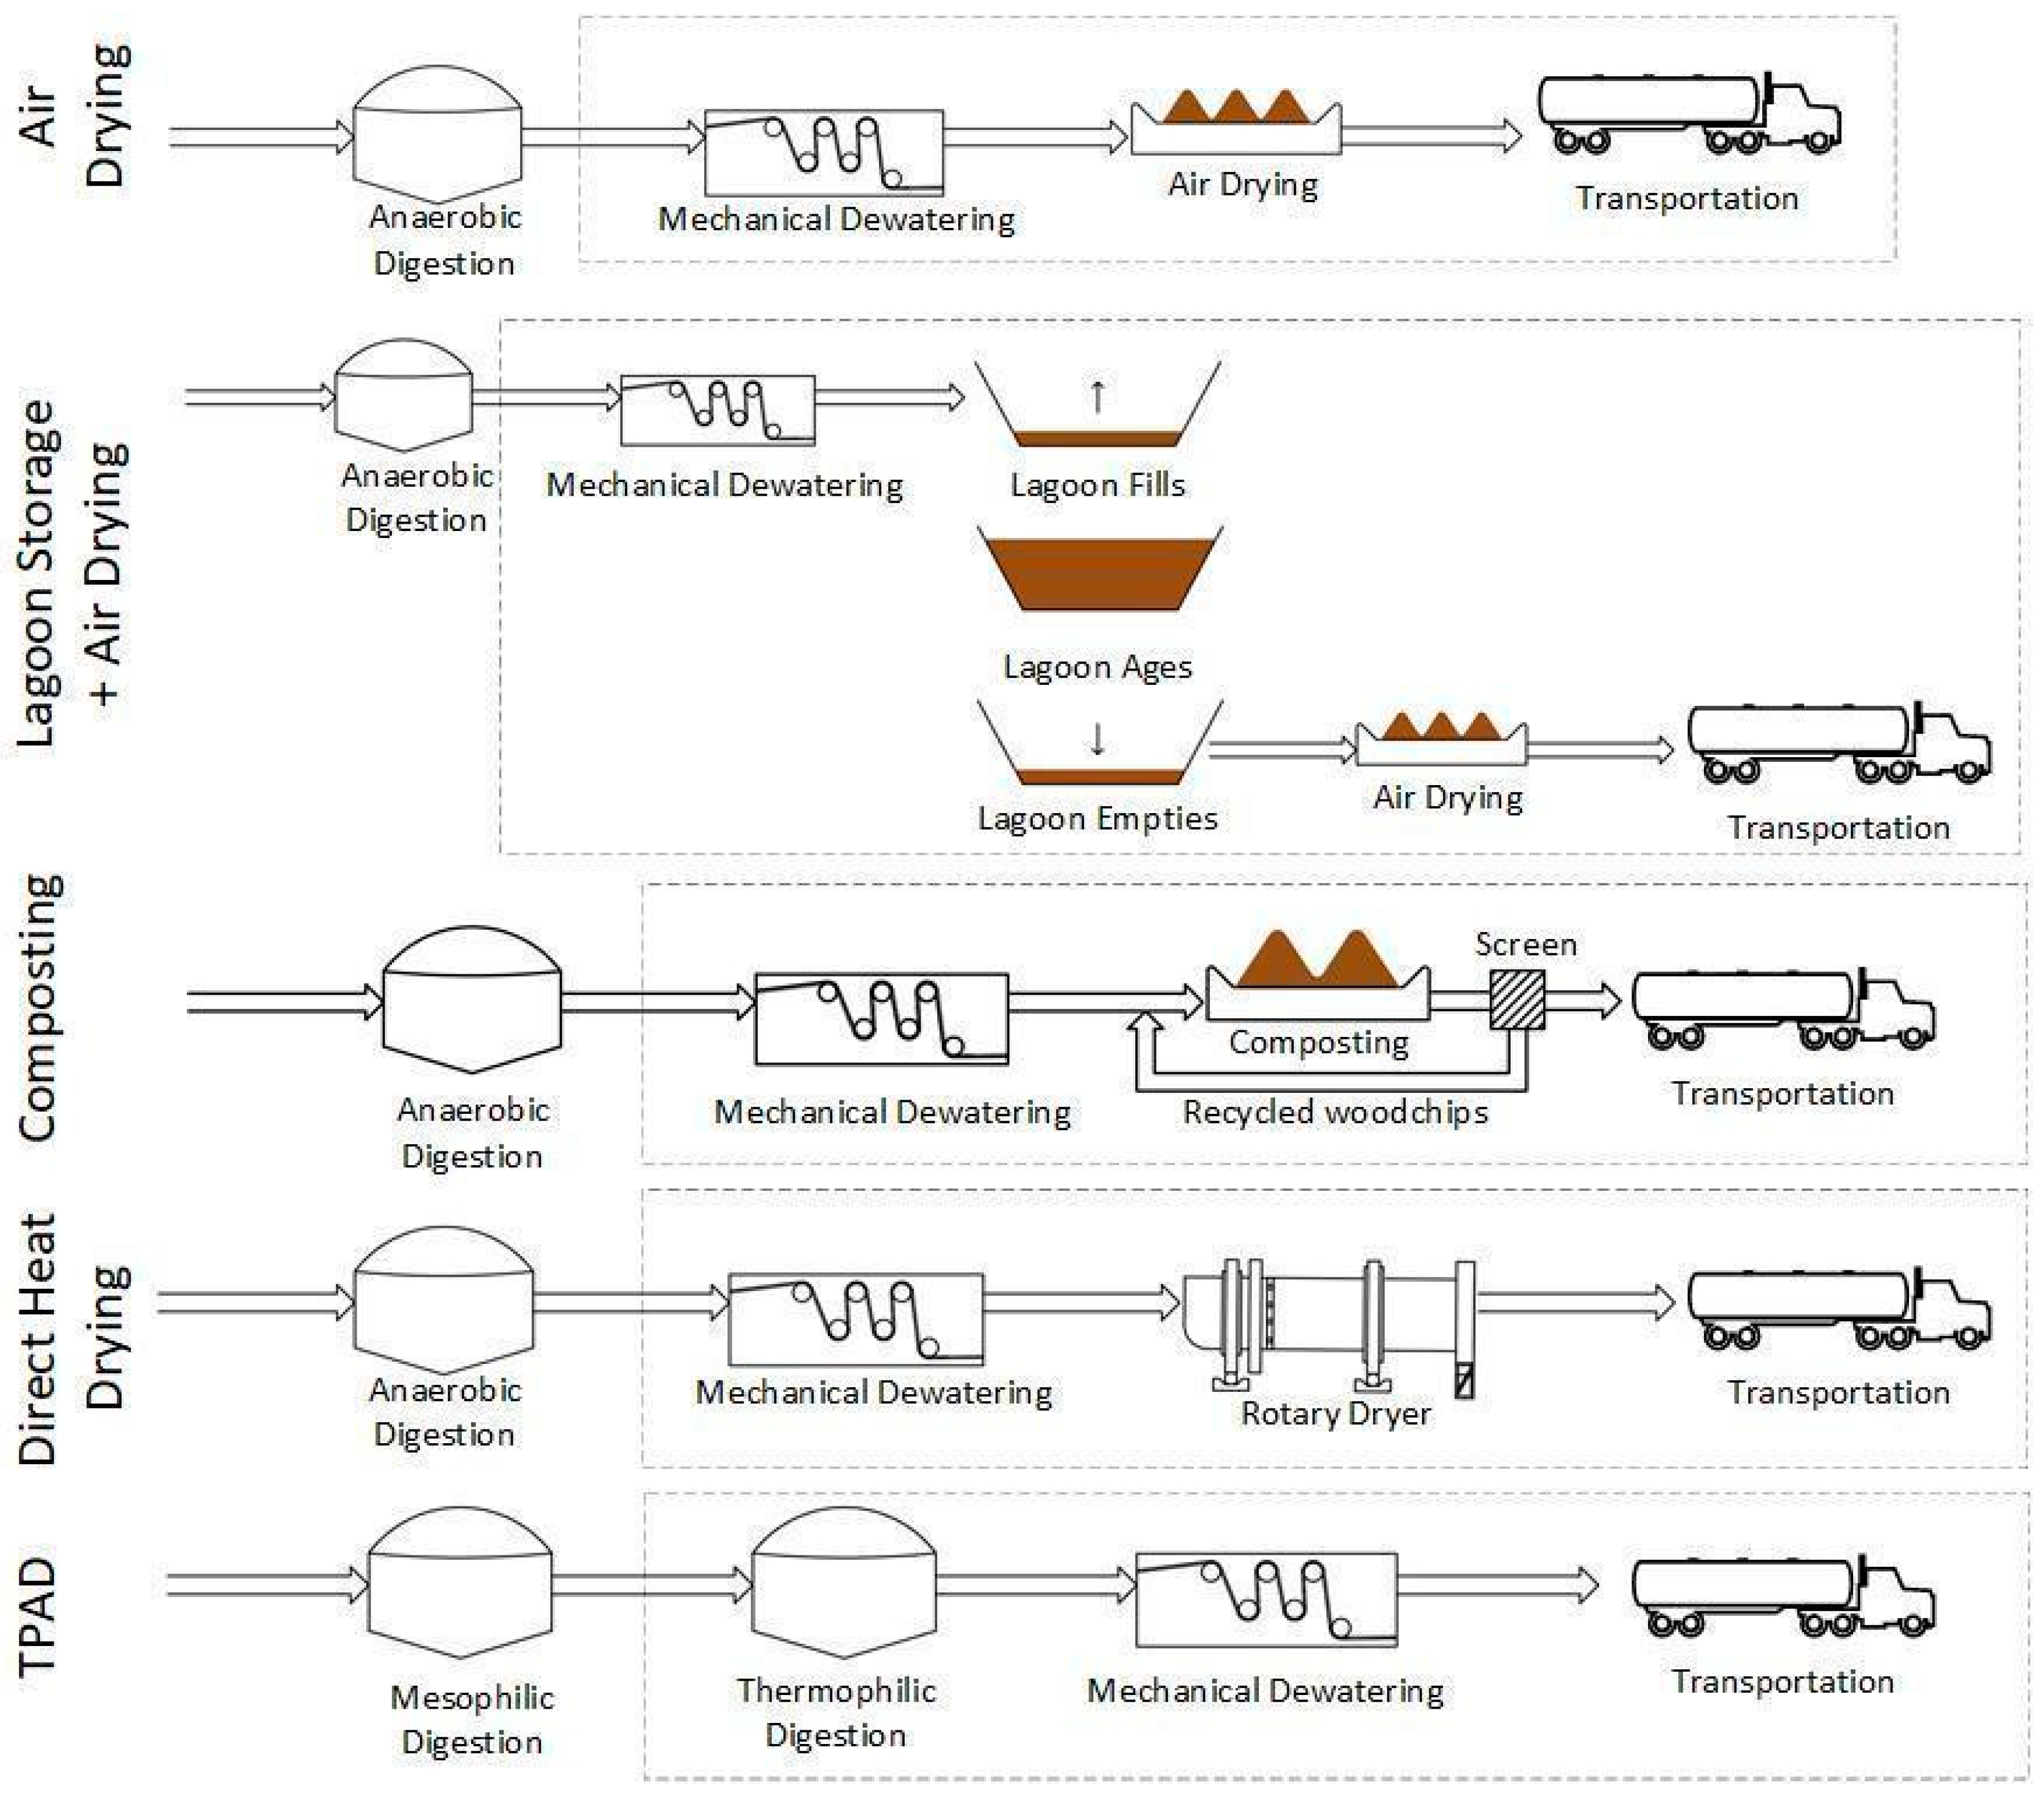
Figure 1. System boundaries for each treatment process under study. Dashed lines represent system boundaries.
Applsci 15 03482 g001
Figure 2. Mass flow through Class A biosolids treatment process trains. Rectangles represent biosolids mass at each point in treatment train. Arrows represent unit processes.
Applsci 15 03482 g002
Figure 3. Overall environmental impacts for each Class A biosolids treatment process train using modified IMPACT 2002+ method. Different colors of stacked bars represent four damage categories.
Applsci 15 03482 g003
Figure 4. Contributions of individual unit operations to the overall environmental impacts of (A) Air Drying; (B) Lagoon Storage; (C) Composting; (D) Direct Heat Drying; and (E) TPAD.
Applsci 15 03482 g004
Figure 5. Utilities/fuel, materials, biogenic, and infrastructure sources of environmental impacts of (A) Air Drying; (B) Lagoon Storage; (C) Composting; (D) Direct Heat Drying; and (E) TPAD. Note that the vertical axes in the panels are scaled differently but all have the same units of pt.
Applsci 15 03482 g005
Figure 6. Transportation sensitivity analysis results for five Class A biosolids treatment processes. Transport distances listed are one-way distances.
Applsci 15 03482 g006
Figure 7. Biogenic emissions for biosolids treated via Air Drying, Lagoon Storage Plus Air Drying, and Composting. S1, S2, and S3 refer to the Air Drying sensitivity analysis scenarios (see Table 2).
Applsci 15 03482 g007
Table 1. Inputs and outputs for Air Drying LCA.
ParameterValueUnitEcoinvent Item/Comments
Inputs
             Dewatering Electricity20,895kWhUS electricity, medium voltage, at grid, updated grid mix
             Dewatering Polymer1252kgAcrylonitrile, market
             Dewatering Water2490kgTap water, at user
             Wastewater to be Treated3437kgTreatment, sewage, unpolluted, to wastewater treatment, class 3
             Diesel Fuel610kgDiesel, at regional storage
             Asphalt 54,122kgAsphalt a
             Transportation of Final Product48,664tkmTransport, lorry 16-32t, EURO3
Outputs
             CO2, Biogenic119,619kgCarbon dioxide
             CH4, Biogenic3107kgMethane
             N2O, Biogenic54kgNitrous oxide
             CO2, Fuel Combustion4270kgCarbon dioxide
a An amount of 1 kg of asphalt includes 0.1 kg of bitumen adhesive compound, hot; 0.9 kg of gravel, crushed; and 0.0013 kWh of diesel burned in a machine.
Table 2. Air-Drying emissions used in sensitivity analysis.
ScenarioMethane EmissionsNitrous Oxide Emissions
Scenario 1—Most conservative and highest emissions3.8% of initial carbon0.87% of initial nitrogen
Scenario 2—Intermediate emissions2.85% of initial carbon0.74% of initial nitrogen
Scenario 3—Least emissions (Composting-like conditions)1.9% of initial carbon0.60% of initial nitrogen
Table 3. Inputs and outputs for Lagoon Storage Plus Air Drying LCA.
ParameterValueUnitEcoinvent Item/Comments
Inputs
             Dewatering electricity20,895kWhElectricity, medium voltage, at grid
             Dewatering polymer1368kgAcrylonitrile, market
             Dewatering water2496kgTap water, at user
             Wastewater to be treated3531kgTreatment, sewage, unpolluted, at wastewater treatment, class 3
             Diesel fuel528kgDiesel, at regional storage
             Clay54,244kgClay, market
             HPDE liner230kgHDPE resin E
             Asphalt 53,150kgAsphalt a
             Transportation of biosolids48,664tkmTransport, lorry 16–32 t, EURO3
Outputs
             CO2, biogenic207,370kgCarbon dioxide
             CH4, biogenic1926kgMethane
             N2O, biogenic885kgNitrous oxide
             CO2, fuel combustion3720kgCarbon dioxide
a = 1 kg of asphalt, which includes 0.1 kg of hot bitumen adhesive compound; 0.9 kg of gravel, crushed; and 0.0013 kWh of diesel burned in machine.
Table 4. Inputs and outputs for Composting LCA.
ParameterValueUnitEcoinvent Item/Comments
Inputs
             Dewatering electricity20,895kWhElectricity, medium voltage, at grid
             Dewatering polymer1281kgAcrylonitrile, market for
             Dewatering water2492kgTap water, at user
             Wastewater to be treated3460kgTreatment, sewage, unpolluted, at to wastewater treatment, class 3
             Woodchips488,564kgWaste woodchips, mixed, from industry, u = 40%, at plant
             Sawdust238,654kgSawdust, from dried lumber, at planer mill, US PNW/kg
             Diesel fuel1486kgDiesel, at regional storage
             Trommel screen electricity1169kWhElectricity, medium voltage, at grid
             Asphalt 52,184kgAsphalt a
             Transportation of final product141,286tkmTransport, lorry 16–32 t, EURO3
Outputs
             CO2, biogenic146,611kgCarbon dioxide
             CH4, biogenic1838 kgMethane
             N2O, biogenic23kgNitrous oxide
             CO2, fuel combustion10,486kgCarbon dioxide
a = 1 kg of asphalt, which includes 0.1 kg of hot bitumen adhesive compound; 0.9 kg of gravel, crushed; and 0.0013 kWh of diesel burned in machine.
Table 5. Inputs and outputs for Direct Heat Drying LCA.
ParameterValueUnitEcoinvent Name
Inputs
             Dewatering Electricity20,895kWhElectricity, medium voltage, at grid
             Dewatering Polymer1089kgAcrylonitrile, market
             Dewatering Water2482kgTap water, at user
             Wastewater to be Treated3305kgTreatment, sewage, unpolluted, to wastewater treatment, class 3
             Natural Gas62,062m3Natural gas, combusted in industrial boiler
             Transportation of Final Product30,735tkmTransport, lorry 16–32 t, EURO3
Table 6. Inputs and outputs for TPAD LCA.
ParameterValueUnitEcoinvent Name
Inputs
             Dewatering Electricity20,895kWhElectricity, medium voltage, at grid
             Dewatering Polymer1089kgAcrylonitrile, market
             Dewatering Water2482kgTap water, at user
             Wastewater to be Treated3046kgTreatment, sewage, unpolluted, at wastewater treatment, class 3
             TPAD Electricity17,401kWhElectricity, medium voltage, at grid
             Transportation of Final Product132,719tkmTransport, lorry 16–32 t, EURO3
Outputs
             Carbon Dioxide22,976kgCarbon dioxide
Disclaimer/Publisher’s Note: The statements, opinions and data contained in all publications are solely those of the individual author(s) and contributor(s) and not of MDPI and/or the editor(s). MDPI and/or the editor(s) disclaim responsibility for any injury to people or property resulting from any ideas, methods, instructions or products referred to in the content.