
Exploring Convective Drying Behavior of Hydroxide Sludges Through Micro-Drying Systems

 , and
, and
Abstract
1. Introduction
2. Materials and Methods
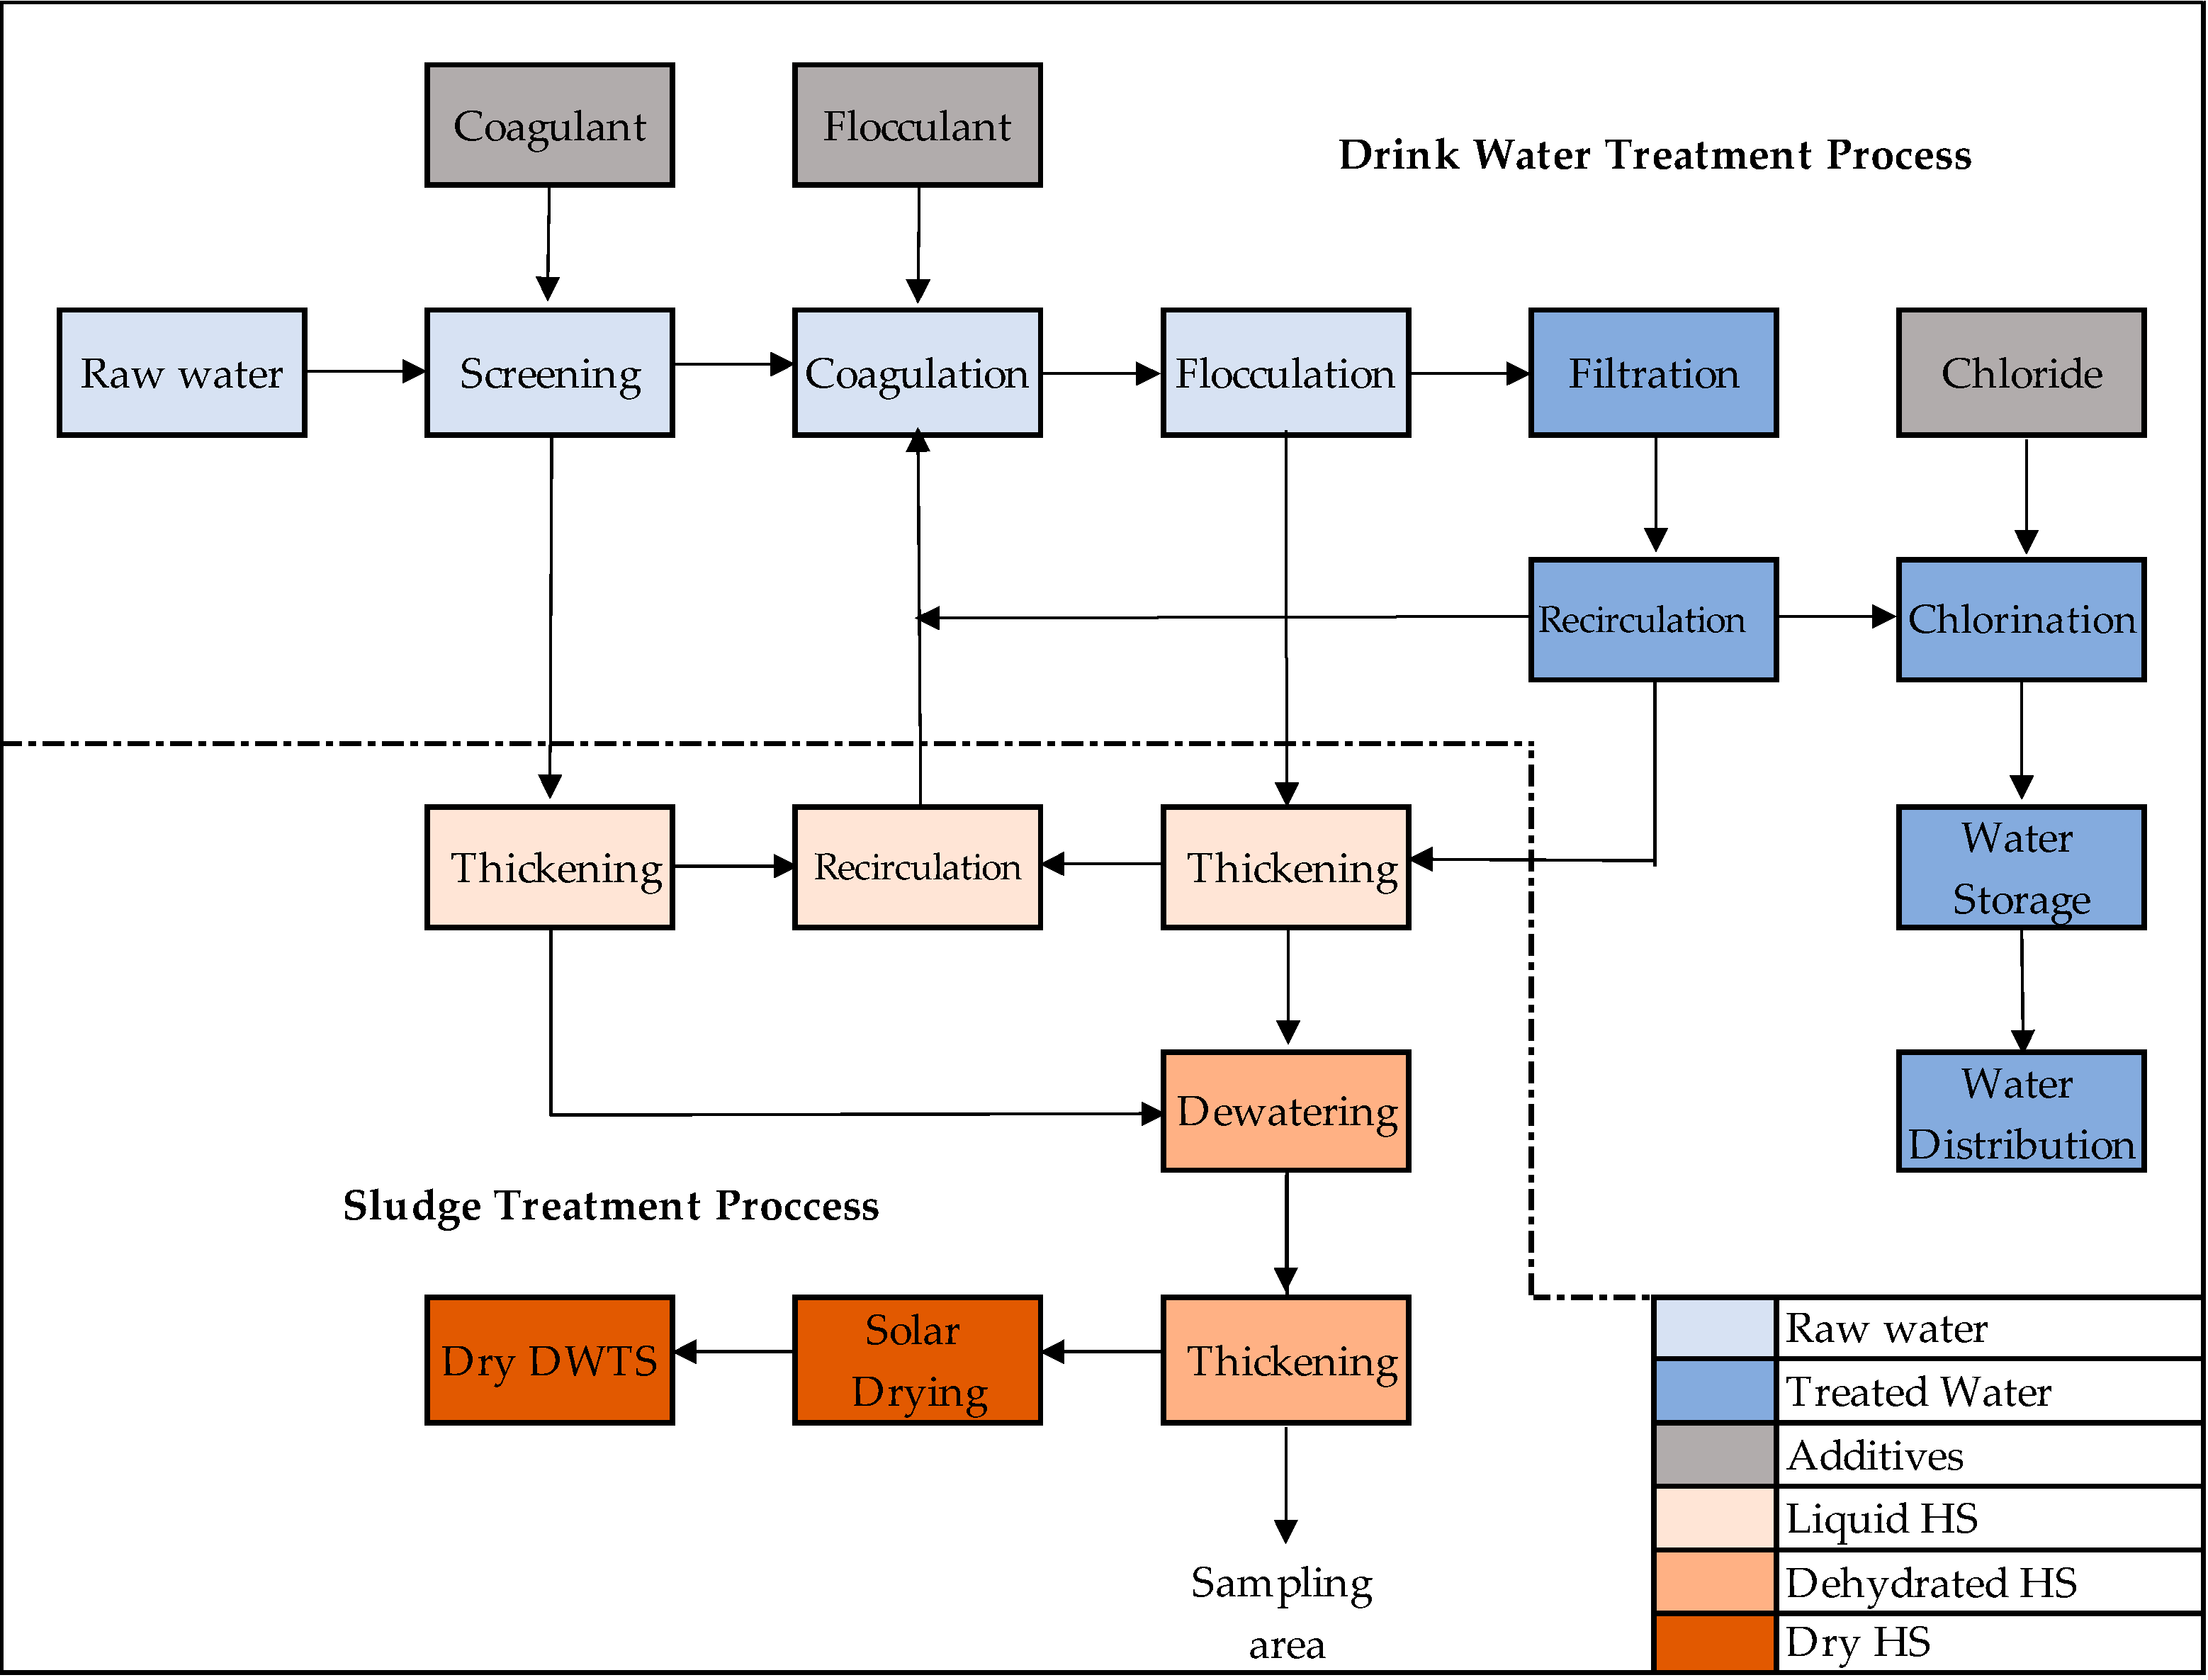
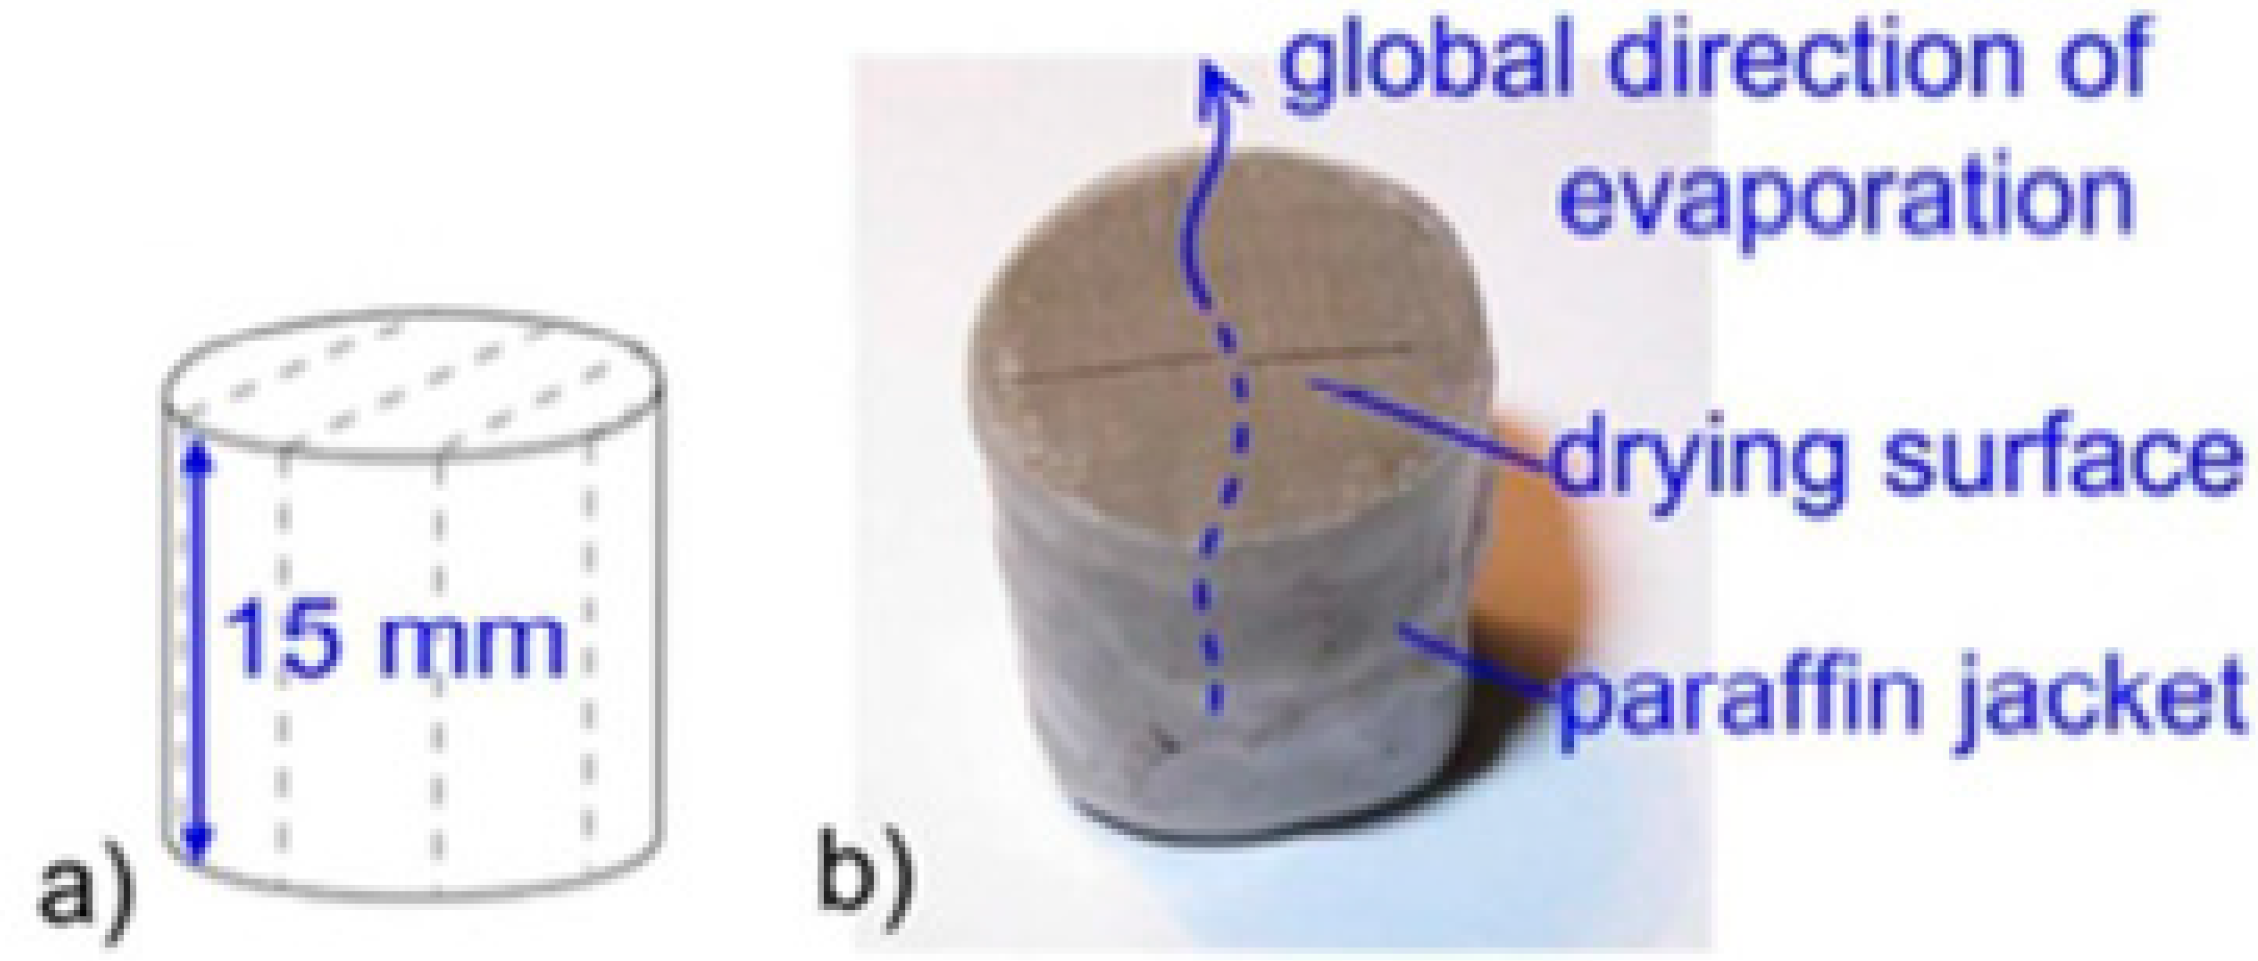
2.1. Sludge Samples
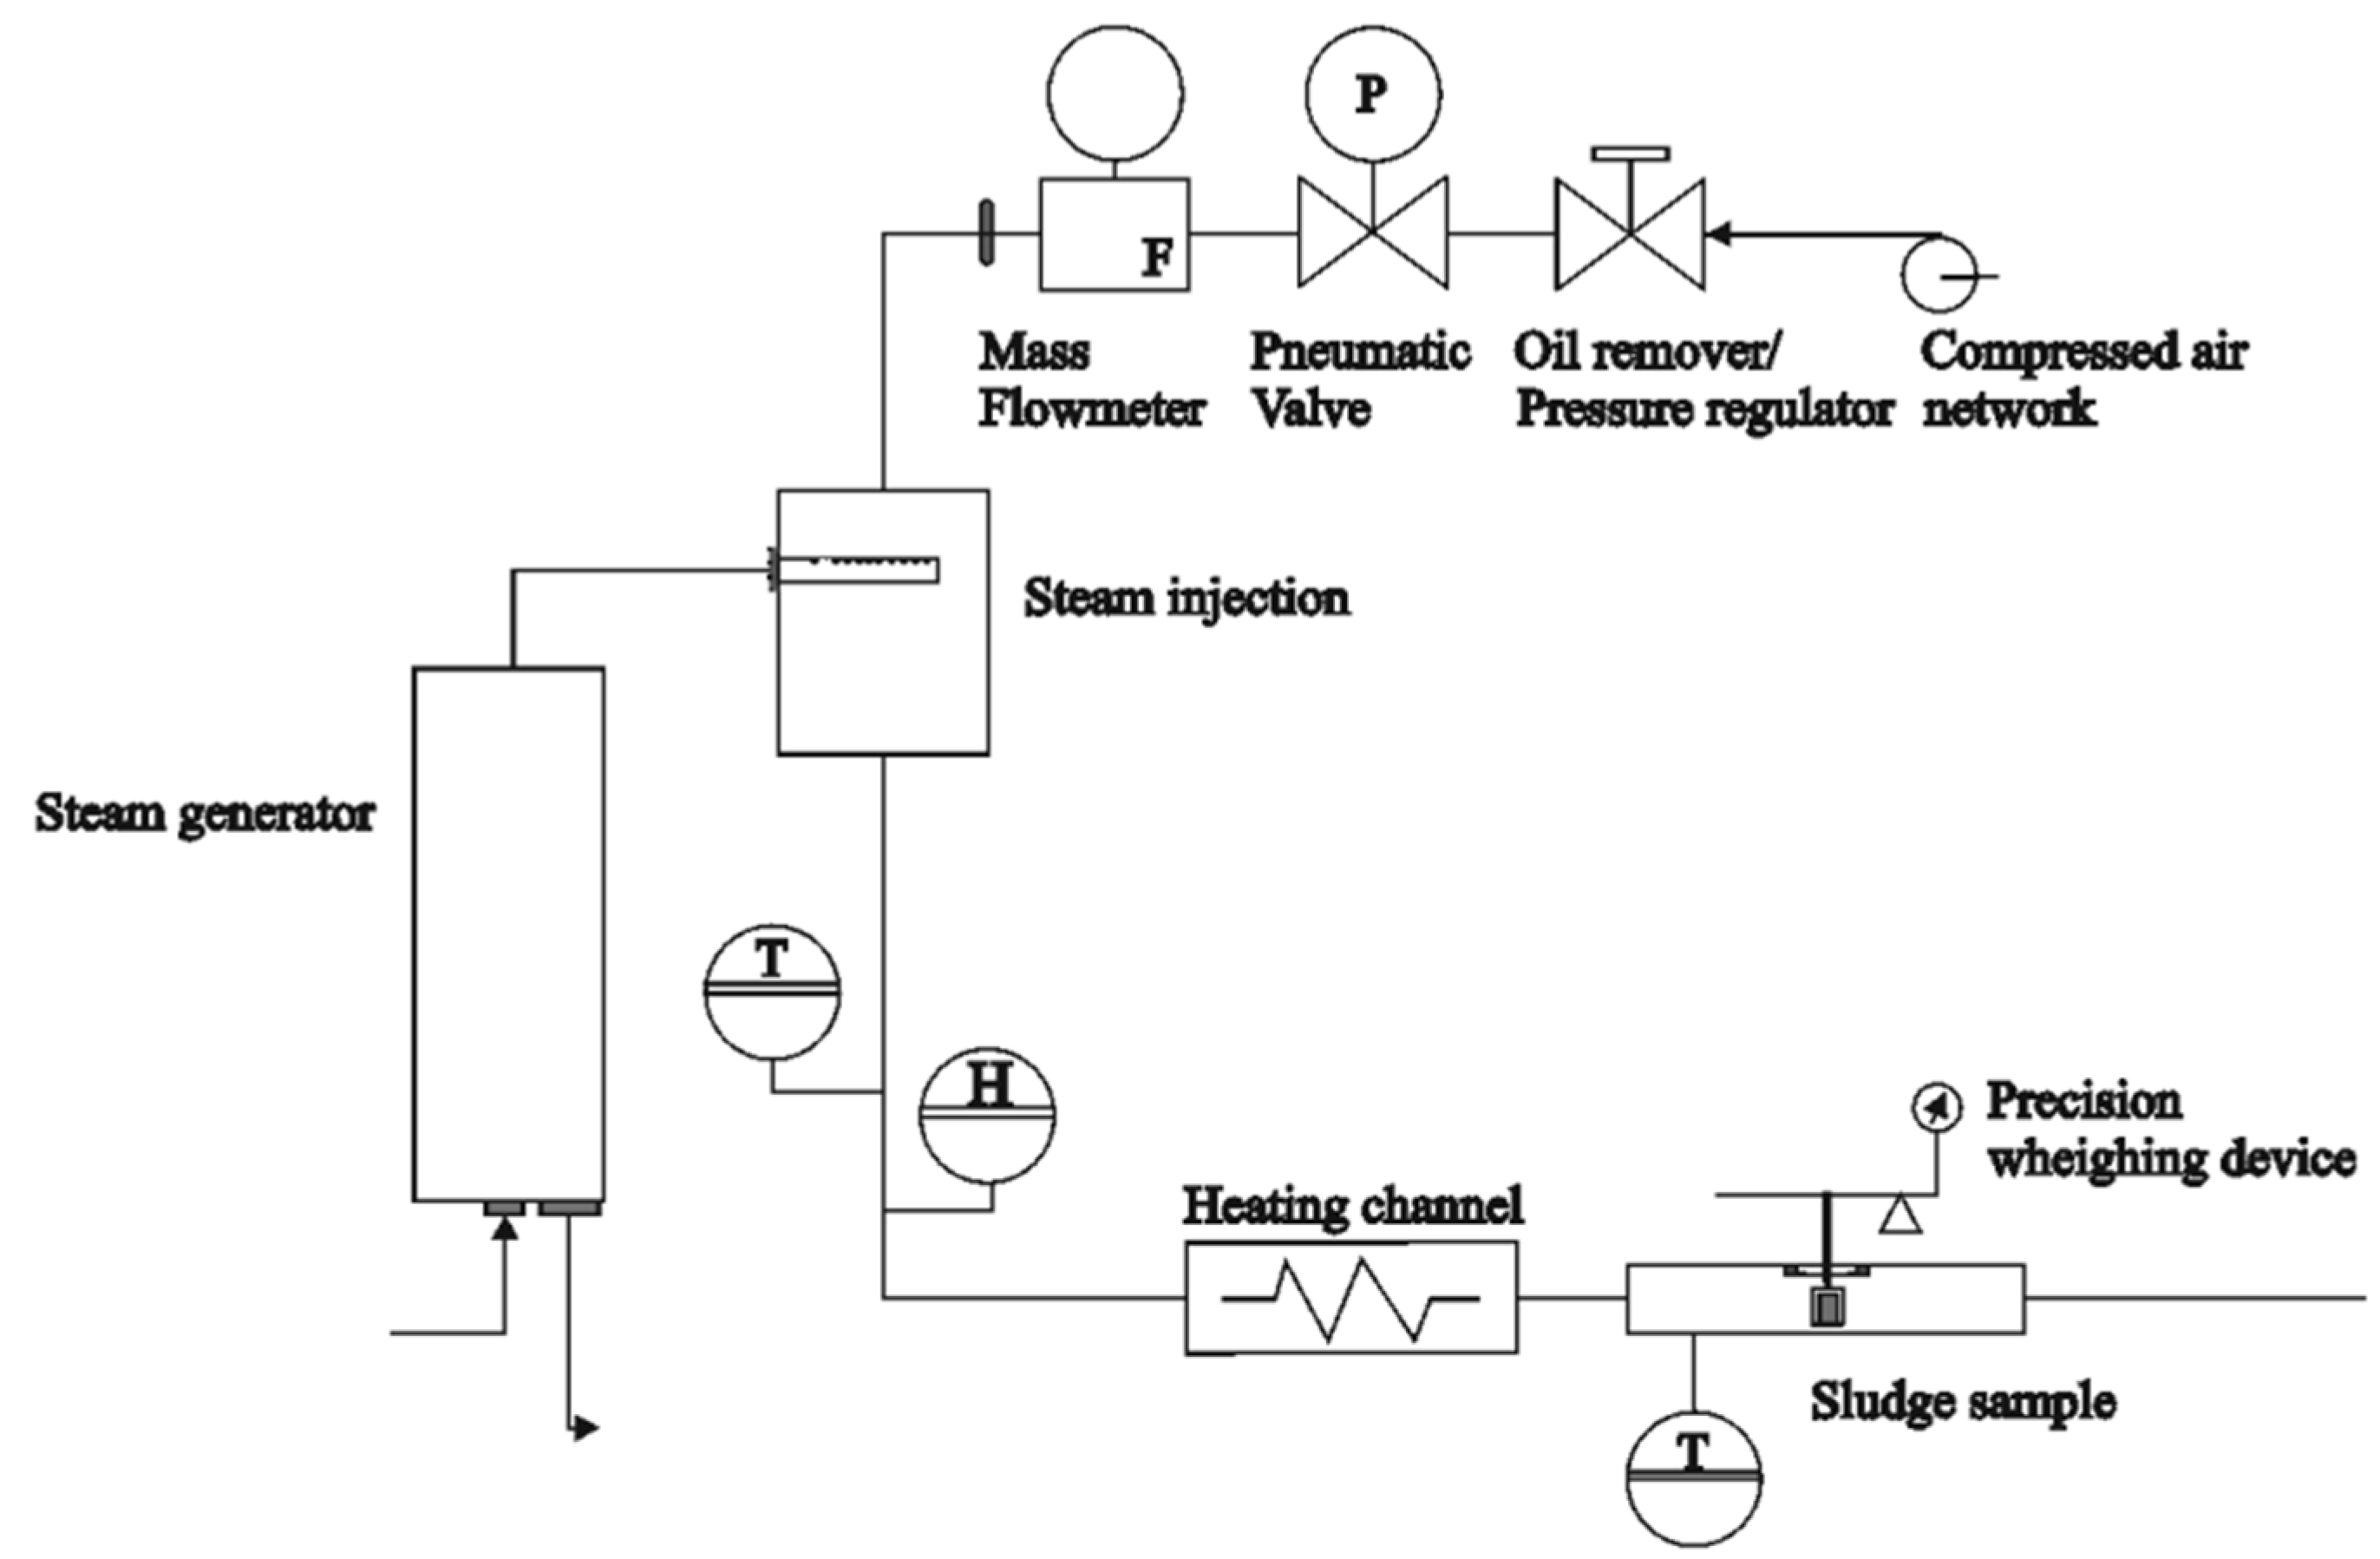
2.2. Drying Tests
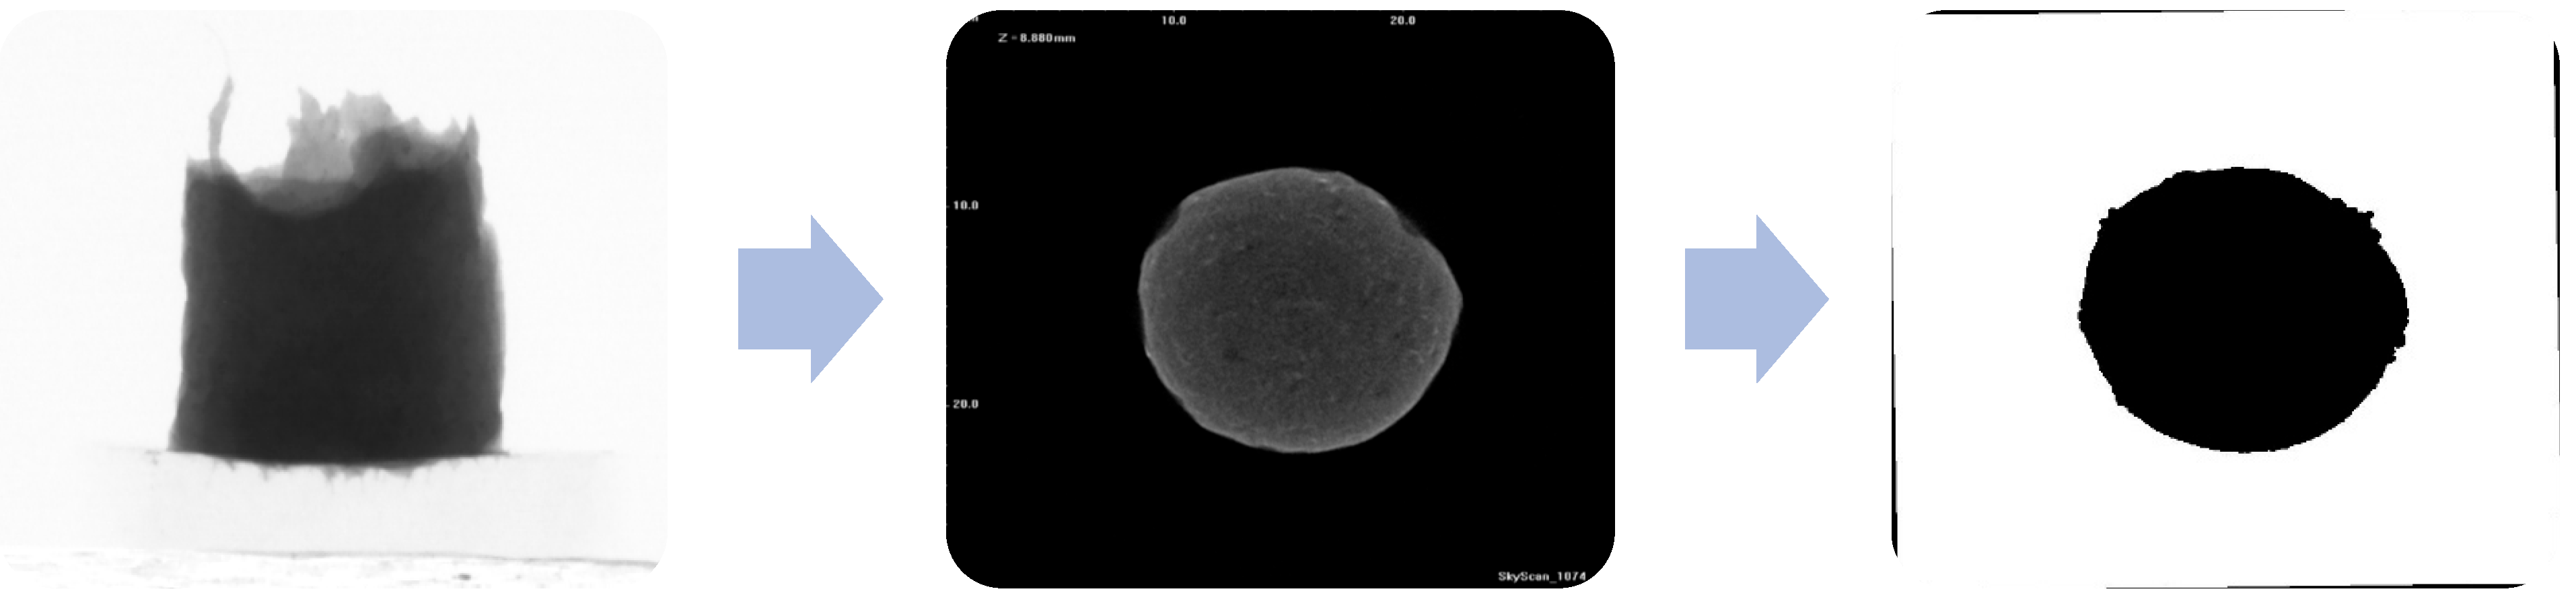
2.3. Shrinkage Curves
2.4. Effective Diffusivities
- L represents the half-thickness of the material;
- X denotes the moisture ratio;
- Deff is the effective diffusion coefficient;
- t corresponds to the drying time.
2.5. Activation Energy
- R is the universal gas constant (J/mol·K);
- T is the absolute air temperature (K);
- Ea represents the activation energy (J/mol);
- D0 is the pre-exponential factor in the Arrhenius model (m2/s).
3. Results and Discussion
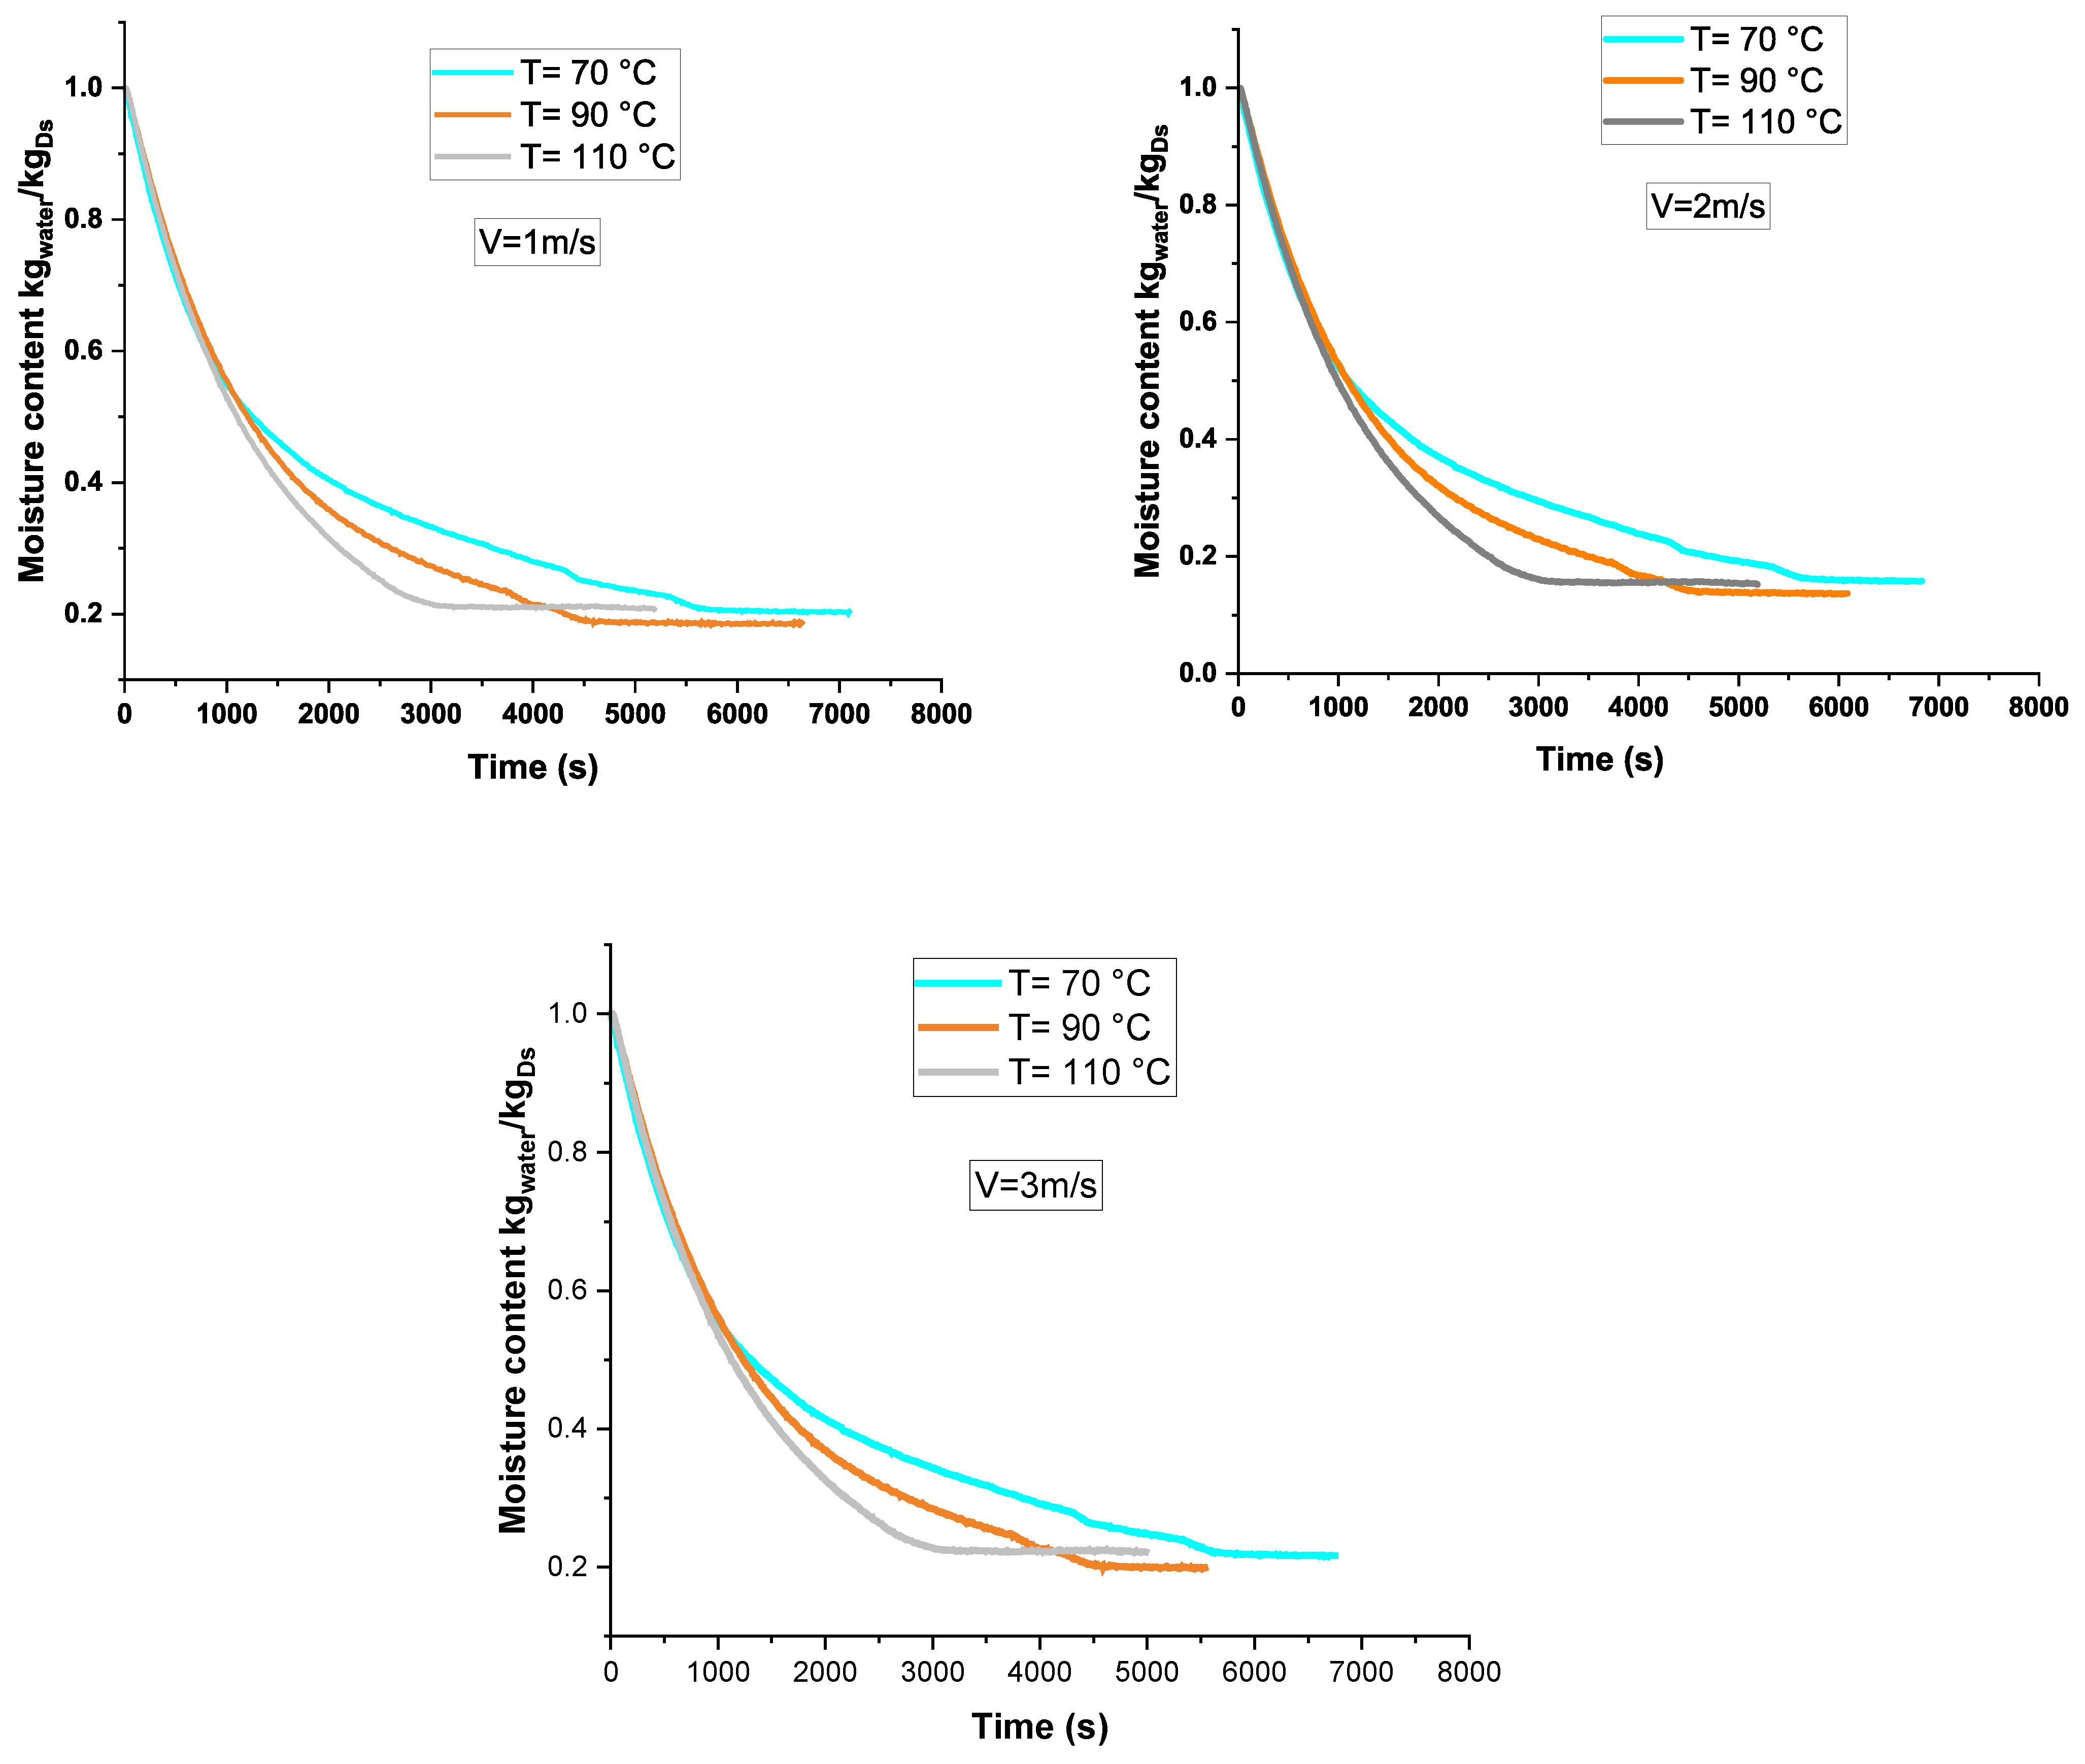
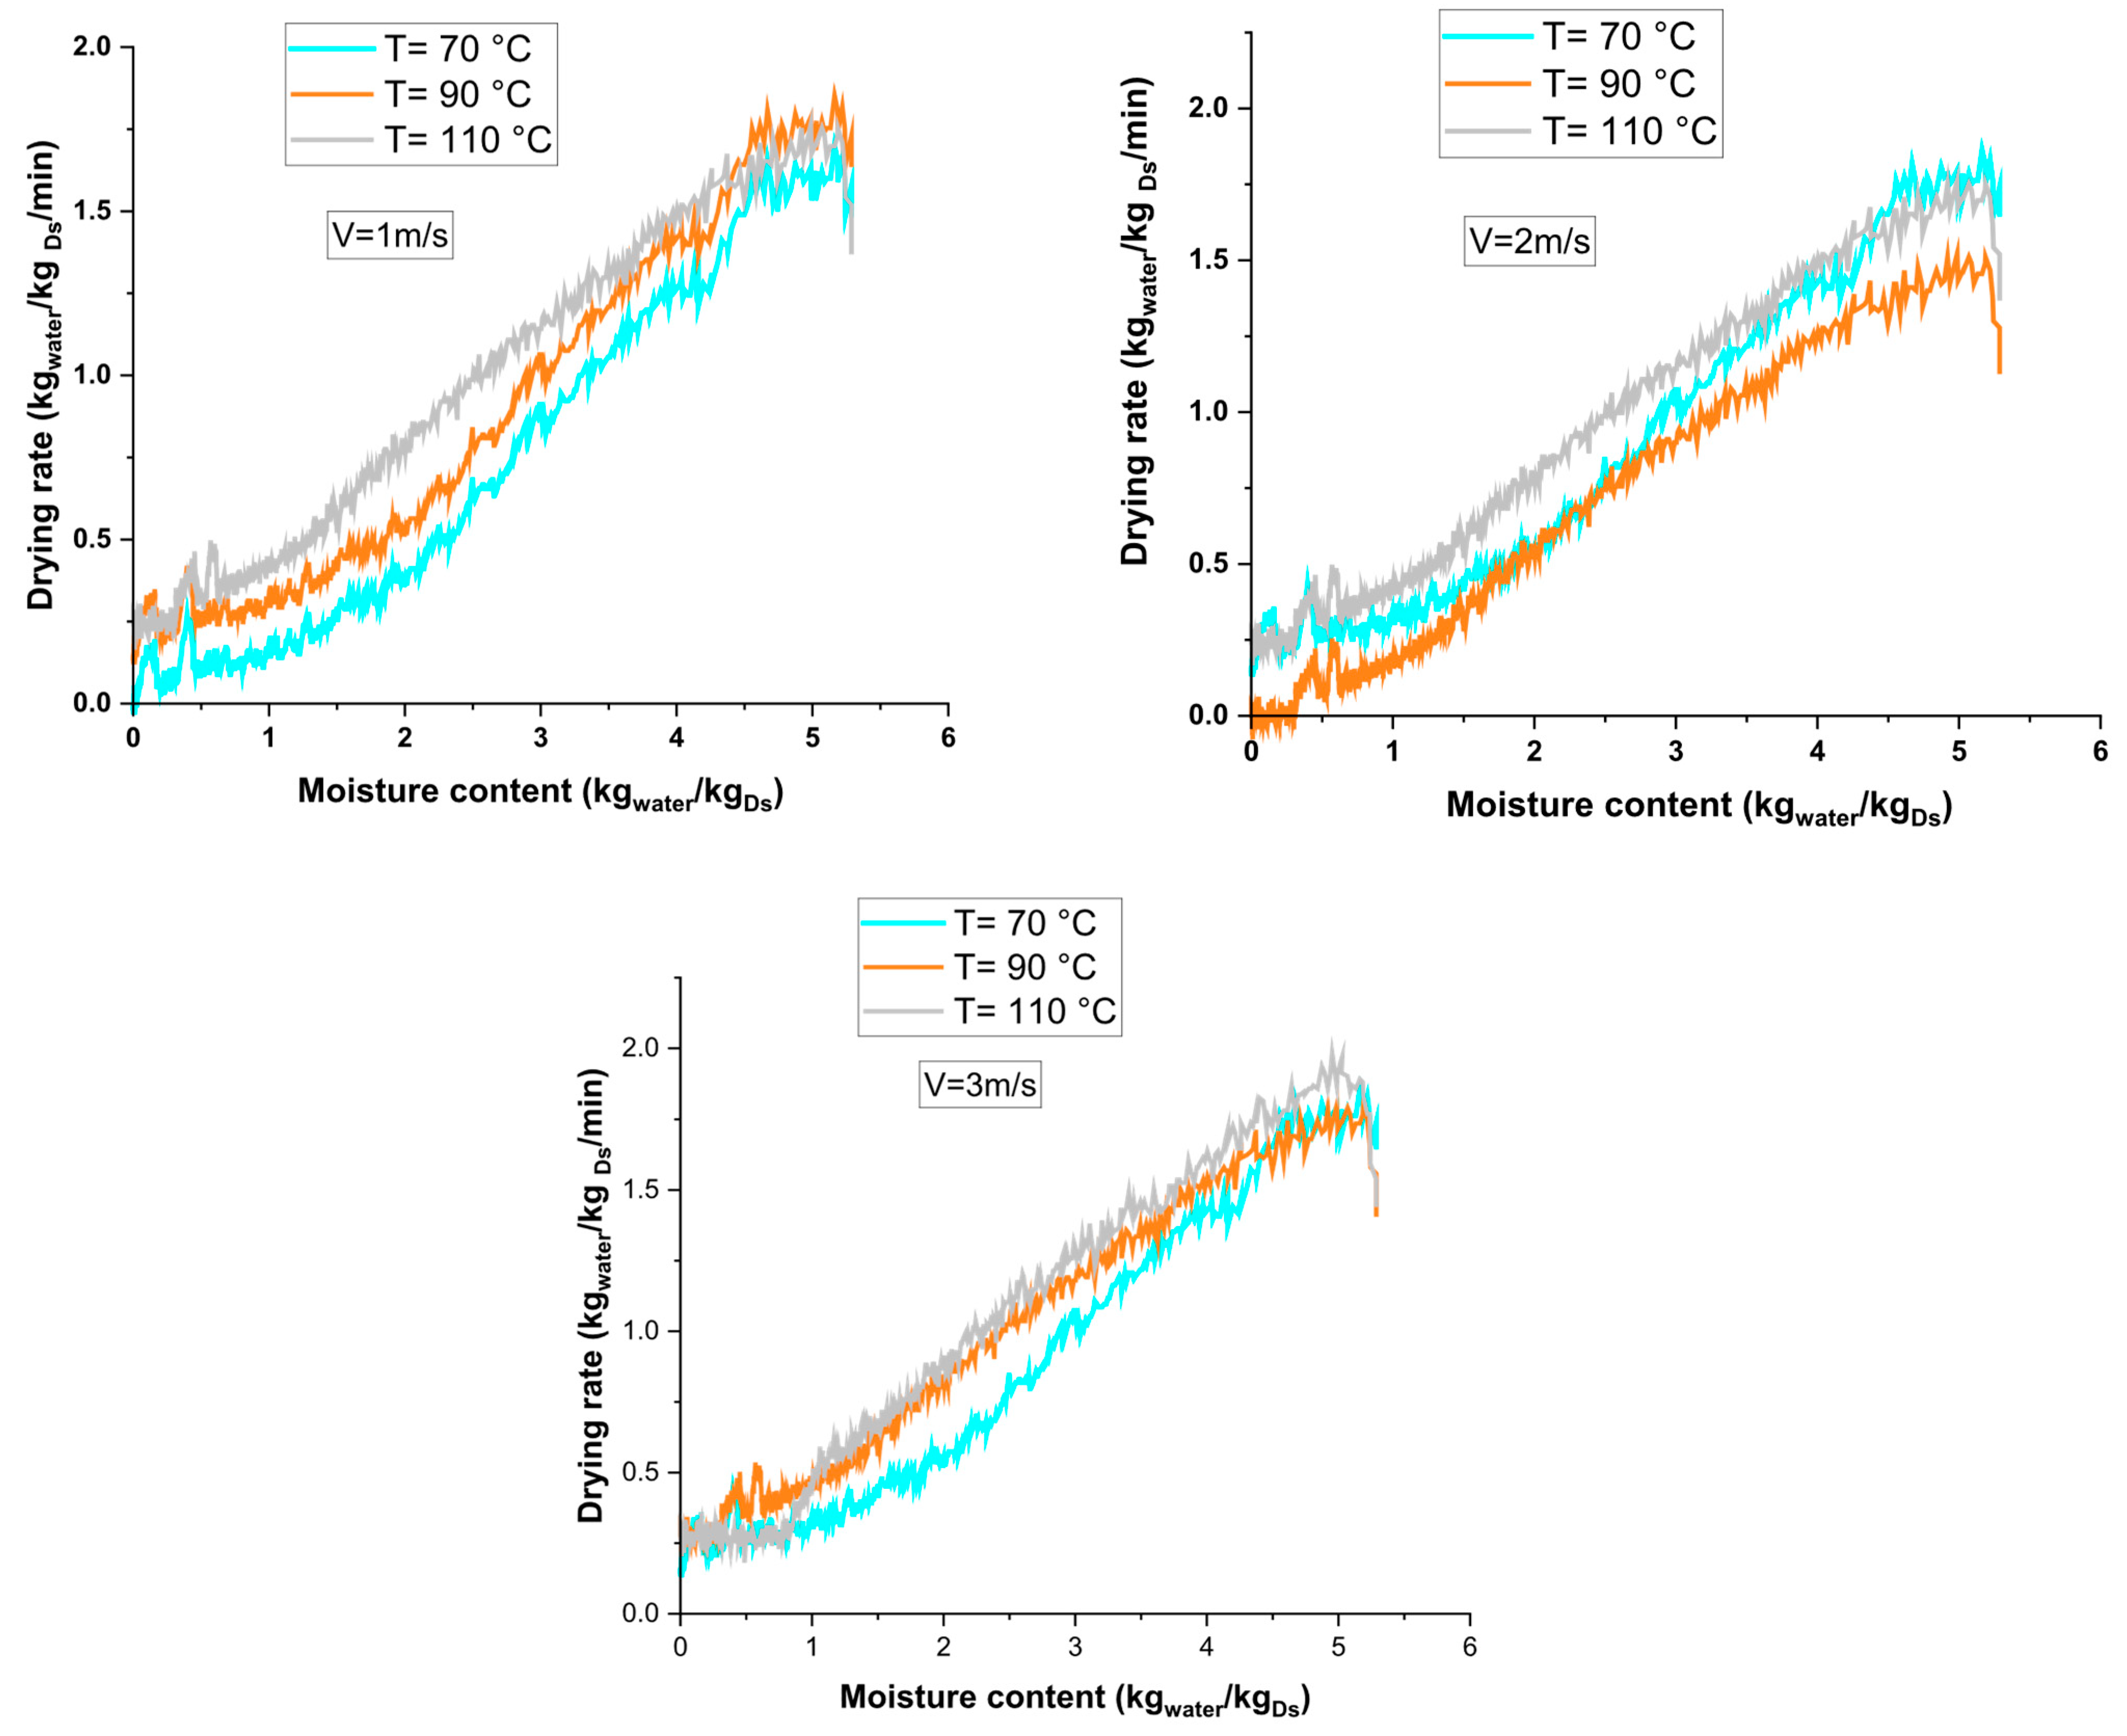
3.1. Drying Kinetics
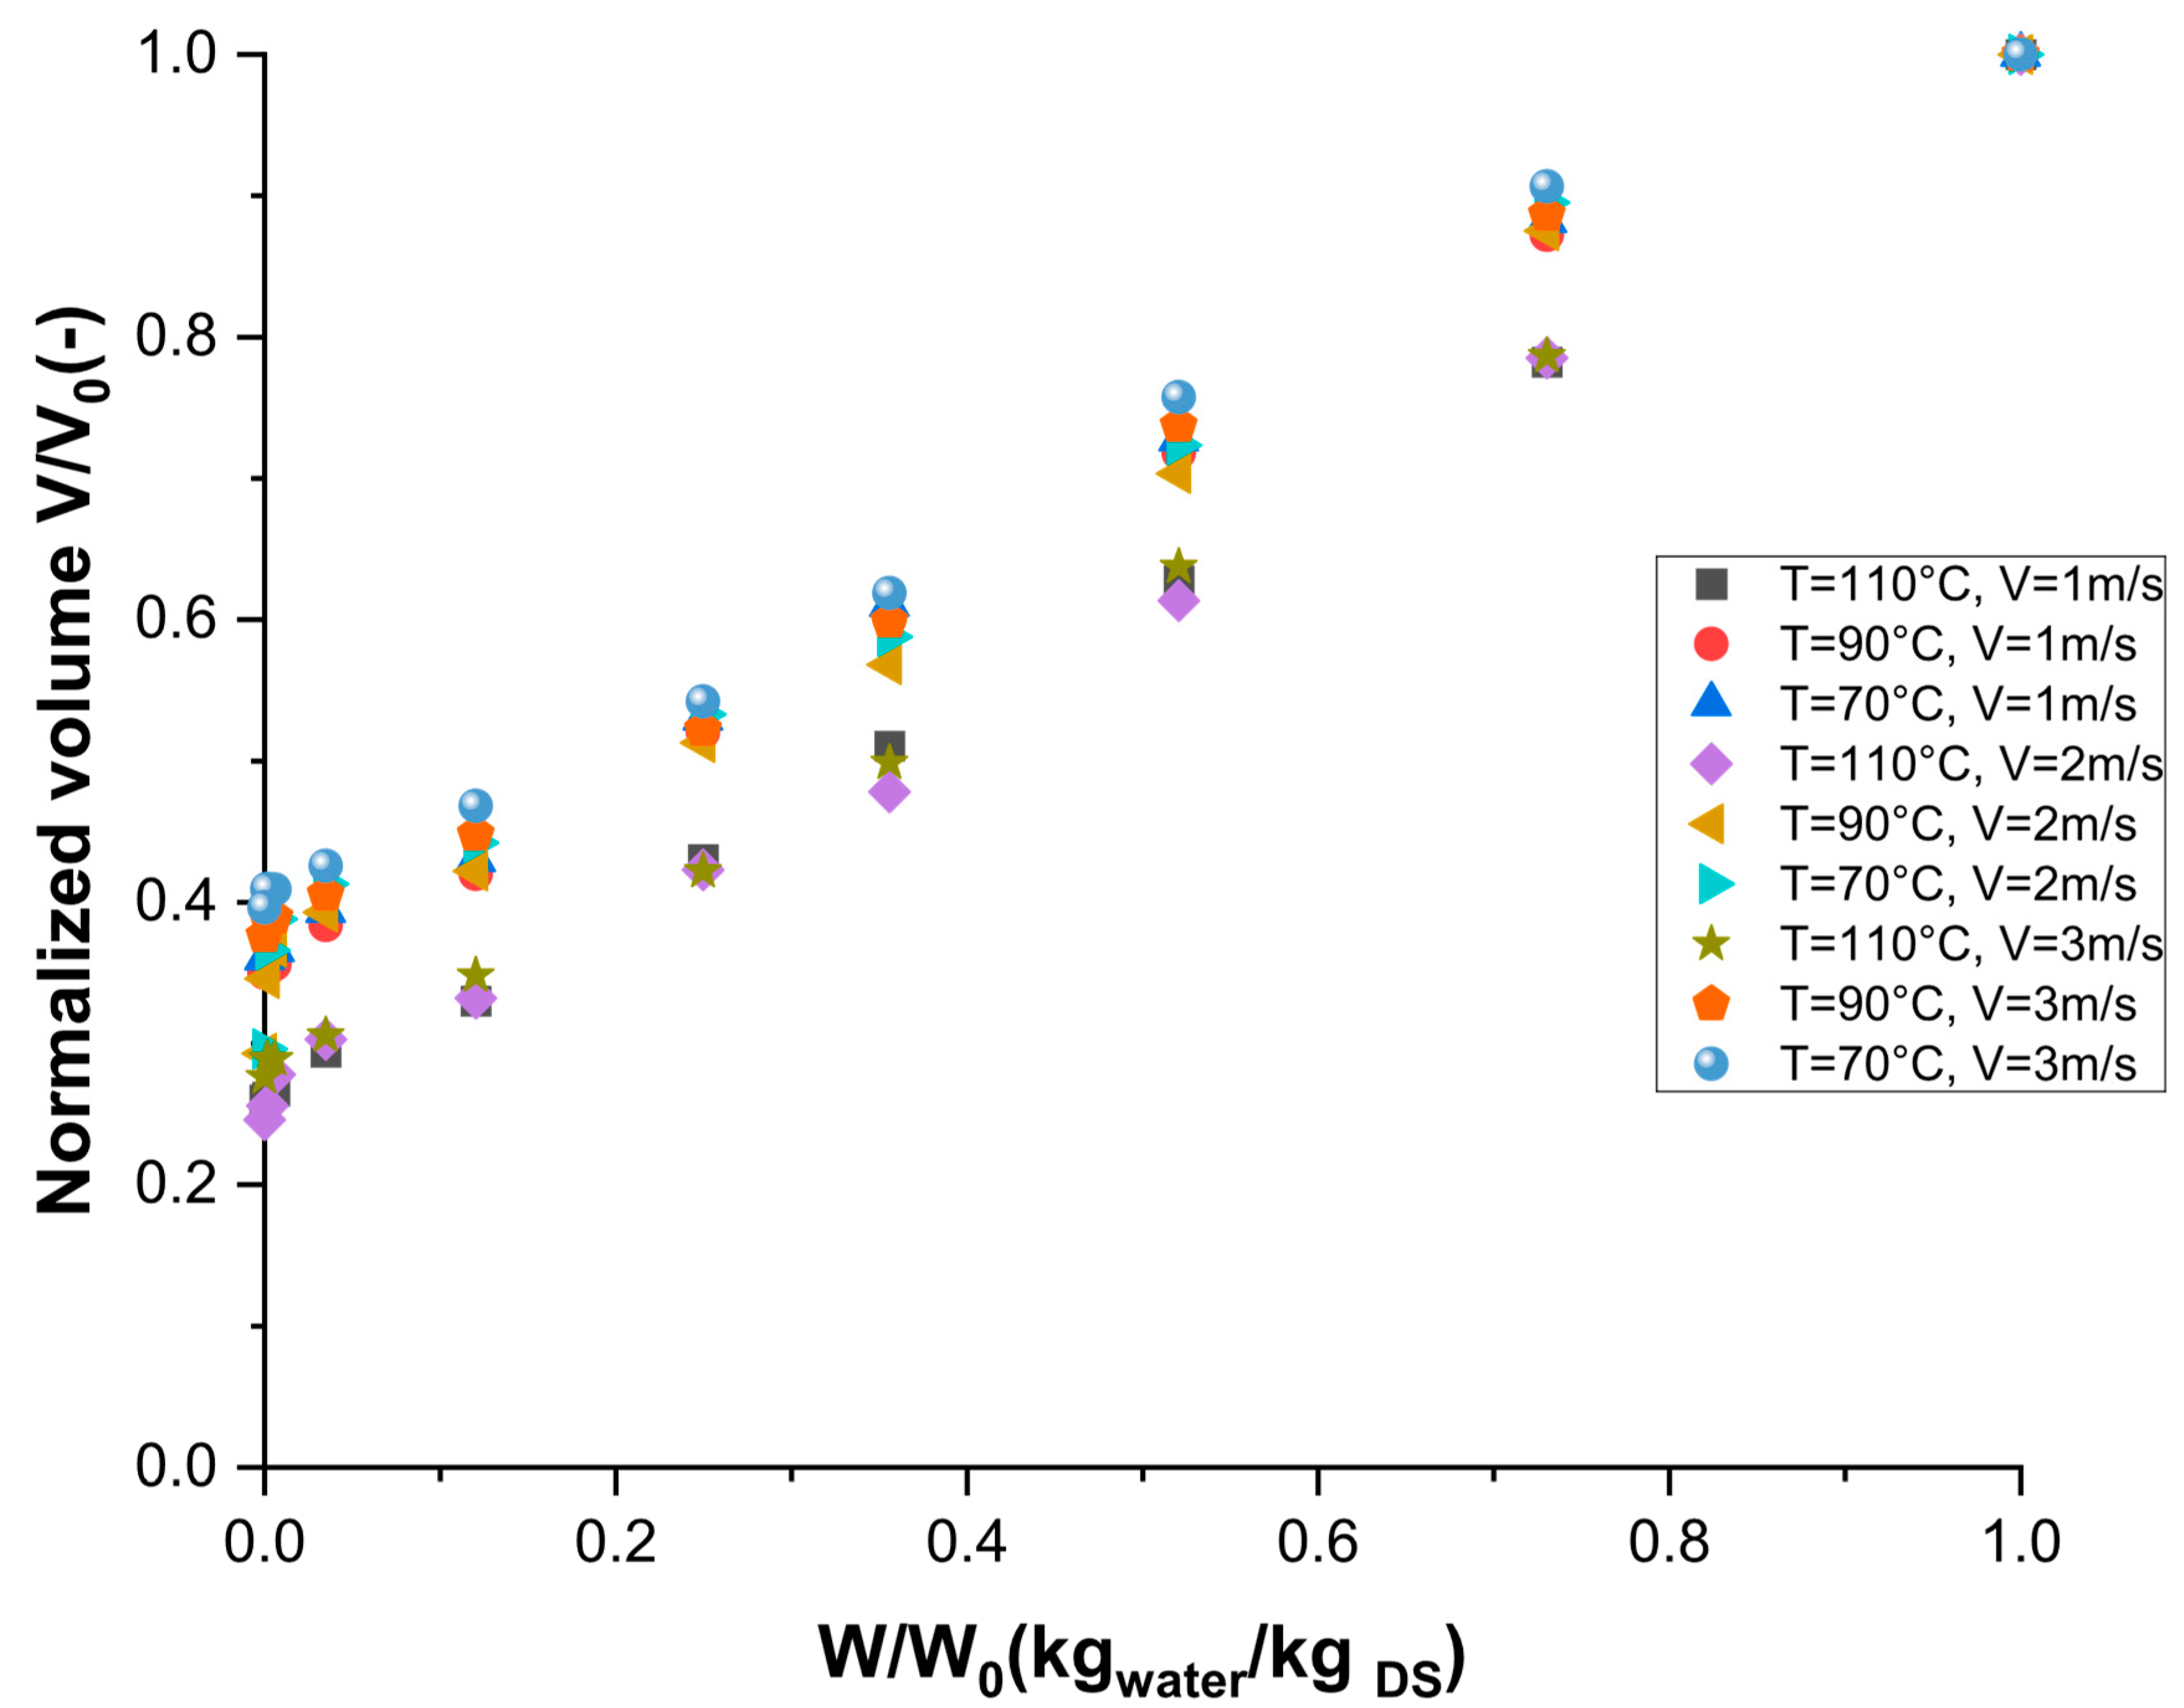
3.2. Volume and Shrinkage
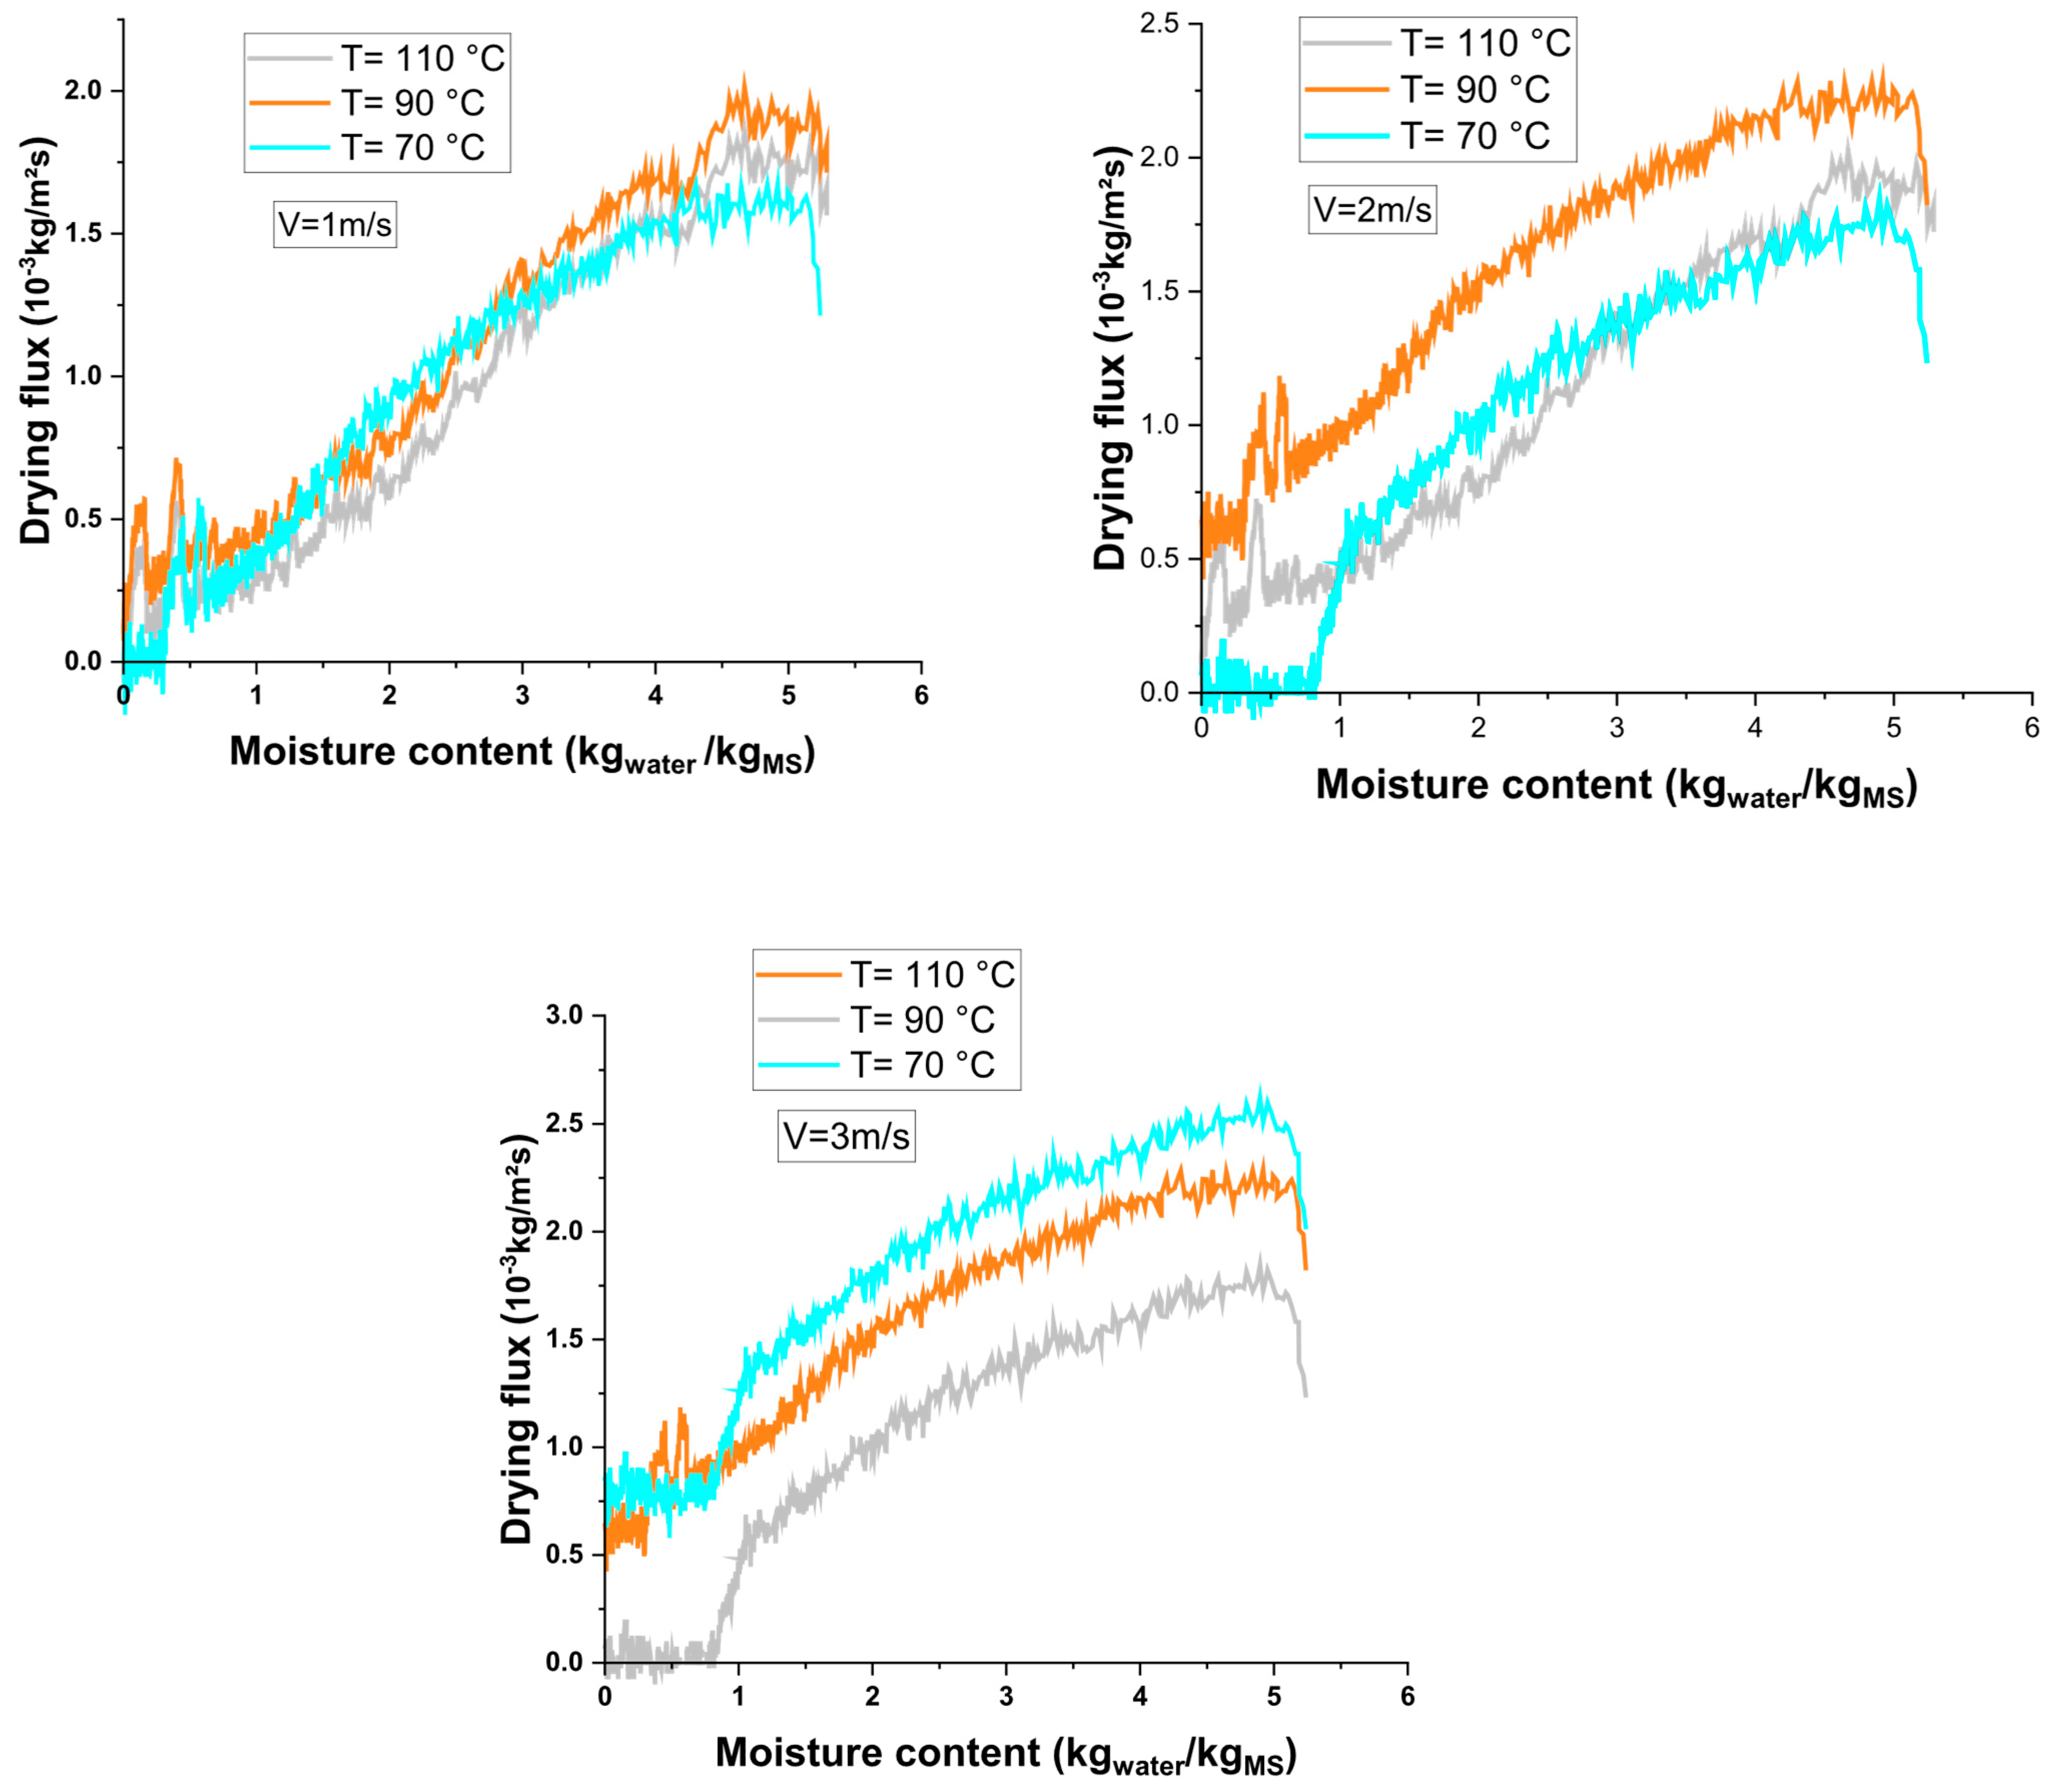
3.3. Drying Characteristic Curve of Hydroxide Sludge
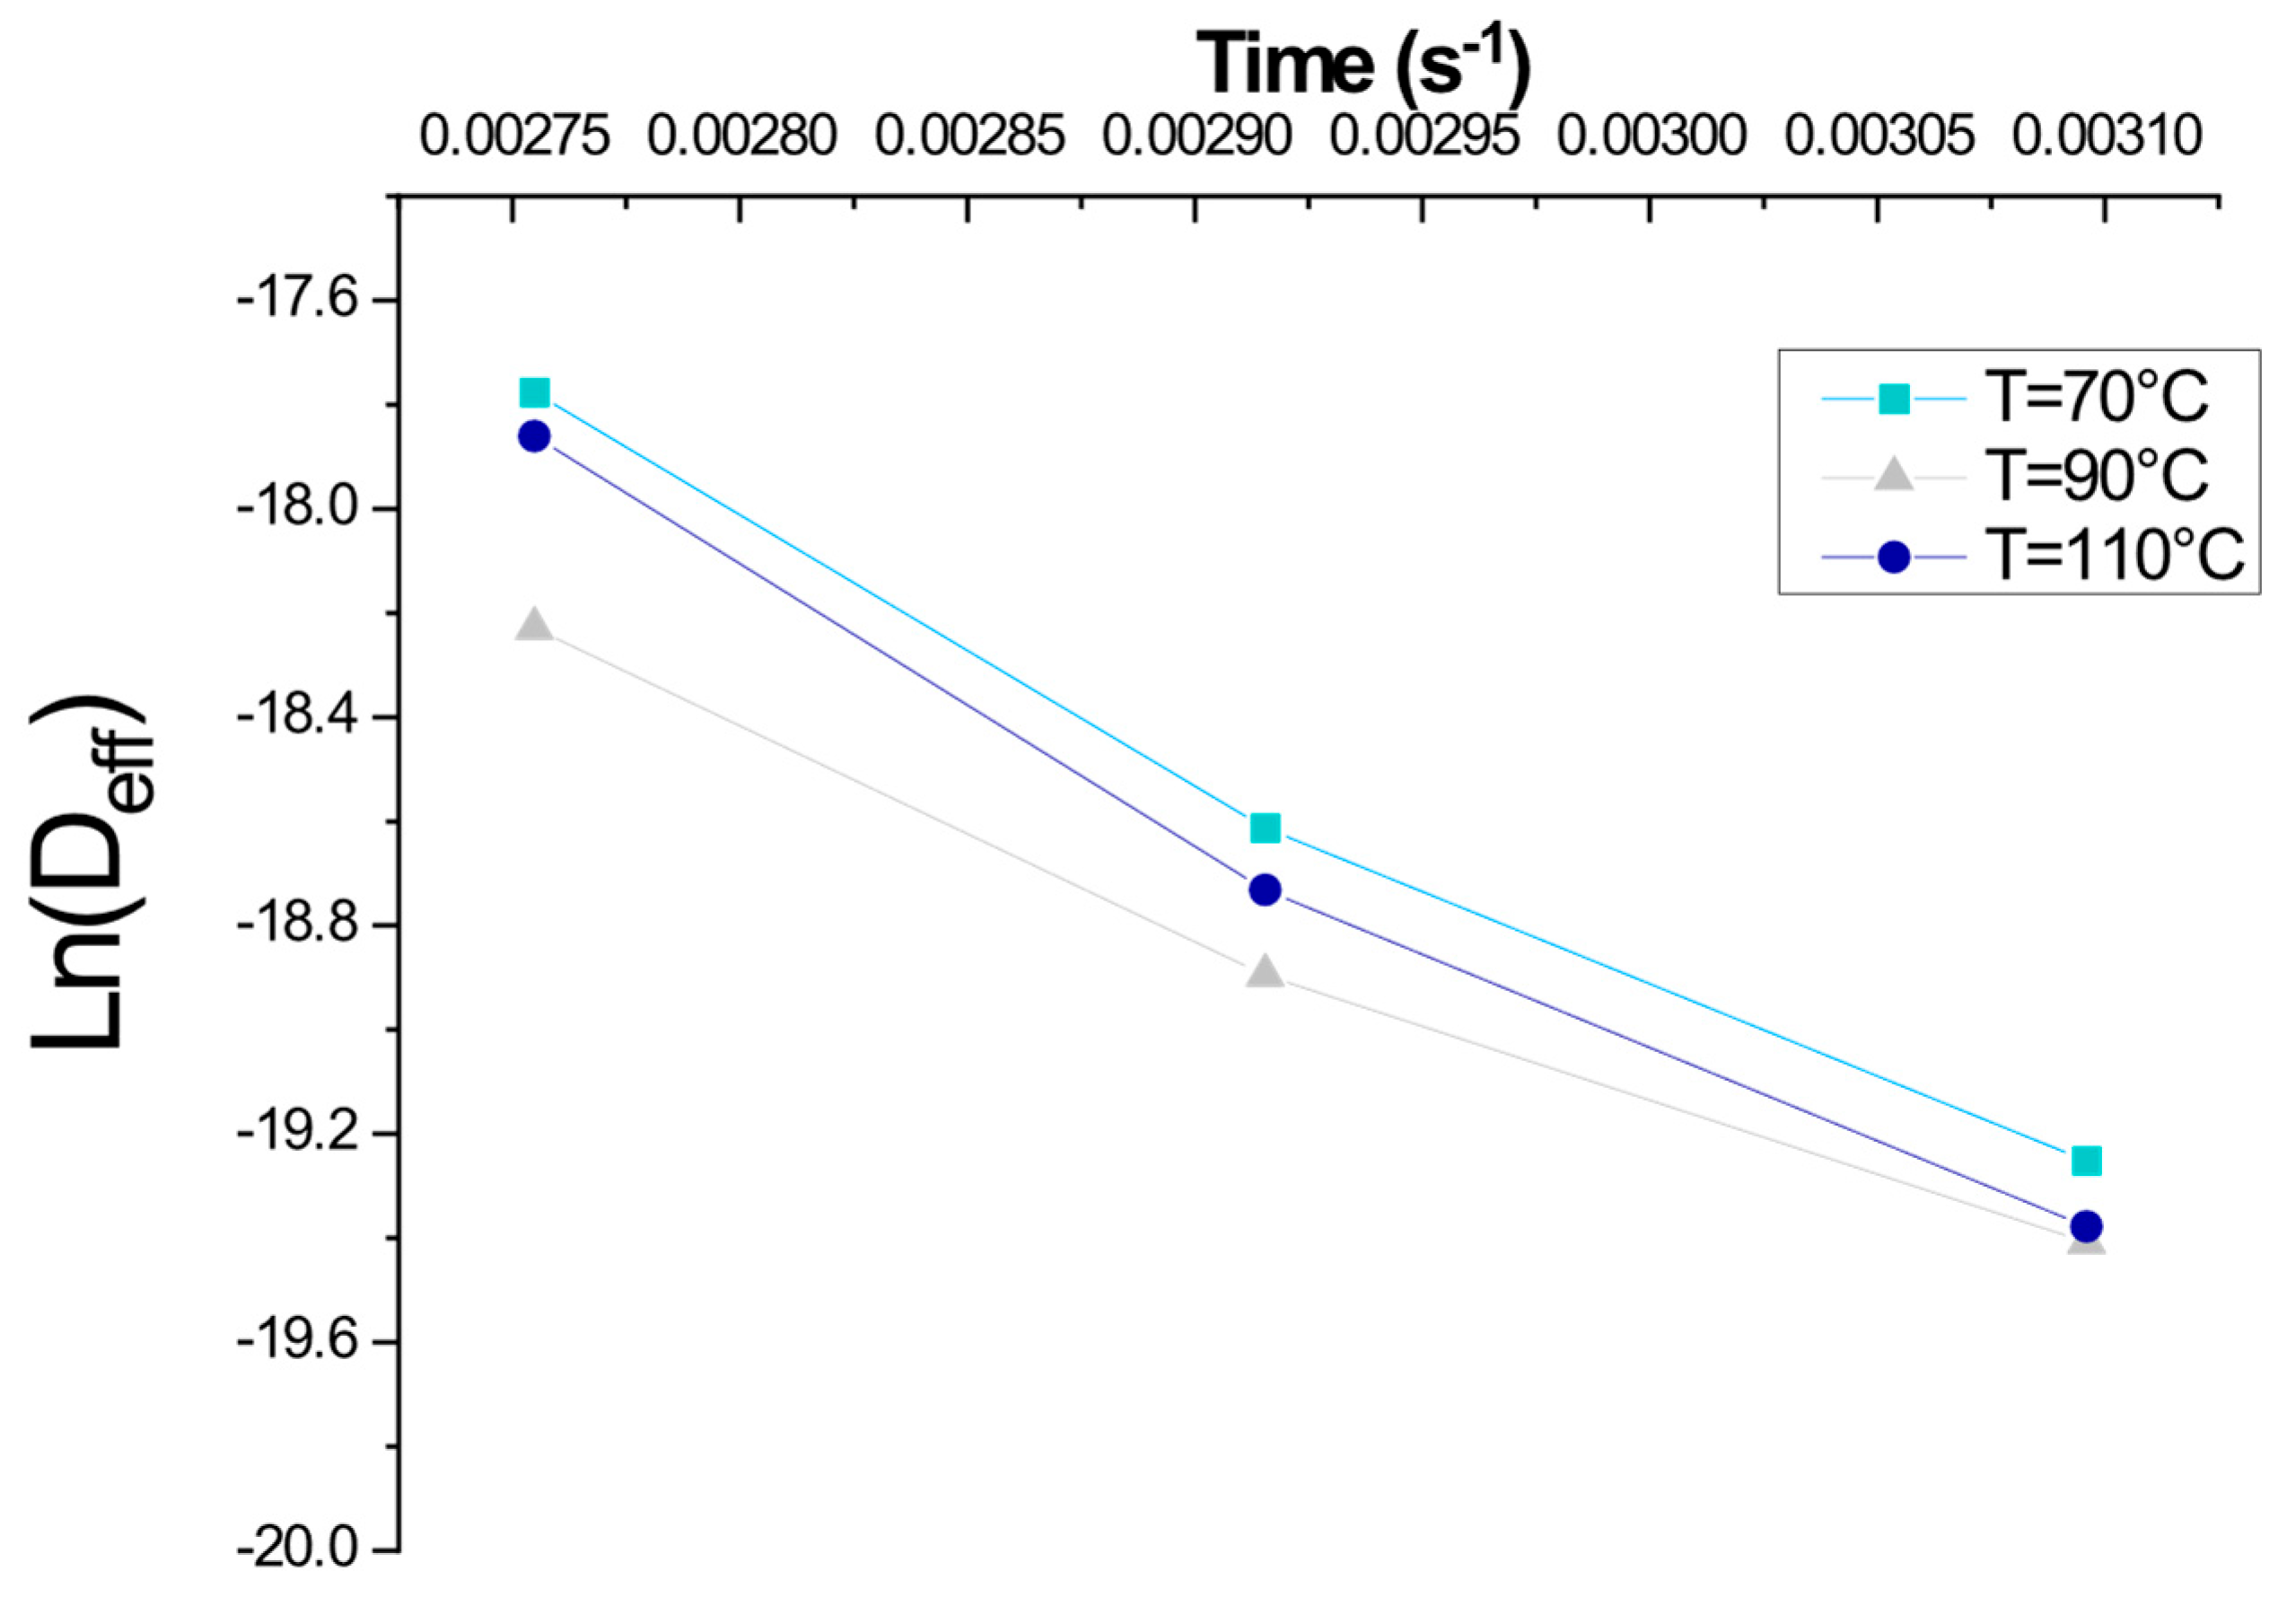
3.4. Activation Energy
4. Practical Applicability
5. Future Perspectives
- Scaling Up the Study: Future work should validate these results at an industrial scale, considering larger sludge volumes and different drying configurations to assess real-world applicability.
- Advanced Drying Optimization: The integration of machine learning models and intelligent control systems could enhance real-time monitoring and adaptive process control, improving energy efficiency dynamically based on sludge properties.
- Valorization Pathways: Investigating the potential reuse of dried hydroxide sludge in various industries, such as cement production, agriculture, or energy recovery, could further enhance sustainability in sludge management.
- Environmental Impact Assessment: A Life Cycle Assessment (LCA) would provide a holistic evaluation of the environmental footprint of different drying strategies, supporting decision-making for more sustainable wastewater treatment processes.
6. Conclusions
Author Contributions
Funding
Acknowledgments
Data Availability Statement
Conflicts of Interest
References
- Fantasse, A.; Lakhal, E.K.; Idlimam, A.; Kouhila, M.; Berroug, F.; El Haloui, Y. Management of Hydroxide Sludge Waste Using Hygroscopic Gravimetric Method and Physico-Chemical Characterization. Mater. Today Proc. 2020, 27, 3021–3027. [Google Scholar] [CrossRef]
- Benlalla, A.; Elmoussaouiti, M.; Cherkaoui, M.; Ait Hsain, L.; Assafi, M. Characterization and Valorization of Drinking Water Sludges Applied to Agricultural Spreading. J. Mater. Environ. Sci. 2015, 6, 1692–1698. [Google Scholar]
- Azeddine, F.; Khadir, L.E.; Ali, I.; Fatiha, B. Energy Efficiency of Drying Kinetics Process of Hydroxide Sludge Wastes in an Indirect Convection Solar Dryer. J. Sol. Energy Eng. 2021, 143, 041007. [Google Scholar] [CrossRef]
- Chahid, L.; Yaacoubi, A.; Bacaoui, A.; Lakhal, E. Valorization of Drinking Water Treatment Sludge (DWTS): Characterization and Applications as Coagulant and Sorbent for Olive Mill Wastewater (OMW). J. Mater. Environ. Sci. 2015, 6, 2520–2533. [Google Scholar]
- Azeddine, F.; Khadir, L.E.; Ali, I. Thermodynamic Analysis and Mathematic Modeling of Waste Sludge from Drinking Water Treatment Plants. J. Ecol. Eng. JEE 2022, 23, 140–149. [Google Scholar] [CrossRef]
- Midilli, A.; Kucuk, H.; Yapar, Z. Drying Technology: An International Journal A NEW MODEL FOR SINGLE-LAYER DRYING. Dry. Technol. 2002, 20, 37–41. [Google Scholar] [CrossRef]
- Léonard, A.; Blacher, S.; Marchot, P.; Pirard, J.P.; Crine, M. Drying Technology An International Journal Measurement of Shrinkage and Cracks Associated to Convective Drying of Soft Materials by X-Ray Microtomography. Dry. Technol. 2007, 22, 1695–1708. [Google Scholar] [CrossRef]
- Hidalgo, A.M.; Murcia, M.D.; Gómez, M.; Gómez, E.; García-Izquierdo, C.; Solano, C. Possible Uses for Sludge from Drinking Water Treatment Plants. J. Environ. Eng. 2016, 143, 04016088. [Google Scholar] [CrossRef]
- Fantasse, A.; Parra Angarita, S.; Léonard, A.; Lakhal, E.K.; Idlimam, A.; El Houssayne, B. Rheological Behavior and Characterization of Drinking Water Treatment Sludge from Morocco. Clean. Technol. 2023, 5, 259–274. [Google Scholar] [CrossRef]
- Fraikin, L.; Herbreteau, B.; Salmon, T.; Nicol, F.; Crine, M.; Léonard, A. Use of an Experimental Design to Characterize the Convective Drying Behavior of Different Sludges. Dry. Technol. 2015, 33, 1302–1308. [Google Scholar] [CrossRef]
- Leonard, A.; Blacher, S.; Marchot, P.; Crine, M. Use of X-Ray Microtomography to Follow the Convective Heat Drying of Wastewater Sludges. Dry. Technol. 2002, 20, 1053–1069. [Google Scholar] [CrossRef]
- Pambou, Y.B.; Fraikin, L.; Salmon, T.; Crine, M.; Léonard, A. Sludge Dewatering and Drying: About the Difficulty of Making Experiments with a Non-Stabilized Material. Desalination Water Treat. 2016, 57, 13841–13856. [Google Scholar] [CrossRef]
- Léonard, A.; Royer, S.; Blandin, G.; Salmon, T.; Fraikin, L.; Crine, M. Importance of Mixing Conditions during Sludge Liming Prior to Their Convective Drying. Eur. Dry. Conf. Palma Spain 2011, 26–28. [Google Scholar]
- Huron, Y.; Salmon, T.; Crine, M.; Blandin, G.; Léonard, A. Effect of Liming on the Convective Drying of Urban Residual Sludges. Asia-Pac. J. Chem. Eng. 2010, 5, 909–914. [Google Scholar] [CrossRef]
- Bennamoun, L.; Crine, M.; Léonard, A. Convective Drying of Wastewater Sludge: Introduction of Shrinkage Effect in Mathematical Modeling. Dry. Technol. 2013, 31, 643–654. [Google Scholar] [CrossRef]
- Bahammou, Y.; Tagnamas, Z.; Lamharrar, A.; Idlimam, A. Thin-Layer Solar Drying Characteristics of Moroccan Horehound Leaves (Marrubium vulgare L.) under Natural and Forced Convection Solar Drying. Sol. Energy 2019, 188, 958–969. [Google Scholar] [CrossRef]
- Cox, A.E.; Camberato, J.J.; Smith, B.R. Phosphate Availability and Inorganic Transformation in an Alum Sludge-affected Soil. J. Environ. Qual. 1997, 26, 1393–1398. [Google Scholar] [CrossRef]
- Rashvand, M.; Nadimi, M.; Paliwal, J.; Zhang, H.; Feyissa, A.H. Effect of Pulsed Electric Field on the Drying Kinetics of Apple Slices during Vacuum-Assisted Microwave Drying: Experimental, Mathematical and Computational Intelligence Approaches. Appl. Sci. 2024, 14, 7861. [Google Scholar] [CrossRef]
- Borah, A.; Hazarika, K.; Khayer, S.M. Drying Kinetics of Whole and Sliced Turmeric Rhizomes (Curcuma Longa L.) in a Solar Conduction Dryer. Inf. Process. Agric. 2015, 2, 85–92. [Google Scholar] [CrossRef]
- RuiXun, J.; Aimin, L.; Weiyun, W. Thin Layer Drying Characteristics and Kinetics Model of Dewatered Sludge. China Environ. Sci. 2009, 29, 22–25. [Google Scholar]
- Kai, L.; Xiao-Qian, M.A.; Han-Min, X. Experiment and kinetics model analysis on thin layer drying of paper mill sludge. J. Fuel Chem. Technol. 2011, 39, 149–154. [Google Scholar]
- Ameri, B.; Hanini, S.; Boumahdi, M. Influence of Drying Methods on the Thermodynamic Parameters, Effective Moisture Diffusion and Drying Rate of Wastewater Sewage Sludge. Renew. Energy 2020, 147, 1107–1119. [Google Scholar] [CrossRef]
- Bougayr, E.H.; Lakhal, E.K.; Idlimam, A.; Fantasse, A.; Lamharrar, A.; Kouhila, M.; Abdenouri, N.; Berroug, F. Experimental Study and Modeling of Drying Kinetics and Evaluation of Thermal Diffusivity of Sewage Sludge. Key Eng. Mater. 2023, 954, 55–71. [Google Scholar] [CrossRef]
- Azeddine, F.; El Khadir, L.; Ali, I. Experimental Investigation of Solar Greenhouse Drying of Hydroxide Sludge under Summer and Winter Climate. Pol. J. Environ. Stud. 2022, 31, 1025–1036. [Google Scholar] [CrossRef]
- Bougayr, E.H.; Bahammou, Y.; Fantasse, A.; Lakhal, E.K.; Berroug, F.; Bouziane, A.; Idlimam, A. Stabilization of Sewage Sludge from North Moroccan Wastewater Treatment Plants Using Convective Indirect Solar Drying. Ecol. Eng. Environ. Technol. 2024, 25, 1–16. [Google Scholar] [CrossRef]


| Factors | |||||
|---|---|---|---|---|---|
| Variable | Abbreviation | Units | − | 0 | + |
| Temperature | T | °C | 70 | 90 | 110 |
| Air speed | Va | m/s | 1 | 2 | 3 |
| Diameter | D | mm | 12 | ||
| Height | H | mm | 15 | ||
| Responses | |||||
| Drying time | Dt | Min | |||
| Evaporation rate | Mv | kgwater/min | |||
| Critical moisture | Xc | kgwater/KgDS | |||
| Total shrinkage | %Sh | %Voloss | |||
| Air Velocity | Sample Images During Drying at T = 110 °C | ||||
|---|---|---|---|---|---|
| 1 m/s | 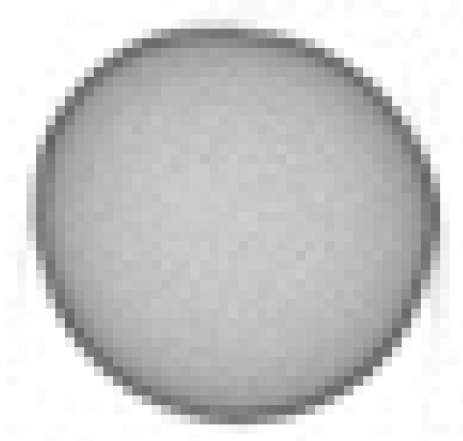 |  | 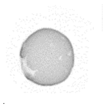 | 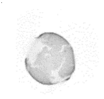 |  |
| W = 5.4 | W = 3.7 | W = 2.1 | W = 1.5 | W = 0 | |
| 2 m/s | 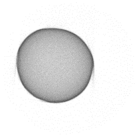 | 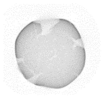 |  |  |  |
| W = 5.3 | W = 3.4 | W = 1.9 | W = 1.2 | W = 0 | |
| 3 m/s | 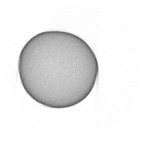 |  |  |  |  |
| W = 5.4 | W = 3 | W = 1.8 | W = 0.9 | W = 0 | |
| Air Velocity (m/s) | Temperature (°C) | Deff (m2s−1) | Ea (J/mol) | r |
|---|---|---|---|---|
| 1 | 110 | 1.75 × 10⁻⁸ | 32,547.04 | 0.996 |
| 90 | 7.33 × 10⁻⁹ | 32,213.81 | 0.985 | |
| 70 | 3.84 × 10⁻⁹ | 31,879.23 | 0.897 | |
| 2 | 110 | 1.21 × 10⁻⁸ | 33,785.47 | 0.994 |
| 90 | 6.22 × 10⁻⁹ | 33,698.51 | 0.974 | |
| 70 | 3.73 × 10⁻⁹ | 32,987.31 | 0.989 | |
| 3 | 110 | 1.04× 10⁻⁸ | 33,457.21 | 0.975 |
| 90 | 8.25 × 10⁻⁹ | 32,496.93 | 0.996 | |
| 70 | 4.36 × 10⁻⁹ | 31,548.63 | 0.938 |
Disclaimer/Publisher’s Note: The statements, opinions and data contained in all publications are solely those of the individual author(s) and contributor(s) and not of MDPI and/or the editor(s). MDPI and/or the editor(s) disclaim responsibility for any injury to people or property resulting from any ideas, methods, instructions or products referred to in the content. |
© 2025 by the authors. Licensee MDPI, Basel, Switzerland. This article is an open access article distributed under the terms and conditions of the Creative Commons Attribution (CC BY) license (https://creativecommons.org/licenses/by/4.0/).
Share and Cite
Fantasse, A.; Parra-Angarita, S.L.; Lakhal, E.K.; Idlimam, A.; Bougayr, E.H.; Léonard, A. Exploring Convective Drying Behavior of Hydroxide Sludges Through Micro-Drying Systems. Appl. Sci. 2025, 15, 3470. https://doi.org/10.3390/app15073470
Fantasse A, Parra-Angarita SL, Lakhal EK, Idlimam A, Bougayr EH, Léonard A. Exploring Convective Drying Behavior of Hydroxide Sludges Through Micro-Drying Systems. Applied Sciences. 2025; 15(7):3470. https://doi.org/10.3390/app15073470
Chicago/Turabian StyleFantasse, Azeddine, Sergio Luis Parra-Angarita, El Khadir Lakhal, Ali Idlimam, El Houssayne Bougayr, and Angélique Léonard. 2025. "Exploring Convective Drying Behavior of Hydroxide Sludges Through Micro-Drying Systems" Applied Sciences 15, no. 7: 3470. https://doi.org/10.3390/app15073470
APA StyleFantasse, A., Parra-Angarita, S. L., Lakhal, E. K., Idlimam, A., Bougayr, E. H., & Léonard, A. (2025). Exploring Convective Drying Behavior of Hydroxide Sludges Through Micro-Drying Systems. Applied Sciences, 15(7), 3470. https://doi.org/10.3390/app15073470