1. Introduction
With the rapid advancement of artificial intelligence, affective computing has emerged as a valuable tool in the preservation and dissemination of digital cultural heritage, particularly in enhancing public emotional resonance and interactive cultural experiences. The rise of large language models such as GPT-4.5, QwenLM, and DeepSeek, along with virtual reality technologies, has driven affective computing beyond traditional single-modal analyses to multimodal data fusion [
1,
2], improving both the accuracy of cultural heritage communication and user immersion [
3,
4].
However, in the face of diverse societal needs, the presentation and dissemination of cultural heritage still encounter several challenges. First, the interpretation of cultural heritage is inherently complex, as its symbolic and historical meanings are often abstract and difficult for the public to fully comprehend [
5]. Second, analyses of user-generated data on social media remain challenging, as it is difficult to precisely extract users’ key cultural interests and engagement points. Existing studies have typically been limited to either text-based sentiment analyses or image recognition, lacking a comprehensive multimodal approach [
6]. As a result, they have failed to integrate multi-source data, uncover deep semantic relationships, and effectively capture authentic emotional feedback from the public on cultural heritage.
Additionally, in commercialized historical districts, the presentation of cultural information is often overshadowed by commercial elements, leading to a weak cultural perception. The current heritage display methods lack emotion-driven optimization, making it difficult to enhance visitors’ cultural understanding and emotional engagement.
This challenge is particularly evident in Qianmen Street, Beijing, a historically significant commercial district located along Beijing’s cultural axis [
7]. This area features a rich blend of historical architecture, commercial culture, and artistic elements, serving as a representative case of cultural heritage conservation and commercial development [
8].
To address these challenges, this study leverages affective computing and large language models to develop an innovative approach to multimodal cultural information mining and personalized presentation. By utilizing AI-driven methods, this study aims to precisely identify users’ interests in the cultural aspects of commercial historical districts like Qianmen Street, ultimately enhancing the visitor experience.
The primary contributions of this study are as follows:
Proposing an LLM-based cultural information mining method that integrates affective computing. This method utilizes the QwenLM and RoBERTa pre-trained models to conduct a sentiment analysis on UGC, quantifying the emotional tendencies and multilayered cultural perceptions across different users. Additionally, it explores how distinct emotional features influence cultural experiences.
Developing a multimodal affective model driven by emotion-based feedback, which establishes semantic associations between text and image data in UGC. This model computes the sentiment tendencies across various cultural dimensions and maps these results into an interactive VR environment, enabling personalized and immersive cultural heritage presentations that enhance user cognition and emotional engagement.
Validating the effectiveness of the optimization of information presentation through eye-tracking experiments, analyzing how different presentation styles impact the distribution of user attention, emotional engagement, and cognitive load. This study further reveals how emotion-driven personalization enhances the dissemination and impact of cultural heritage information.
This approach provides a systematic and AI-driven solution for improving the cultural experience in commercial historical districts, addressing key challenges in cultural heritage interpretation, sentiment analysis, and multimodal data integration.
2. Related Work
2.1. Affective Computing in Cultural Heritage
Cultural heritage not only preserves historical memory but also embodies the collective emotional experiences of human society. Yang et al. [
9] conducted an empirical study involving 397 visitors at the Mogao Caves in Dunhuang. Using a structural equation model for the quantitative analysis, this study found that visitors’ emotional experiences at cultural heritage sites had a significant positive impact on their cultural identity, learning, and conservation awareness, validating the importance of emotional experiences in heritage preservation.
Affective computing has been widely applied to analyzing users’ emotional tendencies and interest points in cultural heritage. Sentiment analysis techniques enable in-depth mining of visitor feedback, accurately identifying their attitudes and emotional changes, thus playing a crucial role in strengthening the connection between cultural heritage and its audience [
10,
11]. In the field of text analysis, NLP models based on the Transformer architecture have increasingly been used for sentiment mining in cultural heritage reviews and travelogues. For example, Ehrmann et al. [
12] employed the BERT model to recognize and classify named entities in historical documents, providing a structured historical knowledge extraction method and demonstrating its efficiency and accuracy in processing large-scale corpora.
Trichopoulos [
13] integrated LLMs to automatically generate emotionally aligned narratives that matched historical and cultural contexts, enabling dynamic content adaptation in interactive museum guides. Ferracani et al. [
3] combined GPT-4 with image generation technology to develop an interactive storytelling system based on users’ emotional feedback, offering visitors personalized cultural experiences. Wang et al. (2024) [
4] constructed a knowledge graph for Tang Dynasty gold and silver artifacts using the BERT model, enabling emotion-driven visualization of cultural content and allowing visitors to explore heritage based on their interests and emotional preferences.
Most of the current studies on cultural emotion data mining rely solely on single-modal text or image sentiment analyses, lacking multimodal information fusion. Consequently, they fail to capture the associations between different modalities, potentially missing comprehensive emotional signals. Furthermore, the existing research primarily focuses on data analysis rather than incorporating its findings into personalized cultural information displays, resulting in a disconnect between data mining and the presentation of user experience.
2.2. The Application of Large Language Models in User-Generated Content
User-generated content provides rich data for cultural heritage research, reflecting public attitudes, interests, and emotions toward specific cultural heritage sites, thereby offering insights into user needs [
14,
15]. Xu et al. [
16] demonstrated that analyzing UGC significantly influences tourists’ perceived value of a destination.
Abuzayed and Al-Khalifa [
17] utilized the BERTopic tool, integrating deep-learning-based text embeddings and clustering techniques to extract hidden topics from social media data and analyzing users’ focus on architectural styles and historical narratives. Guan et al. [
18] applied deep learning to topic modeling for visitor reviews, examining audience interest in the historical background of exhibits. Catelli et al. [
19] combined the BERT and ELECTRA models for sentiment deception detection in reviews of Italian cultural heritage, identifying fake reviews and supporting service improvements in heritage management. Khan et al. [
20] leveraged ChatGPT to enhance their understanding of users’ emotions in social media feedback, demonstrating that LLMs could effectively analyze UGC, capture implicit emotional information on social platforms, and improve the accuracy of sentiment computation models. Jiménez-Díaz et al. [
21] employed a clustering analysis to examine the public’s sense of belonging in UGC, mapping different citizen groups’ cultural interaction patterns to interpretable emotional dimensions.
Most LLM-based studies on UGC have remained limited to single-text or single-image analyses [
22,
23], with few integrating multiple data types for a relational analysis. Moreover, the existing models process all of the text indiscriminately without distinguishing cultural categories for sentiment insights. This study aims to address these limitations by optimizing the automated classification based on predefined cultural value dimensions, generating structured text data, and focusing on a multidimensional sentiment analysis.
2.3. Cultural Information Display in Virtual Reality
Many researchers have explored the relationship between visual information design and user experience in human–computer interaction interfaces. Afzal et al. [
1] proposed that a stronger presence in virtual reality experiences can elicit positive emotional responses, leading to psychological benefits. Okanovic et al. [
24] applied Extended Reality technology to integrating digital storytelling into museum exhibitions, reconstructing historical scenes and digitized objects to present rich humanistic and historical information.
Makransky and Petersen [
25] utilized VR technology to reconstruct historical buildings and murals, significantly enhancing users’ historical knowledge acquisition and memory retention through virtual interaction. Marto et al. [
26] investigated the application of augmented reality (AR) technology in cultural heritage education. Their study integrated visual, auditory, and tactile interactions, demonstrating that multimodal interactions enhance user engagement and improve memory retention. Li et al. [
27] employed an eye-tracking analysis to evaluate the visual perception of traditional Chinese commercial streets, discovering that users’ visual focus was often drawn to distinctive spatial features such as arcade corridors, horsehead walls, and landmark buildings. This finding suggests that the design of traditional commercial streets should consider these elements. Casillo et al. [
28] proposed an adaptive multimodal recommendation system that integrated physical and virtual experiences into cultural tourism, optimizing the cultural content recommendations using semantic methods and probabilistic graphical modeling to improve users’ perception of cultural information.
The existing research primarily focuses on visual information design, historical content reproduction, and enhancements in immersion. However, it overlooks users’ emotional feedback in personalized information displays, failing to adequately consider users’ emotional states.
2.4. Summary
While previous research has made significant progress, most of these studies have relied on single-modal data analyses, lacking multimodal information fusion. Additionally, the research remains at the data analysis level without effectively integrating its results into personalized cultural displays. Therefore, this study proposes a novel approach to cultural information mining and personalized presentation by integrating affective computing, LLMs, and VR technology. This framework establishes a comprehensive pipeline from data to the user experience, promoting personalized, emotionally driven, and intelligent cultural heritage presentations.
3. Methodology
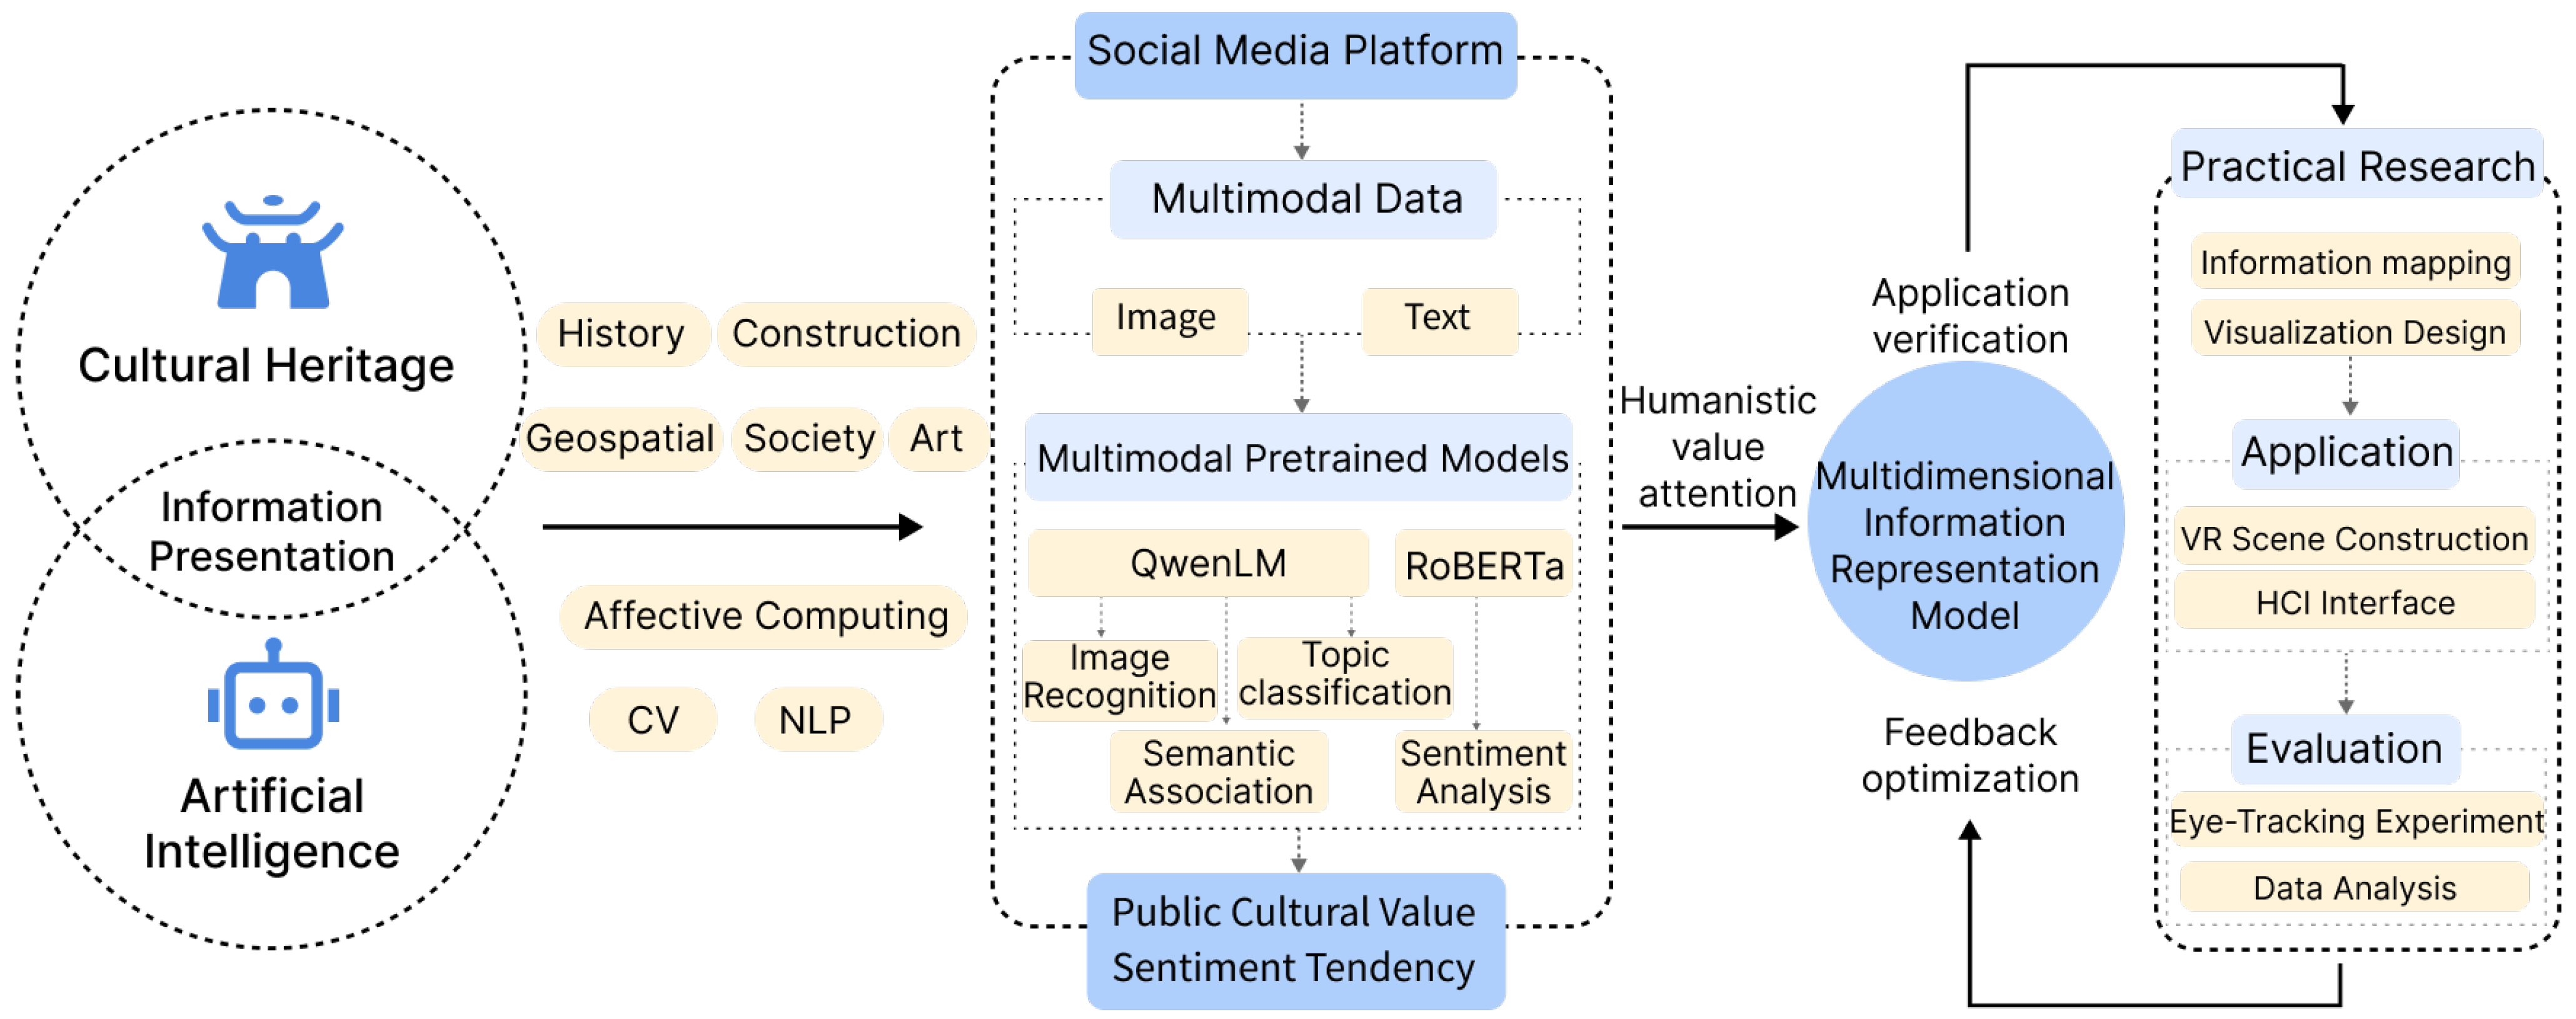
In the field of cultural heritage information presentation, user-generated content (UGC) on social media platforms provides a rich source of emotional feedback. However, accurately extracting user sentiment and effectively presenting cultural information remain challenging due to the unstructured nature of the data, modality differences, and semantic ambiguities. The traditional text-based sentiment analysis methods struggle to capture the deep semantic associations within multimodal data, while purely computer-vision-based approaches fail to interpret users’ cognitive perceptions of cultural content.
To address these limitations, this study proposes a multimodal affective computing method based on large language models (as shown in
Figure 1). This approach enhances the understanding of user emotions in cultural heritage presentations and improves the accuracy of the information visualization. The emotional data results are further structured into a Multidimensional Information Representation Model, which serves as the basis for designing an interactive interface that reflects various cultural dimensions of Qianmen Street. The proposed method is validated through an eye-tracking experiment in a VR environment, assessing its effectiveness in optimizing cultural information presentation and user engagement.
3.1. Constructing a Cultural Value Assessment Framework
Building upon existing research on architectural cultural heritage [
29], this study develops a cultural value assessment system tailored to commercial heritage buildings such as those on Qianmen Street. This framework evaluates cultural heritage across seven key dimensions: historical, geographical, architectural, social, artistic, service-oriented, and educational (as shown in
Table 1).
To refine and validate this framework, UGC from social media was analyzed. Specifically, 1586 valid user reviews were collected from the Dianping platform. The textual data were processed using Jieba word segmentation, with stop words removed, and representative keywords were extracted using an analysis of high-frequency words. This method ensures systematic classification of the data while comprehensively covering cultural information. Furthermore, it establishes clear thematic classification rules, enhancing the precision of cultural heritage information mining and the feasibility of a multidimensional analysis.
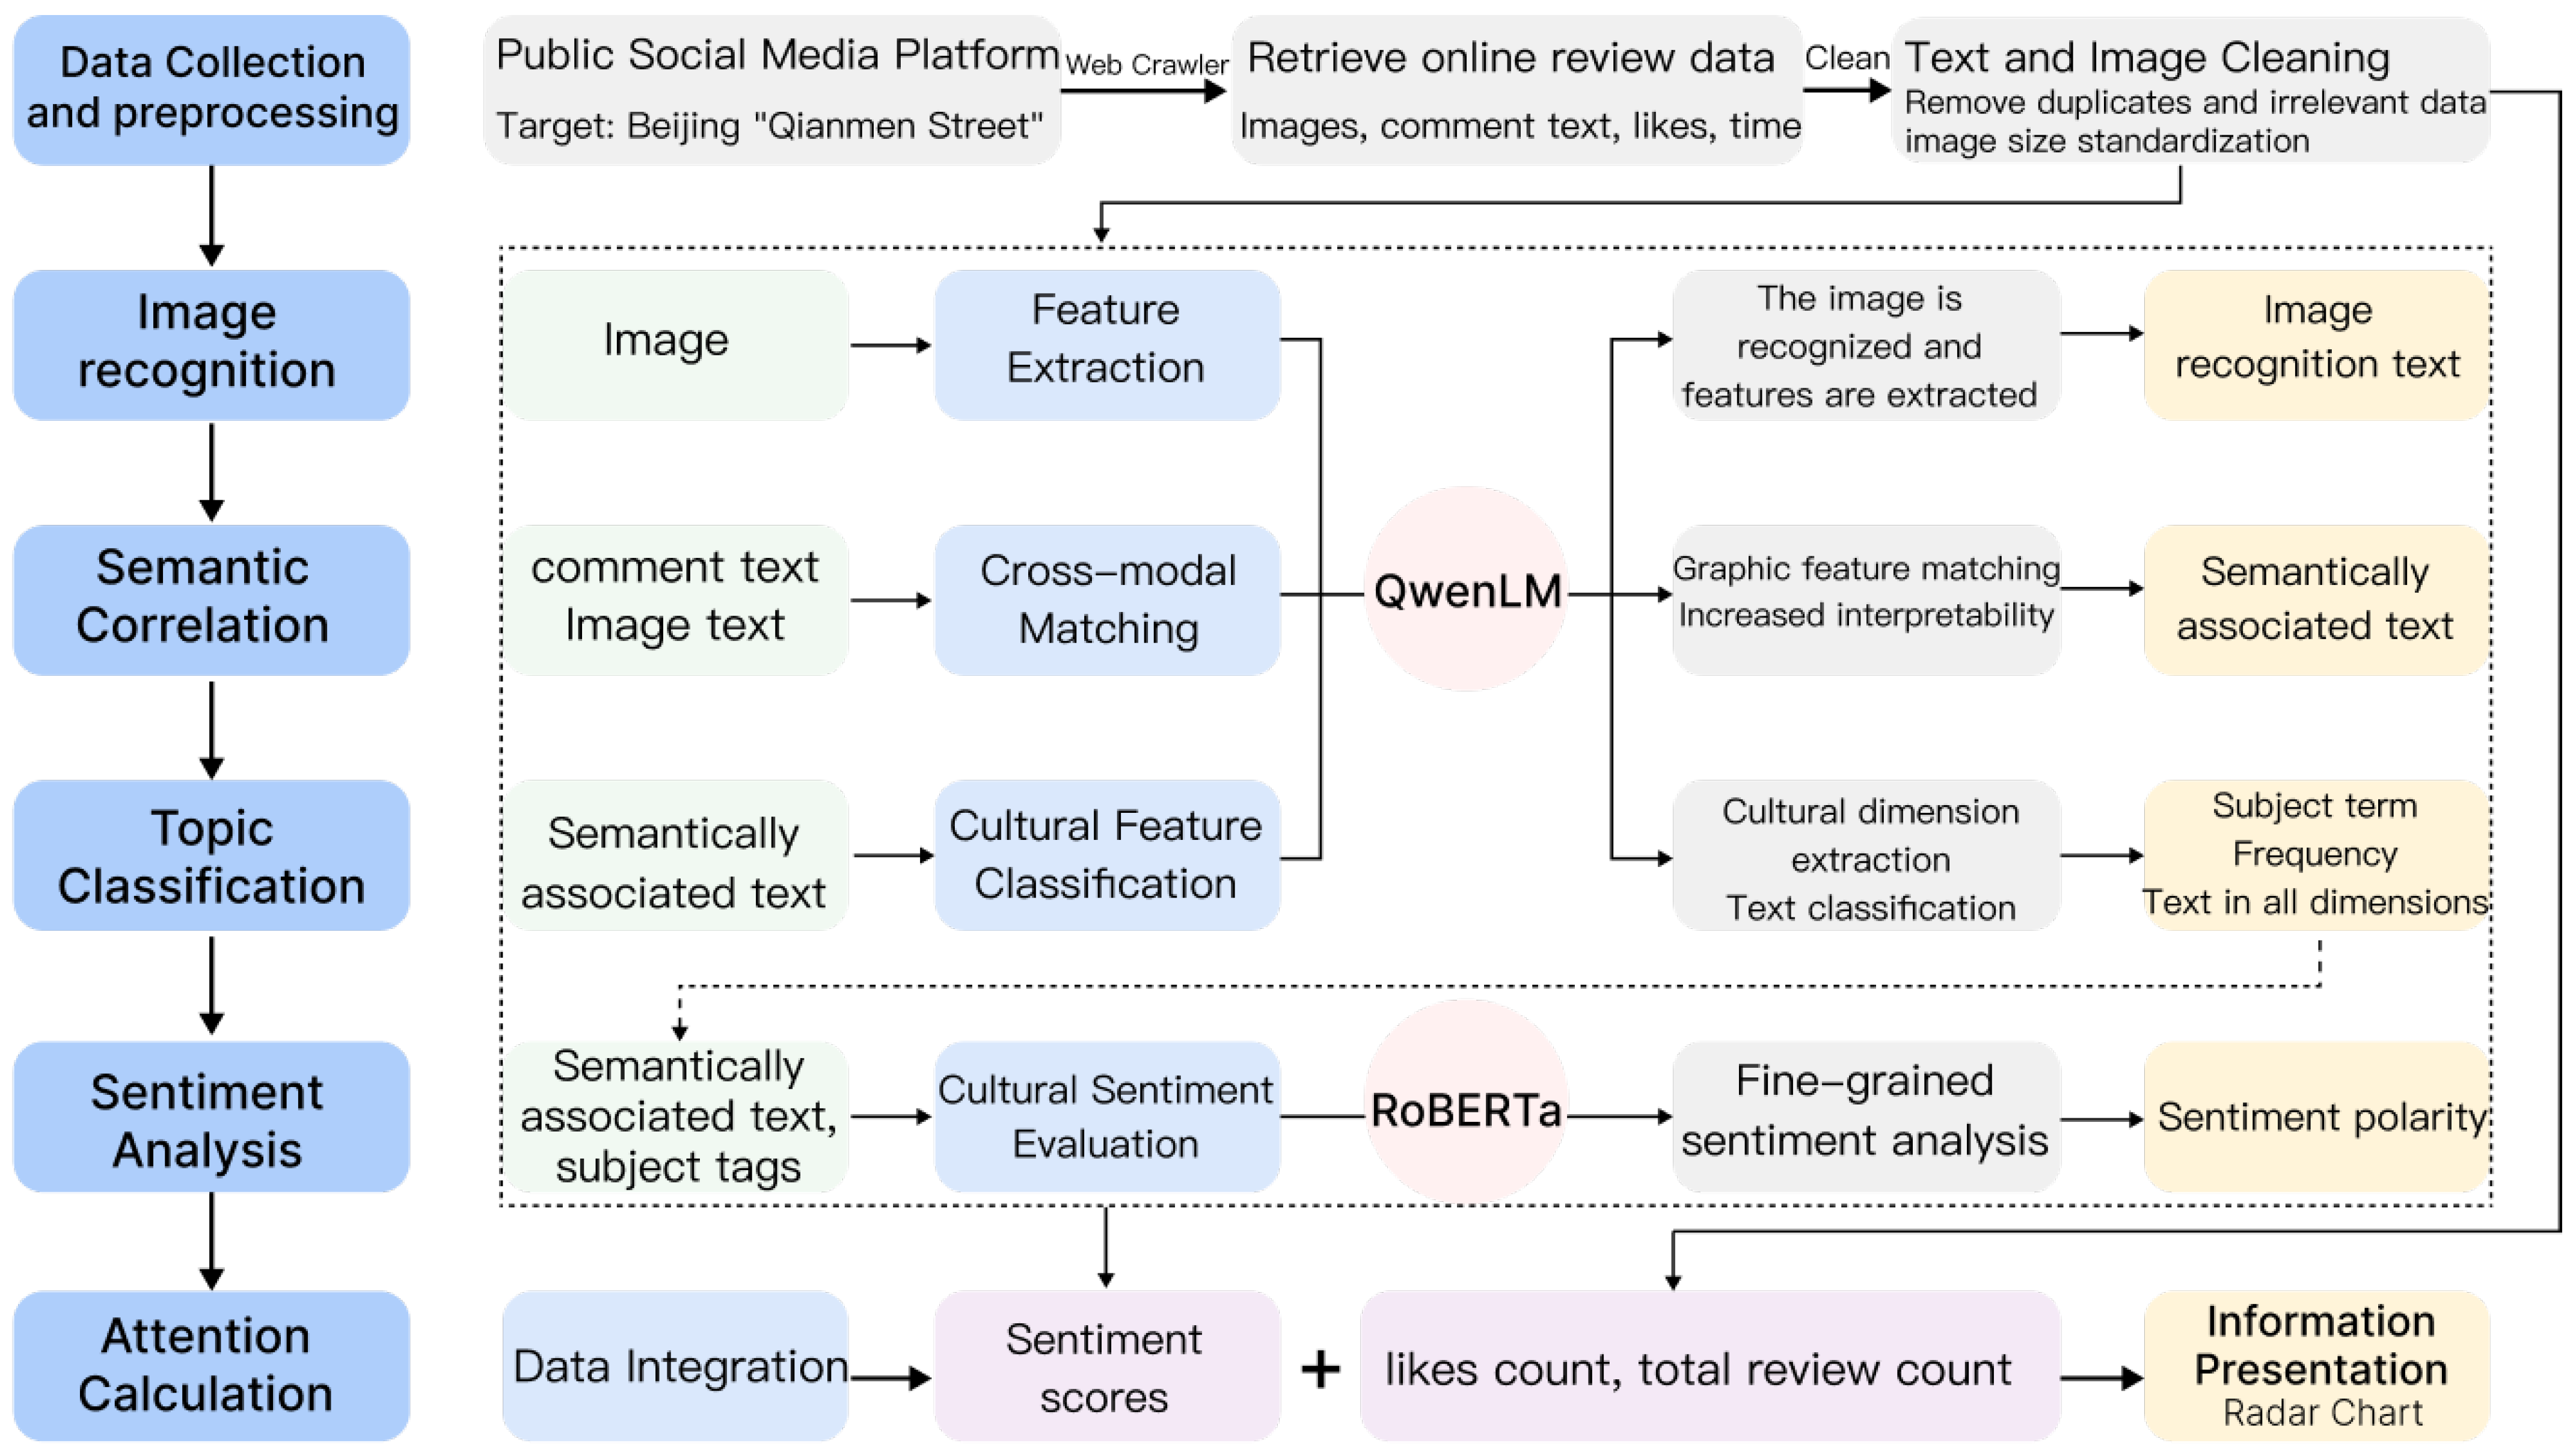
3.2. Large-Model-Assisted Multimodal Data Processing
During the data processing stage, the pre-trained models QwenLM (Qwen2-VL-7B-Instruct, Qwen2.5-Coder-32B-Instruct) and RoBERTa (roberta-base-go-emotions, twitter-roberta-base-sentiment-latest) were employed to analyze the text and image data from social media platforms. This approach enabled a systematic workflow encompassing the data collection, feature extraction, multimodal semantic fusion, and information presentation (as illustrated in
Figure 2). First, UGC was scraped for the target scenario and cleaned. Then, the QwenLM model was applied for image feature extraction, followed by cross-modal matching to semantically associate the user text with image features. This resulted in semantically enriched cross-modal information. Subsequently, QwenLM categorized and extracted the cultural theme dimensions, while the RoBERTa model conducted a fine-grained sentiment analysis, quantifying users’ emotional polarity and its distribution across cultural dimensions.
3.3. Data Collection and Analysis
Data were collected from user reviews of eight representative architectural and cultural landmarks within Qianmen Street and its surrounding commercial area, sourced from travel platforms such as Dianping. The dataset included 9207 valid text reviews and 29,742 images, as detailed in
Table 2.
Using the Qwen2-VL-7B-Instruct model, the image features were extracted and mapped to cultural value themes through rigorously designed prompts, converting visual content into analyzable textual information. Subsequently, based on the predefined cultural value dimensions, a targeted prompt strategy was developed, and the Qwen2.5-Coder-32B-Instruct model was employed for text parsing, labeling, and classification. This process ensured that the extracted data were accurately aligned with the established cultural value framework. The proposed method efficiently processes large-scale data, enabling precise cultural information extraction and laying a robust foundation for subsequent sentiment analyses and user interest modeling.
During the data integration process, textual data and extracted image text are first subjected to semantic matching to enhance the correlation between different modalities (as illustrated in
Figure 3). Subsequently, based on the seven predefined cultural value dimensions (historical, geographical, architectural, social, artistic, service-oriented, and educational), a thematic clustering method is employed for automatic classification, with a model-based discrimination mechanism further optimizing the classification accuracy.
When the AI identifies that a user review or image text pertains to a specific cultural dimension, the relevant content is tagged and assigned to this category. If no relevant content is detected, the system marks the dimension as “None”, and in the subsequent sentiment analysis calculations, the probabilities for positive, neutral, and negative sentiments are all set to zero.
Once semantic matching and thematic clustering are complete, the system organizes and stores the data according to cultural dimension labels, ensuring that each dimension’s content can be presented independently. Ultimately, each user review is structurally segmented across the different cultural value dimensions, forming a multimodal cultural evaluation dataset that integrates textual and visual information. This structured dataset establishes a robust foundation for sentiment analysis and user interest modeling.
3.4. Public Cultural Value Sentiment Extraction
After associating and categorizing the multimodal data, sentiment analysis techniques were applied to extracting the public cultural value sentiment tendencies from user comments. The twitter-roberta-base-sentiment-latest model analyzed the sentiment tendencies in the categorized text data, calculating the probability distribution for three sentiment categories: positive, neutral, and negative. Furthermore, the roberta-base-go-emotions model identified 28 emotional tendencies, including calm, admiration, disappointment, anger, confusion, and more, for each comment. By combining interaction metrics such as likes and comments, key metrics such as the attention, sentiment score, and intensity index for each dimension were calculated.
3.5. Formulas for Key Metrics
The number of followers serves as an indicator of a user’s level of engagement with a specific cultural dimension. This is determined by aggregating the weighted support counts of all valid comments across various value dimensions, where the weight of each comment is calculated as the number of likes it has received plus one. The “+1” accounts for the comment’s author, while the number of likes represents the supporters of that comment. This metric reflects the total scale of user support for the viewpoints within that dimension, and it forms the fundamental basis for measuring user participation.
- 2.
Attention Ratio (A)
The Attention Ratio measures the proportion of user focus on a specific cultural dimension relative to the overall user attention. It is calculated by determining the ratio of the attention for each dimension to the total attention across all dimensions.
- 3.
Sentiment Score (E)
The sentiment score focuses on the positive and negative tendencies of comments. The weighted sum of the sentiment differences is calculated, with the attention metric serving as a weight factor:
- 4.
Satisfaction (S)
Satisfaction is calculated based on the sentiment score, normalized by the total amount of user attention to the dimension. It serves to measure the combined intensity of emotions and user engagement within that dimension. Satisfaction is computed as the ratio of the sentiment score to the amount of user attention.
This metric reflects the quality of users’ focus and the emotional bias in the given dimension. It provides a unified quantitative framework for evaluating cultural value dimensions. Through rigorous data processing and calculation methods, it quantifies users’ emotional tendencies toward the cultural value of Qianmen Street.
3.6. The Multidimensional Information Model for Qianmen Street
The social media content for Qianmen Street was analyzed following topic modeling, a semantic analysis, and sentiment calculation, and the processed data were visualized into a multidimensional information model, as presented in
Figure 4. This revealed variations in different cultural dimensions within commercial heritage sites, uncovering hidden multilayered features and insights across dimensions. Overall, these cultural presentations can be categorized into four primary forms.
3.6.1. High Attention, High Emotion
These cultural dimensions not only attract a large volume of visitor attention but also evoke strong emotional resonance, indicating their significant influence and appeal in cultural presentation. Such dimensions serve as the core of visitor experiences, enhancing engagement and satisfaction through emotional connections. For example, the high attention and emotional intensity in the art appreciation dimension for Quanyechang suggest that its cultural display is both visually appealing and emotionally compelling, strengthening visitor engagement and satisfaction. The data analysis indicates a positive correlation between attention and emotional involvement in the art appreciation dimension, with interactive displays further enhancing emotional participation. Similarly, Xianyukou exhibits high attention and emotional intensity in the socio-cultural dimension, demonstrating that its local folk traditions and cultural heritage effectively resonate with visitors’ emotional needs. The fusion of emotional identity and cultural memory enhances the overall visitor experience.
3.6.2. High Attention, Low Emotion
These dimensions attract a large amount of visitor attention, but their emotional response remains subdued. This may be due to a lack of emotional engagement in the presentation format or an overly static approach to display. To enhance emotional involvement, it is essential to improve the interactivity, immersion, and narrative depth, thereby evoking stronger emotional connections. For instance, Zhengyang Gate and the Arrow Tower show high attention but a low emotional response in the historical dimension. Despite their strong appeal, the current historical display methods fail to evoke deep emotional resonance among visitors. The low emotional engagement may stem from a lack of variety or an overly abstract presentation, which fails to create a meaningful emotional connection.
3.6.3. Low Attention, High Emotion
This category includes cultural dimensions with low visibility but strong emotional intensity, suggesting that these elements evoke deep emotional responses once they are discovered. Such dimensions are often underrepresented or not actively promoted, yet they hold significant intrinsic emotional value and present untapped potential. For example, while Quanjude’s art appreciation dimension receives relatively low attention, its high emotional response highlights the deep emotional connection with traditional cultural artistry within the dining experience. By enhancing the variety and depth of cultural presentations, emotional engagement can be amplified further.
3.6.4. Low Attention, Low Emotion
These dimensions exhibit both low attention and a low emotional response, indicating that their current presentation fails to effectively engage visitors. For example, the guided interpretation at the Arrow Tower does not attract significant visitor interest, possibly due to the monotony, lack of depth, or insufficient interactivity of the content. Guided narratives should not only serve as tools for conveying historical information but also integrate emotionally engaging storytelling techniques. If the presentation remains static or outdated, this may result in visitor disengagement and decreased emotional intensity.
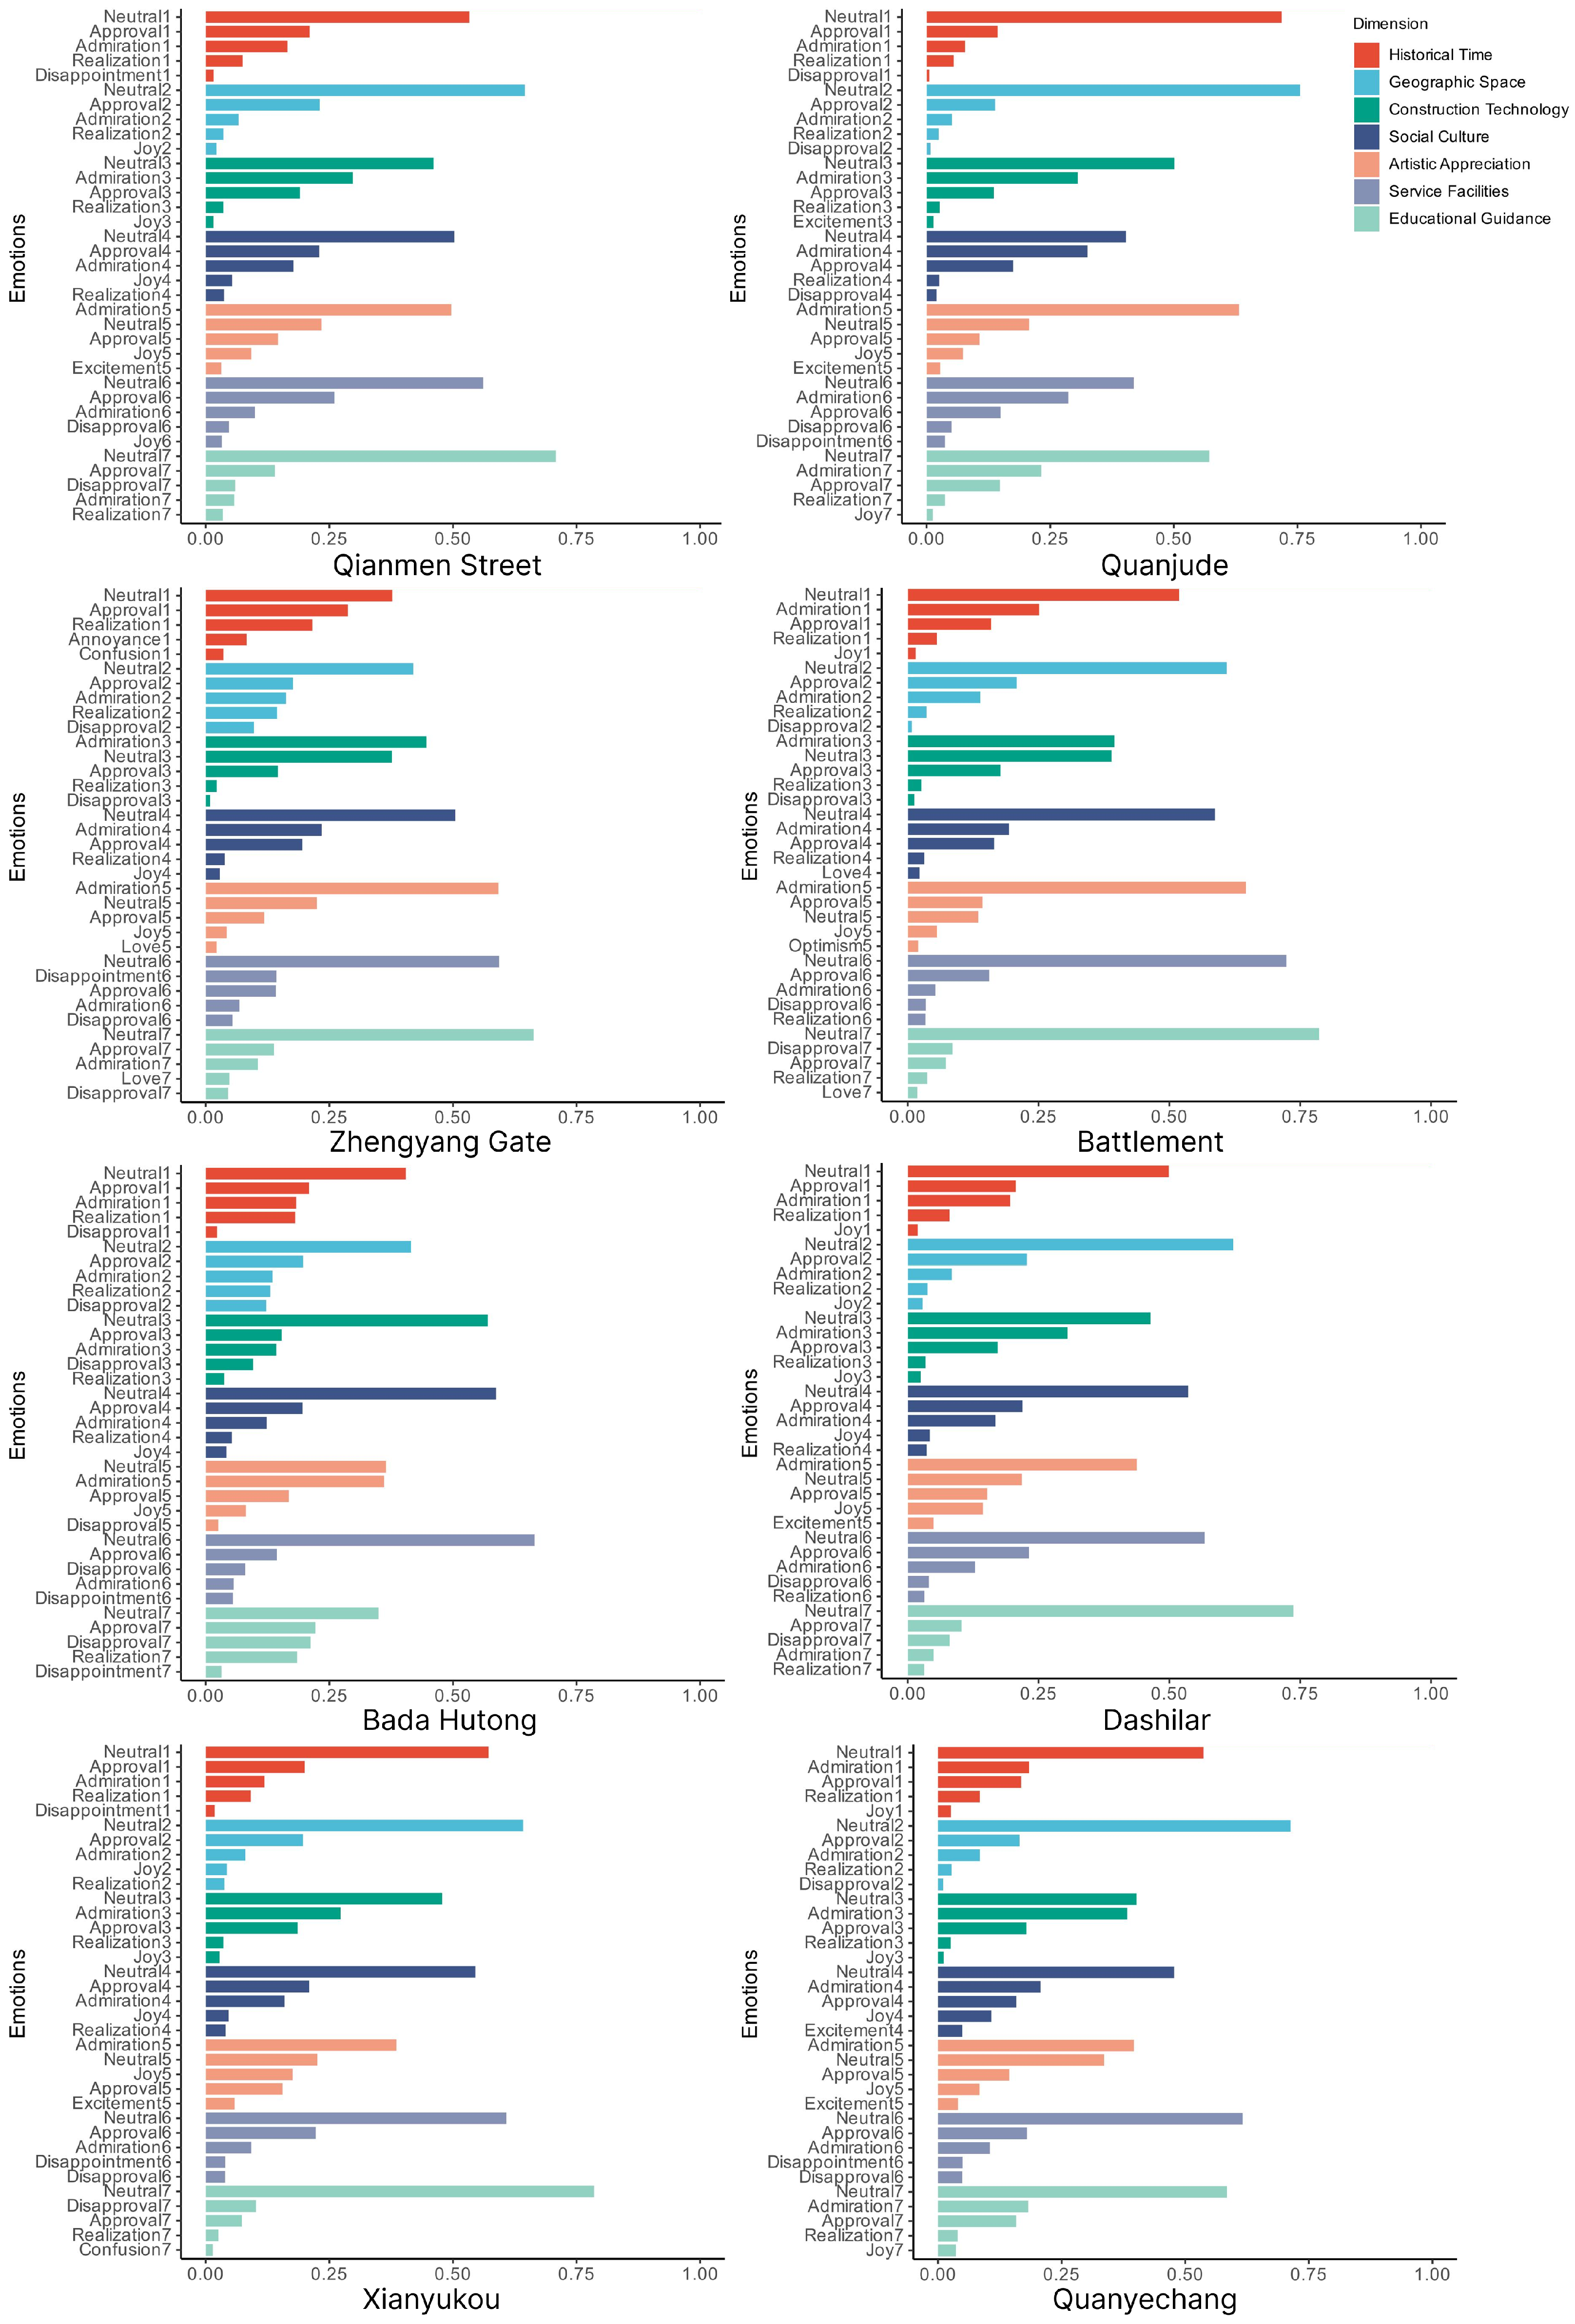
3.7. Emotional Diversity and Refinement
Furthermore, the twitter-roberta-base-sentiment-latest model was applied for an in-depth sentiment analysis of public emotions across eight cultural landmarks. The analysis computed the levels of 28 emotions, including neutral, annoyance, disappointment, optimism, sadness, excitement, etc., within the seven cultural value dimensions, based on the user-generated content. The emotional data for each dimension were weighted, and the top five emotions were selected for visualization in bar charts, as shown in
Figure 5.
An analysis of the public sentiment across eight cultural landmarks reveals that the historical and geographical dimensions predominantly drive emotional expression, with a high proportion of neutral sentiment. This suggests that visitors’ emotional responses to these cultural heritage sites tend to be rational, focusing more on the historical background and the geographical context rather than forming strong emotional connections. While historical and geographical contexts function as “background elements”, they play a crucial role in shaping visitor perceptions. However, they do not necessarily elicit deep emotional resonance. Instead, visitors’ recognition of these cultural heritage sites is primarily based on historical and geographical significance rather than profound emotional engagement.
Despite a predominance of neutral and positive sentiments, certain landmarks and cultural dimensions exhibit more complex emotional layers. For instance, in the socio-cultural dimension, Qianmen Street and Dashilar demonstrate a strong “appreciation” sentiment, likely due to their rich historical significance and cultural identity.
In the architectural art dimension, visitors exhibit notable aesthetic responses to historical architecture, particularly at Quanjude and the Arrow Tower. The recognition of architectural forms, craftsmanship, and artistic value suggests that these sites hold high cultural significance within visitor sentiment. However, certain landmarks show higher proportions of “disappointment” and “disapproval” in terms of their service facilities and educational guidance, revealing shortcomings in commercial and modern adaptations. This emotional gap in visitors’ expectations highlights challenges with information accessibility and interactive engagement.
At commercial heritage sites like Qianmen Street, each cultural dimension encompasses multilayered features and information. This study reveals that artistic appreciation and social culture are the most emotionally engaging dimensions, while certain historical and cultural elements struggle to resonate with visitors due to their lack of emotional appeal.
Additionally, these findings highlight hidden cultural value points, such as the aesthetic experience of culinary culture, which, despite receiving limited attention, demonstrate significant emotional potential. Furthermore, the levels of negative sentiment are relatively higher in dimensions related to service facilities and educational guidance, suggesting that the current presentation strategies and services require further optimization.
3.8. Multidimensional Sentiment Mapping and Visualization
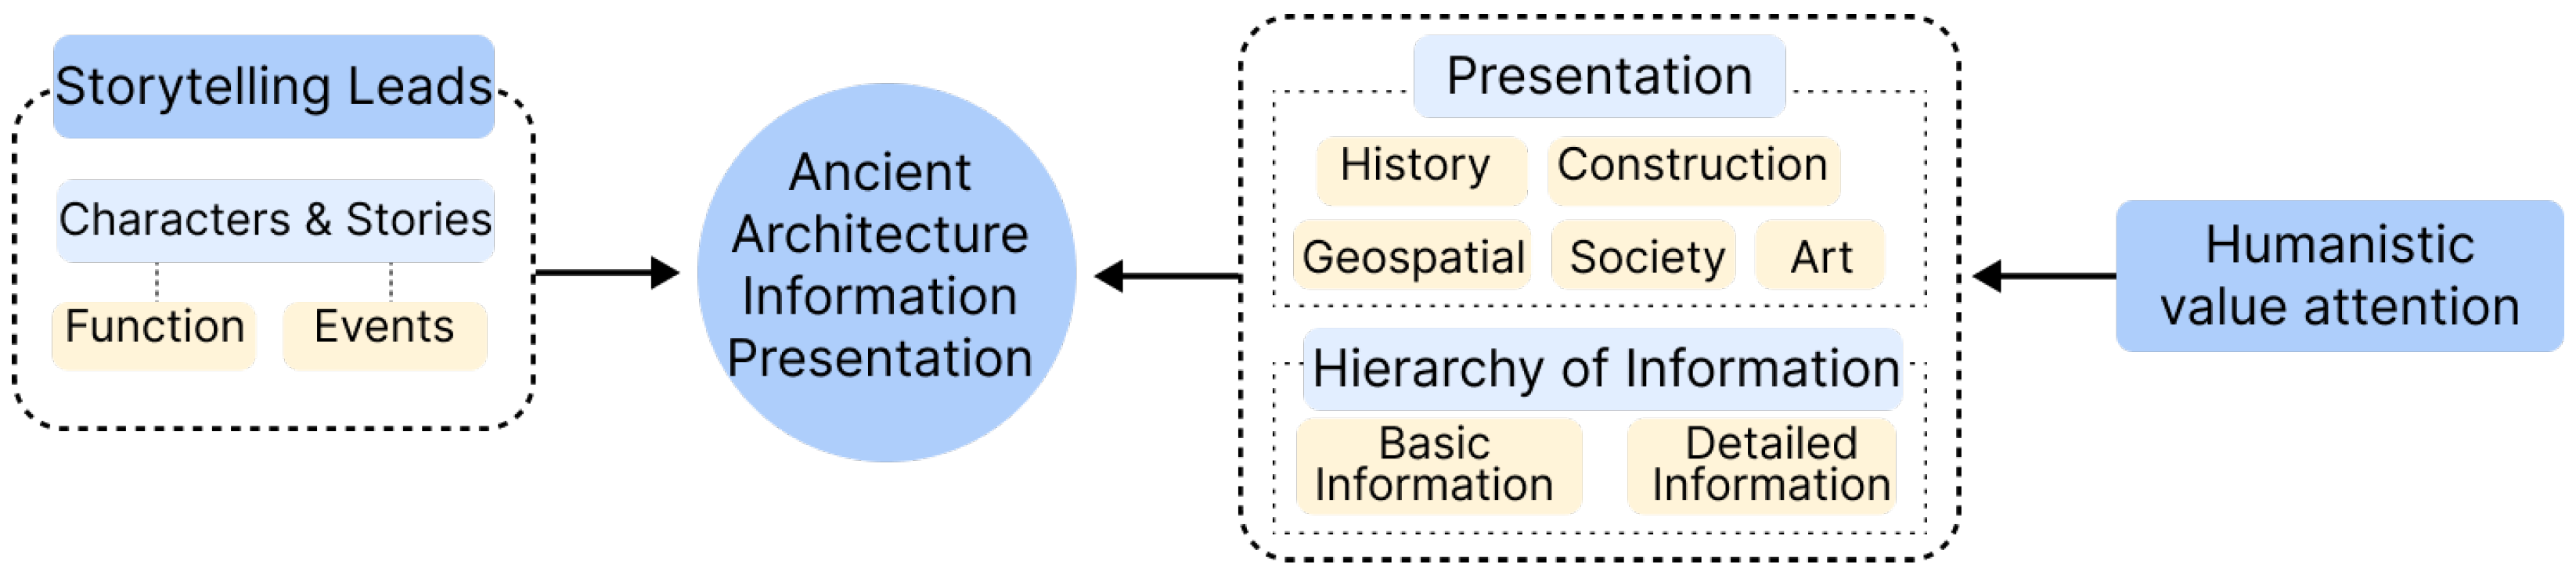
Based on the multidimensional sentiment model, a VR interactive visualization interface was designed to align with users’ cognitive habits and aesthetic preferences, as shown in
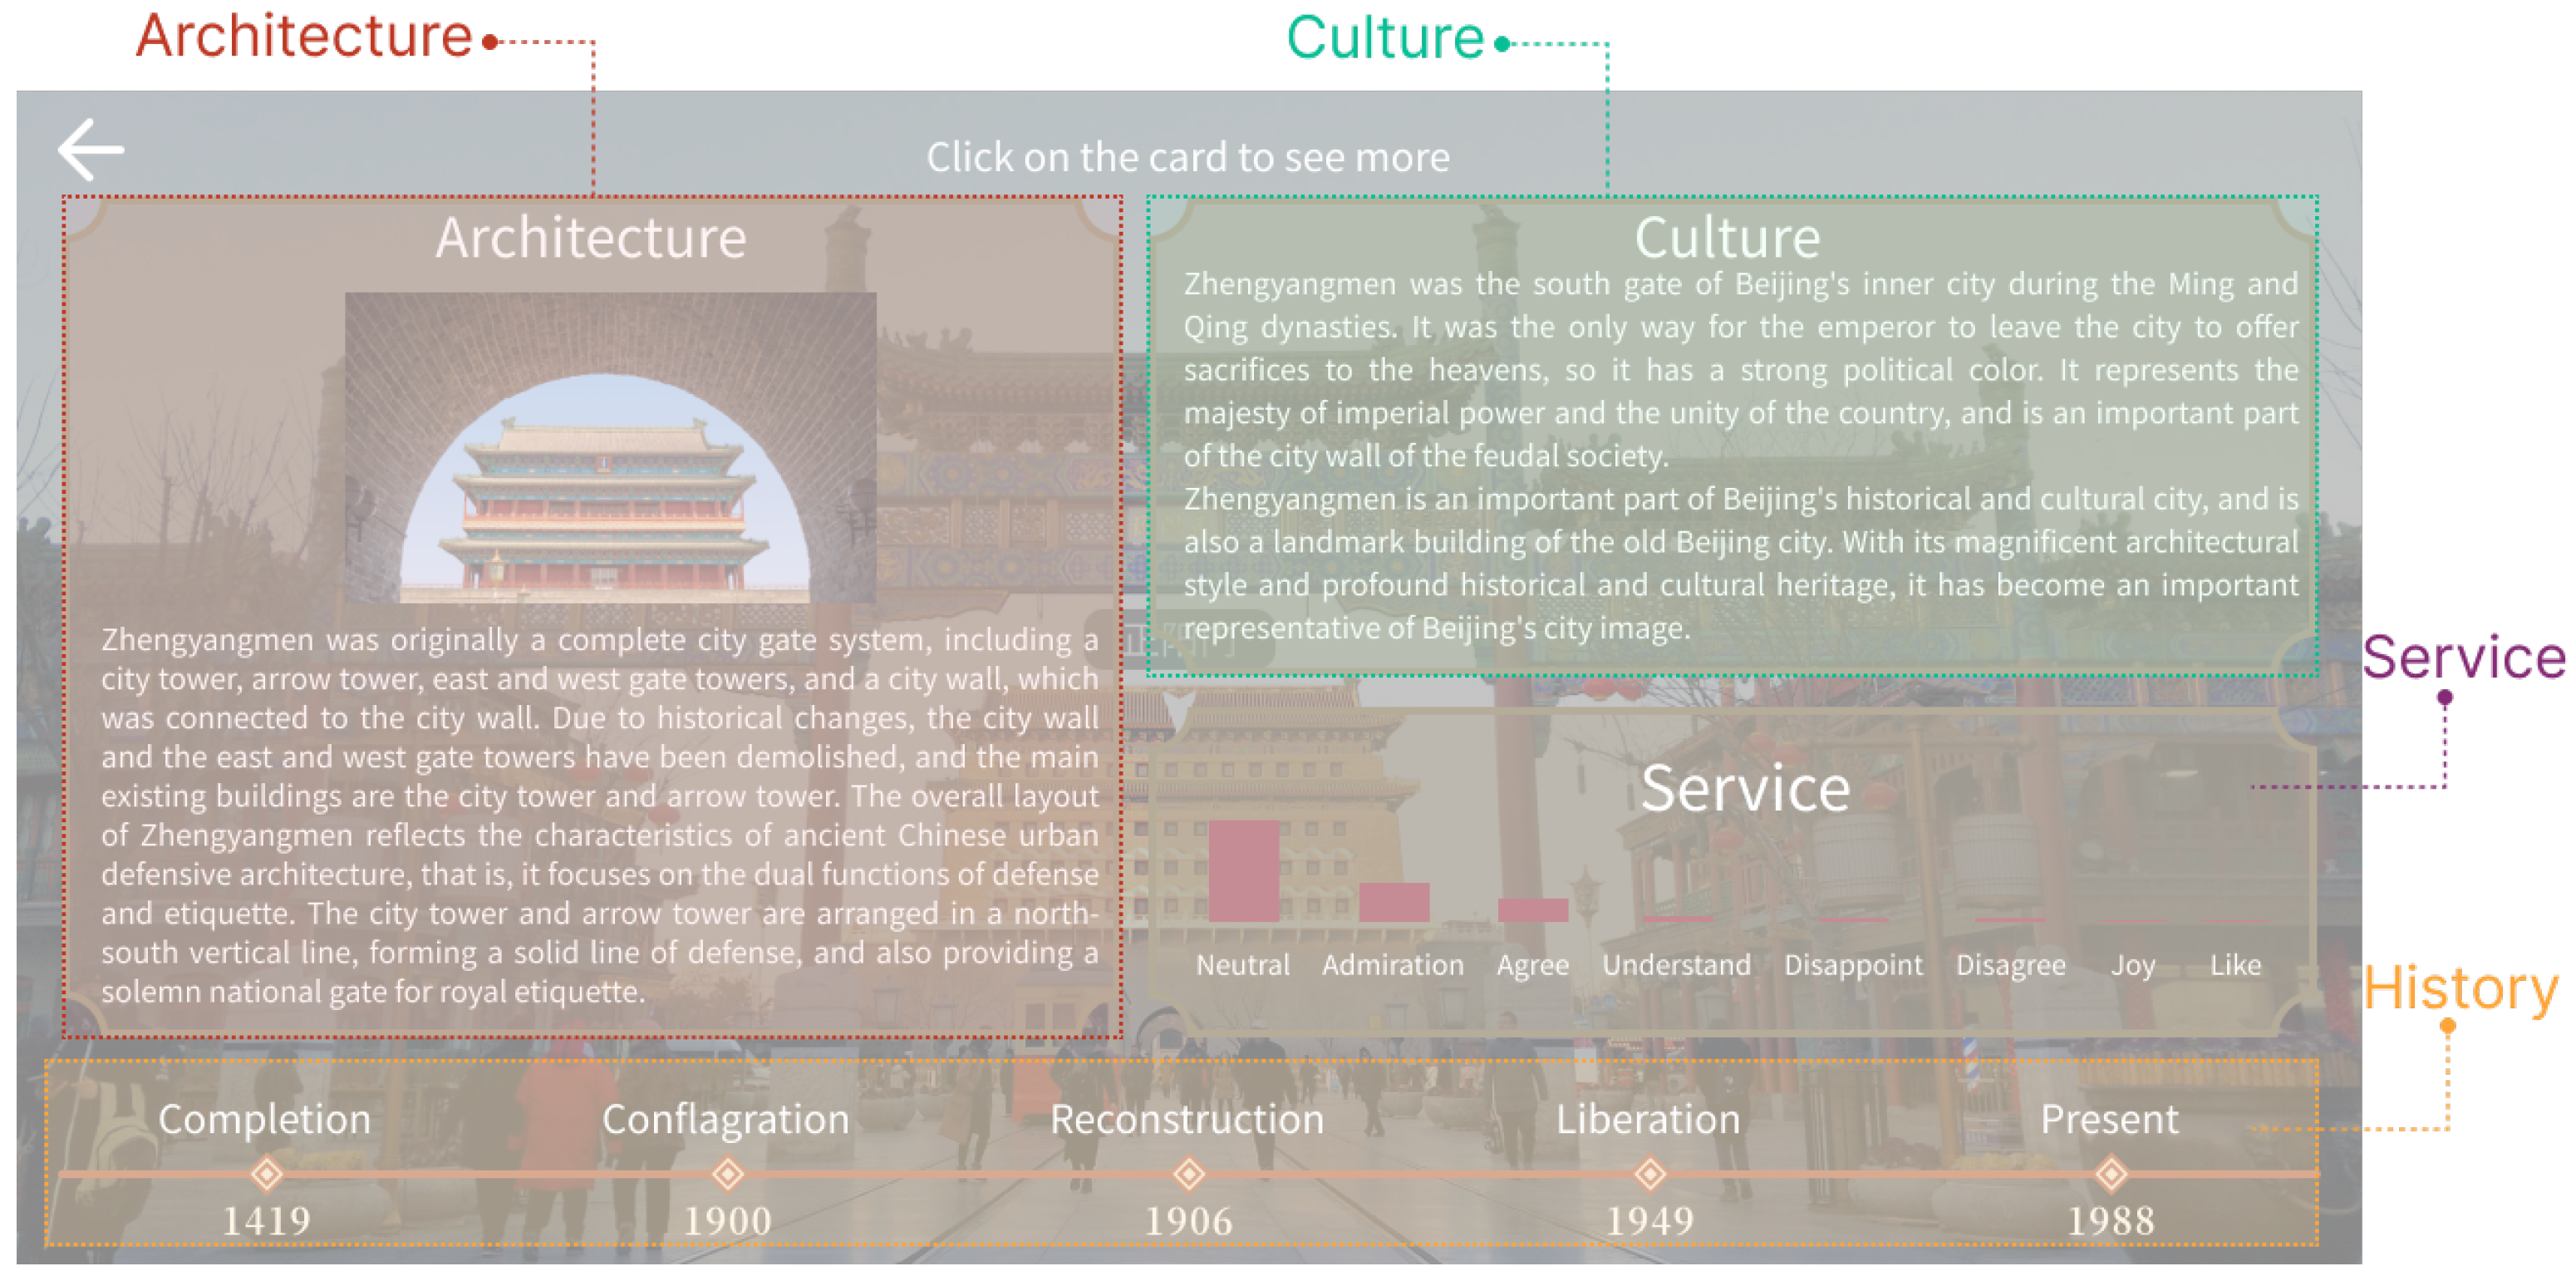
Figure 6. The interface follows the principles of hierarchical information structuring and multidimensional optimization, ensuring a clear and well-organized content flow. Additionally, the narrative-driven presentation enhances user immersion and engagement, fostering curiosity and encouraging deeper exploration of the humanistic values embedded within commercial cultural heritage.
In terms of visual design, the cultural, architectural, artistic, and service dimensions are presented using a combination of text and images, ensuring that the information is intuitive and easy to understand, as illustrated in
Figure 7. However, due to the extensive volume of historical information and its typical presentation in chronological order, the historical dimension is displayed using a timeline format instead of a traditional text–image combination.
4. The User Eye-Tracking Experiment
4.1. Experimental Objectives
This experiment aims to measure the distribution of users’ attention and emotional responses to different cultural dimensions within a VR environment and to evaluate the impact of a data-driven information presentation model on users’ allocation of attention. Additionally, this study seeks to verify whether an interface design optimized based on user interest levels can enhance the information acquisition efficiency and immersion experience.
4.2. The Experimental Design
The experiment consisted of two groups:
Experiment 1: A homogeneous interface was used, where all of the information modules had the same layout and area. Users were allowed to freely explore within the VR environment to observe their natural attention distribution patterns. This experiment also validated whether the user interest model’s predictions aligned with the actual attention patterns.
Experiment 2: The interface was optimized based on multidimensional sentiment model data, with high-interest content placed in core areas and the area weight adjusted accordingly. The goal was to assess the effectiveness of the model in interface optimization and determine whether an interest-driven layout influences users’ allocation of attention.
4.3. Participant Selection
A total of 12 undergraduate and graduate students majoring in industrial design were recruited as participants. Prior to the experiment, all of the participants received basic VR interaction guidance to ensure the validity and comparability of the data.
4.4. The Experimental Procedure
Before the experiment, the participants were required to complete a basic information questionnaire, covering their familiarity with architectural heritage and virtual reality technology. The researchers then introduced the experimental tasks and VR equipment operation methods, followed by eye-tracking calibration.
The formal experiment consisted of two phases:
Experiment 1: The participants explored a homogeneous interface freely;
Experiment 2: The participants explored an optimized interface, where high-interest content was repositioned based on a sentiment analysis.
Throughout the experiment, an eye-tracking device recorded the participants’ gaze trajectories, fixation durations, and pupil diameter data to evaluate how different interface designs influenced the allocation of users’ attention and their emotional responses.
4.5. Experimental Results
4.5.1. Pupil Diameter Variation and Emotional Response
Experiment 1 employed eye-tracking technology to measure the participants’ fixation patterns while browsing the information panels on Zhengyangmen and Quanjude, focusing on five cultural dimensions: culture, history, architecture, art, and service (as shown in
Table 3 and
Table 4). Variations in the diameters of their pupils were calculated to assess the emotional impact of different cultural information on users. Pupil diameter variations are a key physiological indicator for evaluating emotional arousal and cognitive load [
30]. Generally, an increase in pupil diameter indicates higher emotional engagement or a greater cognitive load demand when processing specific information.
To ensure the accuracy of the experimental data, the average pupil diameter for each participant was first calculated while they viewed different information panels. The data were then normalized to eliminate baseline differences between individuals.
Next, by comparing the variations in the diameter of the pupils for different participants within the same cultural dimension and analyzing deviations from their overall average across all dimensions, the relative emotional impact of each cultural dimension was assessed.
As shown in
Table 2 and
Table 3, larger variations in pupil diameter indicate stronger emotional engagement with the corresponding cultural dimension. However, this metric alone does not distinguish between positive and negative emotions. Conversely, smaller variations suggest lower attention levels or the absence of a significant emotional response to the information presented.
A comparative analysis of the pupil diameter data from the VR eye-tracking experiment and the multidimensional sentiment model derived from affective computing revealed a high degree of consistency in certain dimensions. For instance, the pupil diameter variations in the artistic, architectural, and cultural dimensions closely aligned with users’ emotional engagement levels. However, discrepancies were observed in the historical and service dimensions, highlighting the differing focal points of affective computing and eye-tracking in measuring emotional and cognitive processes.
In the Zhengyangmen VR scene, users exhibited significant pupil diameter variations in the artistic (0.647 mm) and architectural (0.419 mm) dimensions, which corresponded to the high levels of attention and satisfaction found in the UGC data. This suggests that the personalized information presentation in VR effectively stimulated users’ emotions. However, despite the historical dimension receiving the highest attention score (0.87) in the UGC data, the pupil diameter variations for this dimension were negative (−0.297 mm) in the VR eye-tracking experiment. This indicates that the static text–image presentation failed to effectively engage users emotionally, likely due to a lack of interactivity, leading to a decline in their attention. Similarly, while the cultural dimension was highly recognized in the UGC data (with a satisfaction score of 0.51), the pupil diameter variations for this dimension in the VR experiment were relatively low (−0.368 mm), suggesting that long-term cultural appreciation did not translate into an immediate immersive experience.
In the Quanjude VR scene, the cultural dimension showed high engagement levels in both the UGC data and VR eye-tracking experiments, indicating that the personalized information presentation successfully maintained users’ emotional involvement in the cultural content. However, for the service dimension, the UGC data indicated high attention levels (0.69) but extremely low satisfaction (0.18). Correspondingly, the pupil diameter variations were significant (0.462 mm) in the VR experiment. This suggests that users tend to express strong subjective emotions when evaluating service quality, and such emotionally charged content in the VR environment can amplify their psychological expectations, leading to intense emotional reactions.
Overall, the VR eye-tracking experiment effectively validated the affective computing results for the artistic, architectural, and cultural dimensions, but certain discrepancies were found in the historical and service dimensions. These differences may stem from variations in the information presentation methods, real-time attention allocation patterns, and differences in measuring negative emotions. Additionally, since the VR interface primarily relies on static text–image presentations, it may fail to fully replicate real-world immersive experiences, potentially underestimating the emotional responses to certain dimensions.
4.5.2. A Heatmap Analysis and the Feasibility of Personalized Information Displays
In Experiment 2, the VR interface was optimized based on the multidimensional sentiment model derived from affective computing. Eye-tracking technology was employed to record the distribution of users’ fixation points in the optimized interface. Heatmap visualization was then used to analyze the allocation of user attention, allowing for an assessment of how personalized information presentation influences user engagement, historical understanding, and cultural experience.
By observing and analyzing the heatmap results shown in
Figure 8, key patterns emerged. In the Zhengyangmen scene, users’ fixation points were primarily concentrated in the cultural and architectural modules, especially in text areas related to the historical background. This indicates that users were more inclined to focus on architectural history, cultural narratives, and their evolution over time.
In general, the optimized presentation of personalized information based on UGC data enhances user engagement by shaping the distribution of their attention across different cultural heritage scenarios. In historical architectural settings (e.g., Zhengyangmen), users exhibit a stronger focus on architectural history and cultural narratives, while in culinary heritage settings (e.g., Quanjude), their attention shifts toward brand culture and service quality. This variation in the attention allocation suggests that scene-specific content optimization can effectively influence users’ information engagement patterns, ultimately enhancing their cultural cognition and immersive experience in distinct historical and cultural contexts.
5. Limitations and Future Work
This study proposes a cultural information optimization and presentation method by integrating user-generated content (UGC) from social media, large language models (LLMs), and affective computing techniques. The method’s effectiveness in cultural heritage communication was validated through VR experiments. While this research introduces an innovative approach to cultural information display, further exploration is needed in terms of the data’s applicability, ethical considerations, and future research directions.
The affective computing model based on UGC data relies on users’ authentic experiences and multisensory feedback. However, VR experiments cannot fully replicate their immersed perceptions of real-world settings. As a result, the VR experiment primarily measures users’ immediate allocation of attention and emotional arousal rather than their long-term engagement and comprehensive evaluation of cultural content. Additionally, the eye-tracking data do not fully capture all of the emotional dimensions encompassed in the UGC data, limiting their ability to represent the depth of user sentiment.
From an ethical standpoint, LLMs may introduce biases or historical distortions when generating cultural information. Future research could integrate expert review mechanisms and information traceability techniques to ensure that the AI-generated cultural interpretations remain historically accurate and to enhance the content’s credibility.
The affective computing method based on UGC data is not only applicable to commercial heritage sites but could also be extended to a broader scope of cultural heritage exhibitions and digital cultural communication. Heritage site managers, researchers, and designers can leverage emotion-driven data insights to optimize cultural heritage display strategies. For instance, this method could be applied to smart tourism systems, enabling personalized cultural guidance services based on visitors’ emotional feedback and interest preferences, thereby enhancing tailored cultural experiences.
Furthermore, through a large-scale UGC data analysis, this approach could be utilized to monitor the sustainable development of cultural heritage tourism, assessing visitors’ emotional responses to issues such as over-commercialization and environmental degradation.
6. Conclusions
This study innovatively integrates user-generated content (UGC) from social media, large language models (LLMs), and multimodal affective computing methods to develop a cultural information optimization framework tailored to commercial heritage architecture. A data-driven cultural value classification system is proposed, leveraging a cross-modal sentiment analysis to uncover users’ emotional tendencies toward different cultural dimensions, thereby enhancing the presentation of cultural information. Compared to traditional survey-based approaches, this study offers a more data-driven and personalized information optimization strategy. The proposed framework holds broad application potential in digital cultural heritage display, intelligent guided tours, intangible cultural heritage preservation, and smart tourism. Future research could further integrate multimodal data, interactive technologies, and intelligent recommendation systems to enhance the applicability of affective computing methods, fostering more intelligent and personalized cultural heritage presentations.
Author Contributions
Conceptualization: H.H., X.W. and Y.W. Methodology: H.H. and Y.W. Software: H.H. and K.Y.T. Validation: X.W. Formal analysis: X.W. Investigation: H.H. and Y.W. Resources: X.W. Data curation: H.H., K.Y.T. and Y.W. Writing—original draft preparation: H.H. and Y.W. Writing—review and editing: H.H., X.W. and Q.L. Visualization: H.H. and Y.W. Supervision: X.W. Funding acquisition: X.W. All authors have read and agreed to the published version of the manuscript.
Funding
This research was supported by the Humanities and Social Science Fund of Ministry of Education (23YJA760090); the Beijing High-Level Talent Training of Propaganda and Culture Project; and the National Cultural and Tourism Science and Technology Innovation Research and Development Project.
Institutional Review Board Statement
Not applicable.
Informed Consent Statement
Not applicable.
Data Availability Statement
The data that support the findings of this study are available from the corresponding author upon reasonable request.
Acknowledgments
We would like to thank our supervisor Wang Xiaohui for her guidance and help in this research.
Conflicts of Interest
Author Qingyue Li was employed by the company Esri. The remaining authors declare that the research was conducted in the absence of any commercial or financial relationships that could be construed as a potential conflict of interest.
References
- Afzal, S.; Khan, H.A.; Piran, M.J.; Lee, J.W. A comprehensive survey on affective computing; challenges, trends, applications, and future directions. IEEE Access 2024, 12, 96150–96168. [Google Scholar] [CrossRef]
- Zhang, Y.; Wang, M.; Wu, Y.; Tiwari, P.; Li, Q.; Wang, B.; Qin, J. Dialoguellm: Context and emotion knowledge-tuned large language models for emotion recognition in conversations. arXiv 2023, arXiv:2310.11374. [Google Scholar]
- Ferracani, A.; Bertini, M.; Pala, P.; Nannotti, G.; Principi, F.; Becchi, G. Personalized Generative Storytelling with AI-Visual Illustrations for the Promotion of Knowledge in Cultural Heritage Tourism. In Proceedings of the 6th Workshop on the Analysis, Understanding, and Promotion of Heritage Contents, Melbourne, Australia, 28 October–1 November 2024; pp. 28–32. [Google Scholar]
- Wang, Y.; Liu, J.; Wang, W.; Chen, J.; Yang, X.; Sang, L.; Wen, Z.; Peng, Q. Construction of Cultural Heritage Knowledge Graph Based on Graph Attention Neural Network. Appl. Sci. 2024, 14, 8231. [Google Scholar] [CrossRef]
- Liu, Y.; Lin, H.W. Construction of interpretation and presentation system of cultural heritage site: An analysis of the old city, Zuoying. Heritage 2021, 4, 316–332. [Google Scholar] [CrossRef]
- Hua, Y.; Ding, L.; Dong, H.; Lin, Z. Influence of User-Generated Content (UGC) in Social Media on the Intangible Cultural Heritage Preservation of Gen Z Tourists in the Digital Economy Era. Int. J. Tour. Res. 2024, 26, e2743. [Google Scholar] [CrossRef]
- Zhang, Y.; Zhang, Q. A model approach for post evaluation of adaptive reuse of architectural heritage: A case study of Beijing central axis historical buildings. Herit. Sci. 2023, 11, 57. [Google Scholar] [CrossRef]
- Tao, S.; Duan, W. A Post-Evaluation Study on the Renewal of Public Space in Qianmen Street of Beijing’s Central Axis Based on Grounded Theory. Buildings 2024, 14, 3969. [Google Scholar] [CrossRef]
- Yang, Y.; Wang, Z.; Shen, H.; Jiang, N. The Impact of Emotional Experience on Tourists’ Cultural Identity and Behavior in the Cultural Heritage Tourism Context: An Empirical Study on Dunhuang Mogao Grottoes. Sustainability 2023, 15, 8823. [Google Scholar] [CrossRef]
- Gîrbacia, F. An Analysis of Research Trends for Using Artificial Intelligence in Cultural Heritage. Electronics 2024, 13, 3738. [Google Scholar] [CrossRef]
- Orea-Giner, A.; Muñoz-Mazón, A.; Villacé-Molinero, T.; Fuentes-Moraleda, L. Cultural tourist and user experience with artificial intelligence: A holistic perspective from the Industry 5.0 approach. J. Tour. Future 2022, 1–18. [Google Scholar] [CrossRef]
- Ehrmann, M.; Hamdi, A.; Pontes, E.L.; Romanello, M.; Doucet, A. Named entity recognition and classification in historical documents: A survey. ACM Comput. Surv. 2023, 56, 1–47. [Google Scholar] [CrossRef]
- Trichopoulos, G. Large language models for cultural heritage. In Proceedings of the 2nd International Conference of the ACM Greek SIGCHI Chapter, Athens, Greece, 27–28 September 2023; pp. 1–5. [Google Scholar]
- Gon, M. Local experiences on Instagram: Social media data as source of evidence for experience design. J. Destin. Mark. Manag. 2021, 19, 100435. [Google Scholar] [CrossRef]
- Yue, L.; Chen, W.; Li, X.; Zuo, W.; Yin, M. A survey of sentiment analysis in social media. Knowl. Inf. Syst. 2019, 60, 617–663. [Google Scholar] [CrossRef]
- Xu, H.; Cheung, L.T.O.; Lovett, J.; Duan, X.; Pei, Q.; Liang, D. Understanding the influence of user-generated content on tourist loyalty behavior in a cultural World Heritage Site. Tour. Recreat. Res. 2023, 48, 173–187. [Google Scholar] [CrossRef]
- Abuzayed, A.; Al-Khalifa, H. BERT for Arabic topic modeling: An experimental study on BERTopic technique. Procedia Comput. Sci. 2021, 189, 191–194. [Google Scholar] [CrossRef]
- Guan, R.; Zhang, H.; Liang, Y.; Giunchiglia, F.; Huang, L.; Feng, X. Deep feature-based text clustering and its explanation. IEEE Trans. Knowl. Data Eng. 2020, 34, 3669–3680. [Google Scholar] [CrossRef]
- Catelli, R.; Bevilacqua, L.; Mariniello, N.; Di Carlo, V.S.; Magaldi, M.; Fujita, H. A new Italian Cultural Heritage dataset: Detecting fake reviews with BERT and ELECTRA leveraging sentiment. IEEE Access 2023, 11, 52214–52225. [Google Scholar]
- Khan, N.D.; Khan, J.A.; Li, J.; Ullah, T.; Zhao, Q. Leveraging Large Language Model ChatGPT for enhanced understanding of end-user emotions in social media feedbacks. Expert Syst. Appl. 2025, 261, 125524. [Google Scholar] [CrossRef]
- Jiménez-Díaz, G.; Diaz-Agudo, B.; Bruni, L.E.; Kadastik, N.; Follo, A.; Damiano, R.; Striani, M.; Sanchez-Martin, A.; Lieto, A. Interpretable clusters for representing citizens’ sense of belonging through interaction with cultural heritage. ACM J. Comput. Cult. Herit. 2025, 17, 1–22. [Google Scholar] [CrossRef]
- Ding, J.; Tao, Z.; Hou, M.; Chen, D.; Wang, L. A Comparative Study of Perceptions of Destination Image Based on Content Mining: Fengjing Ancient Town and Zhaojialou Ancient Town as Examples. Land 2023, 12, 1954. [Google Scholar] [CrossRef]
- Wei, D.; Wang, Y.; Liu, M.; Lu, Y. User-generated content may increase urban park use: Evidence from multisource social media data. Environ. Plan. B Urban Anal. City Sci. 2024, 51, 971–986. [Google Scholar] [CrossRef]
- Okanovic, V.; Ivkovic-Kihic, I.; Boskovic, D.; Mijatovic, B.; Prazina, I.; Skaljo, E.; Rizvic, S. Interaction in extended reality applications for cultural heritage. Appl. Sci. 2022, 12, 1241. [Google Scholar] [CrossRef]
- Makransky, G.; Petersen, G.B. The cognitive affective model of immersive learning (CAMIL): A theoretical research-based model of learning in immersive virtual reality. Educ. Psychol. Rev. 2021, 33, 937–958. [Google Scholar] [CrossRef]
- Marto, A.; Melo, M.; Goncalves, A.; Bessa, M. Multisensory augmented reality in cultural heritage: Impact of different stimuli on presence, enjoyment, knowledge and value of the experience. IEEE Access 2020, 8, 193744–193756. [Google Scholar] [CrossRef]
- Li, Z.; Sun, X.; Zhao, S.; Zuo, H. Integrating eye-movement analysis and the semantic differential method to analyze the visual effect of a traditional commercial block in Hefei, China. Front. Archit. Res. 2021, 10, 317–331. [Google Scholar] [CrossRef]
- Casillo, M.; Colace, F.; Lorusso, A.; Santiniello, D.; Valentino, C. Integrating Physical and Virtual Experiences in Cultural Tourism: An Adaptive Multimodal Recommender System. IEEE Access 2025, 13, 28353–28368. [Google Scholar] [CrossRef]
- Cao, Z.; Mustafa, M.; Mohd Isa, M.H. The role of artistic quality in a heritage architectural style in modulating tourist interest and aesthetic pleasure: A case study of Hui-style architecture in the Hongcun Scenic Area, China. J. Herit. Tour. 2024, 19, 896–918. [Google Scholar] [CrossRef]
- Grootjen, J.W.; Thalhammer, P.; Kosch, T. Your Eyes on Speed: Using Pupil Dilation to Adaptively Select Speed-Reading Parameters in Virtual Reality. Proc. ACM-Hum.-Comput. Interact. 2024, 8, 284. [Google Scholar] [CrossRef]
| Disclaimer/Publisher’s Note: The statements, opinions and data contained in all publications are solely those of the individual author(s) and contributor(s) and not of MDPI and/or the editor(s). MDPI and/or the editor(s) disclaim responsibility for any injury to people or property resulting from any ideas, methods, instructions or products referred to in the content. |
© 2025 by the authors. Licensee MDPI, Basel, Switzerland. This article is an open access article distributed under the terms and conditions of the Creative Commons Attribution (CC BY) license (https://creativecommons.org/licenses/by/4.0/).


