Article

Quality Risk Evaluation of the Whole Process of Assembly Building Based on Game Theory-Combinatorial Empowerment and Three-Dimensional Cloud Modeling

1
College of Civil Engineering and Architecture, Dalian University, Dalian 116622, China
2
School of Water Resources & Environmental Engineering, East China University of Technology, Nanchang 330013, China
*
Author to whom correspondence should be addressed.
Appl. Sci. 2025, 15(7), 3417; https://doi.org/10.3390/app15073417
Submission received: 12 December 2024 / Revised: 18 January 2025 / Accepted: 20 January 2025 / Published: 21 March 2025
(This article belongs to the Section Civil Engineering)

Abstract

:
In the context of intelligent construction and building industrialization, assembly buildings face many challenges in quality management due to their special design and construction characteristics. Therefore, a comprehensive method for evaluating the quality risk of the whole process of assembly building is proposed. This method is based on game-theoretic combinatorial empowerment and three-dimensional cloud modeling. By identifying the key risk factors, analyzing and classifying the quality risks that may exist in the whole process of the assembly building project, using the game theory combination assignment method to determine its comprehensive weight, establishing the game-theoretic-combinatorial-assignment three-dimensional cloud model, calculating and comparing the distance between the evaluation cloud and the standard cloud, and determining the risk level of the indexes, thereby realizing the comprehensive assessment of the quality risk. Example validation shows that the method yields a risk level of II for the whole project, which is more consistent with the actual situation, and by comparing with the two-dimensional cloud model, it further verifies the effectiveness and advantages of the three-dimensional cloud model in identifying the high hidden risks, and provides a new idea and method for the quality management of the whole process of the assembled building.

1. Introduction

In recent years, with the continuous development of the construction industry and the acceleration of the urbanization process, assembly building, as a new architectural mode, has gradually received widespread attention due to its advantages of speed, environmental protection, and energy saving. The promotion of assembled building will greatly promote the upgrading and transformation of the construction industry and bring more rapid development momentum for the whole industry [1]. However, due to the special characteristics of assembly building, such as the complexity of design, manufacturing, transportation, installation and other links, their quality management faces many challenges, which not only affect the quality and safety of the buildings, but also directly influence the success of the project. Therefore, how to effectively assess and manage the quality risk issues in the whole process of assembled building has become an urgent need to ensure the sustainable development of the project.
Scholars at home and abroad have carried out certain explorations and practices in the field of quality risk evaluation of assembled buildings. Wang et al. [2] firstly divided the quality evaluation indexes of assembled building construction into hierarchical levels, then constructed a quality risk evaluation index system, and put forward strategies and suggestions to improve the quality of assembled building. Qu Fuqiang et al. [3] established a quality risk network evaluation model for assembled precast components based on the quality risk of precast components, utilizing survey sampling data from precast-concrete-component enterprises. Zhang Bing et al. [4] evaluated the quality risk of assembled building in two aspects, the component manufacturing and the construction management, and constructed a quality risk evaluation model which they then verified the feasibility of. In the research field of risk evaluation methods, scholars at home and abroad have also achieved certain research results. HW Deng et al. [5] identified the quality risk factors of prefabricated components from the perspective of total-quality management and used intuitionistic-fuzzy-hierarchical analysis to determine the weights of each quality risk factor and summarized the important points of quality control. Li [6] used regression analysis to determine the weights of the indexes and used structural equation modeling to assess the cost risk of assembled building. Other scholars also used a multilevel extension method [7], an improved CRITIC method [8], and an artificial neural network [9] to establish risk evaluation models for research. When assessing the risk evaluation, scholars have explored and improved the dimensions of the cloud model. Ma et al. [10] used a one-dimensional cloud model to provide an in-depth assessment and class classification of the stability of the extraction zone and provided a comprehensive analysis and evaluation of it. Guo Jin et al. [11] used a combination of an improved hierarchical analysis method (AHP) and an entropy weight method to propose a risk evaluation method for embankment engineering based on a combined-empowerment-two-dimensional cloud model, which can intuitively determine the risk level of an embankment. Xie Bin et al. [12] proposed a high-altitude railroad tunnel construction risk early warning model based on an improved game theory-two-dimensional cloud, which provides a new idea for the early warning assessment of high-altitude railroad tunnel construction risk. Previous studies have addressed many two-dimensional cloud models such as the consequences and the probabilities of influencing factors, Cheng Lei et al. [13] proposed a three-dimensional cloud model on this basis, and constructed a risk indicator system for roofing accidents in deep coal mines through a game analysis of improved hierarchical analysis and an entropy weight method by means of game-theory, and visualized and analyzed it using a three-dimensional cloud model in order to realize a comprehensive assessment of accidental dangers.
In summary, most of the existing studies focus on the quality risk assessment of some specific links or stages of assembly buildings, such as the quality problems in the production stage of prefabricated components [3], or the quality risk control of the construction process [4], while there are relatively few studies on the systematic evaluation of the quality risk of the whole process of assembly buildings and a complete evaluation system has not yet been formed. In addition, in terms of risk evaluation methods, the one-dimensional or two-dimensional cloud models widely used in existing studies have limited ability to express the hidden nature of risks in complex projects and fail to effectively synthesize risk characteristics in different dimensions, lacking a comprehensive risk assessment method. Both one-dimensional and two-dimensional cloud model indicators in the field of risk evaluation are usually for probability and consequence, and given the complexity and diversity involved in assembly building projects and the increasingly significant hidden nature of quality risks, comprehensive consideration of the probability of risk occurrence, consequence, and the degree of hiddenness of the risk is crucial for improving the accuracy of the quality risk evaluation results for assembly buildings. Therefore, it is necessary to expand the research dimensions of the evaluation model and introduce the three-dimensional cloud model for the quality risk analysis of assembly building.
In order to make up for the above deficiencies, based on the complexity and diversity of quality risks in assembly building projects, this paper proposes for the first time to use the combination of game-theoretic-combinatorial-empowerment and three-dimensional cloud modeling to comprehensively consider the probability of risk occurrence, consequences, and concealment, and to realize a comprehensive assessment of quality risks in the whole process. Firstly, literature on statistical analysis, accident case combing, expert research, and related theories are used to identify the quality risk influencing factors in the whole process of assembly building and to construct the quality risk evaluation index system. Subsequently, game-theory ideas are used to optimize the combination of subjective and objective weights of the indicators to reduce the influence of weighting errors. Finally, the three-dimensional cloud model is constructed to evaluate the quality risk and to visualize the risk level, in order to be able to provide new ideas and a decision-making basis for the quality management and risk control in the assembly construction industry.

2. Materials and Methods

2.1. Construction of Quality Risk Evaluation Indicator System for Assembled Building

2.1.1. Identification of Quality Risk Factors for Assembled Building

To accurately assess the quality risk of assembled building, it is necessary to identify the potential influencing factors and to establish a perfect quality risk evaluation index system based on these factors. How to correctly select the risk evaluation indicators is particularly important as too many indicators will lead to the complexity of the assessment process, increase the difficulty of decision-making, and influence the effectiveness of risk management, while too few indicators may lead to the inability to comprehensively quantify the risk so that the evaluation results lack of depth and accuracy, and then they cannot effectively identify and respond to the key issues arising in the actual project. Therefore, in order to ensure the rationality and accuracy of the evaluation results, this paper adopts the following five-step process to identify the potential risk factors affecting the quality of assembled buildings in strict accordance with the principles of science, systematicity, objectivity, and operability in order to construct the index system, see Figure 1. These indicators cover the five key stages of the entire process of prefabricated construction and can effectively assess the probability, consequences, and concealment of quality risks. In addition, the indicator system is not fixed and can be dynamically adjusted according to industry development, emerging technologies, and specific project characteristics to ensure its scientific nature, comprehensiveness, and practicality.
(1)
Literature search and preliminary screening
Through CNKI, Web of Science, Wanfang Library, and other platforms, we searched for the keywords “quality of assembled buildings”, “quality risk”, and other keywords to identify the risk evaluation indexes, set the search time to 2015–2024, found a total of 264 related pieces of literature, sieved out the reports, conferences, etc., to get 213 effective pieces of literature, from which the common risk factors were extracted to form the initial index library.
(2)
Accident case studies
We combined these pieces of literature with the quality accident cases in assembly building projects in the past 5 years, analyzed the causes of the accidents using the “4M1E” theory (personnel, materials, machinery, methods, environment), and identified representative risk factors.
(3)
Classification and optimization of indicators
Based on the division of the whole project process of assembly building into five main stages (decision-making and design, bidding and procurement, production and transportation, on-site assembly and construction, and operation and maintenance) and considering them as guideline layers [14,15], the indicators of the above initial screening were categorized. Applying the Work Breakdown Structure and Risk Breakdown Structure [16] (WBS-RBS) in the graphical method, indicators with high repetition or low relevance are eliminated and optimized to form a scientific and reasonable indicator library.
(4)
Expert consultation (Delphi method)
Ten experts in the field of assembly building with different working years and positions were invited to assess the importance, scientific nature, and operability of the indicators through multiple rounds of consultation. Experts helped to finalize the 20 secondary indicators through a scoring system and feedback.
(5)
Construction of the final indicator system
On the basis of the expert assessment, an evaluation index system for quality risk of the whole process of assembled buildings is established, which includes three levels: target level, criterion level, and index level, of which the criterion level includes five first-level indexes, and the index level includes 20 second-level indexes, as shown in Table 1.
The decision-making design phase U1 contains four indicators, which are the deviation rates for key design parameters U11, the amount of design team experience on relevant projects U12, the number of design changes in the prefabricated components U13, and the construction rework rate after meetings and handovers U14. Excessive deviations or frequent changes in key design parameters can lead to construction delays and quality hazards, affecting the overall controllability of the project. An experienced design team can more effectively solve complex problems encountered during the design process, reduce errors and omissions during the design phase, and minimize the risk of rework. A high rework rate means that inadequate preliminary design briefings or inadequate reviews lead to deviations during construction, triggering safety hazards.
The bidding and procurement phase U2 contains three indicators which are, the number of enterprises participating in the tender U21, the scoring of the suppliers’ and the contractors’ qualifications U22, and the acceptance rate of purchased materials U23. The greater the number of companies bidding, the more competitive the bidding will be and the more adequate the bidding will be, which will help in the selection of quality suppliers. The qualifications and reputation of suppliers or contractors may be directly affected by changes in policy or adjustments in regulatory requirements, which can have a knock-on effect on the quality risk of the project, and suppliers and contractors with high qualification scores will be able to ensure the quality of construction of the project. The acceptance rate of materials directly reflects the quality control of the procurement process, which is crucial to the stability and safety of subsequent construction.
The production and transportation phase U3 contains seven indicators which are, immature technical specifications for component production U31, the raw material quality and supply chain stability U32, the production equipment failure rate and utilization rate U33, the average years of experience of the production staff U34, the number of production meetings and the time for communication and feedback U35, the transportation damage rate U36, and the compliance rate of stacking protection and handling measures U37. Immature technical specifications can directly lead to deviations in the production of components, affecting their consistency. Raw material quality and supply chain stability can vary significantly due to fluctuations in raw material prices or the risk of supply chain disruptions, which often result from dynamic changes in the external market environment, and poor raw material quality and supply chain delays can affect not only the timely supply of components, but also the construction schedule. Failure of production equipment and inexperienced personnel can increase uncertainty in the production process and affect the overall quality of the project. Production meetings and feedback mechanisms can help resolve production issues and reduce the risk of information asymmetry. The transportation damage rate and stacking protection, and the loading and unloading measures ensure the safety of components in the logistics process, preventing damage or quality degradation during transportation and storage.
The U4 indicator layer of the on-site assembly construction stage consists of four indicators, namely, the construction personnel training pass rate U41, the assembly construction technology implementation compliance rate U42, the unreasonable site plan U43, and the acceptance pass rate U44. The skill and training level of construction personnel directly affects the smooth running of the project. The execution compliance rate of assembly construction technology measures whether the on-site construction is carried out in strict accordance with the technical standards to ensure standardization and safety in the construction process. Unreasonable on-site planning may lead to problems such as chaotic resource allocation and construction delays, which increase the risk to quality. If the inspection and acceptance process is not standardized, quality problems may not be detected and corrected in time, ultimately affecting the overall quality of the project.
The U5 indicator layer of the operation and maintenance phase contains two indicators: the frequency of monitoring of facilities and maintenance of equipment U51, and the troubleshooting capabilities of the maintenance staff U52. The operation and maintenance phase are also an important part of the assembly-building life cycle that cannot be ignored. Effective operation and maintenance management not only prolongs the service life of the building but also reduces the probability of the occurrence of building quality risks and ensures the reliability of the building for long-term use.

2.1.2. Determination of Weights of Indicators for Quality Risk Evaluation of Assembled Building

Determining the weights of indicators is a crucial step in the whole process of quality risk evaluation of assembled building. At present, the assignment methods are mainly categorized into the subjective assignment method, the objective assignment method, and the combination assignment method. The subjective approach has the advantage of fully reflecting the intentions of decision makers, but it is highly subjective. In contrast, the objective assignment method has a high degree of objectivity, but it is difficult to reflect the degree of importance attached by decision makers to different indicators. The combination method combines the advantages of the subjective and objective methods and determines the weights by taking into account the intrinsic pattern of the indicator data and the experience of the decision maker. In this paper, the Ordinal Priority Approach (OPA) is used to determine the subjective weights, the anti-entropy weighting method is used to calculate the objective weights, and finally the combination of weights is assigned through game theory. It is mainly based on the following considerations: That the order priority method is an efficient multi-attribute decision-making method. Its core advantage is that it directly reflects the subjective judgment of experts through sorting, avoids the complexity of consistency verification in the traditional hierarchical analysis method, and simplifies the weight calculation process. The anti-entropy weight method can more reasonably reflect the differences between indicators compared with the traditional entropy weight method and can reduce the influence of extreme weights by reversely measuring information entropy, thereby ensuring the fairness and adaptability of weight distribution. By combining the advantages of the two weighting methods and balancing the differences between subjective and objective weights with the help of game theory, a more scientific, comprehensive and fair weight distribution result is finally obtained, so as to effectively improve the accuracy and reliability of the quality risk assessment of the whole process of prefabricated buildings.
(1)
Ordinal priority approach method
The ordinal priority approach method is a multi-attribute decision-making (MADM) method [17], which establishes a mathematical model to solve the multi-attribute decision-making problem by allowing the decision maker to rank the indicators to determine the weights. The method is simple and intuitive to operate, only needs to be ranked without complex numerical scoring, it can fully reflect the subjective preference and experience of the decision maker, and it simplifies the process of determining the weights by converting the ranking results into weights. The weights are determined by direct comparison of the experts’ rankings, avoiding the inconsistency problem that may be caused by the pairwise comparison matrix in the traditional AHP method, so there is no need for consistency testing.
In addition, the core strength of the ordinal priority approach method is its high sensitivity to changes in decision preferences. Compared with the traditional weight calculation methods, the OPA method accurately captures the subtle differences in the ranking through a linear optimization model. For example, in the quality risk evaluation of this study, for indicators U13 (number of prefabricated component design changes) and U14 (construction rework rate) to be ranked under U1 in the decision-making design phase the differences in the experts’ rankings must reflect their different emphasis on the rationality of the design scheme and the importance of construction management. The OPA method is able to directly quantify these subtle changes in ranking into weight differences, thus improving the science and rationality of weight allocation.
The use of the OPA method first requires policymakers to identify the basic criteria and sub-criteria and to select expert groups. To ensure the accuracy of the weighting calculation, the panel members come from the fields of assembly building design, production and construction, with diverse professional backgrounds and rich practical experience. The experts ranked the indicators according to their experience, education and other factors to prioritize them, and then prioritized each criterion or sub-criterion separately and prioritized the alternatives within each criterion. Finally, a linear model (1) was constructed based on the collected data and programmed to be solved using MATLAB R2020a to ensure the accuracy of the sorted data and the reliability of the results.
Max Z
S.t:
Z i j k W i j k k W i j k k + 1           i , j   a n d   k Z i j m W i j k m           i , j   a n d   k i = 1 p j = 1 n k = 1 m W i j k = 1 W i j k 0           i , j   a n d   k
where i represents experts, j represents standardized preferences, and k represents alternatives.
After solving, the model subjective weights are determined through Equation (2):
W ( 1 ) = i = 1 p k = 1 m W i j k , j
(2)
Anti-entropy weighting method
Compared with the traditional entropy weighting method, the anti-entropy weighting method [18] can more effectively reflect the differences between indicators when calculating objective weights. By defining a kind of anti-entropy value, the anti-entropy weight method attenuates the sensitivity to the differences of the indicators, which makes it possible to consider the importance of each indicator more fairly in the weight calculation, trying to avoid the situation of extreme weights in the process of assigning weights, and especially when dealing with some key indicators, it can better reflect their actual impact.
The steps for determining the objective weights of the indicators by the anti-entropy weighting method are as follows:
1)
Determine the original risk judgment matrix. There are m experts to evaluate n risk evaluation indicators and so the evaluation results formed the original risk judgment matrix Z = z i j n × m , as in Formula (3):
Z = z 11 z 12 z 1 m z 21 z 22 z 2 m z n 1 z n 2 z n m
2)
Normalization processing of the original risk judgment matrix. In order to ensure that each indicator has the same importance in the evaluation process and to avoid the bias caused by the difference in the scale and the difference in the range of values, the raw data are normalized and converted into the [0, 1] interval as shown in Equation (4):
z i j = z i j min z i max z i min z i
where z i j denotes the normalized value of the jth sample of the ith indicator, z i j denotes the original value of the jth sample of the ith indicator, and min z i and max z i denote the minimum and maximum values of the ith indicator, respectively.
The normalized matrix is obtained after processing as Equation (5):
Z = z 11 z 12 z 1 m z 21 z 22 z 2 m z n 1 z n 2 z n m
3)
Calculate the anti-entropy value of the indicators. Using the normalized data, calculate the anti-entropy value for each indicator, as Equation (6):
H i = j = 1 m r i j ln 1 r i j , 1 j m
Among them, r i j = z i j j = 1 m z i j and m is the number of experts.
4)
Calculate the objective weights of the indicators. The anti-entropy value is normalized to ensure that the sum of the weights of the indicators is 1. Equation (7) is as follows:
w i = H i i = 1 n H i , 1 i n
where, w i represents the normalized anti-entropy value of the ith indicator, and 0 ≤ w i ≤ 1. n represents the number of evaluation indicators.
Through the above steps, the objective weights of each indicator can be obtained as follows in Equation (8):
W ( 2 ) = w i
(3)
Combinatorial Empowerment Based on Game Theory
Game theory is used to synthesize subjective and objective weights, considering them as two sides of the game, by solving the optimal solution (Nash equilibrium point) in order to obtain the combined weights [19]. The core of the methodology lies in the effective integration of subjective expert experience with data-driven objective analysis through a dynamic-balancing mechanism. Thus, it solves the inconsistency or conflict between the two in weight allocation, avoids the bias brought by a single assignment method, improves the stability and reliability of weights, and provides more comprehensive and accurate evaluation results. The specific steps are as follows:
(1)
Linear combination model construction. The subjective weight vector W(1) determined by the OPA method and the objective weight vector W(2) determined by the inverse entropy weight method are linearly combined, and the linear combination coefficients α1 and α2 are introduced as in Equation (9):
W = 1 W ( 1 ) + 2 W ( 2 )
The aim is to minimize the deviation between subjective and objective weights by optimizing the combination coefficient α.
(2)
Optimizing objective function construction. In order to find the optimal weight vector W′ in the set of possible weight vectors, the optimization objective function is constructed. In this paper, the principle of departure minimization is adopted, and the goal is to minimize the deviation between W′, and W(1) and W(2) at the same time, that is, the weight vectors are subjected to deviation minimization as shown in Equation (10):
min j = 1 2 j W ( j ) T W ( j ) 2
The formula ensures that the impact of subjective and objective weights on the final result is represented in a balanced way, thus avoiding significant conflicts between the two.
(3)
Optimal solution solving. The first-order derivative condition of the optimal solution is obtained according to the matrix differentiation property, and the form of the corresponding system of linear equations is shown in Equation (11), and the optimal linear combination coefficients α1 and α2 can be obtained by solving the system of linear equations:
W ( 1 ) W ( 1 ) T W ( 1 ) W ( 2 ) T W ( 2 ) W ( 1 ) T W ( 2 ) W ( 2 ) T ( 1 ) ( 2 ) = W ( 1 ) W ( 1 ) T W ( 2 ) W ( 2 ) T
(4)
Normalization. The calculated optimal combination coefficients α1, α2 are normalized to obtain the final composite weight vector W′, Equation (12) as follows:
W = 1 1 + 2 W ( 1 ) + 2 1 + 2 W ( 2 )
(5)
Conflict resolution validation. The validation analysis of the examples below reveals significant deviations between subjective and objective weights for some indicators (e.g., U23 and U32). Through optimization, the final distribution of comprehensive weights is more balanced, and subjective preferences and data laws are fully reflected, which verifies the effectiveness of game theoretic combinatorial assignment in resolving weight conflicts.

2.2. Constructing a Game Theory-Combinatorial Empowerment Three-Dimensional Cloud Evaluation Model

In order to solve the stochastic ambiguity problem under the synergistic effect of the three basic variables of risk occurrence probability x, risk occurrence consequence y, and risk concealment z of the whole-process quality risk index of assembled building, this paper chooses the three-dimensional cloud model as the risk evaluation method [13]. By constructing cloud diagrams and comprehensively considering the characteristics of different dimensions of the indicators, the three-dimensional cloud model has the advantage of dealing with uncertainty and ambiguity and can better reflect the complexity of the actual situation in risk evaluation, thus providing more intuitive and comprehensive risk evaluation results. By correlating the risk factors in the five stages of decision-making and design, bidding and procurement, production and transportation, on-site assembly and construction, as well as operation and maintenance, and combining the probability, consequences, and hidden nature of the risks, a systematic quality risk evaluation model has been formed, as shown in Figure 2.

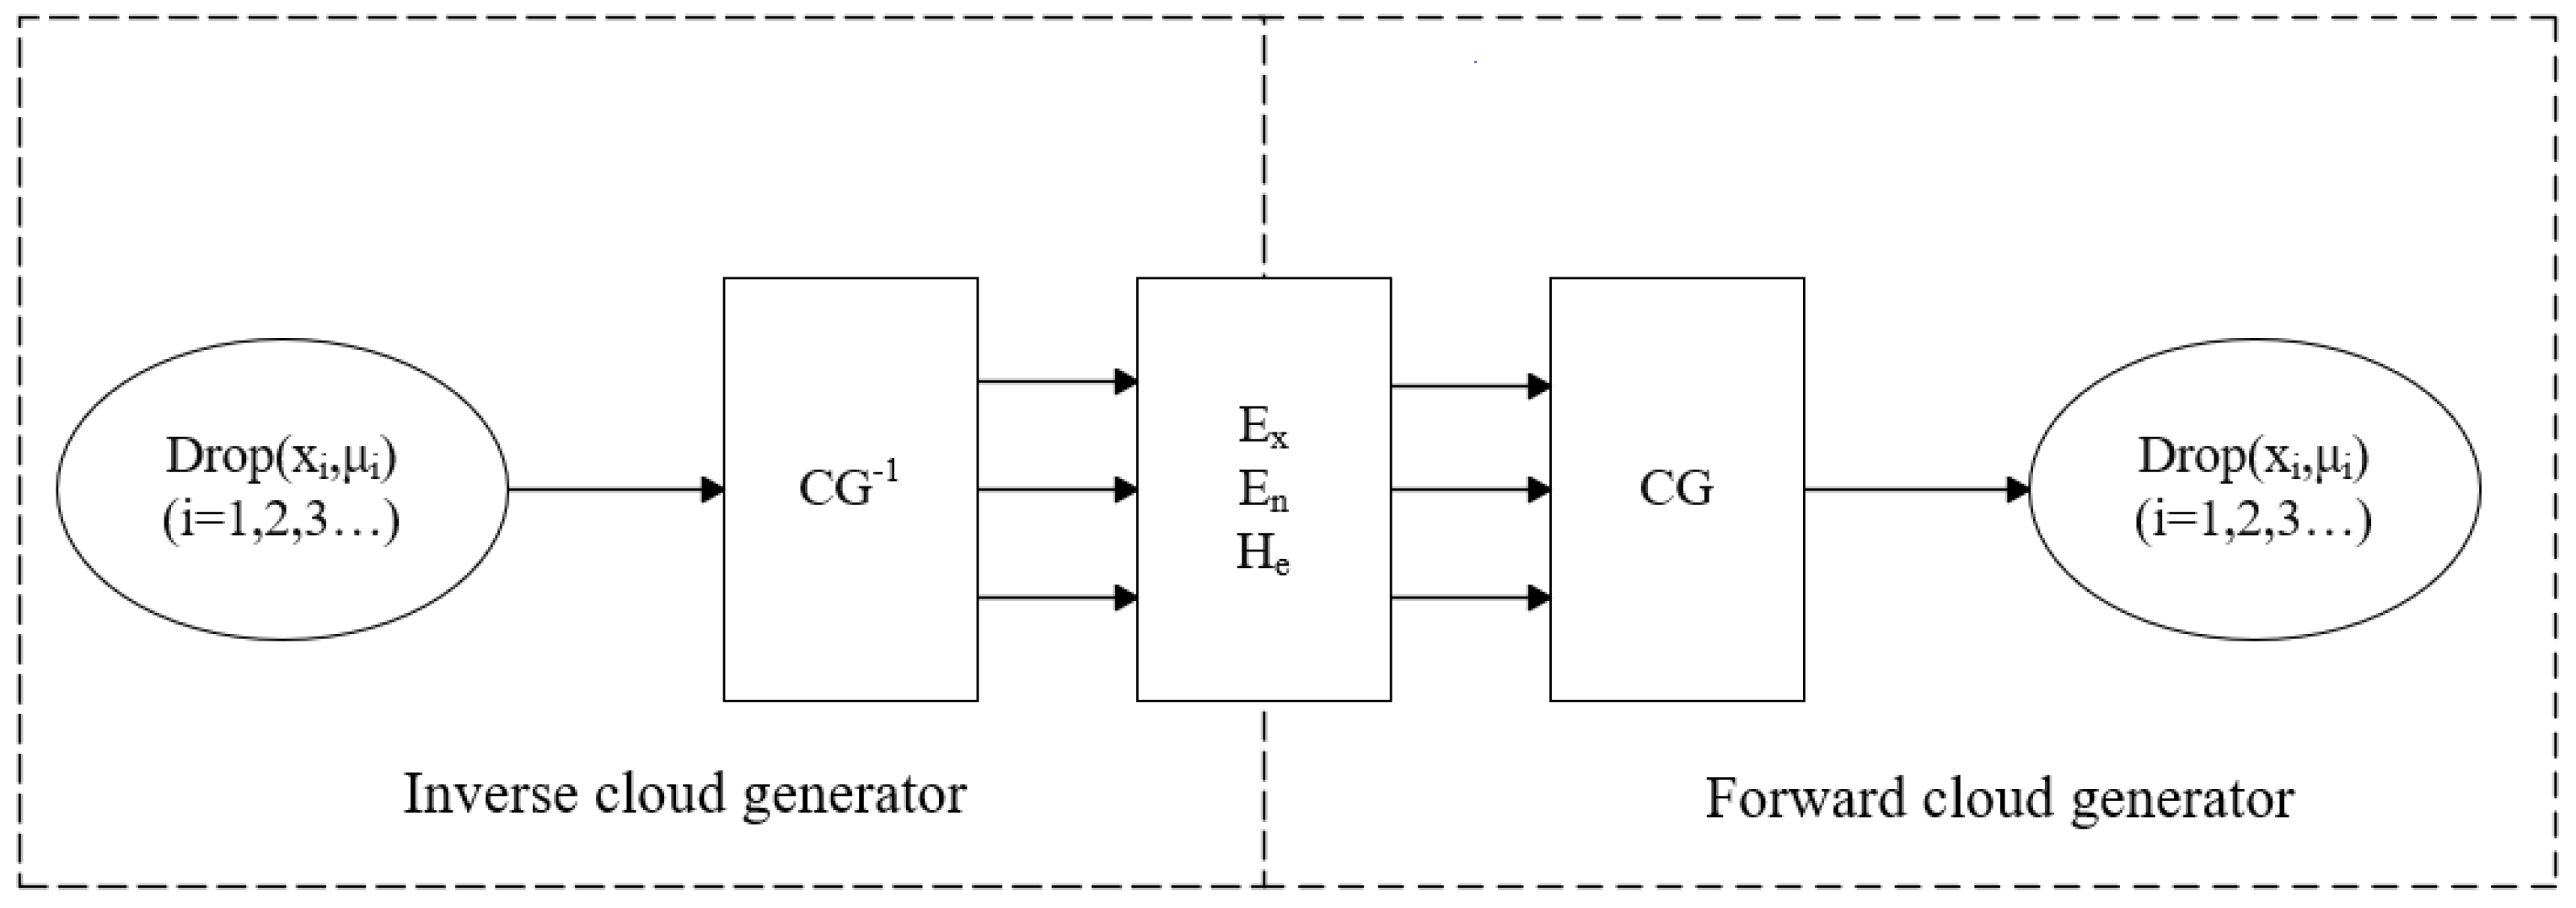
2.2.1. Basic Theory of the Cloud Model

Cloud modeling is a theory and method that combines fuzzy mathematics and probability statistics to deal with complex systems with uncertainty and ambiguity, which can transform qualitative and quantitative problems into each other, and its core idea is to represent the ambiguity and randomness of concepts through cloud droplets, and to construct cloud diagrams to visualize the state of the system and use it to judge the level of risk. The cloud model has three numerical features for describing the morphological distribution of the cloud, which are Expectation Ex, Entropy En, and Hyper-entropy He [20]. Expectation Ex reflects the center value of the cloud model, which is the mean value of the cloud droplets, and it indicates the centralized tendency of things; entropy En reflects the uncertainty and ambiguity of the cloud model, and the larger the entropy, the higher the ambiguity of the concepts; and hyper-entropy He reflects the degree of dispersion of entropy, which is the standard deviation of entropy, and the larger the hyper-entropy is indicates the higher the uncertainty of the cloud droplets in the cloud model.
The basic algorithm of the cloud model is implemented through cloud generators, which are categorized into Forward Cloud Transformation and Backward Cloud Transformation. The Backward Cloud Generator is responsible for converting cloud droplets Drop(xi, μi) (i = 1, 2, 3…) into cloud numerical features (Ex, En, He), which transforms quantitative data into qualitative concepts. The forward cloud transformation generator then converts cloud numerical features (Ex, En, He) to cloud droplets Drop(xi, μi) (i = 1, 2, 3…), realizing the conversion from qualitative concepts to quantitative data. In this paper, the inverse cloud transformation is carried out first to determine the cloud digital features of the quality risk indicators of the whole process of assembly building, and then the forward cloud transformation is carried out to draw the risk evaluation cloud diagram. The principle of the cloud generator is shown in Figure 3.
Each of the underlying variables of the three-dimensional cloud model, risk occurrence probability x, risk occurrence consequence y, and risk concealment z, are evaluated by constructing the model using three sets of numerical features of qualitative concepts, respectively.
      ( x , y , z ) = T ( E X , x , E X , y , E X , z , E n , x , E n , y , E n , z ) ( D x , D y , D z ) = T ( E n , x , E n , y , E n , z , H e , x , H e , y , H e , z )                         μ = e 1 2 ( x E X , x ) 2 D x 2 + ( y E X , y ) 2 D y 2 + ( z E X , z ) 2 D z 2
where t represents a three-dimensional random function obeying a normal distribution, E X , x , E X , y , E X , z are the expectations of the three basis variables, E n , x , E n , y , E n , z are the entropies of the three basis variables, and, H e , x , H e , y H e , z are the hyper-entropy of the three basis variables. μ is the degree of certainty that a three-dimensional cloud droplet belongs to a certain characterization concept (μ ∈ [0, 1]).
We call the cloud model consisting of cloud drops drop(x, y, z, μ) conforming to the above equation a three-dimensional normal cloud model. The three-dimensional cloud model represents each risk indicator as a cloud containing a large number of cloud droplets that are distributed in three-dimensional space, reflecting the characteristics and uncertainties of the indicator. Standard clouds, on the other hand, are pre-defined to represent reference clouds for different risk levels. The risk level to which the evaluation cloud belongs is determined by calculating the distance between the evaluation cloud and the three-dimensional cloud droplet clusters of the standard clouds at each level. Therefore, the focus of this paper is to map the three-dimensional cloud droplet clusters of the evaluation cloud and the risk level standard cloud, and to determine the risk level of the indicator by comparing the distances between the cloud droplet clusters.

2.2.2. Construction of Three-Dimensional Cloud Evaluation Model

(1)
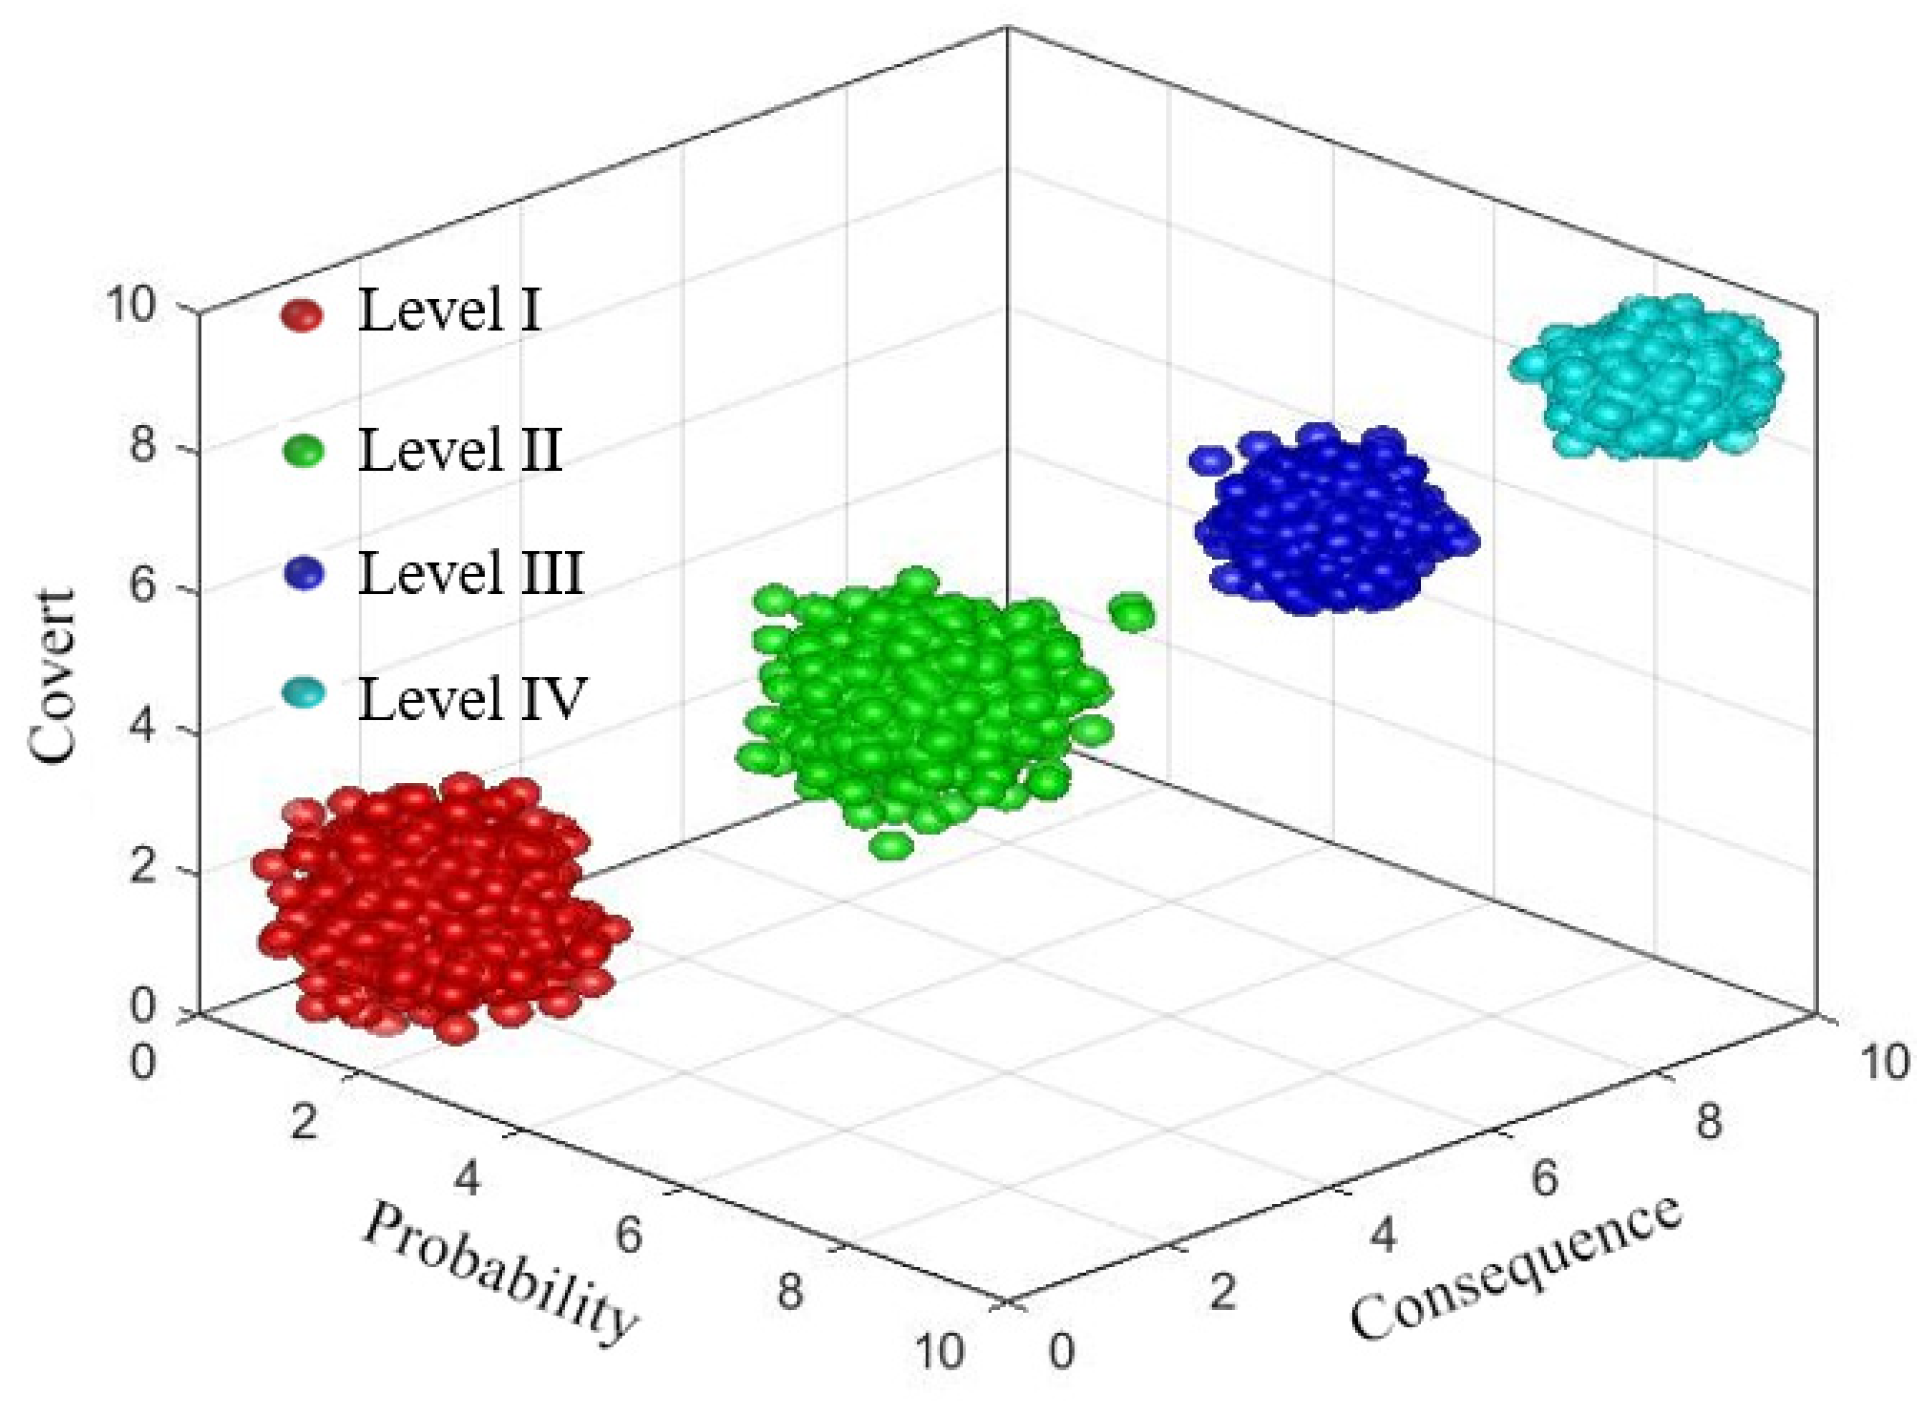
Determine the three-dimensional cloud droplet clusters for risk level criteria clouds
In this paper, with reference to national and industry norms such as the Evaluation Standard for Assembled Building, and combining research results and expert opinions in the field of assembled building, the risk probability, consequence and concealment levels of the selected evaluation indexes will be scored by the experts according to the “0–10” point system, and classified into levels Ⅰ to IV, as shown in Table 2. The standard cloud is established based on the division interval of the risk evaluation level, and its three numerical characteristics are calculated by the following Formula (14):
E X ¯ = S i max + S i min 2 E n ¯ = S i max S i min 6 H e ¯ = k
where E X ¯ is the expectation of the standard cloud; E n ¯ is the entropy of the standard cloud; H e ¯ is the hyper-entropy of the standard cloud; S i max and S i min denote the upper and lower boundary values of the ith interval, respectively; and k is a constant, according to the existing research experience in related fields, which this paper takes as k = E n ¯ 10 .
(2)
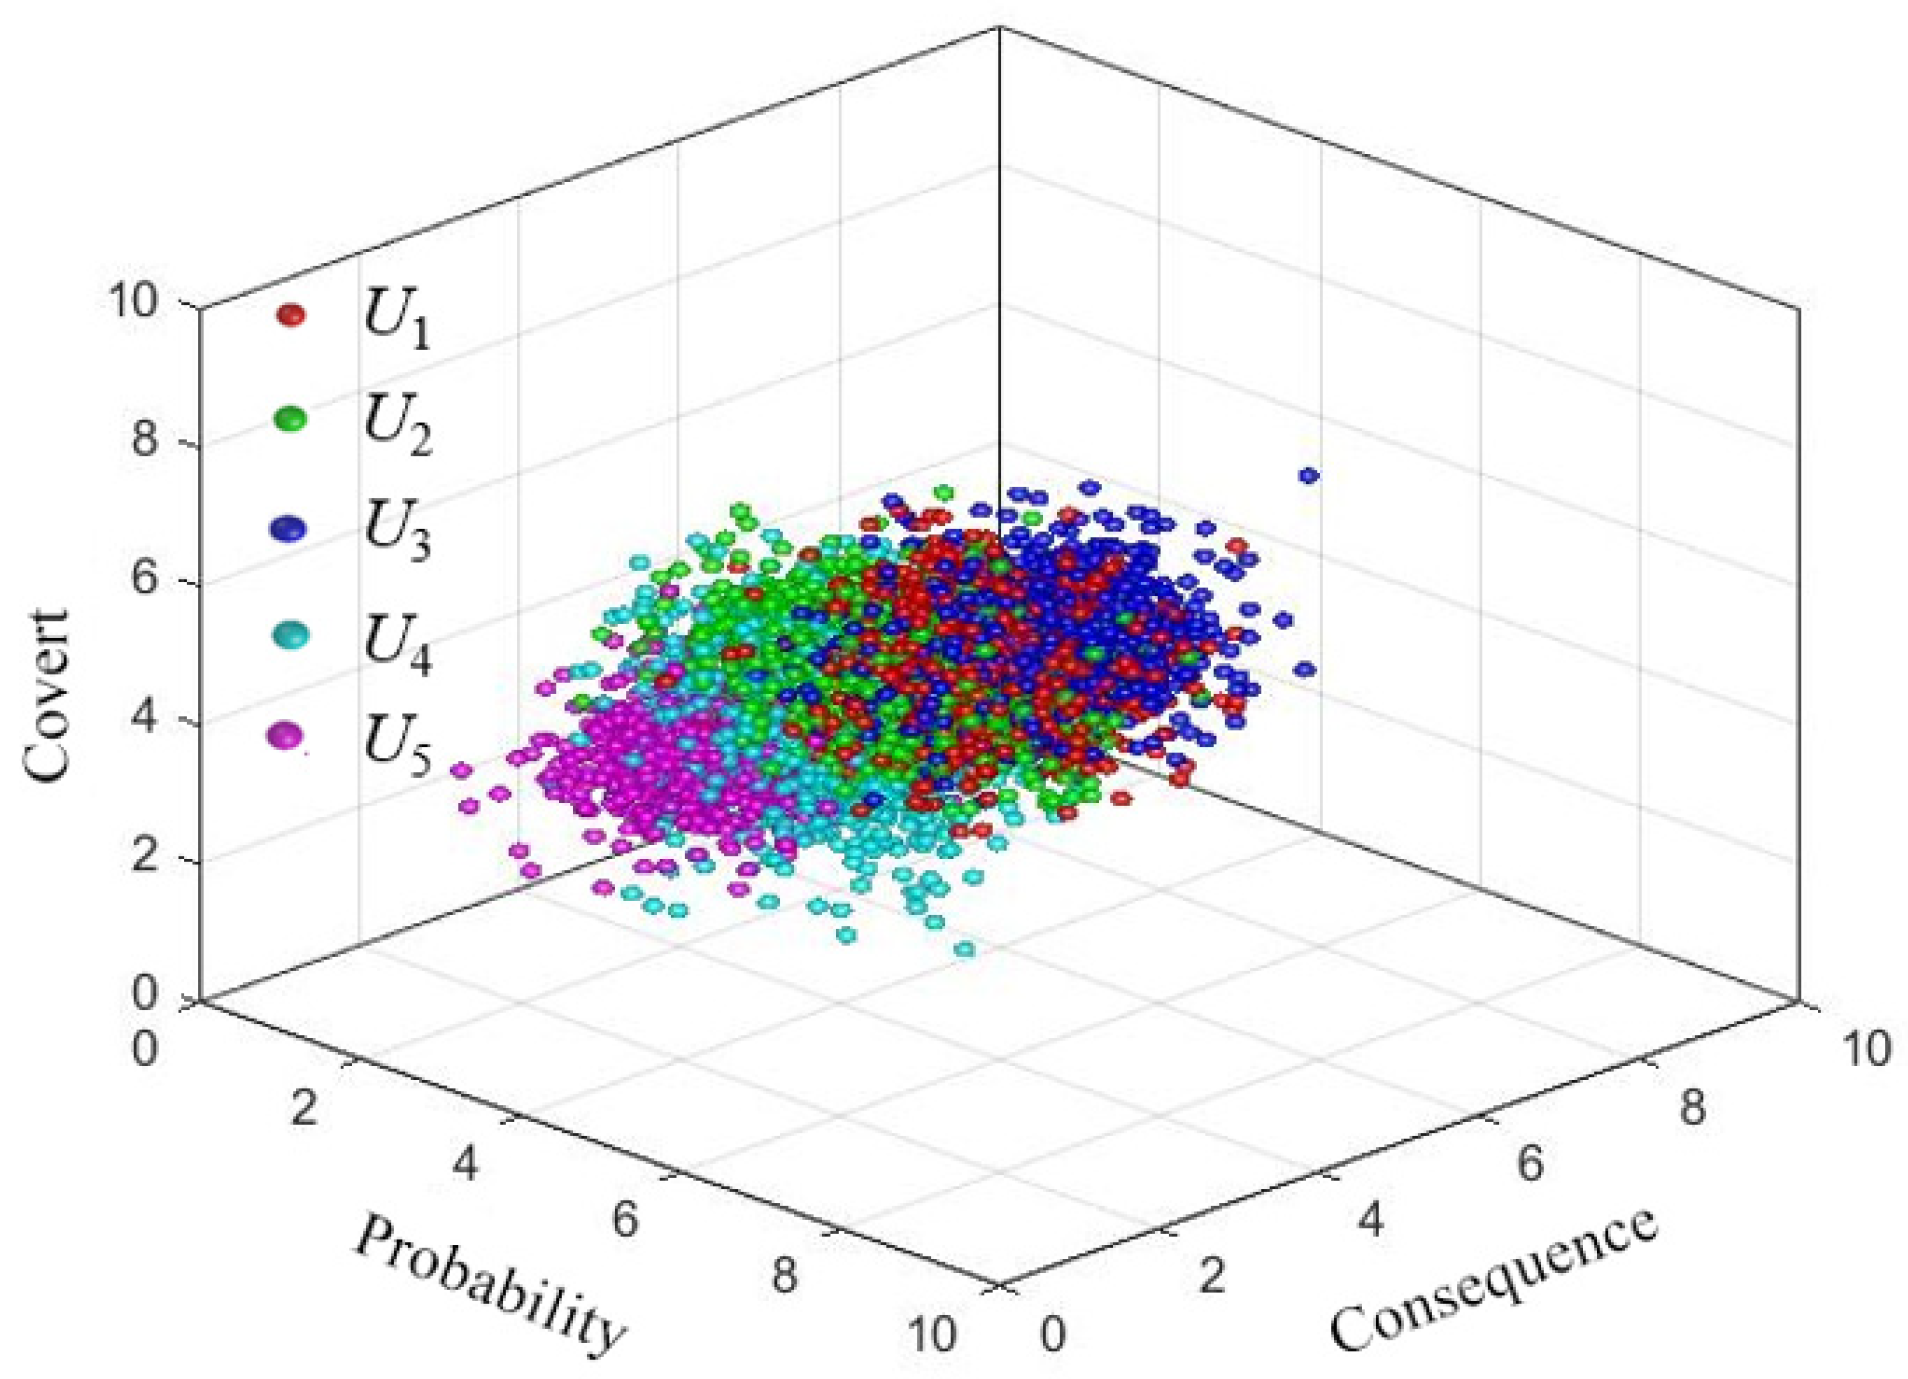
Determine the three-dimensional cloud droplet clusters for risk indicator evaluation clouds
Invite q industry experts to score the probability of occurrence, consequences, and hiddenness of the selected evaluation indicators according to the ten-point scoring method, and calculate the three numerical characteristics of the evaluation cloud based on these data, respectively, and create Equation (15) which is as follows:
E X j = 1 q i = 1 q x i j E n j = π 2 × 1 q i = 1 q x i j E X j H e j = s j 2 E n j 2 S j 2 = 1 q 1 i = 1 q ( x i j E X j ) 2
where q is the number of experts; n is the number of risk indicators; xij (i = 1, 2, …, q; j = 1, 2, …, n) is the score of the jth risk indicator by the ith expert; and S j 2 is the sample variance.
(3)
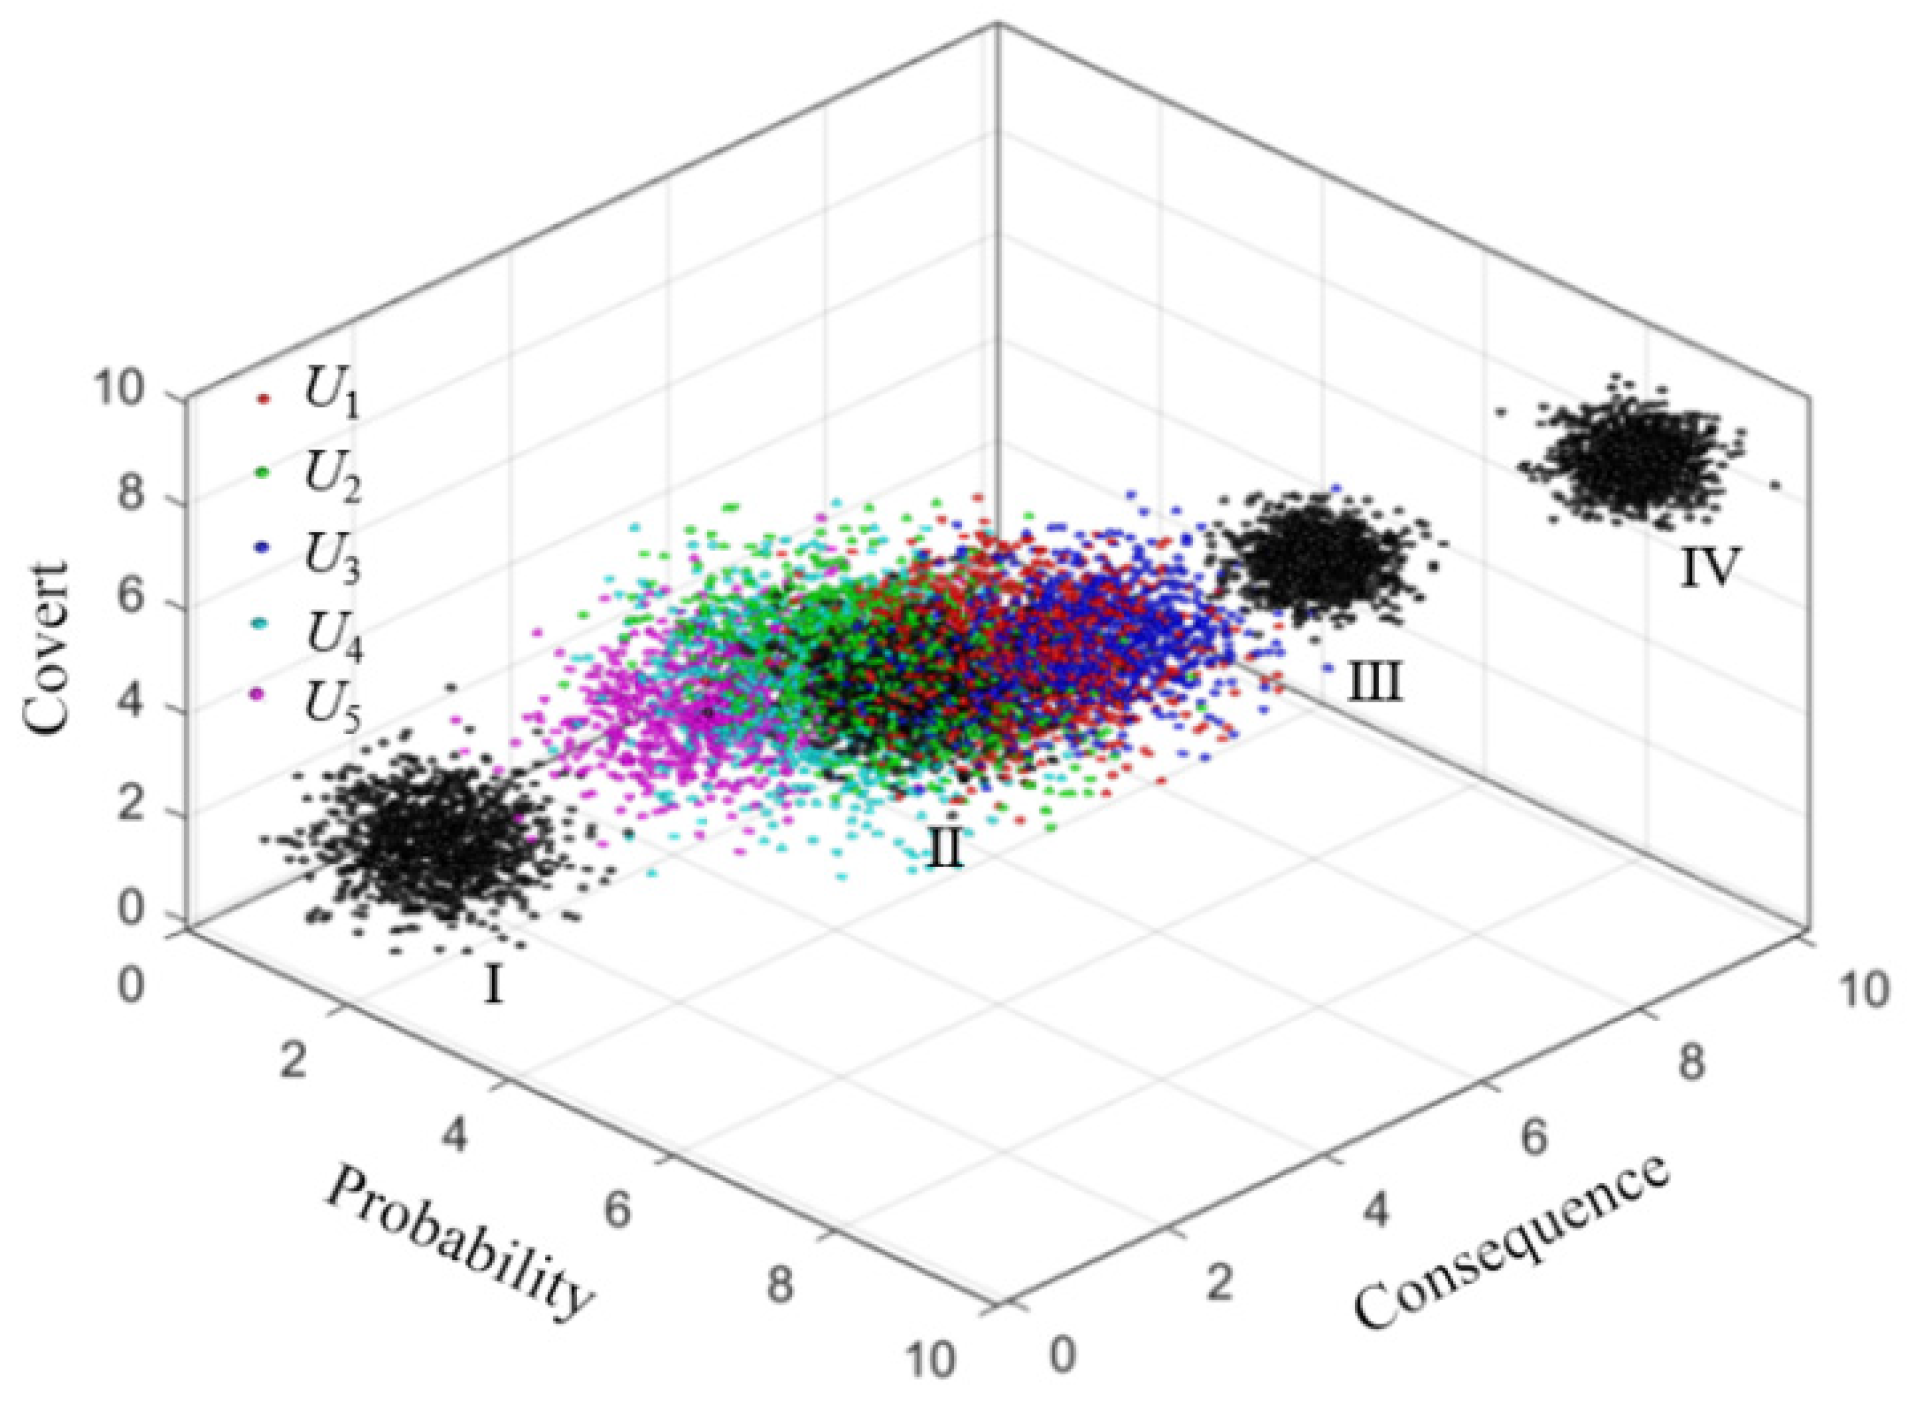
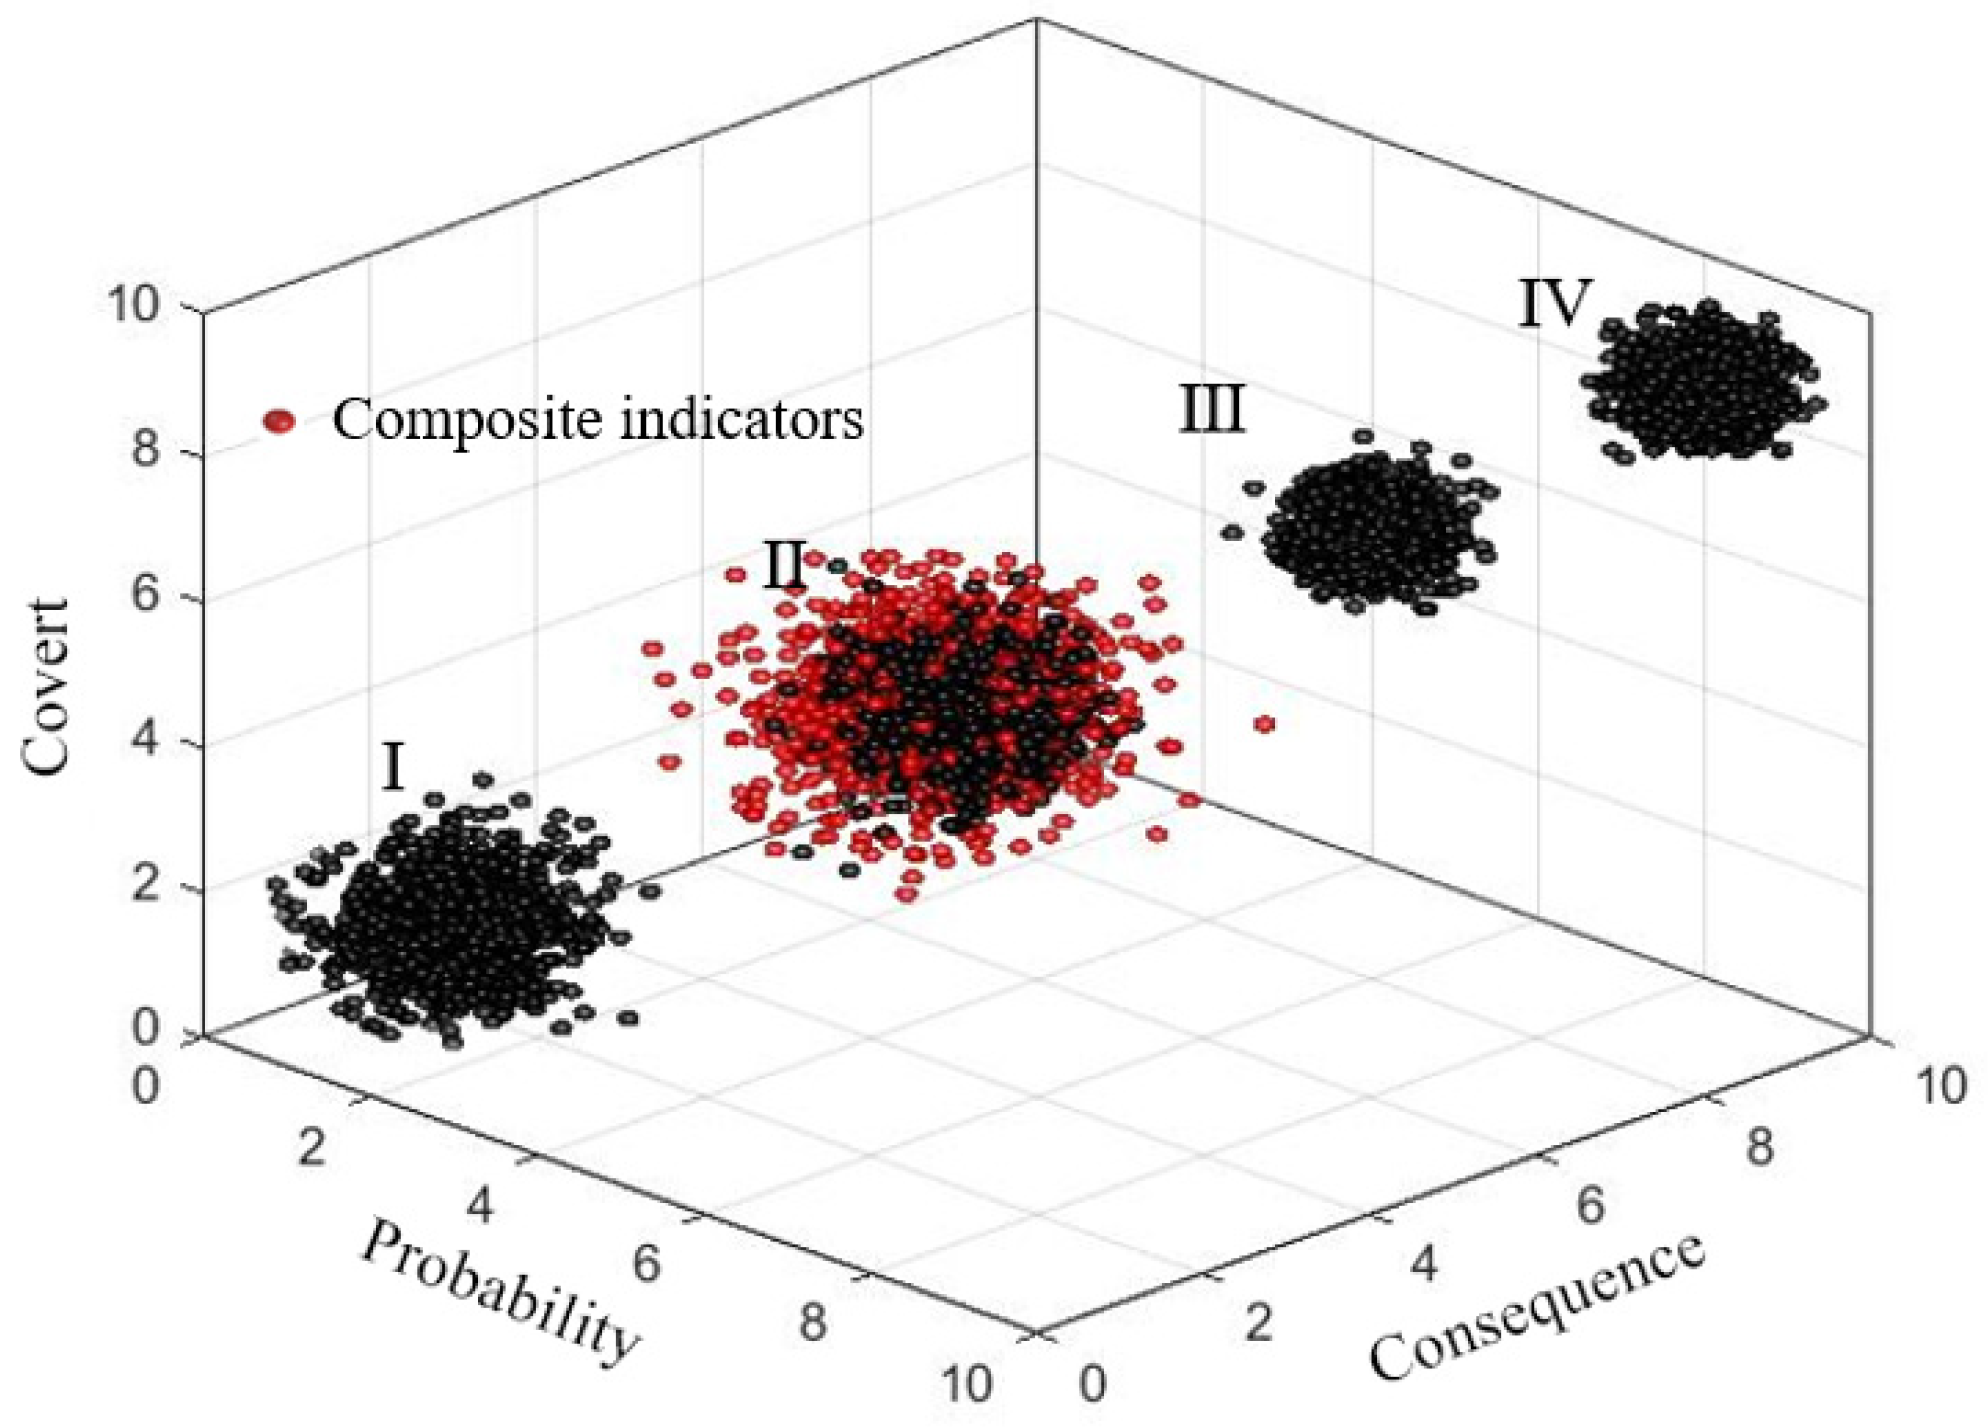
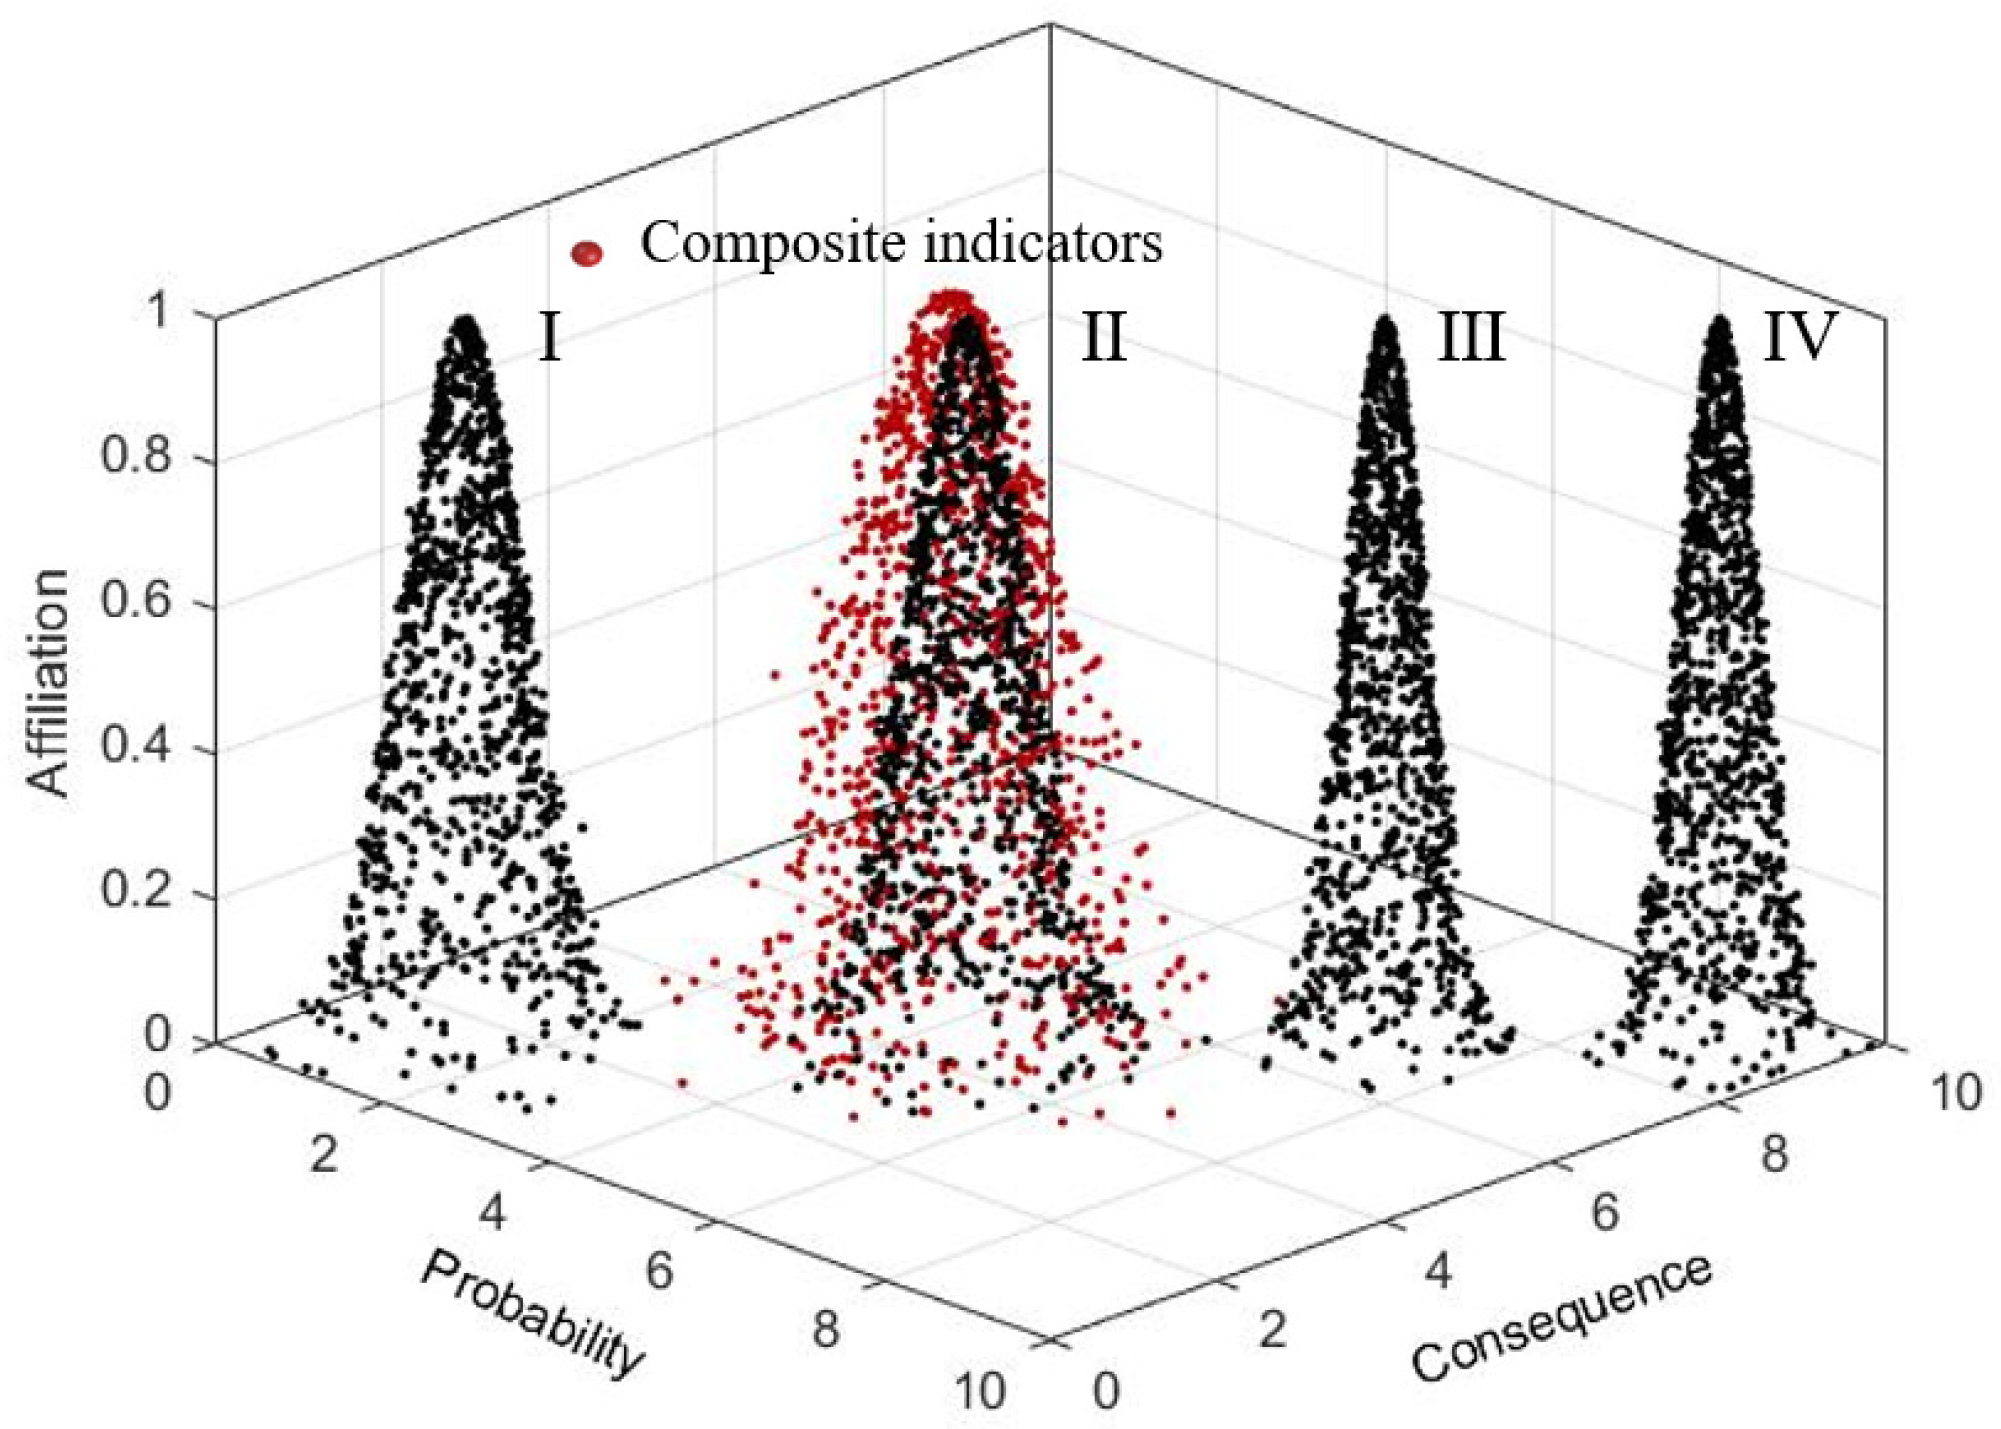
Determine the three-dimensional cloud droplet clusters for integrated evaluation clouds
The comprehensive evaluation cloud utilizes the cloud model fusion algorithm to calculate the numerical characteristics of the evaluation cloud for high-level risk indicators by means of the low-level indicator risk cloud matrix and the weight matrix together. Formula (16) is calculated as follows:
C = ( w 1 , w 2 , , w n ) E X , 1 E n , 1 H e , 1 E X , n E n , n H e , n = E X , E n , E e
(4)
Determine the level of risk
The digital eigenvalues of the standard cloud and the comprehensive evaluation cloud obtained above are used to generate a comparison cloud map through MATLAB R2020a software, and the determination of the risk level is based on the comparison of the two locations within the same cloud map. By comparing and analyzing the distance between the evaluation cloud and the standard cloud, the grade range of risk indicators can be initially judged; however, since the resultant clouds of different risk grades may be closer, it is difficult to accurately distinguish the risk grades only by visual comparison, so this paper introduces the proximity calculation method to more accurately determine the risk grades to which they belong. The calculation of Formula (17) is as follows:
L = 1 E X , x ¯ E X , x 2 + E X , y ¯ E X , y 2 + E X , z ¯ E X , z 2
where, E X , x ¯ and E X , x denote the expected value of risk probability for the standard cloud and the evaluation cloud; E X , y ¯ and E X , y denote the expected value of risk consequence for the standard cloud and the evaluation cloud; and E X , z ¯ and E X , z are the expected value of risk concealment for the standard cloud and the evaluation cloud.
The three-dimensional cloud model proposed in this paper quantifies the risk characteristics through the three dimensions of risk probability, consequence, and hiddenness, and this approach has a high degree of flexibility to adapt the evaluation indicator system to specific project types. For example, for infrastructure projects (e.g., a bridge or tunnel construction), the modeling framework can be dynamically adapted by introducing indicators reflecting environmental risks or technical complexity. In addition, the game-theoretic portfolio assignment method can be widely applied to other types of construction projects through the dynamic balance of subjective and objective weights, without relying on a specific industry context.

3. Instance Validation

3.1. Overview of the Project

An assembly office building project is located in Hefei City, Anhui Province, with a total construction area of about 13,660 m2. The building structure form is a frame shear wall structure, the main structure adopts prefabricated assembly technology, the prefabricated components mainly include prefabricated floor slabs, prefabricated wall panels, prefabricated beams and columns, etc., and the prefabricated rate of the components is about 40%, and the assembly rate reaches 45%. The project consists of ten floors above ground and two floors underground and is mainly to be used for office and commercial purposes.

3.2. Weighting Calculation

A total of eleven experienced industry experts in assembly building-related fields were hired to rank the degree of influence of the whole-process quality risk factors identified in the screening of this study, and subjective weights, W(1), were obtained by applying Equations (1) and (2) using the OPA method. At the same time, according to the actual situation of the project, experts were invited to check the feasibility study report, construction organization design plan, and the operation and maintenance situation of the project, etc., to score each risk indicator, and based on the scoring results of the experts, combined with Equations (3)–(8), the objective weights of the indicators based on the anti-entropy weighting method, W(2), were calculated. Finally, the comprehensive weight, W′, of the quality risk evaluation indexes in the whole process of assembly building is derived through Equations (9)–(12), and the results are shown in Table 3.

3.3. Cloud Modeling

A total of ten experienced industry experts were invited to score the probability of occurrence, consequences, and hiddenness of each secondary risk factor in this whole-process quality risk evaluation system for assembled buildings, as shown in Table 4.
According to the scoring results of the experts in Table 4, the numerical characteristic values of the base variables of each second-level risk indicator can be obtained by applying Equation (15), based on which, the numerical characteristics of the base variables corresponding to the first-level risk indicators and the comprehensive indicators can be further determined by Equation (16), and the results are shown in Table 5.
Based on the numerical characteristics of the standard cloud listed in Table 2 and the numerical characteristics of the evaluation clouds at all levels obtained from Table 5, the corresponding three-dimensional cloud droplet coordinates and the certainty of each cloud droplet can be calculated, respectively. With these data, the three-dimensional cloud droplet clusters representing the standard clouds of different risk levels and the evaluation clouds of all levels (taking the integrated indicator and the first-level indicator as an example) are plotted, as shown in Figure 4, Figure 5 and Figure 6.
Then, the evaluation cloud of the above risk indicators and the three-dimensional cloud droplet clusters of the risk level standard cloud are displayed in the same layer, and the three-dimensional cloud droplet clusters are plotted separately through the software for comparison, as in Figure 7 and Figure 8.
From Figure 7, it can be preliminarily judged that the risk level of U1, U2, and U3, the first-level indicators of the quality of this assembly building project, lies between Class II and Class III, and the risk level of U4 and U5 lies between Class I and Class II. From Figure 8, it can be seen that the risk level of the quality of the whole project is basically located in Class II.

3.4. Analysis of Results

Since for some of the indicators it is difficult to accurately determine their similar risk levels by direct observation on the comparison cloud diagram, the formula for similarity (17) is introduced for quantitative analysis. The proximity formula allows the degree of proximity between each evaluation indicator and the different risk criteria to be derived, thus more precisely determining the risk level attribution of each indicator. The higher the degree of similarity, the stronger the match between the indicator and the risk level, thus providing a scientific basis for the determination of the risk level. The detailed calculation results and the finalized risk level can be seen in Table 6.
From Figure 7 and Figure 8, and from Table 6, it can be seen that the comprehensive risk level of the whole-process quality of this assembly building is level II, which indicates that the risk is acceptable and consistent with the actual situation of the project, and it also verifies the validity of the evaluation method of the three-dimensional cloud model proposed in this paper. The risk level of each level indicator is II, which means that the risk level at these stages is generally acceptable. Although there may be some challenges in risk management at each stage, these risks are still under control and do not require additional significant interventions.
Refined to the secondary indicators, the risk level of all the secondary indicators is II, except for the number of design changes of prefabricated components U13, and the quality of raw materials and the supply chain stability U32, which have a risk level of III. It is analyzed that this is mainly due to the irrationality of the design scheme and changes in the construction site conditions in the assembly building project, which leads to an increase in prefabricated component design changes, and thus the overall quality and schedule of the project is greatly affected. In order to cope with such risks, research and demonstration work should be strengthened in the pre-design phase of assembly building projects to ensure the rationality and feasibility of the design scheme and to avoid rework as much as possible; at the same time, an efficient design change management process should be established to strengthen the communication and collaboration between the design team and the construction team, so as to minimize the adverse effects of design changes.
In addition, the high risk of raw material quality and the supply chain stability issues is mainly due to factors such as poor supplier management, logistics and transportation issues, and market fluctuations in the project. It is recommended to select reputable suppliers and establish long-term and stable cooperative relationships; meanwhile, it is recommended to implement strict raw material quality testing and control measures to ensure that the raw materials for assembled buildings comply with standards and to further optimize supply chain management and to improve logistics and transportation efficiency in order to reduce losses and delays during transportation. By establishing an emergency plan, the team are able to take timely countermeasures when problems arise in the supply chain to ensure the smooth progress of assembly building projects.
Above, by applying the three-dimensional cloud model to the whole process quality risk evaluation of an assembled office building project, the overall risk level calculated by the model is class II, which is highly consistent with the actual situation of the project and verifies the applicability and feasibility of the model. The three-dimensional cloud model is able to comprehensively and accurately identify the key risks in the whole process of assembled buildings by comprehensively considering the three dimensions of risk occurrence probability, consequence, and hiddenness, which provides a scientific and reasonable basis for risk management. This indicates that the three-dimensional cloud model has a strong practical value and promotion potential in the quality risk evaluation of complex engineering projects.

4. Model Comparison and Validation

In order to reflect the advantages of the three-dimensional cloud model, this paper selects the same case data and compares and analyzes the two-dimensional cloud model with the three-dimensional cloud model. The main feature of the two-dimensional cloud model is to evaluate the risk through the dimensions of “probability of risk occurrence” and “risk consequences”, and the result can reflect the significance of the risk more clearly. However, the model does not consider the important factor of risk concealment, which limits its performance in complex risk scenarios.
According to the relevant formula of the two-dimensional cloud model, the numerical characteristics of the risk of each indicator are calculated [20], and the comprehensive indicator evaluation cloud and the evaluation cloud of the first-level indicator are plotted against the risk level standard cloud, respectively, which can be seen in Figure 9 and Figure 10. The evaluation results of the two-dimensional cloud models obtained through the proximity calculation are then organized and shown in Table 7. In order to show the comparison of the results of the two cloud modeling methods more clearly, the evaluation results of the two methods are summarized in Table 8.
As can be seen from the results in Table 8, the results of the two-dimensional cloud model risk evaluation method and the three-dimensional cloud model risk evaluation method are basically the same, and that the risk level of the whole project and the five level 1 indicators are all level II, and that there are only differences in the risk level of individual indicators. The risk level of the secondary indicators U37 (compliance rate of stacking protection and loading/unloading measures) and U51 (frequency of monitoring of facilities and maintenance of equipment) in the two-dimensional cloud model is III and I, respectively, while the corresponding three-dimensional cloud model assesses the risk level of both as II, which is more in line with the actual situation of the project. This shows that the two-dimensional cloud model fails to fully reflect the potential impact of stacking protection measures and the hidden risk of later equipment maintenance, while the three-dimensional cloud model can more comprehensively capture the dynamic changes of these two types of risks by adding the “hidden” dimension, which can more effectively reveal the hidden risks, especially in the complex quality management process of assembled buildings, which has a more applicable and practical value and can be applied and promoted in other fields.
In summary, through the comparative analysis of the two-dimensional cloud model and the three-dimensional cloud model, the advantages and applicability of the three-dimensional cloud model in the quality risk evaluation of the whole process of assembled buildings are verified, which not only improves the accuracy of the evaluation, but also provides a more intuitive decision support tool for managers.

5. Conclusions and Prospects

5.1. Conclusions

This paper centers on the research object of quality risk evaluation in the whole process of assembly building, deeply analyzes the potential risk factors in each stage of the whole life cycle of assembly building projects, and puts forward corresponding countermeasures. Through the comprehensive use of game theory-combinatorial empowerment and three-dimensional cloud model, it not only provides a scientific basis for the quality management of assembled building but it also verifies the effectiveness and applicability of the method in practice. The conclusions of the study are as follows:
(1)
This paper systematically analyzes the potential quality risk factors in the whole process of assembled buildings from the five stages of decision-making and design, bidding and procurement, production and transportation, on-site assembly and construction, and operation and maintenance, identifies the key risk points, and puts forward targeted coping strategies. On this basis, a quality risk evaluation index system for the whole process of assembled buildings, containing 20 secondary indicators, is established, which provides a theoretical framework for the quantitative assessment of quality risk.
(2)
Applying the game theory-combinatorial method for quality risk evaluation and introducing the OPA (Ordinal Priority Approach) to calculate the subjective weights and the anti-entropy weight method to calculate the objective weights, through expert scoring and weight optimization, the weights of the risk factors are determined objectively and impartially, which improves the scientific nature and accuracy of the risk assessment. The game theory-combinatorial method effectively integrates the subjective judgment of experts and the objective analysis of data, which enhances the credibility and practicality of the model.
(3)
A three-dimensional cloud model is used to evaluate the quality risk of the whole process of assembly building, combining the three dimensions of risk probability, risk consequence, and risk concealment to quantitatively analyze the risk characteristics of each index. Example validation shows that the overall risk level is II, which is highly consistent with the actual situation of the project, and the risk level of key risk indicators U13 and U32 are both III, while the rest of the risk indicators are all II, reflecting the significant impact of frequent design adjustments and the quality of raw materials themselves on the quality risk. Comparison results with the traditional two-dimensional cloud model show that the three-dimensional cloud model can more accurately identify high hidden risks, especially in the risk evaluation of U37 and U51, and that the assessment results of the three-dimensional cloud model are closer to the actual project situation than the two-dimensional cloud model.
In conclusion, this paper constructs a comprehensive evaluation method applicable to the quality risk of the whole process of assembled buildings through the combination of game-theoretic-combinatorial-empowerment and three-dimensional cloud modeling, which can accurately identify and quantify the complex quality risk and provides scientific support for quality management and decision-making related to assembled buildings. Meanwhile, the theoretical framework and practical validation of the method show that it has high generalizability and can provide reference for the risk evaluation of other types of construction projects.

5.2. Prospects

Despite the results of this study, there is still room for expansion in the theoretical research and practical application:
(1)
Applicable scenario expansion can be expended in the future. The three-dimensional cloud model can be applied to more complex assembly building types, such as ultra-high-rise buildings, modular buildings, or intelligent buildings, so as to validate the model’s versatility and applicability in diversified scenarios.
(2)
Enriching the dimensions of risk evaluation. Although this paper introduces a three-dimensional cloud model (probability, consequence, and hiddenness), future research can explore more dimensions affecting risk to improve its scientific and comprehensive nature. For example, economy, as the direct or indirect impact of risk occurrence on cost. The time factor, as the dynamic monitoring of risk trends over time. Socio-environmental impacts, such as assessing the long-term impacts and social satisfaction of assembly building quality risks on the community and the environment.
(3)
Optimization of indicator selection. The selection of indicators in the current study mainly relies on the literature research, accident case analysis, and expert opinions, which is somewhat subjective. In the future, data-driven indicator mining can be combined to mine high-frequency risk points in the whole life cycle of the building through the introduction of big data analysis technology, which can automatically screen key markers and reduce the impact of human intervention on the indicator system, as well as dynamically updating the indicator system according to the characteristics of different types of projects (e.g., building scale, regional conditions, construction environment, etc.) to make it more adaptable.

Supplementary Materials

The following supporting information can be downloaded at: https://www.mdpi.com/article/10.3390/app15073417/s1.

Author Contributions

Conceptualization, Q.S.; methodology and software, Z.Y.; formal analysis, X.W.; investigation, Z.W.; writing—original draft preparation, Z.Y.; supervision, Q.S. and D.L.; funding acquisition, D.L. All authors have read and agreed to the published version of the manuscript.

Funding

This research was funded by the National Natural Science Foundation of China, No. 42061011 and Dalian University Interdisciplinary Key Projects, DLUXK-2024-ZD-003.

Institutional Review Board Statement

Not applicable.

Informed Consent Statement

Not applicable.

Data Availability Statement

The data presented in this study are available in article and Supplementary Materials.

Acknowledgments

The authors would like to thank the researchers, Ziyang Ye, Xin Wei, Zecheng Wang, and Dongwei Li for their discussions during the development process of this study. The authors are very thankful to Dongwei Li for the financial support.

Conflicts of Interest

The authors declare no conflicts of interest.

References

  1. Ma, R. Development status and future tr-end of assembly building. Constr. Technol. 2021, 50, 64–68, (In Chinese and English). [Google Scholar]
  2. Wang, L.; Ji, Y.; Li, D. Research on Material Quality Risk Management Based on Machine Learning for Prefabricated Civil Buildings. For. Chem. Rev. 2022, 1858–1871. [Google Scholar]
  3. Qu, F.; Chen, C.; Yan, W. Quality risk evaluation of prefabricated components for assembled buildings based on ANP-FUZZY. J. Civ. Eng. Manag. 2019, 36, 92–98. [Google Scholar]
  4. Zhang, B.; Liu, F.; Cha, X. Quality risk evaluation of assembled buildings—based on ISM-ANP gray clustering model. Constr. Econ. 2023, 44, 101–107. [Google Scholar]
  5. Deng, H.; Liu, J. Research on PC Component Quality Risk Evaluation Based on Intuitionistic Fuzzy Analytic Hierarchy Process. IOP Conf. Ser. Earth Environ. Sci. 2020, 525, 012043. [Google Scholar] [CrossRef]
  6. Li, X.J. Research on investment risk influence factors of prefabricated building projects. J. Civ. Eng. Manag. 2020, 26, 599–613. [Google Scholar] [CrossRef]
  7. Yi, Z.; Lai, S.; Li, X.; Dai, E.; Sun, H. Quality and safety risk assessment of assembled buildings based on multilevel topology. J. Wuhan Eng. Univ. 2020, 42, 669–673+705. [Google Scholar]
  8. Dai, Y.; An, Q.; Li, D.; Pei, F.; Zhou, J.; Jiao, B.; Lin, N. Risk evaluation of potential defects in basement waterproofing project quality based on game theory-cloud model. J. Civ. Eng. Manag. 2024, 41, 82–88. [Google Scholar]
  9. Tang, Y.; Huang, B.; Li, W.; Guan, M. Neural network-based risk evaluation of drain breakage-induced subsidence. People’s Yangtze River 2024, 55, 133–138. [Google Scholar]
  10. Ma, T.; Lin, Y.; Zhou, X.; Zhang, M. Grading evaluation of goaf stability based on entropy and normal cloud model. Adv. Civ. Eng. 2022, 2022, 9600909. [Google Scholar] [CrossRef]
  11. Guo, J.; Gu, C.; He, J. Risk evaluation of embankment project based on combined empowerment two-dimensional cloud model. Adv. Water Conserv. Hydropower Sci. Technol. 2022, 42, 117–122. [Google Scholar]
  12. Xie, B.; Liu, Y.; Cui, L. Early warning of construction risk of high-altitude railroad tunnel based on improved game theory-two-dimensional cloud model. Railw. Stand. Des. 2025, 1–10. [Google Scholar]
  13. Cheng, L.; Xu, Y.; Jing, G. Risk analysis of deep coal mine roof accidents based on combined-assigned three-dimensional cloud assessment technology. J. Saf. Environ. 2024, 24, 413–422. [Google Scholar]
  14. Sun, Y.; Yang, H.; Gao, X.; Yang, Y.; Sun, W. Research on quality influencing factors in the whole process of assembled building. Constr. Econ. 2023, 44, 21–29. [Google Scholar]
  15. Sun, Y.; Wu, X.; He, M.; Cong, X. Research on the whole process quality management of assembly building based on BIM+IoT technology. Constr. Econ. 2021, 42, 58–61. [Google Scholar]
  16. Shi, Z.; Liu, D.; Ji, F.; Feng, C. Construction risk assessment of super-large sinkhole foundation. J. Southwest Jiaotong Univ. 2021, 56, 1241–1249. [Google Scholar]
  17. Ataei, Y.; Mahmoudi, A.; Feylizadeh, M.R.; Li, D.F. Ordinal Priority Approach (OPA) in Multiple Attribute Decision-Making. Appl. Soft Comput. J. 2020, 86, 105893. [Google Scholar] [CrossRef]
  18. Xiang, S.; Cai, Z.; Liu, P.; Li, L. Fuzzy comprehensive evaluation of low-carbon operation of distribution networks based on AHP-inverse entropy weight method. J. Electr. Power Sci. Technol. 2019, 34, 69–76. [Google Scholar]
  19. Huang, Y.; Xu, S.; Jiang, M.; Li, W. A game-theoretic combinatorial empowerment-based navigation safety evaluation of waterways. J. Saf. Environ. 2021, 21, 2430–2437. [Google Scholar]
  20. Yang, Y.; Zhao, Y. Safety risk evaluation of assembly building component lifting construction based on combined empowerment two-dimensional cloud model. J. Nat. Hazards 2022, 31, 167–174. [Google Scholar]
Figure 1. Risk indicator screening flowchart.
Applsci 15 03417 g001
Figure 2. Quality risk evaluation model for the whole process of assembled building.
Applsci 15 03417 g002
Figure 3. Principle of the cloud generator.
Applsci 15 03417 g003
Figure 4. Three-dimensional cloud droplet cluster of the standard cloud.
Applsci 15 03417 g004
Figure 5. Three-dimensional cloud droplet cluster of the first-level indictor evaluation cloud.
Applsci 15 03417 g005
Figure 6. Three-dimensional cloud droplet cluster of the integrated evaluation cloud.
Applsci 15 03417 g006
Figure 7. Comparison of three-dimensional cloud droplet clusters of the evaluation cloud for the first-level indicators and the standard cloud.
Applsci 15 03417 g007
Figure 8. Comparison of three-dimensional cloud droplet clusters for the evaluation cloud of integrated metrics and the standard cloud.
Applsci 15 03417 g008
Figure 9. Comparison of tier 1 indicator evaluation cloud and risk rating criteria cloud.
Applsci 15 03417 g009
Figure 10. Comparison of composite indicator evaluation cloud and risk rating criteria cloud.
Applsci 15 03417 g010
Table 1. Quality risk evaluation indicators of the whole process of prefabricated buildings.
Target LayerGuideline Layer
(Level 1 Indicators)
Indicator Layer
(Level 2 Indicators)
Meaning of the Indicator
Quality Risks throughout the Assembly Building ProcessDecision-making design phase U1Deviation rates for key design parameters U11Excessive discrepancies between prefabricated component design parameters and actual requirements
Number of design team experience on relevant projects U12Insufficient experience gained by the design team in similar projects in the field of assembled buildings
Number of design changes in prefabricated components U13Frequent changes and adjustments to the precast program
Construction rework rate after meetings and handovers U14Inadequate review and communication of drawings and technical requirements
Bidding and procurement phase U2Number of enterprises participating in the tender U21Insufficient number of firms participating in the bidding, which may result in insufficient competition for bids
Scoring of suppliers’ and contractors’ qualifications U22Poor qualifications and credibility of suppliers and contractors do not guarantee the quality of projects
Acceptance rate of purchased materials U23Procurement and acceptance not in accordance with specifications
Production and transportation phase U3Immature technical specifications for component production U31Inadequate production technical specifications and reduced production efficiency
Raw material quality and supply chain stability U32Delayed delivery of materials or components in the supply chain chain
Production equipment failure rate and utilization rate U33Frequent malfunctions in the use of production equipment
Average years of experience of production staff U34Insufficient relevant skills and experience of production personnel, affecting the accuracy of operations
Number of production meetings and time for
communication and feedback U35
Poor communication in the production chain, problems occur without timely feedback and resolution
Transportation damage rate U36Inadequate transportation planning resulting in damage to components during transportation
Compliance rate of stacking protection and handling measures U37Inadequate protection of components during stacking and handling, resulting in damage prior to assembly
On-site assembly construction phase U4Construction personnel training pass rate U41Low level of skills and training of construction personnel
Assembly construction technology implementation
compliance rate U42
Non-compliance with technical specifications during construction, or imperfect technical standards
Unreasonable site plan U43Lack of scientific and systematic organization and planning of the construction site
Acceptance pass rate U44Unstandardized construction quality inspection and acceptance
Operation and maintenance phase U5Frequency of monitoring of facilities and maintenance of equipment U51Inadequate routine monitoring and periodic overhaul of project follow-up
Troubleshooting capabilities of maintenance staff U52Inadequate ability of maintenance staff to resolve equipment or facility malfunctions
Table 2. Standard cloud risk assessment level numerical characteristics.
RatingGrade DescriptionProbability Level DescriptionConsequence Level DescriptionConcealment Level DescriptionScore RangeStandard Cloud Digital Features
IRisks are negligibleHardly everMinor hazardsEasily recognized[0, 3)(1.5, 0.5, 0.05)
IIRisks are acceptableLess likelyLesser hazardsEasier recognized[3, 6)(4.5, 0.5, 0.05)
IIIAcceptable after risk repairGreater probability of occurrenceGreater hazardsHarder to recognize[6, 8)(7, 0.33, 0.033)
IVRisks are unacceptable and must be rectifiedHigh probability occurrenceDreadful hazardsExtremely difficult to recognize[8, 10](9, 0.33, 0.033)
Table 3. Summary of weights of indicators at all levels.
Level 1 IndicatorsSubjective WeightingObjective WeightingCombined WeightingLevel 2 IndicatorsSubjective WeightingObjective WeightingCombined Weighting
U10.2030.2010.203U110.2820.2510.279
U120.2200.2400.222
U130.2440.2630.246
U140.2540.2460.253
U20.2080.1910.204U210.3010.3070.302
U220.3260.3490.328
U230.3730.3440.370
U30.2100.2250.213U310.1790.1310.174
U320.2070.1530.202
U330.0810.1340.086
U340.0930.1600.100
U350.1670.1500.164
U360.1360.1190.134
U370.1380.1550.140
U40.2150.1960.211U410.2520.2390.251
U420.2440.2360.243
U430.2210.2470.224
U440.2830.2780.282
U50.1640.1870.169U510.5040.4860.502
U520.4960.5140.498
Table 4. Scores of basic variables of secondary indicator.
Industry Expertx1x2x3x4x5x6x7x8x9x10
Risk Indicators
U115.5/5.4/3.44.3/5.5/4.04.3/5.4/3.45.8/5.8/4.14.7/5.5/3.34.8/4.9/3.55.6/5.2/3.45.9/5.7/3.05.0/5.0/4.44.1/6.0/4.5
U123.4/4.5/4.94.2/4.5/4.22.9/2.9/4.04.4/4.6/5.02.3/3.5/3.72.6/3.4/3.93.2/4.3/5.74.0/2.9/3.84.0/4.0/5.82.3/3.3/5.7
U136.8/7.5/7.05.8/7.1/6.26.1/5.8/6.67.1/5.2/7.06.0/7.5/6.75.9/6.0/5.35.8/5.6/6.37.2/5.5/5.56.5/7.5/6.37.3/7.3/8.2
U144.9/3.3/4.54.2/5.0/4.05.0/4.5/5.03.0/3.2/4.33.0/3.8/3.63.8/3.8/3.83.0/3.0/4.33.4/5.4/3.85.1/4.9/5.54.0/4.0/4.0
U214.0/5.0/4.85.1/4.5/3.95.1/5.2/4.53.4/4.8/4.63.3/4.8/4.63.3/5.0/4.04.3/5.1/4.25.0/5.2/4.44.5/5.0/4.24.0/5.5/4.0
U225.4/5.5/6.53.9/6.5/6.73.4/3.5/6.03.9/3.9/7.13.6/3.6/6.53.3/3.8/6.33.3/3.9/7.65.2/5.0/6.05.1/4.8/6.05.2/4.4/5.5
U234.9/5.5/4.03.3/5.0/2.34.9/4.0/3.42.9/4.5/2.73.2/3.9/4.33.3/3.7/2.83.0/3.9/3.04.8/5.2/4.25.0/5.2/4.13.4/4.5/2.5
U315.8/6.4/4.86.0/6.3/3.25.3/4.5/5.34.0/4.8/3.54.2/4.4/3.84.9/4.7/4.54.0/5.6/4.45.0/5.2/3.55.5/5.5/5.06.0/4.7/4.1
U327.4/8.0/7.67.2/7.5/8.07.0/6.7/7.06.7/6.8/6.96.5/6.5/6.97.6/7.0/7.57.3/6.5/7.86.9/8.6/7.27.0/7.5/7.48.0/7.8/7.5
U334.5/5.0/6.52.9/5.3/6.33.6/3.9/6.92.9/4.0/6.53.0/4.5/5.83.2/3.7/6.73.0/3.5/6.84.0/5.5/6.43.5/5.8/6.84.0/5.4/7.0
U344.0/5.1/4.64.4/5.5/4.32.5/4.1/3.93.5/3.3/4.43.5/4.4/3.53.1/3.4/4.53.3/4.7/4.33.8/5.4/4.54.2/6.0/5.04.4/6.2/4.0
U354.8/4.5/6.53.3/2.9/6.54.5/5.7/4.53.0/3.4/5.03.5/3.3/6.03.3/4.0/6.03.2/4.1/6.44.5/5.6/6.45.5/5.0/5.45.3/3.8/5.1
U363.5/5.4/3.13.8/5.2/3.84.2/4.3/4.03.2/3.8/2.72.9/4.0/2.22.2/3.9/1.72.9/3.1/2.52.5/4/2.23.7/5.0/3.53.0/6.0/2.5
U376.4/7.1/3.96.5/6.4/2.76.5/5.5/3.67.0/6.4/2.66.7/6.1/2.47.6/7.5/2.26.9/5.7/2.26.5/6.8/3.06.5/7.0/4.46.2/7.0/3.6
U412.8/6.0/4.54.4/5.1/2.72.1/4.5/2.52.2/5.0/2.52.2/4.8/2.82.8/4.3/3.22.9/4.2/3.93.8/5.0/4.14.4/5.5/4.53.5/4.0/4.5
U423.7/4.5/3.54.1/4.6/3.52.1/5.6/3.32.8/3.9/3.12.5/3.9/3.52.4/3.8/3.21.9/3.4/3.04.5/6.0/4.43.8/6.0/4.54.0/5.3/5.0
U434.7/4.5/4.64.5/5.0/3.13.2/4.8/3.34.1/4.2/3.53.1/4.2/4.03.8/3.5/3.63.1/4.2/3.14.0/4.8/4.04.5/5.0/4.05.3/3.2/4.3
U443.6/5.8/4.72.5/4.9/2.34.2/4.0/3.52.7/3.5/1.53.2/4.0/2.53.0/4.0/2.62.5/5.3/4.53.0/5.2/4.23.5/5.0/5.03.5/4.8/3.0
U512.3/5.2/4.02.5/3.8/3.72.7/3.7/3.11.8/3.0/2.92.0/3.5/3.32.5/2.8/2.72.1/5.4/3.23.0/4.5/4.02.7/4.4/3.82.0/4.6/2.8
U523.5/4.4/2.92.2/3.5/2.82.2/3.8/2.12.6/3.9/2.02.4/3.5/3.42.2/3.5/2.52.0/5.5/3.04.0/5.8/3.03.5/4.4/3.83.4/5.5/3.5
Table 5. Digital characteristics of the risk cloud of the evaluation indicators at all levels.
Composite IndicatorsProbability ResultCovertLevel 1 IndicatorsProbabilityResultCovertLevel 2 IndicatorsProbabilityResultCovert
Quality risks throughout the assembly building process U(4.00, 0.76, 0.26)(4.83, 0.78, 0.22)(4.25, 0.67, 0.24)U1(4.72, 0.77, 0.25)(4.99, 0.74, 0.30)(4.75, 0.68, 0.29)U11(5.00, 0.70, 0.22)(5.44, 0.33, 0.11)(3.7, 0.55, 0.21)
U12(3.33, 0.84, 0.28)(3.79, 0.74, 0.31)(4.67, 0.94, 0.40)
U13(6.45, 0.66, 0.27)(6.50, 1.10, 0.55)(6.51, 0.74, 0.35)
U14(3.94, 0.88.0.24)(4.09, 0.86, 0.25)(4.28, 0.55, 0.21)
U2(4.09, 0.94, 0.40)(4.67, 0.64, 0.14)(4.64, 0.60, 0.23)U21(4.20, 0.75, 0.21)(5.01, 0.24, 0.13)(4.32, 0.33, 0.12)
U22(4.23, 1.00, 0.46)(4.49, 0.96, 0.06)(6.42, 0.58, 0.20)
U23(3.87, 1.03, 0.51)(4.54, 0.69, 0.22)(3.33, 0.84, 0.34)
U3(5.03, 0.64, 0.18)(5.47, 0.84, 0.22)(4.97, 0.62, 0.19)U31(5.07, 0.81, 0.21)(5.21, 0.74, 0.17)(4.21, 0.74, 0.22)
U32(7.16, 0.43, 0.11)(7.29, 0.74, 0.22)(7.38, 0.38, 0.06)
U33(3.46, 0.58, 0.14)(4.66, 0.93, 0.39)(6.57, 0.34, 0.10)
U34(3.67, 0.61, 0.06)(4.81, 1.04, 0.24)(4.30, 0.38, 0.18)
U35(4.09, 1.04, 0.46)(4.23, 0.97, 0.16)(5.78, 0.78, 0.29)
U36(3.19, 0.61, 0.04)(4.47, 0.93, 0.28)(2.82, 0.78, 0.20)
U37(6.68, 0.37, 0.15)(6.55, 0.66, 0.16)(3.06, 0.82, 0.27)
U4(3.35, 0.80, 0.22(4.64, 0.75, 0.22)(3.58, 0.89, 0.31)U41(3.11, 0.92, 0.28)(4.84, 0.60, 0.12)(3.52, 0.98, 0.46)
U42(3.18, 1.05, 0.48)(4.70, 1.03, 0.35)(3.70, 0.70, 0.16)
U43(4.03, 0.74, 0.08)(4.34, 0.60, 0.12)(3.75, 0.54, 0.17)
U44(3.17, 0.54, 0.05)(4.65, 0.78, 0.26)(3.38, 1.25, 0.42)
U5(2.58, 0.60, 0.23)(4.23, 0.92, 0.23)(3.13, 0.54, 0.19)U51(2.36, 0.40, 0.12)(4.09, 0.91, 0.26)(3.35, 0.53, 0.19)
U52(2.80, 0.80, 0.35)(4.38, 0.93, 0.19)(2.90, 0.55, 0.19)
Table 6. Proximity of evaluation indicators and risk levels.
Risk ClassIIIIIIIVLevel of Affiliation
Evaluation Indicators
U0.200 1.559 0.217 0.124 II
U10.1741.6790.2650.138II
U20.1942.1430.2270.127II
U30.1580.8330.3110.150II
U40.2380.6750.1810.112II
U50.2980.4210.1540.101II
U110.1750.7510.2400.133II
U120.2320.7250.1850.113II
U130.1160.2911.1230.230III
U140.2211.3730.1990.118II
U210.1901.6170.2300.128II
U220.1570.5160.2640.142II
U230.2340.7520.1850.113II
U310.1721.0470.2610.138II
U320.1000.2081.9840.335III
U330.1590.4310.2340.134II
U340.2061.1010.2080.121II
U350.1750.7290.2380.132II
U360.2730.4690.1610.104II
U370.1350.3010.2510.146II
U410.2370.5770.1770.110II
U420.2360.6430.1800.111II
U430.2261.1120.1940.116II
U440.2480.5730.1730.109II
U510.3030.4060.1520.100II
U520.2890.4280.1560.102II
Table 7. Two-dimensional cloud modeling to evaluate indicator proximity and risk levels.
Risk ClassIIIIIIIVLevel of Affiliation
Evaluation Indicators
U0.240 1.688 0.270 0.154 II
U10.211 1.856 0.329 0.171 II
U20.245 2.251 0.268 0.153 II
U30.188 0.906 0.401 0.188 II
U40.274 0.863 0.230 0.140 II
U50.340 0.516 0.192 0.125 II
U110.190 0.939 0.394 0.187 II
U120.341 0.731 0.205 0.130 II
U130.142 0.358 1.345 0.280 III
U140.281 1.441 0.237 0.142 II
U210.226 1.690 0.291 0.160 II
U220.247 3.701 0.268 0.152 II
U230.259 1.584 0.251 0.147 II
U310.194 1.098 0.380 0.183 II
U320.124 0.259 3.019 0.398 III
U330.269 0.950 0.236 0.142 II
U340.253 1.129 0.251 0.147 II
U350.266 2.037 0.249 0.146 II
U360.293 0.763 0.219 0.136 II
U370.138 0.334 1.811 0.296 III
U410.270 0.699 0.225 0.139 II
U420.277 0.749 0.224 0.138 II
U430.263 2.014 0.251 0.147 II
U440.280 0.747 0.223 0.137 II
U510.459 0.366 0.183 0.121 I
U520.316 0.587 0.202 0.129 II
Table 8. Comparison of the cloud model risk evaluation results.
Evaluation MethodologyUDecision-Making Design Phase U1Bidding and Procurement Phase U2Production and Transportation Phase U3On-Site Assembly Construction Phase U4Operation and Maintenance Phase U5
2D cloud modelIIIIIIIIIIII
3D cloud modelIIIIIIIIIIII
U11U12U13U14U21U22U23U31U32U33U34U35U36U37U41U42U43U44U51U52
2D cloud modelIIIIIIIIIIIIIIIIIIIIIIIIIIIIIIIIIIIIIIIIII
3D cloud modelIIIIIIIIIIIIIIIIIIIIIIIIIIIIIIIIIIIIIIIIII
Disclaimer/Publisher’s Note: The statements, opinions and data contained in all publications are solely those of the individual author(s) and contributor(s) and not of MDPI and/or the editor(s). MDPI and/or the editor(s) disclaim responsibility for any injury to people or property resulting from any ideas, methods, instructions or products referred to in the content.

