Abstract
The thermal parameters of polybutyl methacrylate–siloxane (PBMA–siloxane) coatings annealed at different temperatures were investigated by means of nondestructive techniques such as Photothermal Radiometry in the frequency domain and frequency-scan photothermal beam deflection spectrometry. The experimental PTR data were interpreted with the use of a model in which the PTR signal is collected from the whole coating’s thickness. A comparison of the results obtained using PTR and BDS methods is presented and discussed.
1. Introduction
Corrosion is the process of the irreversible surface disintegration of metals or their alloys caused by their interaction with an aggressive environment. Common types of corrosion include rusting, which occurs when iron or steel is exposed to moisture and oxygen, and pitting corrosion, which creates small holes in the metal surface. Preventative actions can be taken to protect materials against corrosion, e.g., applying protective coatings or using corrosion-resistant materials. The corrosion resistance of a material determines its operational lifetime; thus, considerable efforts are made to develop new classes of anti-corrosion layers, including organic–inorganic compounds, to improve material protection against the detrimental effects of the external environment []. Siloxane–polyacrylic-based coatings, Si-PxMA (where x is the type of acrylic monomer: M = methyl, E = ethyl, B = butyl, etc.), were found to be promising as coatings that provide high corrosion resistance for metals and their alloys while also ensuring good adhesion to the surface [,]. These properties make such a coating an effective barrier that prevents corrosive species from penetrating the material. The anti-corrosion properties can be improved by modifying the composition of the basic hybrid material [] or by decreasing the length of the alkyl chain in the siloxane–polyacrylic sol–gel structure [], which enhances its reliability and durability when applied in devices working in aqueous media. It has been found that Si-PxMA coatings with short alkyl chains, such as ethyl- and butyl-, have relatively good anti-corrosion properties, whereas Si-PxMA coatings with longer alkyl chains present rather poor corrosion properties [,]. The goal of our study is to use the Photothermal Radiometry [,] and Beam Deflection Spectroscopy [,,] methods for the thermal characterization of Si-PBMA coatings and make a comparison of the advantages and disadvantages of these methods in the investigation of the discussed layers. Photothermal Radiometry is a powerful tool for material characterization and defect detection, offering nondestructive evaluation capabilities across various fields. This method involves the pulsed illumination of a sample with monochromatic radiation and the detection of the consequent thermal radiation emitted by the sample [,,]. PTR provides nondestructive, non-contact, reliable, and fast coating characterization with high in-plane and through-plane resolution. It has been applied to determine a coating’s thickness, adhesion strength, hardness depth and profile, residual stress, etc. [,]. The PTR method is well known for its applications in the investigation of the parameters of semiconductor materials [,,,,,,]. Photothermal beam deflection spectrometry is a non-contact technique for advanced material characterization that provides information about the thermal and related properties of materials [,]. It is based on periodic sample illumination and generates temperature oscillations in the sample itself and further in its surroundings by converting the absorbed energy into heat through different radiationless de-excitation processes that occur in the illuminated material. As a result, the refractive index changes, and its gradient is induced in the fluid layer over the sample’s illuminated surface, which is sensed by the probe laser beam, causing its deflection and phase change [,,]. Beam deflection spectrometry provides the highly sensitive and accurate detection of subtle changes in material properties, including porous [], amorphous [], and bulk [] materials. It is also applicable to thin films, layered structures, and nanomaterials []. The potential of beam deflection spectrometry has even been used in pharmaceutical applications []. In the current work, both techniques were used for the determination of the thermal properties, such as the thermal diffusivity, conductivity, and effusivity, of Si-PBMA coatings, which allows for better material selection and design in thermal management solutions, as well as for the determination of changes in their thermal properties after annealing in the temperature range from 25 °C to 180 °C during the synthesis process. We discuss the possibility of the application of the PTR and BDS methods for the characterization of PBMA–siloxane coatings from the point of view of the precise determination of the thermal parameters of the investigated layers, such as the thermal conductivity, thermal diffusivity, and thermal effusivity.
This work had three main goals: the determination of the thermal parameters of anti-corrosion layers, the investigation of the changes in these parameters as a function of changes in the annealing temperature (the values of thermal diffusivity and thermal conductivity provide information about the structural quality of the layers; the better their quality, the higher the values of these thermal parameters), and the comparison of the thermal parameter values obtained using two different methods (PTR and BDS).
2. Sample Preparation
The ~3.3 μm thick polybutyl methacrylate–siloxane-(Si-PBMA) coating was deposited on a steel support (KovinTrade, Celje, Slovenia) []. The coating was obtained using 3-(trimethoxysilyl)propyl methacrylate (98.0%, Sigma-Aldrich, St. Louis, MO, USA), butyl methacrylate (99.0%, Alfa Aesar, Kandel, Germany), H2O, and ethanol (absolute, Merck, Darmstadt, Germany) in a molar ratio of 1:8:10.5:0.08:5 in the solvent tetrahydrofuran (99.9%, Sigma Aldrich, St. Louis, MO, USA) and warmed to 70 °C for 4 h during the process of coating polymerization []. The sol was then mixed with tetraethyl orthosilicate (99.0%, Sigma-Aldrich, St. Louis, MO, USA), ethanol (absolute, Merck, Darmstadt, Germany), and acidified water (pH = 1). The resulting solution was stirred for 1 h, deposited on a support using a dip-coater (Bungard, RDC15), and annealed at a rate of 2.5 °C/min up to 25, 90, 120, 150, and 180 °C.
The SEM images of the investigated samples were recorded using a scanning electronic microscope (JSM 7001, JEOL). The measurements were performed under a pressure of 50 Pa and operating conditions of 15 kV, 8–10 nA, and an emitted beam of 1 μm in diameter. To avoid charging the sample during measurements, it was coated with 5 nm of Au/Pd layer. The SEM image of the Si-PBMA sample is presented in Figure 1.
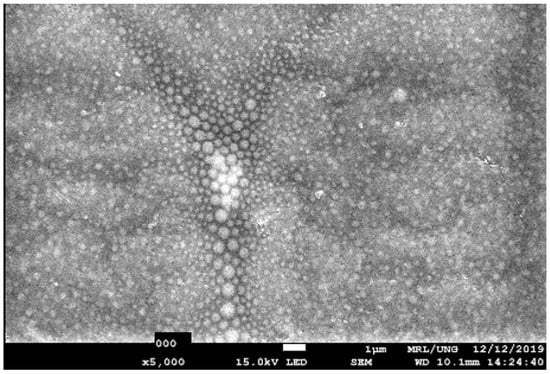
Figure 1.
The SEM image (5000×) of the Si-PBMA sample.
It is seen from Figure 1 that the sample is characterized by a rather compact structure without visible cracks or pores, which should positively influence its thermal properties.
3. Experimental Methods
The thermal parameters of the annealed coatings were obtained using the Modulated Photothermal Radiometry and BDS methods. PTR measurements of the Si-PBMA coatings were performed using the experimental setup illustrated in Figure 2.
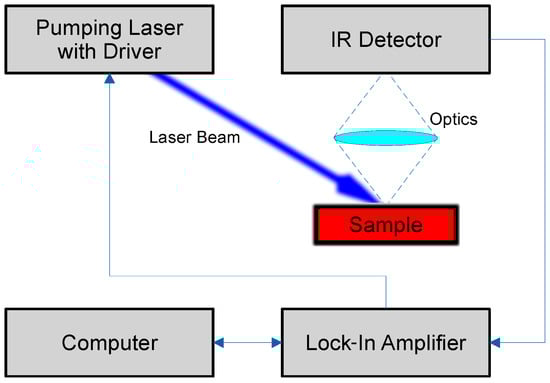
Figure 2.
The simplified schematic block diagram of the experimental setup employed for the PTR measurements.
For a pumping laser beam of light, an Omicron LuxX driver with a laser diode with an optical output power of 300 mW and a wavelength of 405 nm was applied. The intensity of this beam of light was modulated by a lock-in amplifier (Stanford Research S865A).
As a result of the absorption of this beam of light, periodical thermal waves were generated in the sample. This process resulted in infrared radiation from the sample, which was detected as a PTR signal by a cooled electrical photovoltaic detector (PVI-3TE-5, 0.5 mm × 0.5 mm, VIGO System S.A., Ożarów Mazowiecki, Poland) equipped with a BaF2 lens with a focal length of 25 mm. The maximum spectral sensitivity of this detector was at 5 µm. The PTR signal was measured with the S865A Stanford Research amplifier. The measurements were computer-controlled and performed at room temperature.
The BDS analysis was carried out using the conventional setup presented in Figure 3.
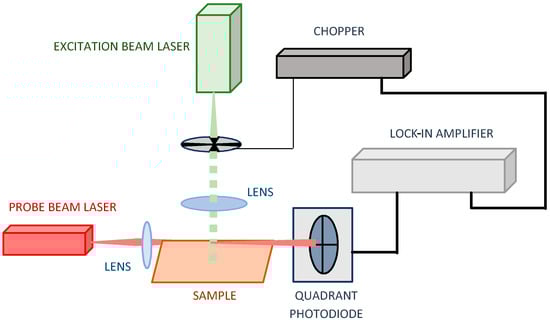
Figure 3.
The BDS experimental setup.
The source of the excitation beam was a solid-state laser (532 nm, 30 mW) (GoPhotonics, BWI-532-10-E/66966, New Delhi, India). The excitation beam was intensity-modulated at 3–30 Hz by a variable-speed mechanical chopper (Scientific Instruments 300CD, 300C and 300H model). The source of the probe beam was a Helium–Neon laser (633 nm, 3 mW) (Uniphase, Model 1103P, St. Charles, MI, USA). The probe beam (PB) and the excitation beam (EB) were formed properly using bi-convex, AR-coated lenses (350–700 nm, Edmund Optics). The excitation beam was formed by a lens with a 100 mm focal length to be defocused to a spot size of around 2 mm2 on the sample surface, which determines the spatial resolution of the BDS imaging. The probe beam was focused by a lens of 40 mm to form a probe beam waist over the examined sample, which ensures a 1D experimental configuration (PB size << EB size in the area of TOs) []. The probe beam intensity change was detected by QPD (RBM–R. Braumann GmbH, Model C30846E, Attenkirchen, Germany) with the interference filter in front of it (CWL 633 nm, Edmund Optics). The BDS signal was measured by a lock-in amplifier (Stanford Research instruments, Model SR830 DSP). The 3D movement of the sample was made possible by the translation stage (CVI, Model 2480M/2488, Albuquerque, NM, USA) due to the geometrical configuration of the system being optimized.
4. Theoretical Considerations
4.1. PTR Method
The Modulated Photothermal Radiometry basics are presented in detail in the literature [,]. This method involves the illumination of the sample by an intensity-modulated beam of laser light. When the material is illuminated by a light beam, it absorbs energy, and its temperature increases. The temperature of the material is directly related to its thermal and optical properties, such as thermal conductivity, diffusivity, capacity, and optical absorption. As a result of the optical absorption of this light, periodical temperature waves arise in the sample, too. By measuring the thermal emission from the material using a sensitive detector, information about its internal structure, composition, and properties can be obtained. A simplified schematic of the investigated samples consisting of two layers, i.e., the PBMA–siloxane coating deposited on the substrate, is presented in Figure 4.
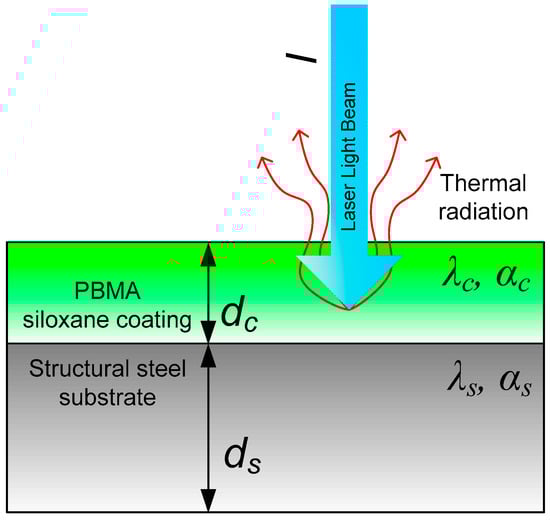
Figure 4.
Schematic cross-section of the investigated two-layer sample.
In our previous studies, we dealt with sol–gel coatings that were covered with a thin layer of gold [,]. The presence of this layer resulted from the preparation of samples for SEM studies. Since this layer also played the role of an absorber, the PTR signal was proportional to the temperature of the surface, and the following model (Equation (1)) for the PTR signal could be used:
where I—intensity of the laser beam; dc and ds—thickness of the coating and the substrate, respectively; λc and λs—coating and substrate thermal conductivities, respectively; αc and αs—coating and substrate thermal diffusivities; and Rcs—thermal reflection coefficient between the coating and the substrate. It is described by Equation (2):
In Equation (2), bcs = ec/es, where ec and es are the thermal effusivities of the coating and the substrate, respectively. The complex thermal wave number σi (subscript i can be s or c, which refers to the coating and the substrate, respectively) is described by Equation (3):
where ω is the angular modulation frequency.
In the case of PBMA samples, the coating was optically transparent to the beam of light. The illuminating light was absorbed in the steel substrate, which was optically opaque and thermally thick.
Therefore, the model presented above was found to be insufficient to reproduce the PTR characteristics measured for PBMA samples. An extended model was proposed that assumes that the PTR signal comes from the full thickness of the coating.
In this case, as described by Equation (4), the PTR signal is proportional to the definite integral of the spatial temperature distribution T(x) with respect to the spatial variable x in the interval [0, dc], i.e., over the thickness of the layer.
The integrand of the integral is the spatial temperature distribution T(x) of the periodical component of the temperature in the coating. The model assumes that the light was absorbed by the metal substrate, as the coating was optically transparent. The resulting thermal wave in the metal substrate was then transmitted to the coating and propagated, reflecting multiple times at the air–coating and metal–coating interfaces. As a result, a spatial temperature distribution T(x) arose in the coating. It was then the source of IR radiation. The mathematical formula for T(x) was derived using the thermal wave interference method.
Significant differences in the characteristics of the PTR signals in these two models, described by Equations (1) and (4), can be observed in Figure 5, where the comparison of the two models is presented. The values of parameters taken for the simulation calculations were as follows: dc = 10·10−4 cm, αc = 10.0 × 10⁻³ cm2/s, λc = 10.0 × 10⁻³ W/cm·K, αs = 0.125 cm2/s, and λs = 0.45 W/cm·K. The values of the thermal diffusivity and thermal conductivity of the substrate (αs and λs) taken for the simulation correspond to the actual values of these parameters of the structural steel substrate on which the coatings, which were the object of research in this work, were deposited.
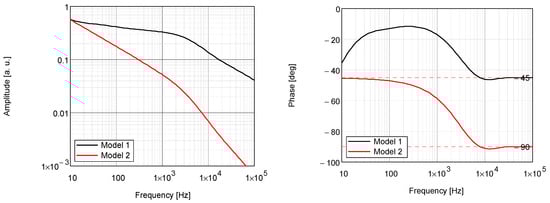
Figure 5.
Theoretical PTR amplitude and phase frequency characteristics calculated in Model 1 and Model 2 of the PTR signal.
Using the proposed model described by Equation (4), calculations of the PTR signal were performed and are presented in Figure 6. The goal of this calculation was to visualize the changes in the PTR amplitude and phase characteristics as a function of simultaneous changes in the values of the thermal diffusivity and thermal conductivity of the coating. The following thermal parameters of the coating were taken for computations: dc = 10·10−4 cm, αc = 10.0 × 10⁻³ cm2/s, and λc = 10.0 × 10⁻³ W/cm·K.
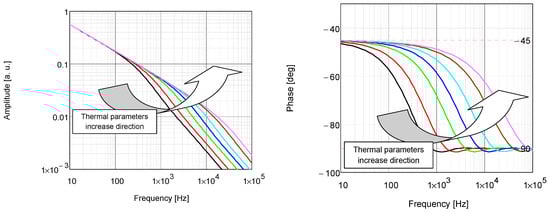
Figure 6.
Theoretical PTR amplitude and phase frequency characteristics calculated for different values of thermal parameters of the coating, αc/n and λc/n, where n is 10, 5, 2, 1, 1/2, 1/5, or 1/10 (solid lines from black to pink).
The simulation investigations show that as thermal diffusivity and thermal conductivity increase, the characteristics shift to higher frequencies. Conversely, when these values decrease, the characteristics shift to lower frequencies. Notably, changes in the thermal parameters have a significantly greater effect on the phase characteristics of the PTR signal than on the amplitude characteristics.
4.2. BDS Method
The temperature oscillations (TOs) υi in layer i of the analyzed sample (Figure 7) were found using the Fourier–Kirchhoff equation [,]:
where qi is the internal heat source power density, and kTi and DTi are thermal conductivity and diffusivity, respectively. The EB incident light is modulated with the frequency f, causing its intensity to vary in the range of 0 to I0. It is then absorbed by the sample, inducing internal heat sources in the sample layer (Figure 7), which are given by [,]
where γi is the optical absorption coefficient of the ith layer, and Li is its thickness.
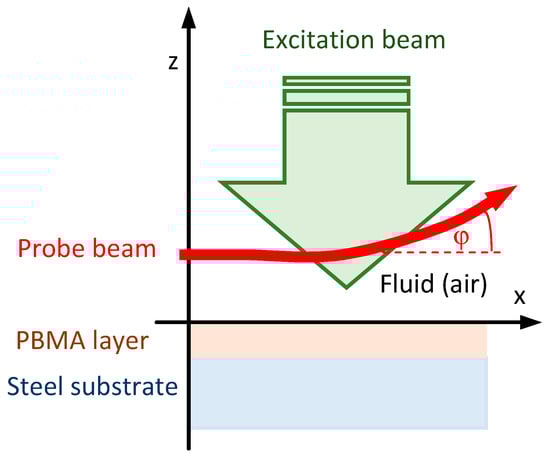
Figure 7.
Scheme of the BDS experimental configuration.
Having determined the temperature distribution (TOs) in the layered structure, a theoretical description of the probe beam (PB) interaction with TOs must be found. In this study, complex geometrical optics equations were applied for that purpose [,]. Furthermore, the PB is treated as a bundle of rays that propagate in a complex space. The PB’s interaction with TOs in the fluid layer above the sample surface causes its trajectory to deviate from the initial direction of propagation (PB deflection) as a consequence of the refractive index gradient in the fluid through which the PB travels, as described by
In Equation (7), n0 refers to the index of refraction (IoR) in the air without TOs, and sT denotes the thermal sensitivity and is described by Equation (8), whereas ξ is the input coordinate of the PB (defined in the input plane of the system), and τ is a running coordinate (complex one) throughout the length of the PB trajectory. In the analysis, the input plane of the PB is defined as the plane z = 0, whereas the PB further propagates along the positive direction of the OX (Figure 7).
The PB trajectory causes an increase in the whole beam divergence, which consequently changes the PB amplitude, which, after the PBt passes through TOs, has the form []
where A0 and E0 (Equation (10)) are the PB amplitude and electric field amplitude at the waist (with a position defined as L0) of the PB not disturbed by TOs, and zR and zRC (Equations (11) and (12)) are Rayleigh’s length and complex Rayleigh’s length, respectively, whereas Δa is the correction to the PB amplitude introduced by the PB’s interaction with TOs []:
Here, DTg describes the air thermal diffusivity; zl and zp denote the distances to the left and right edges of the examined sample, whereas zD is the detector position. The quantities zl, zp, and zD are measured from the input plane of the setup. Furthermore, kTO and k are the wave numbers of the TOs and PB, respectively. The detailed expression describing ΘmR and ΘmI can be found in the literature [].
The change in the PB’s optical path in the gas in which it propagates (introduced by both the PB’s deflection by IoR gradients and a change in the gas IoR) causes variations in the PB phase, expressed as Equation (17) []:
where is the change in the PB phase caused by PB deflection by thermal gradients, whereas is the change in the PB phase introduced by the change in the refractive index of the air in which the PB travels.
At the detector plane (zD), and are written as
where ξD0 = xD1(1 + izD1zRC)−1 is the ray coordinate in the input plane of an experimental system for a given observation point for an undisturbed PB [].
Finally, the PB intensity variations after one pass through TOs at the detector can be written as
where U(xD1, yD1, zD1) is the PB’s electric field distribution, and I0g(xD1, yD1, zD1) is the undisturbed PB intensity that has the form
where xD, yD, and zD are the coordinates of the ray at the detector plane.
The change in the PB intensity introduced by TOs results in a photodeflection (BDS) signal that, for a detection performed by a quadrant photodiode (QP), is in the form
where Kd is the detector constant, k is the PB wave number, z0 is the PB height over the sample surface, ABDS is the change in the PB amplitude caused by deflection, φBDS is the variation in the PB phase resulting from the fluid refractive index change because of TOs and the deflection of the PB by thermal gradients.
5. Experimental Results
5.1. PTR Results
Figure 8 shows the amplitude and phase characteristics of the PTR signal collected for a series of PBMA–siloxane samples annealed at temperatures of 25, 90, 120, 150, and 180 °C.
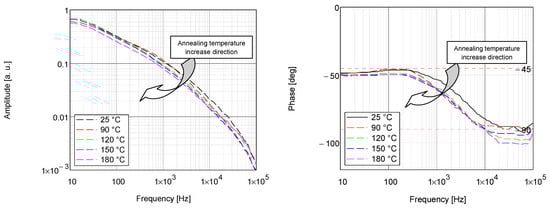
Figure 8.
The experimental amplitude and phase characteristics of the PTR signal obtained for a series of PBMA–siloxane samples annealed at different temperatures.
The next two figures (Figure 9 and Figure 10) present the fits of the theoretical curves to the experimental results for two samples annealed at two extreme temperatures: 25 °C and 180 °C.
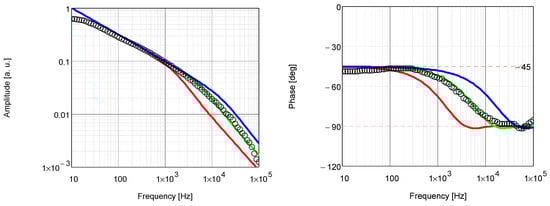
Figure 9.
Theoretical (lines) and experimental (circles) PTR amplitude and phase frequency characteristics. They were obtained for the PBMA–siloxane coating annealed at 25 °C. Characteristics shown with the solid green line were computed for (αc, λc), those with the solid blue line were computed for (3·αc, 3·λc), and those with the solid red line were computed for (αc/3, λc/3).
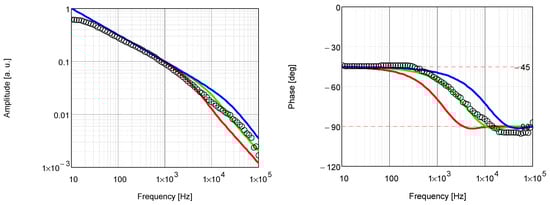
Figure 10.
Theoretical (lines) and experimental (circles) PTR amplitude and phase frequency characteristics. They were obtained for the PBMA–siloxane coating annealed at 180 °C. Characteristics shown with the solid green line were computed for (αc, λc), those with the solid blue line were computed for (3·αc, 3·λc), and those with the solid red line were computed for (αc/3, λc/3).
The best fit of theoretical characteristics to experimental data was obtained for the following values of thermal parameters: αc = 2.524·10−3 cm2/s and λc = 3.02·10−3 W/cm·K.
The best fit of theoretical characteristics to experimental data was obtained for the following values of thermal parameters: αc = 2.785·10−3 cm2/s and λc = 3.489·10−3 W/cm·K.
The obtained thermal parameters of PBMA–siloxane coatings (thermal diffusivity, thermal conductivity, and thermal effusivity) annealed at different temperatures (25, 90, 120, 150, 180 °C) were determined (Table 1) using the least-squares fitting procedure for theoretical dependence, obtained by Equation (4), to the normalized experimental data.

Table 1.
The thermal diffusivity, thermal conductivity, and thermal effusivity values of the investigated coatings obtained at different annealing temperatures using the PTR method.
The fitted parameters were the thermal conductivity λ and the diffusivity α of the PBMA–siloxane coating. The best fit was found when the samples’ thermal parameters were within the relative expanded uncertainty of a 94.45% (±2σ) confidence level (CL) [,]. The thermal effusivity was calculated by Equation (23).
It is seen that all the thermal parameters show a general trend of increasing with the increase in the value of the annealing temperature (Figure 11, Figure 12 and Figure 13).
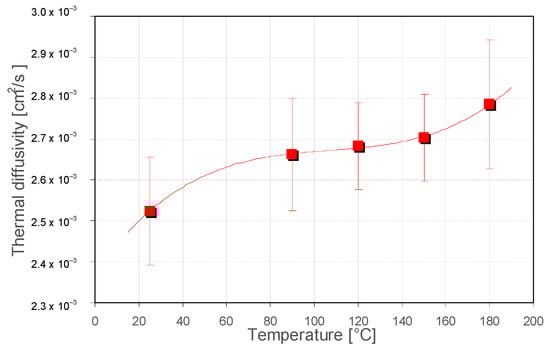
Figure 11.
Values of the determined thermal diffusivities of investigated PBMA–siloxane coatings annealed at different temperatures. The squares are experimental data, and the dashed line is a trend line.
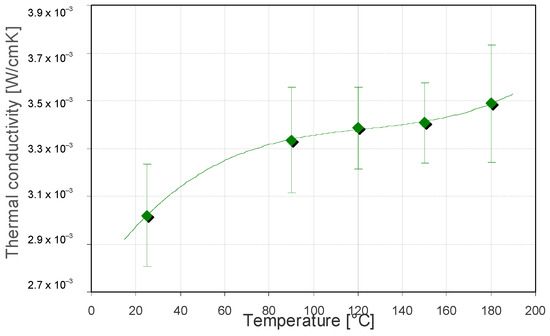
Figure 12.
Values of the determined thermal conductivities of investigated PBMA–siloxane coatings annealed at different temperatures. The diamonds are experimental data, and the dashed line is a trend line.
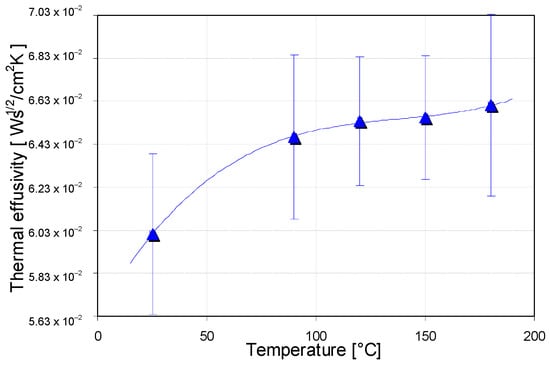
Figure 13.
Values of the determined thermal effusivities of investigated PBMA–siloxane coatings annealed at different temperatures. The triangles are experimental data, and the dashed line is a trend line.
This behavior reflects the changes in material properties that occur as a result of its annealing. The increase in the temperature of the material during sol–gel synthesis causes the breaking of double bonds, thus making the whole material more compact, which also increases its thermal properties []. The increase in annealing temperature from 25 °C to 180 °C results in about a 10% increase in the Si-PBMA coating’s thermal properties, reaching values of 2.785·10−3 cm2·s−1, 3.489·10−3 W·cm−1·K−1, and 6.61·10−2 W· s1/2 cm−2 ·K−1 for thermal diffusivity, conductivity and effusivity, respectively. These results coincide with those obtained in the literature [].
5.2. BDS Results
Each measurement was repeated three times. The obtained values of thermal properties are expressed as the mean value ± its standard deviation (SD). To perform a statistical analysis of the results’ significance, Tukey’s means test (p ≤ 0.05) was used. As a result of the BDS measurements, the signal amplitude and phase characteristics as a function of the EB frequency of modulation were collected (Figure 14).
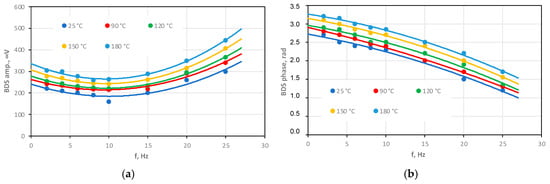
Figure 14.
The amplitude (a) and phase (b) dependence on the modulation frequency of the PBMA sample annealed at different temperatures.
To extract information about the thermal properties (thermal diffusivity, conductivity, and effusivity) of the PBMA layer annealed at different temperatures, the multi-parameter fitting of the theoretical BDS signal dependence (Equation (22)) to the experimental data (Figure 14) was performed. The thermal properties of the aluminum support were taken as the known parameters in the fitting procedure. The obtained results are presented in Table 2.
Table 2.
The thermal diffusivity, thermal conductivity, and thermal effusivity values of the investigated coatings obtained for different annealing temperatures with the use of the BDS method.
With the increase in the annealing temperature values from 25 °C to 180 °C, the thermal diffusivity values changed from 2.52·10−3 cm2·s−1 to 2.78·10−3 cm2·s−1 and from 2.55·10−3 cm2·s−1 to 2.73·10−3 cm2·s−1 with the use of the PTR and BDS methods, respectively. The thermal conductivity values of the same samples changed from 3.02·10−3 W·cm−1·K−1 to 3.48·10−3 W·cm−1·K−1 and from 2.99·10−3 W·cm−1·K−1 to 3.56·10−3 W·cm−1·K−1 with the use of the PTR and BDS methods, respectively. Finally, the thermal effusivity changed from 6.01·10−2 W1/2·cm−2·K−1 to 6.61·10−2 W1/2·cm−2·K−1 and from 5.92·10−2 W1/2·cm−2·K−1 to 6.81·10−2 W1/2·cm−2·K−1 with the use of the PTR and BDS methods, respectively. The thermal diffusivity, thermal conductivity, and thermal effusivity increased by 9% with the increase in annealing temperature.
It can be concluded from the data presented in Table 2 that the higher the coatings’ synthesis temperature, the higher the values of their thermal properties. The reason for this behavior can be explained by the fact that the increase in the curing temperature in the process of sol–gel synthesis causes the breaking of double bonds present in the Si-PBMA material. Because of that, the material becomes more compact without the pores being formed while performing the sol–gel synthesis.
In the next step, the results obtained by BDS were compared with those obtained by PTR (Figure 15, Figure 16 and Figure 17).
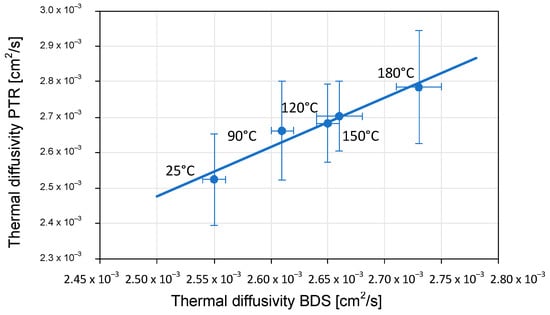
Figure 15.
The relationship between the values of thermal diffusivity determined by the BDS and PTR techniques. The filled circles are experimental data, and the solid line is a linear regression line.
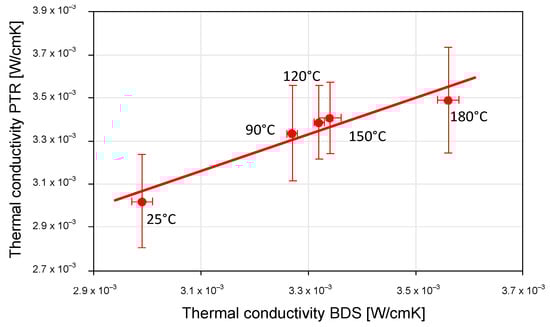
Figure 16.
The relationship between the values of thermal conductivity determined by the BDS and PTR techniques. The filled circles are experimental data, and the solid line is a linear regression line.
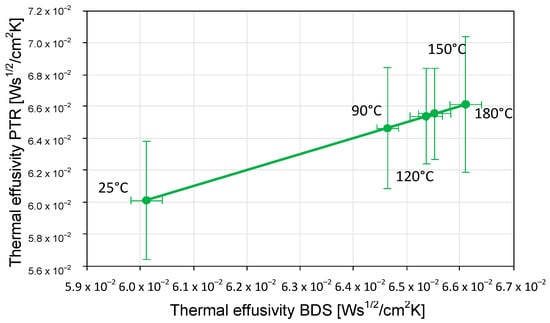
Figure 17.
The relationship between the values of thermal effusivity determined by the BDS and PTR techniques. The filled circles are experimental data, and the solid line is a linear regression line.
To compare the results obtained by the PTR and BDS methods and determine whether significant differences exist between the values of the thermal properties found using the two techniques, the related p-values were calculated at the 95% confidence level []. No significant differences were observed in the determined values of either the thermal conductivity or diffusivity since, in all cases, the p-value was found to be >0.05, which indicates that the difference between compared properties is not considered to be statistically significant.
6. Conclusions
Two different photothermal methods for the determination of the thermal parameters of PBMA coatings were applied, i.e., PTR and BDS. The first goal of the investigation was to determine the set of thermal parameters of the PBMA samples, i.e., thermal diffusivity, thermal conductivity, and thermal effusivity. The second goal of the investigation was to determine the changes in thermal parameters with the change in parameters for annealing the samples. The third goal of the investigation was to check the correlation between the values of the thermal parameters of the samples obtained with these two nondestructive methods. All these goals were achieved and are presented in this paper. Two different thermal models of the PTR signal have been discussed. The appropriate thermal model of the PTR signal of the thin, optically transparent coating on a thick, optically and thermally opaque substrate was established. It was proved that this model can also be applied for further investigation of the thermal parameters of other thin, optically transparent coatings deposited on optically and thermally opaque substrates investigated by the PTR method.
The changes in the thermal parameters of the coating after annealing at various temperatures were examined experimentally. The values of the thermal parameters (thermal conductivity, thermal diffusivity, and thermal effusivity) of a series of corrosion-protective coatings on structural steel were presented. These parameters were extracted using the PTR and BDM methods in the frequency mode. It turned out to be possible to simultaneously determine the thermal diffusivity and thermal conductivity of the coatings. This was accomplished by fitting the theoretical to the experimental amplitude and phase characteristics of the PTR and BDS signals in the frequency domain.
It can be seen that both the thermal diffusivity α and the thermal conductivity λ increased with the increase in the value of the annealing temperature. The thermal diffusivity, thermal conductivity, and thermal effusivity increased by 9% with the increase in annealing temperature. From the obtained results, no significant differences in the obtained values of the thermal properties determined by the two techniques were observed. The results clearly show that both the PTR and BDS methods used are attractive from the point of view of the thermal characterization of thin, optically transparent layers of the PBMA–siloxane coating. The above-described methods are very attractive from the practical point of view due to their nondestructive, non-contact character and low apparatus costs. The extracted thermal parameters provide information about the quality of anti-corrosion coatings.
Author Contributions
Conceptualization, Ł.C.; methodology, Ł.C. and D.K.; software, Ł.C. and S.J.-L.; formal analysis, Ł.C., M.M. and D.K.; investigation, Ł.C. and D.K.; resources, D.K.; data curation, Ł.C. and D.K.; writing—original draft preparation, Ł.C. and D.K.; writing—review and editing, Ł.C., M.M. and D.K.; visualization, Ł.C. and S.J.-L.; supervision, Ł.C. All authors have read and agreed to the published version of the manuscript.
Funding
This research was funded in part by the Slovenian Research and Innovation Agency, grant number P2-0393.
Data Availability Statement
The raw data supporting the conclusions of this article will be made available by the authors on request.
Conflicts of Interest
The authors declare no conflicts of interest.
References
- Stankiewicz, A.; Szczygieł, I.; Szczygieł, B. Self-Healing Coatings in Anti-Corrosion Applications. J. Mater. Sci. 2013, 48, 8041. [Google Scholar]
- Rodič, P.; Katić, J.; Korte, D.; Desimone, P.M.; Franko, M.; Ceré, S.M.; Milošev, I. The Effect of Cerium Ions on the Structure, Porosity and Electrochemical Properties of Si/Zr-Based Hybrid Sol-Gel Coatings Deposited on Aluminum. Metals 2018, 8, 248. [Google Scholar] [CrossRef]
- Rodič, P.; Kapun, B.; Milošev, I. Durable Polyacrylic/Siloxane-Silica Coating for the Protection of Cast AlSi7Mg0.3 Alloy against Corrosion in Chloride Solution. Polymers 2023, 15, 3992. [Google Scholar] [CrossRef]
- Conde, J.J.; Ferreira-Aparicio, P.; Chaparro, A.M. Anti-Corrosion Coating for Metal Surfaces Based on Superhydrophobic Electrosprayed Carbon Layers. Appl. Mater. Today 2018, 13, 100. [Google Scholar]
- Wei, X.X.; Zhang, B.; Wu, B. Enhanced Corrosion Resistance by Engineering Crystallography on Metals. Nat. Commun. 2022, 13, 726. [Google Scholar]
- Hamulić, D.; Rodič, P.; Poberžnik, M.; Jereb, M.; Kovač, J.; Milošev, I. The Effect of the Methyl and Ethyl Group of the Acrylate Precursor in Hybrid Silane Coatings Used for Corrosion Protection of Aluminium Alloy 7075-T6. Coatings 2020, 10, 172. [Google Scholar] [CrossRef]
- Ma, H. First-Principles Modeling of Anisotropic Anodic Dissolution of Metals and Alloys in Corrosive Environments. Acta Mater. 2017, 130, 137–146. [Google Scholar]
- Nordal, P.E.; Kanstad, S.O. Photothermal Radiometry. Phys. Scr. 1979, 20, 659. [Google Scholar]
- Corona, J.; Nirmala, K. Recent Progress in Modulated Photothermal Radiometry. Sensors 2023, 23, 4935. [Google Scholar] [CrossRef]
- Jackson, W.B.; Amer, N.M.; Boccara, A.C.; Fournier, D. Photothermal Deflection Spectroscopy and Detection. Appl. Opt. 1981, 20, 1333–1344. [Google Scholar]
- Boccara, A.C.; Fournier, D.; Badoz, J. Thermo optical Spectroscopy: Detection by the “mirage Effect”. Appl. Phys. Lett. 1980, 36, 130–132. [Google Scholar]
- Boccara, A.C.; Fournier, D.; Jackson, W.; Amer, N.M. Sensitive Photothermal Deflection Technique for Measuring Absorption in Optically Thin Media. Opt. Lett. 1980, 5, 377–379. [Google Scholar]
- Wemhoner, J.; Wermer, L.; Silva, C.L.; Barnett, P.; Radosevich, C.; Patel, S.; Edens, H. Lightning Radiometry in Visible and Infrared Bands. Atmos. Res. 2023, 292, 106855. [Google Scholar]
- Fomina, P.S.; Proskurnin, M.A. Photothermal Radiometry Methods in Materials Science and Applied Chemical Research. J. Appl. Phys. 2022, 132, 040701. [Google Scholar]
- Mateos-Canseco, A.; Kusiak, A.; Battaglia, J.L. Thermal Imaging by Scanning Photothermal Radiometry. Rev. Sci. Instrum. 2023, 94, 104902. [Google Scholar]
- Sade, S.; Eyal, O.; Scharf, V.; Katzir, A. Fiber-Optic Infrared Radiometer for Accurate Temperature Measurements. Appl. Opt. 2002, 41, 1908–1914. [Google Scholar]
- Hristov, H.I.; Dimitrov, K.L.; Kolev, S.V. Use of Infrared Radiometry in Temperature Measurement of Plant Leaf. Int. J. Reason.-Based Intell. Syst. 2021, 13, 219–226. [Google Scholar]
- Salnick, A.; Mandelis, A.; Jean, C. Noncontact Measurement of Transport Properties of Long-bulk-carrier-lifetime Si Wafers Using Photothermal Radiometry. Appl. Phys. Lett. 1996, 69, 2522–2524. [Google Scholar]
- Salnick, A.; Jean, C.; Mandelis, A. Noncontacting Photothermal Radiometry of SiO2/Si MOS Capacitor Structures. Solid-State Electron. 1997, 41, 591–597. [Google Scholar]
- Macedo, F.; Vaz, F.; Rebouta, L.; Carvalho, P.; Haj-Daoud, A.; Junge, K.H.; Pelzl, J.; Bein, B.K. Modulated IR Radiometry of (TiSi)N Thin Films. Vacuum 2008, 82, 1457–1460. [Google Scholar]
- Dorywalski, K.; Chrobak, Ł.; Maliński, M. Comparative Studies of the Optical Absorption Coefficient Spectra in the Implanted Layers in Silicon with the Use of Nondestructive Spectroscopic Techniques. Metrol. Meas. Syst. 2020, 27, 323–337. [Google Scholar]
- Martinez-Hernandez, H.D.; Martinez-Munoz, P.E.; Ramirez-Gutierrez, C.F.; Martinez-Ascencio, E.U.; Millan-Malo, B.M.; Rodriguez-Garcia, M.E. Effect of Intrinsic and Extrinsic Defects on the Structural, Thermal, and Electrical Properties in p-Type CZ-Si Wafers with Different Carrier Concentrations. Int. J. Thermophys. 2022, 43, 181. [Google Scholar]
- Chrobak, Ł.; Maliński, M. Investigations of the Possibility of Determination of Thermal Parameters of Si and SiGe Samples Based on the Photo Thermal Radiometry Technique. Infrared Phys. Technol. 2018, 89, 46–51. [Google Scholar]
- Chrobak, Ł.; Maliński, M. On Investigations of the Optical Absorption Coefficient of Gold and Germanium Implanted Silicon with the Use of the Non-Destructive Contactless Photo Thermal Infrared Radiometry. J. Electron. Mater. 2019, 48, 5273–5278. [Google Scholar]
- Fontenot, R.S.; Mathur, V.K.; Barkyoumb, J.H. New Photothermal Deflection Technique to Discriminate between Heating and Cooling. J. Quant. Spectrosc. Radiat. Transf. 2018, 204, 1–6. [Google Scholar]
- Afjeh-Dana, E.; Asadian, E.; Razzaghi, M.R.; Rafii-Tabar, H.; Sasanpour, P. Deflection-Based Laser Sensing Platform for Selective and Sensitive Detection of H2S Using Plasmonic Nanostructures. Sci. Rep. 2022, 12, 15789. [Google Scholar]
- Olmstead, M.A.; Amer, N.M.; Kohn, S.; Fournier, D.; Boccara, A.C. Photothermal Displacement Spectroscopy: An Optical Probe for Solids and Surfaces. Appl. Phys. A 1983, 32, 141–154. [Google Scholar]
- Bialkowski, S.E.; Mandelis, A. Photothermal Spectroscopy Methods for Chemical Analysis. Phys. Today 1996, 49, 76. [Google Scholar]
- Barbero, C.; Kőtz, R.; Haas, O. Differential Photothermal Deflection Spectroscopy (Dpds). a Technique to Study Electrochromism of Synthetic Metals. Synth. Met. 1999, 101, 170. [Google Scholar]
- Sánchez-Lavega, A.; Salazar, A.; Ocariz, A.; Pottier, L.; Gomez, E.; Villar, L.M.; Macho, E. Thermal Diffusivity Measurements in Porous Ceramics by Photothermal Methods. Appl. Phys. A 1997, 65, 15–22. [Google Scholar]
- Leonid, S. Light-Induced Absorption in Materials Studied by Photothermal Methods. Recent Pat. Eng. 2009, 3, 129–145. [Google Scholar] [CrossRef]
- Xu, X.; Cuautle, J.J.A.F.; Kouyate, M.; Roozen, N.B.; Goossens, J.; Menon, P.; Malayil, M.K.; Salenbien, R.; Rajesh, R.N.; Glorieux, C.; et al. Evolution of Elastic and Thermal Properties during TMOS-Gel Formation Determined by Ringing Bottle Acoustic Resonance Spectroscopy, Impulsive Stimulated Scattering, Photopyroelectric Spectroscopy and the Hot Ball Method. J. Phys. D Appl. Phys. 2016, 49, 085502. [Google Scholar] [CrossRef]
- Milošev, I.; Hamulić, D.; Rodič, P.; Carrière, C.; Zanna, S.; Budasheva, H.; Korte, D.; Franko, M.; Mercier, D.; Seyeux, A.; et al. Siloxane Polyacrylic Sol-Gel Coatings with Alkly and Perfluoroalkyl Chains: Synthesis, Composition, Thermal Properties and Log-Term Corrosion Protection. Appl. Surf. Sci. 2022, 574, 151578. [Google Scholar] [CrossRef]
- Hanh, B.D.; Faubel, W.; Heissler, S.; Wartewig, S.; Neubert, R.H. Pharmaceutical Applications of Photothermal Beam Deflection. Laser Phys. 2006, 16, 794–798. [Google Scholar] [CrossRef]
- Rudnicki, J.D.; Russo, R.E.; Shoesmith, D.W. Photothermal Deflection Spectroscopy Investigations of Uranium Dioxide Oxidation. J. Electroanal. Chem. 1994, 372, 63–74. [Google Scholar] [CrossRef]
- Mandelis, A. Laser Infrared Photothermal Radiometry of Semiconductors: Principles and Applications to Solid State Electronics. Solid-State Electron. 1998, 42, 1–15. [Google Scholar] [CrossRef]
- Mandelis, A.; Batista, J.; Shaughnessy, D. Infrared Photocarrier Radiometry of Semiconductors: Physical Principles, Quantitative Depth Profilometry, and Scanning Imaging of Deep Subsurface Electronic Defects. Phys. Rev. B 2003, 67, 205208. [Google Scholar] [CrossRef]
- Chrobak, Ł.; Korte, D.; Budasheva, H.; Maliński, M.; Rodič, P.; Milošev, I.; Janta-Lipińska, S. Investigations of the Thermal Parameters of Hybrid Sol–Gel Coatings Using Nondestructive Photothermal Techniques. Energies 2022, 15, 4122. [Google Scholar] [CrossRef]
- Chrobak, Ł.; Maliński, M.; Korte, D. Two-Layer Hybrid Sol-Gel System’s Thermal Parameters Investigated with the Optical Nondestructive Photoacoustic Method in the Frequency Domain. Mater. Sci. Eng. B 2023, 295, 116585. [Google Scholar]
- Li, B.; Deng, Y.; Cheng, J. Pulsed Photothermal Deflection Spectroscopy with Optically Dense Samples. Appl. Spectrosc. 1995, 49, 279–285. [Google Scholar] [CrossRef]
- Korte, D.; Franko, M. Application of Complex Geometrical Optics to Determination of Thermal, Transport, and Optical Parameters of Thin Films by the Photothermal Beam Deflection Technique. JOSA A 2015, 32, 61–74. [Google Scholar] [PubMed]
- Kirkup, L. An Introduction to Uncertainty in Measurement: Using The Gum, 1st ed.; Cambridge University Press: Cambridge, UK; New York, NY, USA, 2006; ISBN 978-0-521-60579-3. [Google Scholar]
- Williams, J.H. Quantifying Measurement: The Tyranny of Numbers; Morgan & Claypool Publishers: San Rafael, CA, USA, 2016; ISBN 978-1-68174-433-9. [Google Scholar]
- Hamulić, D.; Medoš, G.; Korte, D.; Rodič, P.; Milošev, I. The Effect of Curing Temperature and Thickness of Polybutyl Methacrylate Siloxane Coatings on the Corrosion Protection of Structural Steel S355. Coatings 2023, 13, 675. [Google Scholar] [CrossRef]
- Greenland, S.; Senn, S.J.; Rothman, K.J.; Carlin, J.B.; Poole, C.; Goodman, S.N.; Altman, D.G. Statistical Tests, P Values, Confidence Intervals, and Power: A Guide to Misinterpretations. Eur. J. Epidemiol. 2016, 31, 337–350. [Google Scholar] [PubMed]
Disclaimer/Publisher’s Note: The statements, opinions and data contained in all publications are solely those of the individual author(s) and contributor(s) and not of MDPI and/or the editor(s). MDPI and/or the editor(s) disclaim responsibility for any injury to people or property resulting from any ideas, methods, instructions or products referred to in the content. |
© 2025 by the authors. Licensee MDPI, Basel, Switzerland. This article is an open access article distributed under the terms and conditions of the Creative Commons Attribution (CC BY) license (https://creativecommons.org/licenses/by/4.0/).