Abstract
Improving the physical quality of coarse-textured soils by organic amendments requires choosing the amendment and the dose. The effects of different doses of compost, vermicompost, and biochar on soil bulk density (BD) and water retention parameters (macroporosity, PMAC; aeration capacity, AC; plant available water capacity, PAWC; relative field capacity, RFC) were tested for two sandy-loam soils. Without any treatment, these soils had too high BD and AC values and too low PMAC, PAWC, and RFC values. No amendment satisfactorily improved the PMAC. Only the biochar yielded statistically significant relationships between the BD, AC, PAWC, and RFC, and the amendment rate, ar. With this amendment, aeration and water storage improved because soil water content at field capacity increased with an ar more than those at saturation and the permanent wilting point. A dose of biochar (50 t/ha in a 5-cm-thick layer) made the soil physical quality good with reference to all considered parameters was identified. A single application of a rather high amount of biochar can be expected to improve the physical quality of coarse-textured soils for a long time. The general validity of the optimal ranges of values for the considered parameters and the time dependence of amendment effects in the field require further check.
1. Introduction
Coarse-textured soils, characterized by a high proportion of sand and low organic matter content, often show loose structure, inadequate water retention capacity, rapid drainage, high susceptibility to accelerated nutrient leaching, and erosion vulnerability, which can limit their productivity and ecological resilience [1].
Defined by the Soil Science Glossary [2] as “…any material such as lime, gypsum, sawdust, compost, animal manures, crop residue or synthetic soil conditioners that is worked into the soil or applied on the surface to enhance plant growth…”, soil amendments could enhance the physical, chemical, and biological properties of these soils, making them more suitable for productive use [3,4]. The reason is that adding amendments to coarse soils can be expected to induce improvements in the bulk density [5], water retention [6], water use efficiency [7], aggregate stability [8], porosity [9], and hydraulic conductivity [10] of the soil.
A recent trend envisions the transformation of organic waste into high-value soil organic amendments as a cornerstone of sustainable agricultural practices within the circular economy framework [11]. This shift aims to reduce environmental burdens associated with waste disposal while enhancing soil fertility, promoting carbon sequestration, and fostering microbial diversity, thereby contributing to long-term ecosystem resilience and agricultural productivity [1,12].
Organic soil amendments refer to a wide variety of materials, including animal manure, crop residue, plant leaves, grass clippings, food processing by-products, and sewage sludge, all of which may arise as the residue or by-products of agricultural and industrial processes [13]. Compost, vermicompost, and biochar are organic amendments that can be expected to improve the physico-chemical properties of coarse soils [8,14,15]. For example, Bondì et al. [16] showed that a compost amendment increased the plant available water capacity (PAWC) of a sandy-loam, soil since organic matter incorporation primarily increased the micropore volume and decreased the macroporosity. Co-composted mixtures of maize, sewage sludge, and biochar significantly enhanced the water retention capacity of loamy sand soils, with the observed benefits being influenced by both the compost application rate and the specific type of feedstock used in the composting process [17]. The impact of compost and vermicompost amendments on the soil structure, water retention, and water use efficiency was investigated by Rivier et al. [10] on a sandy and a loamy soil. These authors found that these organic amendments enhanced the soil water-holding capacity, promoted macro-aggregate formation, and reduced bulk density, even when they were applied at low rates. Similar results were obtained by Aksakal et al. [18], since the application of vermicompost to a sandy soil reduced bulk density, increased porosity, enhanced soil water and air permeability, and improved soil aggregation. Ouyang et al. [19] evaluated the effects of biochar amendment on sandy-loam soils and they observed a significant promotion of macro-aggregate formation, an improvement in saturated soil hydraulic conductivity, an increase of saturated water content, and a decrease of residual water content. Biochar can also represent a sustainable approach to mitigate drought conditions and reduce the irrigation needs of desert sandy soils by improving soil porosity, water retention, aggregate stability, and plant-available water [20].
Despite the extensive literature on organic amendments, significant gaps remain in understanding how to optimize their use, warranting further investigation and more detailed studies. Exhaustive research on the effects of the applied rate of a given amendment and comparisons among different source materials are rare [21]. For example, to the best of our knowledge, no study has simultaneously considered and compared the effects of compost, vermicompost, and biochar on the physical quality of coarse-textured soils. Addressing this gap is advisable to establish how to maximize the effectiveness of any amendment in enhancing soil properties while minimizing the potential environmental impacts and resource inefficiency.
An assessment of the amendments’ effects on water retention capacity and the soil’s air-to-water ratio can be conducted by estimating several parameters derived from the soil water retention curve and evaluating the soil physical quality (SPQ) [3,4]. Capacitive-based parameters, such as macroporosity (PMAC), air capacity (AC), relative field capacity (RFC), and plant available water capacity (PAWC), can provide valuable information about the effects of a treatment on specific soil pore classes, i.e., macropores (drainable porosity) or meso-micropores (matrix porosity), which have direct effects on water flow and water redistribution process [4]. These parameters, together with the dry soil bulk density, BD, have particular relevance in agronomic contexts, since they describe the overall soil strength, aeration, and ability to store and provide water to plant roots [22].
From a practical point of view, it appears necessary to establish the following, with reference to a given parameter: (i) if the amendment can actually serve the purpose of improving the SPQ; (ii) what is the minimum dose that makes physically good an otherwise poor soil; and (iii) what is the amount of amendment that should not be exceeded to avoid the risk that a good SPQ deteriorates to unacceptable levels [23]. To give an answer to these questions, it is necessary to compare the relationship expressing the amendment rate effect on the considered parameter with the optimal values of that parameter. All questions can be answered if the optimal conditions are defined in terms of the range of values. This is the case, for example, of the RFC for which the optimal conditions are 0.6 ≤ RFC ≤ 0.7 [3]. Instead, only the first two questions can be answered if the optimal conditions are defined by a single value discriminating between a poor and a good SPQ. An example is the AC, for which the optimal conditions for sandy-loam to clay-loam soils are defined by AC ≥ 0.14 cm3/cm3 [3]. Likely, the possibility of giving an answer to all three questions regardless of the parameter could further broaden the practical interest of the SPQ investigations.
The general purpose of this investigation was to compare the effects of three commercial organic amendments, that is compost, vermicompost, and biochar, on physical quality parameters of two coarse-textured soils with more than 70% sand. The specific objectives were as follows: (i) to review the available literature on the optimal values of the selected SPQ parameters (BD, PMAC, AC, PAWC, and RFC) in order to suggest an optimal range of values for each parameter; (ii) to determine which soil amendment yielded the best response on coarse soils based on the considered SPQ parameters; and (iii) to verify if a single amendment rate could produce a good SPQ with reference to all considered parameters.
2. Soil Physical Quality Parameters and Their Optimal Ranges
The physical quality of agricultural soils refers primarily to the soil’s strength and fluid transmission, and the storage characteristics in the crop root zone. According to Topp et al. [24] and Reynolds et al. [25], an agricultural soil has a good physical quality if it is strong enough to maintain good structure, hold crops upright, and resist erosion and compaction, but also weak enough to allow for unrestricted root growth and the proliferation of soil flora and fauna. Moreover, in a physically good soil, fluid transmission and storage characteristics permit the correct proportions of water, dissolved nutrients, and air for both maximum crop performance and minimum environmental degradation.
The most frequently considered SPQ parameters in agricultural contexts include dry soil bulk density, macroporosity, air capacity, plant available water capacity, and relative field capacity (e.g., [3,25,26,27]). Dry soil bulk density, BD (g/cm3), is an indirect indicator of aeration, strength, and ability to store and transmit water. The other four parameters are obtained from the volumetric soil water content, the θh (L3/L3), values corresponding to pre-established pressure heads, h (L). In particular, macroporosity, PMAC (cm3/cm3), is defined as follows:
in which θs (cm3/cm3) is the saturated soil water content and θ10 (cm3/cm3) is the soil water content at a pressure head of −10 cm. This parameter is expressive of the soil’s ability to quickly drain excess water and facilitate root proliferation. Air capacity, AC (cm3/cm3), is defined as follows:
in which θ100 (cm3/cm3) is the soil water content at a pressure head of −100 cm, also defined as the field capacity water content. The ability to store root-zone air is expressed by AC. The plant available water capacity, PAWC (cm3/cm3), is given by the following:
where θ15,300 (cm3/cm3) is the soil water content at a pressure head of −15,300 cm, also defined as the permanent wilting point water content. This parameter describes the soil’s ability to store plant-available water. Finally, the relative field capacity, RFC, is defined as follows:
and it indicates the soil’s primary limitation with respect to water and air storage.
With reference to some parameters, the physical quality of a given soil is considered acceptable if the parameter falls within a range of values, and is unacceptable otherwise. This is the case for the BD and RFC, for which the optimal ranges are 0.9 ≤ BD ≤ 1.2 g/cm3 and 0.6 RFC ≤ 0.7, respectively [3]. Consequently, both too low (less than the lower limit of the optimal range) and too high (higher than the upper limit of this range) values of the BD and RFC denote an unsatisfactory SPQ. For other parameters, only a lower limit above which the SPQ is considered ideal or optimal has been suggested. In other terms, there is not any information for a possible upper limit above which the SPQ could be more or less poor. For example, according to Reynolds et al. [3], optimal conditions occur if the PMAC ≥ 0.07 cm3/cm3, the AC ≥ 0.14 cm3/cm3, and the PAWC ≥ 0.20 cm3/cm3.
There are at least four reasons why defining an upper limit for the PMAC, AC, and PAWC is advisable and even necessary: (i) methodological consistency, i.e., a range of optimal values is associated with each individual parameter; (ii) it cannot be believed that very high PMAC, AC, and PAWC values unquestionably indicate good SPQ conditions. For example, an AC value higher than approximately 0.3 cm3/cm3 should denote a good SPQ [3], but Reynolds et al. [25] concluded that a very high AC value indicates an excessive aeration and, hence, a poor SPQ; (iii) the existence of a physical upper limit can be expected considering that, in optimal conditions, ϕ = AC + PAWC + θ15,300, has to assume a finite value (Reynolds et al., 2009) [3]. Consequently, none of the three addends can increase indefinitely; and iv) with reference to the SPQ assessment, the concept of an optimal range of values established by defining both a minimum and a maximum acceptable value was already introduced by Reynolds et al. [3] with reference to the location and shape parameters of the pore volume distribution.
The investigation by Reynolds et al. [3] also provided some suggestions about possible optimal ranges for the PMAC, AC, and PAWC, since these authors recognized that the soils with a good SPQ had 0.07 ≤ PMAC ≤ 0.10 cm3/cm3, 0.15 ≤ AC ≤ 0.22 cm3/cm3, and 0.15 ≤ PAWC ≤ 0.22 cm3/cm3 (soils of the group 1 in Reynolds et al. [3]) Moreover, these data appeared usable in general since the same authors established comparisons between the properties of these soils and those of other soils differing by both texture and management. Therefore, it can be thought that the SPQ is good if the considered parameters fall within these suggested ranges and poor if the parameters are either too low or too high as compared with the optimal range of values.
Consequently, in this investigation, the conditions defining a good SPQ were assumed to be 0.9 ≤ BD ≤ 1.2 g/cm3, 0.07 ≤ PMAC ≤ 0.10 cm3/cm3, 0.15 ≤ AC ≤ 0.22 cm3/cm3, 0.15 ≤ PAWC ≤ 0.22 cm3/cm3, and 0.6 ≤ RFC ≤ 0.7. With reference to a given parameter, the SPQ was considered good if it fell within the range of optimal values. Otherwise, it was considered poor.
3. Materials and Methods
3.1. Soils and Amendments
Two coarse textured soils were sampled in the Ionian–Metapontino coastal area, namely at Taranto Castellaneta (CAS) and Taranto Ginosa (GIN), in southern Italy. Soil use at the selected field sites was orchard. For each of the two sites, about 20 kg of soil were taken from the upper 20 cm of the soil profile and stored in the laboratory, where the soil was air-dried and sieved to a diameter of 2 mm. Soils were characterized by standard laboratory techniques to determine the particle size distribution and the main chemical properties, including organic matter content, pH, electrical conductivity, cation exchange capacity, and nitrogen content [4]. According to the USDA soil texture classification, both soils were sandy-loam, with clay, silt, and sand content equal to 6%, 21%, and 73%, respectively, at CAS, and 16%, 13%, and 71%, respectively, at GIN. According to the FAO-WRB soil classification, GIN was Chromic Cambisol (Loamic), while CAS was Terric Chromic Cambisol (Loamic). The soil organic matter content was equal to 0.60% at CAS and 1.55% at GIN. Other physical and chemical properties of these two soils have been reported by Castellini et al. [4].
Three soil amendments were used in this investigation, i.e., compost (COM), vermicompost (VER), and biochar (BIO). The COM was a commercial organic amendment obtained by a controlled process of transformation and stabilization of renewable organic matrices such as manure and animal and vegetable residues. The VER was a by-product of the digestion of cow manure by earthworms (Eisenia foetida) manufactured by the Italian Lombrichi Breeding Consortium (CONITALO, Italy). Finally, the BIO was a derivative of a pyro-gasification process of wood obtained from forest cutting (pine, oak, holm oak, chestnut, fir), obtained during a thermal degradation process at a temperature of about 700–800 °C. The COM, VER, and BIO amendments had pH of 8.0, 7.5, and 9.6, respectively, electrical conductivity, EC, equal to 2.2, 3.1, and 0.5 dS/m, respectively, and total organic carbon content, TOC, of 200, 197, and 882 g/kg, respectively. Other information on the main chemical properties of the considered soil amendments have been reported by Castellini et al. [4] for the VER and by Leogrande et al. [28] for the COM and the BIO.
3.2. Soil/Amendment Mixtures
The amendments were preliminarily air-dried and sieved by a 2 mm sieve to remove coarse fragments and large vegetal residue. Then, the soil and the amendments were mixed at 19 amendment/soil ratios (r) by weight: 0 (i.e., control soil without amendment), 0.5%, 1%, 2%, 4%, 5%, 6%, 6.5%, 7%, 8%, 9%, 10%, 12%, 13%, 15%, 17%, 22%, 33%, and 43%. Using a relatively large number of amendment rates for each soil and amendment was preferred to replicating the experiment several times for a low number of amendment rates, given that nearly homogeneous soil was used, and the objective of the investigation was to determine the relationship between a soil parameter and the amendment rate. In other words, a direct correspondence between the used amendment rate and the measured or determined soil parameter for that ar value was established. This approach was similar to that applied in other investigations on the SPQ parameters, such as those by Ghiberto et al. [29] for the RFC, He et al. [30] for the S index, and by Dexter [31] and Gubiani et al. [32] for PAWC.
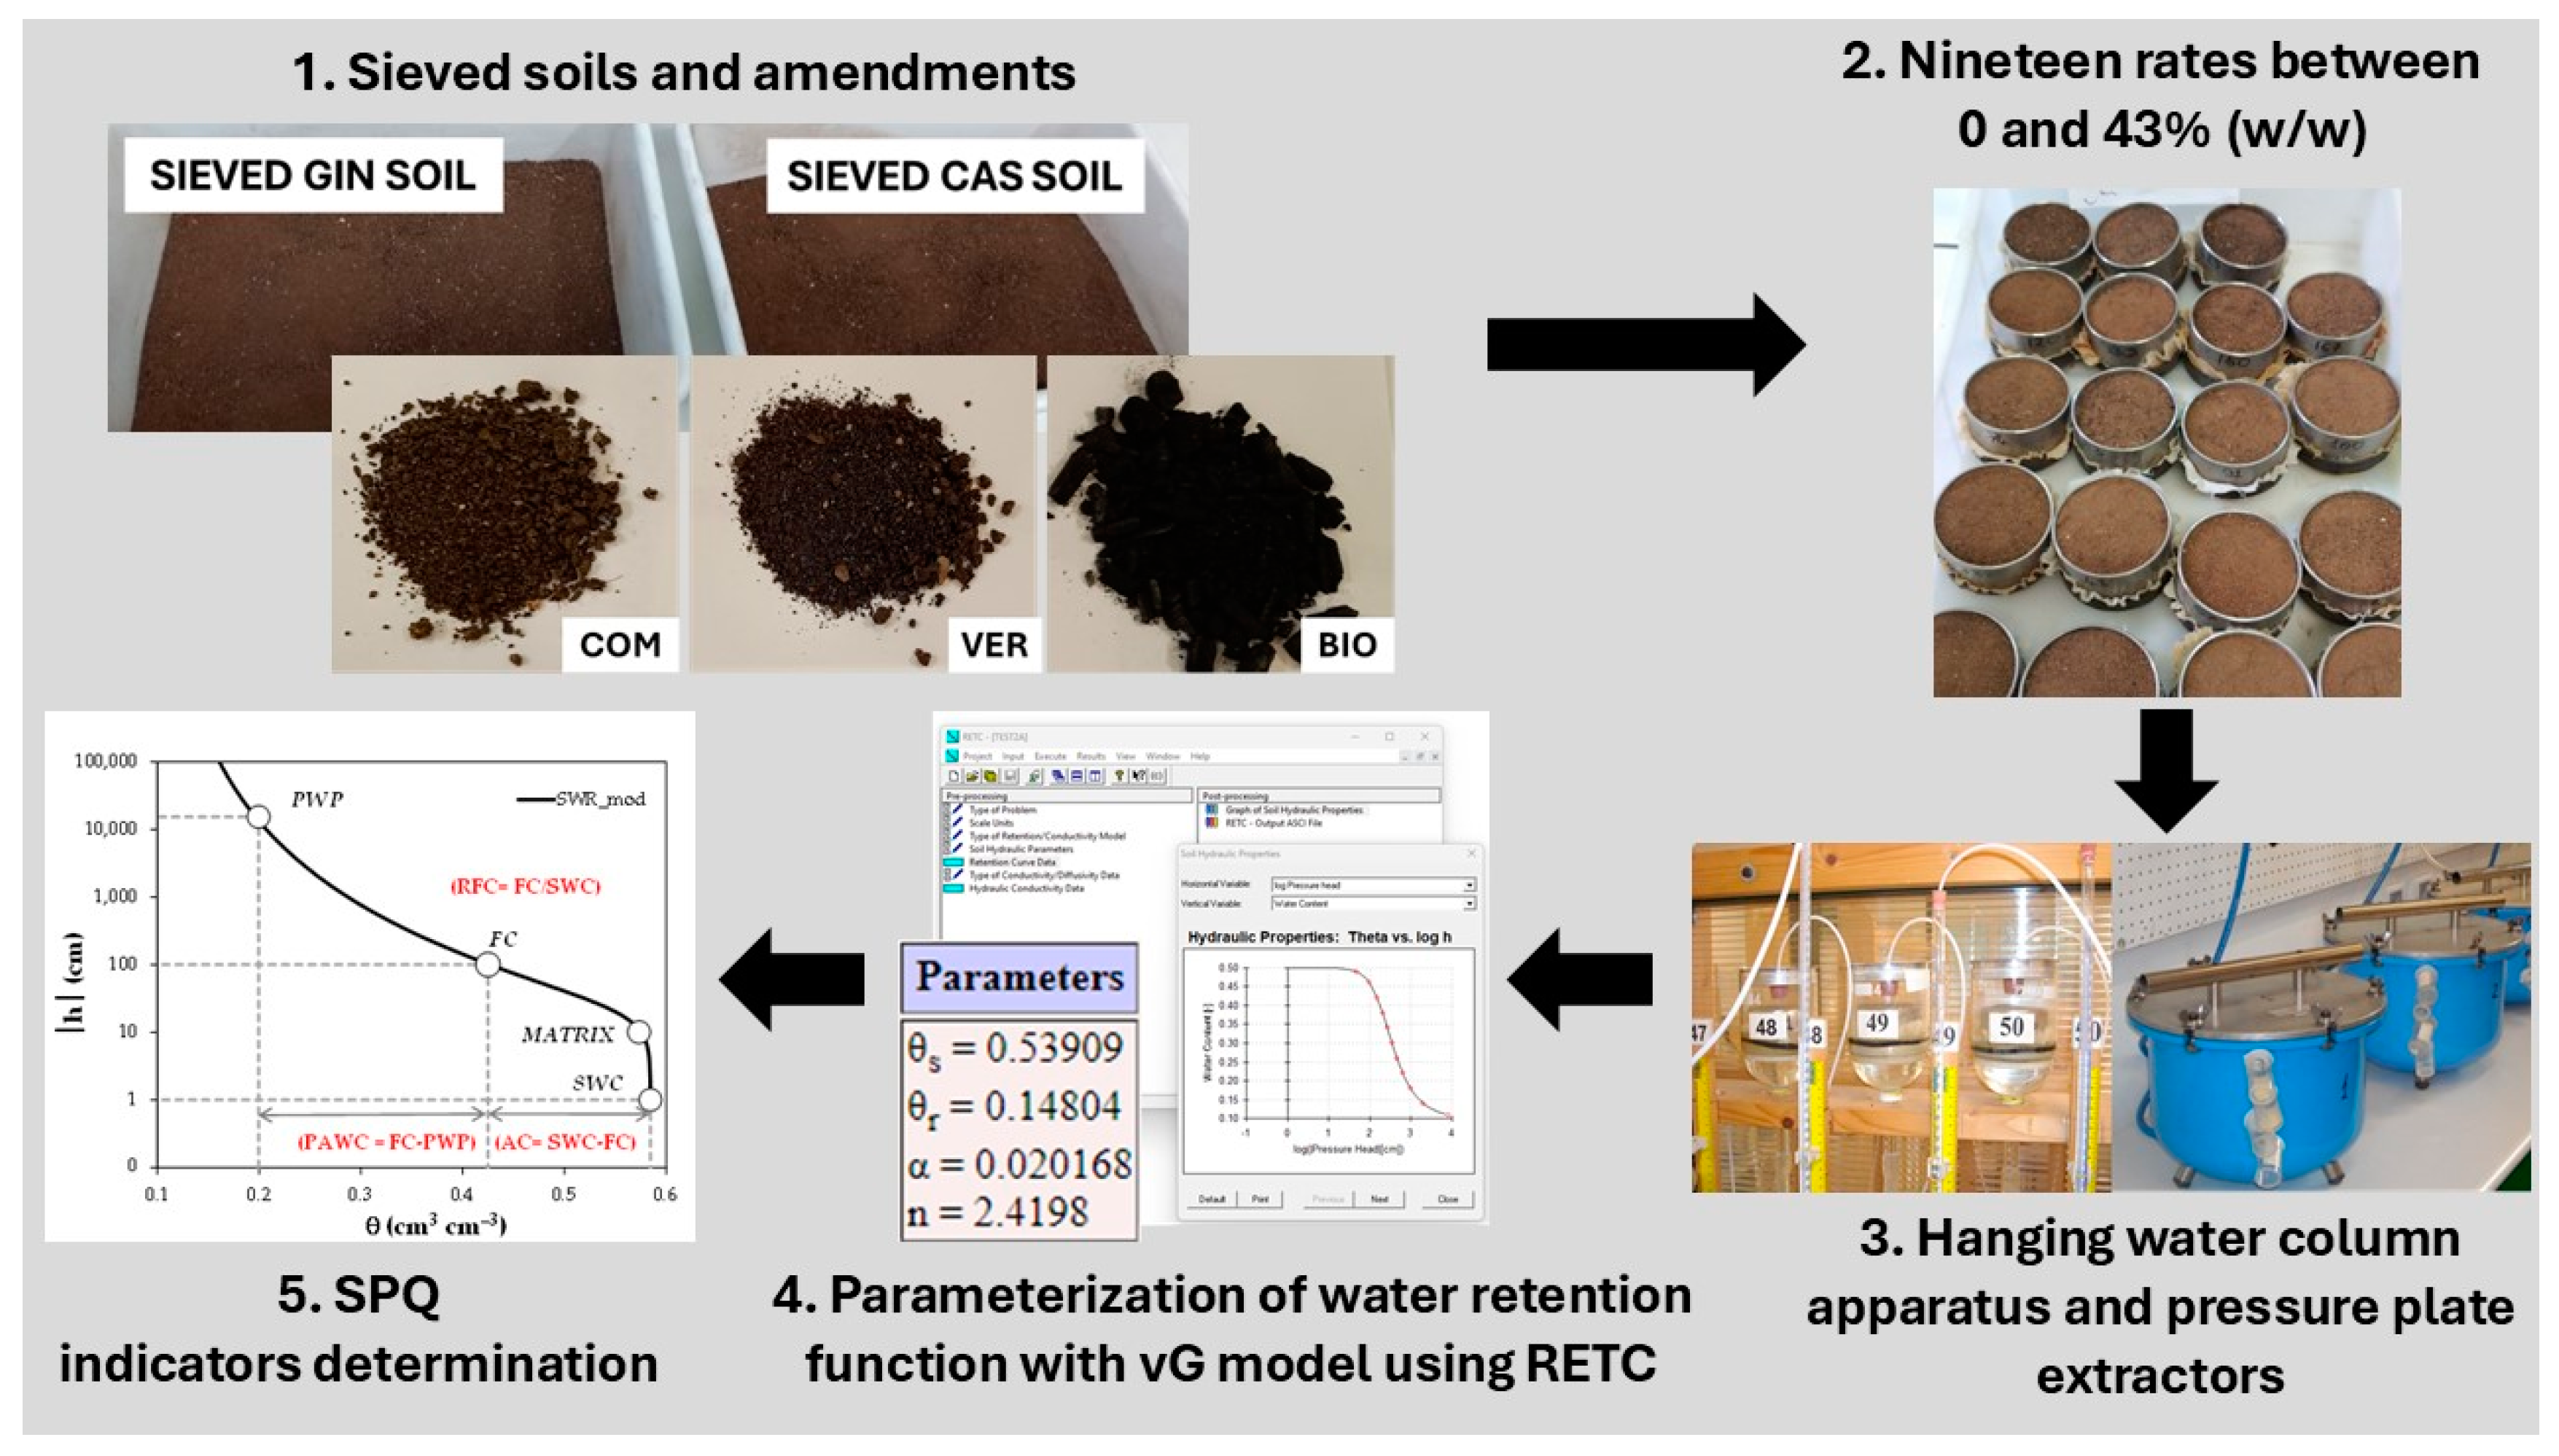
Samples of each mixture were obtained by compacting a known dry mass of mixture (i.e., soil + amendment) into 7.2 cm diameter by 5 cm height (204 cm3) metal cylinders (Figure 1). Samples were prepared by the same procedure used in previous investigations [4,16], that is trying to keep the bulk density of the soil and that of the amendment theoretically constant between different samples. The cylinder was filled with the mixture in four successive steps, lightly pressing the sample surface with a pestle at each step. Consequently, for a given soil/amendment mixture, an amendment rate, ar (t/ha), was calculated to account for the amendment amount to be incorporated into the top 5 cm of the unit soil area. Depending on the used soil amendment, the maximum ar value was 177–224 t/ha.
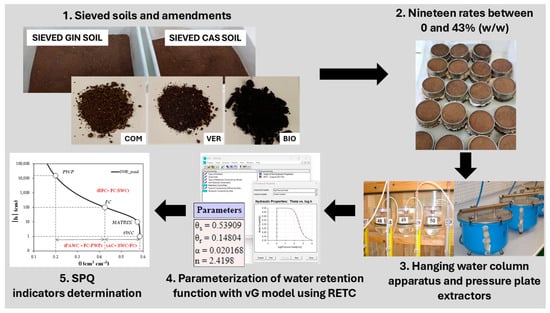
Figure 1.
Flow chart of the steps for soil physical quality (SPQ) parameters determination: 1. preparation of sieved soils (Ginosa, GIN, and Castellaneta, CAS), and amendments, i.e., compost (COM), vermicompost (VER), and biochar (BIO); 2. soil/amendment mixture in cylindrical samplers; 3. soil water retention determination; 4. parameterization of soil water retention function; 5. determination of the SPQ parameters.
3.3. Soil Water Retention and Bulk Density Determination
The volumetric soil water content, θh, close to saturation, i.e., in the range of soil pressure head (h) values −100 ≤ h ≤ − 5 cm, was obtained by a hanging water column apparatus [33]. The soil samples were placed on the surface of the porous plate of a glass funnel and saturated from below by applying four successive equilibrium steps of about 24 h each at h values of −20, −10, and −5 cm, followed by submersion (i.e., h = 0) [34]. Starting from saturation, soil samples were drained by imposing a drainage sequence of eleven h values: −5, −7.5, −10, −15, −20, −25, −30, −40, −50, −70, and −100 cm. For each equilibrium h value, the volume of drained water was recorded, and these volumes were added backwards to the equilibrium volumetric water content, θh (cm3/cm3), determined at h = −100 cm by weighting the sample after oven-drying at 105 °C for 24 h [34]. For each soil/amendment mixture, the water retention data at pressure heads in the range −15,300 ≤ h ≤ −330 cm were determined in pressure plate extractors using samples of 5-cm-diameter by 1-cm-height [35]. The duration of the overall laboratory experiment, i.e., the sample wetting/saturation phase and the determination of water retention during the drainage transient, lasted 2 to 3 weeks.
Therefore, the soil water retention curve was parameterized for each soil/amendment mixture considering 15 pairs of volumetric soil water content vs. soil water pressure head values. The unimodal van Genuchten (vG) water retention function [36] was fitted to the data by the RETC software (version 6.02) [37]. To accurately estimate the water retention curve, model fitting was performed by optimizing all the parameters, namely the residual and saturated volumetric soil water content (i.e., θr, θs) and the scale and shape parameters (α and n) of the vG model [4]. The modeled water retention curves were used for the calculation of the SPQ parameters (Figure 1).
The soil bulk density (BD) was determined using the 204 cm3 oven-dried soil samples by standard laboratory procedures [4,16].
3.4. Data Analysis
For each soil/amendment mixture, a linear regression analysis was performed between each considered soil variable and the amendment rate, ar. The linear regression line between an SPQ parameter and an ar was not forced to start from the same value for ar = 0 regardless of the considered amendment in order to give the same weight to each experimental data point included in each linear regression analysis. In addition to the SPQ parameters, i.e., BD, PMAC, AC, PAWC, and RFC, the volumetric soil water content at saturation, θs, and that at pressure heads of −10 (θ10), −100 (θ100), and −15,300 (θ15,300) cm were also considered. The θ vs. the ar relationship was determined to establish a link between an SPQ parameter (PMAC, AC, PAWC, RFC) and the two θ values considered to calculate that parameter. Therefore, 54 correlations (9 soil parameters × 2 soils × 3 soil amendments) were considered. The influence of the amendment addition was investigated by assessing the significance of the correlation coefficient, R, between the considered soil variable and the ar. A two-tailed t test at p = 0.05 was applied for this purpose [38].
4. Results
4.1. Bulk Density
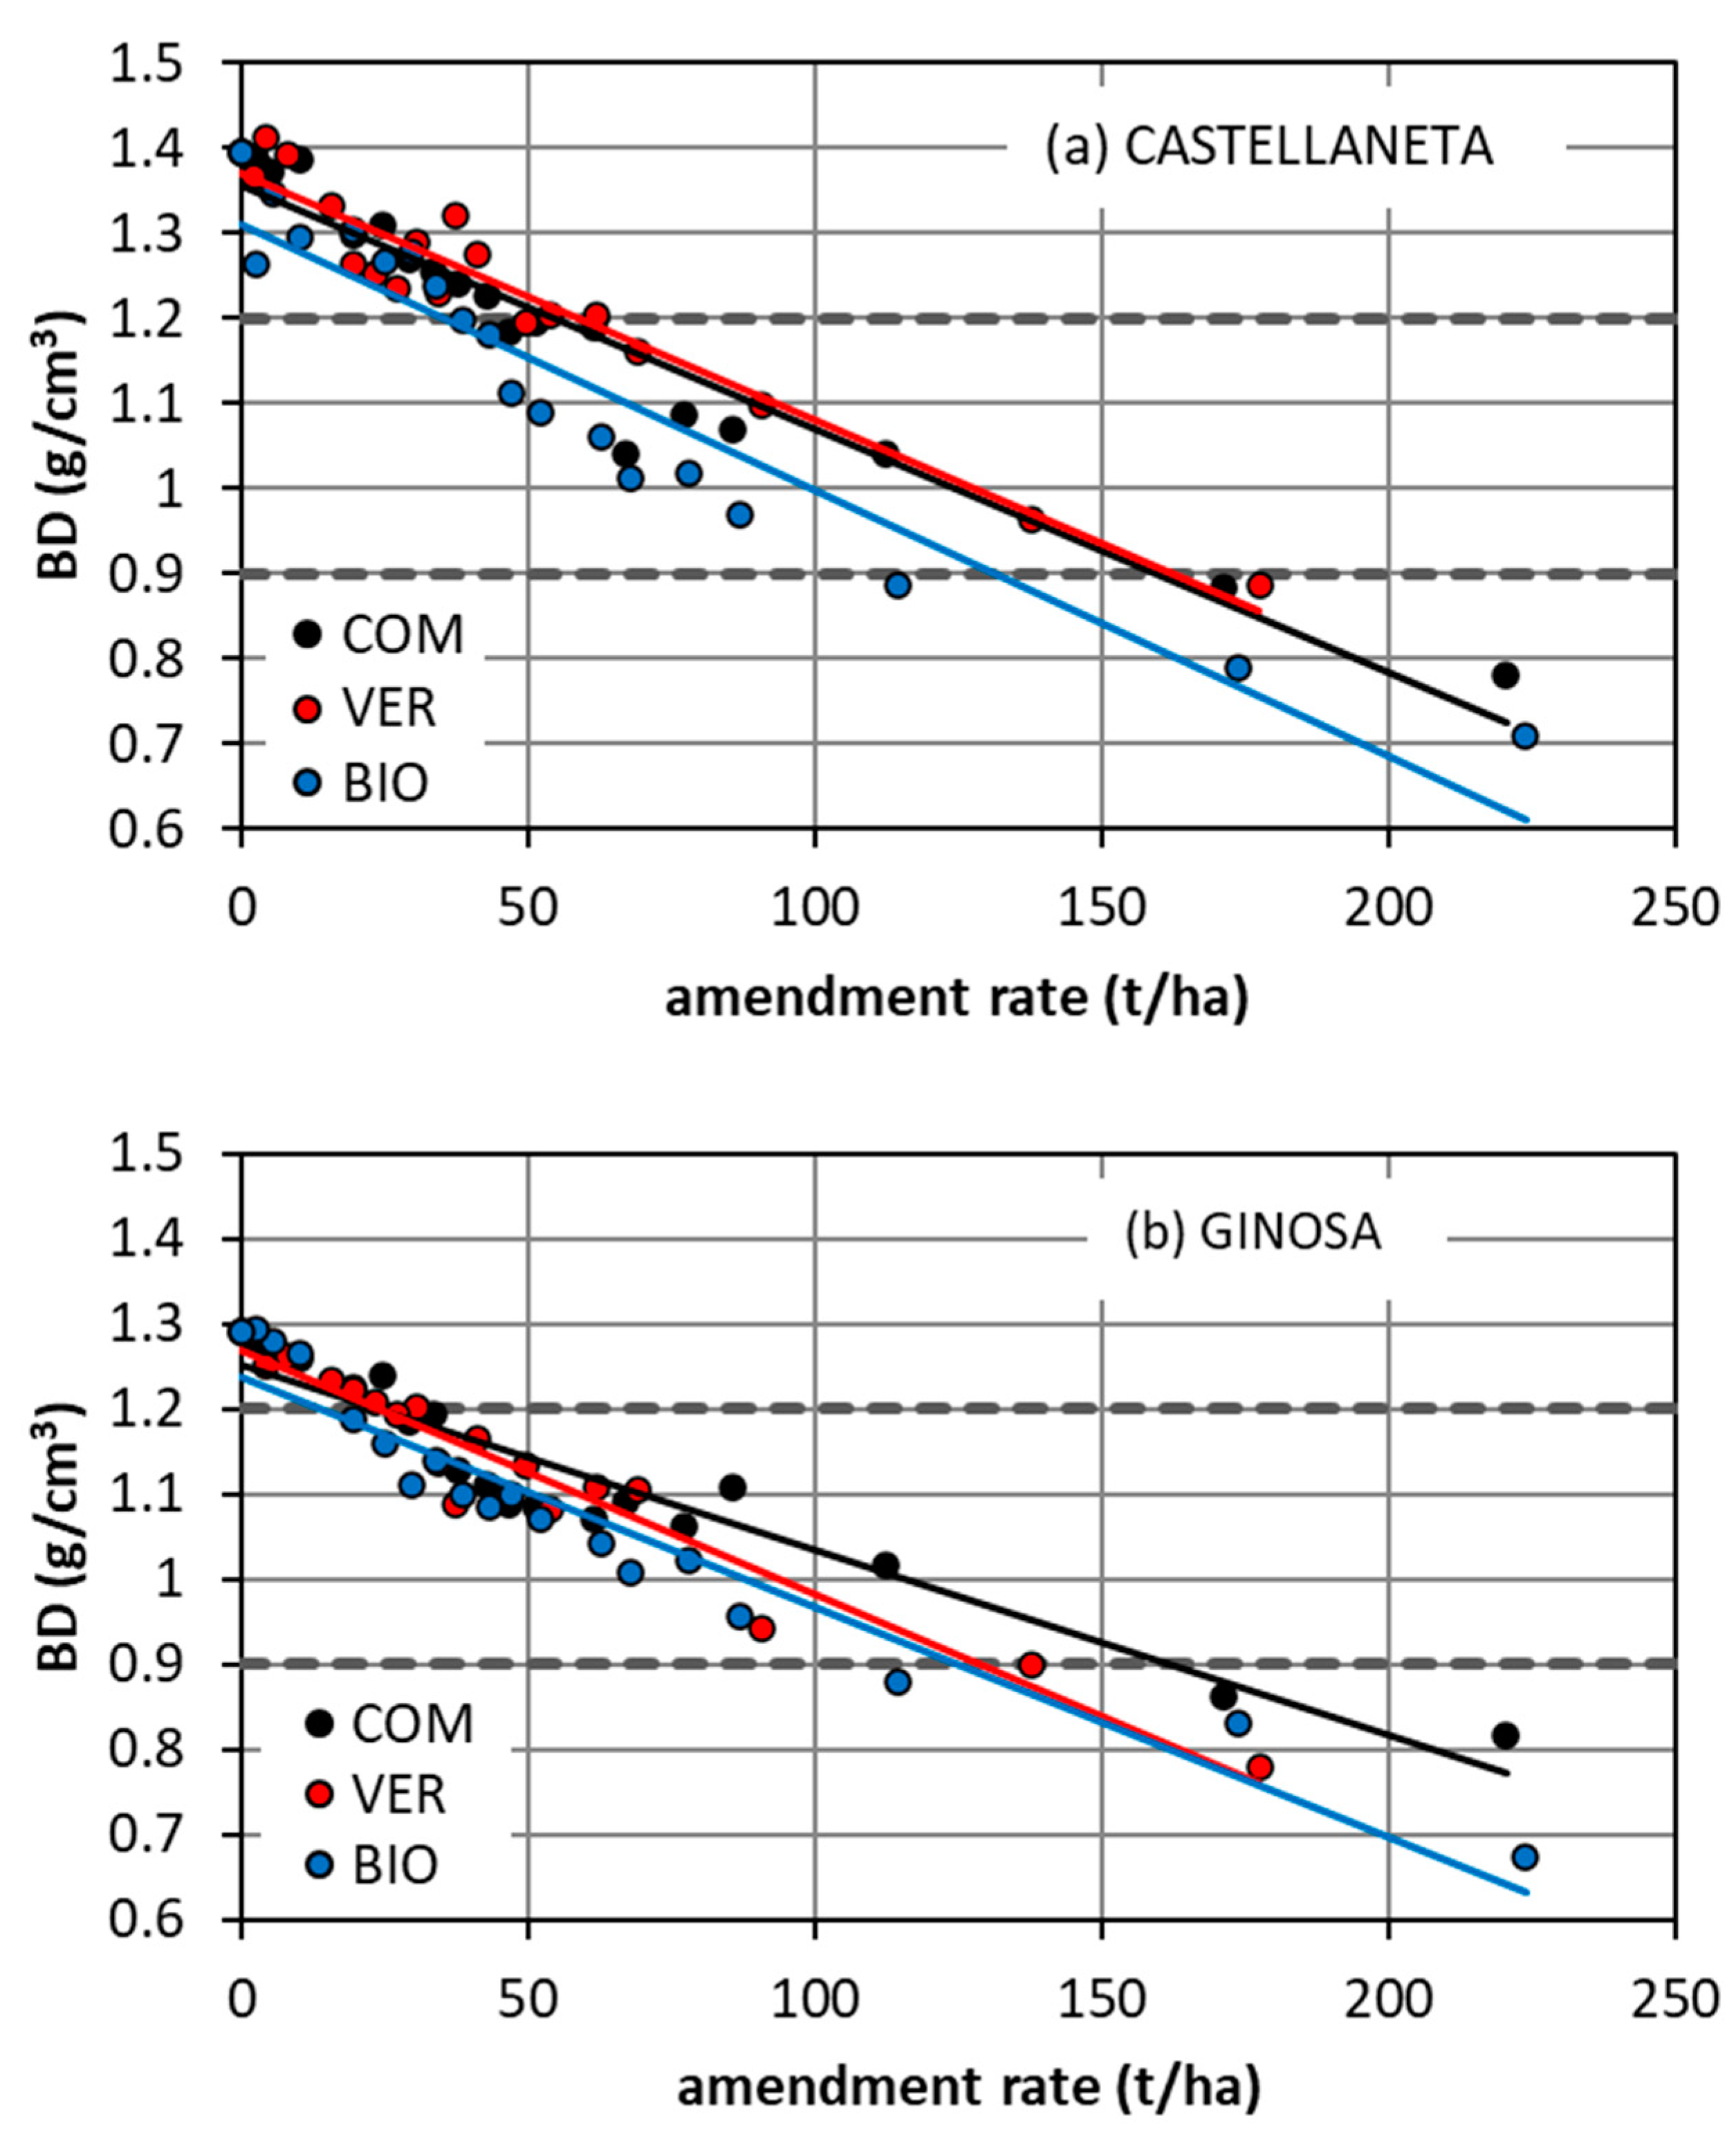
In the absence of any treatment, both soils had too high a bulk density (>1.2 g/cm3), denoting a poor SPQ with reference to this parameter. In particular, the BD was equal to 1.39 g/cm3 at CAS and 1.29 g/cm3 at GIN, with a percentage difference between the two soils, Δ = +8.0%. Therefore, the amendment addition was effective if it determined a decrease of the BD.
For both soils and the three amendments (COM, VER, BIO), the BD decreased significantly as the ar increased, with coefficients of determination, R2, of the fitted BD vs. the ar relationship varying between 0.91 and 0.95, depending on the soil and the amendment (Figure 2 and Table 1). In particular, relatively low amounts of the amendment were generally enough to make the SPQ good, since the BD decreased below the upper limit of the range of the optimal values. Instead, high ar values deteriorated the SPQ, since the BD became less than the lower limit of the optimal range. Therefore, both a minimum, armin, and a maximum, armax, ar value were defined for each soil/amendment combination. In particular, the armin was the minimum amount of amendment necessary to obtain a good SPQ (BD = 1.2 g/cm3) starting from the poor condition of a too compacted soil (BD > 1.2 g/cm3). Instead, the armax was the amount of the amendment beyond which the condition was reversed, and the passage was from a good SPQ (0.9 ≤ BD ≤ 1.2 g/cm3) to a poor SPQ (BD < 0.9 g/cm3). The SPQ was good for armin ≤ ar ≤ armax and poor for both ar < armin and ar > armax.
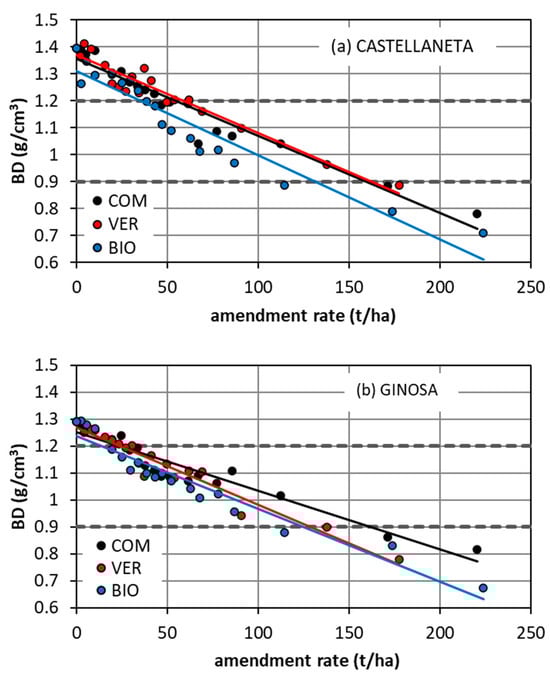
Figure 2.
Dry soil bulk density, BD, against the amendment rate for the three tested amendments (COM = compost; VER = vermicompost; BIO = biochar) at (a) the Castellaneta and (b) the Ginosa field sites. For a given site, the continuous lines are the significant linear regression lines (black for COM; red for VER; blue for BIO). The dashed grey lines define the range of values inside which the soil physical quality is considered good.

Table 1.
Intercept, slope, and coefficient of determination, R2, of the linear regression line between the considered soil physical quality parameters and the amendment rate, ar (t/ha).
At CAS, the armin was equal to 54–58 t/ha for the COM and the VER, and 36 t/ha for the BIO. At GIN, BD = 1.2 g/cm3 was obtained with 23–24 t/ha of COM and VER, and 14 t/ha of BIO. Therefore, for both soils, a relatively low amount of the BIO had the same effect of higher amounts of COM and VER. Depending on the amendment, the dose to be used at CAS was 2.3–2.6 times higher than that necessary at GIN. Likely, this result occurred because, in the absence of any treatment, the BD was higher at CAS than at GIN.
The maximum amendment rate, not be exceeded to avoid an SPQ deterioration (BD < 0.9 g/cm3), was equal to 132–162 t/ha at CAS and 125–159 t/ha at GIN, depending on the amendment. The maximum rate for CAS was equal to 1.0–1.3 times that of GIN, depending on the soil amendment. Therefore, the armax varied with both the amendment and the soil less than the armin.
4.2. Soil Water Content
The volumetric soil water content at saturation (θs) and that at pressure heads, h, of −10 (θ10), −100 (θ100), and −15,300 (θ15,300) cm increased with the amendment rate, ar, according to statistically significant relationships for both soils and the three amendments (Table 2). The R2 values of the fitted relationships varied from 0.35 to 0.97, depending on the considered combination among the pressure head, the soil, and the amendment. These relationships were marginally stronger in the more unsaturated conditions, since the median of R2 was equal to 0.79 for both the θs and θ10, and to 0.83 for both the θ100 and θ15,300, and at GIN than at CAS (medians of R2 = 0.86 and 0.81, respectively). Stronger θ vs. ar relationships were obtained with the BIO and the COM than with the VER, since the medians of R2 were equal to 0.85, 0.83, and 0.64, respectively.
Table 2.
Intercept, slope, and coefficient of determination, R2, of the linear regression line between the volumetric soil water content at fixed pressure head values and the amendment rate, ar (t/ha).
4.3. Macroporosity
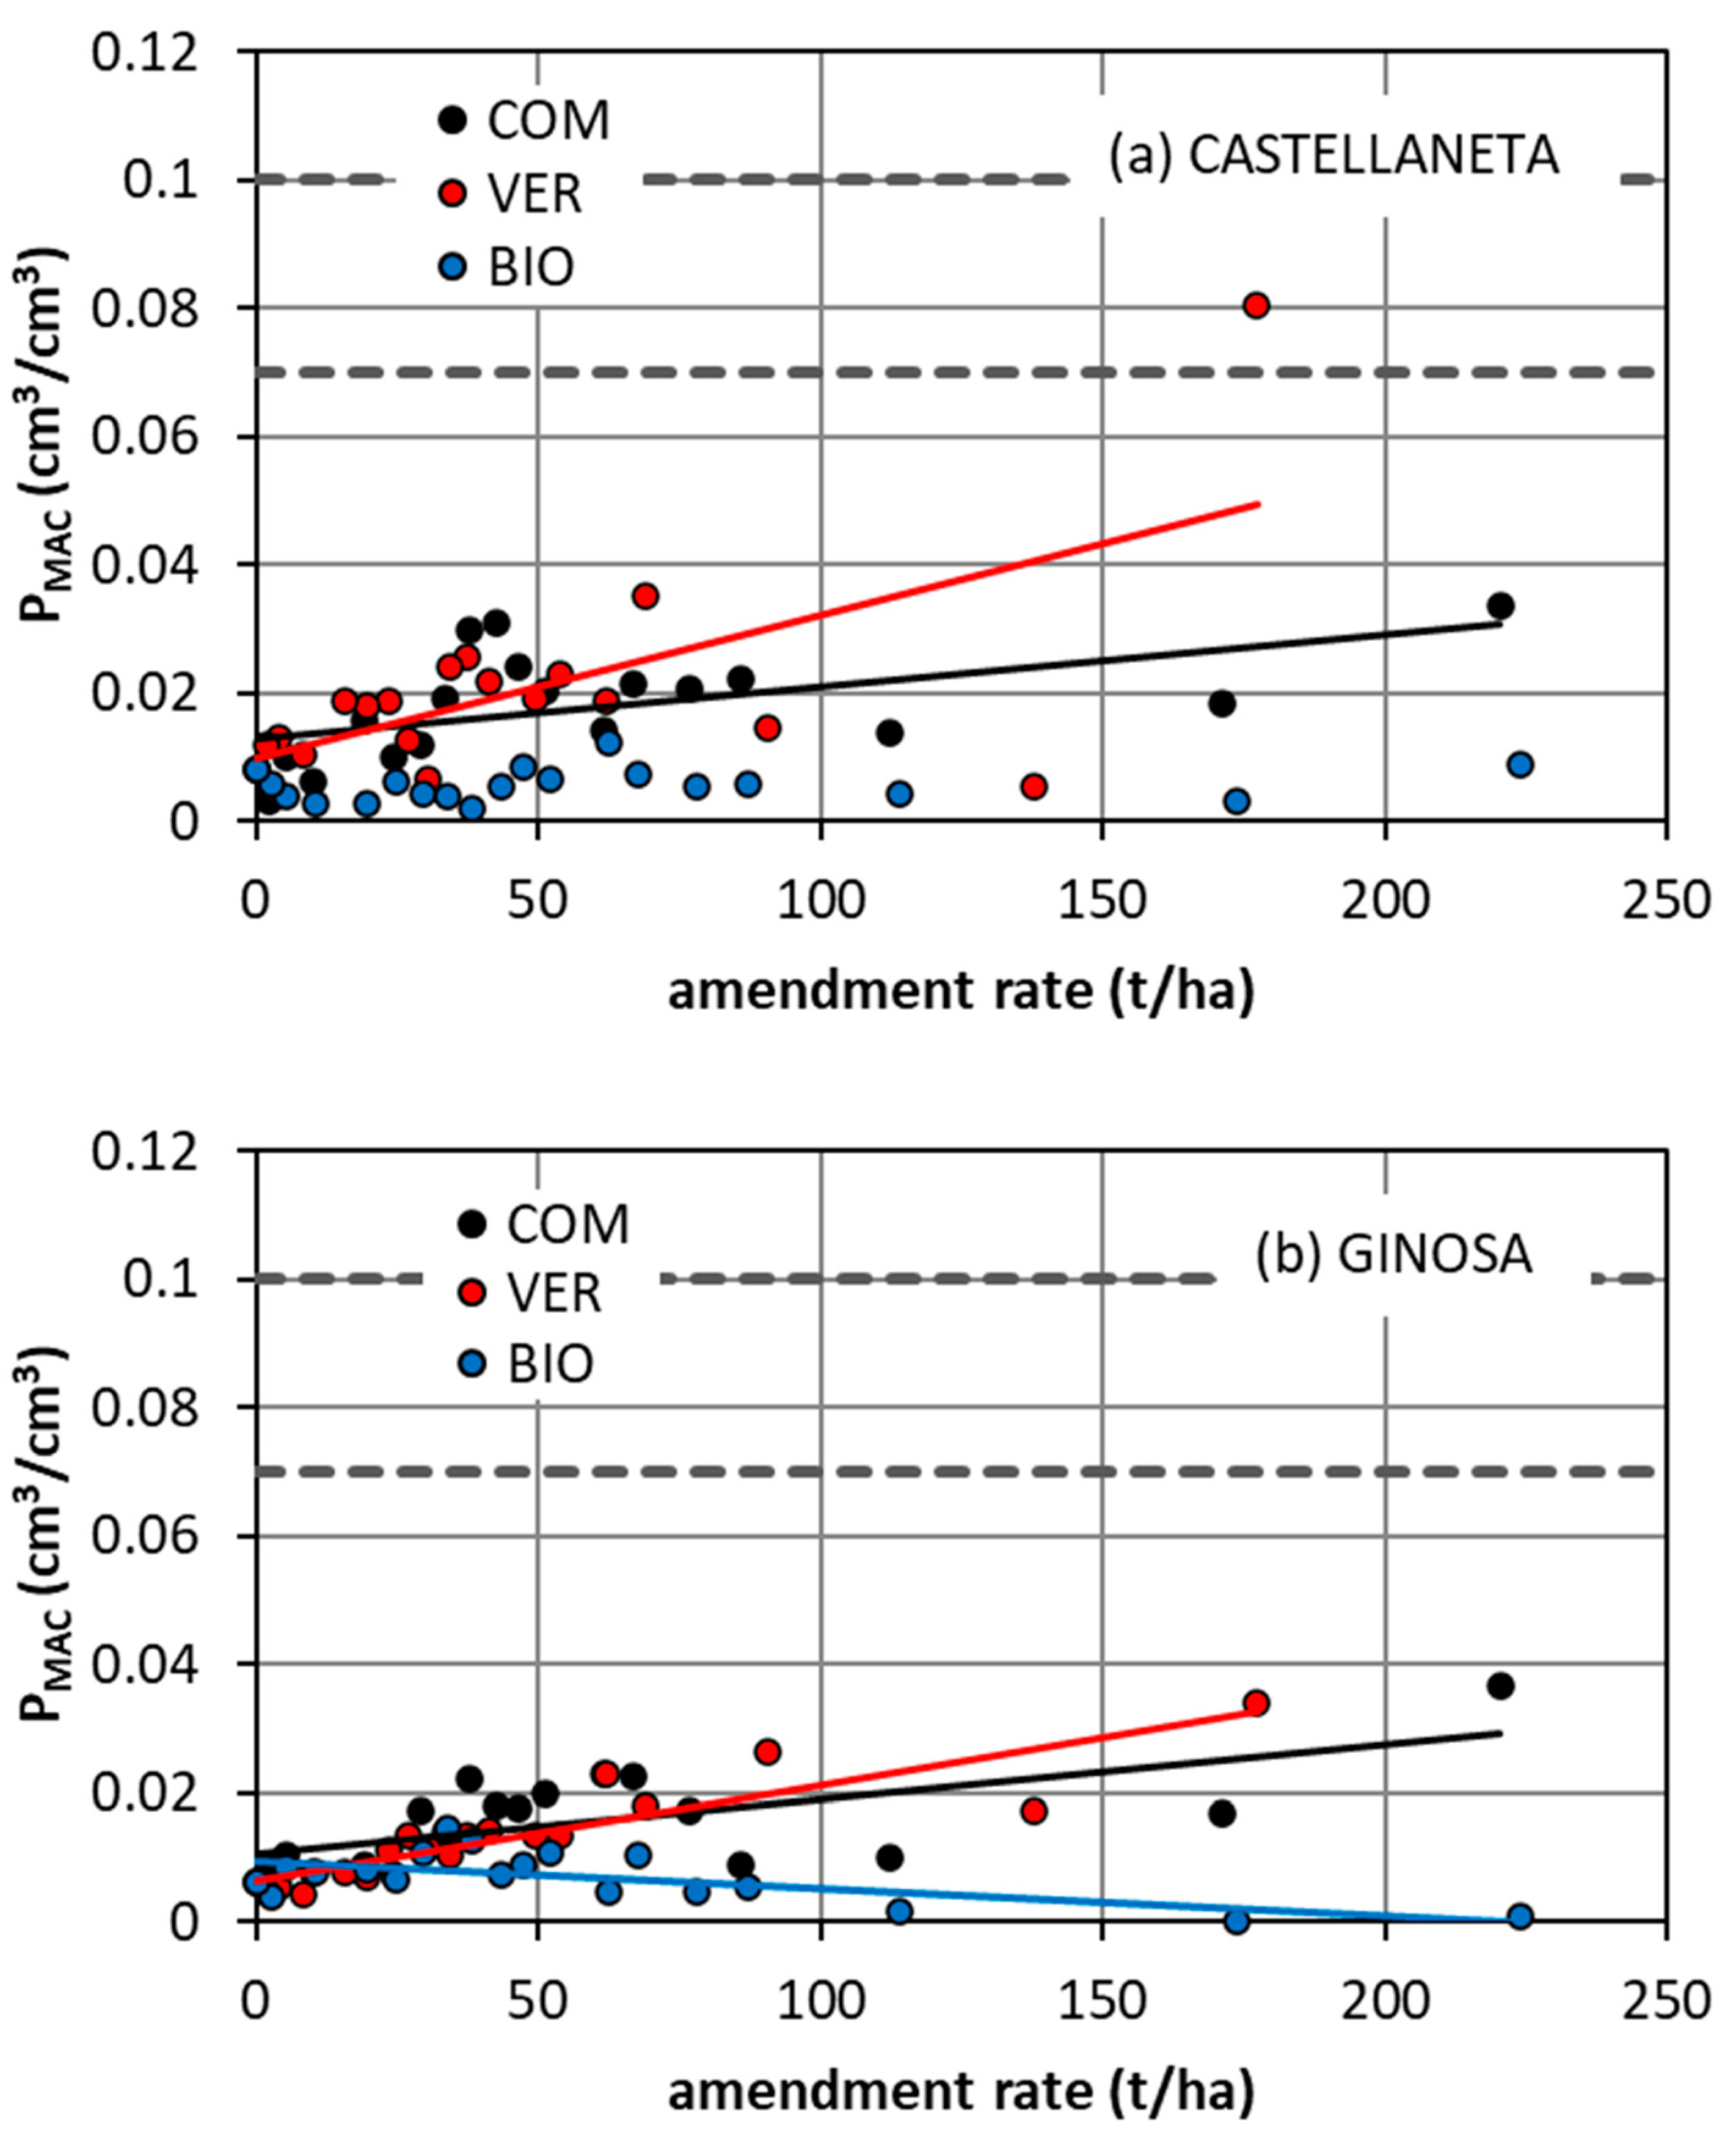
Without amendments, the CAS soil had a higher PMAC value than the GIN soil (PMAC = 0.0081 cm3/cm3 in the former case and 0.0063 cm3/cm3 in the latter; Δ = +27.1%). In both cases, however, the PMAC was much lower than the lowest limit of the optimal range of values (PMAC = 0.07 cm3/cm3). In particular, the PMAC values of the two non-amended soils were nearly an order of magnitude lower than the lowest admissible PMAC value (by 8.6 and 11.1 times for CAS and GIN, respectively). These very low PMAC values were expected, since the soil samples used in this investigation were repacked and, hence, structureless or with little structure [34]. Consequently, for this SPQ parameter, an effective amendment should induce a substantial increase of the PMAC.
The PMAC vs. ar relationship varied with both the soil and the amendment, since adding the amendment determined an increase of the PMAC in some cases (COM and VER at CAS and GIN), a decrease in one case (BIO at GIN), or it was ineffective in another case (BIO at CAS) (Figure 3 and Table 1). The statistically significant relationship between the PMAC and the ar was generally rather weak since, with the only exception of the VER at GIN (R2 = 0.78), the significant values of R2 varied between 0.31 and 0.42 (Table 1).
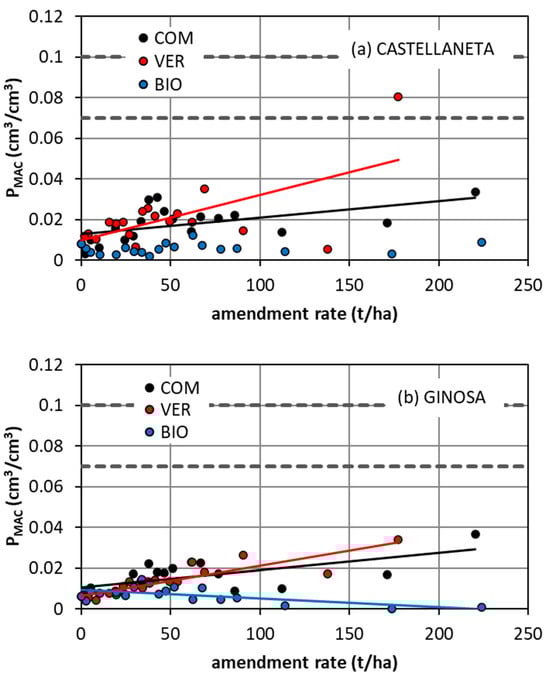
Figure 3.
Macroporosity, PMAC, against the amendment rate for the three tested amendments (COM = compost; VER = vermicompost; BIO = biochar) at (a) the Castellaneta and (b) the Ginosa field sites. For a given site, the continuous lines are the significant linear regression lines (black for COM; red for VER; blue for BIO). The dashed grey lines define the range of values inside which the soil physical quality is considered good.
At CAS, the ratio between the slopes of the θs and θ10 vs. the ar relationships was equal to 1.12 for the COM, 1.40 for the VER, and 1.01 for the BIO (Table 2). Therefore, with the COM and the VER, the θs increased more than the θ10 as the ar increased and consequently the PMAC increased. Instead, with the BIO, the slopes of the θs and θ10 vs. the ar relationships were similar, hence the PMAC did not vary significantly with the ar. At GIN, the ratio between the slopes of the θs and θ10 vs. the ar relationships was equal to 1.15 for the COM, 1.50 for the VER, and 0.96 for the BIO. Therefore, even in this case, using the COM and the VER determined an increase of the PMAC with the ar since θs increased more than θ10. Instead, the PMAC decreased with the BIO since the θ10 increased more than the θs as the ar increased.
Even for those cases in which the PMAC increased with the ar, the macroporosity always remained well below the lower limit of the optimal range. Therefore, neither a minimum amendment rate, that is an amount of amendment making the PMAC acceptable, nor obviously a maximum rate were identified for the PMAC in the range of the considered ar values.
In summary, regardless of the soil, adding the BIO did not improve soil macroporosity, instead there was some sign that this amendment induced an additional decrease of an already low value. Using the COM and the VER favored development of some new pores with a diameter > 300 μm [3], but the increase in macroporosity overall was limited and therefore the PMAC remained low even with high soil amendment rates.
4.4. Air Capacity
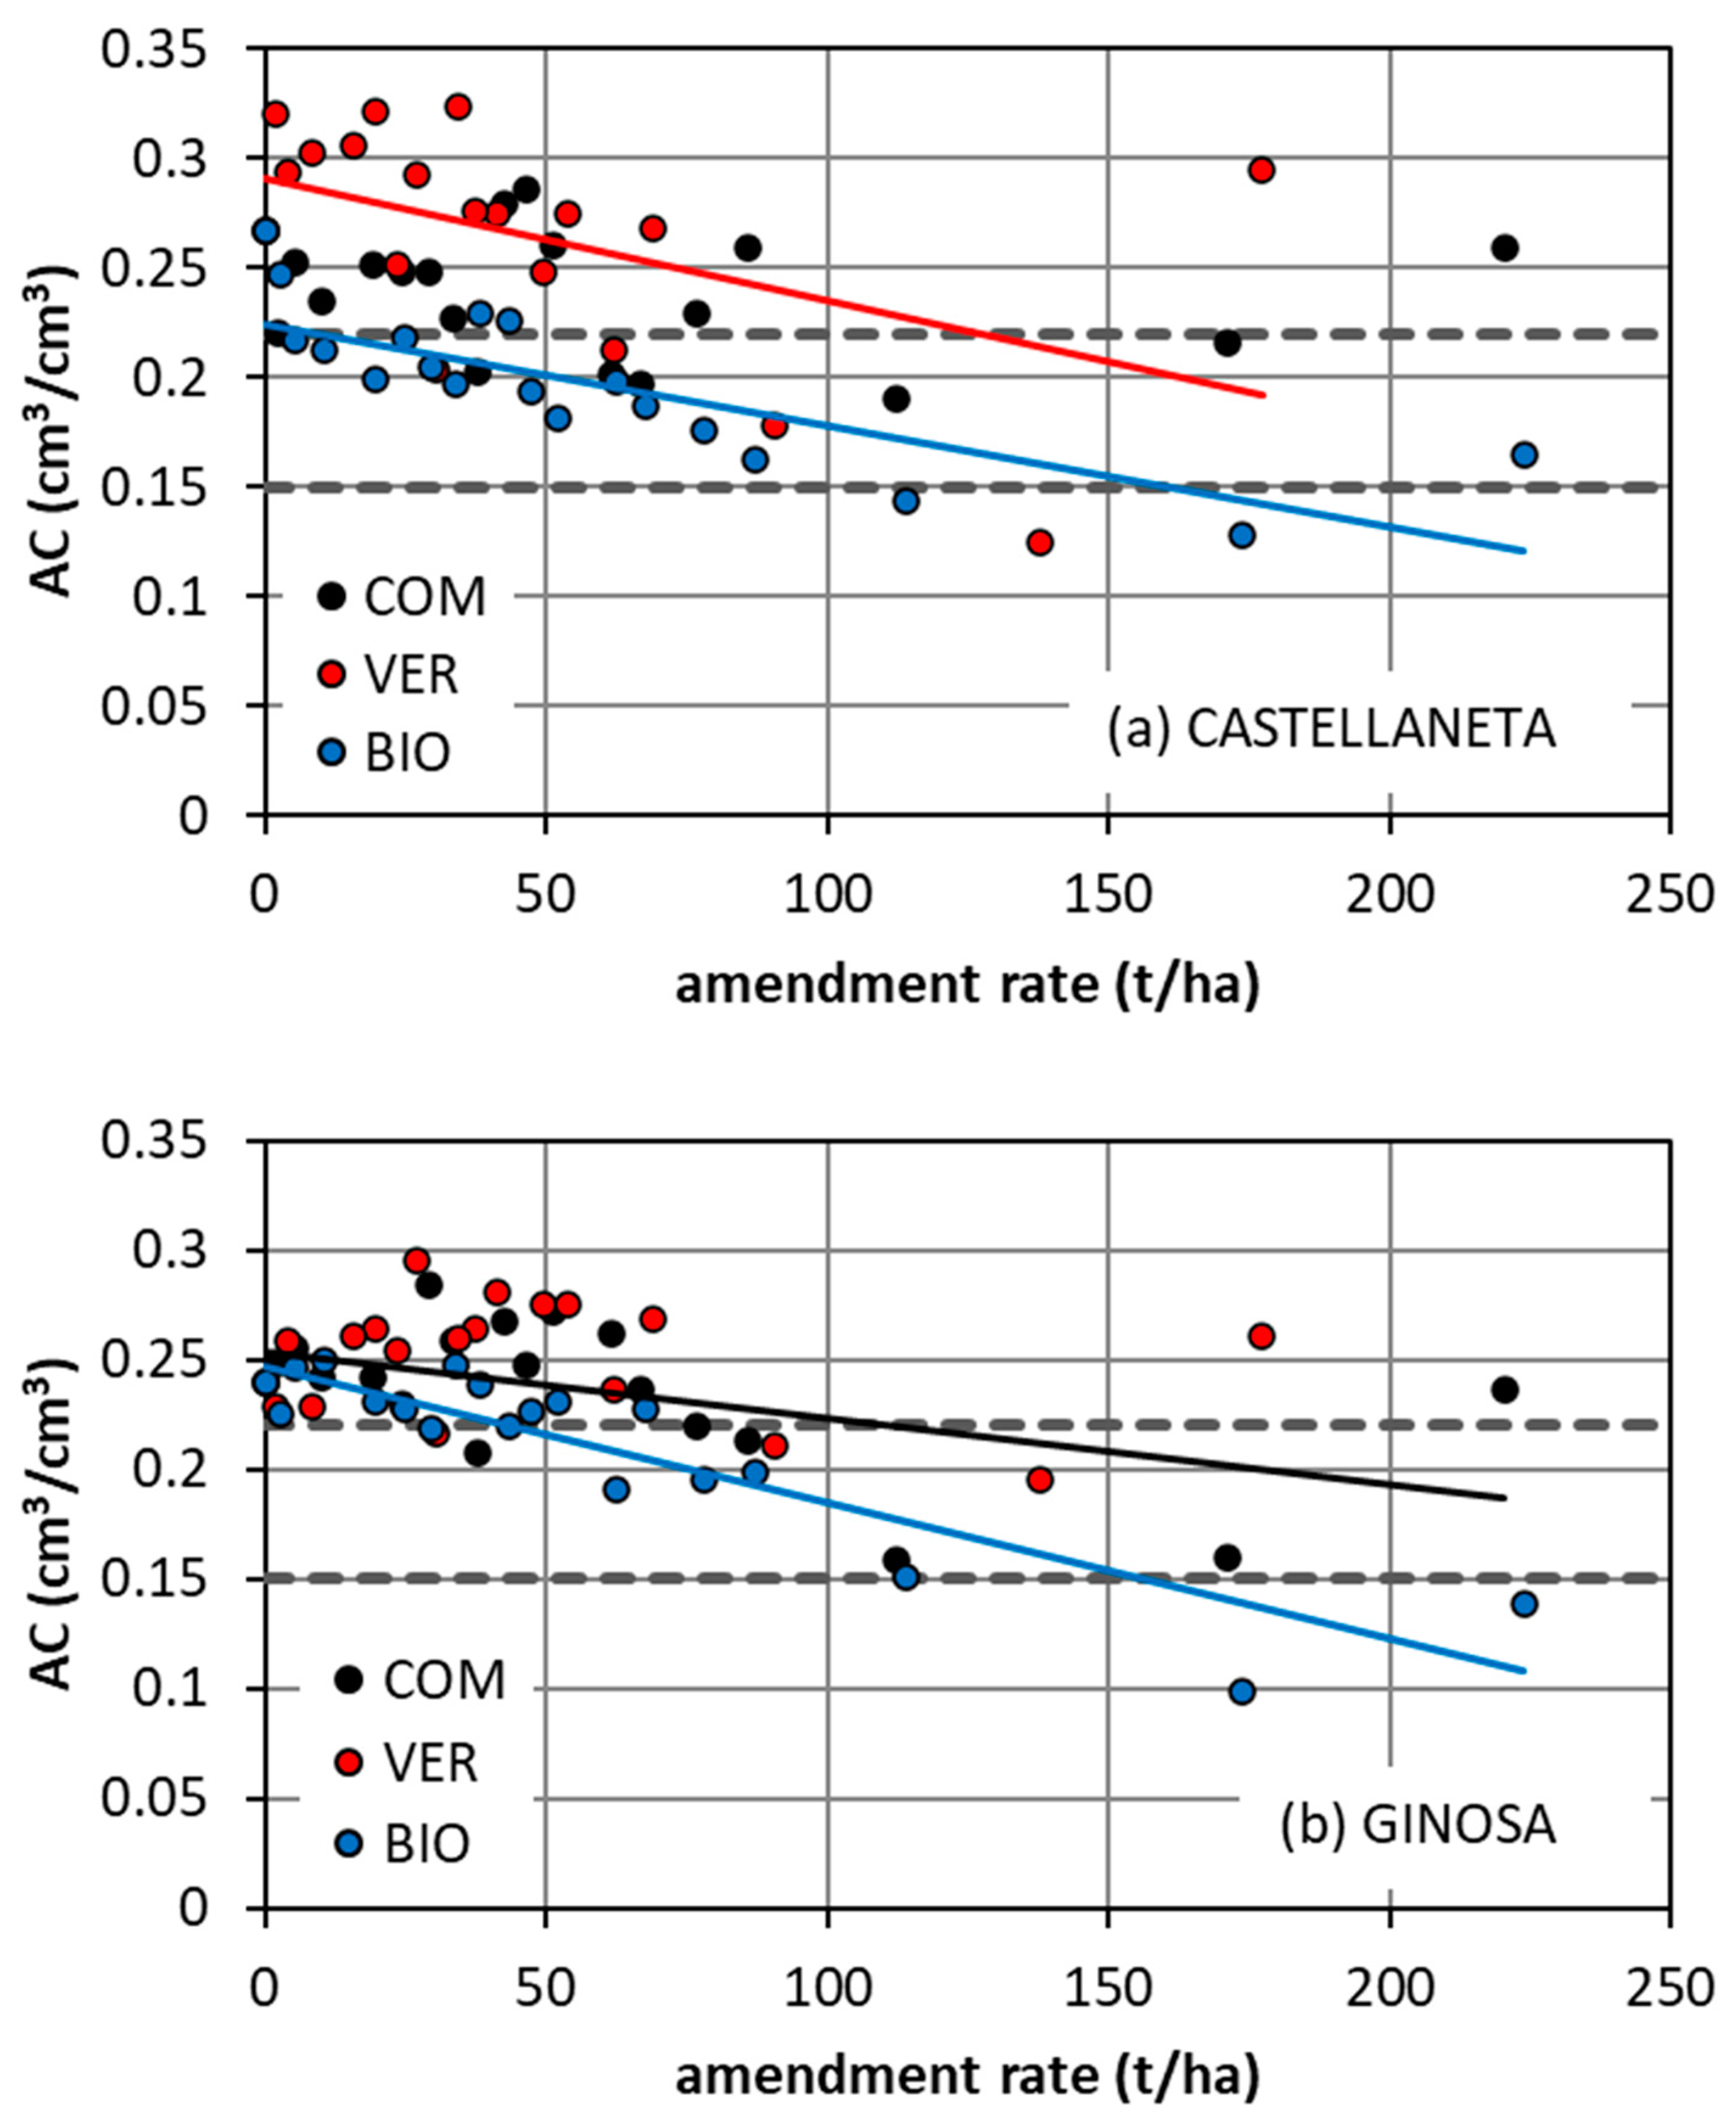
In the absence of an amendment, the CAS soil was more aerated than the GIN soil (AC = 0.267 cm3/cm3 and 0.240 cm3/cm3, respectively; Δ = +11.5%). Aeration was excessive (AC > 0.22 cm3/cm3) in both soils, hence the SPQ was poor with reference to this soil parameter. The expectation was to detect a decrease of the AC in both soils as a consequence of the treatment.
Adding the COM at CAS and the VER at GIN did not influence the AC (Figure 4 and Table 1). In the other cases (VER and BIO at CAS, and COM and BIO at GIN), the AC decreased as the ar increased, in accordance with the objective of the treatment. The statistically significant relationships were rather weak for the COM and the VER (R2 = 0.24–0.28) and stronger for the BIO (R2 = 0.62–0.80).
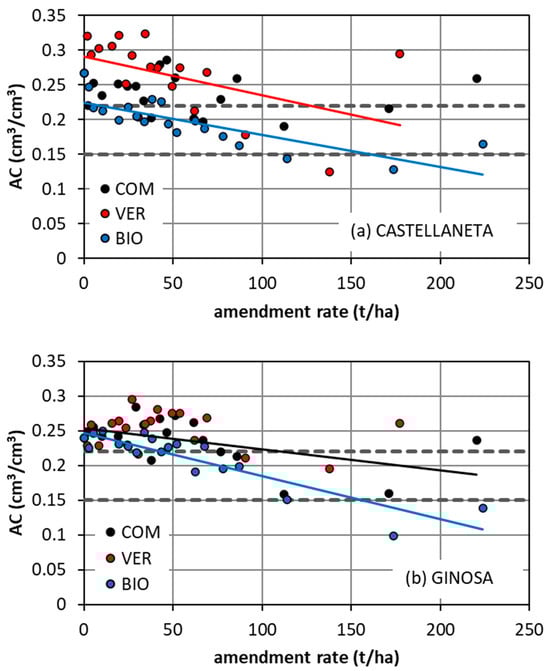
Figure 4.
Air capacity, AC, against the amendment rate for the three tested amendments (COM = compost; VER = vermicompost; BIO = biochar) at (a) the Castellaneta and (b) the Ginosa field sites. For a given site, the continuous lines are the significant linear regression lines (black for COM; red for VER; blue for BIO). The dashed grey lines define the range of values inside which the soil physical quality is considered good.
At CAS, the ratio between the slopes of the θ100 and θs vs. the ar relationships was equal to 1.10 for the COM, 1.71 for the VER, and 1.46 for the BIO (Table 2). Therefore, the θ100 increased more than the θs with all amendments. However, with the COM, the two relationships were nearly parallel, since the slopes did not differ much. Therefore, the AC remained nearly constant as the ar changed. With the other two amendments, the slope of the θ100 vs. the ar relationship was greater enough than that of the θs vs. the ar relationship as to induce a decrease of the AC. At GIN, the ratio between the slopes of the θ100 and θs vs. the ar relationships was equal to 1.47 for the COM, 1.26 for the VER, and 1.67 for the BIO. Even in this case, a relatively large difference between the two slopes induced the detected decrease of the AC that instead did not change when these slopes were similar.
In the range of the ar values considered for the experiment, using the VER at CAS and the COM at GIN allowed us only to define an armin value, that is the amount of the amendment inducing a decrease of the AC from a too high value to AC = 0.22 cm3/cm3. These armin values were equal to 118 t/ha for the VER at CAS and 111 t/ha for the COM at GIN. It was not possible to define an armax value beyond which the AC became too low (<0.15 cm3/cm3). Instead, both the armin and the armax were defined for the BIO, and they were equal to 9 t/ha and 150 t/ha, respectively, at CAS, and to 45 t/ha and 162 t/ha, respectively, at GIN. The minimum amendment rate was five times lower at the CAS than at the GIN soil even if, in the absence of an amendment, the former soil was more aerated than the latter. The maximum amendment rate was similar for the two soils.
Therefore, the COM and the VER were generally ineffective or not very effective since the AC did not change by adding the amendment, or it decreased a little, and according to the rather scattered AC vs. the ar relationship (Figure 4). Consequently, only a minimum amendment rate was detectable. The BIO induced a clearer decrease of the AC, and both a minimum and a maximum amendment rate were identified for the two soils with this amendment.
4.5. Plant Available Water Capacity
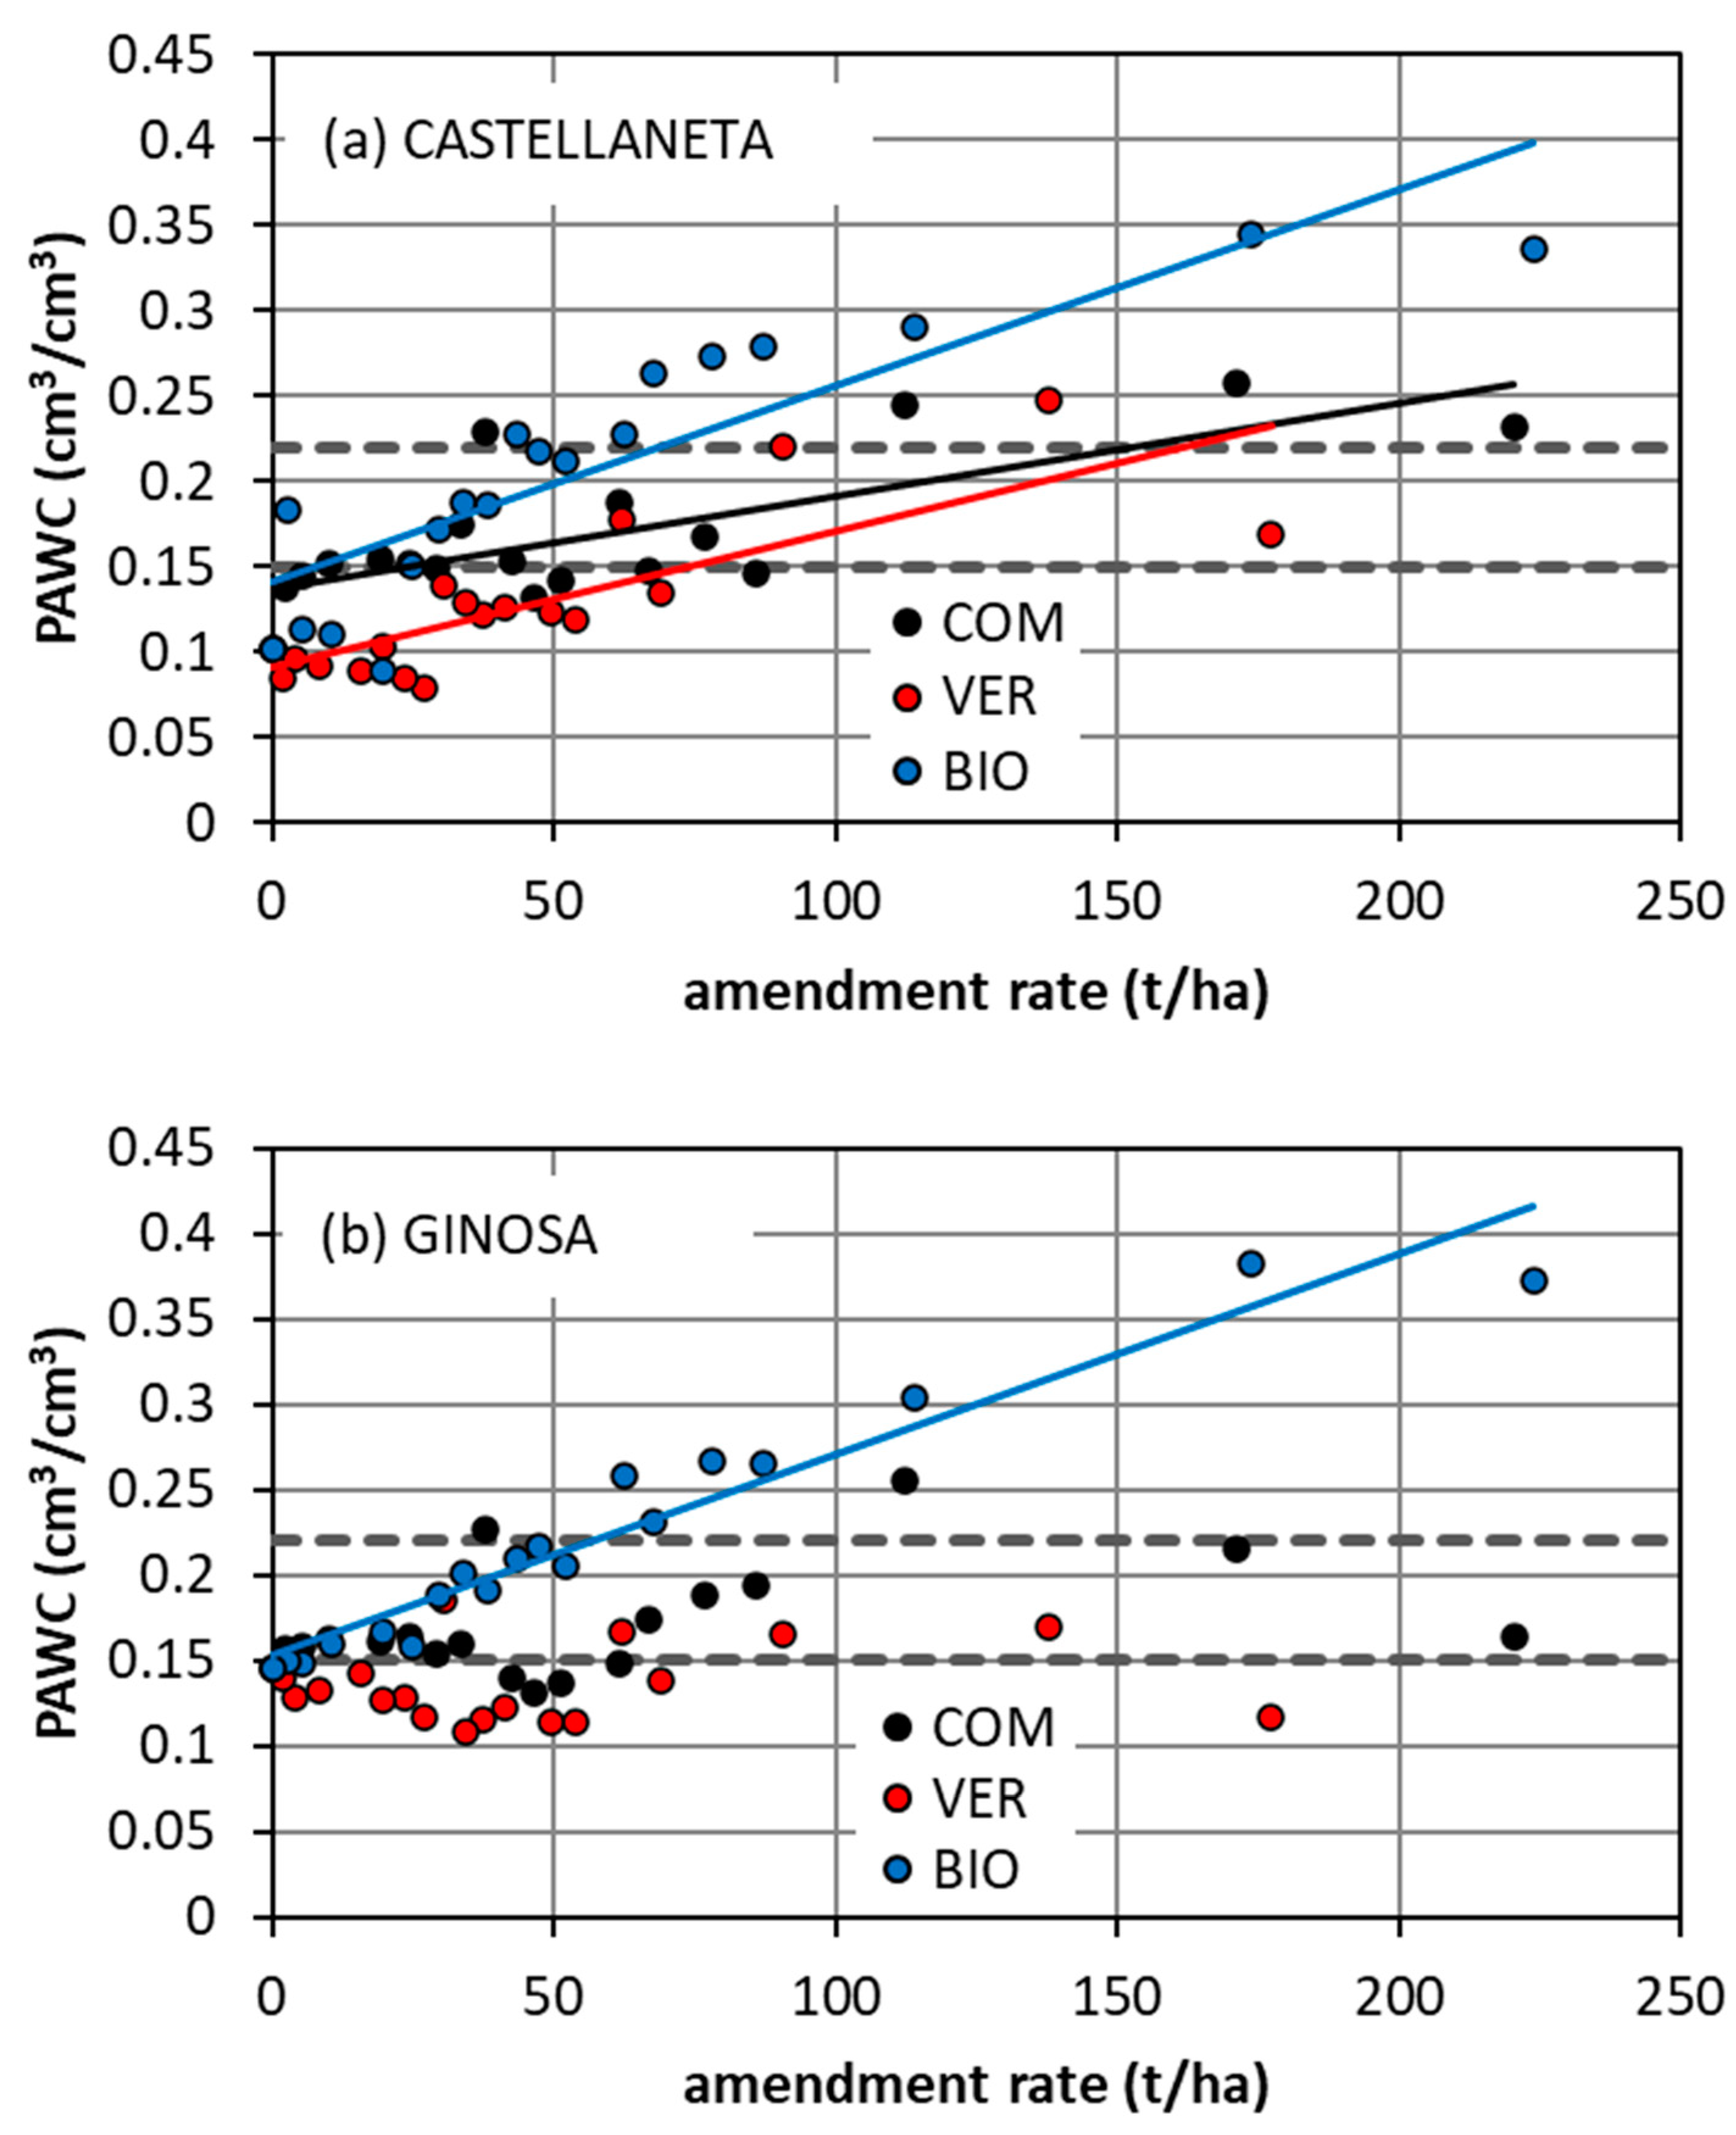
In untreated conditions, the PAWC was lower at CAS than at GIN (PAWC = 0.102 cm3/cm3 and 0.144 cm3/cm3, respectively; Δ = −29.1%). These PAWC values were lower than the minimum optimal value (PAWC = 0.15 cm3/cm3). However, the difference between the actual value and the lowest optimal value of the PAWC was appreciable only at CAS. At GIN, these two values were similar, since they only differed by 0.006 cm3/cm3, indicating that this soil had a nearly optimal PAWC value in an untreated condition. Therefore, the need to amend the soil to induce an increase of the PAWC was detected at CAS but, strictly, not at GIN. However, amending the GIN soil was necessary with reference to other SPQ parameters. Therefore, the relationship between the PAWC and the ar was also tested for this soil to verify if, in this case, adding the amendment (i) did not have any adverse effect, since the SPQ remained good, or (ii) induced a deterioration of an initially acceptable SPQ.
Adding the amendment determined an increase of the PAWC with all amendments at CAS, and only with the BIO at GIN, since the COM and the VER were ineffective in this soil (Figure 5 and Table 1).
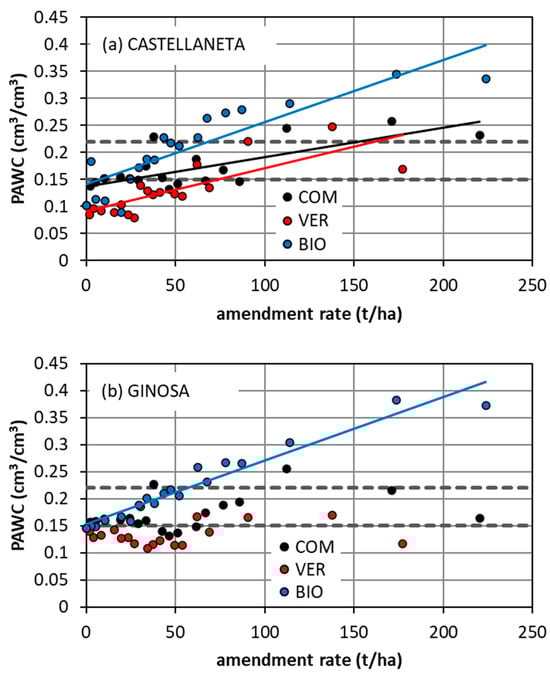
Figure 5.
Plant available water capacity, PAWC, against the amendment rate for the three tested amendments (COM = compost; VER = vermicompost; BIO = biochar) at (a) the Castellaneta and (b) the Ginosa field sites. For a given site, the continuous lines are the significant linear regression lines (black for COM; red for VER; blue for BIO). The dashed grey lines define the range of values inside which the soil physical quality is considered good.
At CAS, the ratio between the slopes of the θ100 and θ15,300 vs. the ar relationships was equal to 2.90 for the COM, 2.46 for the VER, and 4.56 for the BIO (Table 2). Therefore, the PAWC increased because, with more amendment, the θ100 increased more than the θ15,300. At GIN, the ratio between the slopes of the θ100 and θ15,300 vs. the ar relationships was equal to 1.34 for the COM, 1.13 for the VER, and 4.15 for the BIO. With both the COM and the VER, the slope of the θ100 vs. the ar relationship was only a little greater than that of the θ15,300 vs. the ar relationship. Therefore, the increase of the PAWC with the ar was low and not statistically significant. Adding the BIO determined a significant increase of the PAWC, since the θ15,300 increased a little, whereas the increase of the θ100 was appreciable.
At CAS, both a minimum (26 t/ha for the COM, 73 t/ha for the VER, and 8 t/ha for the BIO) and a maximum (166 t/ha for the COM, 161 t/ha for the VER, and 72 t/ha for the BIO) amendment rate were defined for all amendments (Table 1). The same improvement of the SPQ (from poor to good) was obtained with a relatively small amount of BIO as compared with the necessary amount of COM and VER. Even the maximum rate of BIO was appreciably lower than that required with the other two amendments. Therefore, the BIO was more effective than both the COM and the VER, since lower amendment rates were enough in the former case to determine the same effect on the PAWC. The risk of inducing a soil deterioration (from a good to a poor SPQ) associated with the use of too high ar values was greater with the BIO than with the COM and the VER.
At GIN, the COM and the VER were ineffective, whereas the BIO induced an increase of the PAWC. The intercept of the regression line was equal to 0.153 > 0.150 cm3/cm3, leading to the conclusion that, in this case, the armin was equal to 0 (not necessary treatment). An armax value was definable, and it was equal to 56 t/ha.
Therefore, amending the soil was irrelevant or it induced an increase of the PAWC, depending on both the soil and the type of amendment. In a soil with too low a PAWC value (CAS), all amendments were effective in determining an increase of the PAWC. Using the BIO appeared preferable compared with the other two amendments for at least two reasons: (i) the relationship between the PAWC and the ar was stronger (higher value of R2) and (ii) passing from a poor to a good SPQ required less BIO than COM and, particularly, VER. In a soil that, in the absence of any treatment, had a PAWC value close to the lower limit of the optimal range, adding the COM and the VER did not induce any appreciable change in the PAWC. Instead, the BIO induced an increase in the PAWC. In this case, therefore, there was the risk that an excessive amendment rate could promote an SPQ deterioration, i.e., from good to poor.
4.6. Relative Field Capacity
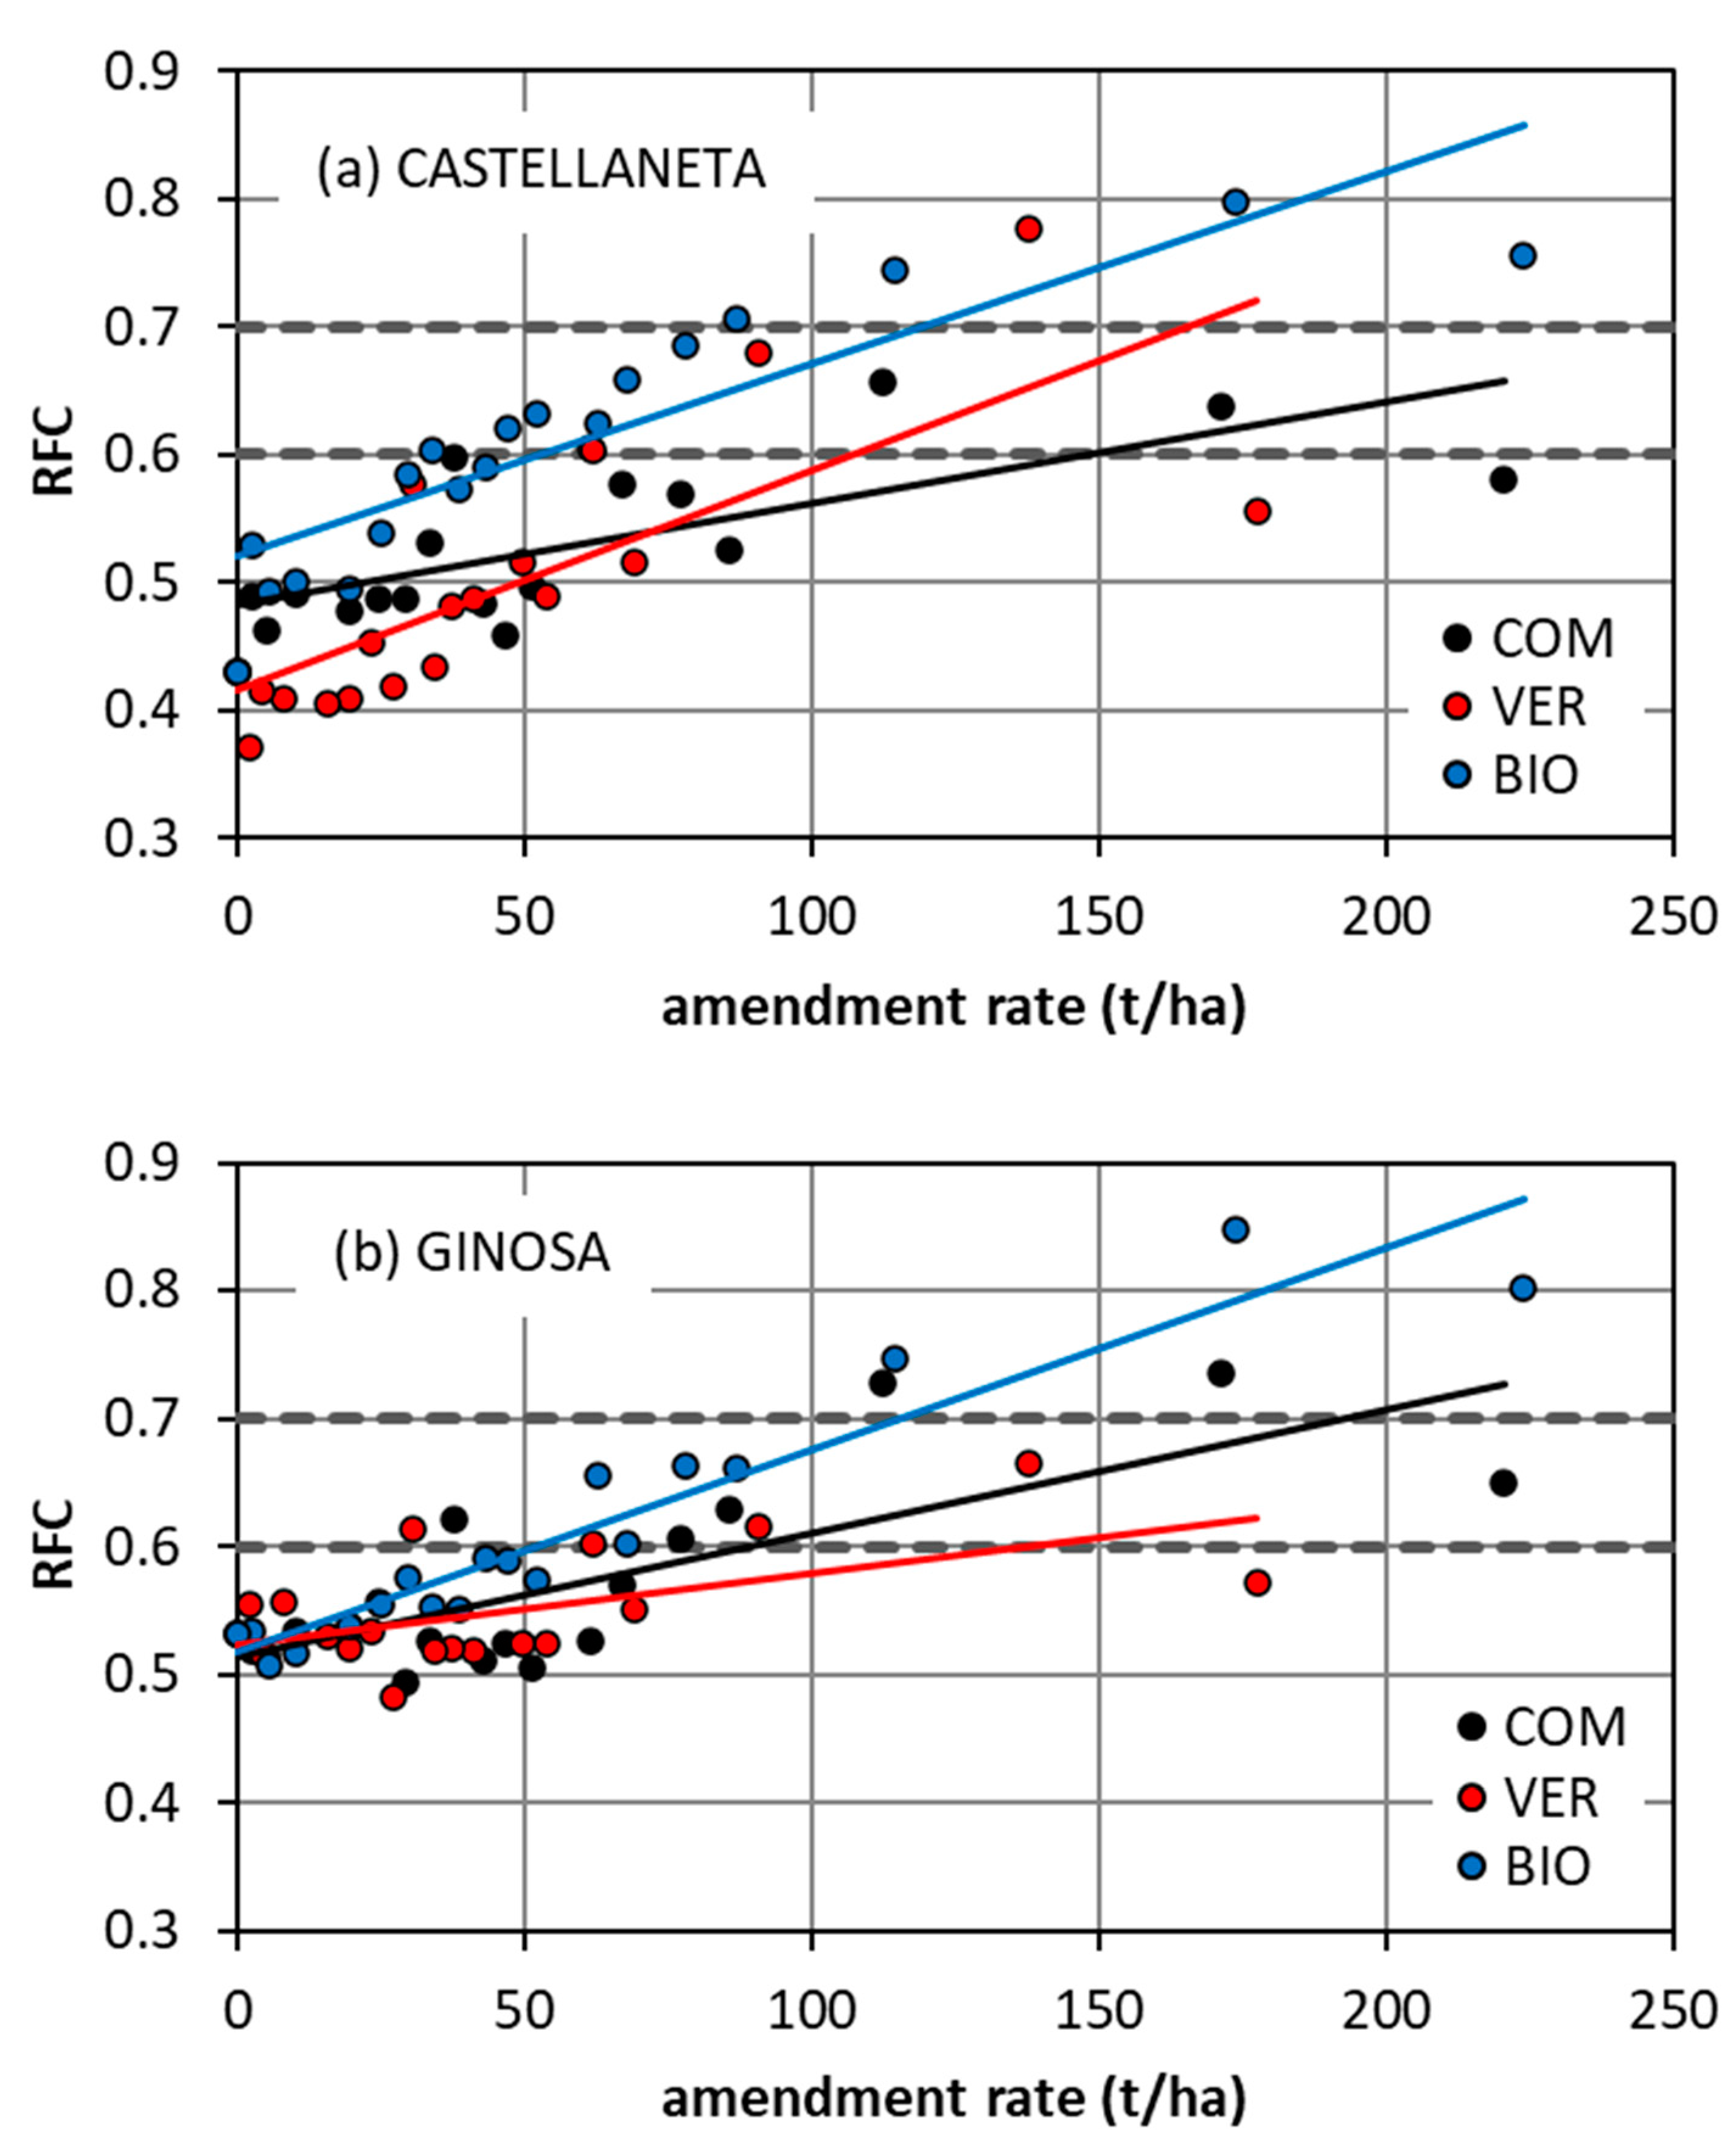
For control soil without amendments, the RFC was lower at CAS than at GIN (RFC = 0.43 and 0.53, respectively; Δ = −19.1%). In both cases, the relative field capacity was lower than the minimum optimal value (RFC = 0.6), and both soils were water-limited. Therefore, an effective treatment was expected to induce an increase of the RFC.
Adding the amendment determined an increase of the RFC in all considered cases (Figure 6) but the RFC vs. the ar relationship was stronger with the BIO (R2 = 0.79–0.91) than with the COM and the VER (R2 = 0.33–0.59) (Table 1).
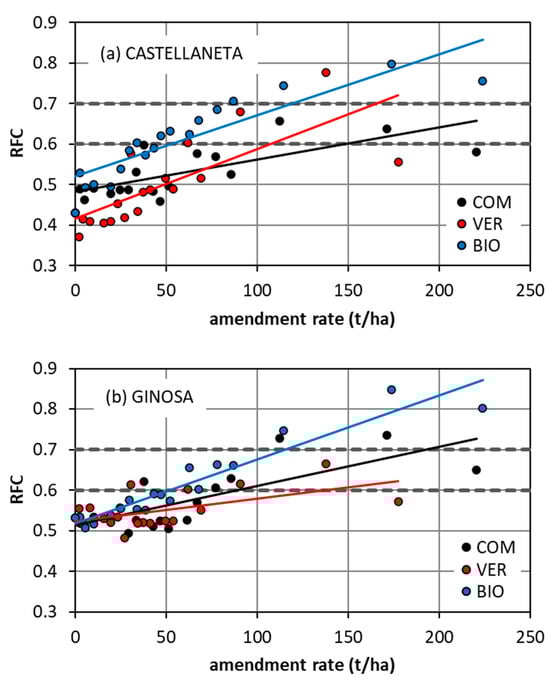
Figure 6.
Relative field capacity, RFC, against the amendment rate for the three tested amendments (COM = compost; VER = vermicompost; BIO = biochar) at (a) the Castellaneta and (b) the Ginosa field sites. For a given site, the continuous lines are the significant linear regression lines (black for COM; red for VER; blue for BIO). The dashed grey lines define the range of values inside which the soil physical quality is considered good.
Therefore, the slopes of the θ100 and θs vs. the ar relationships (Table 2) that were similar enough as not to affect the AC vs. the ar relationship were not so similar to also impede detection of the increasing RFC vs. the ar relationship that was observed for both soils with all the amendments.
A minimum amendment rate was defined for both soils and the three amendments. At CAS, the armin was equal to 146 t/ha of COM, 108 t/ha of VER, and 54 t/ha of BIO. At GIN, the armin was equal to 87 t/ha of COM, 127 t/ha of VER, and 52 t/ha of BIO. Therefore, reaching the lower limit of the optimal RFC range required a relatively small amount of BIO and higher amounts of COM and VER. More COM (by 1.7 times), less VER (by 1.2 times), and a similar amount of BIO (values differing by 1.03 times) were necessary at CAS as compared with GIN.
A maximum amendment rate was definable for the BIO in both soils, the VER at CAS, and the COM at GIN. In particular, the maximum rate of the BIO was equal to 120 t/ha at CAS and 114 t/ha at GIN. The maximum rate of the VER at CAS was 167 t/ha, and that of the COM at GIN was equal to 234 t/ha (Table 1).
Therefore, both the minimum and the maximum rate of BIO were comparable between the two soils, even if the RFC values in the absence of treatment were different. Lower amendment rates were required with the BIO than with the other two amendments. Only the BIO allowed us to define both a minimum and a maximum rate for both soils.
5. Discussion
This investigation was carried out on repacked samples of two relatively coarse-textured soils that, in the absence of any treatment, exhibited a very low macroporosity, a rather low or a nearly acceptable plant available water capacity, an insufficient ability to store water relative to the soil’s total pore volume, and an excessive aeration. Therefore, the SPQ was poor for both soils, and it was worse at CAS than at GIN, since the BD and the AC were higher and the PAWC and the RFC were lower in the former case than the latter one. Indeed, the PMAC was higher at CAS than at GIN, but the PMAC values were very low in both cases.
The experiment demonstrated that adding any of the tested amendments in these soils determined an increase of the relevant soil water content, θh, values for the SPQ assessment [3], since θs, θ10, θ100, and θ15,300 increased with the applied amendment rate. Of course, detecting increasing relationships with the ar for the considered soil water content values is not enough to draw any conclusion about the effects of the treatment on the SPQ. An improvement of the SPQ requires that the slopes of the θh vs. the ar relationships combine with each other in such a way as to effectively determine an improvement of the soil air and water storage parameters. According to this investigation, in soils similar to the tested ones, the objective of the treatment should be inducing a decrease of the AC and an increase of both the PAWC and the RFC. This result can be obtained if the θ100 increases with the ar more than both the θs and the θ15,300. To also obtain an increase of the PMAC, the θs should increase more than the θ10.
Determining the relationships between the applied amendment dose and both the θh and the SPQ parameters [16,34] appears therefore advisable in SPQ investigations, since this approach allows us to predict the variation of any SPQ parameter by varying the intensity of the treatment.
Considering linear relationships in a range of amendment rates appears practically useful, since the intercept of the fitted relationship represents the value of the considered parameter in the absence of any treatment, whereas the slope is expressive of the rate at which the parameter varies with the addition of the amendment. This approach is frequently used in the literature. For example, Ferreras et al. [39] used linear regression analysis procedures to establish the impact of VER addition on water stable aggregates. The same approach was applied by Zhou et al. [40] in an evaluation of different soil quality indices, and by Githinji [41] and Hardie et al. [42] in investigations focused on soil amendment with BIO. A limit of this choice, that should perhaps be taken into account in future research, is that the actual shape of the relationship between an SPQ parameter and an ar could contain an information, such as a stabilization of a parameter above a threshold ar value, that is not predicted by the linear approach.
Both the AC and RFC are calculated as a function of the θs and θ100 and, hence, the starting information is the same for these two indicators. Cullotta et al. [43] and Castellini et al. [44] recognized a strong correlation between the AC and RFC, and a similar result was obtained in this investigation by considering all the RFC vs. AC data points (Figure 7). This circumstance might suggest that one of the two indicators is superfluous for evaluating the SPQ. However, this investigation also showed that the agreement between the two indicators can be partial. In particular, an increasing relationship between the RFC and the ar was detected for the two soils and the three soil amendments, whereas some of the AC vs. the ar relationships were not statistically significant (Table 1). This circumstance suggested that it is indeed advisable to consider both parameters even if the information for their calculation is the same. According to the results obtained in this investigation, the most frequent result should be that amending the soil reduces soil aeration and increases the soil’s ability to retain water relative to the soil’s total pore volume. However, it can also happen that this ability increases without significantly modifying the aeration of the porous medium.
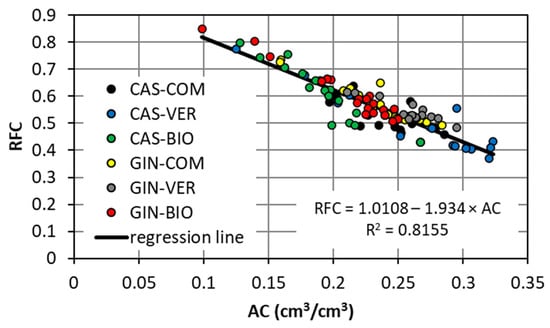
Figure 7.
Relationship between the relative field capacity, RFC, and the air capacity, AC, for the three tested amendments (COM = compost; VER = vermicompost; BIO = biochar) at Castellaneta (CAS) and Ginosa (GIN) and fitted regression line to the whole dataset.
A practically important objective of an investigation considering different amendments and amendment rates is to identify the best amendment to be used in practice and the dose to be employed. For the coarse-textured soils considered in this investigation, the treatment should induce a decrease of the BD and AC and an increase of the PMAC, PAWC, and RFC. The variations of each of these parameters depend on the current value of the parameter and the range of values that denote a good physical quality with reference to that parameter.
None of the tested amendments allowed us to achieve a good SPQ with reference to the PMAC, even if, in general, the COM and the VER increased soil macroporosity better than the BIO. The limited improvement of this SPQ parameter can be considered an expected result, since the investigation was carried out on repacked soil samples and, hence, on a structureless porous medium.
It seems therefore plausible to believe that, in such conditions, the treatment should be particularly effective with reference to the other four considered parameters, that is the BD, AC, PAWC, and RFC. With reference to these parameters, it was often possible to define a minimum amendment rate necessary to improve the soil so that its physical quality became good starting from a poor condition. However, it was also recognized that an excess of an amendment could determine the deterioration of a good SPQ. Therefore, a maximum amendment rate has to be associated with a minimum rate. For armin ≤ ar ≤ armax, the SPQ is good. A poor SPQ is associated with both ar < armin and ar > armax.
The BIO was more effective than the other two amendments in determining a decrease of the aeration and an increase of the plant available water capacity. Therefore, this investigation provided further support to previous findings about the effectiveness of this amendment in coarse-textured soils. For instance, Uzoma et al. [45] evaluated the effects of cow manure biochar on maize productivity and physico-chemical properties of a highly sandy soil (95% sand and 3.7% clay) and they found that biochar addition induced an increase of the net water use efficiency. Šurda et al. [46] reported increases in the PAWC when a sandy soil (91% sand and 1.5% clay) was amended with three different types of biochar. For a sandy soil, Baiamonte et al. [20] recognized that biochar significantly increased soil porosity and the amount of storage pores. Consequently, water retention was overall enhanced and, compared to the unamended control, plant available water increased. Finally, in a direct comparison between biochar and compost for a fine textured soil, the former proved to be more effective than compost for increasing water content at field capacity and permanent wilting point, and plant available water, mainly due to the large internal surface area and the highly porous structure [47].
According to this investigation, there were several reasons why the BIO appeared preferable to improve the SPQ as compared to both the COM and the VER: (i) there were always significant relationships between the BD, AC, PAWC, and RFC and the amendment rate. The same was not true with the other two amendments; (ii) there were higher R2 values with the former amendment (BIO) than the latter ones (COM and VER); (iii) it was possible to define both a minimum and a maximum amendment rate for the four considered parameters. This possibility was not detected with the COM and the VER; (iv) the objective of the treatment, that is passage from a poor to a good SPQ, was reached with lower amendment rates.
A practical problem that emerges is related to the fact that the dose to be applied in practice is one, but the parameters to be improved are four. In light of this investigation, it is possible to define an optimal dose of soil amendment, which is the highest value of the minimum amendment rates determined for the different parameters. The validity of this definition presupposes that this value is not higher than the lowest value of the maximum dose. From the minimum and maximum ar values reported in Table 1, an optimal dose of BIO can be defined for both soils. At CAS, this dose was equal to 54 t/ha and, at GIN, it was 52 t/ha. Therefore, the optimal dose was nearly identical with reference to the two considered sandy-loam soils. About 50 t/ha of BIO were enough to improve the physical quality of the tested soils to acceptable levels with reference to the most agronomically important air and water storage parameters. Adding more BIO, up to nearly 110–160 t/ha, can be expected not to induce a deterioration of the SPQ with reference to the BD, AC, and RFC. However, such high doses are appreciably higher than the armax with reference to the PAWC, equal to 56–72 t/ha, depending on the soil (Table 1). Therefore, according to this investigation, applying a quantity of BIO appreciably greater than the optimal dose can be expected, at first, to determine a decrease in the available water for the crop.
The results obtained in this investigation could suggest that BIO doses of 50 t/ha, corresponding to an amendment/soil ratio, ar, of nearly 9–10%, could generally be used for soils like those tested in this investigation. Evidently, this suggestion should be considered with caution and subjected to specific experimental checks. One reason is that the dosage could appear too high in practice. However, other authors have also concluded that a high dosage of BIO can be expected to improve the water retention of coarse-textured soil with limited water storage capacity [48]. Moreover, an advantage of using the BIO is that a single application of the amendment could be effective for a long time, since the BIO has a very slow decomposition rate [49].
This investigation has contributed to making a step forward with reference to one of the research needs listed by Blanco-Canqui [23], since it has allowed us to obtain an experimental information on both the minimum and the maximum doses of biochar to be used in coarse-textured soils. One of the possible limitations of the applied approach is that, for the considered SPQ parameters, the values that define the optimal conditions were taken from the literature. Although this is a very common practice, it is necessary to acquire further certainties on the validity of these optimal values in a wider range of situations, different from those considered by Reynolds et al. [3].
BIO addition effects on the SPQ parameters can generally be expected to vary with the tested soil. For example, the PAWC increased with the BIO addition in this investigation (Table 1), but the BIO may increase, decrease, or have no effect on the PAWC in other soils, such as clay-like soil [23]. The increase of the PAWC in the tested soils was a consequence of the fact that the θ100 increased with an ar more than the θ15,300 (Table 2), but in medium-textured soils the PAWC could increase with more BIO since the θ15,300 decreases rather than because the θ100 increases [50]. In such a complex context, some authors have warned that reaching general conclusions is a very complex undertaking because experiments performed by different research groups unavoidably differ by many factors, including, for example, the BIO characteristics, soil treatment procedures, and applied experimental methods [50,51]. The experimental methods applied in this investigation made use of simple methodologies and standard equipment, likely present in many, if not all, soil physics laboratories. Therefore, it should be possible for other research groups to compare the results obtained for the CAS and GIN soils with those for other coarse-textured soils and to extend the comparison to soils differing by texture without there being the risk that comparisons are made difficult and, hence, uncertain due to relevant methodological heterogeneities.
6. Conclusions
An optimal dose of an amendment can be defined for a given soil physical quality (SPQ) parameter by determining the relationship between the considered parameter and the amendment rate, and then, by comparing this relationship with the range of optimal values that the parameter should take.
This investigation was focused on two coarse-textured soils having, in the absence of any treatment, a too high dry soil bulk density and aeration and a too low macroporosity, plant available water capacity, and relative field capacity. Each tested amendment (compost, COM; vermicompost, VER; biochar, BIO) can be expected to determine an improvement in the soil’s ability to retain water with higher doses, but an acceptable improvement of the SPQ required that, with higher amendment rates, soil water content at field capacity increased more than that at both saturation and permanent wilting point.
In a condition similar to the considered one, none of the tested organic amendments should be expected to satisfactorily improve macroporosity even if this parameter appears more reactive to COM and VER addition than to the treatment with BIO. With reference to the other parameters, the BIO can be suggested to be superior as compared with both the COM and the VER. In particular, incorporating in a 5 cm layer of soil 50 t/ha of BIO (amendment/soil ratio equal to 9–10%) could be appropriate to induce a good physical quality for both soils. Depending on both the soil and the considered SPQ parameter, using the other amendments could be of little or no use at all, in the sense that the parameter varies only a little or it does not change as a consequence of the amendment addition. In other words, time and money could be spent trying to achieve a goal that is not achieved.
Evidently, other investigations should be carried out on other soils texturally similar to those considered in this experiment to verify if the suggestions given here have, or do not have, a broader validity. In any case, the results of this investigation have to be considered valid soon after the treatment with the amendment, but they do not take into account possible incubation effects. Therefore, they should be considered strictly valid for a recently tilled soil. Moreover, the optimal ranges of the considered SPQ parameters were taken from the literature, but their general validity should be further investigated. Also, the actual shape of the SPQ parameter versus the amendment rate relationship requires development. Both the experimental and the analytical methodology applied in this research can be considered rather easily reproducible. It is therefore hoped that future research will lead to some comparison with the results by other research groups.
Author Contributions
Conceptualization, M.C. and V.B.; methodology, M.C. and V.B.; formal analysis, C.B. and L.G.; investigation, L.G., C.V. and M.M.; resources, M.C.; data curation, C.B. and L.G.; writing—original draft preparation, M.C., C.B. and V.B.; writing—review and editing, M.C., C.B., R.L. and V.B.; supervision, M.C. and V.B.; funding acquisition, M.C. All authors have read and agreed to the published version of the manuscript.
Funding
This work was funded by the projects (i) “Water4AgriFood, Miglioramento delle produzioni agro-alimentari mediterranee in condizioni di carenza di risorse idriche”, (ii) GENFORAGRIS “Fenotipizzazione di GENotipi di Olivo Resistenti a Xylella fastidiosa e messa a punto di un modello di gestione AGRonomica ad elevata Sostenibilità”, funded by MASAF, D.M. n. 664538 del 28/12/2022, and (iii) “Indagine di laboratorio e di pieno campo sull’uso di Ammendanti naturali dei Suoli per strategie di Conservazione dell’Acqua e dei Nutrienti” (ASCAN)—National Research Centre for Agricultural Technologies, Codice progetto CN00000022, Bando a Cascata Spoke n. 6, CUP D13C22001330005—PRJ-1815.
Institutional Review Board Statement
Not applicable.
Informed Consent Statement
Not applicable.
Data Availability Statement
The data presented in this study are available on request from the corresponding author.
Conflicts of Interest
The authors declare no conflicts of interest.
References
- Garbowski, T.; Bar-Michalczyk, D.; Charazińska, S.; Grabowska-Polanowska, B.; Kowalczyk, A.; Lochyński, P. An overview of natural soil amendments in agriculture. Soil Tillage Res. 2023, 225, 105462. [Google Scholar] [CrossRef]
- Glossary of Soil Science Terms; Soil Science Society of America: Madison, WI, USA, 2001.
- Reynolds, W.D.; Drury, C.F.; Tan, C.S.; Fox, C.A.; Yang, X.M. Use of indicators and pore volume function characteristics to quantify soil physical quality. Geoderma 2009, 152, 252–263. [Google Scholar] [CrossRef]
- Castellini, M.; Bondì, C.; Giglio, L.; Iovino, M. Impact of vermicompost addition on water availability of differently textured soils. Heliyon 2024, 10, e35699. [Google Scholar] [CrossRef] [PubMed]
- Baghbani-Arani, A.; Modarres-Sanavy, S.A.M.; Poureisa, M. Improvement the soil physicochemical properties and fenugreek growth using zeolite and vermicompost under water deficit conditions. J. Soil Sci. Plant Nutr. 2021, 21, 1213–1228. [Google Scholar] [CrossRef]
- Alghamdi, A.G.; Aly, A.A.; Al-Omran, A.M.; Alkhasha, A. Impact of biochar, bentonite, and compost on physical and chemical characteristics of a sandy soil. Arab. J. Geosci. 2018, 11, 670. [Google Scholar] [CrossRef]
- Baghbani-Arani, A.; Jami, M.G.; Namdari, A.; Karami Borz-Abad, R. Influence of Irrigation Regimes, Zeolite, Inorganic and Organic Manures on Water Use Efficiency, Soil Fertility and Yield of Sunflower in a Sandy Soil. Commun. Soil Sci. Plant Anal. 2020, 51, 711–725. [Google Scholar] [CrossRef]
- Ibrahim, A.; Marie, H.A.M.E.; Elfaki, J. Impact of biochar and compost on aggregate stability in loamy sand soil. Agric. Res. J. 2021, 58, 34–44. [Google Scholar] [CrossRef]
- Mengistu, T.; Gebrekidan, H.; Kibret, K.; Woldetsadik, K.; Shimelis, B.; Yadav, H. The integrated use of excreta-based vermicompost and inorganic NP fertilizer on tomato (Solanum lycopersicum L.) fruit yield, quality and soil fertility. Int. J. Recycl. Org. Waste Agric. 2017, 6, 63–77. [Google Scholar] [CrossRef]
- Rivier, P.A.; Jamniczky, D.; Nemes, A.; Makó, A.; Barna, G.; Uzinger, G.; Rékási, M.; Farkas, C. Short-term effects of compost amendments to soil on soil structure, hydraulic properties, and water regime. J. Hydrol. Hydromech. 2022, 70, 74–88. [Google Scholar] [CrossRef]
- Das, D.; Abbhishek, K.; Banik, P.; Bhattacharya, P. A valorisation approach in recycling of organic wastes using low-grade rock minerals and microbial culture through vermicomposting. Environ. Chall. 2021, 5, 100225. [Google Scholar] [CrossRef]
- Soria, R.; Rodríguez-Berbel, N.; Sánchez-Cañete, E.P.; Villafuerte, A.B.; Ortega, R.; Miralles, I. Organic amendments from recycled waste promote short-term carbon sequestration of restored soils in drylands. J. Environ. Manag. 2023, 327, 116873. [Google Scholar] [CrossRef]
- Magdoff, F.; Weil, R.R. (Eds.) Soil Organic Matter in Sustainable Agriculture, 1st ed.; CRC Press: Boca Raton, FL, USA, 2004. [Google Scholar] [CrossRef]
- Ampim, P.A.Y.; Sloan, J.J.; Cabrera, R.I.; Harp, D.A.; Jaber, F.H. Green Roof Growing Substrates: Types, Ingredients, Composition and Properties. J. Environ. Hort. 2010, 28, 244–252. [Google Scholar] [CrossRef]
- Dong, L.; Zhang, W.; Xiong, Y.; Zou, J.; Huang, Q.; Xu, X.; Ren, P.; Huang, G. Impact of short-term organic amendments incorporation on soil structure and hydrology in semiarid agricultural lands. Int. Soil Water Conserv. Res. 2022, 10, 457–469. [Google Scholar] [CrossRef]
- Bondì, C.; Castellini, M.; Iovino, M. Compost amendment impact on soil physical quality estimated from hysteretic water retention curve. Water 2022, 14, 1002. [Google Scholar] [CrossRef]
- Głąb, T.; Żabiński, A.; Sadowska, U.; Gondek, K.; Kopeć, M.; Mierzwa-Hersztek, M.; Tabor, S.; Stanek-Tarkowska, J. Fertilization effects of compost produced from maize, sewage sludge and biochar on soil water retention and chemical properties. Soil Tillage Res. 2020, 197, 104493. [Google Scholar] [CrossRef]
- Aksakal, E.L.; Sari, S.; Angin, I. Effects of vermicompost application on soil aggregation and certain physical properties. Land Degrad. Develop. 2016, 27, 983–995. [Google Scholar] [CrossRef]
- Ouyang, L.; Wang, F.; Tang, J.; Yu, L.; Zhang, R. Effects of biochar amendment on soil aggregates and hydraulic properties. J. Soil Sci. Plant Nutr. 2013, 13, 991–1002. [Google Scholar] [CrossRef]
- Baiamonte, G.; Crescimanno, G.; Parrino, F.; De Pasquale, C. Effect of biochar on the physical and structural properties of a desert sandy soil. Catena 2019, 175, 294–303. [Google Scholar] [CrossRef]
- Kranz, C.N.; McLaughlin, R.A.; Johnson, A.; Miller, G.; Heitman, J.L. The effects of compost incorporation on soil physical properties in urban soils—A concise review. J. Environ. Manag. 2020, 261, 110209. [Google Scholar] [CrossRef]
- Stellacci, A.M.; Castellini, M.; Diacono, M.; Rossi, R.; Gattullo, C.E. Assessment of Soil Quality under Different Soil Management Strategies: Combined Use of Statistical Approaches to Select the Most Informative Soil Physico-Chemical Indicators. Appl. Sci. 2021, 11, 5099. [Google Scholar] [CrossRef]
- Blanco-Canqui, H. Biochar and soil physical properties. Soil Sci. Soc. Am. J. 2017, 81, 687–711. [Google Scholar] [CrossRef]
- Topp, G.C.; Reynolds, W.D.; Cook, F.J.; Kirby, J.M.; Carter, M.R. Physical attributes of soil quality. In Soil Quality for Crop Production and Ecosystem Health; Gregorich, E.G., Carter, M.R., Eds.; Development in Soil Science; Elsevier: New York, NY, USA, 1997; Volume 25, pp. 21–58. [Google Scholar] [CrossRef]
- Reynolds, W.D.; Bowman, B.T.; Drury, C.F.; Tan, C.S.; Lu, X. Indicators of good soil physical quality: Density and storage parameters. Geoderma 2002, 110, 131–146. [Google Scholar] [CrossRef]
- Reynolds, W.D.; Drury, C.F.; Yang, X.M.; Fox, C.A.; Tan, C.S.; Zhang, T.Q. Land management effects on the near-surface physical quality of a clay loam soil. Soil Tillage Res. 2007, 96, 316–330. [Google Scholar] [CrossRef]
- Reynolds, W.D.; Drury, C.F.; Tan, C.S.; Yang, X.M. Temporal effects of food waste compost on soil physical quality and productivity. Can. J. Soil Sci. 2015, 95, 251–268. [Google Scholar] [CrossRef]
- Leogrande, R.; Vitti, C.; Castellini, M.; Garofalo, P.; Samarelli, I.; Lacolla, G.; Montesano, F.F.; Spagnuolo, M.; Mastrangelo, M.; Stellacci, A.M. Residual effect of compost and biochar amendment on soil chemical, biological, and physical properties and durum wheat response. Agronomy 2024, 14, 749. [Google Scholar] [CrossRef]
- Ghiberto, P.J.; Imhoff, S.C.; Libardi, P.L.; Da Silva, A.P.; Tormena, C.A.; Pilatti, M.A. Soil physical quality of Mollisols quantified by a global index. Sci. Agric. 2015, 72, 167–174. [Google Scholar]
- He, Y.; Song, X.; Li, X.; Gao, Y.; Yang, J.; Chen, J.; Chen, J.; Cai, C. Spatial Properties of Soil Physical Quality Index S in Black Soil Croplands under Permanent Gully Erosion. Land 2023, 12, 1641. [Google Scholar] [CrossRef]
- Dexter, A.R. Soil physical quality—Part I. Theory, effects of soil texture, density, and organic matter, and effects on root growth. Geoderma 2004, 120, 201–214. [Google Scholar]
- Gubiani, P.I.; do Santos, V.P.; Mulazzani, R.P.; Sanches Suzuki, L.E.A.; Drescher, M.S.; Zwirtes, A.L.; Koppe, E.; Pereira, C.A.; Mentges, L.R.; Galarza, R.d.M.; et al. Relationship between Plant-Available Water and Soil Compaction in Brazilian Soils. Sustainability 2024, 16, 6951. [Google Scholar] [CrossRef]
- Dane, J.H.; Hopmans, J.W. 3.3.2.2 Hanging water column. In Methods of Soil Analysis, Part 4, Physical Methods, Number 5 in the Soil Science Society of America Book Series; Dane, J.H., Topp, G.C., Eds.; Soil Science Society of America, Inc.: Madison, WI, USA, 2002; pp. 680–683. [Google Scholar]
- Bondì, C.; Castellini, M.; Iovino, M. Temporal variability of physical quality of a sandy loam soil amended with compost. Biologia 2024. [Google Scholar] [CrossRef]
- Dane, J.H.; Hopmans, J.W. 3.3.2.4 Pressure plate extractor. In Methods of Soil Analysis, Part 4, Physical Methods, Number 5 in the Soil Science Society of America Book Series; Dane, J.H., Topp, G.C., Eds.; Soil Science Society of America, Inc.: Madison, WI, USA, 2002; pp. 688–690. [Google Scholar]
- van Genuchten, M.T. A closed form equation for predicting the hydraulic conductivity of unsaturated soils. Soil Sci. Soc. Am. J. 1980, 44, 892–898. [Google Scholar] [CrossRef]
- van Genuchten, M.T.; Leij, F.J.; Yates, S.R. The RETC Code for Quantifying the Hydraulic Functions of Unsaturated Soils; EPA/600/2-91/065; U.S. Salinity Laboratory, U.S. Department of Agriculture, Agricultural Research Service: Riverside, CA, USA, 1991.
- Glantz, S.A. Primer of Biostatistics, 7th ed.; The McGraw-Hill Companies: New York, NY, USA, 2012. [Google Scholar]
- Ferreras, L.; Gómez, E.; Toresani, S.; Firpo, I.; Rotondo, R. Effect of organic amendments on some physical, chemical and biological properties in a horticultural soil. Bioresour. Technol. 2006, 97, 635–640. [Google Scholar] [PubMed]
- Zhou, M.; Xiao, Y.; Li, Y.; Zhang, X.; Wang, G.; Jin, J.; Ding, G.; Liu, X. Soil quality index evaluation model in responses to six-year fertilization practices in Mollisols. Arch. Agron. Soil Sci. 2022, 68, 180–194. [Google Scholar]
- Githinji, L. Effect of biochar application rate on soil physical and hydraulic properties of a sandy loam. Arch. Agron. Soil Sci. 2014, 60, 457–470. [Google Scholar]
- Hardie, M.; Clothier, B.; Bound, S.; Oliver, G.; Close, D. Does biochar influence soil physical properties and soil water availability? Plant Soil 2014, 376, 347–361. [Google Scholar]
- Cullotta, S.; Bagarello, V.; Baiamonte, G.; Gugliuzza, G.; Iovino, M.; La Mela Veca, D.S.; Maetzke, F.; Palmeri, V.; Sferlazza, S. Comparing Different Methods to Determine Soil Physical Quality in a Mediterranean Forest and Pasture Land. Soil Sci. Soc. Am. J. 2016, 80, 1038–1056. [Google Scholar] [CrossRef]
- Castellini, M.; Stellacci, A.M.; Barca, E.; Iovino, M. Application of multivariate analysis techniques for selecting soil physical quality indicators: A case study in long-term field experiments in Apulia (southern Italy). Soil Sci. Soc. Am. J. 2019, 83, 707–720. [Google Scholar] [CrossRef]
- Uzoma, K.C.; Inoue, M.; Andry, H.; Fujimaki, H.; Zahoor, A.; Nishihara, E. Effect of cow manure biochar on maize productivity under sandy soil condition. Soil Use Manag. 2011, 27, 205–212. [Google Scholar] [CrossRef]
- Šurda, P.; Vitková, J.; Lichner, L.; Botková, N.; Toková, L. Effect of wettable and hydrophobic biochar addition on properties of sandy soil. Biologia 2024. [Google Scholar] [CrossRef]
- Ghorbani, M.; Neugschwandtner, R.W.; Konvalina, P.; Asadi, H.; Kopecký, M.; Amirahmadi, E. Comparative effects of biochar and compost applications on water holding capacity and crop yield of rice under evaporation stress: A two-years field study. Paddy Water Environ. 2023, 21, 47–58. [Google Scholar]
- Wang, D.; Li, C.; Parikh, S.J.; Scow, K.M. Impact of biochar on water retention of two agricultural soils—A multi-scale analysis. Geoderma 2019, 340, 185–191. [Google Scholar] [CrossRef]
- Kuzyakov, Y.; Bogomolova, I.; Glaser, B. Biochar stability in soil: Decomposition during eight years and transformation as assessed by compound-specific 14C analysis. Soil Biol. Biochem. 2014, 70, 229–236. [Google Scholar] [CrossRef]
- Wei, B.; Peng, Y.; Lin, L.; Zhang, D.; Ma, L.; Jiang, L.; Li, Y.; He, T.; Wang, Z. Drivers of biochar-mediated improvement of soil water retention capacity based on soil texture: A meta-analysis. Geoderma 2023, 437, 116591. [Google Scholar] [CrossRef]
- Razzaghi, F.; Bilson Obour, P.; Arthur, E. Does biochar improve soil water retention? A systematic review and meta analysis. Geoderma 2020, 361, 114055. [Google Scholar] [CrossRef]

Disclaimer/Publisher’s Note: The statements, opinions and data contained in all publications are solely those of the individual author(s) and contributor(s) and not of MDPI and/or the editor(s). MDPI and/or the editor(s) disclaim responsibility for any injury to people or property resulting from any ideas, methods, instructions or products referred to in the content. |
© 2025 by the authors. Licensee MDPI, Basel, Switzerland. This article is an open access article distributed under the terms and conditions of the Creative Commons Attribution (CC BY) license (https://creativecommons.org/licenses/by/4.0/).