Article

The Performance Study of a Novel Vertical Variable Stiffness Disc Spring Seismic Isolation Bearing

1
Research Center of Space Structures, Guizhou University, Guiyang 550025, China
2
Guizhou Province Key Laboratory of Green Building and Intelligent Construction, Guiyang 550025, China
*
Author to whom correspondence should be addressed.
Appl. Sci. 2025, 15(6), 3380; https://doi.org/10.3390/app15063380
Submission received: 10 February 2025 / Revised: 12 March 2025 / Accepted: 18 March 2025 / Published: 19 March 2025

Abstract

:
To effectively adapt to seismic actions in complex earthquake environments and enhance the seismic isolation performance of building structures, this paper divides the disk spring group of traditional disk spring isolation bearings into an upper disk spring group and a lower disk spring group. By arranging different stacking layers, an improved Vertical Variable Stiffness Disk Spring Isolation (VVSDSI) bearing is proposed. The operational performance of this bearing is thoroughly investigated through a theoretical analysis, experimental testing, and numerical simulations. The research results demonstrate the following: (1) under ultimate load conditions, the working stages of the VVSDSI bearing can be divided into two phases. During the isolation phase, the vertical stiffness of the bearing is relatively low, with a value of 11.14 kN/mm, whereas in the protection phase, the vertical stiffness increases significantly to 35.34 kN/mm. (2) During the isolation phase, the preloading displacement exhibits a positive correlation with equivalent stiffness and an equivalent damping ratio, while the loading amplitude shows a negative correlation with these parameters. (3) The theoretical hysteresis model prediction value and numerical model simulation value of the VVSDSI bearing are in good agreement with the measured data, with the maximum errors of the peak load being 6.78% and 10.07%, respectively, which can accurately simulate the mechanical properties of the bearing. Therefore, this research result can provide a theoretical basis and experimental support for the design of vertical seismic isolation systems.

1. Introduction

Structural isolation technology reduces seismic energy input into the upper structure by establishing an isolation layer to prolong the natural vibration period of structures, thereby minimizing earthquake-induced damage to buildings. It serves as an effective means of enhancing structural seismic resistance [1,2,3]. Through investigations of destructive seismic events, such as the 1986 Kalamata Earthquake [4], 1994 Northridge Earthquake [5], 1999 Taiwan Chi-Chi Earthquake [6,7], and 2013 Lushan Earthquake [8], researchers have observed that the energy from vertical ground motion in seismic fault zones can sometimes exceed that of horizontal motion, leading to numerous column failures and structural damage. Consequently, scholars have conducted various explorations and proposed the concept of three-dimensional (3D) isolation [9,10,11] to effectively mitigate structural damage caused by vertical seismic actions.
To investigate the effects of three-dimensional seismic isolation on structures, Liang et al. [12,13] conducted experimental studies on a three-dimensional isolation system composed of laminated lead rubber bearings (LRBs) and vertical ring spring bearings (RSBs) connected in series. They further analyzed the vibration isolation performance of this system under three-dimensional ground motions using a six-story structure. Han et al. [14] developed a novel air spring-friction pendulum system (FPS) combining horizontal FPS isolators with vertical air spring isolators and evaluated its seismic isolation effectiveness for truss structures under different earthquake excitations. Cesmeci et al. [15] proposed a bilinear liquid spring (BLS)-magnetorheological fluid damper (CMRD) system for vertical vibration isolation, experimentally investigating its mechanical behavior. Xu et al. [16,17] performed experimental studies on the vertical isolation performance of a new multi-dimensional earthquake isolation and mitigation device (MEIMD), demonstrating its excellent seismic isolation capabilities.
Laminated disc springs have garnered widespread attention from researchers due to their simple structure, controllable stiffness, and strong energy-dissipation capacity through friction, leading to their application in vertical seismic isolation devices for building structures [18,19,20]. Li et al. [21] combined lead-core rubber bearings with disc springs to create a three-dimensional multi-functional seismic isolation bearing installed at building foundations. They investigated the isolation effectiveness through a time–history analysis. Wang et al. [22] conducted theoretical and experimental analyses to study the mechanical properties of composite disc spring vibration isolators (CDSVIs). Zhao et al. [23] performed shaking table tests using different seismic waves on 1:2 scale fixed-base models and DSB vertical seismic isolation models, demonstrating that disc spring bearings can effectively reduce the impact of vertical seismic forces on superstructures. Currently, three-dimensional isolation systems combining disc springs with rubber have been proven as an effective three-dimensional seismic isolation method [24,25], being applied in structures, such as bridges and nuclear power plants [26]. However, traditional disc spring isolation bearings face challenges in simultaneously meeting the requirements of seismic isolation performance under minor earthquakes and controlling mechanical responses and deformations during major earthquakes due to their constant stiffness characteristics.
Variable stiffness isolation technology has attracted significant attention due to its ability to adapt to seismic excitations of different intensities. However, current research predominantly focuses on horizontal stiffness adjustments, while exploration into the active control of vertical stiffness remains in its nascent stage. To address low-frequency vibration isolation for critical equipment, Song et al. [27] proposed a vertical variable stiffness isolation bearing incorporating articulated springs and four-bar linkage mechanisms. Meanwhile, Chen et al. [28,29] designed a vertical isolation variable stiffness (VIVS) device consisting of multiple hydraulic cylinders, which can provide variable vertical stiffness at different loading stages to suppress large displacements under intense seismic motions. Regrettably, the high cost of this device hinders its widespread application.
Based on the aforementioned research background, this paper proposes an improved Vertically Variable Stiffness Disc Spring Isolator (VVSDSI) and conducts systematic investigations into its design theory and mechanical behavior, as illustrated in Figure 1. First, the structural configuration and operational characteristics of the VVSDSI isolator are elucidated, accompanied by the establishment of its theoretical hysteretic model. Subsequently, experimental investigations are performed to examine the load-displacement curve characteristics of the isolator under ultimate loading conditions. Furthermore, parametric analyses are conducted to evaluate the influences of the preloading displacement and loading amplitude on the hysteretic curves, equivalent stiffness, and equivalent damping ratio of the isolator. Finally, a numerical model of the VVSDSI isolator is developed using ABAQUS v.2023 finite element software, with its validity rigorously validated against experimental results.

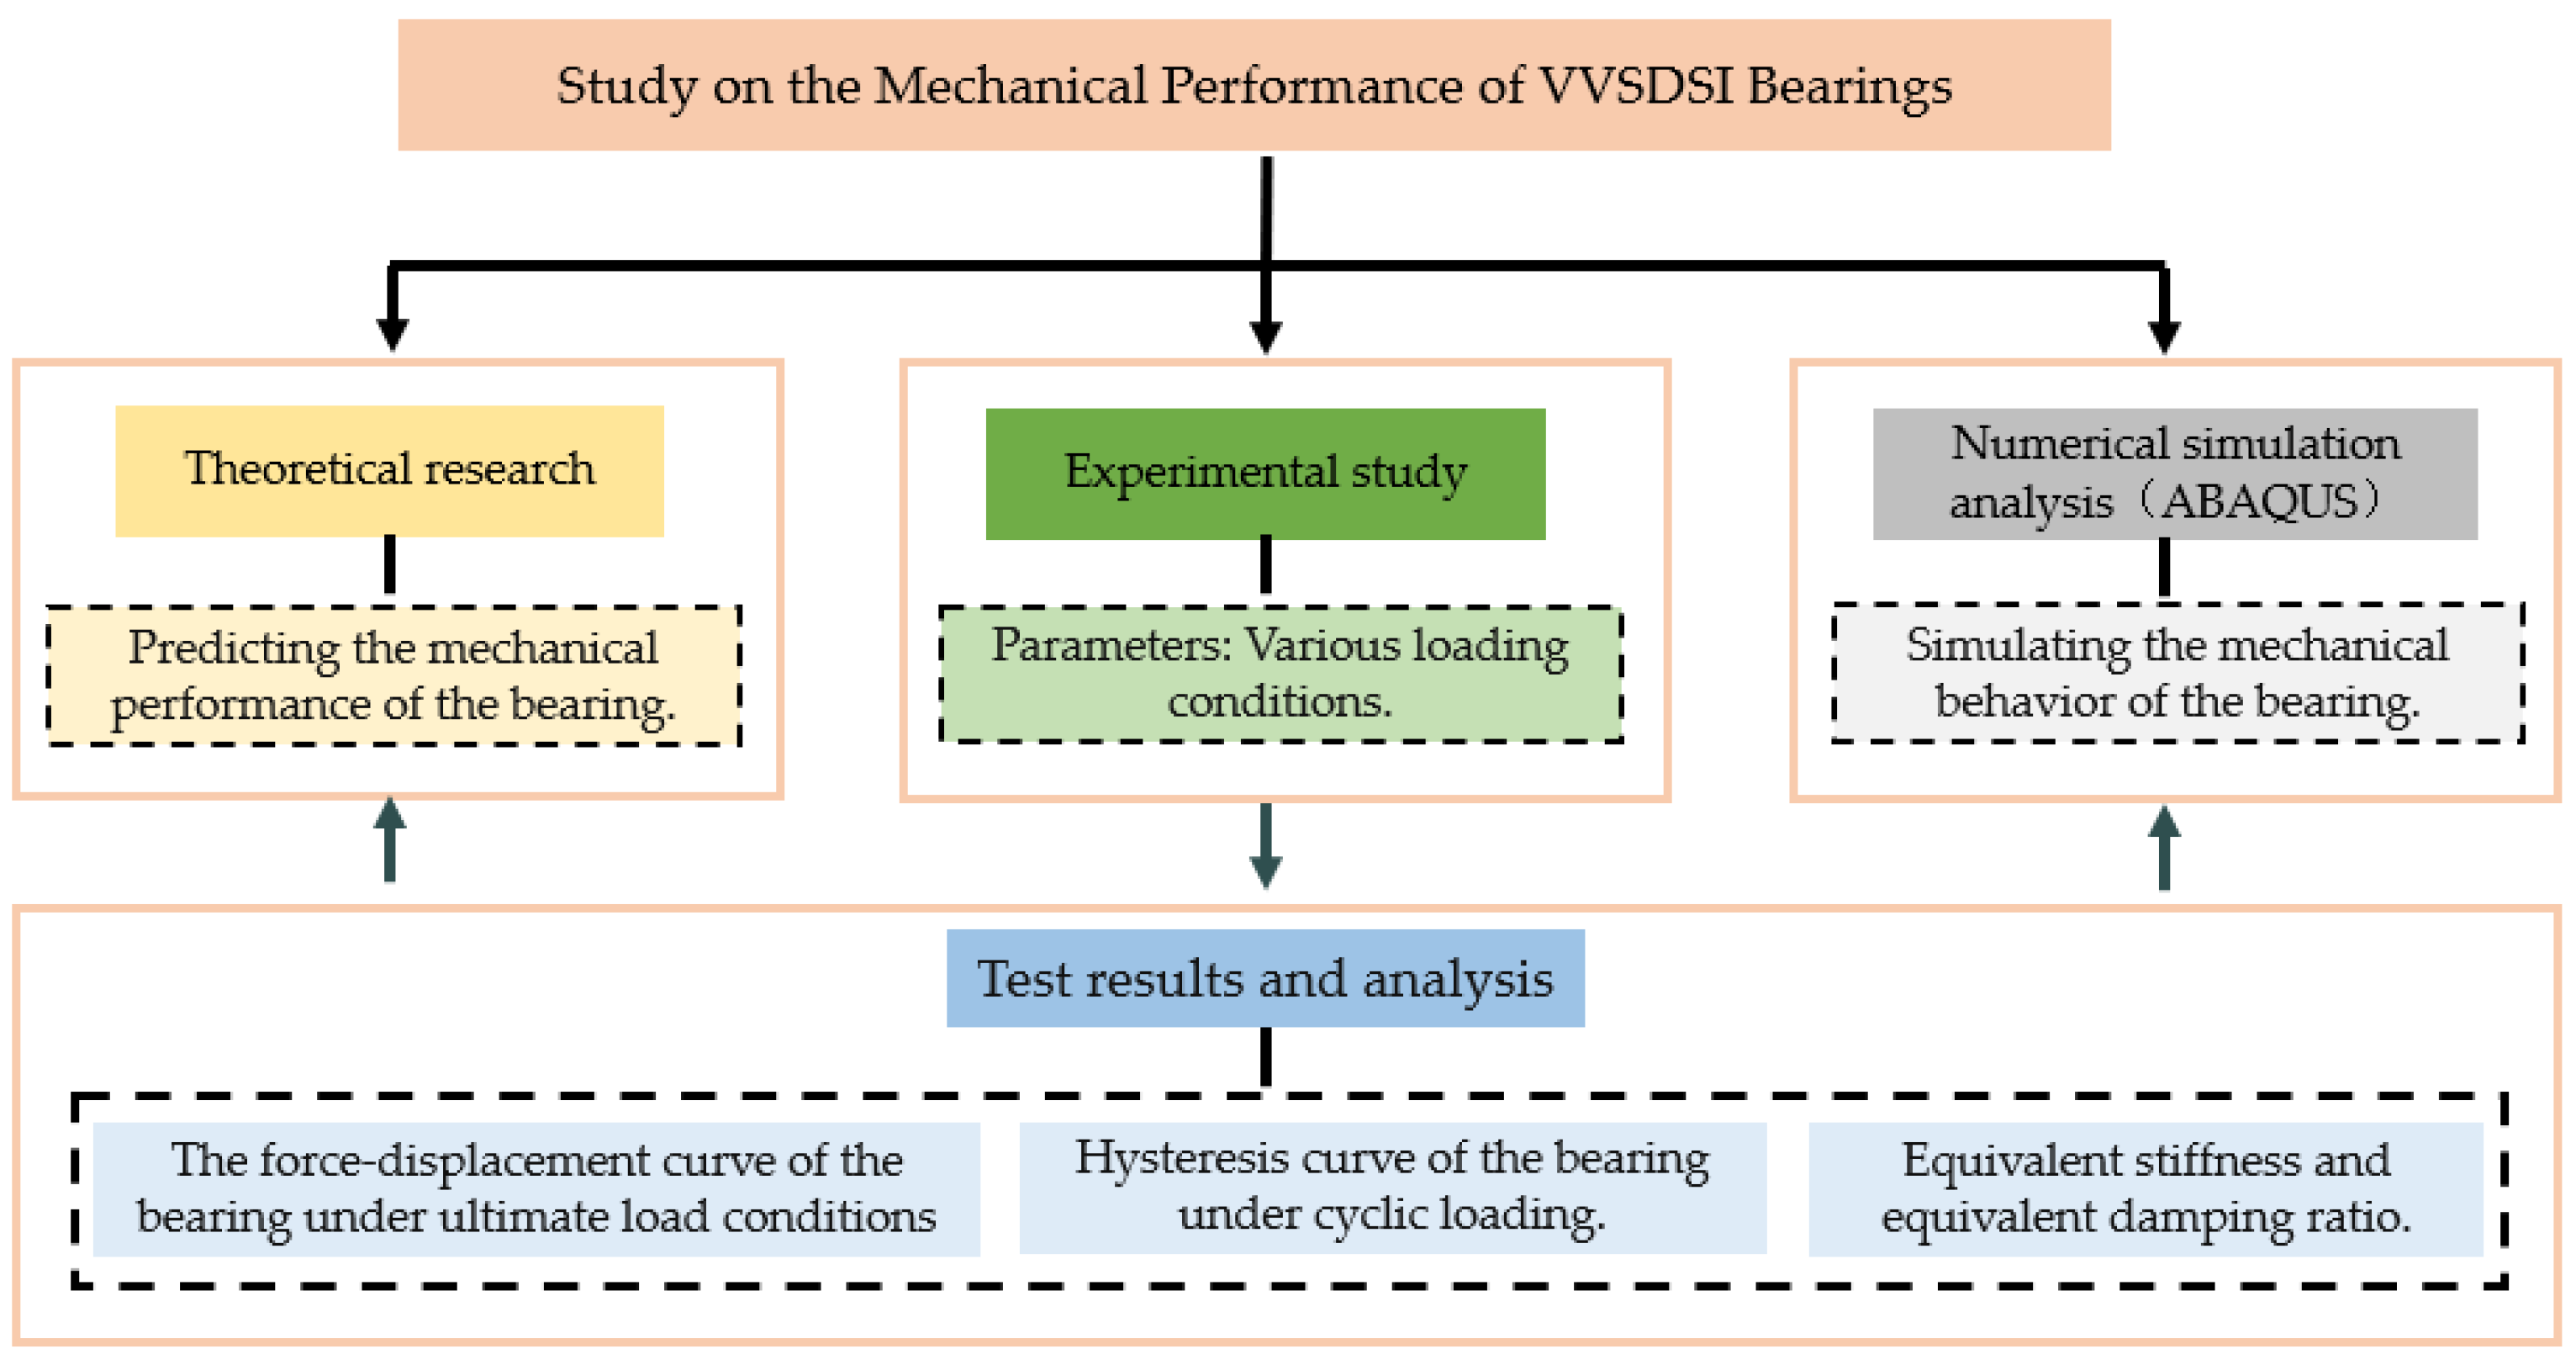
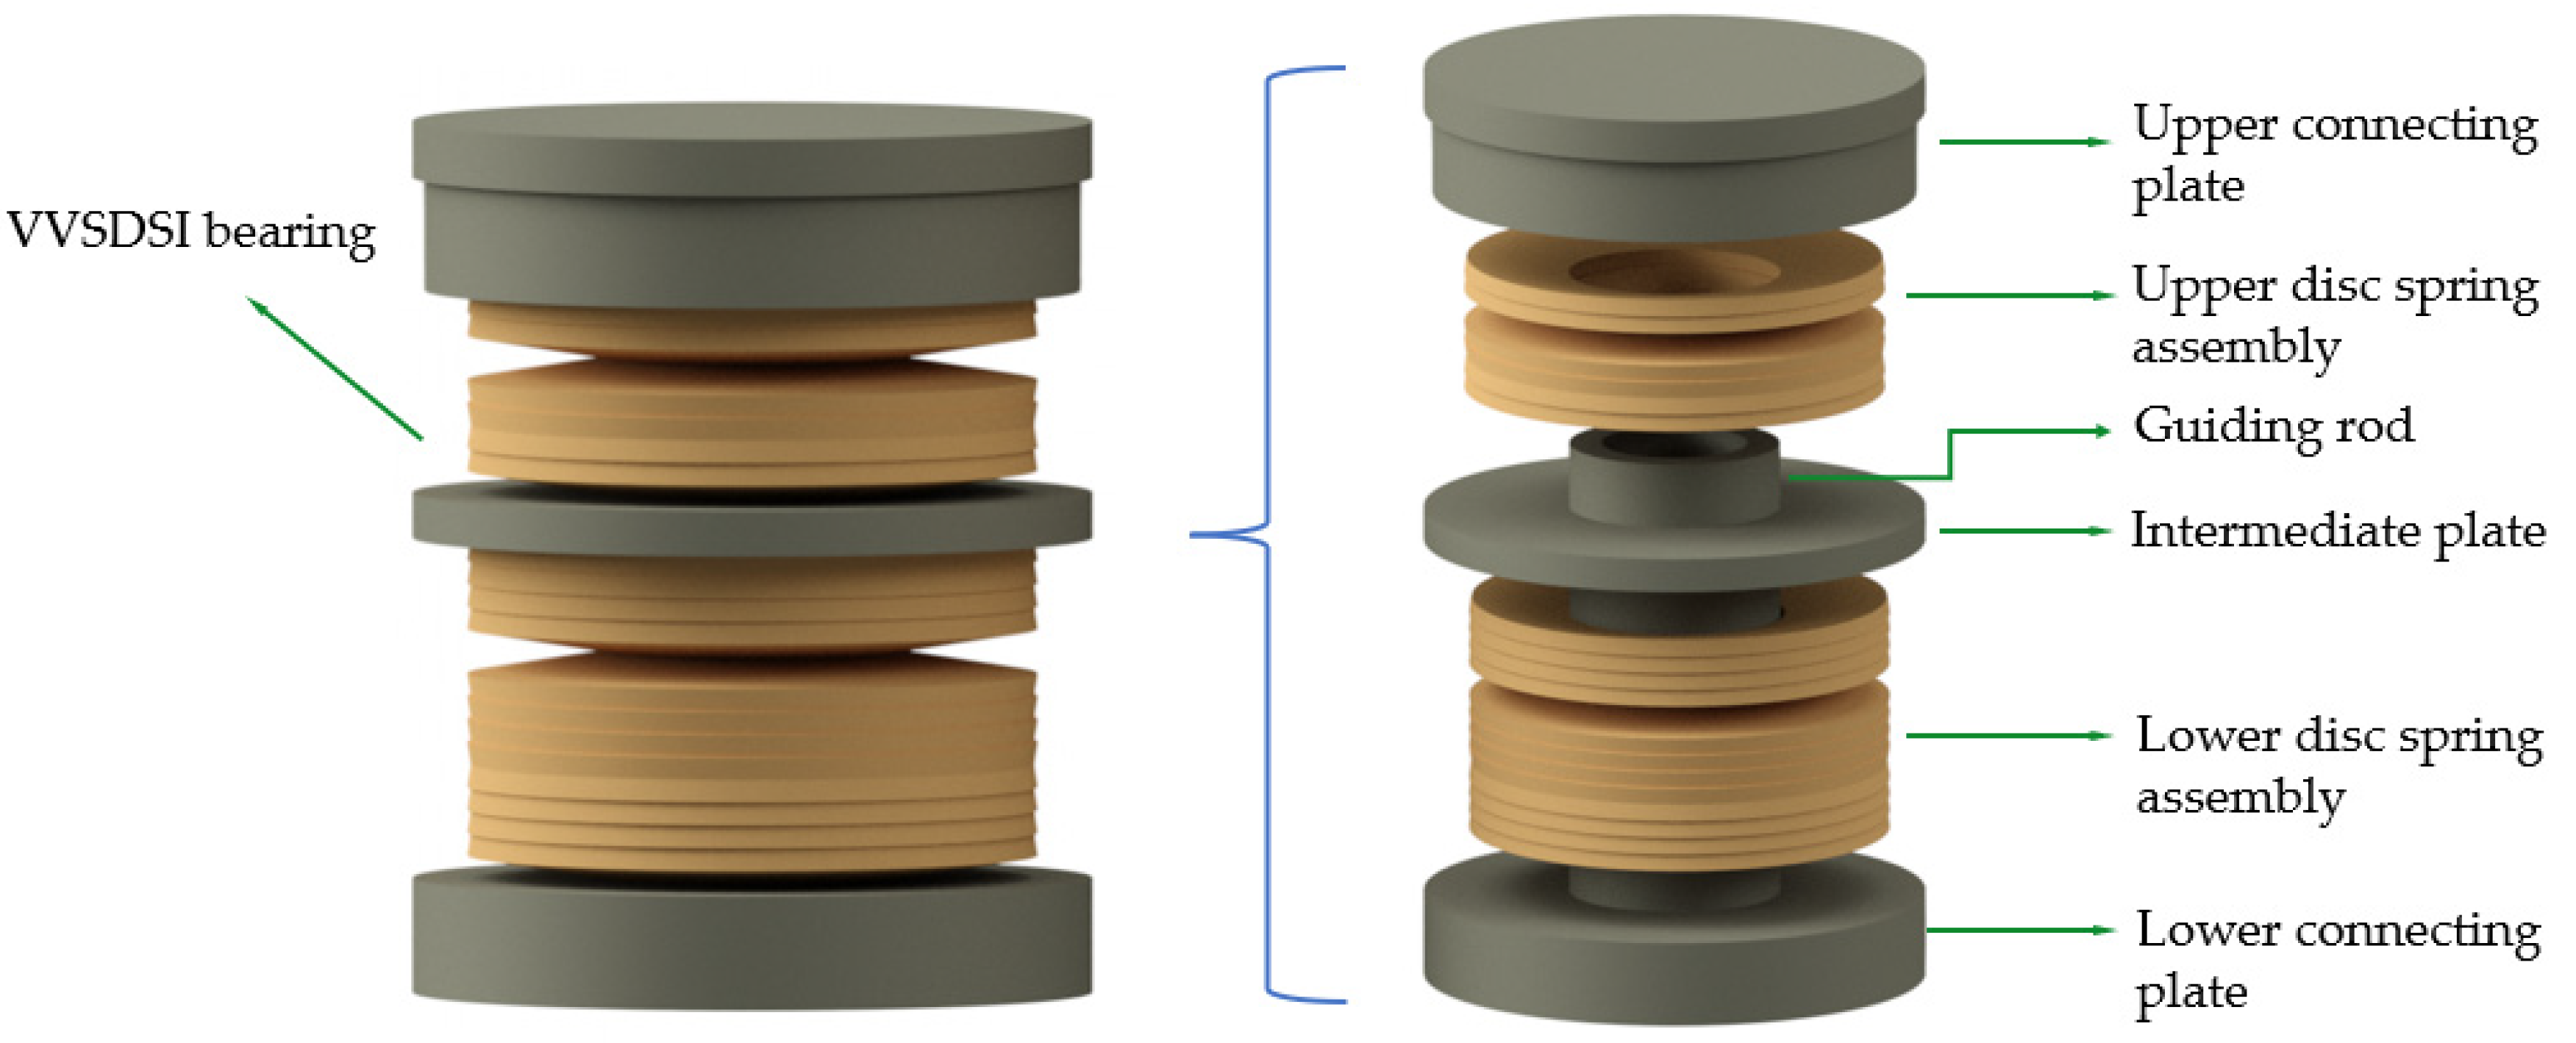
2. Working Mechanism of VVSDSI Bearing

2.1. Structural Construction

Figure 2 illustrates that the VVSDSI bearing primarily consists of an upper connecting plate, an upper disc spring assembly, a guiding rod, an intermediate plate, a lower disc spring assembly, and a lower connecting plate. The guiding rod is located within the disc spring assembly and is welded to the lower connecting plate at its base to prevent horizontal movement of the disc spring group. The upper end of the guiding rod extends into the inner sleeve of the upper connecting plate, facilitating the vertical movement of the disc spring assembly. The intermediate plate is situated between the upper and lower disc spring assemblies, regulating the internal deformation of these assemblies. The upper disc spring assembly comprises six-disc springs arranged in two layers and organized into three groups, while the lower disc spring assembly consists of twelve disc springs stacked in four layers and organized into three groups. The entire bearing will experience vertical displacement due to superstructure loads and vertical seismic activity.

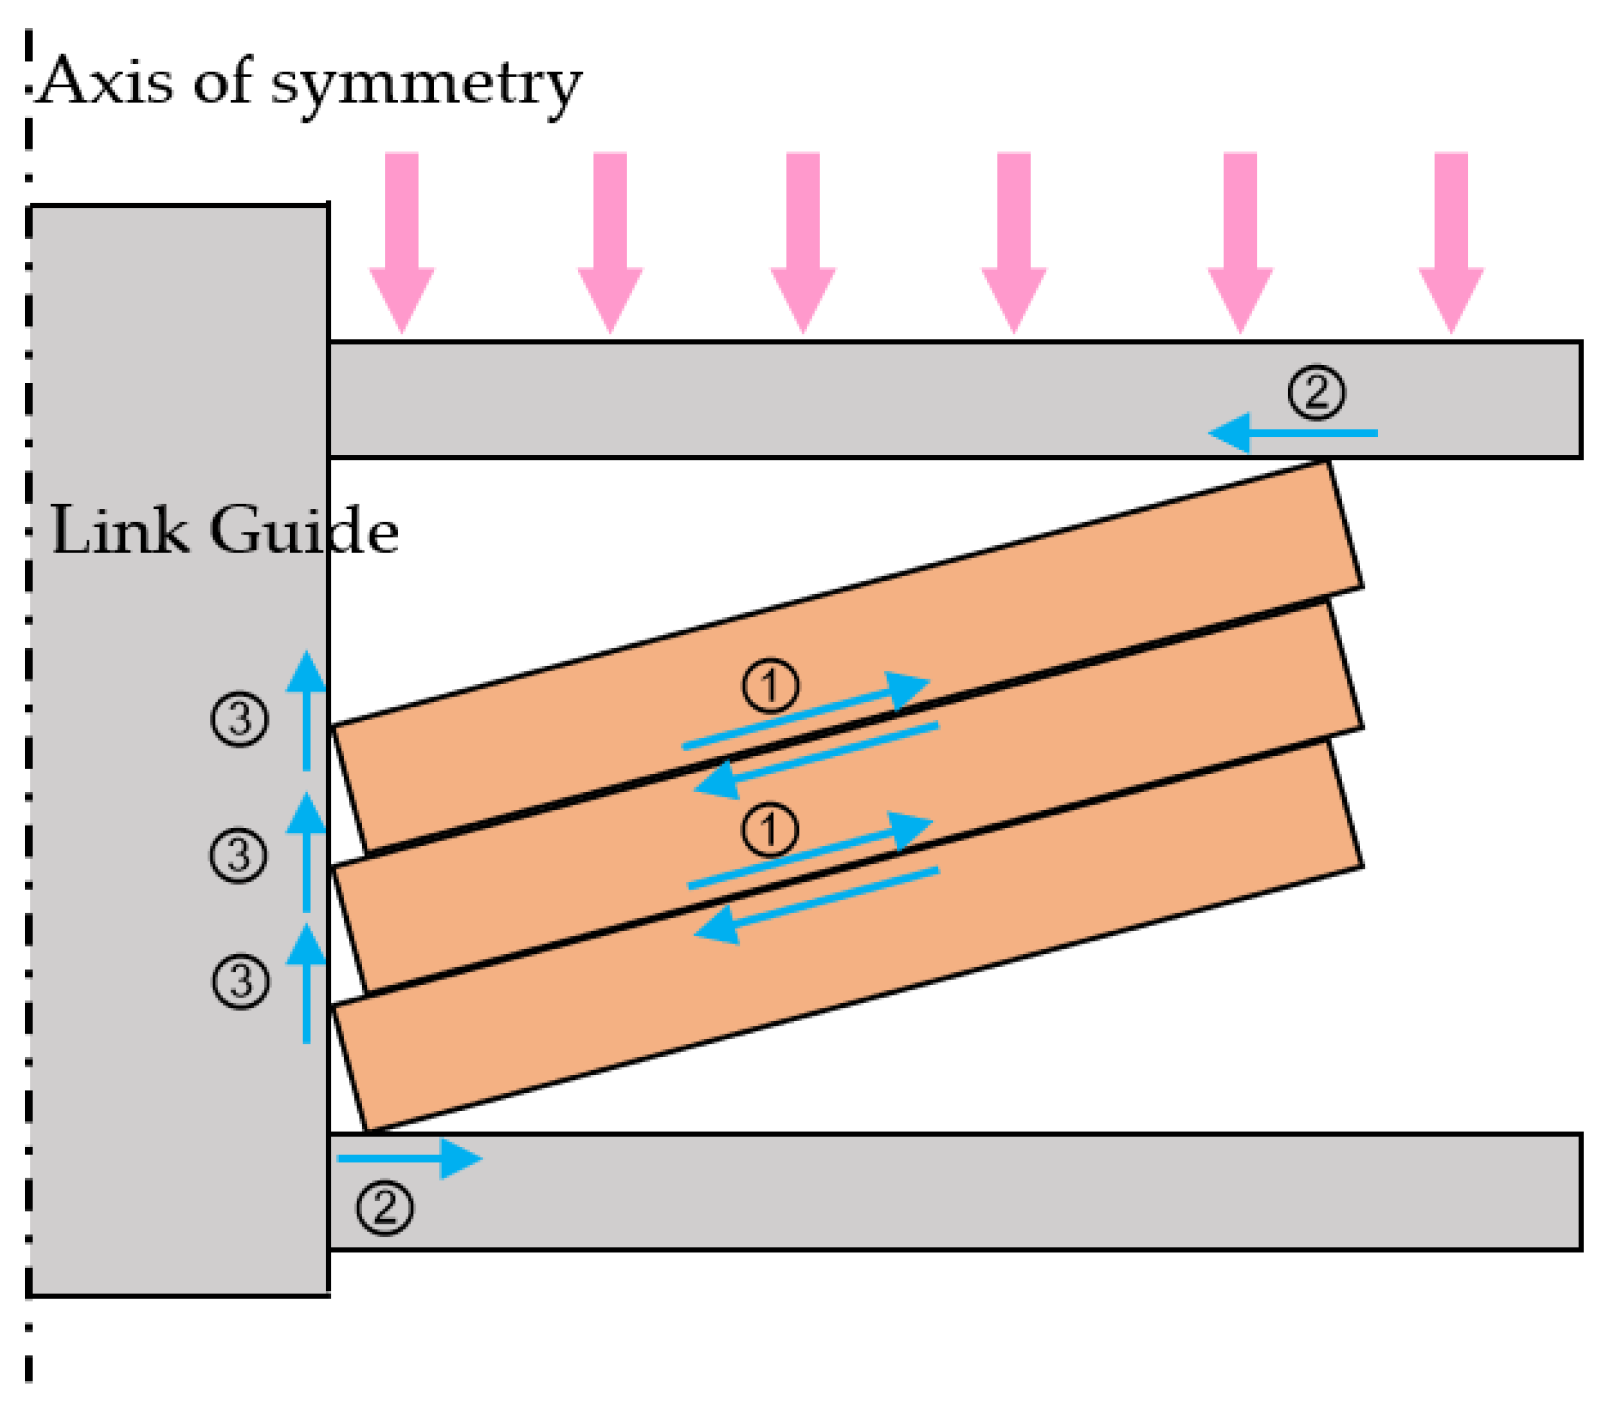
2.2. Operational Mechanism

The VVSDSI bearing adjusts its stiffness, load-bearing capacity, and deformation ability by serially connecting upper and lower disc spring groups with varying stacking layers. As shown in Figure 3, under applied loads, the damping force of the bearing is primarily composed of Coulomb damping, which originates from three main sources: (1) friction between adjacent disc springs; (2) friction between the end disc springs, and the connecting plates; and (3) friction between the disc springs and the guide rod. The Coulomb damping force is primarily influenced by the configuration of the disc springs and the number of stacked plates in each set, as well as the surface quality and lubrication conditions of the disc springs.

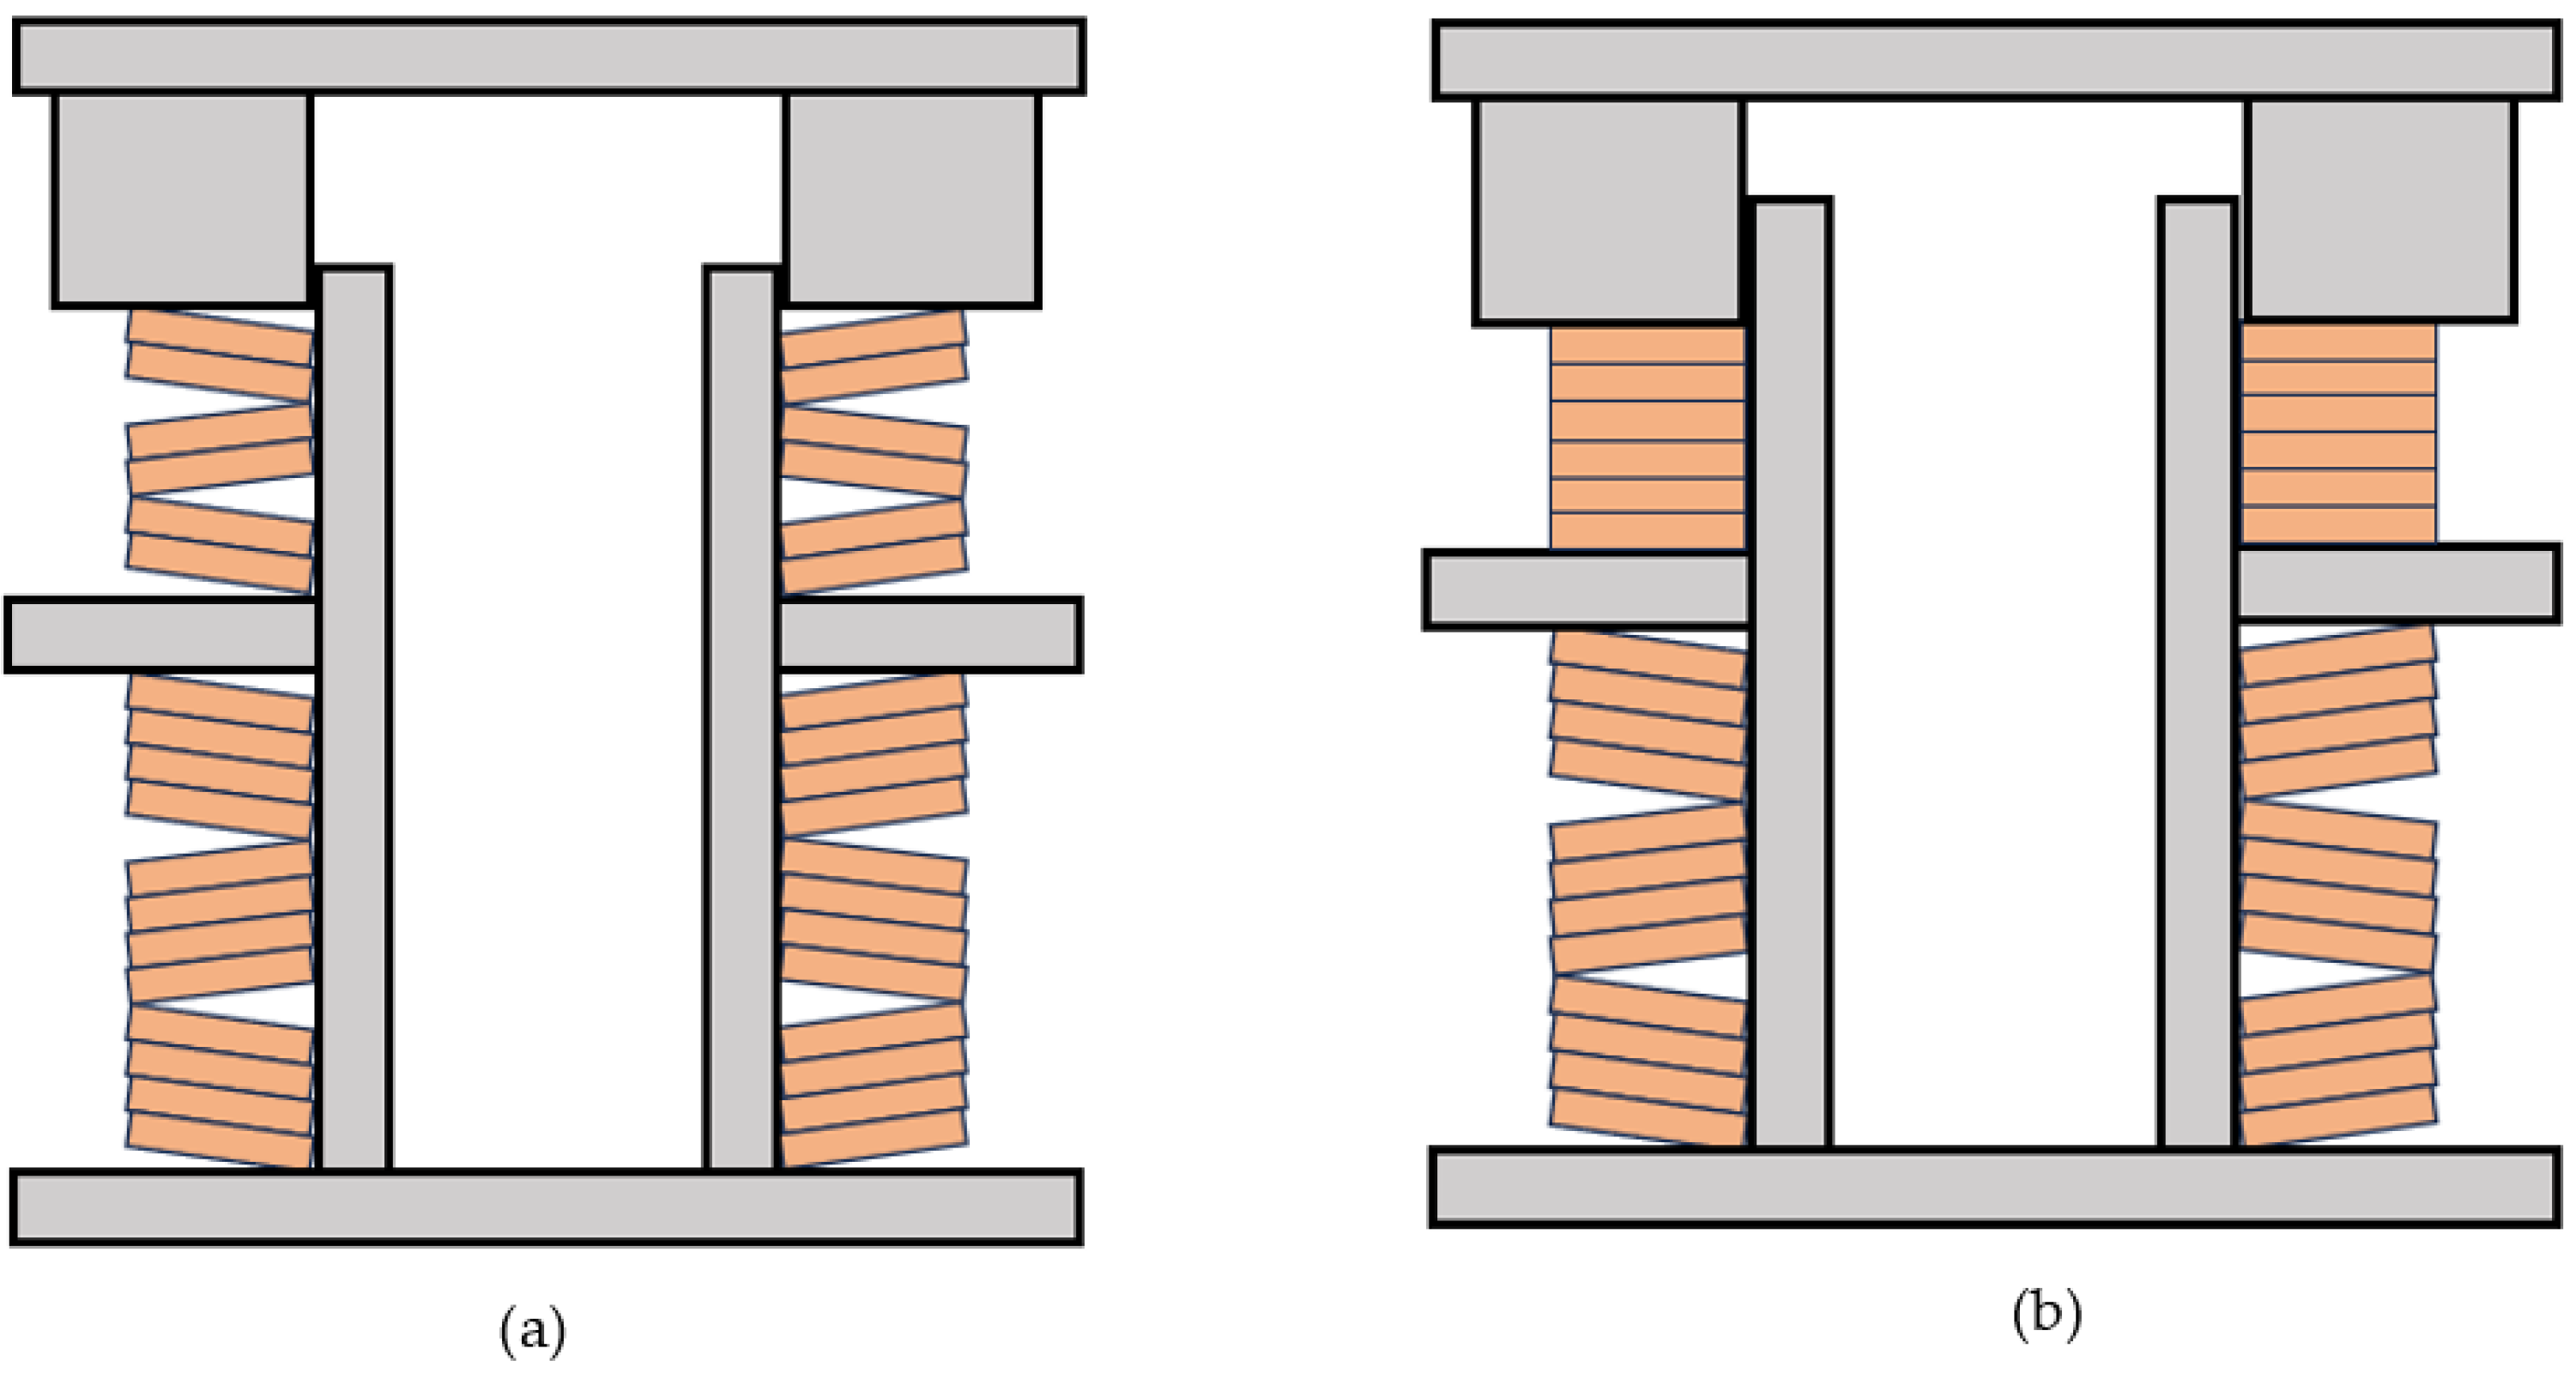
2.3. Characteristic Working Status

The stiffness of the VVSDSI bearing varies with the actual deformation, allowing its working state to be classified into two stages: the isolation stage and the protection stage, as illustrated in Figure 4. The deformation of the disc springs differs between these stages. In the isolation stage (Figure 4a), the bearing undergoes relatively small deformations. At this stage, the upper and lower disc spring groups work in unison, providing relatively low vertical stiffness, which enhances vibration isolation effectiveness. As deformation increases, the upper disc spring group reaches its compression limit. Subsequently, the lower disc spring group deforms, transitioning the structure into the protection stage (Figure 4b). In this state, the vertical stiffness of the bearing increases significantly, enabling an adaptive adjustment of vertical stiffness to enhance structural protection.

2.4. Theoretical Study of VVSDSI Bearings

2.4.1. Mechanical Properties of Disc Springs

The Chinese disc spring specification (GB/T 1972-2005) [30] states that the formulas for load Fs and deformation δ of an individual disc spring are as follows:
F S = 4 E 1 μ 2 t 4 M 1 D 2 δ t h 0 t δ t h 0 t 0.5 δ t + 1
where E and μ represent the elastic modulus and Poisson’s ratio of the disc spring material, respectively; D and t denote the outer diameter and thickness, respectively; h0 denotes the compressible stroke of the disc spring, as illustrated in Figure 5. M1 is given by the following:
M 1 = 1 π D d 1 1 D d 1 2 D d 1 + 1 D d 1 1 2 ln D d 1 1
where d is the inner diameter of the disc spring.
The friction force of the disc spring group mainly originates from three aspects: (1) friction between adjacent disc springs; (2) friction between the end of the disc spring and the loading plate; (3) friction between the disc spring and the guide rod. In actual design, the inner diameter of the disc spring is usually larger than the outer diameter of the catheter, which can effectively avoid friction with the catheter. Therefore, the bearing capacity of the disc spring group is expressed as follows:
F G = F S n 1 ± f M n 1 ± α f R
where fM represents the friction coefficient between the conical surfaces of the disc springs (see Table 1); fR represents the friction coefficient at the load-bearing edges of the disc springs (see Table 1); n represents the number of disc spring stacks; α denotes the number of contact surfaces between the outer edges of the disc springs and the upper and lower surfaces; and the symbol ‘−’ denotes loading, whereas ‘+’ signifies unloading.
Consequently, the vertical stiffness of the disc spring assembly under friction is
K = F G m δ = n F S m δ 1 ± f M n 1 ± α f R
where δ is the deformation of a single disc spring and m is the number of layers of a disc spring group. For disc springs of type A and B, their stiffness can be approximated as the linear stiffness, i.e., the stiffness value of the disc spring when δ = 0.75h0.

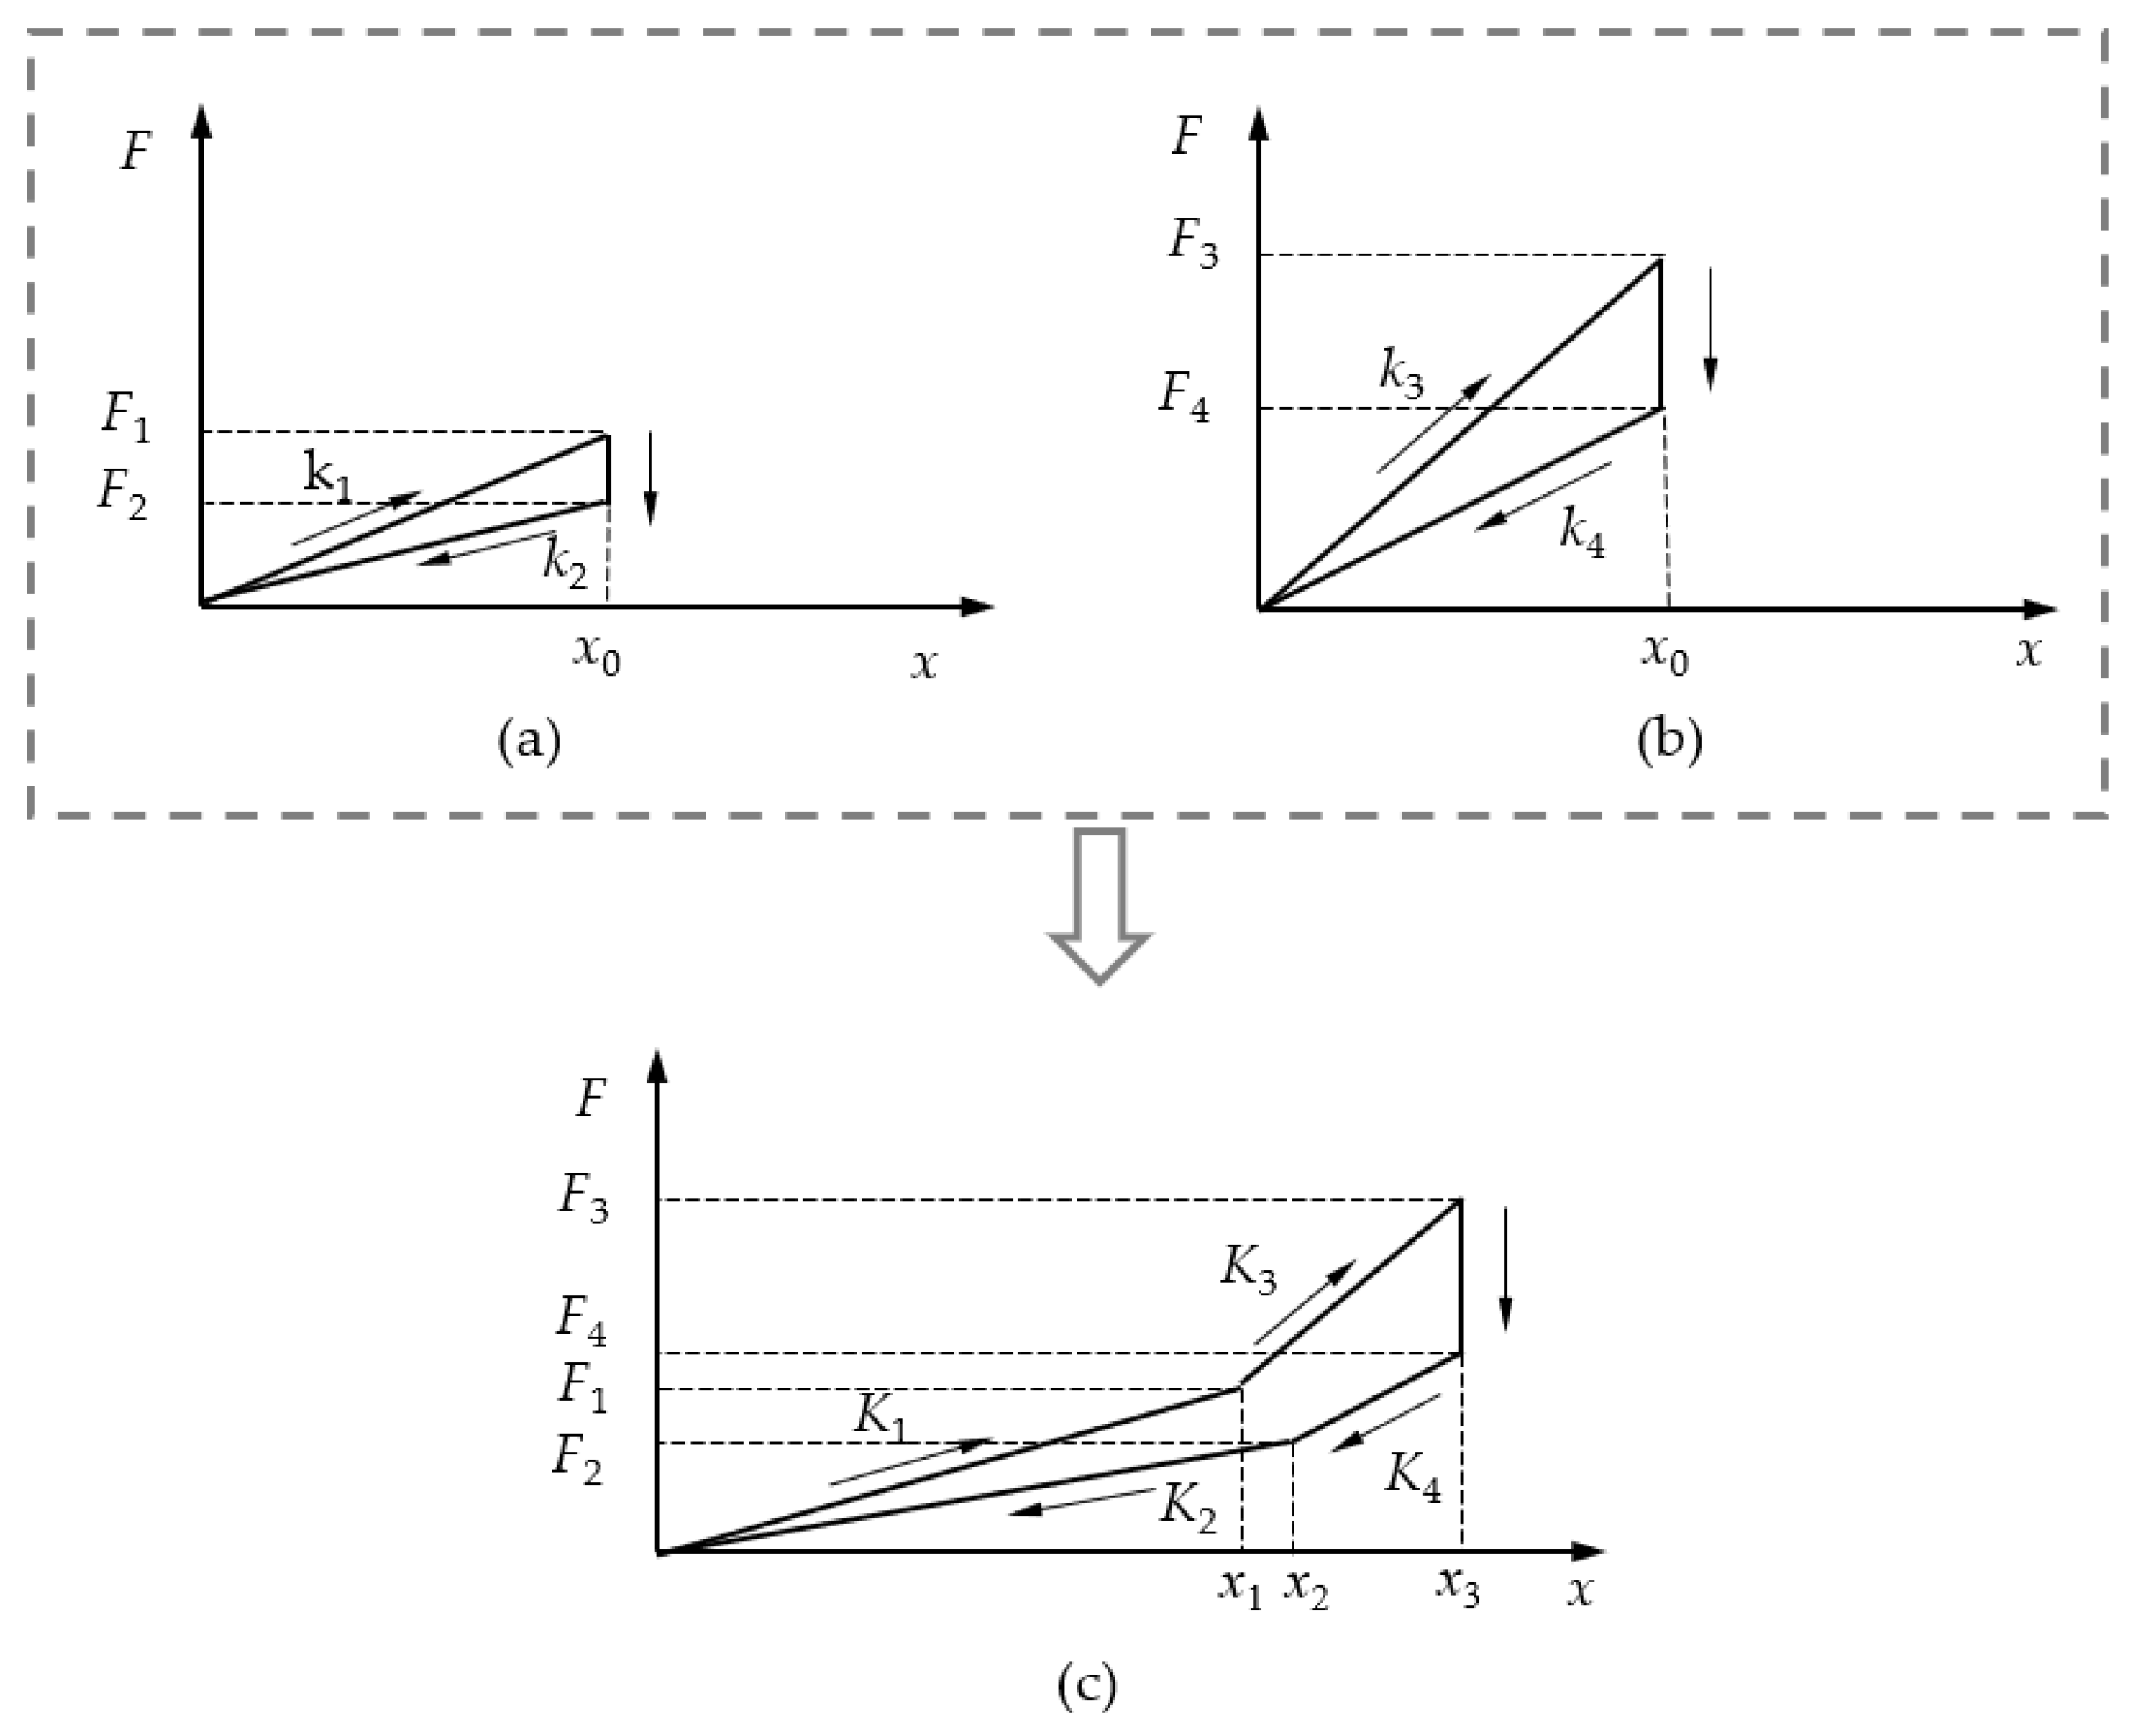
2.4.2. Theoretical Hysteresis Model of VVSDSI Bearing
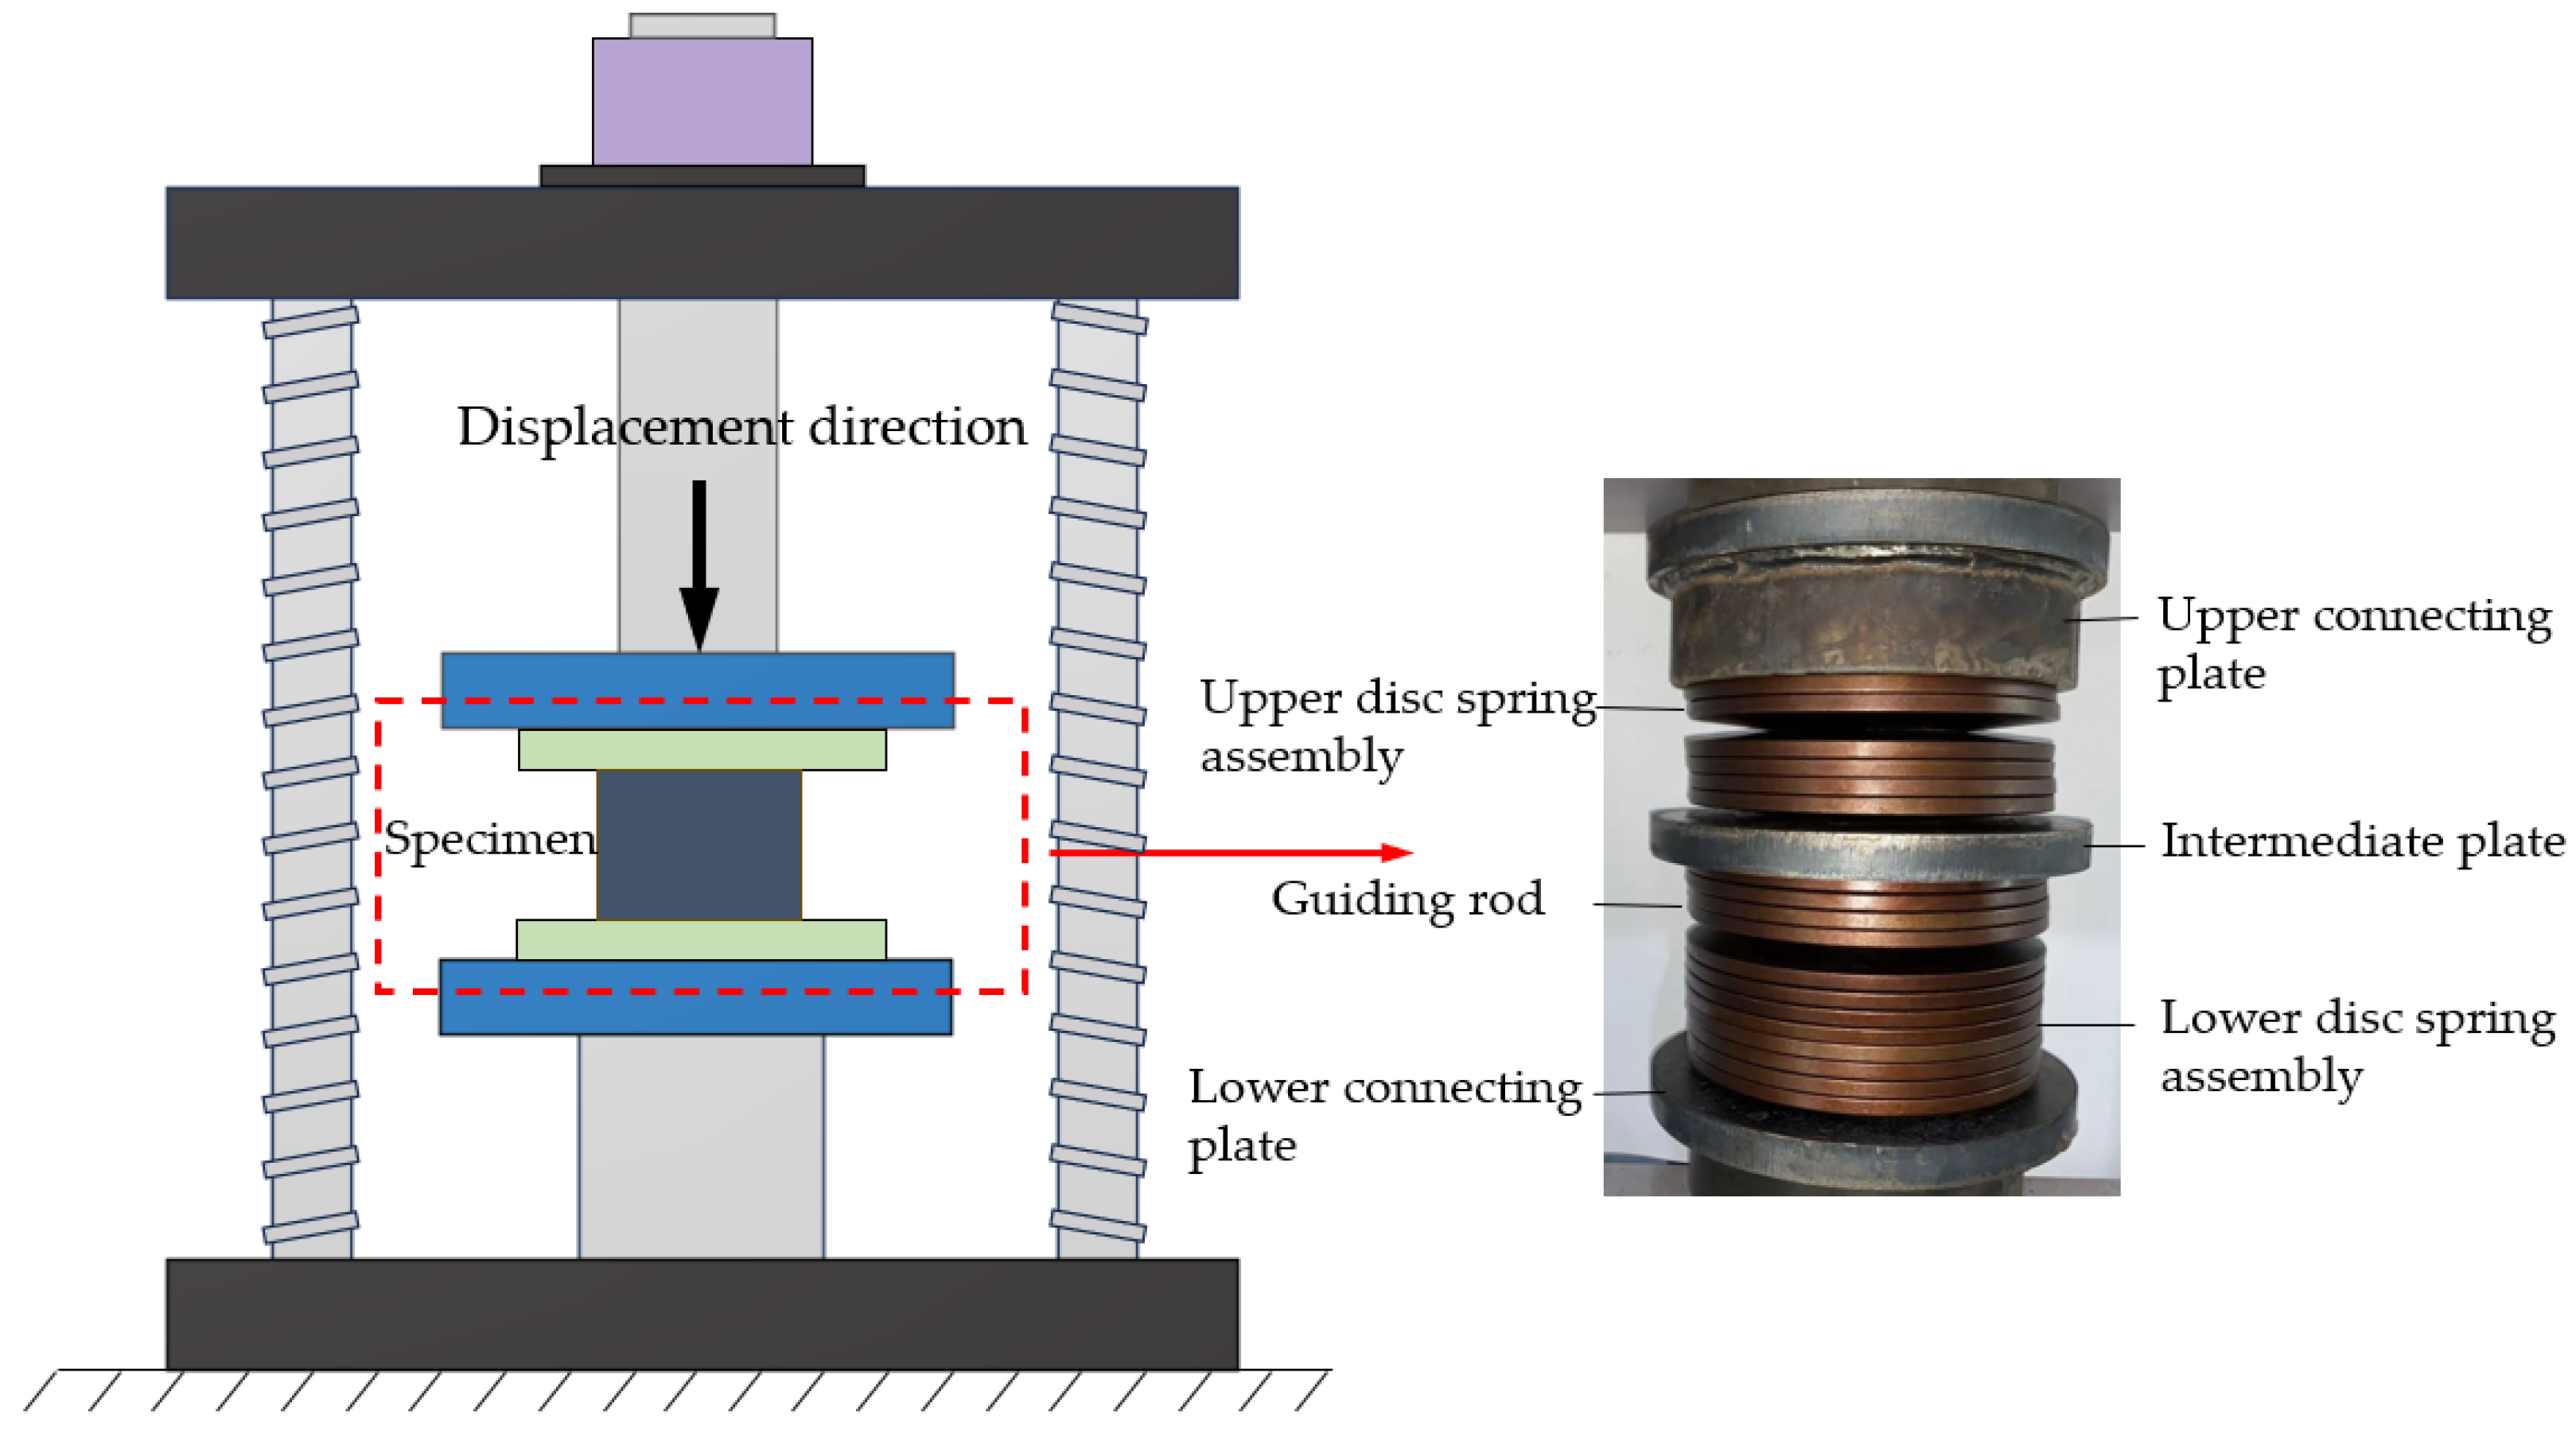
The VVSDSI isolation system consists of two parts: the upper disc spring set and the lower disc spring set. By combining the hysteresis models of both, the hysteresis model for the VVSDSI disc spring system considering friction effects can be obtained, as shown in Figure 6.
According to the characteristics of the proposed bearing, it is essential to analyze the mechanical properties of the bearing in both scenarios. The working stage of the VVSDSI bearing includes two parts: the seismic isolation stage and the protection stage. During the seismic isolation stage, the upper and lower disc spring assemblies function collaboratively. At this time, the current loading and unloading stiffnesses of the bearing are as follows:
K 1 = k 1 k 3 k 1 + k 3
K 2 = k 2 k 4 k 2 + k 4
where k1 and k3 are the loading stiffness of the upper disc spring group and the lower disc spring group, and k2 and k4 are their unloading stiffness, which can be calculated by Equations (1)–(4).
During the protection phase, the upper disc spring group becomes inactive, while only the lower disc spring group continues to function. The current loading and unloading stiffness of the bearing is as follows:
K 3 = k 3
K 4 = k 4
furthermore, the VVSDSI bearing’s theoretical hysteresis model can be acquired.
Loading phase:
F = K 1 x 0 x x 1 K 1 x 1 + K 3 x x 1 x 1 < x < x 3
Unloading phase:
F = K 2 x 0 x x 2 K 2 x 2 + K 4 x x 1 x 2 < x < x 3
where x denotes the vertical displacement of the bearing; x1 = (1 + k1/k3) x0 represents the vertical displacement of the bearing when the stiffness changes during loading; x2 = (1 + k2/k4) x0 is the vertical displacement of the bearing when the stiffness changes during unloading; x0 is the maximum travel displacement of the upper and lower disc spring sets; and x3 is the maximum vertical displacement of the bearing.

3. Test Program

3.1. Specimen Design

To study the working performance of the VVSDSI bearing and verify the accuracy of the theoretical hysteresis model, a vertical loading test was carried out on the proposed variable stiffness bearing. The structure of the VVSDSI bearing is shown in Figure 7, which mainly consists of upper and lower disc spring assemblies, guide rods, upper and lower connecting plates, and an intermediate plate. The upper disc spring assembly consists of six disc springs, and the lower disc spring consists of twelve disc springs. This study utilizes the dimensions of the B-series disc springs as specified in the Chinese Disc Spring Specification [30], with detailed design parameters presented in Table 2.

3.2. Test Device

The SHT5206-P microcomputer-controlled electro-hydraulic servo universal testing machine (Shenzhen Wance Testing Equipment Co., Shenzhen, China) was used for loading and data recording. It has a maximum vertical load capacity of 2000 kN and a displacement stroke of 750 mm. During testing, the loading speed and amplitude can be adjusted to simulate different loading conditions. The built-in force and displacement sensors automatically collect vertical load and displacement data, ensuring precise measurement and real-time data acquisition.

3.3. Loading Protocol

To investigate the mechanical properties of the VVSDSI bearing, tests were conducted following the loading protocol specified in the Chinese test method for seismic isolation rubber bearings [31].
(1)
Ultimate load test: Based on the characteristics of the bearing, the displacement control method was used for loading. During the test, the specimen was slowly loaded from the initial state to the ultimate state (the upper and lower disc springs were completely flattened) and then unloaded. To ensure the accuracy of the results, the test was repeated 3 times, and all load-displacement curve data were recorded.
(2)
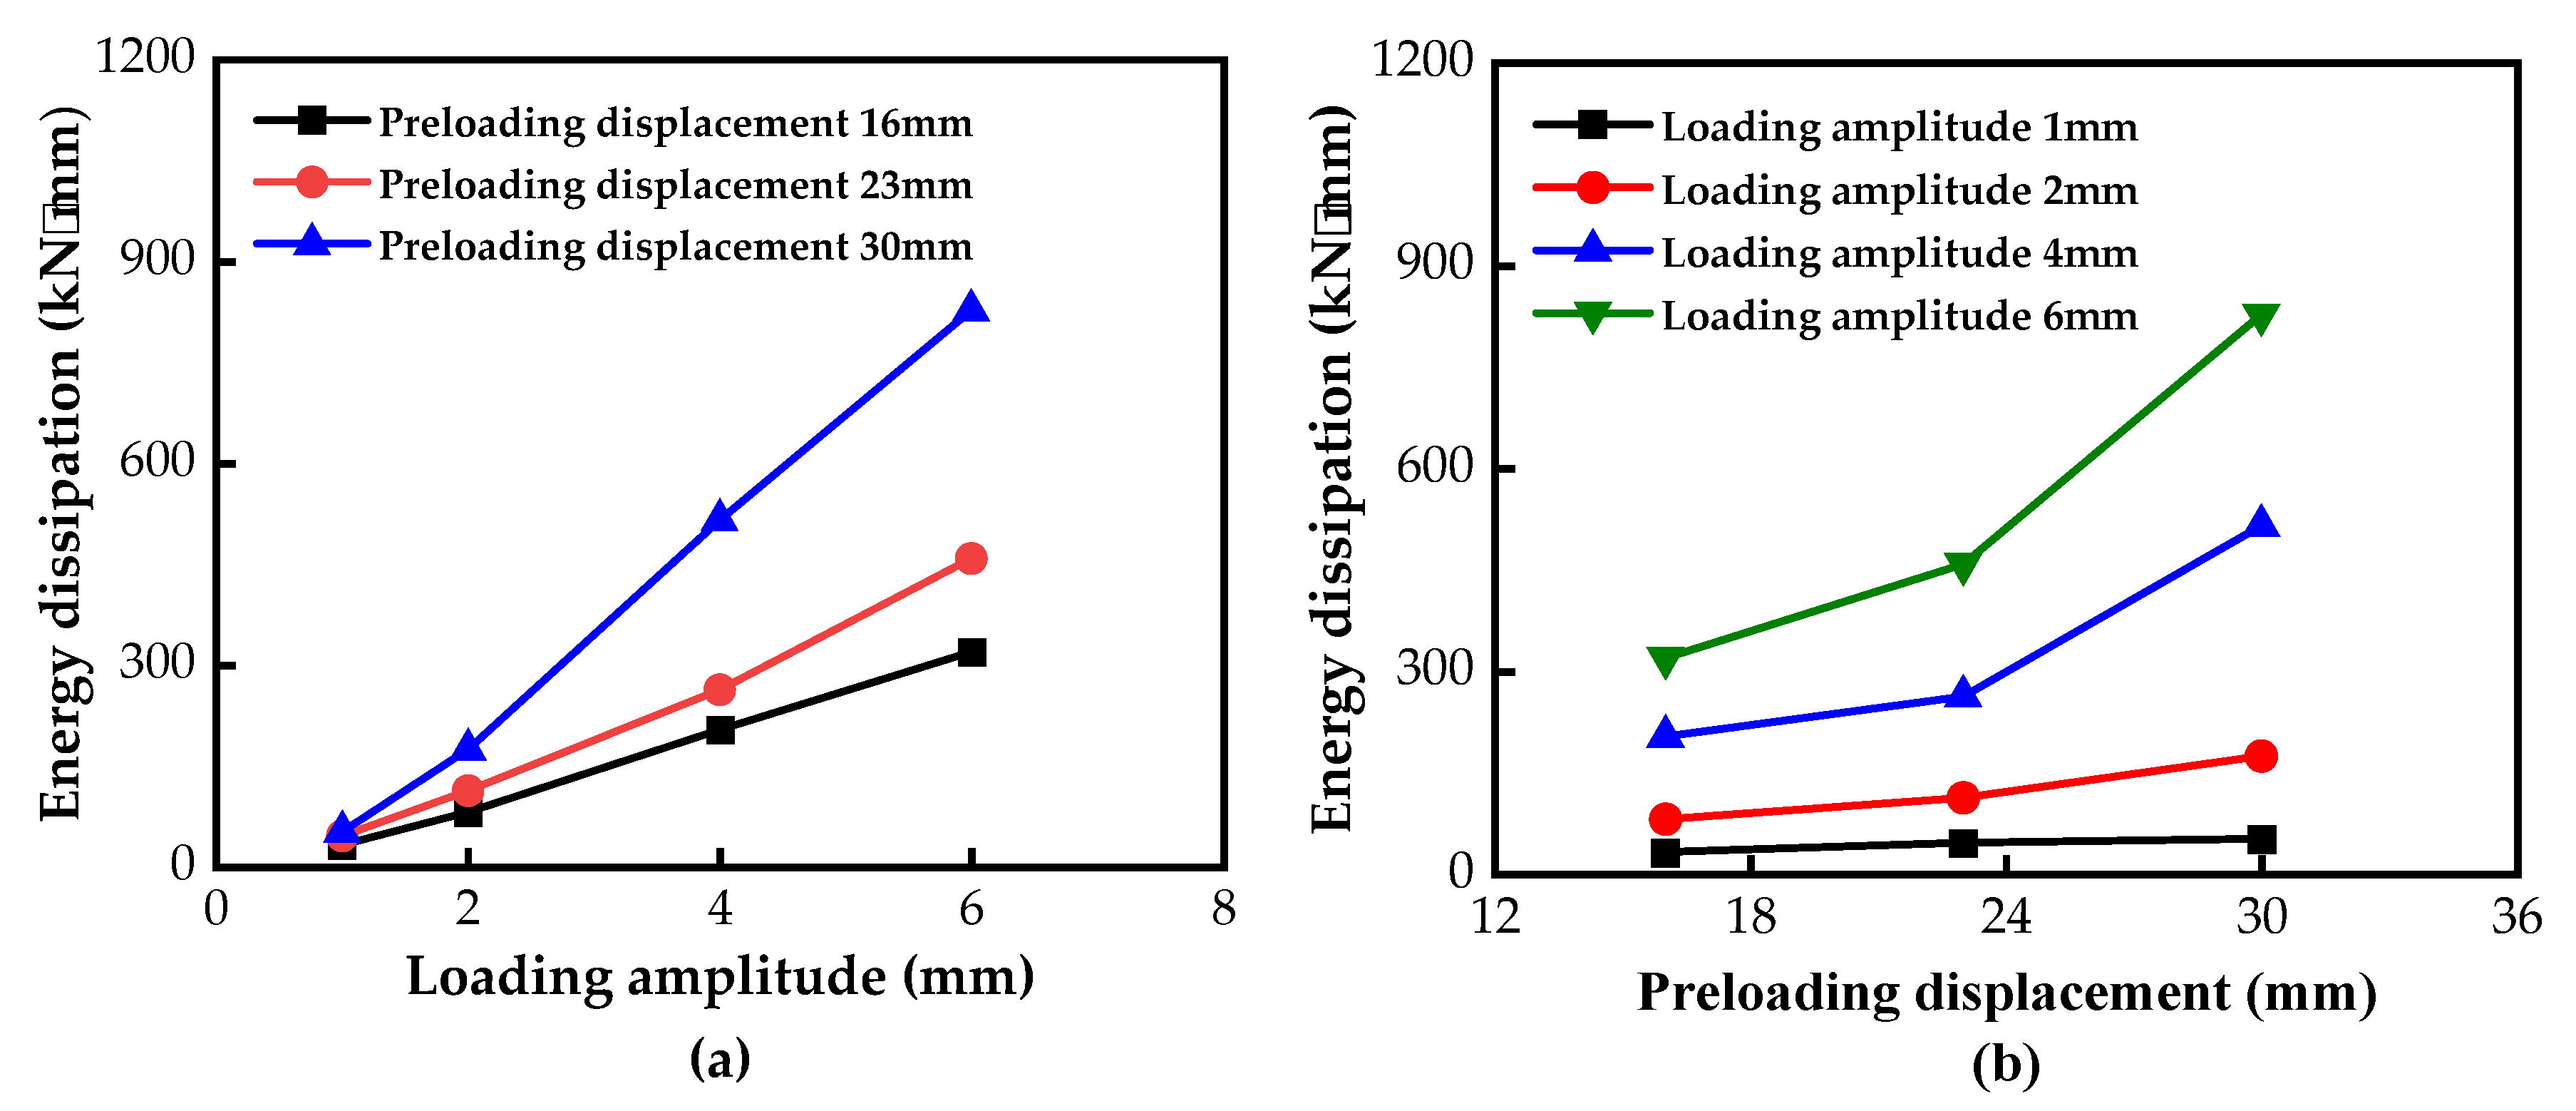
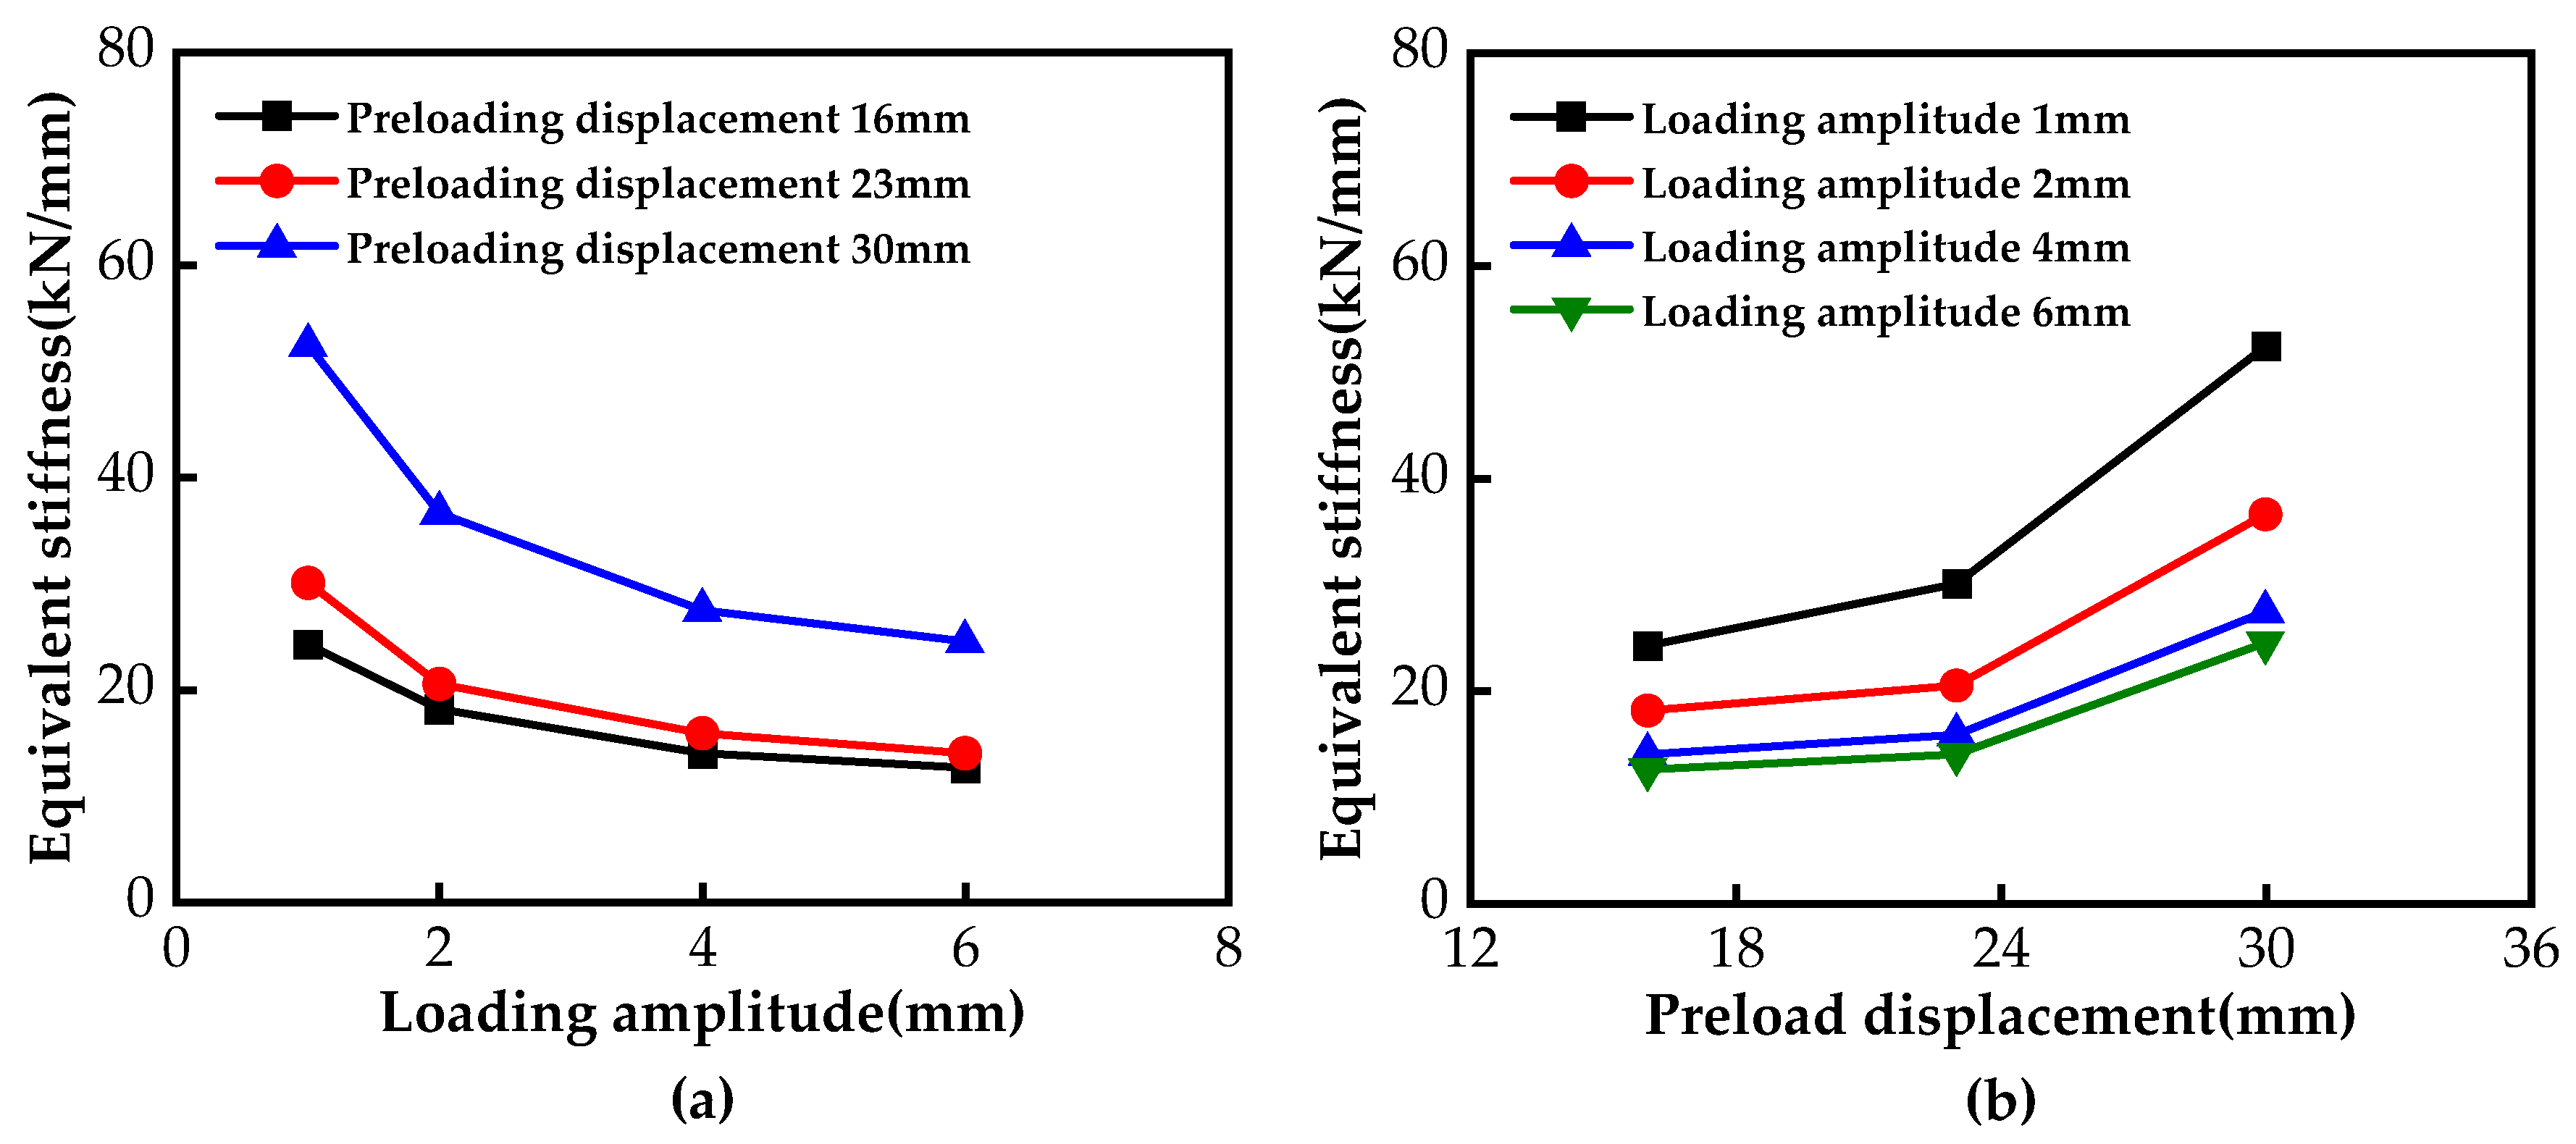
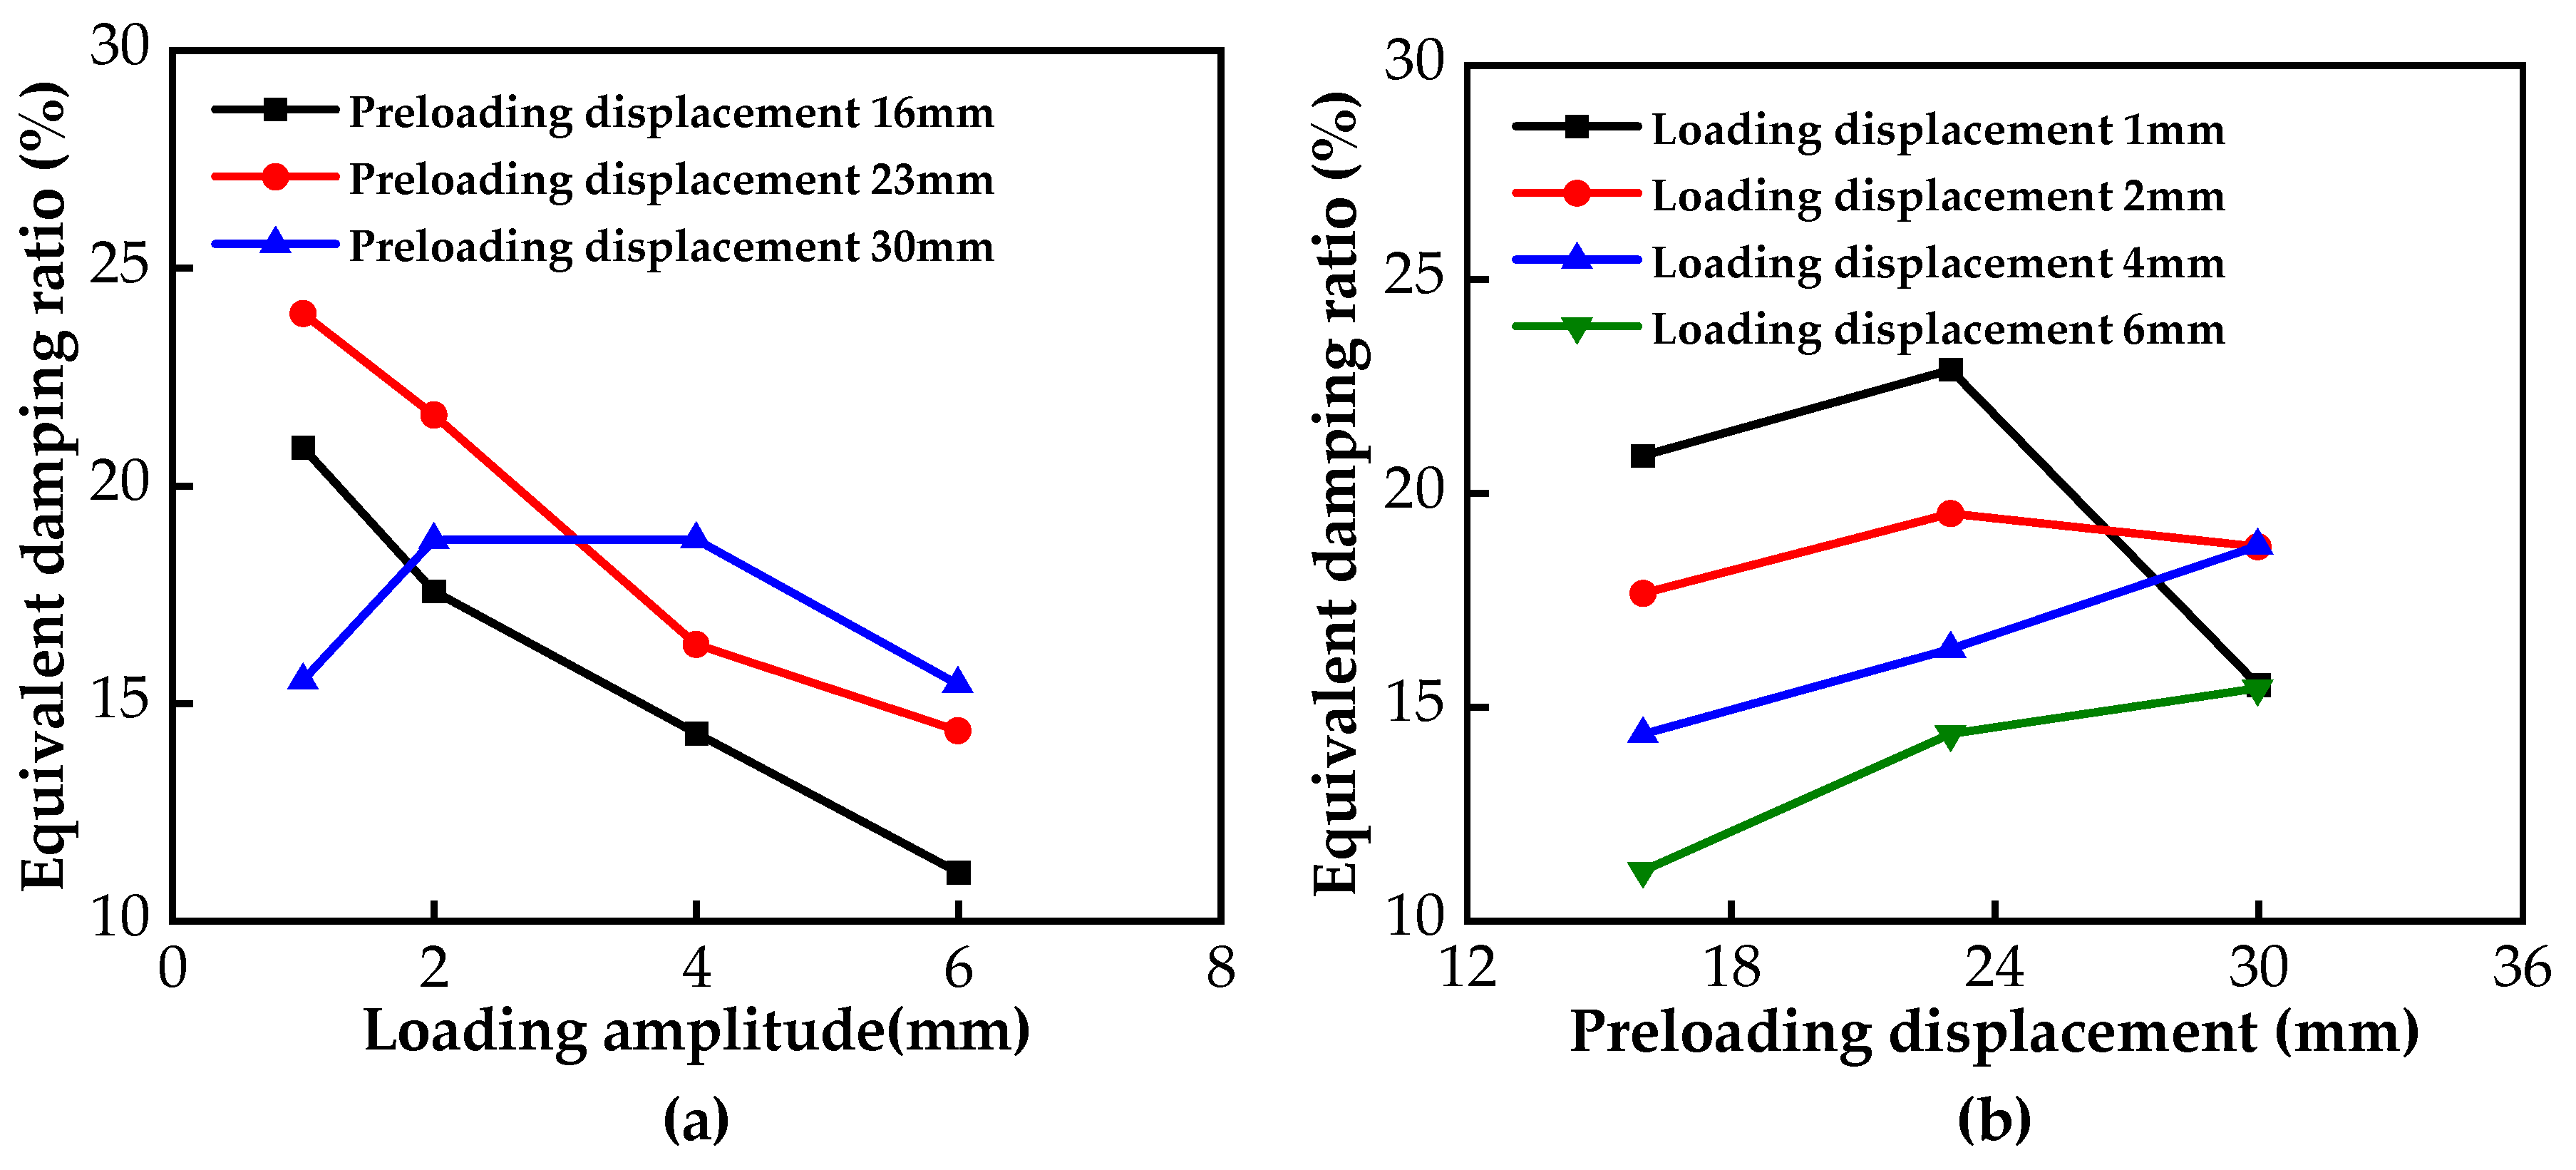
Cyclic load test: The bearing is cyclically loaded using the displacement control method. During the test, the preloading displacement is 16, 23, and 30 mm; the loading frequency is 0.02 Hz, and the loading amplitude is 1, 2, 4, and 6 mm. Each test is completed after three reverse loadings, and the load-displacement hysteresis curve data of the bearing are recorded.

4. Test Results and Discussion

This section analyzes the test outcomes of the VVSDSI bearing under both ultimate and cyclic loads. The bearing’s mechanical properties are evaluated through hysteresis curves, equivalent stiffness, and equivalent damping ratio, with the test results compared to the theoretical model of the hysteresis curve.

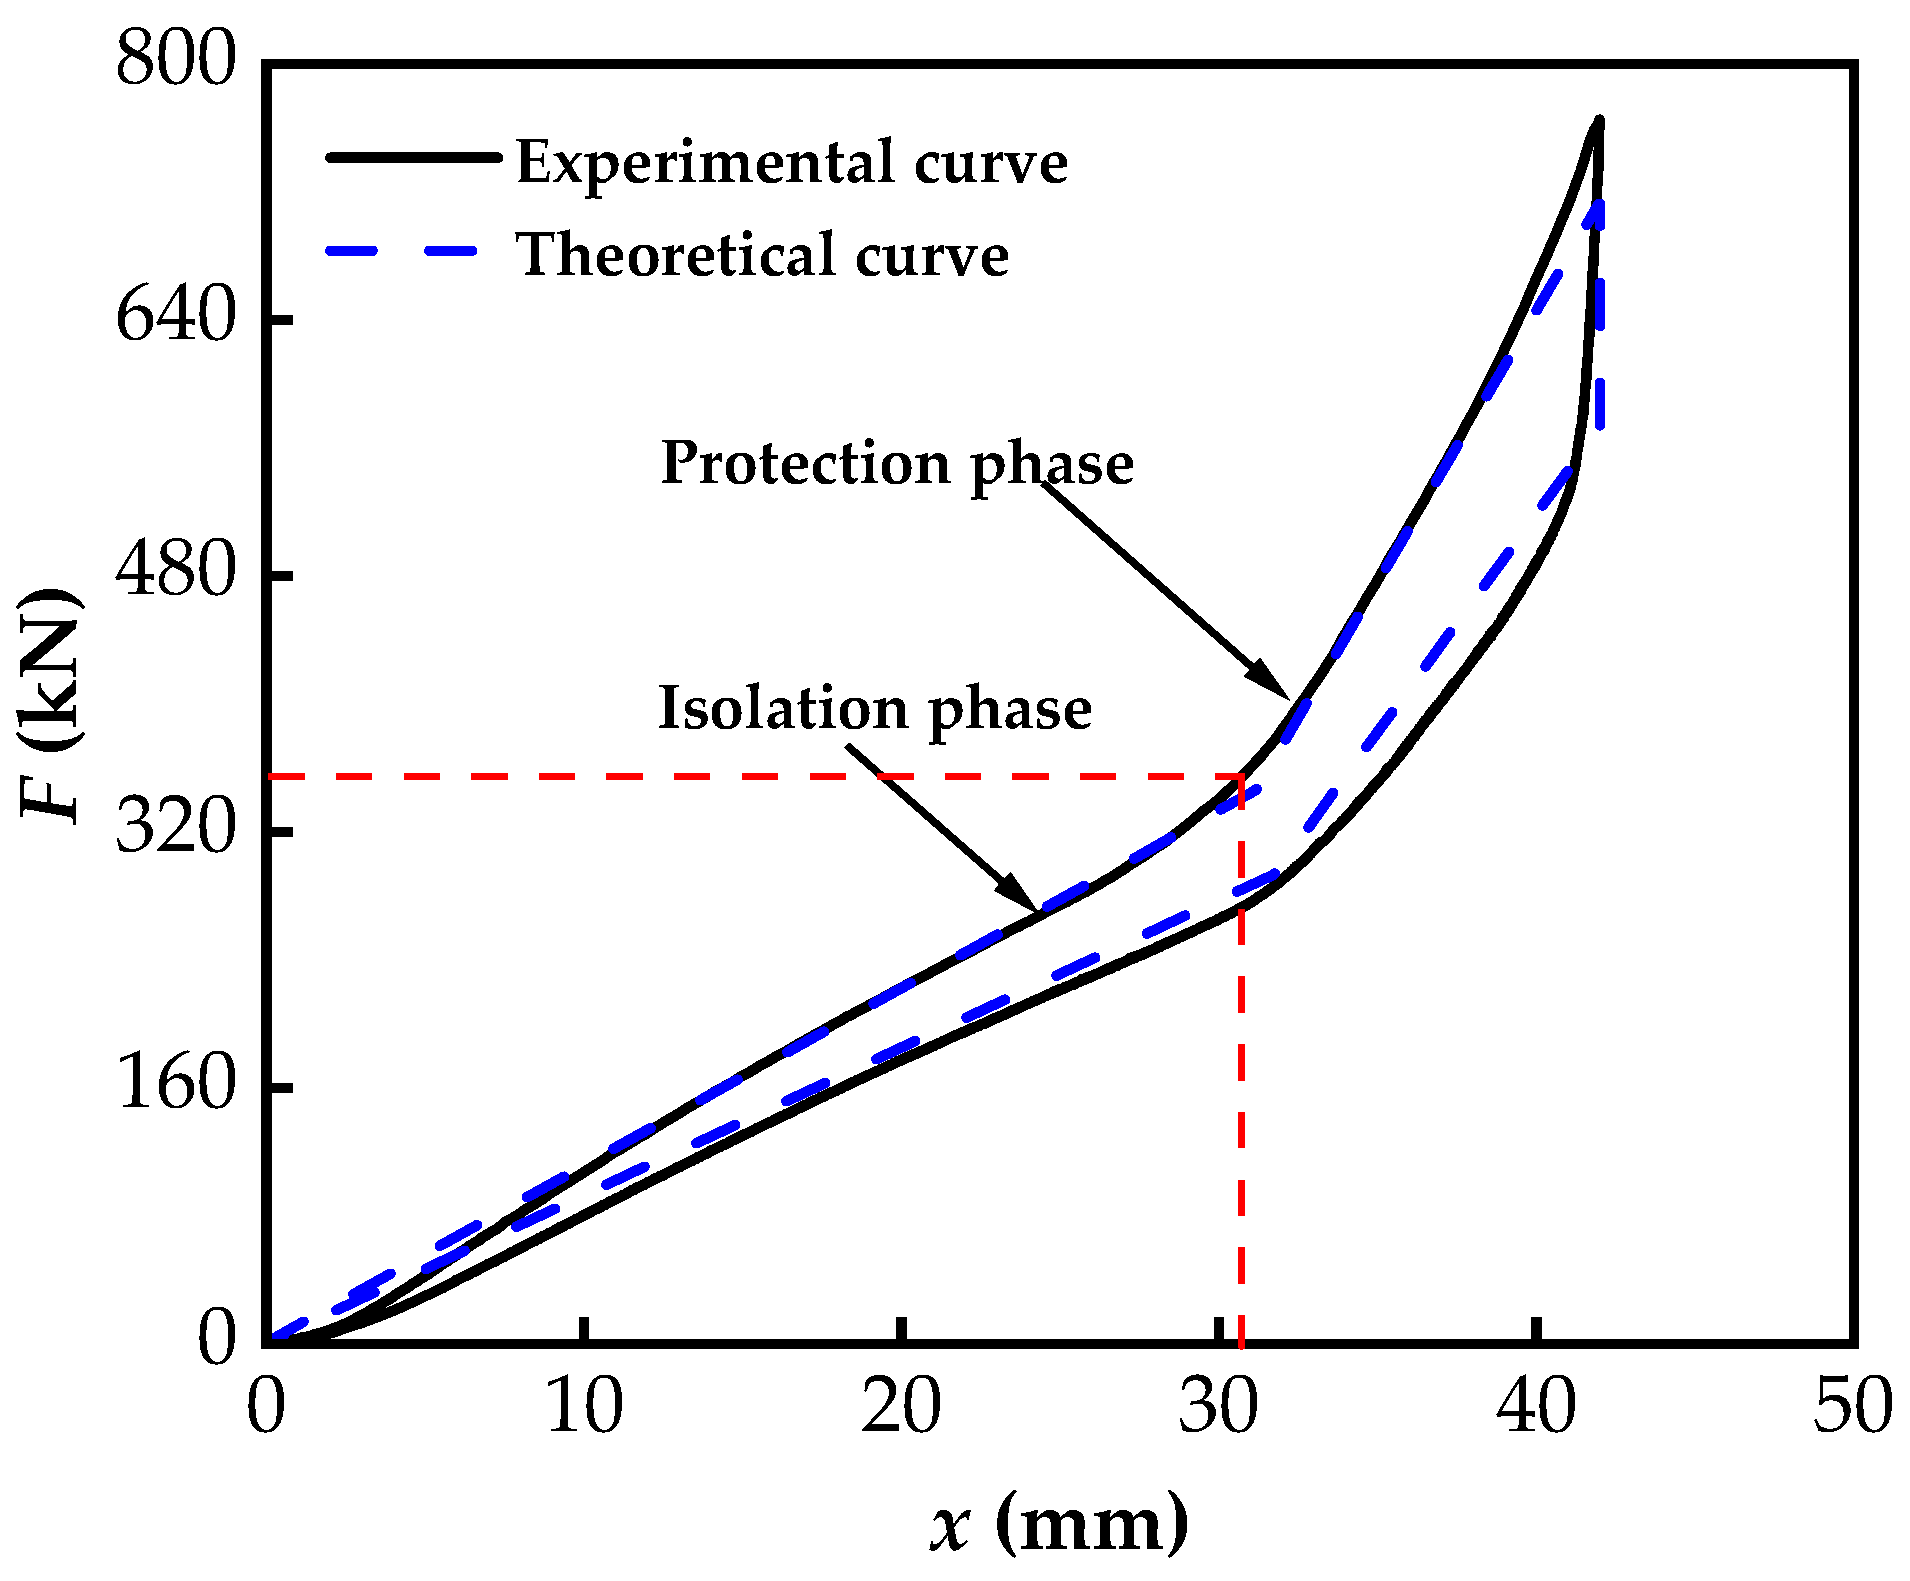
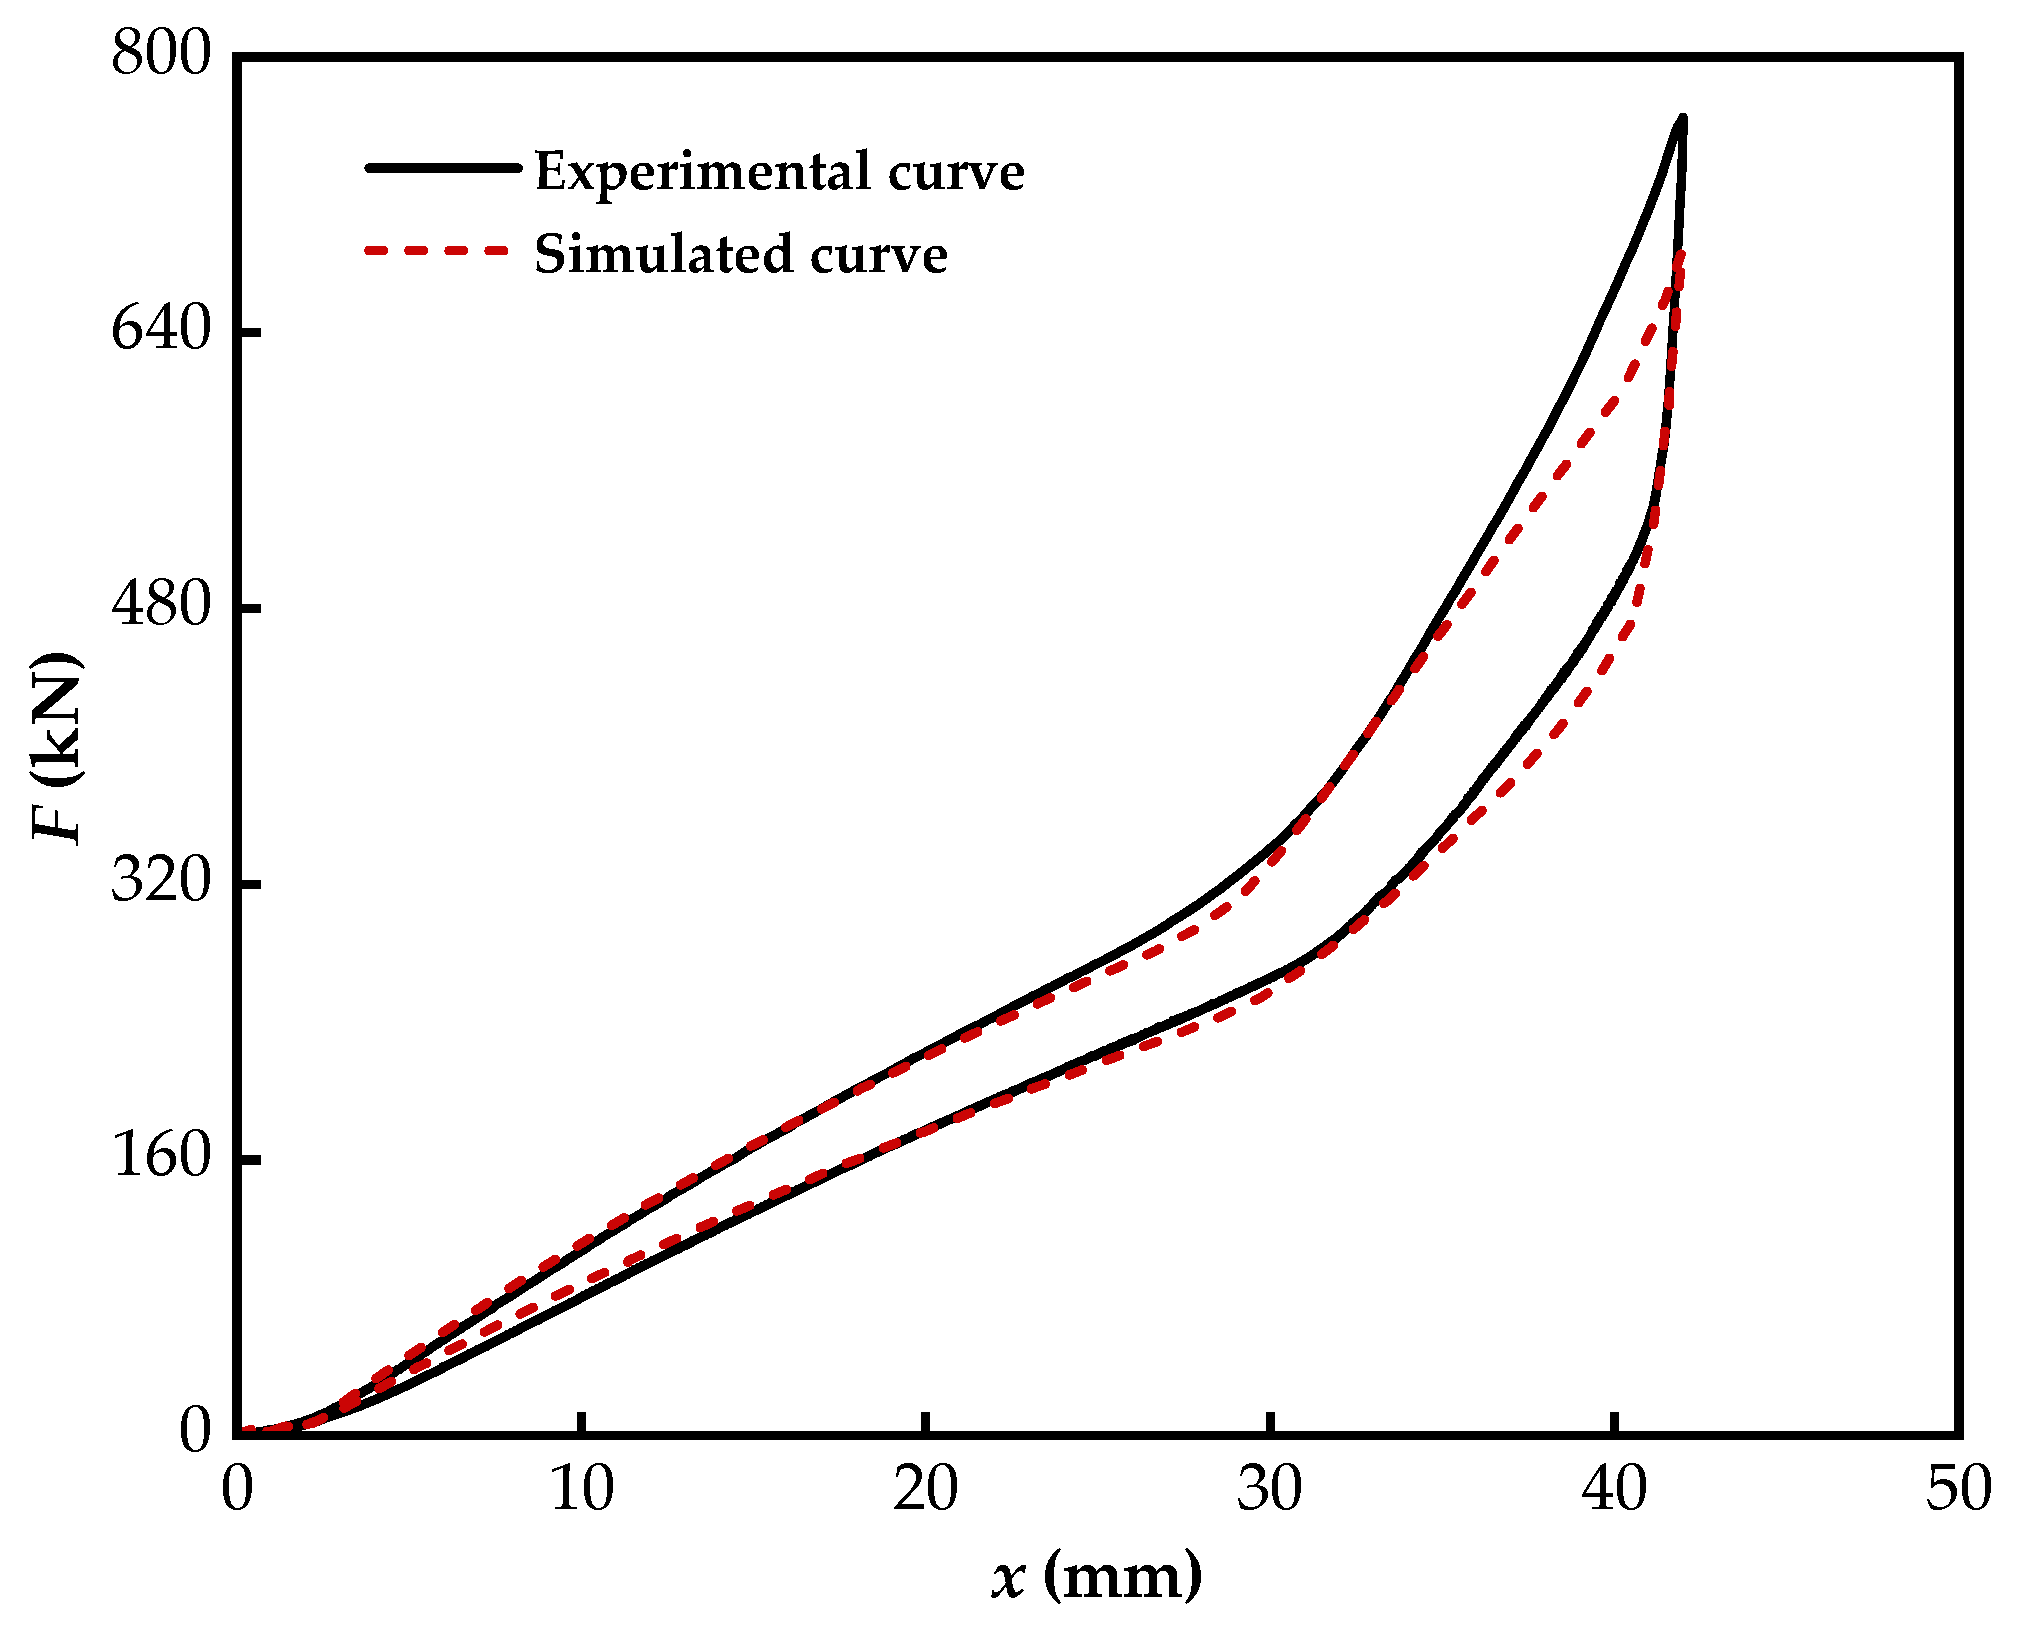
4.1. Results and Analysis of the Ultimate Load Test

The load-displacement curve of the bearing is shown in Figure 8. As observed, the protection phase begins at a displacement of 31.2 mm and ends at 42 mm. By calculating the slope of the curves in the isolation and protection phases, it is determined that the vertical stiffness of the bearing in the isolation phase is 11.66 kN/mm. When the loading displacement reaches 31.2 mm, the bearing transitions into the protection phase, where the stiffness increases to 37.06 kN/mm. Furthermore, after each loading cycle, the bearing fully recovers to its initial height without any signs of damage, demonstrating stable vertical load-bearing capacity.
Table 3 presents the experimental and theoretical peak loads and vertical stiffness of the bearing during the loading stage. As shown in the table, the maximum error for the peak load is 6.78%, while the maximum error for the equivalent stiffness reaches 8.47%. These results validate the accuracy of the proposed theoretical hysteresis model for the VVSDSI bearing.

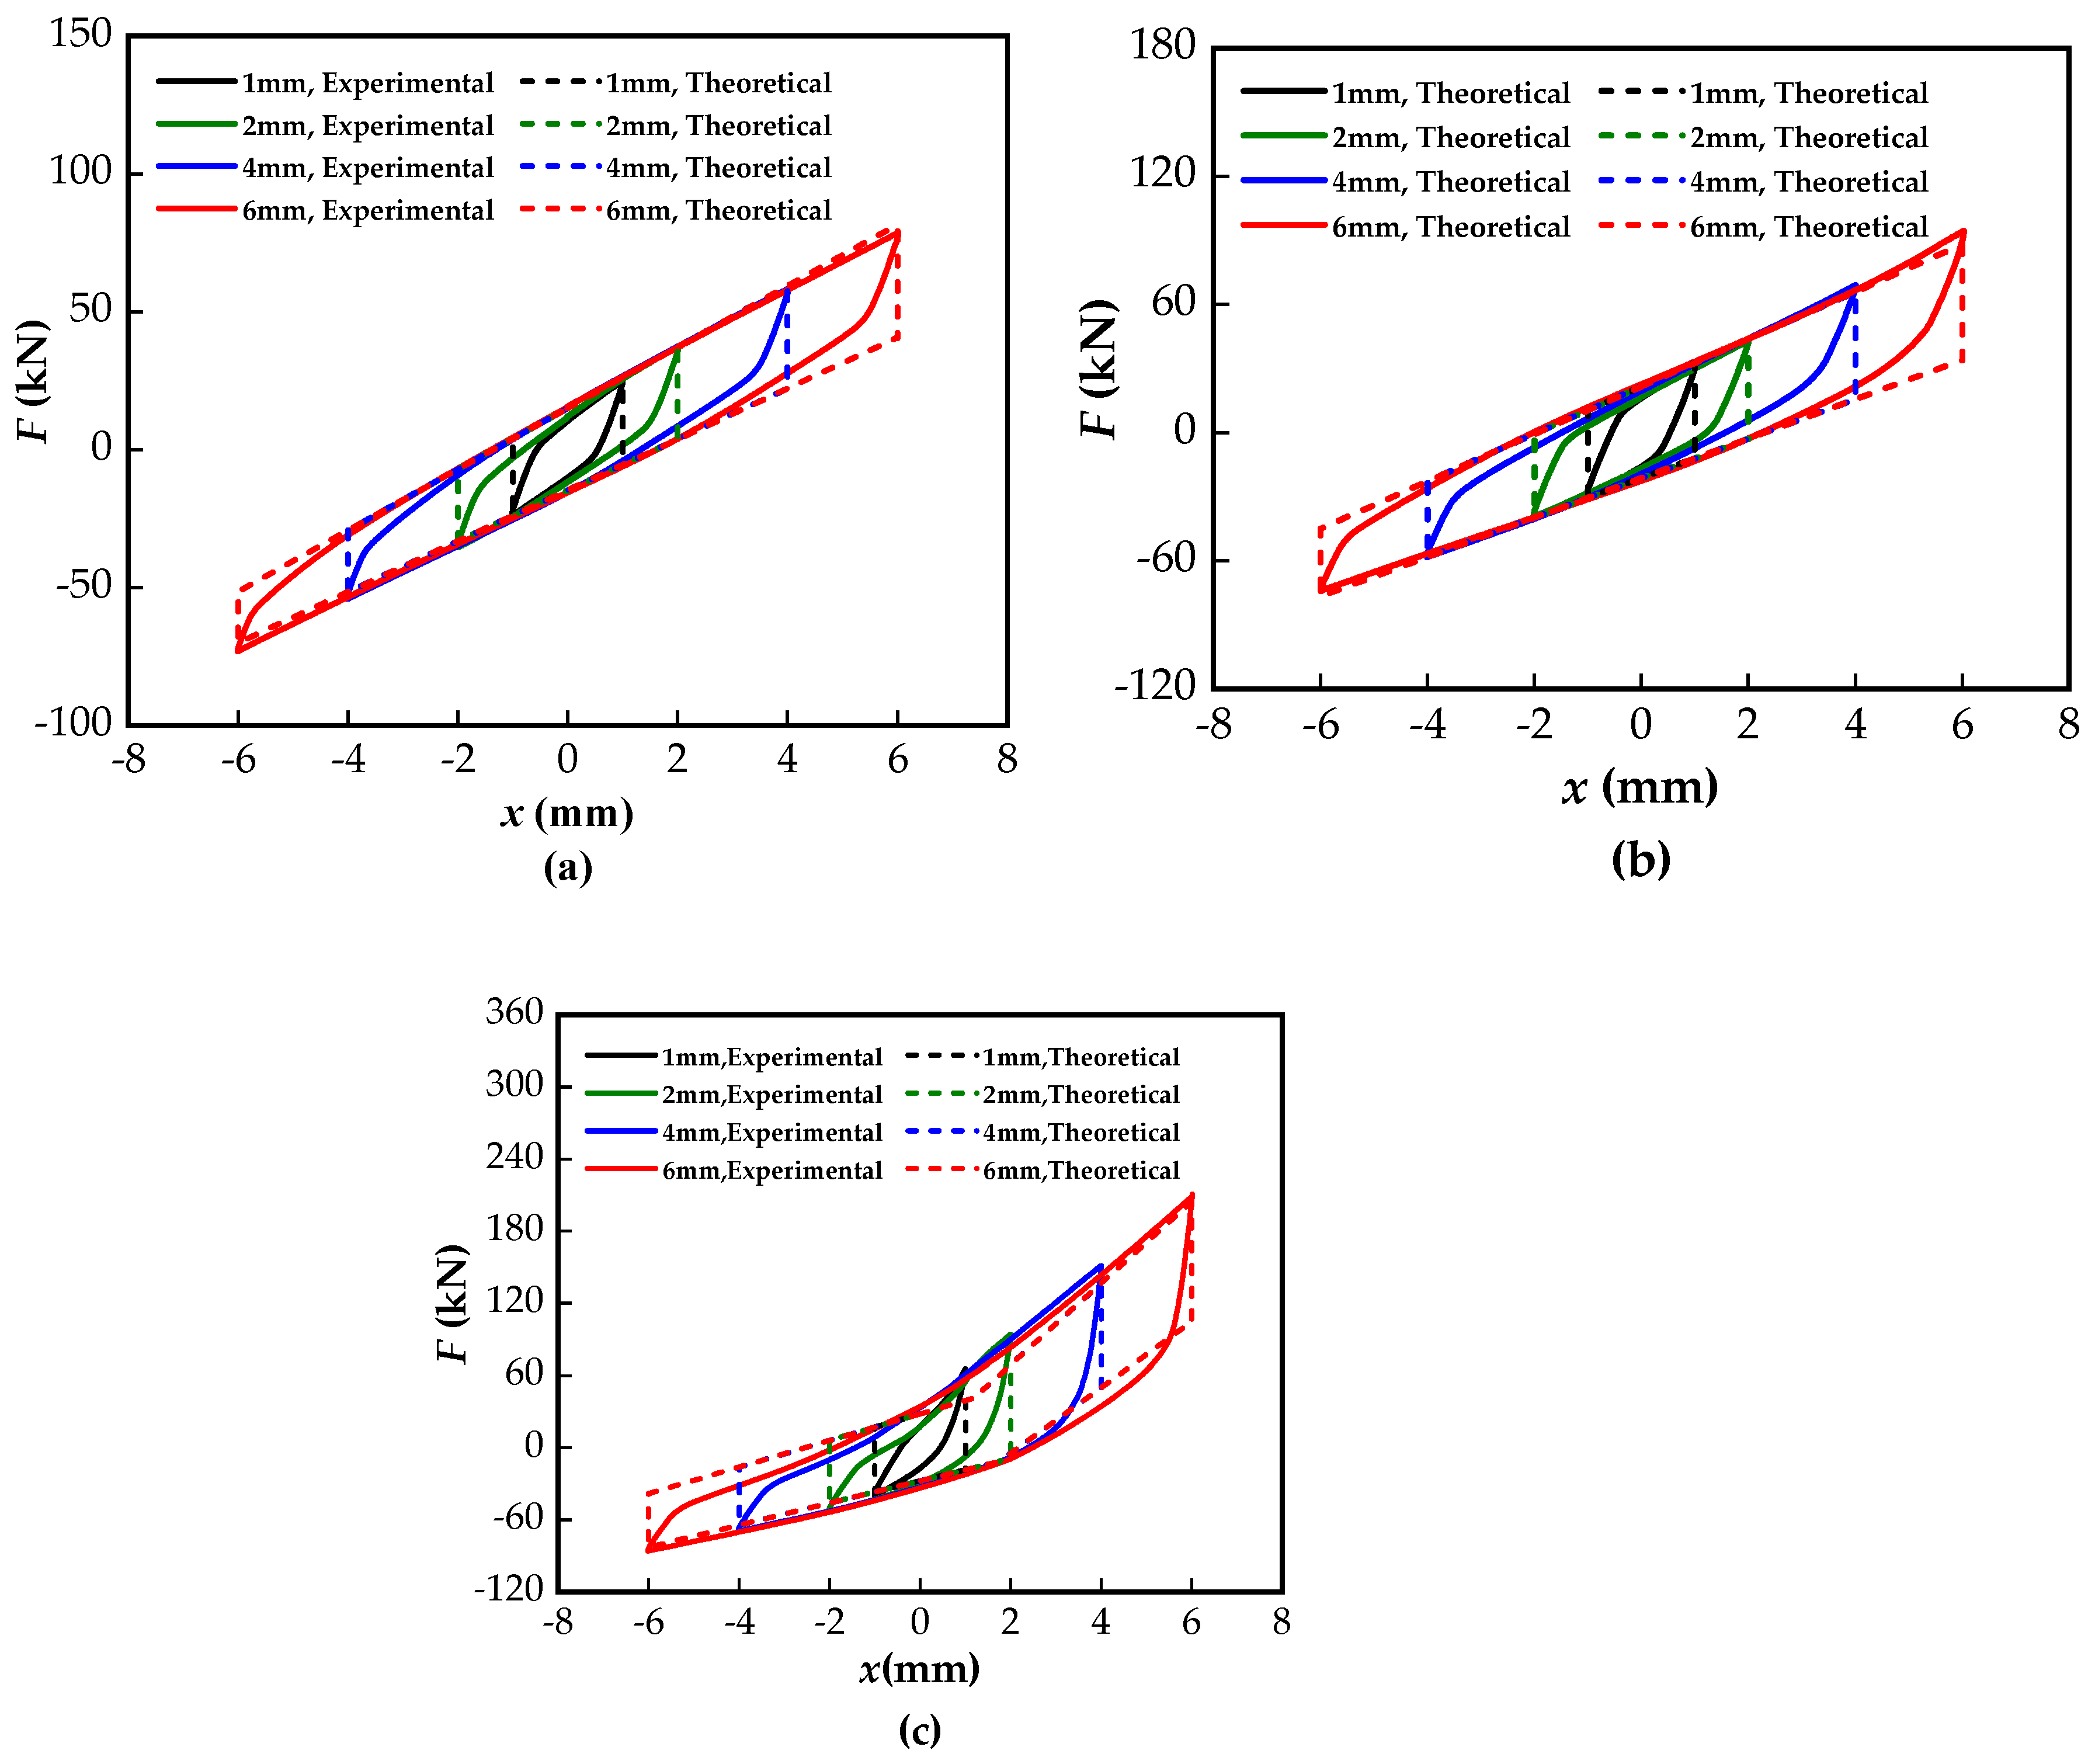
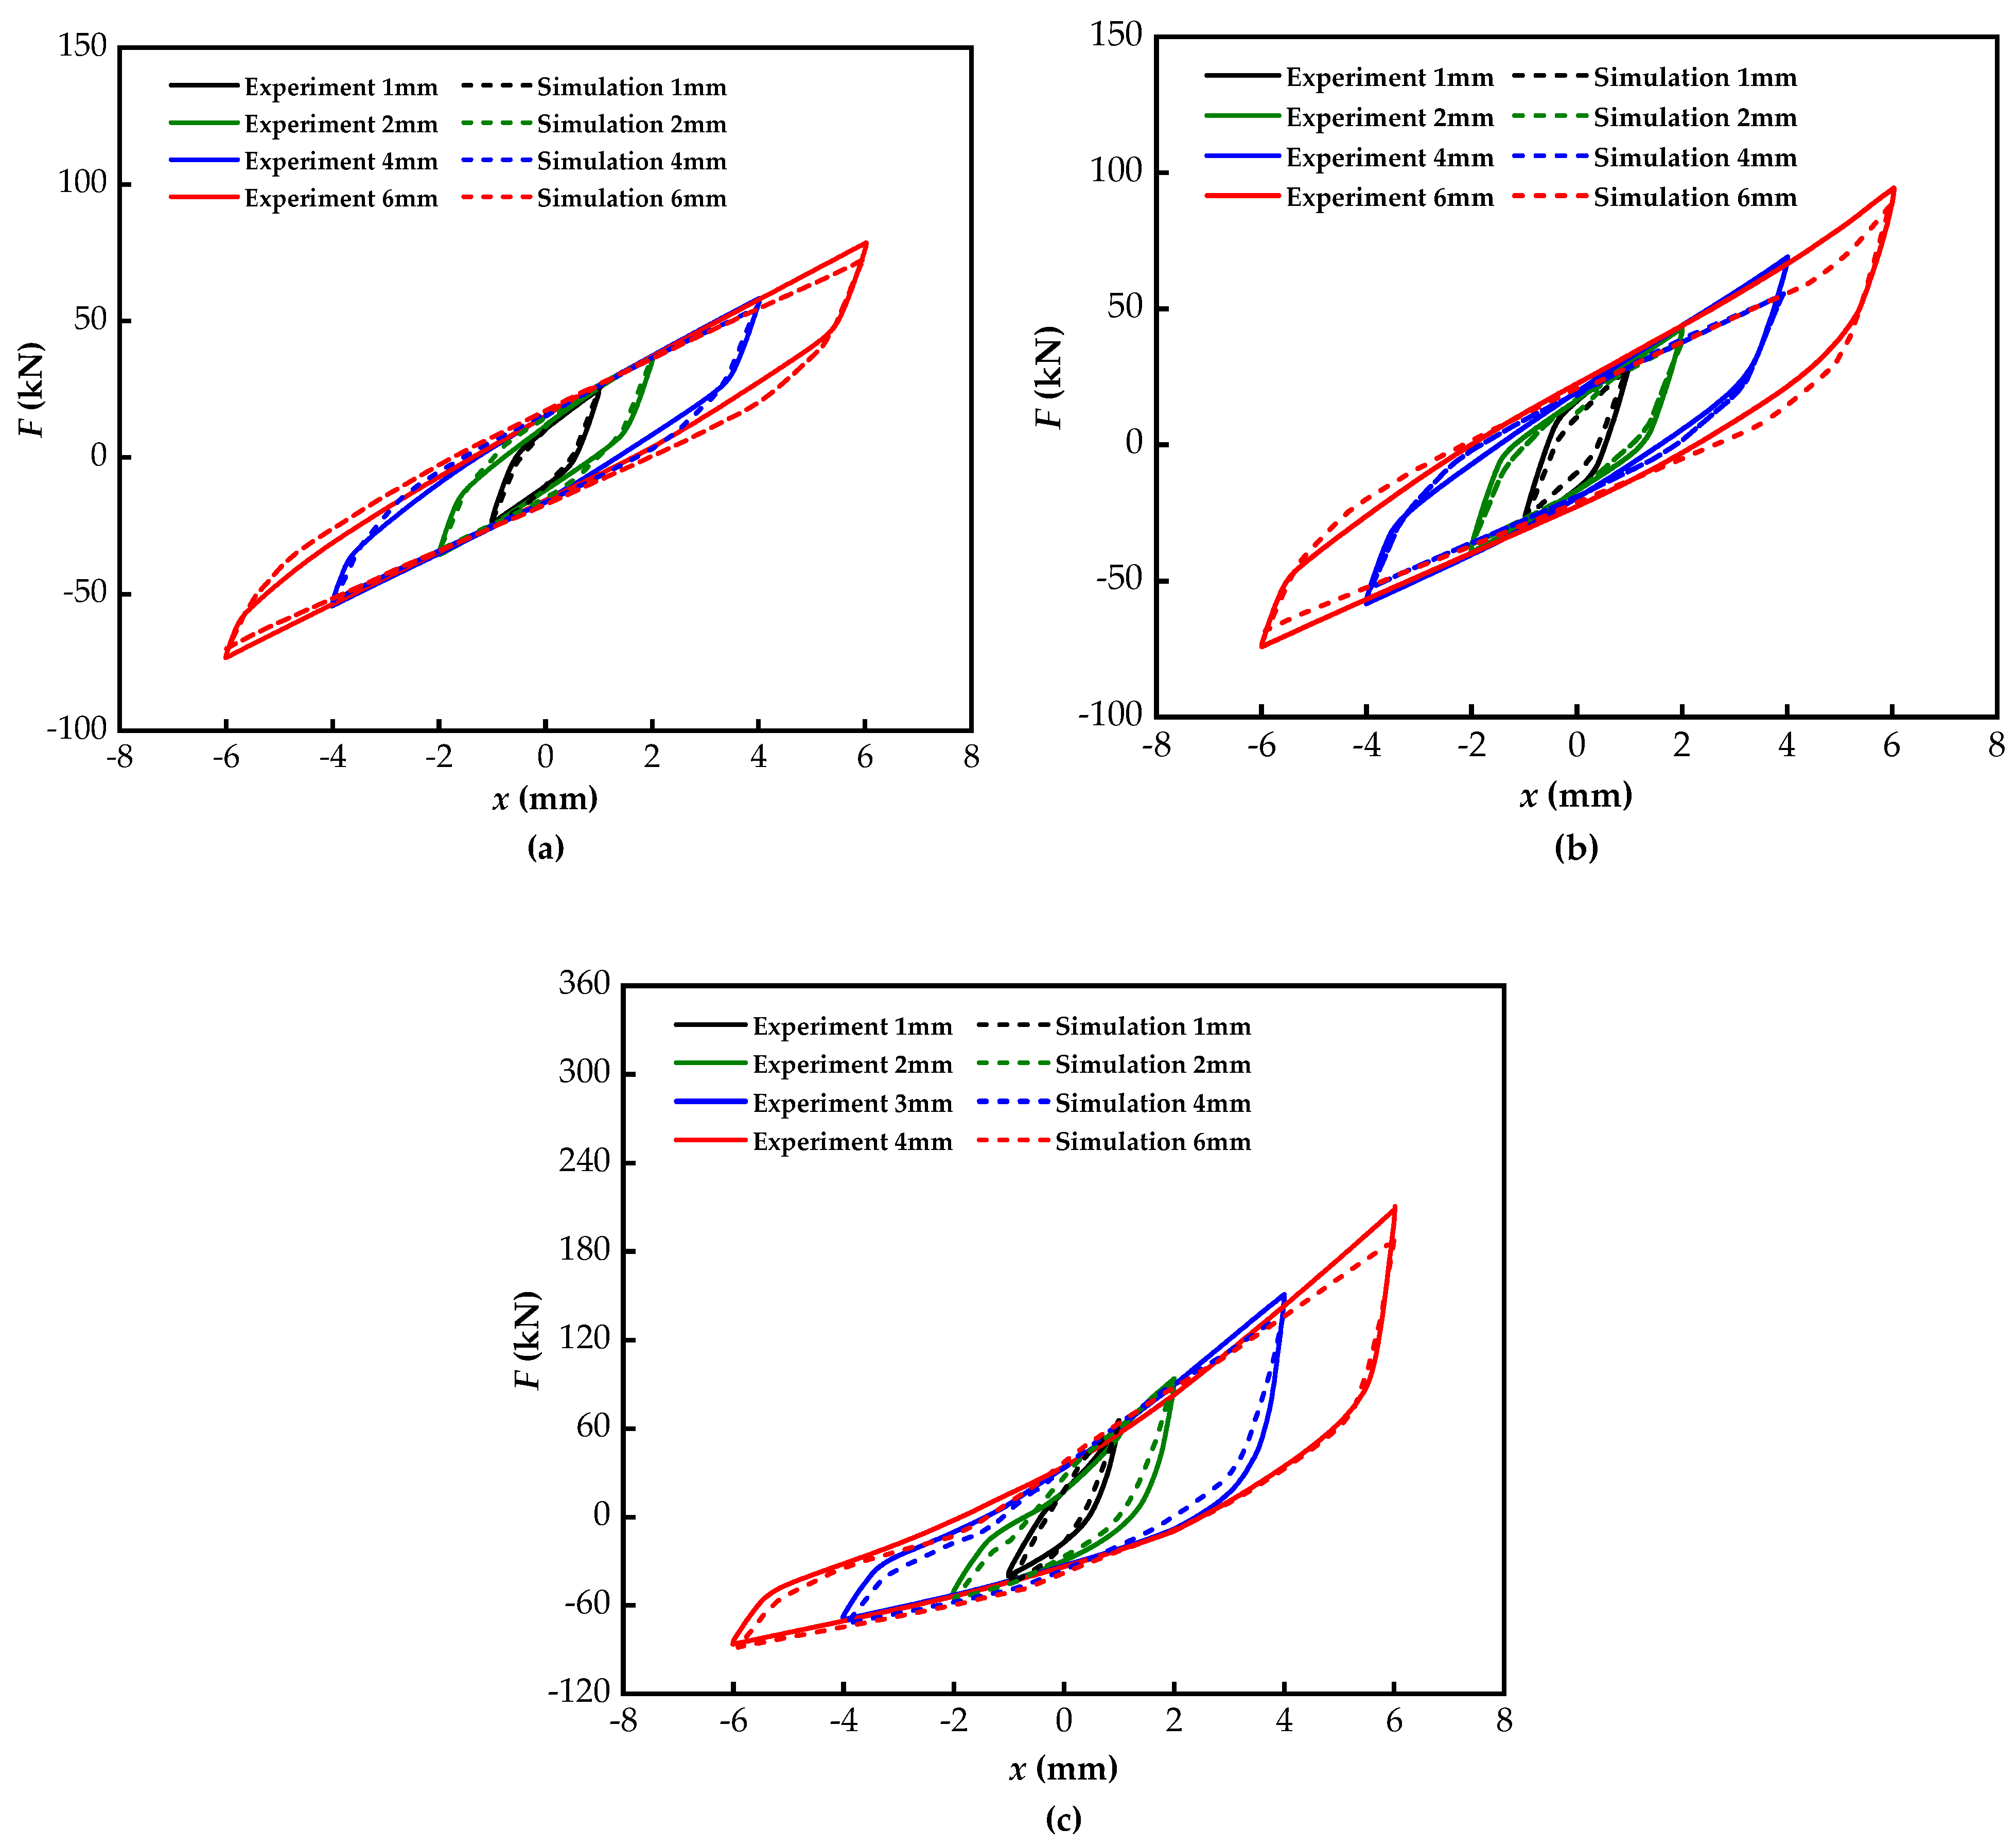
4.2. Results and Analysis of the Cyclic Load Test

To more intuitively analyze the influence of the preloading displacement and loading amplitude, the state of the bearing under preloading displacement is defined as the initial state, and the corresponding load value is zero. Figure 9 presents the hysteresis curves of the bearing under different loading amplitudes at the same preloading displacements (16 mm, 23 mm, and 30 mm). As observed, for a given preloading displacement, the upper and lower ends of the same hysteresis curve exhibit asymmetry, with the upper end appearing fuller than the lower end. This is primarily attributed to frictional damping forces. During loading, as pressure increases, frictional damping forces rise, resulting in a more pronounced hysteresis loop. Conversely, during unloading, the reduction in bearing pressure leads to a decrease in the frictional damping forces, causing the hysteresis loop to become narrower. Additionally, at the same preloading displacement, increasing the loading amplitude enhances the asymmetry of the hysteresis curve while reducing its fullness.
When the preloading displacement is 16 mm or 23 mm, the hysteresis curve of the bearing exhibits a bilinear characteristic. However, at a preloading displacement of 30 mm, the shape of the hysteresis curve changes significantly, with a noticeable increase in the vertical stiffness. This occurs because, in the isolation phase, both the upper and lower disc spring groups function together, resulting in lower vertical stiffness. Upon entering the protection phase, the upper disc spring group ceases to contribute, leading to an increase in vertical stiffness. Additionally, as the preloading displacement increases, the hysteresis curve becomes more pronounced. This is attributed to the greater vertical deformation and load on the disc springs at higher preloading displacements, which in turn increases the Coulomb friction force, thereby enhancing the energy dissipation capacity of the bearing.
The energy dissipation capacity of the bearing is evaluated by calculating the enclosed area of the hysteresis loop, as shown in Figure 10. Figure 10a illustrates that, at a constant preloading displacement, the energy dissipation of the bearing increases with the loading amplitude. Specifically, when the preloading displacement is 23 mm, the energy dissipation rises from 45.68 kN·mm to 458.38 kN·mm as the loading amplitude increases. Furthermore, a comparison of the slope of the curves under different preloading displacements reveals that at 16 mm, the slope is 57.48 kN·mm/mm, whereas at 23 mm, it increases to 82.54 kN·mm/mm. This indicates that as the loading amplitude increases, the influence of preloading displacement on energy dissipation becomes more pronounced. As shown in Figure 10b, at a loading amplitude of 2 mm, the energy dissipation values are 80.95 kN·mm, 112.67 kN·mm, and 174.22 kN·mm for different preloading displacements. When the loading amplitude increases to 4 mm, the corresponding energy dissipation values rise to 203.64 kN·mm, 262.88 kN·mm, and 515.68 kN·mm. These results demonstrate a positive correlation between the preloading displacement and energy dissipation capacity at a given loading amplitude.
Equivalent stiffness and equivalent damping ratio are the fundamental characteristics used to assess the seismic isolation capability of a bearing. Among them, the equivalent stiffness Ke is the slope of the bearing’s hysteresis curve, which can be determined using the following equation:
K e = F max F min D max D min
where Dmax and Dmin are the maximum displacement values in the loading and unloading directions of the hysteresis curve, respectively, and Fmax and Fmin are the loads corresponding to Dmax and Dmin, respectively.
According to the theoretical relationship between damping and energy loss, the formula for computing the equivalent damping ratio is as follows:
ζ = W 4 π ω S = 2 W π K e D 2
where W is the area of the hysteresis curve envelope, indicating the energy loss per cycle of the curve; ωs is the elastic strain energy; and D is the relative displacement of the hysteresis curve (D = DmaxDmin).
Table 4 presents the experimental and theoretical analysis results of hysteresis curves under different preloading displacements and loading amplitudes. The data in Table 4 show that the maximum errors of Fmax and Fmin are 7.13% and 3.45%, respectively, with average errors of 2.20% and 1.23%. The average error for equivalent stiffness values reaches 6.53%. It is worth noting that when the preloading displacement is 30 mm and the loading amplitudes are 1 mm and 2 mm, the equivalent stiffness error is relatively large. This phenomenon occurs because, at this stage, the upper disc spring group is approaching its limit state, leading to an increase in the nonlinearity of the disc springs, which in turn results in greater discrepancies. In summary, the experimental results align well with the theoretical solutions, indicating that the proposed variable-stiffness seismic isolation bearing (VVSDSI) hysteresis model can effectively predict the hysteretic behavior of the bearing.
Figure 11 and Table 5 compare the equivalent stiffnesses of the bearings under different preloading displacements and loading amplitudes. The results indicate that the vertical equivalent stiffness of the bearings ranges from 12.63 kN/mm to 52.42 kN/mm, with the minimum stiffness value of 12.63 kN/mm occurring at a preloading displacement of 16 mm and a loading amplitude of 6 mm. As shown in Figure 11a, when the preloading displacement is 16 mm, the equivalent stiffness decreases as the loading amplitude increases, with values of 24.26 kN/mm, 18.16 kN/mm, 14.02 kN/mm, and 12.63 kN/mm, respectively. This demonstrates that, for the same preloading displacement, the equivalent stiffness of the bearing decreases with an increasing loading amplitude. Figure 11b reveals that the equivalent stiffness of the bearing increases with an increasing preloading displacement. For instance, with a loading amplitude of 4 mm, the stiffness values are 14.02 kN/mm, 15.89 kN/mm, and 27.42 kN/mm, respectively. Moreover, when the preloading displacement is 30 mm, the equivalent stiffness is significantly higher compared to when the preloading displacement is 16 mm or 23 mm. This is because, at preloading displacements of 16 mm and 23 mm, both the upper and lower spring sets work together, resulting in lower vertical stiffness. In contrast, at a preloading displacement of 30 mm, the upper spring set is close to its limit state, while the lower spring set continues to operate, thereby increasing the vertical stiffness.
Figure 12 and Table 6 compare the equivalent damping ratios of the bearings under different preloading displacements and loading amplitudes. The results show that the equivalent damping ratio ranges from 11.12% to 23.96%. As seen in Figure 12a, when the preloading displacement is 16 mm or 23 mm, the equivalent damping ratio decreases with an increasing loading amplitude. This phenomenon is attributed to the reduction in the fullness of the hysteresis loop as the loading amplitude increases, leading to a lower equivalent damping ratio. When the preloading displacement is 30 mm, the equivalent damping ratio first increases and then decreases with an increasing loading amplitude. This is due to significant changes in the bearing’s stiffness during this stage, which affects the equivalent damping ratio. Figure 12b shows that, for the same loading amplitude, the equivalent damping ratio is generally higher when the preloading displacement is 23 mm compared to 16 mm. This indicates that, during the isolation phase, the equivalent damping ratio increases with the preloading displacement.

4.3. Performance Comparison Between VVSDSI Seismic Isolation Bearings and Traditional Disc Spring Seismic Isolation Bearings

In order to further study the mechanical properties of the VVSDSI bearing, this paper compares the working performance of the proposed seismic isolation bearing (VVSDSI) and the conventional disc spring seismic isolation bearing (CSDVI) [22] during loading. By normalizing the force–displacement curve, the performance difference between the two bearings can be analyzed more intuitively.
As shown in Figure 13, the curve of the CSDVI bearing approximates a single-stiffness curve. The force–displacement relationship exhibits a linear growth trend with increasing displacement, reflecting the fixed stiffness response characteristic of traditional disc spring seismic isolation bearings. In contrast, the VVSDSI bearing demonstrates a bilinear stiffness characteristic with two distinct phases. During the initial stage, its lower stiffness manifests as a gentle ascending curve, enabling a flexible response under minor displacements to effectively absorb seismic energy. As displacements increase, the bearing transitions into the second phase where stiffness is significantly enhanced. This design provides stronger supporting forces to meet the isolation requirements under larger displacements. Overall, the VVSDSI exhibits smoother and more efficient isolation characteristics during seismic events, thereby enhancing the seismic performance of structures.

5. Numerical Simulation of VVSDSI Bearing

5.1. Element Type and Material Constitutive Model

This section conducts a numerical simulation analysis on the VVSDSI bearing using ABAQUS finite element software. The disc spring material is 60Si2Mn with an elastic modulus E = 2.06 × 10⁵ MPa and Poisson’s ratio μ = 0.3. During the modeling process, the disc spring is simulated using an 8-node incompatible mode hexahedral element (C3D8I). The influence of guide rods is neglected, while the upper connecting plate, middle steel plate, and lower connecting plate are all modeled as rigid materials. The finite element model of the VVSDSI bearing is shown in Figure 14.

5.2. Contact Unit Definition

During the operation of disc springs, friction forces are generated between both the contact surfaces of disc springs and connecting plates, as well as between the end faces of disc springs and connecting plates. Based on the relevant literature [32,33] and finite element trial calculation results, the friction coefficients in the finite element simulations are determined as follows: the friction coefficient between disc springs and the connecting plate contact surfaces is set to 0.6, while that between the disc spring end faces is set to 0.25. The contact type employs a surface-to-surface interaction, with normal contact behavior simulated using hard contact elements and tangential contact behavior modeled through the penalty function method.

5.3. Boundary Conditions and Loading Configuration

The lower connecting plate is fixed as the boundary condition, while the upper connecting plate is loaded using a displacement-controlled method. To prevent lateral movement of the disc spring during the loading process, horizontal constraints are applied at two symmetrical points on its lower edge.

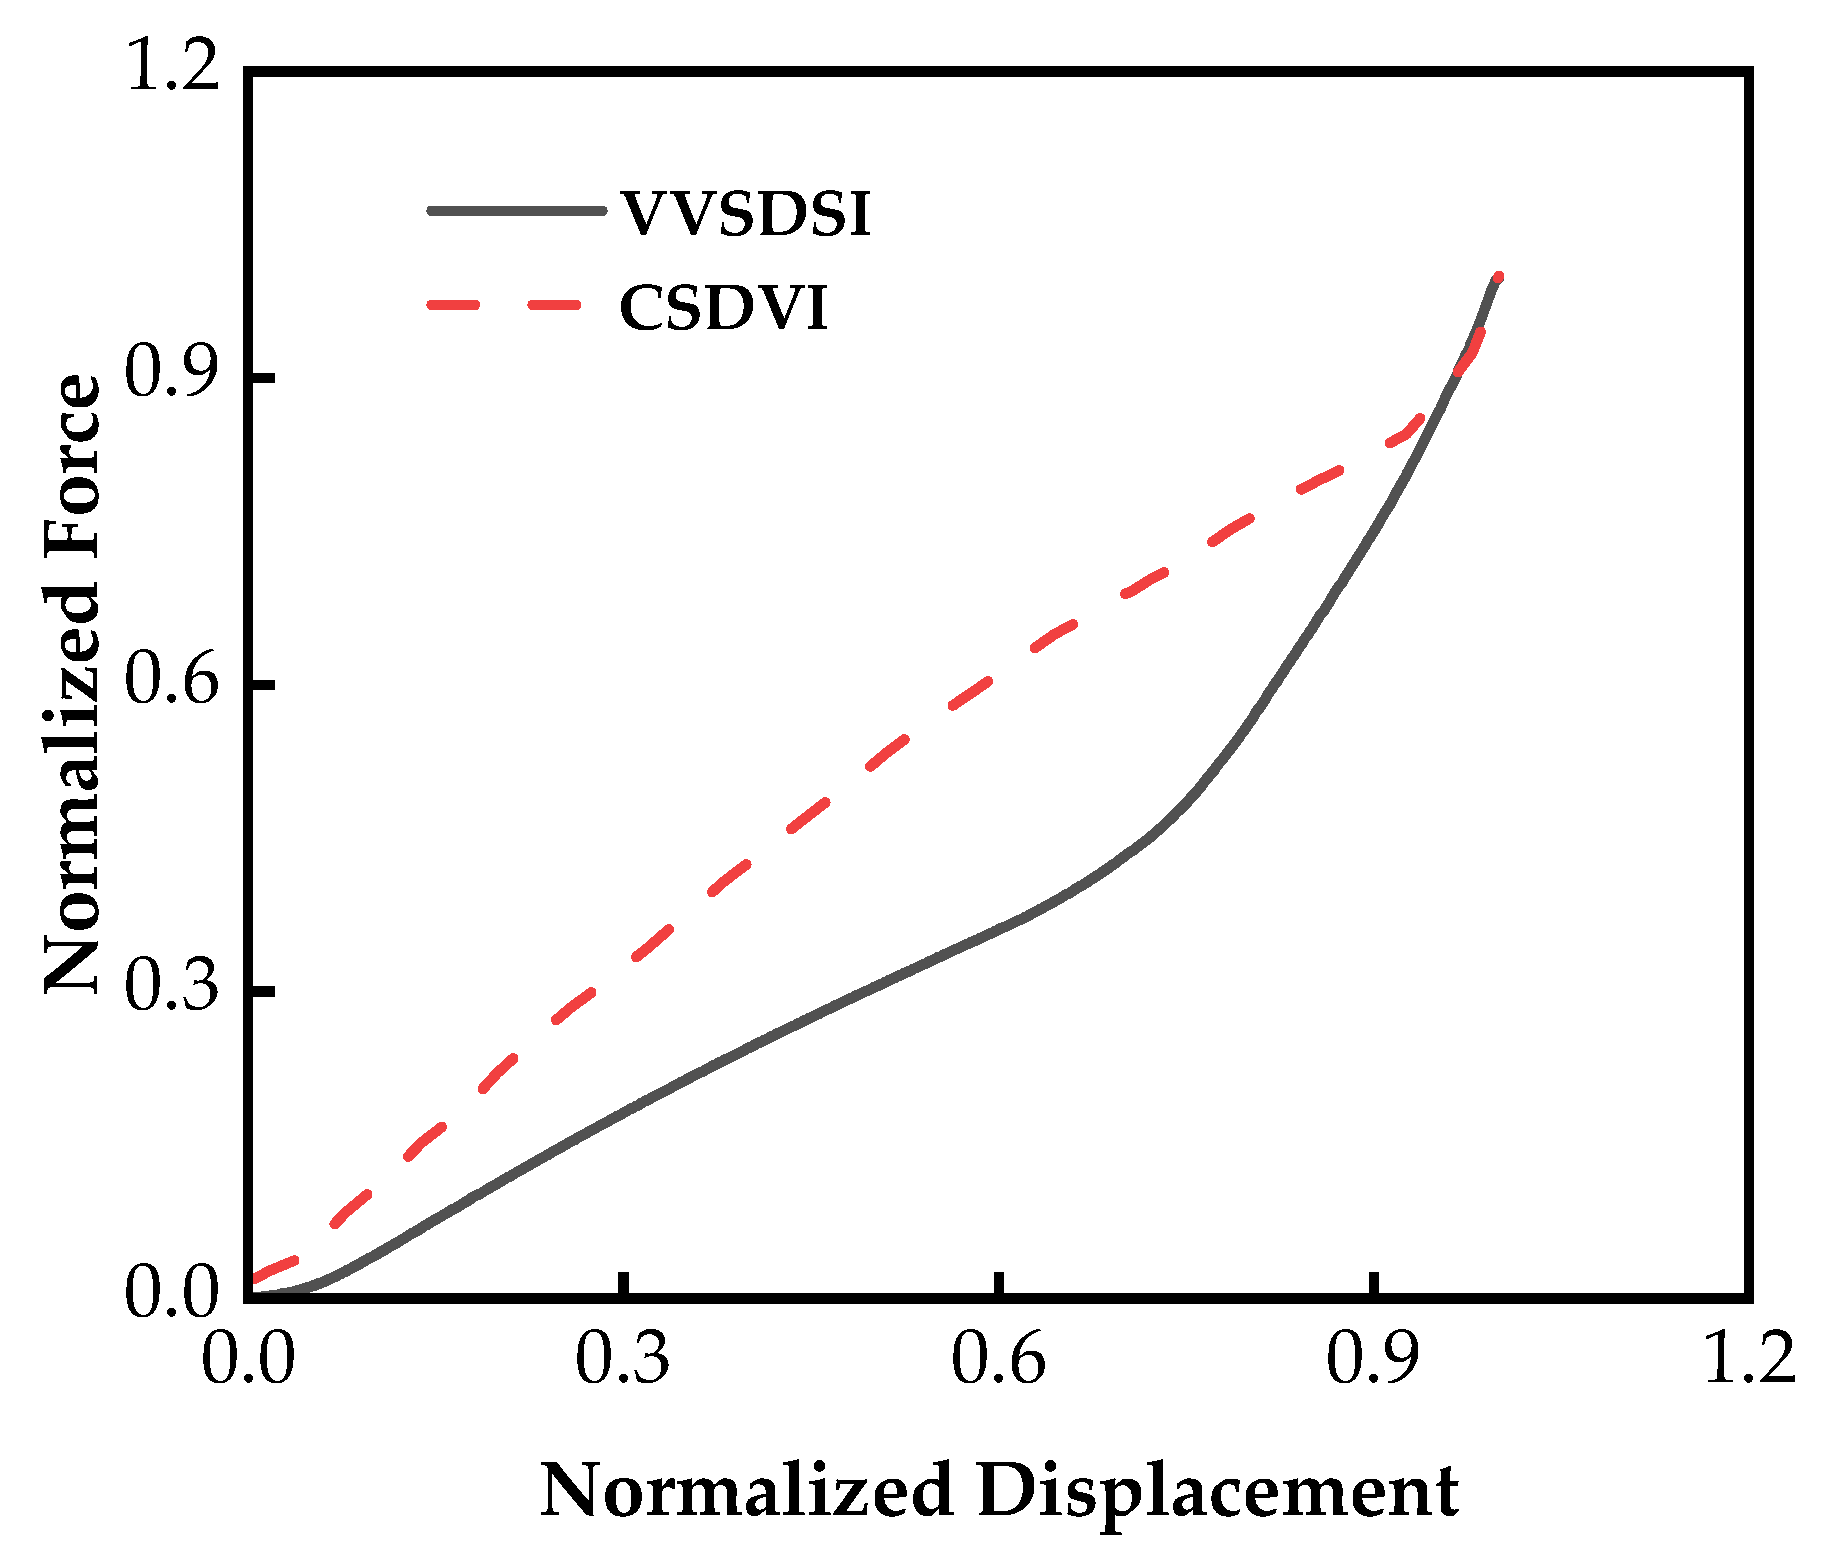
5.4. Comparative Analysis of Test Results and Numerical Simulation Results

Figure 15 shows the comparison between experimental results and numerical simulation results of the load-displacement curves for VVSDSI bearings under ultimate loading conditions. As can be seen from the figure, the simulated values of VVSDSI bearings exhibit similar overall curve characteristics to the experimental values in terms of the shape. During the seismic isolation phase, the force–displacement curves of the bearings show good agreement between simulation and experimental results. However, after entering the protection phase, the deviation between simulation results and experimental values increases, with the peak load error reaching 10.07%. Although local discrepancies exist, the overall comparative results demonstrate that the numerical model can effectively predict the mechanical behavior of the bearings.
According to the comparison of load-displacement curves for VVSDSI bearings under cyclic loading shown in Figure 16, the numerical simulation results reproduced the typical hysteretic characteristics of the experimental curves well. Both exhibit good agreement in terms of amplitude variation and hysteretic loop morphology. Table 7 compares experimental and numerical simulation results for the equivalent stiffnesses of VVSDSI bearings under cyclic loading. The results demonstrate satisfactory consistency between numerical simulations and experimental data, with a maximum error of 13.34% and an average error of 5.32%.

6. Conclusions

  • Compared to traditional disc spring bearings, the proposed VVSDSI bearing in this study demonstrates two distinct vertical stiffness stages. During the isolation phase, the VVSDSI isolation bearing exhibits lower stiffness with a bilinear hysteretic curve. As the displacement load increases and the bearing enters the protection stage, its vertical stiffness shows significant enhancement.
  • The load-displacement hysteresis curve of the VVSDSI bearing exhibits typical asymmetry. Studies have shown that increasing the preloading displacement results in a fuller hysteresis curve, enhancing the energy dissipation capacity of the bearing. In contrast, increasing the load amplitude reduces the fullness of the hysteresis curve and exacerbates its asymmetry. During the seismic isolation phase, the preloading displacement is positively correlated with the equivalent stiffness and damping ratio, while the load amplitude shows a negative correlation with these parameters.
  • A comparison between the experimental and theoretical results shows that the maximum errors for Fmax and Fmin are 7.13% and 3.45%, respectively, with average errors of 2.20% and 1.23%. The average error in the equivalent stiffness (Ke) is 6.53%. These findings demonstrate that the theoretical model is accurate enough to predict the actual mechanical behavior and can be applied for design purposes.
  • Under the action of ultimate load and cyclic load, the load-displacement hysteresis curve characteristics of the VVSDSI bearing simulation and test are similar, and the simulation results are in good agreement with the experimental results. Among them, the peak load error is 10.07%, and the average error of the equivalent stiffness value is 5.32%.

Author Contributions

Conceptualization, J.-C.X. and K.-J.M.; Methodology, Y.L. and J.-C.X.; Investigation, C.L.; Writing—original draft, Y.L.; Writing—review and editing, Y.L. and H.-M.Z.; Funding acquisition, J.-C.X.; Resources, K.-J.M. All authors have read and agreed to the published version of the manuscript.

Funding

This research was funded by National Natural Science Foundation of China (Grant No. 50978064); the Guiyang Municipal Civil Air Defense Engineering Quality Supervision Station Project (No. 2017-068CG); and the Guiyang Science and Technology Plan Project (No. [2022]44-1).

Institutional Review Board Statement

Not applicable.

Informed Consent Statement

Not applicable.

Data Availability Statement

The raw data are available on request via email from the corresponding author.

Conflicts of Interest

The authors declare no conflicts of interest.

Abbreviations

The following abbreviations are used in this manuscript:
VVSDSIVertical Variable Stiffness Disc Spring Isolation

References

  1. Warn, G.P.; Ryan, K.L. A Review of Seismic Isolation for Buildings: Historical Development and Research Needs. Buildings 2012, 2, 300–325. [Google Scholar] [CrossRef]
  2. Calvi, P.M.; Calvi, G.M. Historical development of friction-based seismic isolation systems. Soil Dyn. Earthq. Eng. 2018, 106, 14–30. [Google Scholar] [CrossRef]
  3. Rakicevic, Z.; Bogdanovic, A.; Farsangi, E.N.; Sivandi-Pour, A. A Hybrid Seismic Isolation System Toward More Resilient Structures: Shaking Table Experiment and Fragility Analysis. J. Build. Eng. 2021, 38, 102194. [Google Scholar] [CrossRef]
  4. Papazoglou, A.; Elnashai, A. Analytical and field evidence of the damaging effect of vertical earthquake ground motion. Earthq. Eng. Struct. Dyn. 1996, 25, 1109–1137. [Google Scholar] [CrossRef]
  5. Bozorgnia, Y.; Niazi, M.; Campbell, K.W. Characteristics of free-field vertical ground motion during the Northridge earthquake. Earthq. Spectra 1995, 11, 515–525. [Google Scholar] [CrossRef]
  6. Shabestari, K.T.; Yamazaki, F. Near-fault spatial variation in strong ground motion due to rupture directivity and hanging wall effects from the Chi-Chi, Taiwan earthquake. Earthq. Eng. Struct. Dyn. 2010, 32, 2197–2219. [Google Scholar] [CrossRef]
  7. Xue, Q. Need of performance-based earthquake engineering in Taiwan: A lesson from the Chichi earthquake. Earthq. Eng. Struct. Dyn. 2000, 29, 1609–1627. [Google Scholar] [CrossRef]
  8. Zhang, Y.; Dong, S.; Hou, C.; Jusong, S.; Zhonghai, W.; Hailong, L.; Ping, S.; Gang, L. Seismogenic Structure of the April 20, 2013, Lushan Ms7 Earthquake in Sichuan. Acta Geol. Sin. 2013, 87, 13. [Google Scholar] [CrossRef]
  9. Liu, W.; Tian, K.; Wei, L.; He, W.; Yang, Q. Earthquake response and isolation effect analysis for separation type three-dimensional isolated structure. Bull. Earthq. Eng. 2018, 16, 6335–6364. [Google Scholar] [CrossRef]
  10. Xu, J.; Gao, H.; Guo, Z.; Zhao, J.; Yang, Z.; Zhao, G.; Guo, Z.; Liu, D.; Sun, W. Key technologies research on of soil-structure interaction base story isolated structure response in 3D seismic zone. Front. Earth Sci. 2023, 11, 1254042. [Google Scholar] [CrossRef]
  11. Makris, N.; Constantinou, M. Spring-viscous damper systems for combined seismic and vibration isolation. Earthq. Eng. Struct. Dyn. 1992, 21, 649–664. [Google Scholar] [CrossRef]
  12. Liang, Q.; Luo, W.; Zhou, Y.; Ke, X.; Li, J. Seismic performance of a novel three-dimensional isolation bearing. J. Build. Eng. 2022, 57, 104818. [Google Scholar] [CrossRef]
  13. Liang, Q.; Luo, W.; Zhou, Y.; Lu, Z.; Li, J.; He, Z. Vibration filtering effect of a novel three-dimensional isolation bearing on metro vibration isolation. Eng. Struct. 2024, 301, 117304. [Google Scholar] [CrossRef]
  14. Han, Q.; Jing, M.; Lu, Y.; Liu, M. Mechanical behaviors of air spring-FPS three-dimensional isolation bearing and isolation performance analysis. Soil Dyn. Earthq. Eng. 2021, 149, 106872. [Google Scholar] [CrossRef]
  15. Eltahawy, W.; Ryan, K.; Cesmeci, S.; Gordaninejad, F. Displacement/velocity-based control of a liquid spring—MR damper for vertical isolation. Struct. Control Health Monit. 2019, 26, e2363. [Google Scholar] [CrossRef]
  16. Xu, Z.; Huang, X.; Guo, Y.; Wang, S.-A. Study of the properties of a multi-dimensional earthquake isolation device for reticulated structures. J. Constr. Steel Res. 2013, 88, 63–78. [Google Scholar] [CrossRef]
  17. Xu, Z.; Gai, P.; Zhao, H.; Huang, X.-H.; Lu, L.-Y. Experimental and theoretical study on a building structure controlled by multi-dimensional earthquake isolation and mitigation devices. Nonlinear Dyn. 2017, 89, 723–740. [Google Scholar] [CrossRef]
  18. Hong, X.J.; Zhu, S.; Xu, Y.L. Three-dimensional vibration control of high-tech facilities against earthquakes and microvibration using hybrid platform. Earthq. Eng. Struct. Dyn. 2010, 39, 615–634. [Google Scholar] [CrossRef]
  19. Xue, S.; Zhu, T. Performance test study of vertical isolation bearings with disc springs. In Proceedings of the 16th National Structural Engineering Conference, Paris, France, 28–31 July 2007; Volume III. [Google Scholar]
  20. Yang, Q.; Guo, Y.; Fu, H.; Li, X. Experimental study on the vertical seismic isolation performance of an array of disc springs column supports. Build. Struct. 2017, 47, 330–335. [Google Scholar]
  21. Li, A.; Wang, W. Three-dimensional multi-functional vibration isolation bearing design and its application in vibration reduction of subway construction. Earthq. Eng. Eng. Dyn. 2014, 34, 202–208. [Google Scholar]
  22. Wang, W.; Wang, X. Tests, model, and applications for coned-disc-spring vertical isolation bearings. Bull. Earthq. Eng. 2020, 18, 357–398. [Google Scholar] [CrossRef]
  23. Zhao, Y.; Su, J.; Zhou, X.; Sui, Y. Vibration table test and numerical simulation of vertical isolation structure with dish springs. J. Build. Struct. 2008, 29, 99–106. [Google Scholar] [CrossRef]
  24. Xiong, S.; Huang, L.; Chen, J.; Su, J. Multi-dimensional Seismic Response Analysis of Base-Isolated Frame Structure with 3D Isolator. J. Earth Sci. 2005, 16, 66–71. [Google Scholar]
  25. Zhu, X.; Pan, R.; Li, J.; Lin, G. Study of isolation effectiveness of nuclear reactor building with three-dimensional seismic base isolation. Eng. Comput. 2021, 39, 1209–1233. [Google Scholar] [CrossRef]
  26. Somaki, T.; Nakatogawa, T.; Miyamoto, A.; Sugiyama, K.; Oyobe, Y.; Tamachi, K. Development of 3 Dimensional Base Isolation System for Nuclear Power Plants. In Proceedings of the 16th International Conference on Structural Mechanics in Reactor Technology (SMiRT 16), Washington, DC, USA, 12–17 August 2001. [Google Scholar]
  27. Song, R.; Song, X.; Tian, J. Mechanical and performance analysis of vertical variable stiffness isolation bearing. Build. Sci. 2022, 38, 25–33. [Google Scholar] [CrossRef]
  28. Chen, Z.; Ding, Y.; Shi, Y.; Li, Z. A vertical isolation device with variable stiffness for long-span spatial structures. Soil Dyn. Earthq. Eng. 2019, 123, 543–558. [Google Scholar] [CrossRef]
  29. Dong, W.; Shi, Y.; Wang, Q.; Wang, Y.; Yan, J.-B. Development of a long-period vertical base isolation device with variable stiffness for steel frame structures. Soil Dyn. Earthq. Eng. 2023, 164, 107638. [Google Scholar] [CrossRef]
  30. GB/T 1972-2005; Disc Spring. Standards Press of China: Beijing, China, 2005.
  31. GB/T 20688.1-2007; Rubber Bearings-Part 1: Seismic-Protection Isolators Test Methods. Ministry of Housing and Urban-Rural Construction of the People’s Republic of China: Beijing, China, 2007.
  32. Xing, J.; Huang, H.; Zhang, J.; Yang, Q.S. Mechanical properties of disc springs. J. Vib. Shock 2015, 34, 167–172. [Google Scholar] [CrossRef]
  33. Zhang, S.; Zhao, S.; Zhu, D.; Liu, H.; Liu, G. Mechanical Property Test and Simulation Analysis of Disc Spring. J. Hunan Univ. Nat. Sci. 2018, 45, 64–73. [Google Scholar] [CrossRef]
Figure 1. Research workflow of VVSDSI bearing.
Applsci 15 03380 g001
Figure 2. Schematic diagram of the structure of the VVSDSI bearing.
Applsci 15 03380 g002
Figure 3. Schematic diagram of the friction force of the disc spring assembly.
Applsci 15 03380 g003
Figure 4. Diagram of VVSDSI bearing operational status. (a) Operational state of the seismic isolation stage; (b) operational state of the protection stage.
Applsci 15 03380 g004
Figure 5. Dimensions of disc spring.
Applsci 15 03380 g005
Figure 6. Hysteretic model of VVSDSI bearing considering the friction effect. (a) Upper disc spring assembly; (b) Lower disc spring assembly; (c) VVSDSI disc spring system.
Applsci 15 03380 g006
Figure 7. Experimental setup and specimen.
Applsci 15 03380 g007
Figure 8. The load-displacement curves of the VVSDSI bearing under the ultimate load.
Applsci 15 03380 g008
Figure 9. Load-displacement curves for VVSDSI bearing. (a) Preloading displacement 16 mm; (b) preloading displacement 23 mm; (c) preloading displacement 30 mm.
Applsci 15 03380 g009
Figure 10. Energy dissipation of the VVSDSI bearing under different preloading displacements and loading amplitudes. (a) Different preloading displacements; (b) different loading amplitudes.
Applsci 15 03380 g010
Figure 11. Equivalent stiffnesses of the VVSDSI bearing under different preloading displacements and loading amplitudes. (a) Different preloading displacements; (b) different loading amplitudes.
Applsci 15 03380 g011
Figure 12. Equivalent damping ratios of the VVSDSI bearing under different preloading displacements and loading amplitudes. (a) Different preloading displacements; (b) different loading amplitudes.
Applsci 15 03380 g012
Figure 13. Normalized load−displacement curves of VVSDSI and CSDVI bearings.
Applsci 15 03380 g013
Figure 14. Finite element model of VVSDSI bearing.
Applsci 15 03380 g014
Figure 15. Comparison of the experimental and simulated values of the load-displacement curve under ultimate load.
Applsci 15 03380 g015
Figure 16. Comparison of experiment and simulation values of load-displacement hysteresis curves under cyclic loading. (a) Preloading displacement 16 mm; (b) preloading displacement 23 mm; (c) preloading displacement 30 mm.
Applsci 15 03380 g016
Table 1. Friction coefficients of disc springs.
SeriesfMfR
A0.005~0.030.03~0.05
B0.003~0.020.02~0.04
C0.002~0.0150.01~0.03
Table 2. Design parameters of disc spring groups in VVSDSI bearings.
CategoryD (mm)d (mm)t (mm)H0 (mm)Combination Form
Upper disc spring set2501271017Double-stacked
Triple-paired
Lower disc spring set2501271017Quadruple-stacked
Triple-paired
Table 3. Peak loads and loading stiffnesses of the VVSDSI bearing during the isolation and protection stages.
Load and StiffnessF1 (kN)F3 (kN)K1 (kN/mm)K3 (kN/mm)
Theoretical results346.03712.3611.0933.92
Test results363.92764.1511.6637.06
Relative errors (%)4.926.784.898.47
Note: K1 = F1/x1 is the loading stiffness of the isolation stage of the bearing, and K3 = (F3F1)/(x3x1) is the loading stiffness of the protection stage of the bearing, where F1 and F3 are the peak loads of the isolation and protection stages, and x1 and x3 are the displacements corresponding to F1 and F3.
Table 4. Comparison of theoretical and experimental results of the hysteresis curves under different preloading displacements and different loading amplitudes.
Preloading Displacement with Loading Amplitude (mm)Ke (kN/mm)Fmax (kN)Fmin (kN)
Theo. V.Exptl. V.Rel Err. (%)Theo. V.Exptl. V.Rel Err. (%)Theo. V.Exptl. V.Rel Err (%)
16 ± 125.0624.263.30188.54187.350.64138.42138.530.08
16 ± 217.6118.163.03199.63199.960.17126.19126.970.61
16 ± 413.8814.021.00221.81220.860.43110.73108.182.36
16 ± 612.6412.630.08244.00235.913.4392.2889.203.45
23 ± 131.5830.075.02266.18264.430.66203.02204.020.49
23 ± 220.8720.531.66277.27276.590.25193.79194.070.14
23 ± 415.5115.892.39299.45302.771.10175.34175.180.09
23 ± 613.7314.012.00321.63328.161.99156.88159.441.61
30 ± 138.1052.4227.32343.81370.217.13267.62264.681.11
30 ± 228.6936.6221.66373.17398.646.39258.39251.452.76
30 ± 425.1327.488.55441.00455.783.24239.93235.102.05
30 ± 623.9524.532.36508.84513.610.93221.48221.480
Note: Theo. V. represents the theoretical value; Exptl. V. represents the experimental value; Rel Err. represents the relative error.
Table 5. Experimental results of equivalent stiffnesses of the VVSDSI bearing under different preloading displacements and different loading amplitudes.
Preloading Displacement (mm)Loading Amplitude (mm)
1246
1624.2618.1614.0212.63
2330.0720.5315.8914.01
3052.4236.6227.4824.53
Table 6. Experimental results of equivalent damping ratios of the VVSDSI bearing under different preloading displacements and different loading amplitudes.
Preloading Displacement
(mm)
Loading Amplitude (mm)
1246
1620.8817.5714.3111.12
2323.9621.6316.3514.36
3015.5218.7518.5314.83
Table 7. Comparison of equivalent stiffness values for VVSDSI bearings under cyclic loading.
Preloading Dis-Placement with Loading Amplitude (mm)Simulated Values (kN/mm)Experimental Value (kN/mm)Relative Error
(%)
16 ± 124.4924.260.94
16 ± 217.6218.162.97
16 ± 413.5114.023.63
16 ± 611.9312.635.54
23 ± 127.8630.077.34
23 ± 218.6020.539.40
23 ± 413.7715.8913.34
23 ± 613.1414.016.21
30 ± 154.7552.424.44
30 ± 236.8436.620.60
30 ± 426.4627.483.71
30 ± 623.1524.535.62
Disclaimer/Publisher’s Note: The statements, opinions and data contained in all publications are solely those of the individual author(s) and contributor(s) and not of MDPI and/or the editor(s). MDPI and/or the editor(s) disclaim responsibility for any injury to people or property resulting from any ideas, methods, instructions or products referred to in the content.

