
Lifting-Line Predictions for the Ideal Twist Effectiveness of Spanwise Continuous and Discrete Control Surfaces †


Abstract
Featured Application
Abstract
1. Introduction
2. Materials and Methods
2.1. Theoretical Development
2.2. Twist Effectiveness
2.3. Numerical Solver
3. Results
4. Discussion
Author Contributions
Funding
Data Availability Statement
Acknowledgments
Conflicts of Interest
Nomenclature
| coefficient in the Fourier sine series | |
| decomposed Fourier coefficient relating to angle of attack | |
| wingspan | |
| decomposed Fourier coefficient relating to wing twist | |
| Induced-drag coefficient | |
| lift coefficient | |
| lift slope | |
| local airfoil lift slope | |
| local chord length | |
| spanwise efficiency factor | |
| number of terms retained from the infinite Fourier sine series | |
| index for the Fourier sine series | |
| aspect ratio | |
| taper ratio | |
| twist at a spanwise position of the wing | |
| freestream velocity | |
| spanwise coordinate, positive out the left wing | |
| geometric angle of attack of an airfoil at a spanwise position | |
| zero-lift angle of attack of an airfoil at a spanwise position | |
| vortex strength at a spanwise position along the lifting line | |
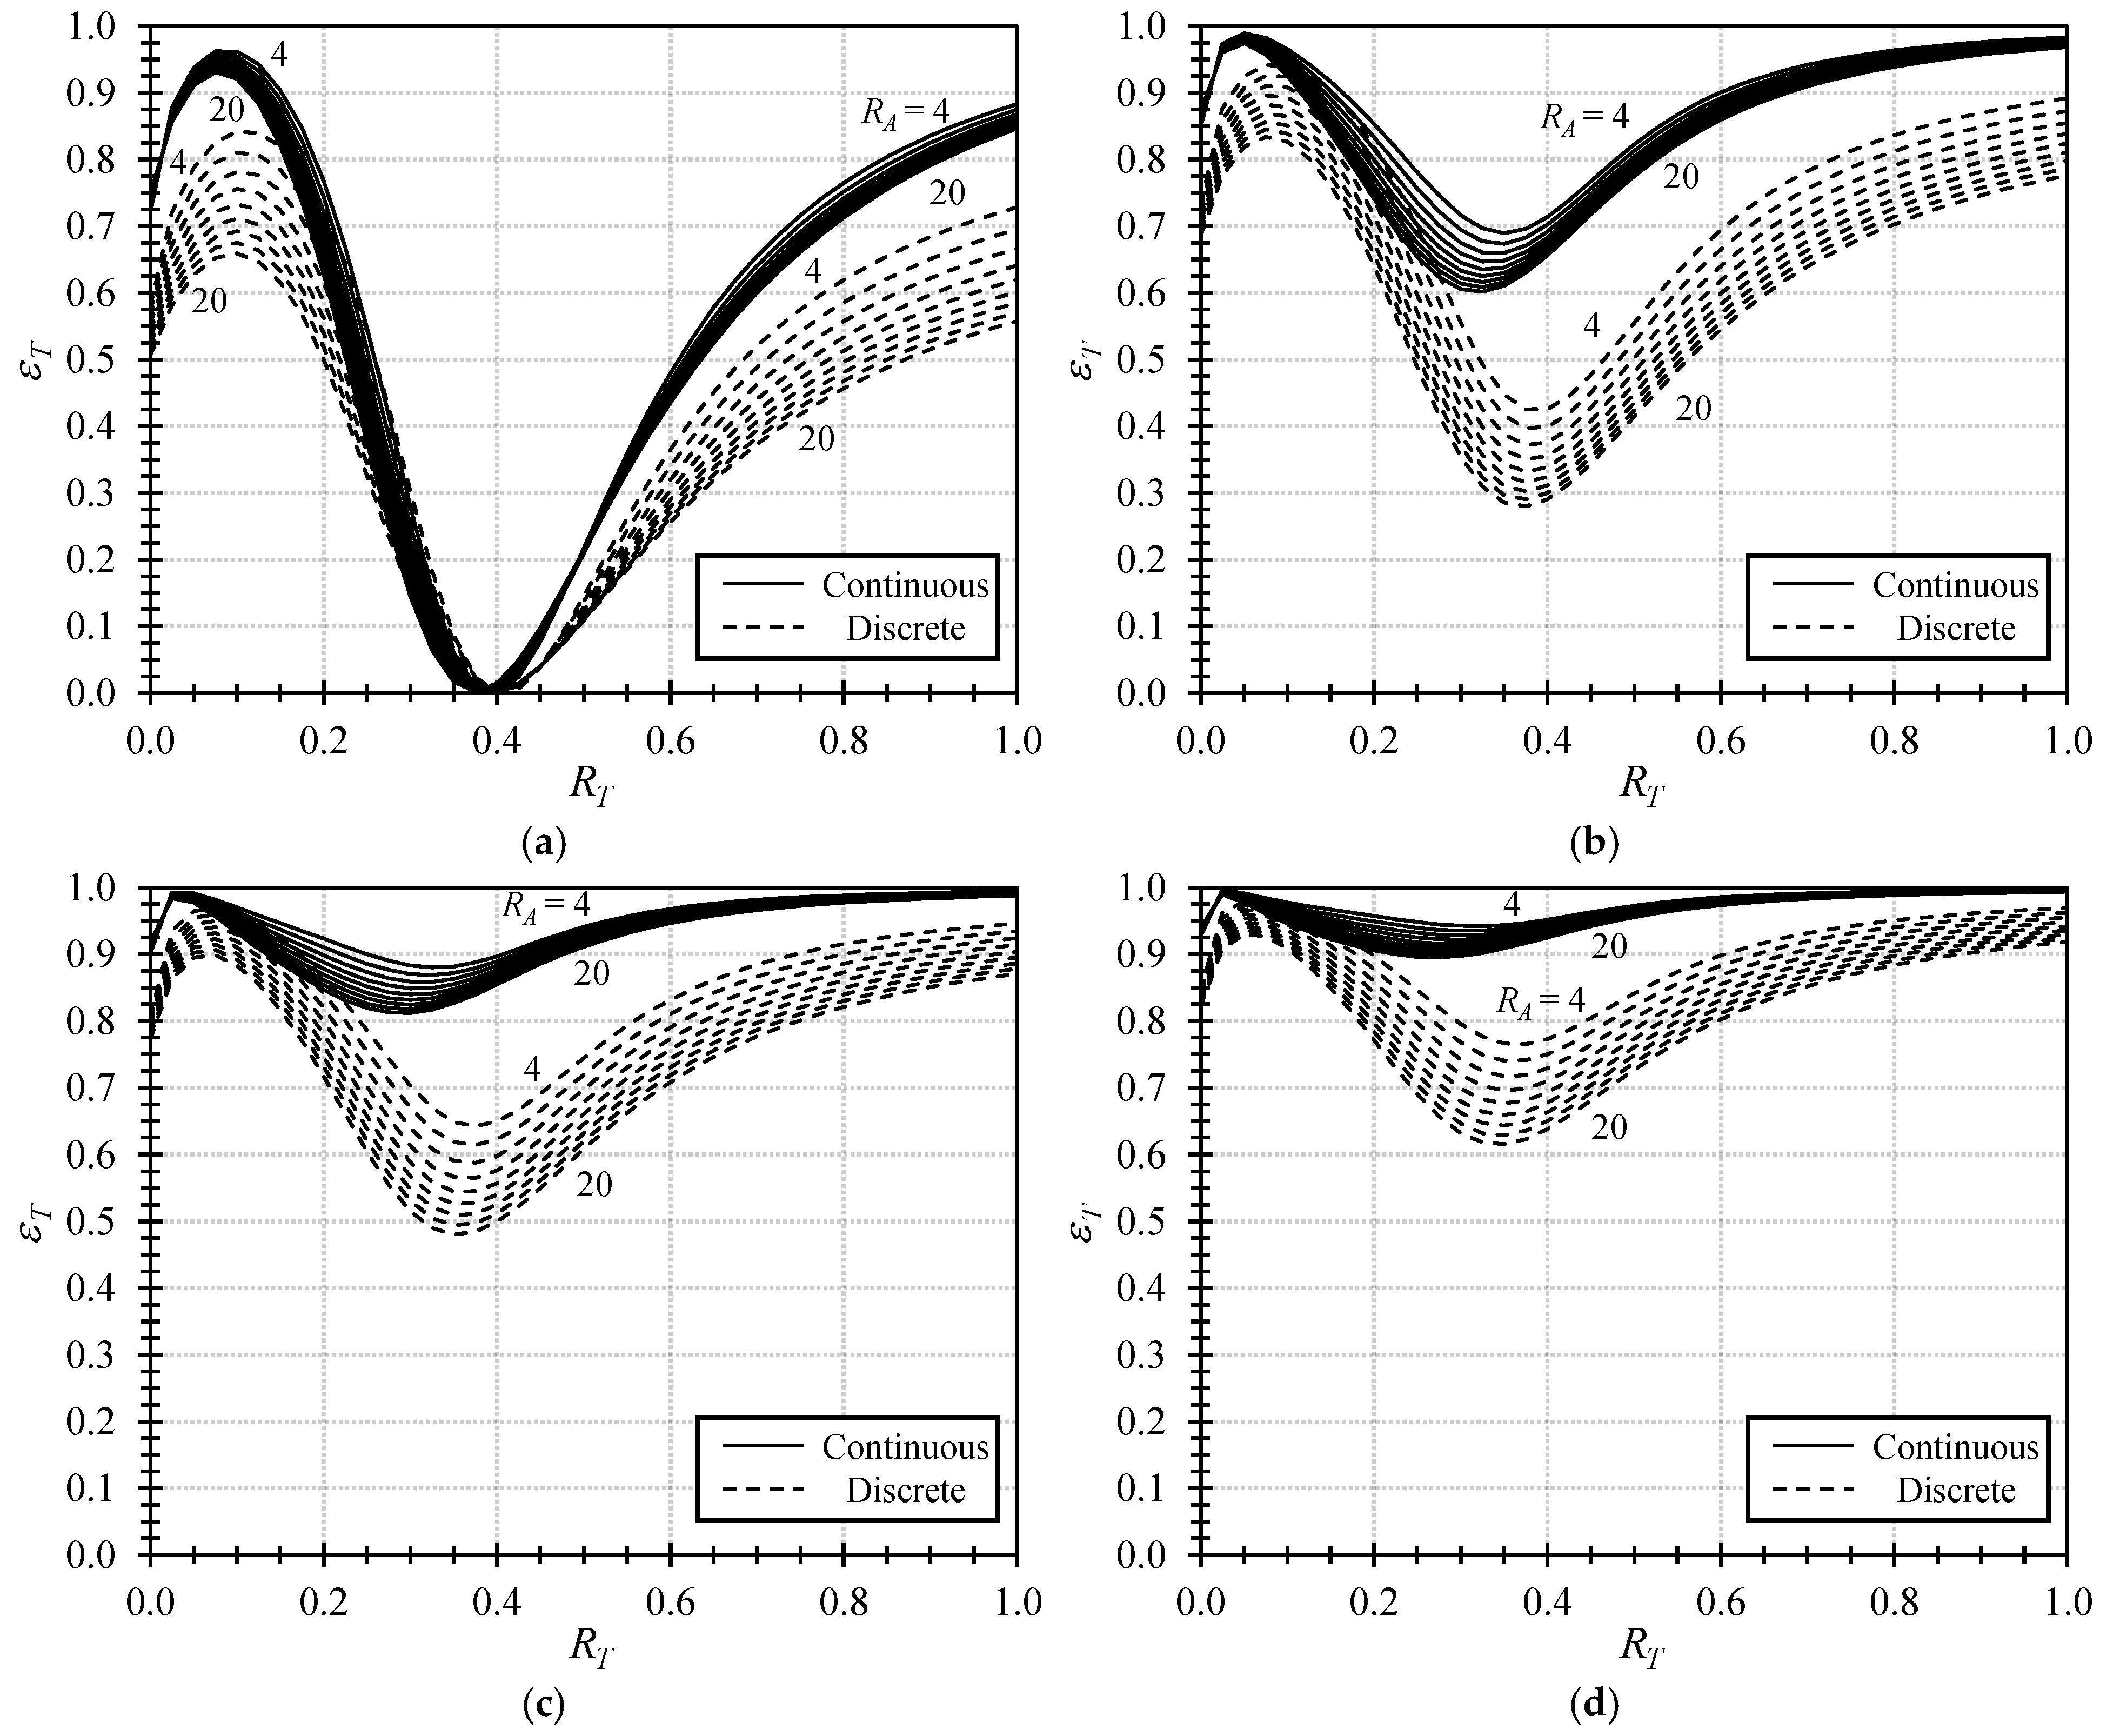
| twist effectiveness | |
| change in variable for the spanwise coordinate | |
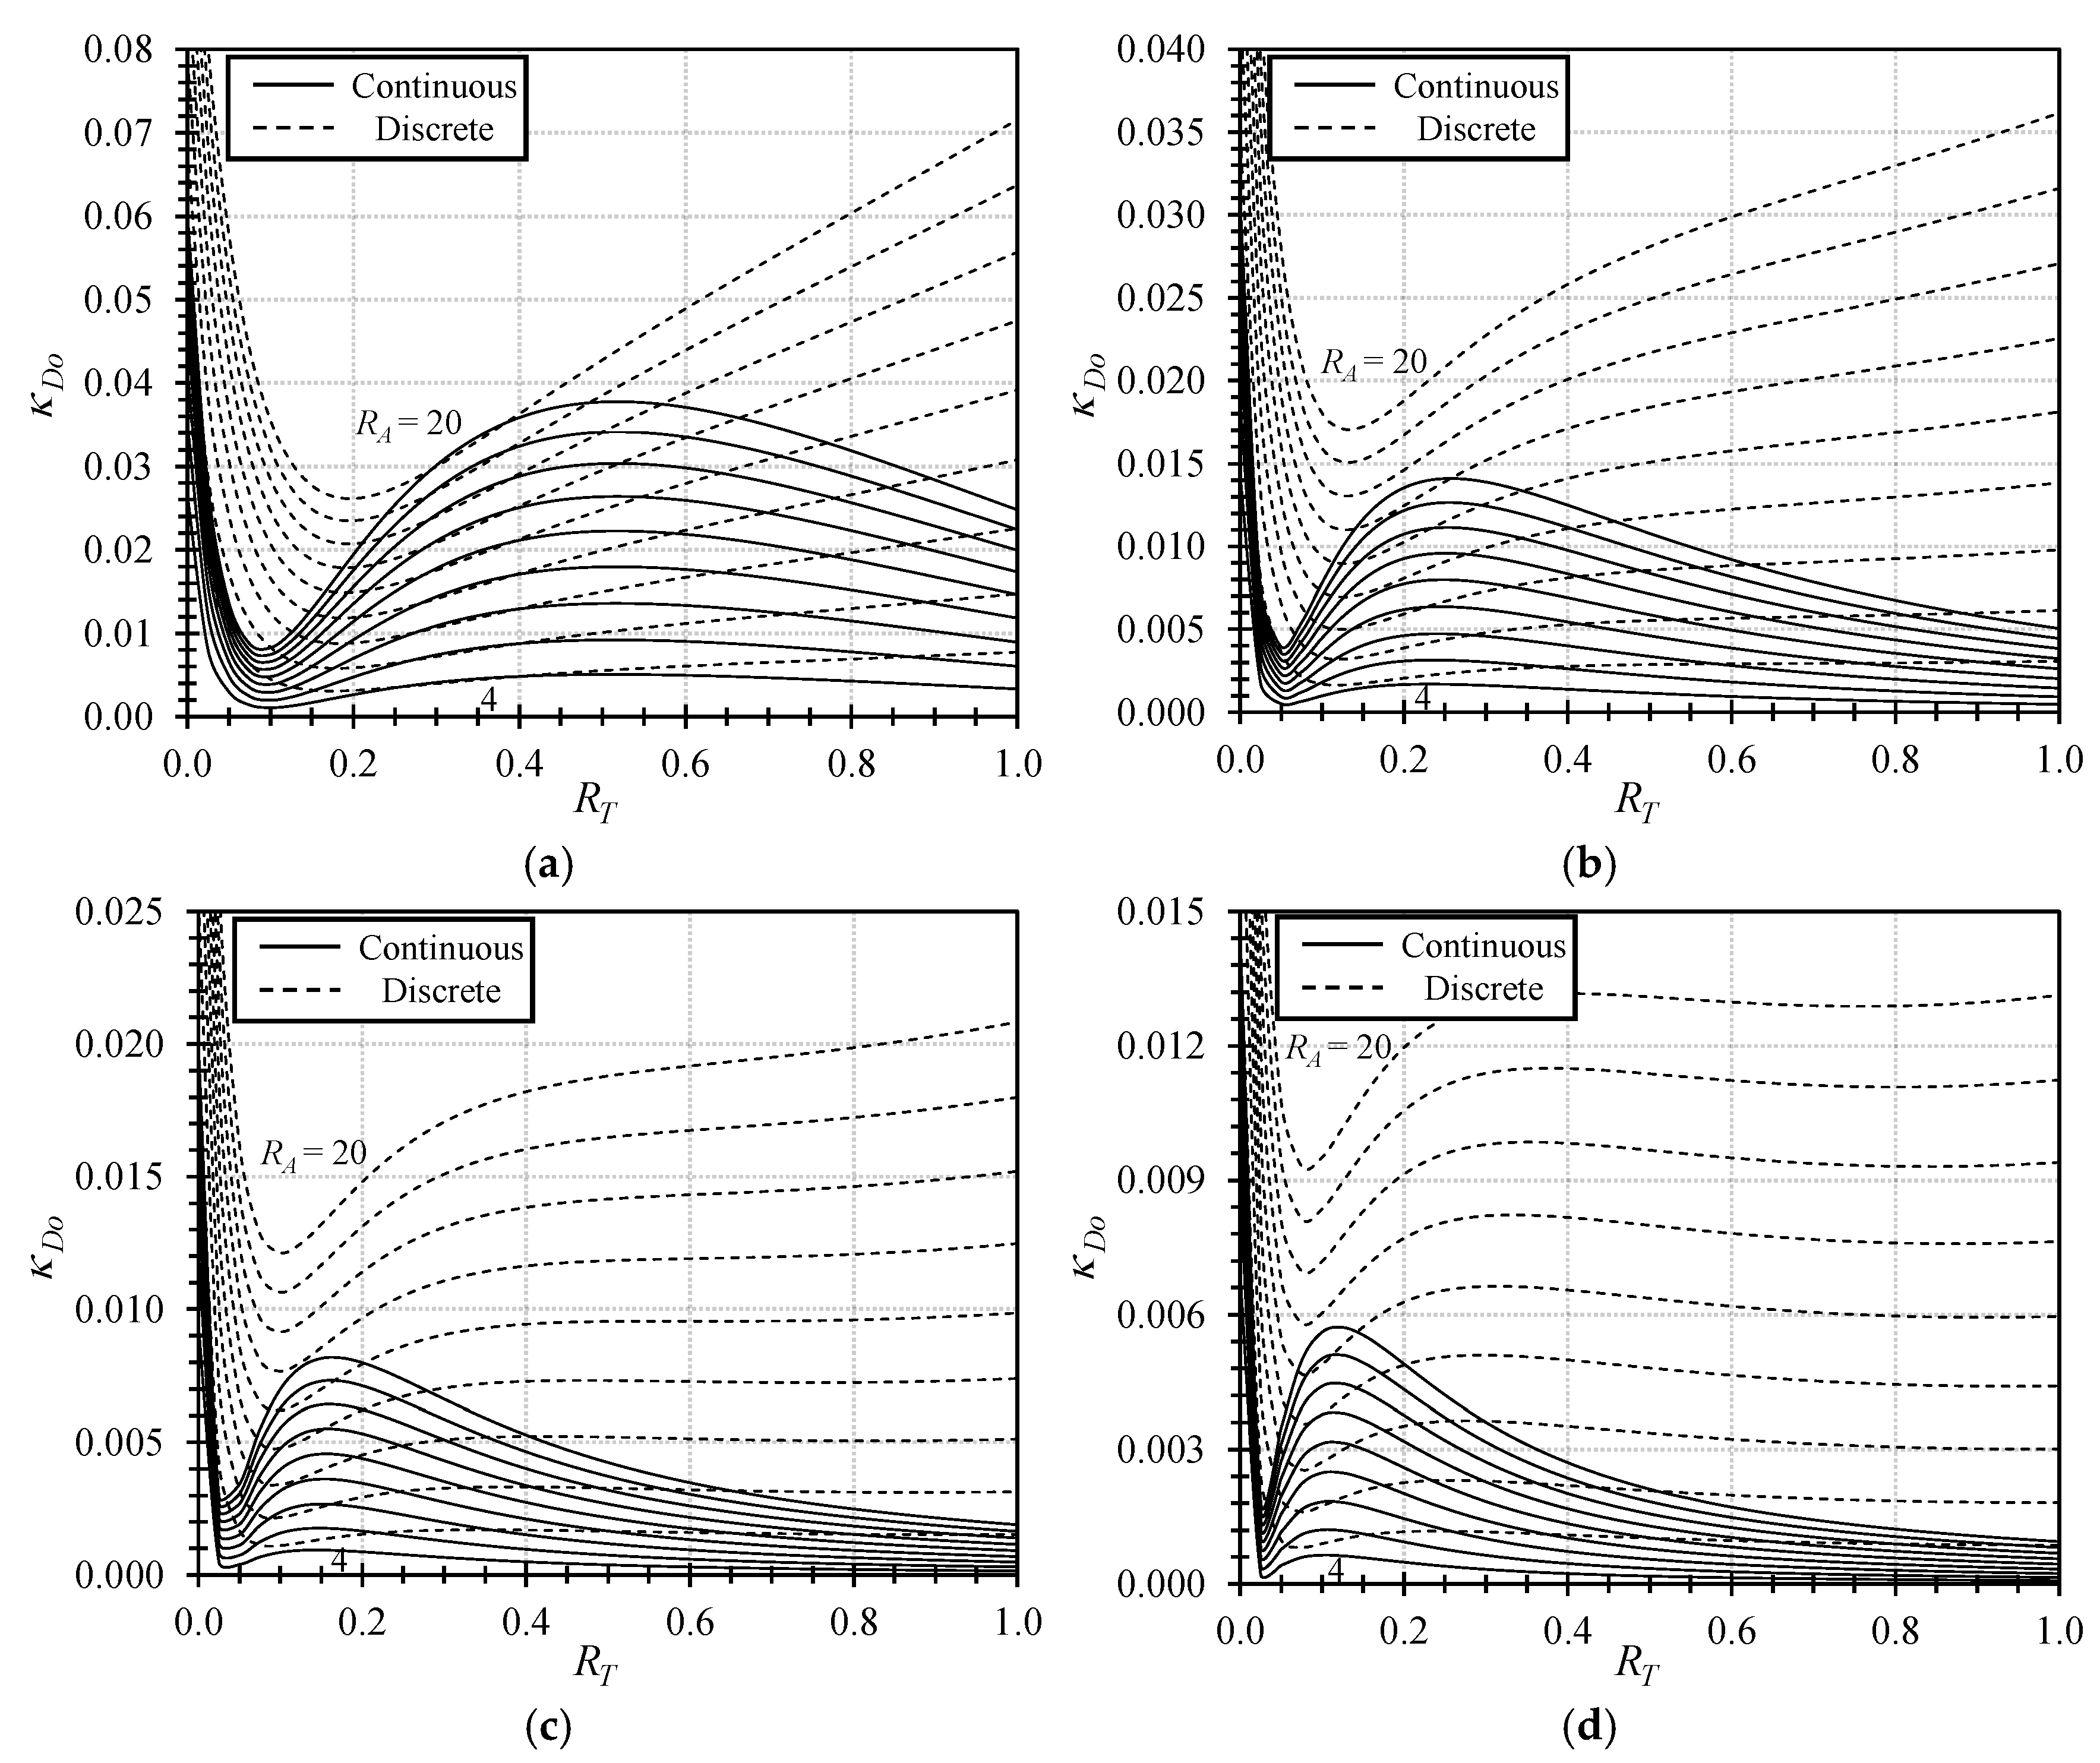
| optimum induced-drag factor | |
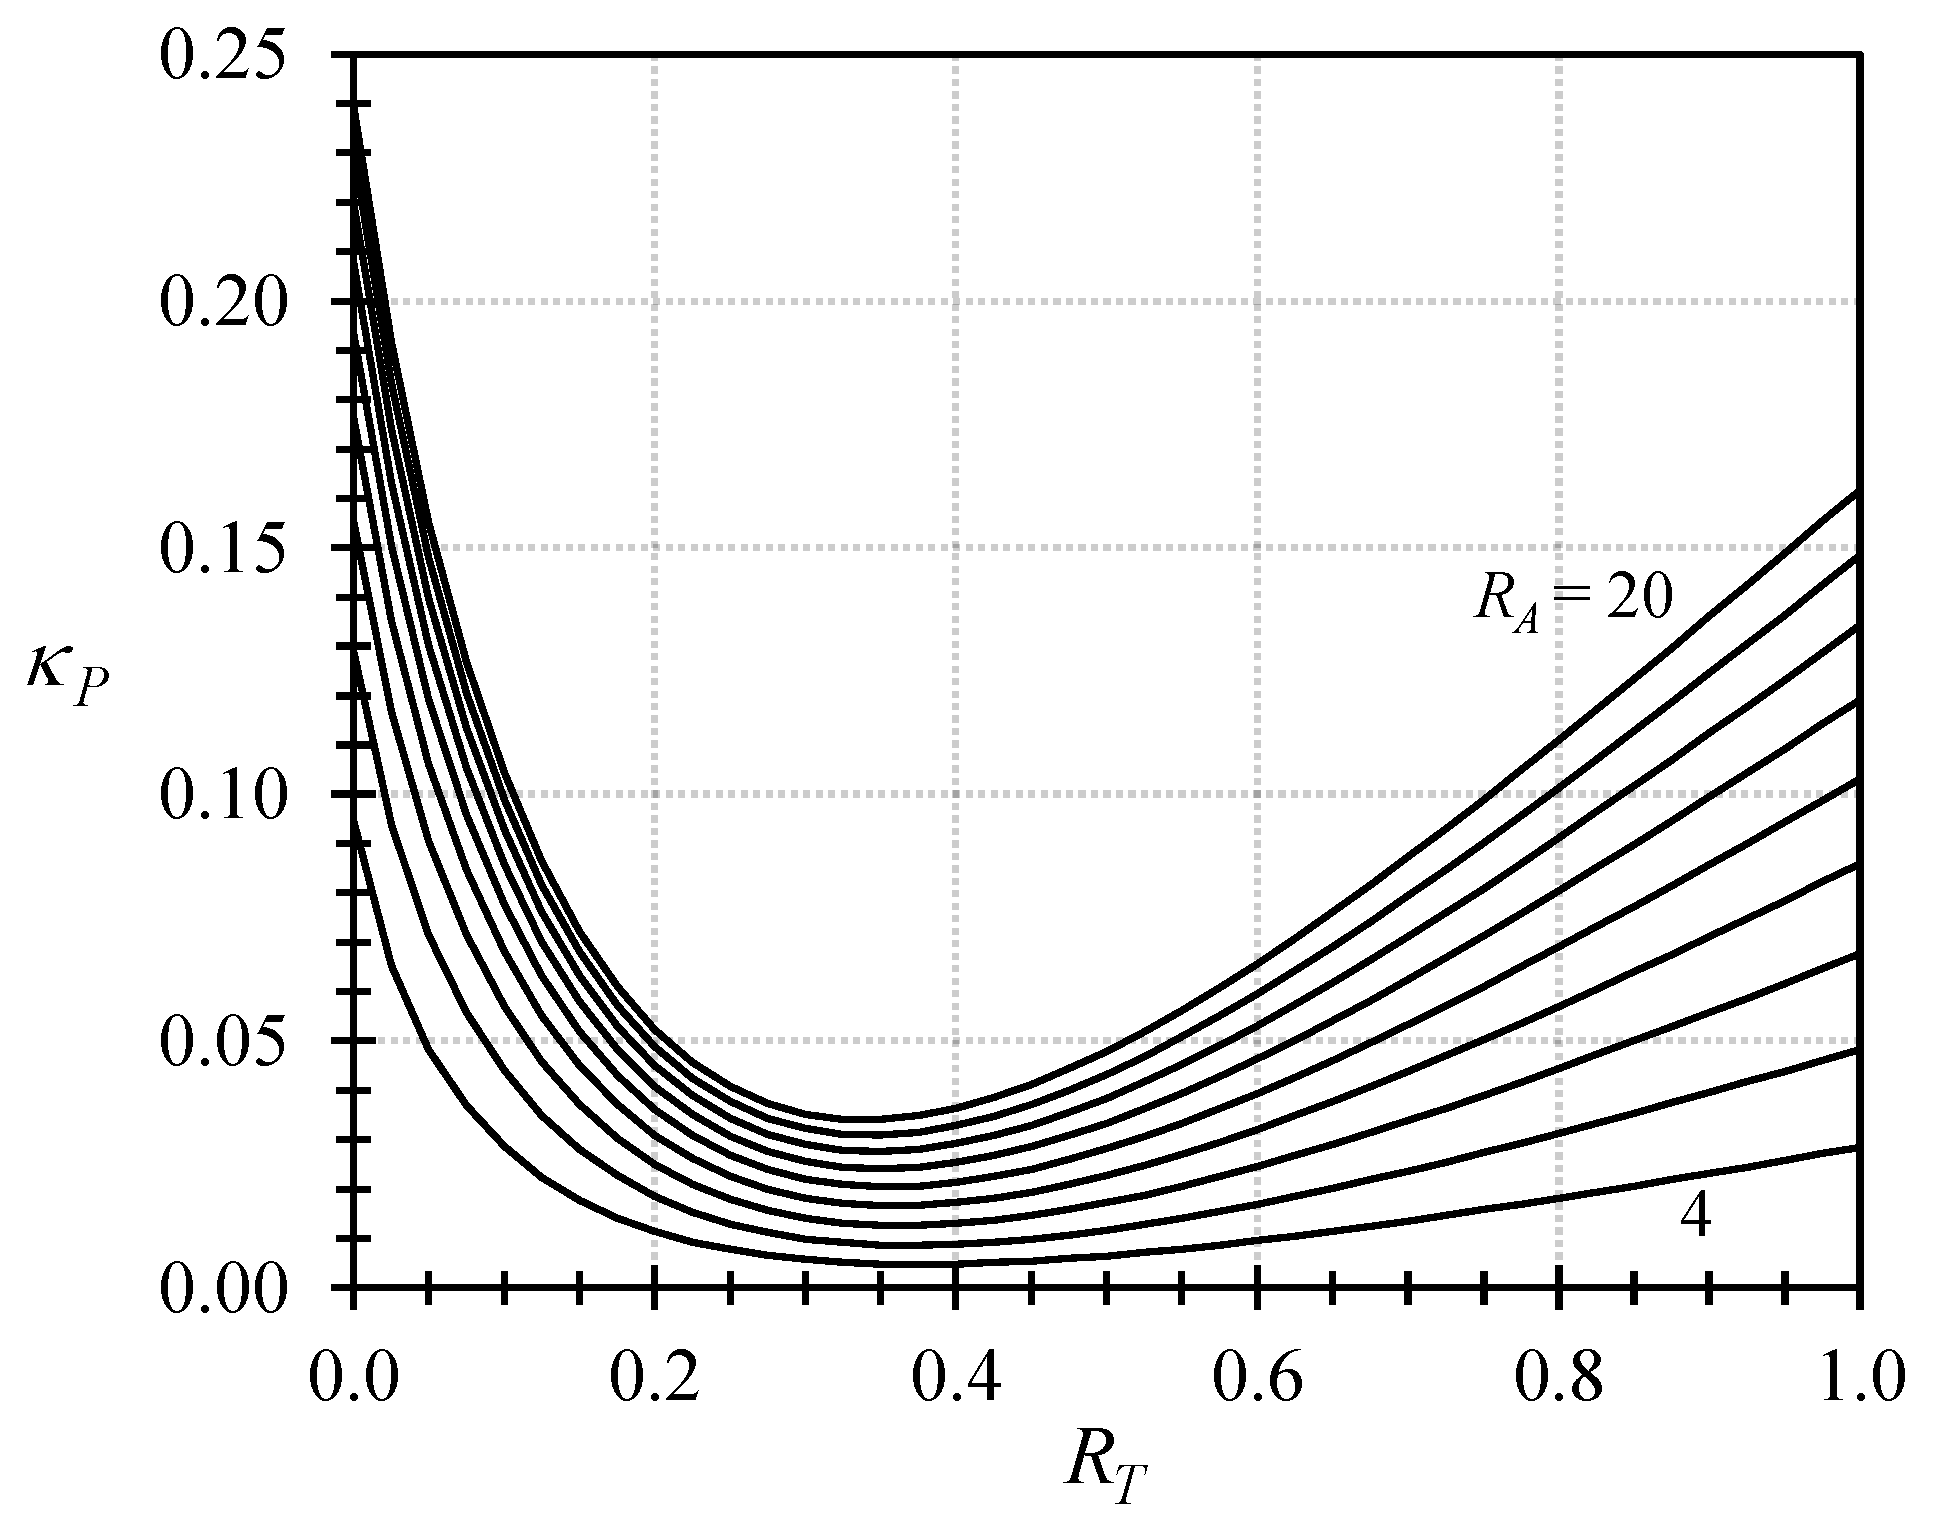
| induced-drag planform penalty | |
| lift-twist contribution to induced drag | |
| twist contribution to induced drag | |
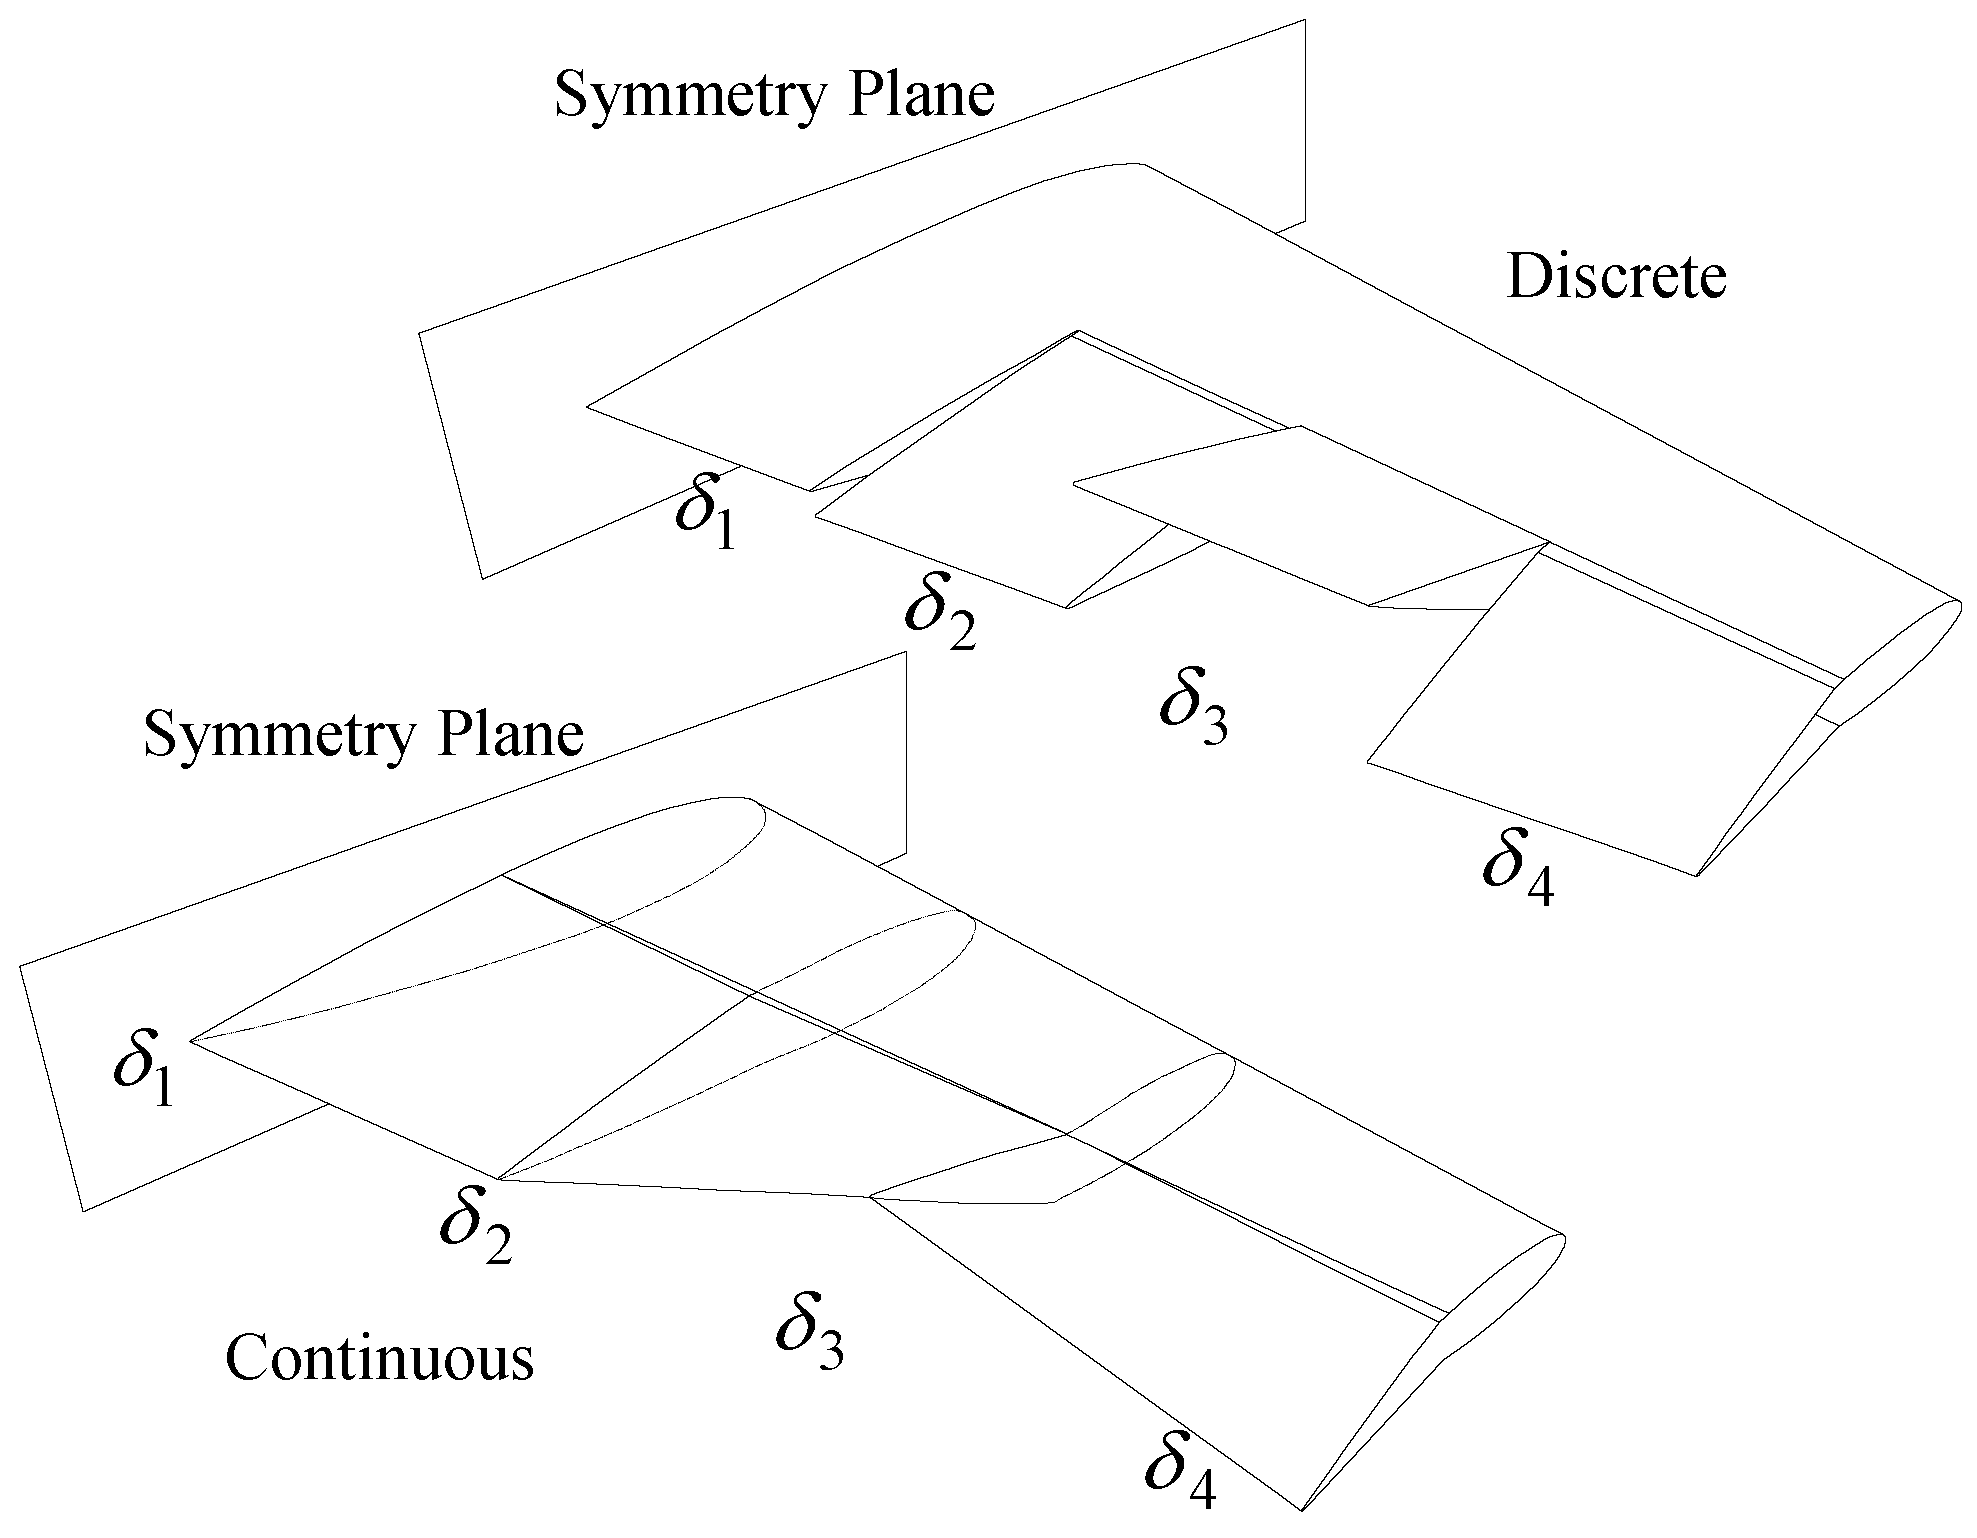
| amount of twist, determines the amount and direction of wing twist but not the shape | |
| twist distribution function, determines the shape of the twist distribution |
References
- Glines, C.V. The Promise of Flight Fulfilled. Aviat. Hist. 2003, 14, 26. [Google Scholar]
- Lougheed, V.V. The Secret Experiments of the Wright Brothers Victor Longhand, Popular Mechanics. In Popular Mechanics; Hearst Corporation: New York, NY, USA, 1911; pp. 797–804. [Google Scholar]
- Marks, C.R.; Zientarski, L.; Culler, A.J.; Hagen, B.; Smyers, B.M.; Joo, J.J. Variable Camber Compliant Wing—Wind Tunnel Testing. In Proceedings of the AIAA 2015-1051, 23rd AIAA/AHS Adaptive Structures Conference, Kissimmee, FL, USA, 5–9 January 2015. [Google Scholar]
- Kaul, U.K.; Nguyen, N.T. Drag Optimization Study of Variable Camber Continuous Trailing Edge Flap (VCCTEF) Using OVERFLOW. In Proceedings of the 32nd AIAA Applied Aerodynamics Conference, Atlanta, GA, USA, 16–20 June 2014. [Google Scholar]
- Lebofsky, S.; Ting, E.; Nguyen, N.T.; Trinh, K.V. Aeroelastic Modeling and Drag Optimization of Flexible Wing Aircraft with Variable Camber Continuous Trailing Edge Flap. In Proceedings of the 32nd AIAA Applied Aerodynamics Conference, Atlanta, GA, USA, 16–20 June 2014. [Google Scholar]
- Ting, E.; Dao, T.; Nguyen, N.T. Aerodynamic Load Analysis of a Variable Camber Continuous Trailing Edge Flap System on a Flexible Wing Aircraft. In Proceedings of the 56th AIAA/ASCE/AHS/ASC Structures, Structural Dynamics, and Materials Conference, Kissimmee, FL, USA, 5–9 January 2015. [Google Scholar]
- Nguyen, N.; Urnes, J. Aeroelastic Modeling of Elastically Shaped Aircraft Concept via Wing Shaping Control for Drag Reduction. In Proceedings of the AIAA Atmospheric Flight Mechanics Conference, Minneapolis, MN, USA, 13–16 August 2012. [Google Scholar]
- Kudva, J.; Appa, K.; Martin, C.; Jardine, A.; Sendeckyj, G.; Harris, T.; McGowan, A.; Lake, R. Design, Fabrication, and Testing of the DARPA/Wright Lab Smart Wing Wind Tunnel Model. In Proceedings of the AIAA-1997-1198, 38th Structures, Structural Dynamics, and Materials Conference, Kissimmee, FL, USA, 7–10 April 1997. [Google Scholar]
- Gilbert, W.W. Development of a Mission Adaptive Wing System for a Tactical Aircraft. In Proceedings of the Aircraft Systems Meeting, Aircraft Design and Technology Meeting, Anaheim, CA, USA, 4–6 August 1980. [Google Scholar]
- Hall, J.M. Executive Summary AFTI/F-111 Mission Adaptive Wing; WRDC-TR-89-2083; Wright Research and Development Center: Dayton, OH, USA, 1989. [Google Scholar]
- Hetrick, J.; Osborn, R.; Kota, S.; Flick, P.; Paul, D. Flight Testing of Mission Adaptive Compliant Wing. In Proceedings of the AIAA-2007-1709, 48th AIAA/ASME/ASCE/AHS/ASC Structures, Structural Dynamics, and Materials Conference, Honolulu, HI, USA, 23–26 April 2007. [Google Scholar]
- Vos, R.; Gurdal, Z.; Abdalla, M. Mechanism for Warp-Controlled Twist of a Morphing Wing. J. Aircr. 2010, 47, 450–457. [Google Scholar] [CrossRef]
- Dale, A.S.; Cooper, J.E.; Mosquera, A. Adaptive Camber-Morphing Wing using 0-υ Honecomb. In Proceedings of the AIAA-2013-1510, 54th AIAA/ASME/ASCE/AHS/ASC Structures, Structural Dynamics, and Materials Conference, Boston, MA, USA, 8–11 April 2013. [Google Scholar]
- Molinari, G.; Arrieta, A.F.; Guillaume, M.; Ermanni, P. Aerostructural Performance of Distributed Compliance Morphing Wings: Wind Tunnel and Flight Testing. AIAA J. 2016, 54, 3859–3871. [Google Scholar] [CrossRef]
- Lyu, Z.; Martins, J.R.R.A. Aerodynamic Shape Optimization of an Adaptive Morphing Trailing-Edge Wing. J. Aircr. 2015, 52, 1951–1970. [Google Scholar] [CrossRef]
- Fasel, U.; Tiso, P.; Keidel, D.; Molinari, G.; Ermanni, P. Reduced-Order Dynamic Model of a Morphing Airborne Wind Energy Aircraft. AIAA J. 2019, 57, 3586–3598. [Google Scholar] [CrossRef]
- Previtali, F.; Arrieta, A.F.; Ermanni, P. Performance of a Three-Dimensional Morphing Wing and Comparison with a Conventional Wing. AIAA J. 2014, 52, 2101–2113. [Google Scholar] [CrossRef]
- Wickenheiser, A.M.; Garcia, E. Aerodynamic Modeling of Morphing Wings Using an Extended Lifting-Line Analysis. J. Aircr. 2007, 44, 10–16. [Google Scholar] [CrossRef]
- Gamboa, P.; Vale, J.; Lau, F.J.P.; Suleman, A. Optimization of a Morphing Wing Based on Coupled Aerodynamic and Structural Constraints. AIAA J. 2009, 47, 2087–2104. [Google Scholar] [CrossRef]
- Molinari, G.; Arrieta, A.F.; Ermanni, P. Aero-Structural Optimization of Three-Dimensional Adaptive Wings with Embedded Smart Actuators. AIAA J. 2014, 52, 1940–1951. [Google Scholar] [CrossRef]
- Béguin, B.; Breitsamter, C.; Adams, N. Aerodynamic Investigations of a Morphing Membrane Wing. AIAA J. 2012, 50, 2588–2599. [Google Scholar] [CrossRef]
- Keidel, D.; Fasel, U.; Ermanni, P. Concept Investigation of a Lightweight Composite Lattice Morphing Wing. AIAA J. 2021, 59, 2242–2250. [Google Scholar] [CrossRef]
- Burdette, D.A.; Martins, J.R.R.A. Impact of Morphing Trailing Edges on Mission Performance for the Common Research Model. J. Aircr. 2019, 56, 369–384. [Google Scholar] [CrossRef]
- Prandtl, L. Tragflügel Theorie. Nachricten von der Gesellschaft der Wissenschaften zu Gottingen. Geschäeftliche-Mitteilungen Kl. 1918, 1918, 451–477. [Google Scholar]
- Prandtl, L. Applications of Modern Hydrodynamics to Aeronautics; NACA TR-116; NASA: Washington, DC, USA, 1921. [Google Scholar]
- Phillips, W.F. Lifting-Line Analysis for Twisted Wings and Washout-Optimized Wings. J. Aircr. 2004, 41, 128–136. [Google Scholar] [CrossRef]
- Phillips, W.F. Incompressible Flow over Finite Wings. Mechanics of Flight, 2nd ed.; Wiley: Hoboken, NJ, USA, 2010; pp. 46–94. [Google Scholar]
- Phillips, W.F. Analytical Decomposition of Wing Roll and Flapping Using Lifting-Line Theory. J. Aircr. 2014, 51, 761–778. [Google Scholar] [CrossRef]
- Phillips, W.F.; Hunsaker, D.F.; Taylor, J.D. Minimizing Induced Drag with Weight Distribution, Lift Distribution, Wingspan, and Wing-Structure Weight. In Proceedings of the AIAA Aviation 2019 Forum, Dallas, TX, USA, 17–21 June 2019. [Google Scholar]
- Phillips, W.F.; Snyder, D.O. Modern Adaptation of Prandtl’s Classic Lifting-Line Theory. J. Aircr. 2000, 37, 662–670. [Google Scholar] [CrossRef]
- Hodson, J.; Hunsaker, D.F.; Spall, R. Wing Optimization Using Dual Number Automatic Differentiation in MachUp. In Proceedings of the 55th AIAA Aerospace Sciences Meeting, AIAA SciTech Forum, Grapevine, TX, USA, 9–13 January 2017. [Google Scholar]
- Glauert, H. The Elements of Aerofoil and Airscrew Theory; Cambridge University Press: London, UK, 1926. [Google Scholar]
- McCormick, B.W. Numerical Model of a Lifting Line to Determine Induced Drag. Aerodynamics, Aeronautics, and Flight Mechanics, 2nd ed.; John Wiley & Sons: Hoboken, NJ, USA, 1995; pp. 171–174. [Google Scholar]
- Katz, J.; Plotkin, A. Lifting-Line solution by horseshoe elements. In Low-Speed Aerodynamics, 2nd ed.; Cambridge University Press: New York, NY, USA, 2001. [Google Scholar]
- Saffman, P.G. ; Vortex Dynamics; Cambridge University Press: Cambridge, UK, 1992. [Google Scholar] [CrossRef]
- Kraft, D. A Software Package for Sequential Quadratic Programming; Tech. Rep, DFVLR-FB 88-28; DLR German Aerospace Center—Institute for Flight Mechanics: Koln, Germany, 1988. [Google Scholar]
- Montgomery, Z.S.; Hunsaker, D.F.; Joo, J.J. Aerodynamic Efficiency Analysis of Morphing Wings Relative to Non-Morphing Wings. In Proceedings of the AIAA 2020-2008, AIAA Scitech 2020 Forum, Orlando, FL, USA, 6–10 January 2020. [Google Scholar]

Disclaimer/Publisher’s Note: The statements, opinions and data contained in all publications are solely those of the individual author(s) and contributor(s) and not of MDPI and/or the editor(s). MDPI and/or the editor(s) disclaim responsibility for any injury to people or property resulting from any ideas, methods, instructions or products referred to in the content. |
© 2025 by the authors. Licensee MDPI, Basel, Switzerland. This article is an open access article distributed under the terms and conditions of the Creative Commons Attribution (CC BY) license (https://creativecommons.org/licenses/by/4.0/).
Share and Cite
Montgomery, Z.S.; Hunsaker, D.F.; Joo, J.J. Lifting-Line Predictions for the Ideal Twist Effectiveness of Spanwise Continuous and Discrete Control Surfaces. Appl. Sci. 2025, 15, 3383. https://doi.org/10.3390/app15063383
Montgomery ZS, Hunsaker DF, Joo JJ. Lifting-Line Predictions for the Ideal Twist Effectiveness of Spanwise Continuous and Discrete Control Surfaces. Applied Sciences. 2025; 15(6):3383. https://doi.org/10.3390/app15063383
Chicago/Turabian StyleMontgomery, Zachary S., Douglas F. Hunsaker, and James J. Joo. 2025. "Lifting-Line Predictions for the Ideal Twist Effectiveness of Spanwise Continuous and Discrete Control Surfaces" Applied Sciences 15, no. 6: 3383. https://doi.org/10.3390/app15063383
APA StyleMontgomery, Z. S., Hunsaker, D. F., & Joo, J. J. (2025). Lifting-Line Predictions for the Ideal Twist Effectiveness of Spanwise Continuous and Discrete Control Surfaces. Applied Sciences, 15(6), 3383. https://doi.org/10.3390/app15063383