Communication

Experimental Analysis of Accuracy and Precision in Displacement Measurement Using Millimeter-Wave FMCW Radar

1
Analog Devices KK, 1-9-1 Higashi-Shimbashi, Minato-ku, Tokyo 105-7323, Japan
2
Sakura Tech Corporation, 3-2-6, Shin-Yokohama, Kohoku-ku, Yokohama 222-0033, Kanagawa, Japan
*
Author to whom correspondence should be addressed.
Appl. Sci. 2025, 15(6), 3316; https://doi.org/10.3390/app15063316
Submission received: 28 January 2025 / Revised: 15 March 2025 / Accepted: 16 March 2025 / Published: 18 March 2025

Abstract

:

Featured Application

Contactless vibration or displacement sensing by millimeter-wave radar.

Abstract

Millimeter-wave radar is emerging as a key sensor technology not only for autonomous driving but also for various industrial applications, such as vital sign monitoring and structural displacement sensing using millimeter-wave FMCW radar, which must detect extremely small displacements on the sub-micron scale. Accurate displacement measurements fundamentally rely on obtaining precise intermediate frequency (IF) phase data over slow time (i.e., chirp-to-chirp intervals or pulse repetition time) generated by the radar sensor system. In this study, we developed a millimeter-wave FMCW radar sensor for displacement sensing using a 77–81 GHz radar transceiver MMIC (Monolithic Microwave Integrated Circuit) and evaluated its accuracy and precision through a series of experiments. First, we assessed the MMIC’s phase performance under static conditions using a rigid RF waveguide, and second, we measured a vibrating target using an industrial vibration shaker as a reference. The experiments demonstrated a maximum accuracy error of +0.359 degrees (1.907 μm displacement) and a maximum 3-sigma precision of ±0.358 degrees (±1.180 μm displacement), validating the feasibility of using millimeter-wave radar to measure very small displacements.

1. Introduction

Millimeter-wave FMCW radar is emerging as an effective technology for sensing applications, particularly in the field of small displacement measurement, such as respiration detection, vibration detection, or bridge displacement detection [1]. With advancements in integrated semiconductor technology, the performance of millimeter-wave radar sensors has significantly improved recently, enabling their application in critical machine vibration sensing, where detecting extremely small displacements is crucial.
Machine vibration sensing, commonly known as condition-based monitoring (CbM), has gained popularity as a proactive maintenance strategy [2]. Traditionally, accelerometers have been used to measure small vibrations [3,4]. However, as contact-based sensors, accelerometers present certain challenges. For instance, the mass of the sensor itself may alter the vibration characteristics of the target, making it less suitable for specific applications. In such cases, contactless vibration sensing techniques, such as millimeter-wave radar, offer a viable alternative.
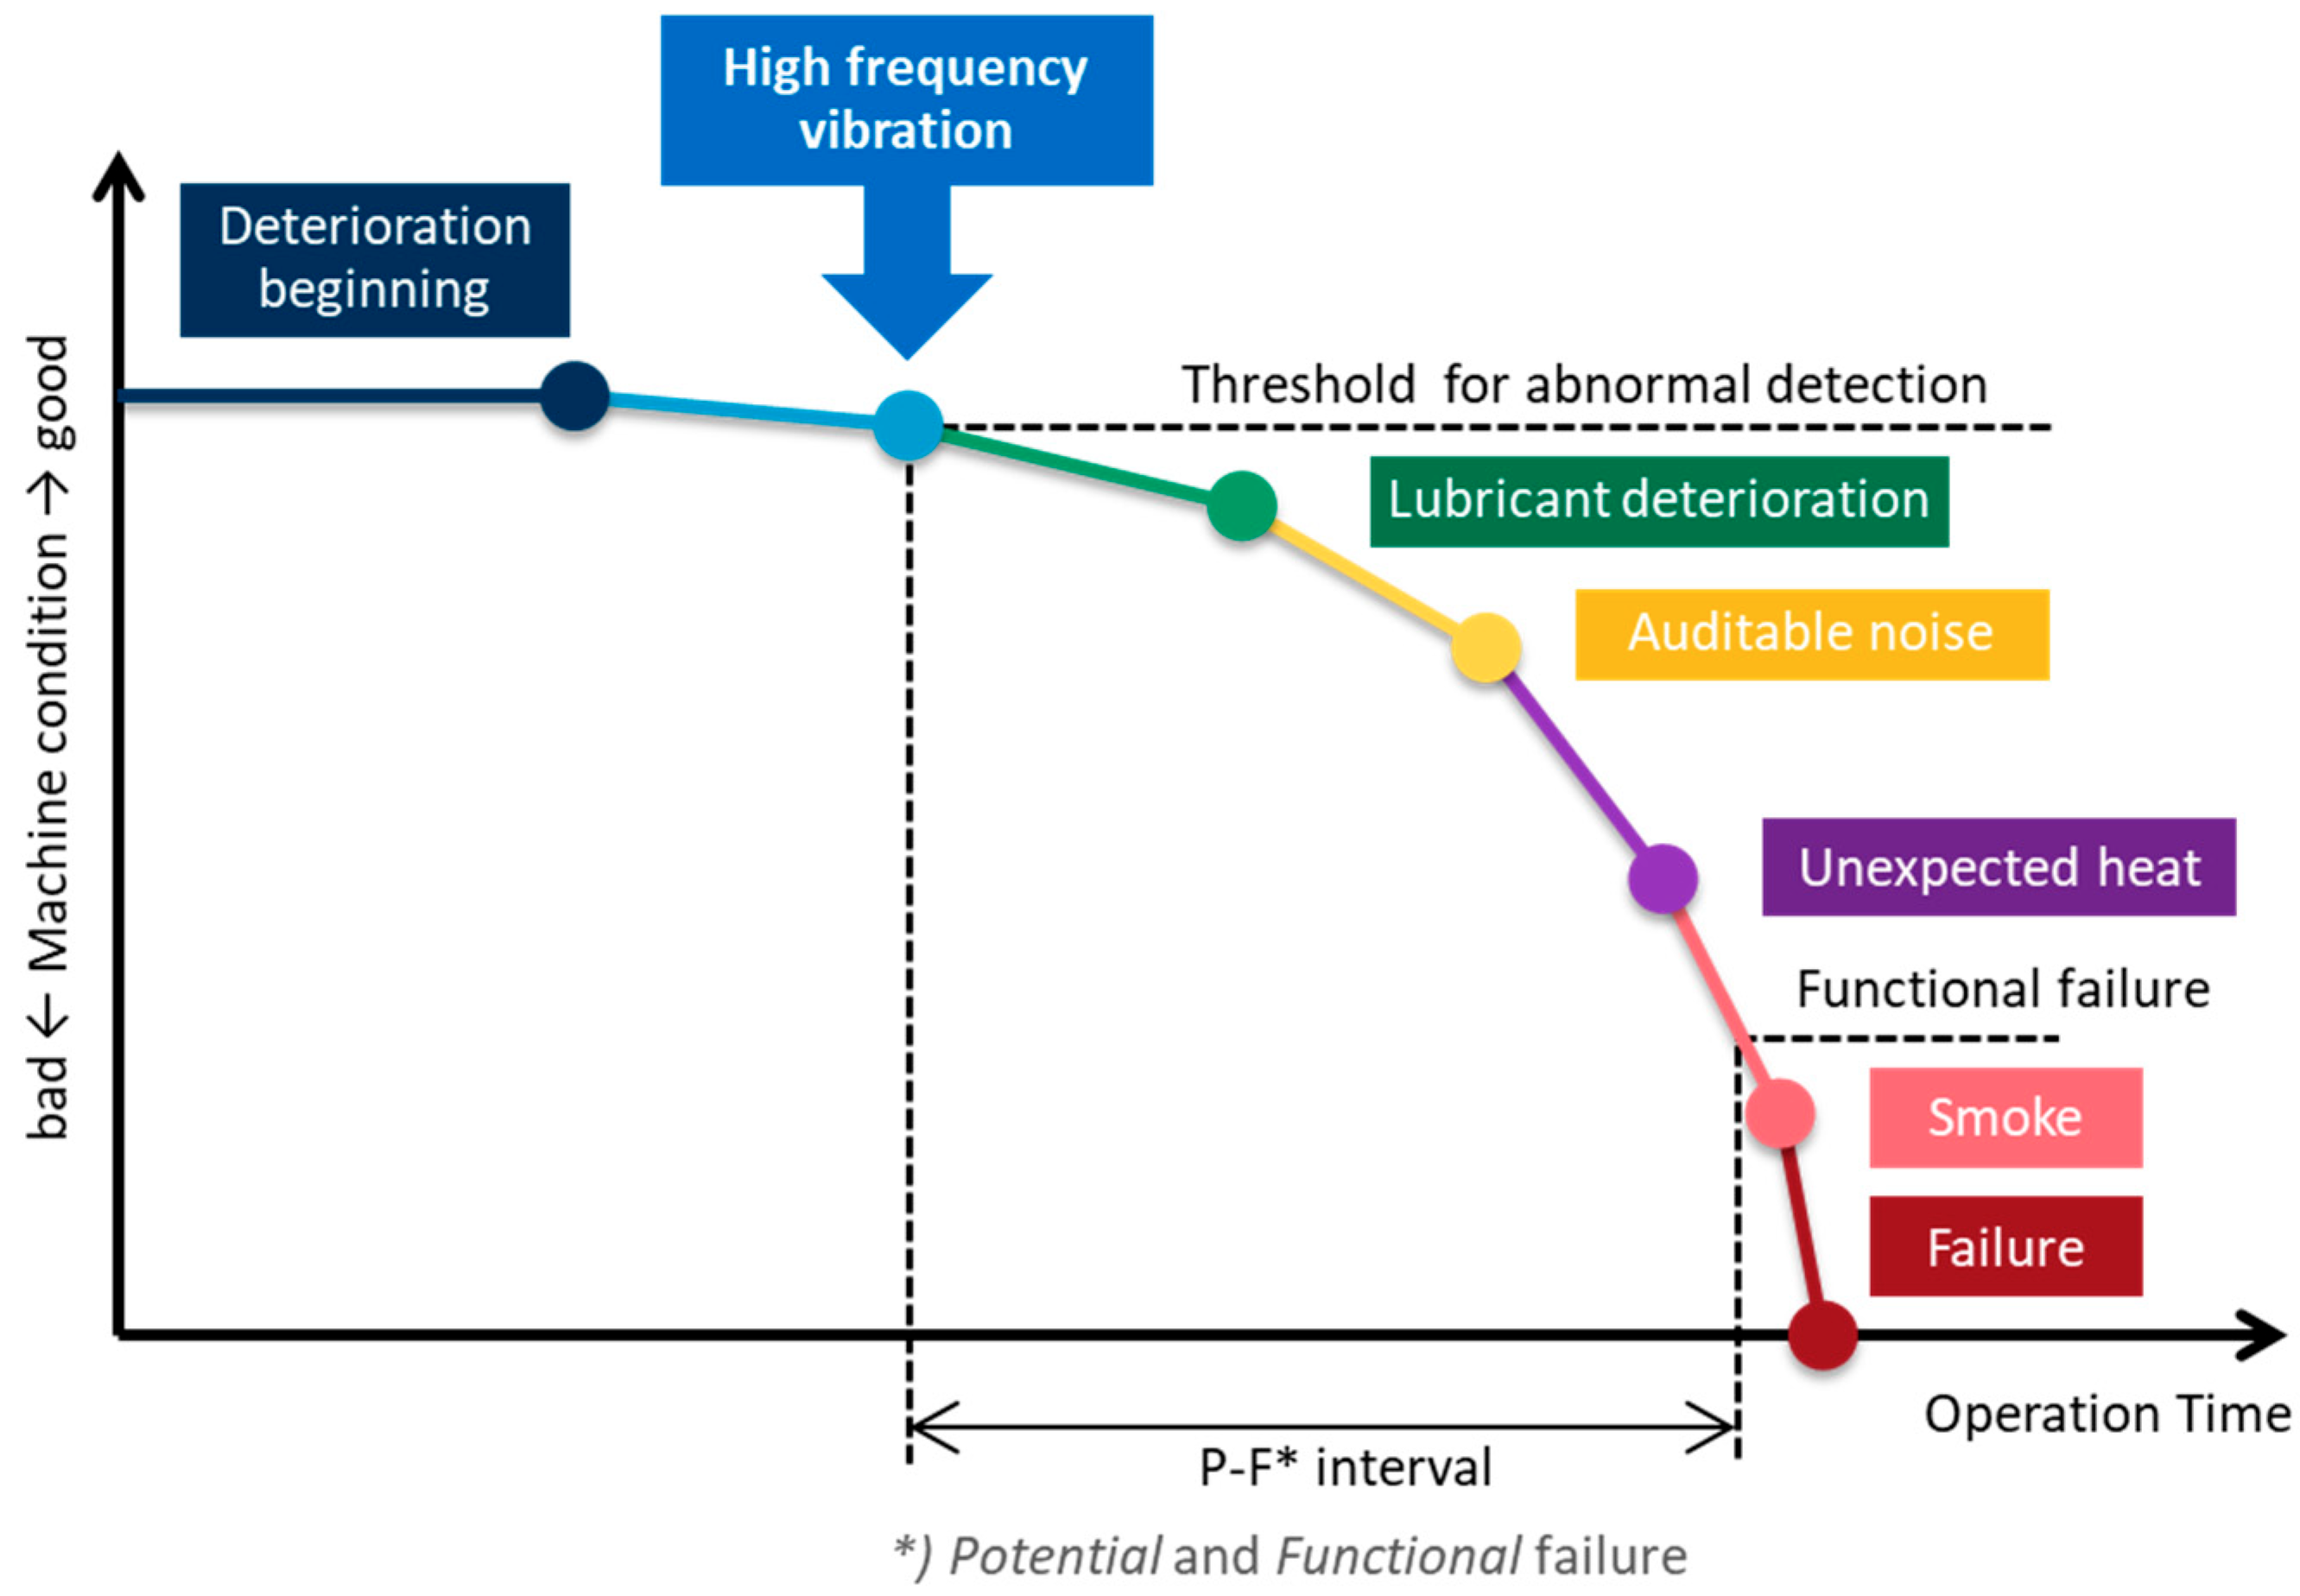
In the context of machine vibrations related to deterioration, the P-F (Potential Failure–Functional Failure) curve, shown in Figure 1, is widely discussed in the CbM engineering field [5]. The P-F curve tracks machine deterioration through various indicators, including vibration, over the operational period. Detecting vibrations in the early stages of deterioration is crucial, as characteristic changes often emerge during this period [6]. Early detection is essential for timely maintenance. For example, bearing fault monitoring requires detecting high-frequency vibrations, as these serve as critical diagnostic features. A motor rotating at 880 rpm can generate vibrations exceeding 10 kHz in the frequency spectrum [7], which must be detected by sensors.
For sinuous vibrations, the displacement (D [mm]) is determined by acceleration (A [g]) and vibration frequency (f [Hz]), as expressed in Equation (1). As the equation indicates, higher vibration frequencies correspond to smaller displacements, necessitating sensor systems capable of detecting extremely small displacement ranges.
D = A × 2 × 10 3 × 9.8 2 π f 2
Among contactless displacement sensing techniques, optical laser sensors are one of the feasible options for precise displacement measurement. Several studies have employed optical laser sensors to measure small displacements. To achieve extreme sensor accuracy, a photonic FMCW radar architecture has been proposed, in which the chirped signal generator and dechirp modulation are implemented using a photonic circuit, while the RF frontend is based on a microwave and millimeter-wave transceiver circuit [8]. Since the photonic circuit offers lower phase noise, higher chirp linearity, and significantly wider bandwidth [9], ultra-high accuracy can be achieved in small displacement measurements, reaching the sub-micron or nanometer range. However, this system requires more complex components and a much higher-speed analog frontend circuit (e.g., a high-speed A/D converter). Furthermore, in condition-based monitoring (CbM) of machines, vibration amplitudes typically range from millimeters to micrometers, making RF-based FMCW radar sufficiently accurate while allowing for a simplified circuit, such as a single integrated MMIC. Additionally, RF frontends can operate reliably in harsh and dusty environments, and RF-based circuits offer greater stability under such conditions.
As for studies on RF radar sensor accuracy, several studies have validated the accuracy and precision of radar sensors for small vibration or displacement measurements using controlled experimental setups. For instance, mechanical linear sliders or actuators have been used to provide well-defined displacements while radar sensors detect the target’s position [10,11,12]. However, in such cases, measurement accuracy depends on the precision of the mechanical system, which includes components such as motors, metal arms, and reflectors in a complex structure. Consequently, scale errors may arise, which are difficult to isolate.
To mitigate such scale errors, some studies employed optical laser displacement sensors as reference sensors for radar measurements [13]. When two sensors (i.e., radar and laser sensor) are used, precise alignment between the sensors and target (e.g., a reflector) is critical, as even a slight angular misalignment can introduce micrometer-scale errors. To resolve alignment issues, an experimental apparatus was developed in which both sensors were linearly aligned on a mechanical linear slider system to minimize misalignment caused by angular offsets [14]. Additionally, the setup was built on a solid granite slab to isolate it from environmental influences. This configuration achieved an accuracy of ±4.5 μm while other limitations, such as thermal expansion and mechanical alignment errors, were also addressed. Furthermore, another study controlled environmental factors such as air temperature, relative humidity, air pressure, and carbon dioxide concentration to improve radar measurement accuracy, achieving ±0.1 μm accuracy, which reached the limit of reference laser sensor accuracy of ±0.4 μm [15].
Further improvements in measurement accuracy require an alternative setup beyond the limitations of the reference laser sensor. Moreover, previous studies did not fully examine MMIC phase accuracy and precision due to circuit characteristics.
In FMCW radar-based vibration monitoring, the phase characteristics of beat signals between consecutive FMCW chirps are directly linked to displacement accuracy and precision [16]. Therefore, phase accuracy and precision are critical parameters for radar sensors in detecting small displacements.
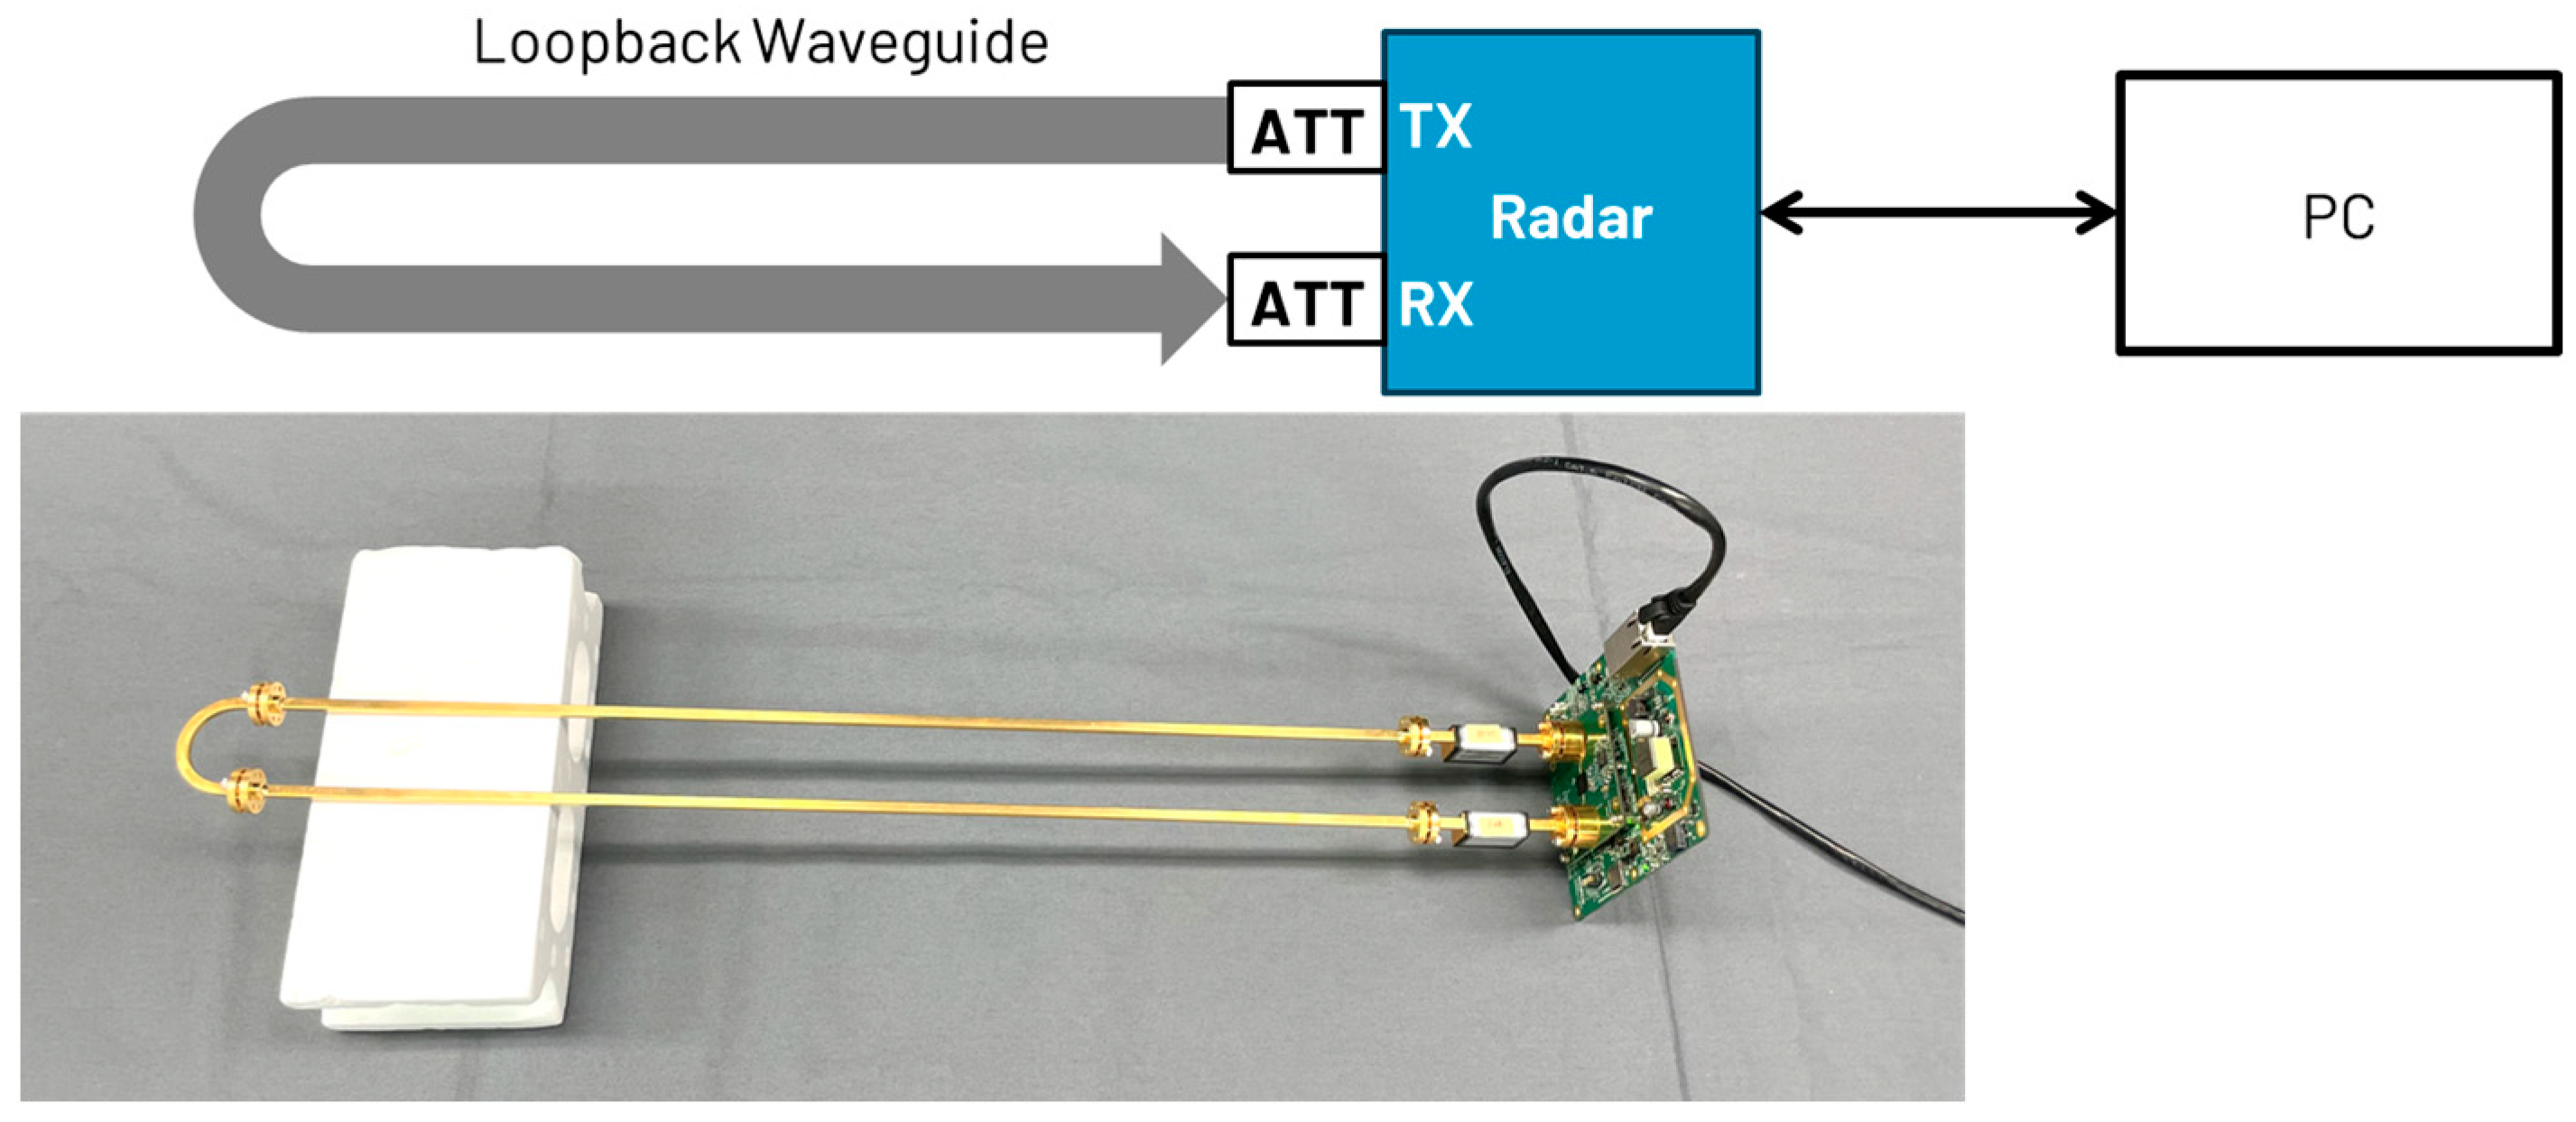
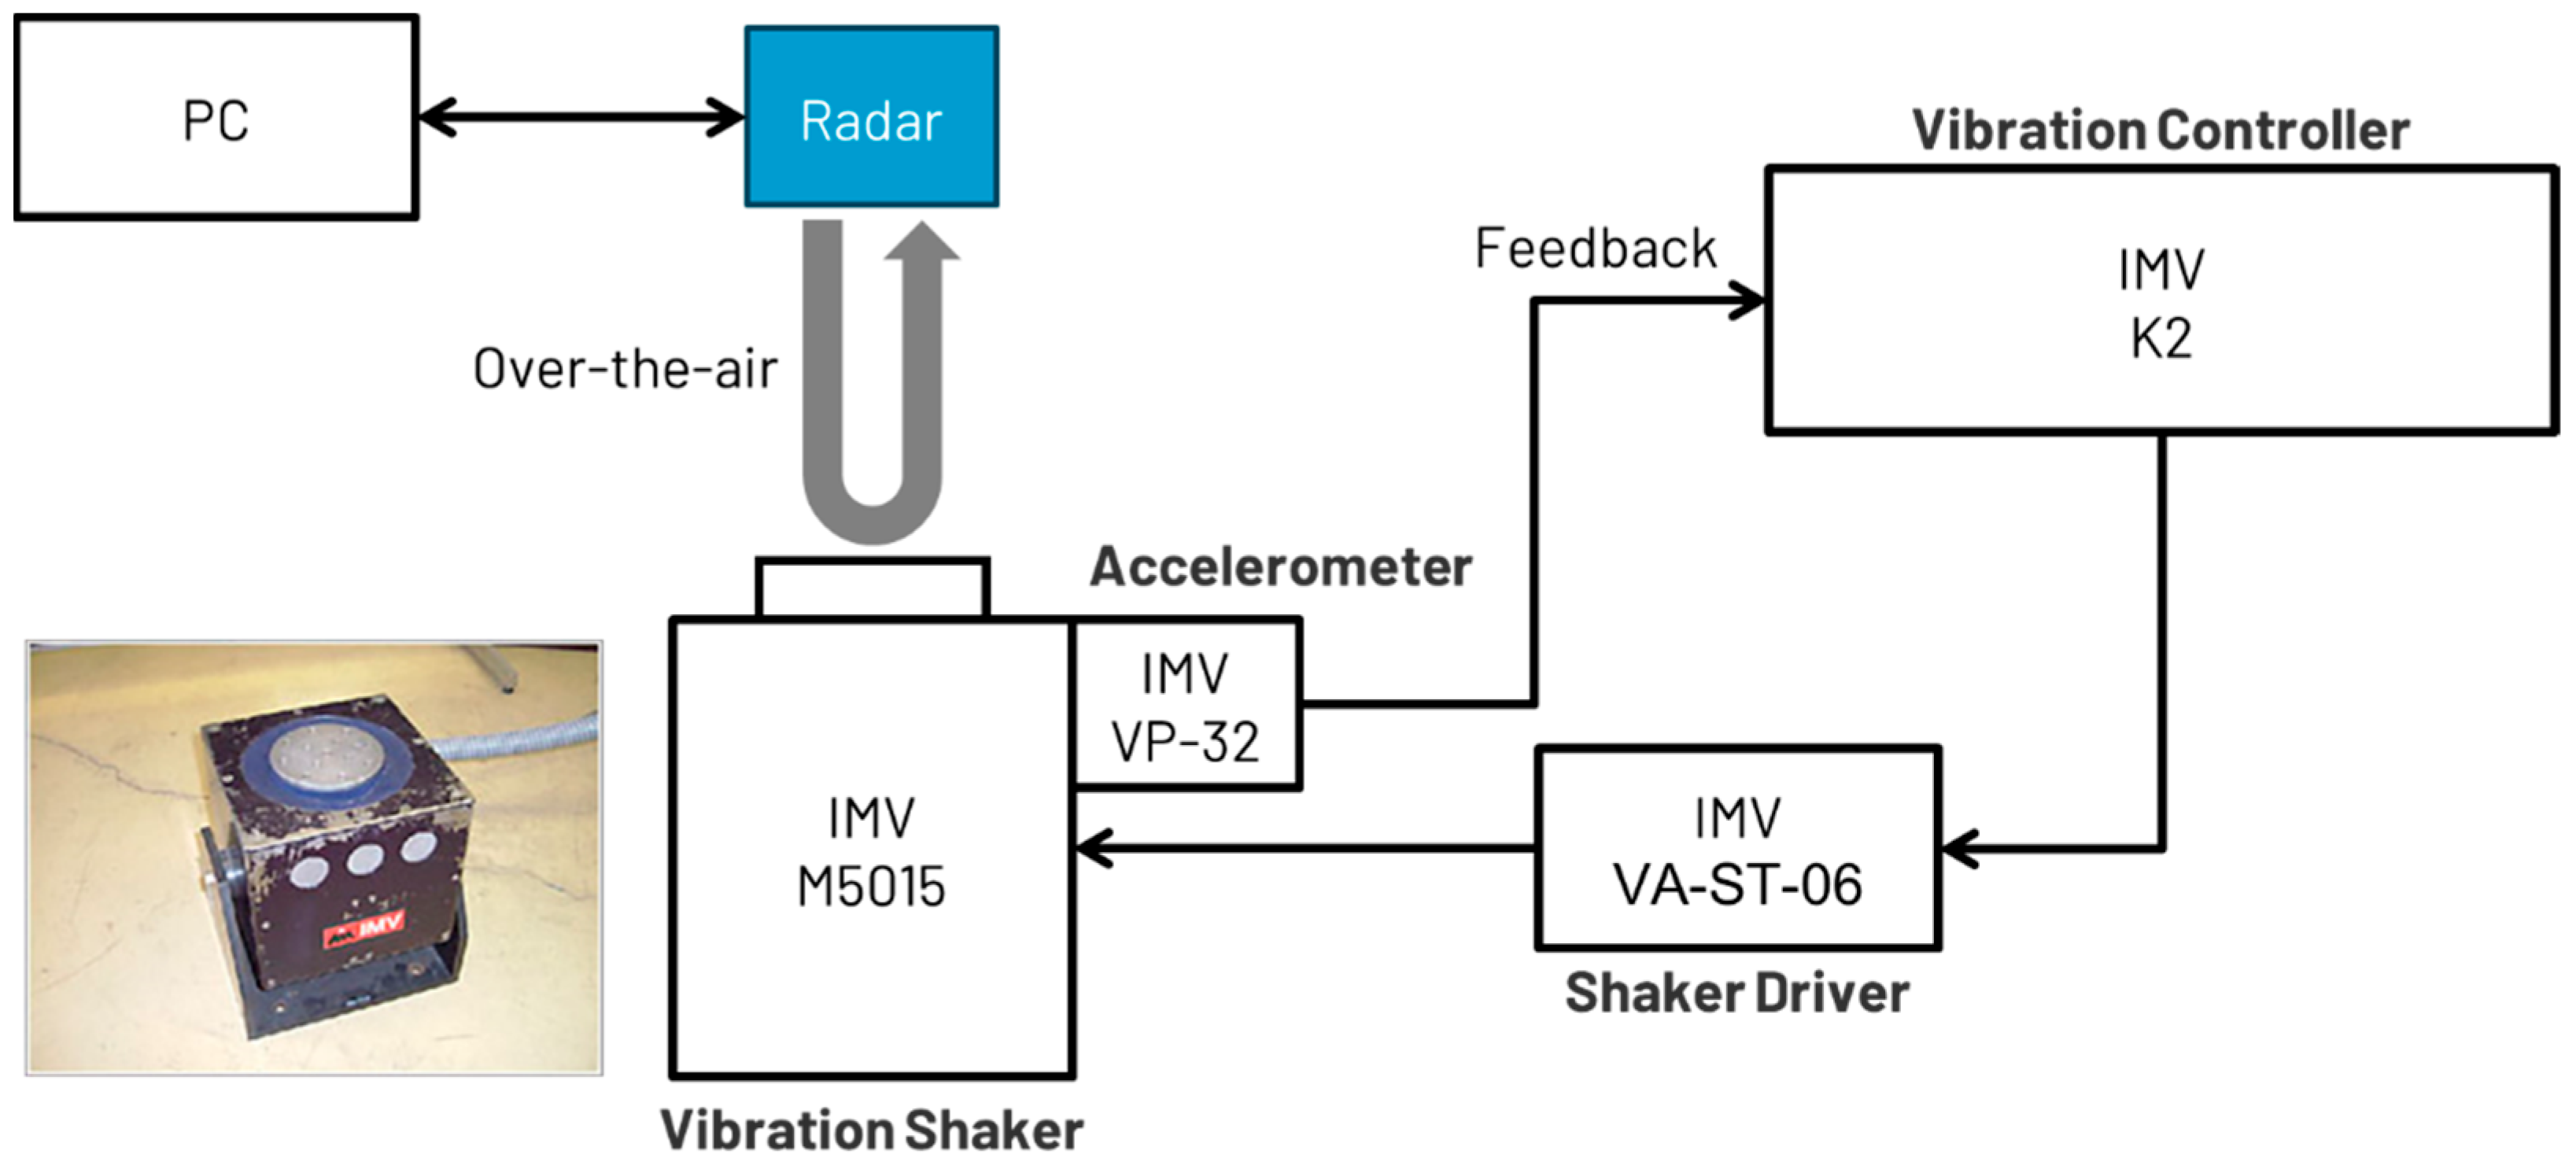
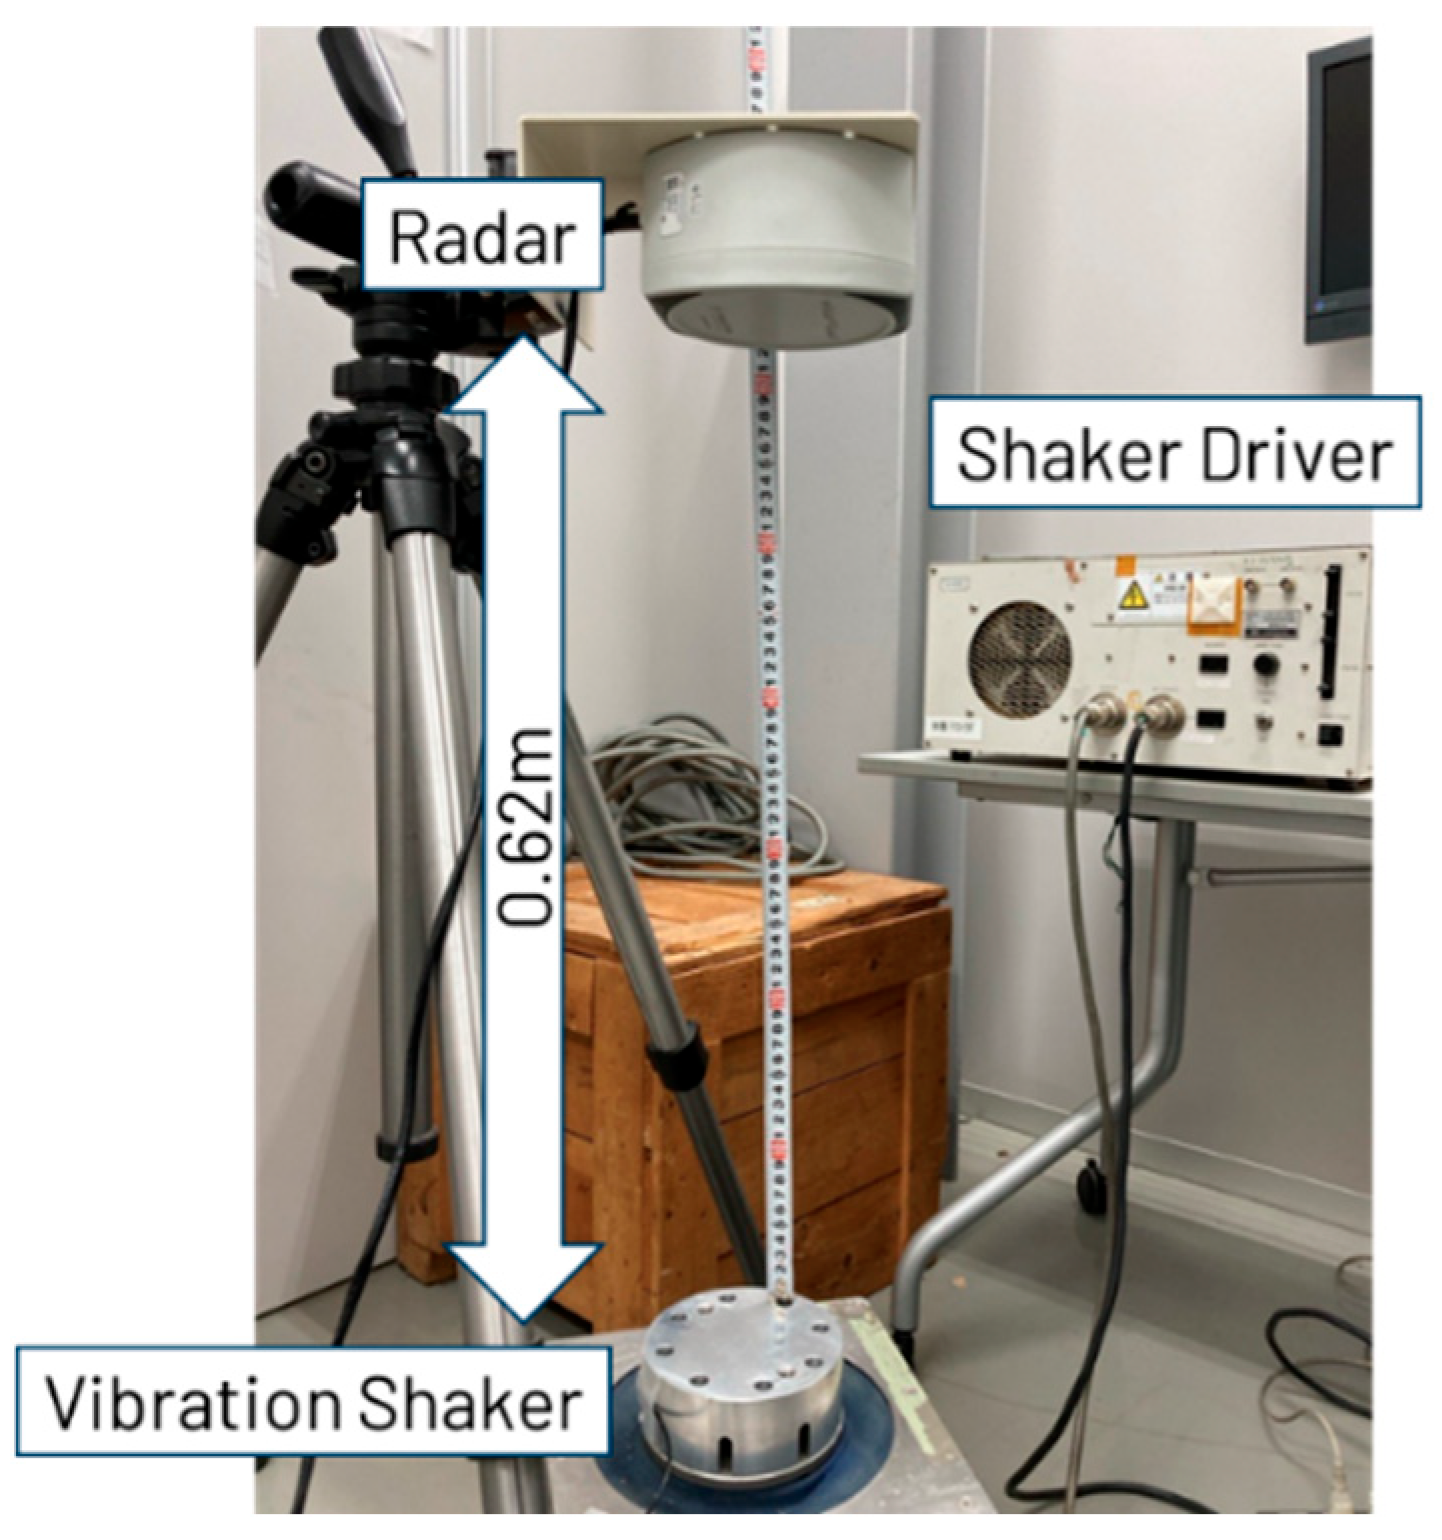
This study aims to address the gap in precise micrometer-scale displacement measurement using FMCW radar through controlled experiments with enhanced methodologies. Unlike previous studies, this research employs a novel loopback waveguide testing method to provide a stable radar target free from environmental influences. Two experiments were conducted to evaluate the radar system’s phase accuracy and precision. The first experiment focused on fundamental phase measurements using a loopback waveguide to evaluate the inherent phase accuracy and precision of the MMIC, independent of environmental factors. The second experiment measured actual displacements in free space using an industrial vibration shaker, which enables precise displacement control and is widely used in the development of commercial industrial products. The methodologies and findings presented in this paper contribute to the advancement of next-generation sensing technologies, establishing a new standard for precision in vibration monitoring using FMCW radar.
This paper is organized as follows: Section 2 introduces the radar signal processing algorithm for machine vibration and small displacement sensing. Section 3 details the experimental setup for phase accuracy and precision measurements. Section 4 presents the results of the two experiments, followed by a discussion in Section 5. Finally, Section 6 concludes this paper.

2. Phase Estimation Algorithm for Displacement Monitoring

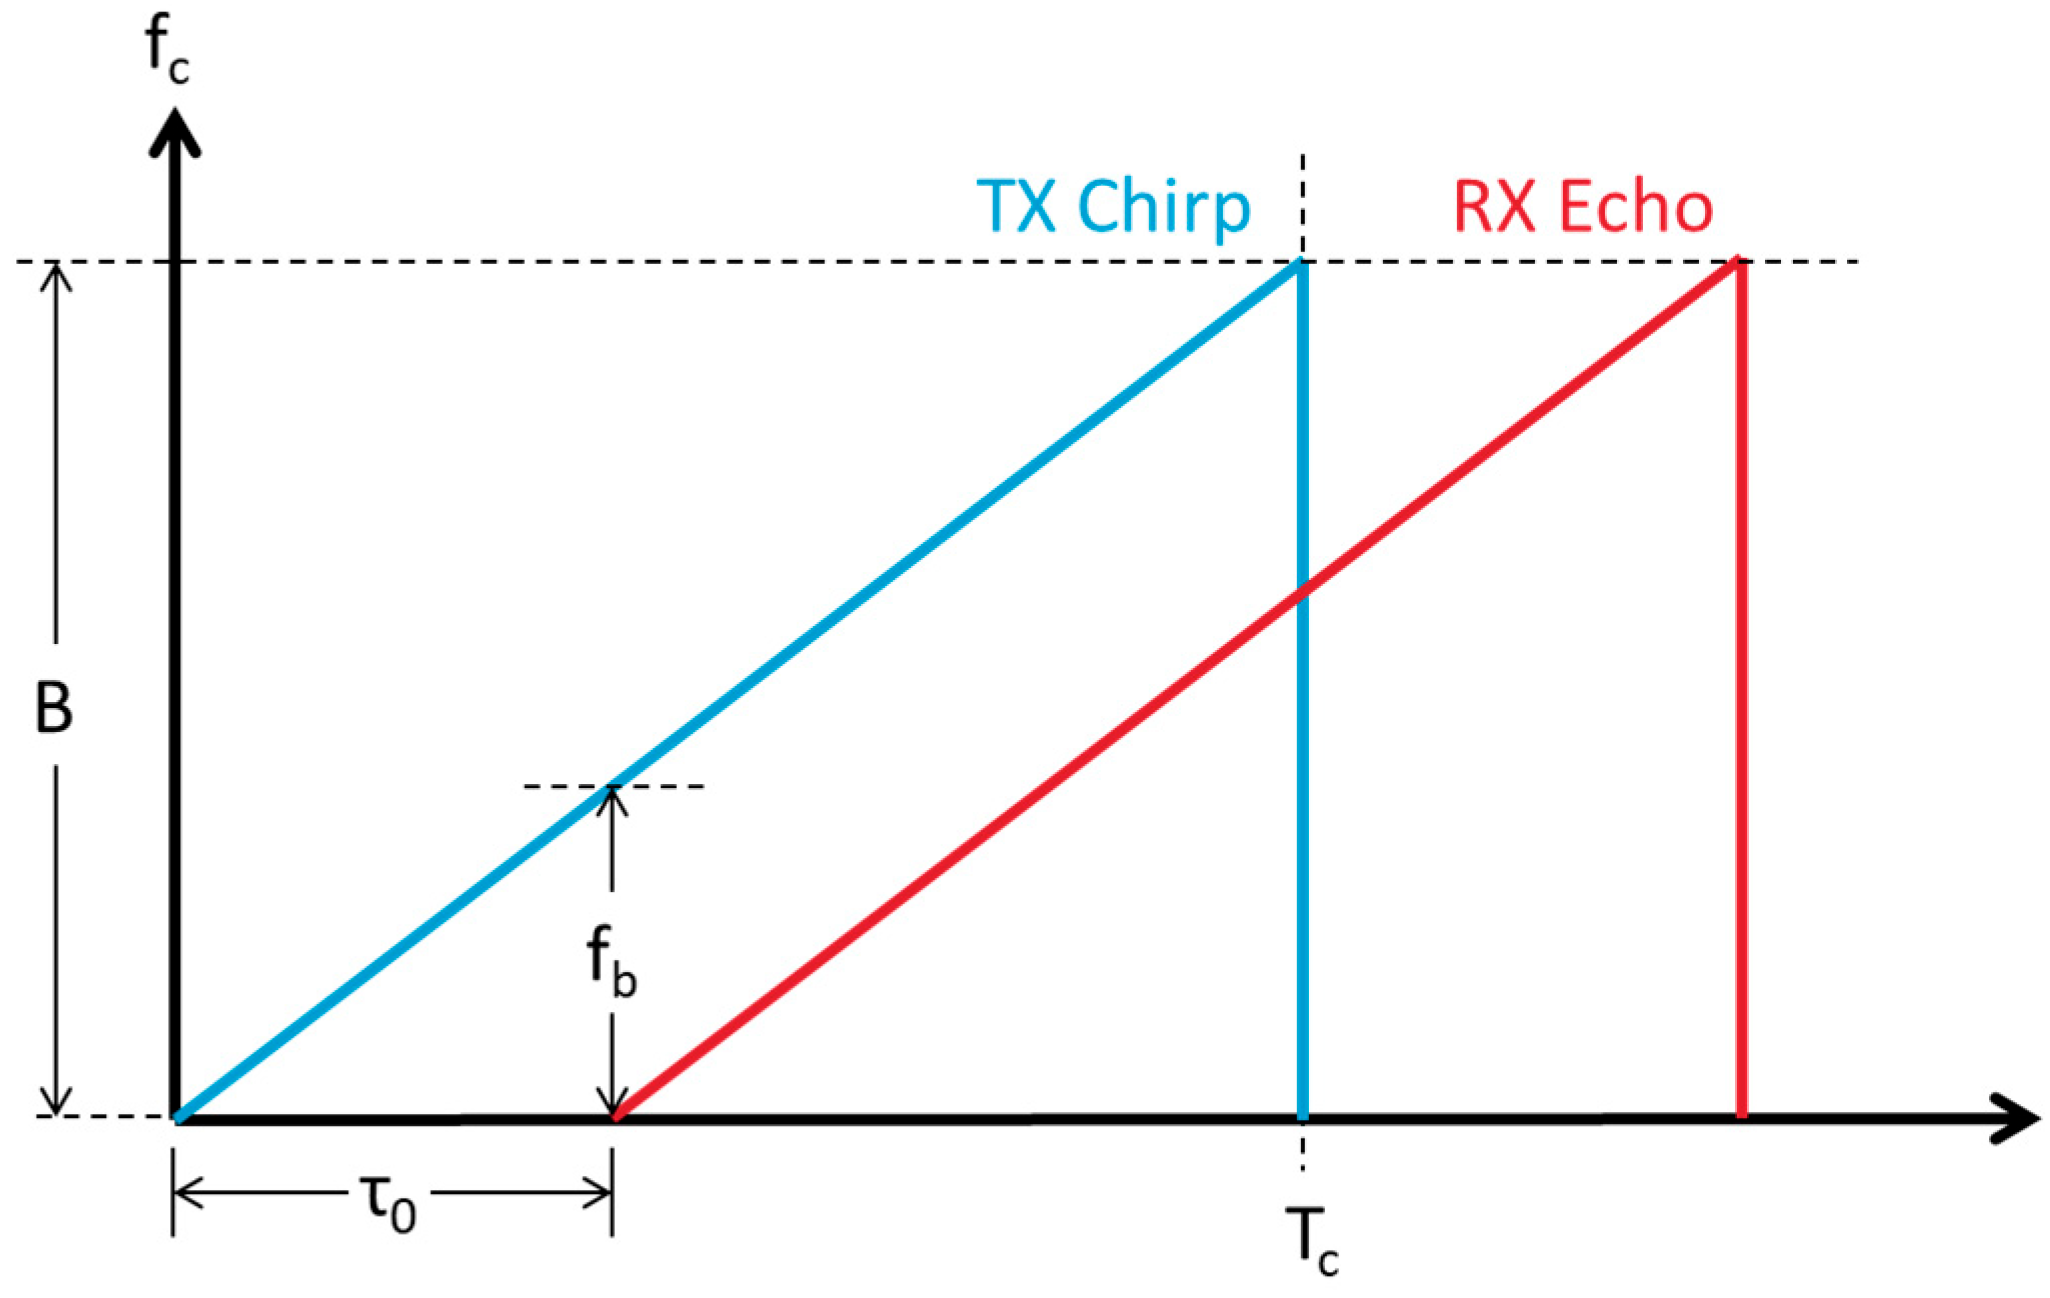
FMCW radar essentially transmits frequency-modulated continuous wave signals toward a target at a distance d0, and the returning echo is a delayed version of the transmitted signal, with the delay denoted by τ0. In an FMCW system designed with Tc and B as parameters—where Tc is the chirp duration, B is the chirp sweep bandwidth, and c is the speed of light—the range is determined by the beat frequency fb, which represents the difference between the transmitted waveform and the echo as described in Figure 2. The range d0 between the radar and the target can be expressed by Equation (2). In this study, we focus on a specific fb, meaning that a specific d0 is fixed.
d 0 = c T c f b 2 B
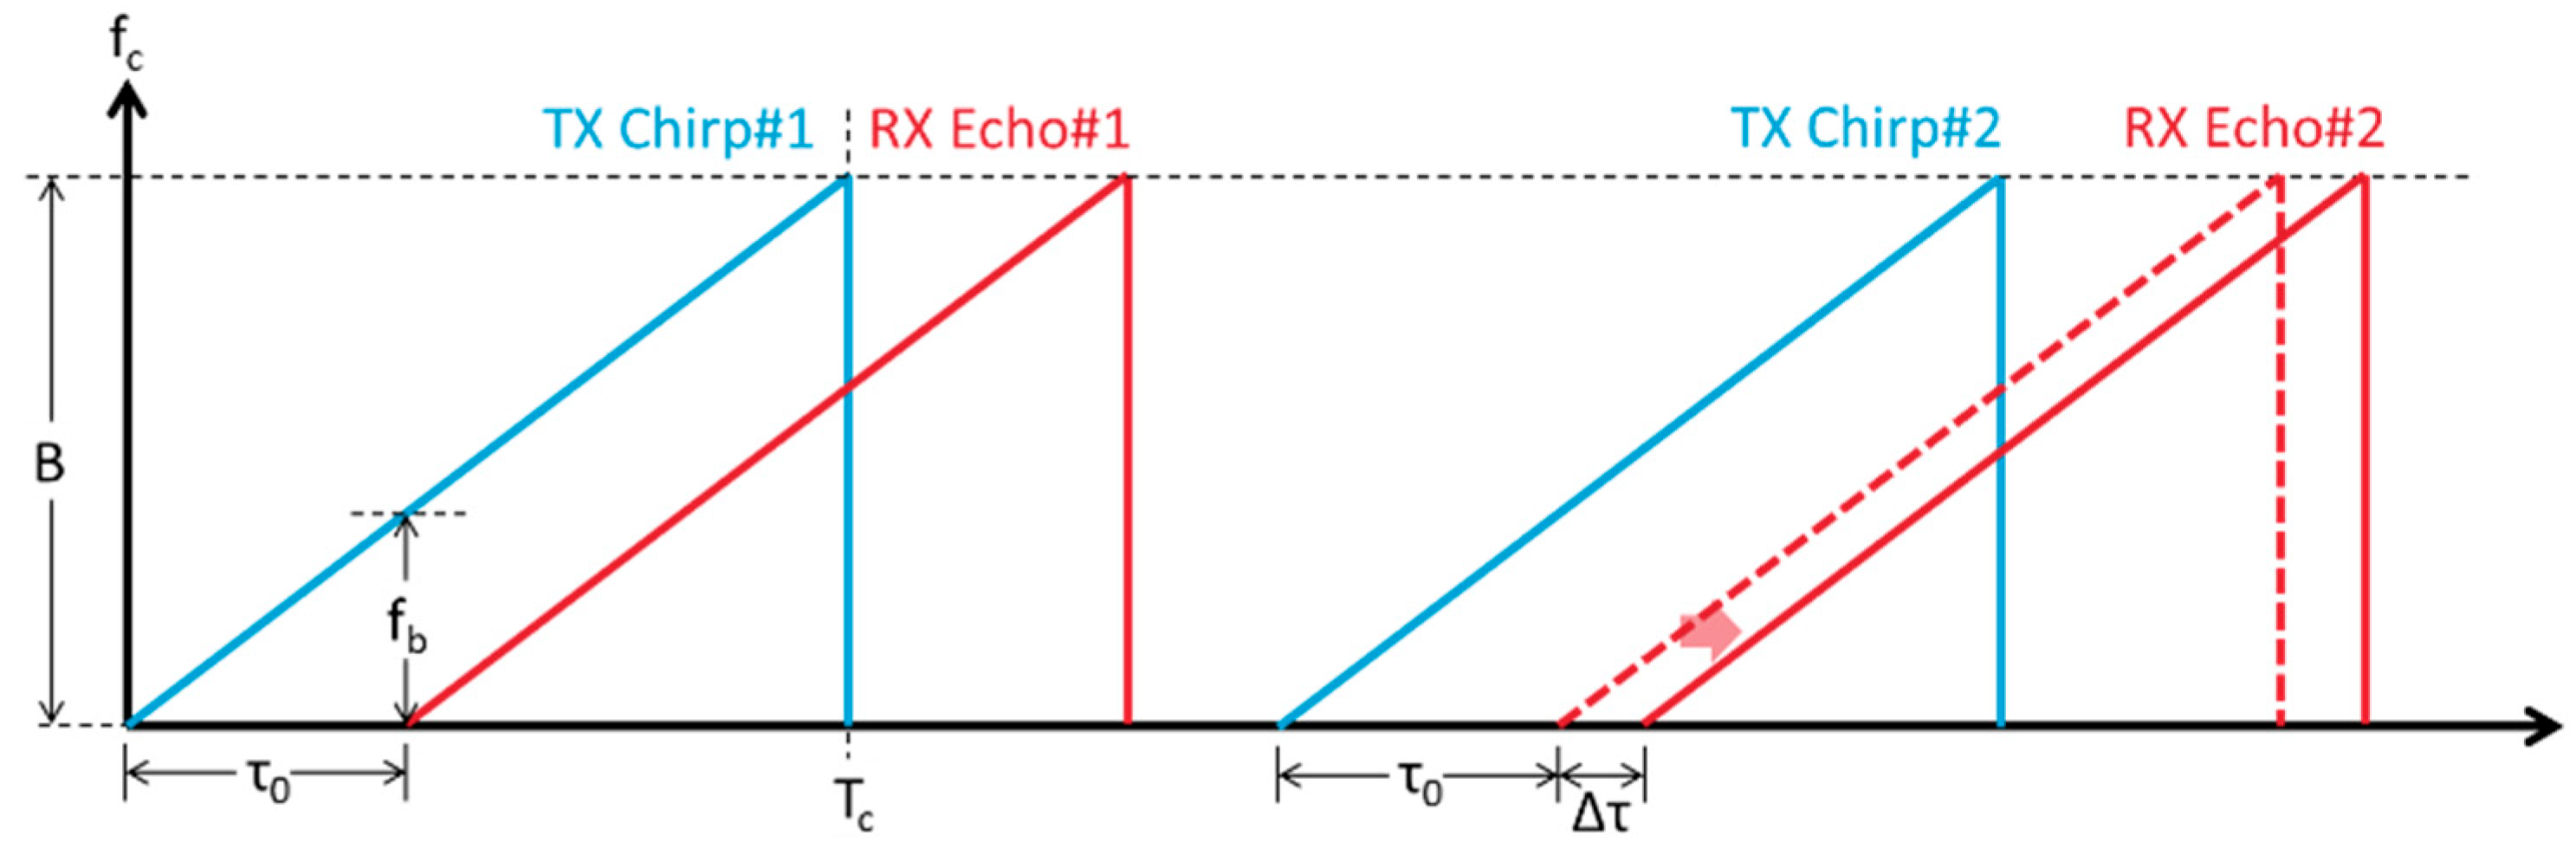
If the target undergoes a very small displacement while fb remains the same between two chirps, the echo delay Δτ of the second echo is minimal, and the change in fb is less than the system’s resolution. This scenario is illustrated in Figure 3.
The phase of the beat signal from the first chirp and its echo can be described by Equation (3), while the phase of the beat signal for the second chirp is described by Equation (4). The difference between these two phases can be calculated using Equation (5).
φ 1 = 2 π f c τ 0
φ 2 = 2 π f c τ 0 + τ
φ = φ 2 φ 1 = 2 π f c τ
The small displacement d that occurs between the first and second chirp results in a delay Δτ, as expressed in Equation (6). The carrier frequency fc is defined in Equation (7). Consequently, the phase difference Δϕ due to the small displacement is given by Equation (8), and d can be derived from Equation (9).
2 d = c τ
f c = c λ
Δ φ = 4 π d λ
d = λ 4 π Δ φ
According to Equation (9), a displacement causes a phase shift in the beat signal, with the wavelength λ being a fixed system parameter. For instance, if d is very small, on the order of 1 µm, and λ is 3.8 mm (i.e., 79 GHz), then Δϕ would be 0.19 degrees. This implies that the sensor system must have the accuracy to detect such a small phase shift (Δϕ). Therefore, this study will examine the accuracy and precision of phase measurements through experimental approaches.
The phase accuracy is dependent on the radar MMIC, and it is not dependent on the supported RF frequency. If the same phase shift (e.g., 1 degree) is captured by both a 24 GHz (λ = 12.5 mm) and a 79 GHz (λ = 3.8 mm) radar system, the corresponding displacement in the 24 GHz system would be 3.3 times larger than that in the 79 GHz system, according to Equation (9). Therefore, a higher-frequency system enables more precise measurements under the same phase shift conditions. Based on this principle, this study adopts a millimeter-wave FMCW radar MMIC.

3. Experimental Setup

3.1. Radar System Equipment

In this study, we utilized the ADAR6902 from Analog Devices as the millimeter-wave FMCW radar transceiver MMIC. This device features an all-digital PLL based on a Rotary Traveling Wave Oscillator (RTWO) architecture. The RTWO circuit facilitates lower phase noise [17], which is crucial for precise clocking, while simultaneously supporting ultra-high frequencies and broader bandwidths, despite the inherent design complexities. Using this MMIC, we developed a millimeter-wave FMCW radar sensor system named “miRadar CbM”, which features a narrow field of view (FoV) of ±3° to accurately detect specific machine vibrations.
To achieve precise sensing, the system employs a single transmitter and receiver in a 1T1R RF configuration, although the MMIC itself supports three transmitters and four receivers. Figure 4 shows the system block diagram of the sensor. In Figure 5, the left side (a) shows the hardware, and the right side (b) displays the software GUI (version no. 2021_0611_2150 Ver0.1) used for measurement. Table 1 presents the sensor system specifications.

3.2. Phase Performance Test Using Loopback Waveguide

As described in Section 2, the accuracy and precision of radar sensors are crucial for detecting small displacements. A previous study evaluating the phase performance of FMCW radar employed a measurement method in which radar targets were positioned at arbitrary distances, and phase fluctuations in the IF signal from the target echo received by the radar sensor were analyzed [18]. However, to accurately measure extremely small phase deviations, which are affected by small displacements of the target, both the radar and the target must be securely fixed. Furthermore, completely eliminating noise caused by spatial and environmental vibrations is challenging, as such noise often affects the measurement system. For instance, a previous study [14] observed a 100 Hz noise originating from the measurement equipment.
Traditionally, the phase characteristics have been measured or calibrated in free space (i.e., over-the-air), where a radar MMIC transmits an FMCW waveform and receives the echo from a fixed target (e.g., a corner reflector). For general-purpose ranging applications, such as sensors for autonomous driving, this is not a critical issue. However, for detecting very small displacements on the micrometer scale, it becomes a significant challenge. The target must remain strictly rigid relative to the MMIC, and isolating the setup from any environmental vibrations is also challenging.
In this study, we mitigated environmental influences by connecting the transmission and receiving ports with a waveguide, as shown in Figure 6. This waveguide setup simplified the experimental configuration by eliminating the need for vibration-isolation tables to stabilize the radar and target, as well as an anechoic chamber to remove unintended echoes, thereby facilitating easier measurements. The radar sensor used in this experiment was the miRadar CbM, with the only modification being the replacement of the antenna output and input with a waveguide, while all other configurations remained unchanged.
Measurements were performed using the FMCW radar profile outlined in Table 2. In this experiment, two pulse repetition time (PRT) profiles were evaluated. Each chirp consisted of 256 ADC samples, and range FFTs were computed with 4096 samples, achieved by zero-padding the original 256 samples to 4096. A single chirp burst comprised 2048 chirps. Measurements were conducted over a 30 s duration, corresponding to approximately 60 bursts per iteration. The experiment was repeated three times, resulting in a total of 583,500 ADC samples collected for analysis under each of the two sensor settings, as summarized in Table 3.

3.3. Phase Performance Test Using Industrial Vibration Shaker

To verify the radar sensor’s capability in industrial vibration sensing, a second measurement scenario was conducted using an industrial vibration shaker as a reference target for vibration. In this setup, a vibration test system by IMV was employed, as illustrated in Figure 7 and Figure 8. For the measurement of very small displacements, several setups were adopted, such as the shaker machine and linear mechanical slider, as shown in Table 4. Currently, there is no mature and standardized setup for such measurements. Therefore, the experiment in this study was conducted at the IMV test center, which complies with ISO/IEC 17025 [19] standards for the competence of testing and calibration laboratories. ISO/IEC 17025 is a standard for laboratory management systems, ensuring that all equipment is well calibrated.
The vibration test system controls both acceleration and vibration frequency, which in turn determine the displacement, defined as the peak-to-peak vibration amplitude. In this experiment, vibration frequencies of 700 Hz and 1600 Hz were used, with accelerations adjusted to generate specific small displacements at the target. The displacement amplitude ranged from 15.198 μm down to 0.019 μm, as described in Table 5.
Each measurement was conducted over a 30 s period with three iterations, resulting in a total of 48 trials at 700 Hz and another 48 trials at 1600 Hz, as detailed in Table 5 and Table 6.

4. Results

4.1. Results Using Loopback Waveguide Test

According to the initial experimental results using the loopback waveguide, phase instability was observed specifically during the first 192 chirps and the first 5 bursts at the start of the measurement. Figure 9 shows the chirp and burst framework at the experiential measurement and stable phase data to be picked up. This instability is attributed to the MMIC instability caused by the self-heating of the circuit. Figure 10 shows the standard deviation (STDEV) of the raw phase data from a single measurement, which consists of 62 bursts and 2048 chirps. The data indicates that instability occurs during the first 5 bursts out of the total 62 bursts and the first 192 chirps out of the total 2048 chirps, while the subsequent data remain highly stable. Figure 11 illustrates the data after the removal of the unstable segments, resulting in 1856 chirps and 57 bursts, which demonstrate very stable phase data.
Next, Figure 12 presents a histogram of the measurement data, focusing exclusively on the stable phase data described earlier. Table 7 summarizes the statistical analysis of sensor accuracy and precision. The maximum phase offset of +0.359 degrees, corresponding to a displacement of +1.907 μm, represents the accuracy error of the sensor. Similarly, the maximum ±1.180 degrees, corresponding to ±1.180 μm displacement, reflects the sensor’s precision. All discussions are based on a 3-sigma scenario for statistical reliability because this work aims to prove the capability for commercial use cases where a 3-sigma scenario has always been adopted.
According to Figure 12, the means are shifted to the positive side, even though only the stable phase data are plotted. Since the waveguide is entirely rigid, this offset can be attributed to the inherent characteristics of the MMIC itself. Through this experiment, the fundamental accuracy and precision of the radar MMIC sensor were successfully validated using the rigid loopback waveguide method.

4.2. Results Using Industrial Shaker

Next, Figure 13 presents a scatter plot of all data collected from the industrial shaker test, with the green line representing the ideal target displacement. As discussed in Section 4.1 regarding the sensor data offset caused by the MMIC characteristics, this offset is also observed in the current experiment. In Figure 12, the radar sensor data consistently show a positive offset across the entire measurement range, though linearity is maintained. To quantify this relationship, linear regression was applied to the entire dataset, evaluating how well the data fit the green line. The resulting R2 (coefficient of determination) values were 0.99 for the 700 Hz vibration scenario (i.e., Short PRT setting) and 0.80 for the 1600 Hz vibration scenario (i.e., Long PRT setting). These high R2 values indicate a very strong correlation across the entire tested range, from 15.198 μm to 0.019 μm, which was generated by the shaker.
As seen in Figure 13, the data exhibit two error components: first, a positive offset error across the entire range, and second, a gradient error, which can be considered a gain error related to displacement. The first error was previously estimated in Section 4.1 and is attributed to the characteristics of the radar MMIC. The second error could be caused by either the MMIC characteristics or the shaker itself, necessitating further experimental measurements with various shaker machines and a wider reference displacement scenario, which should be addressed in future work.

5. Discussion

In 
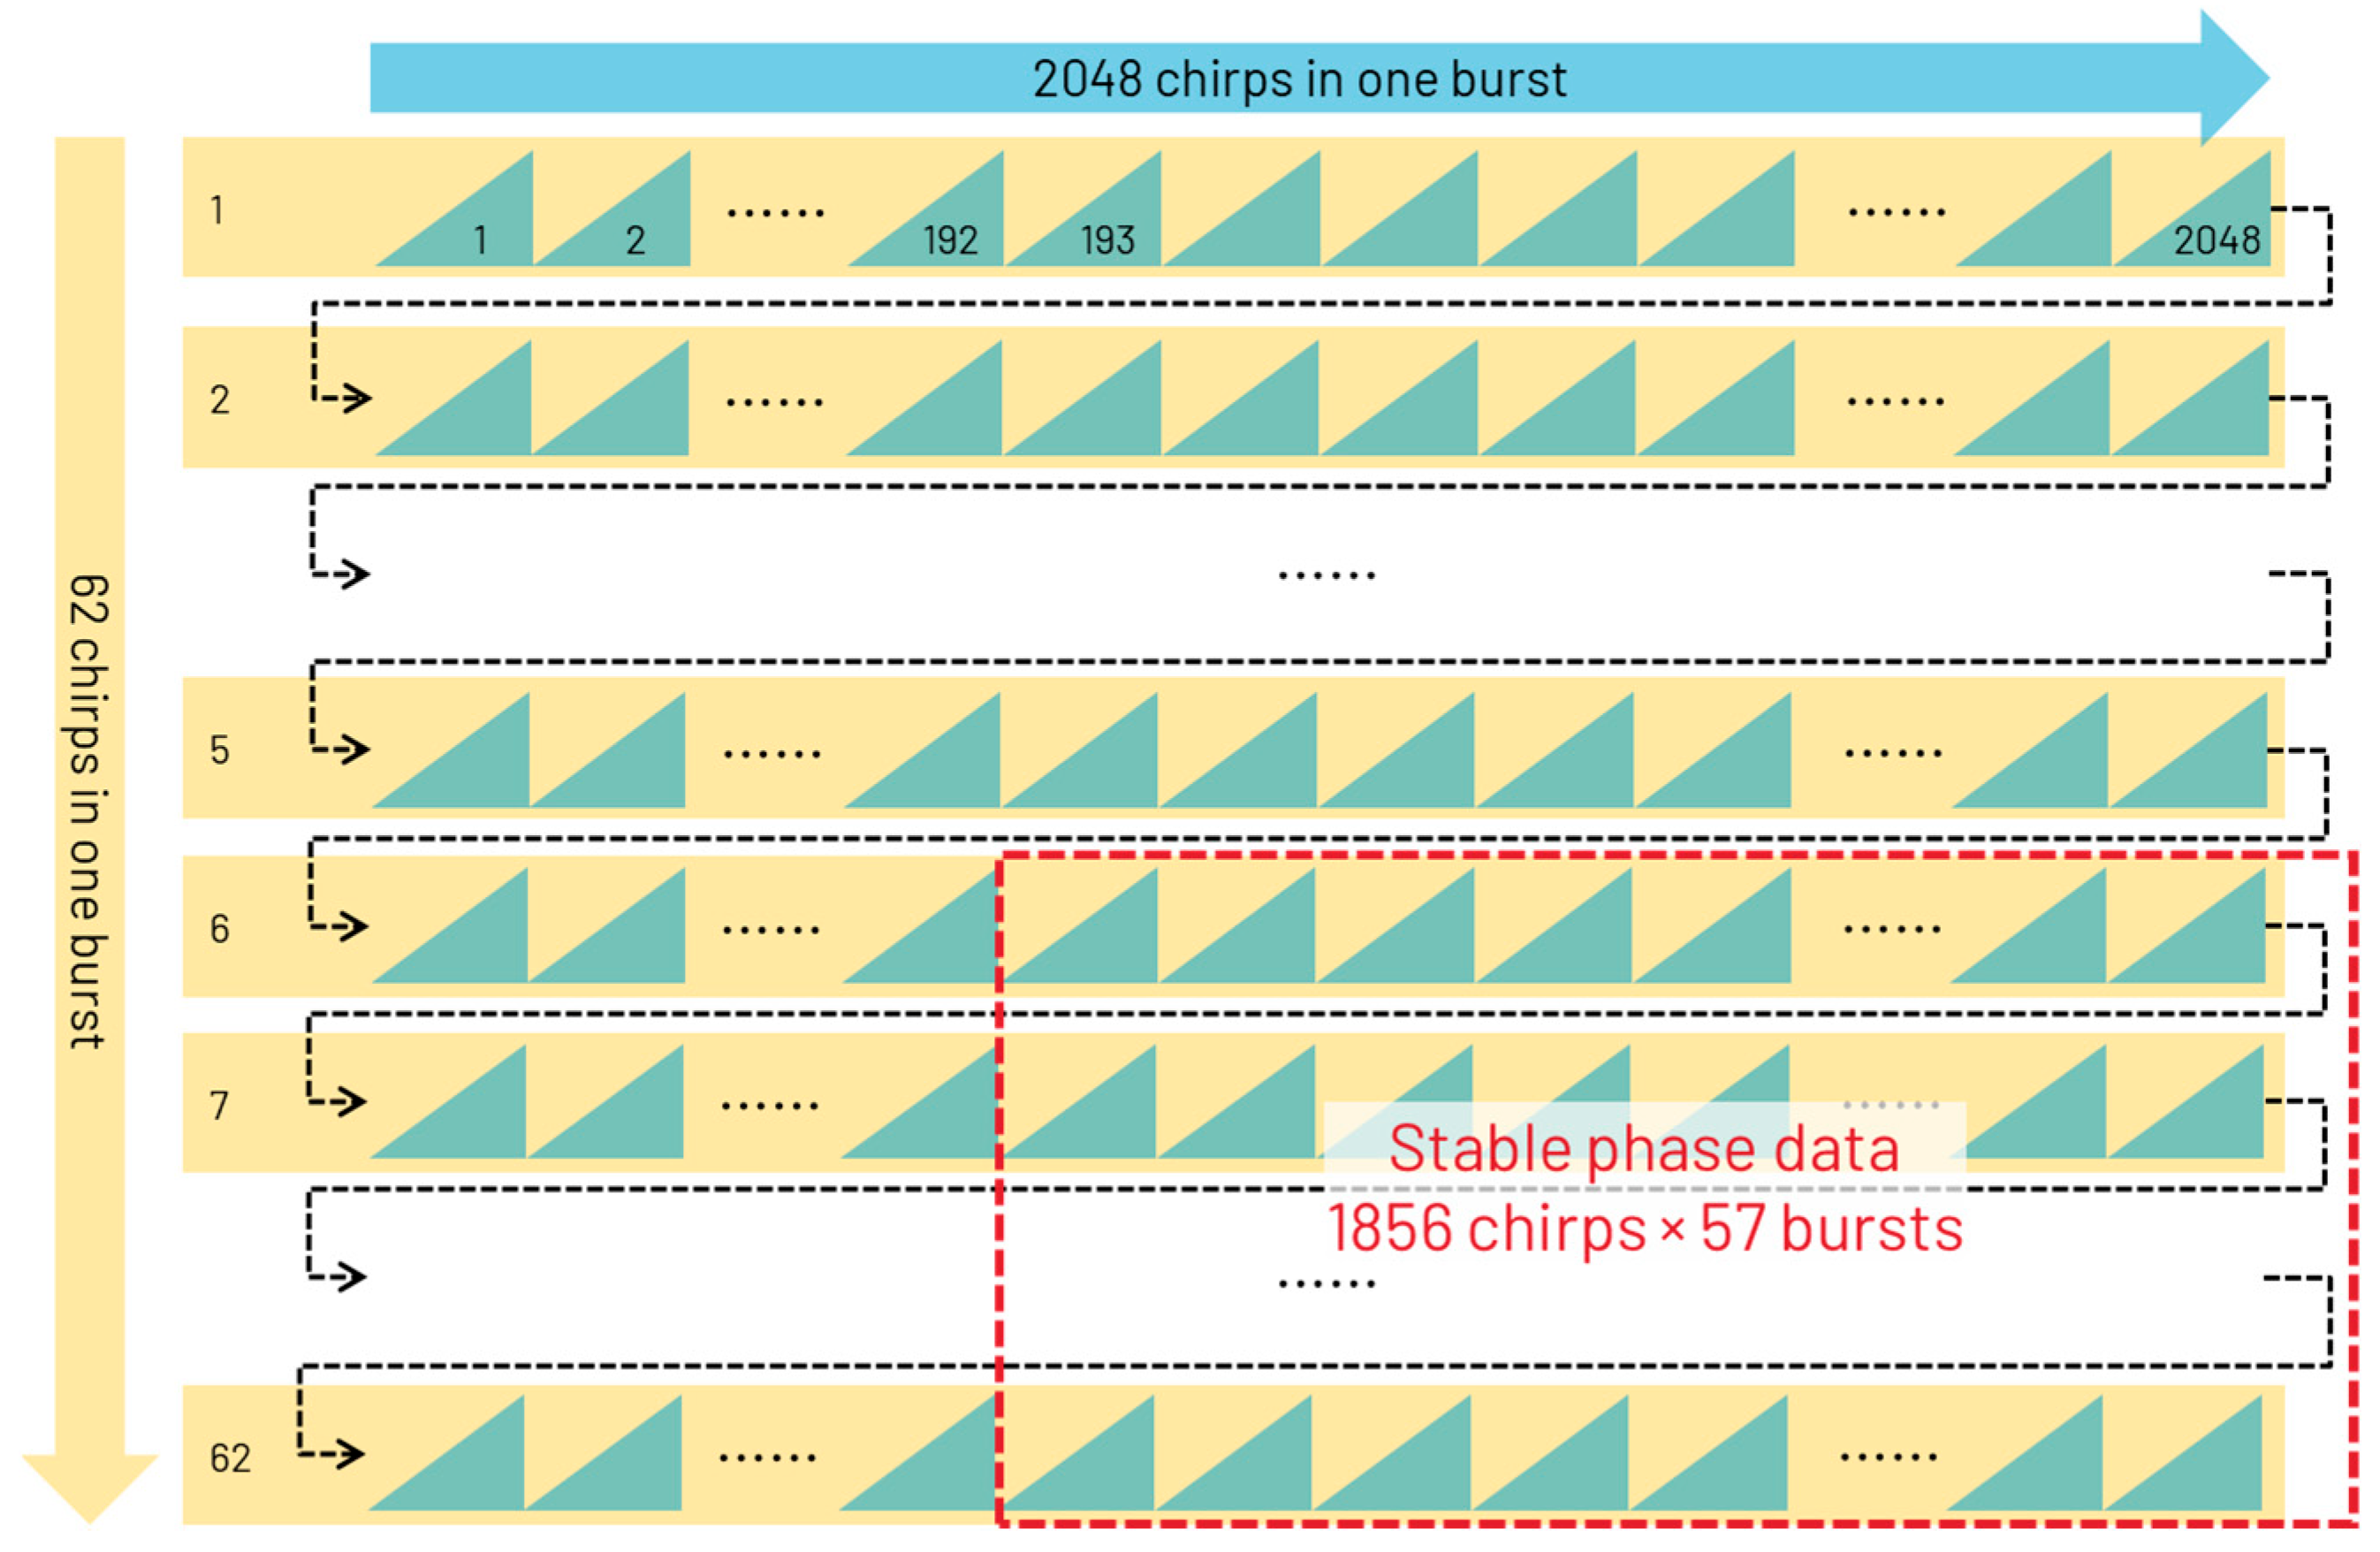
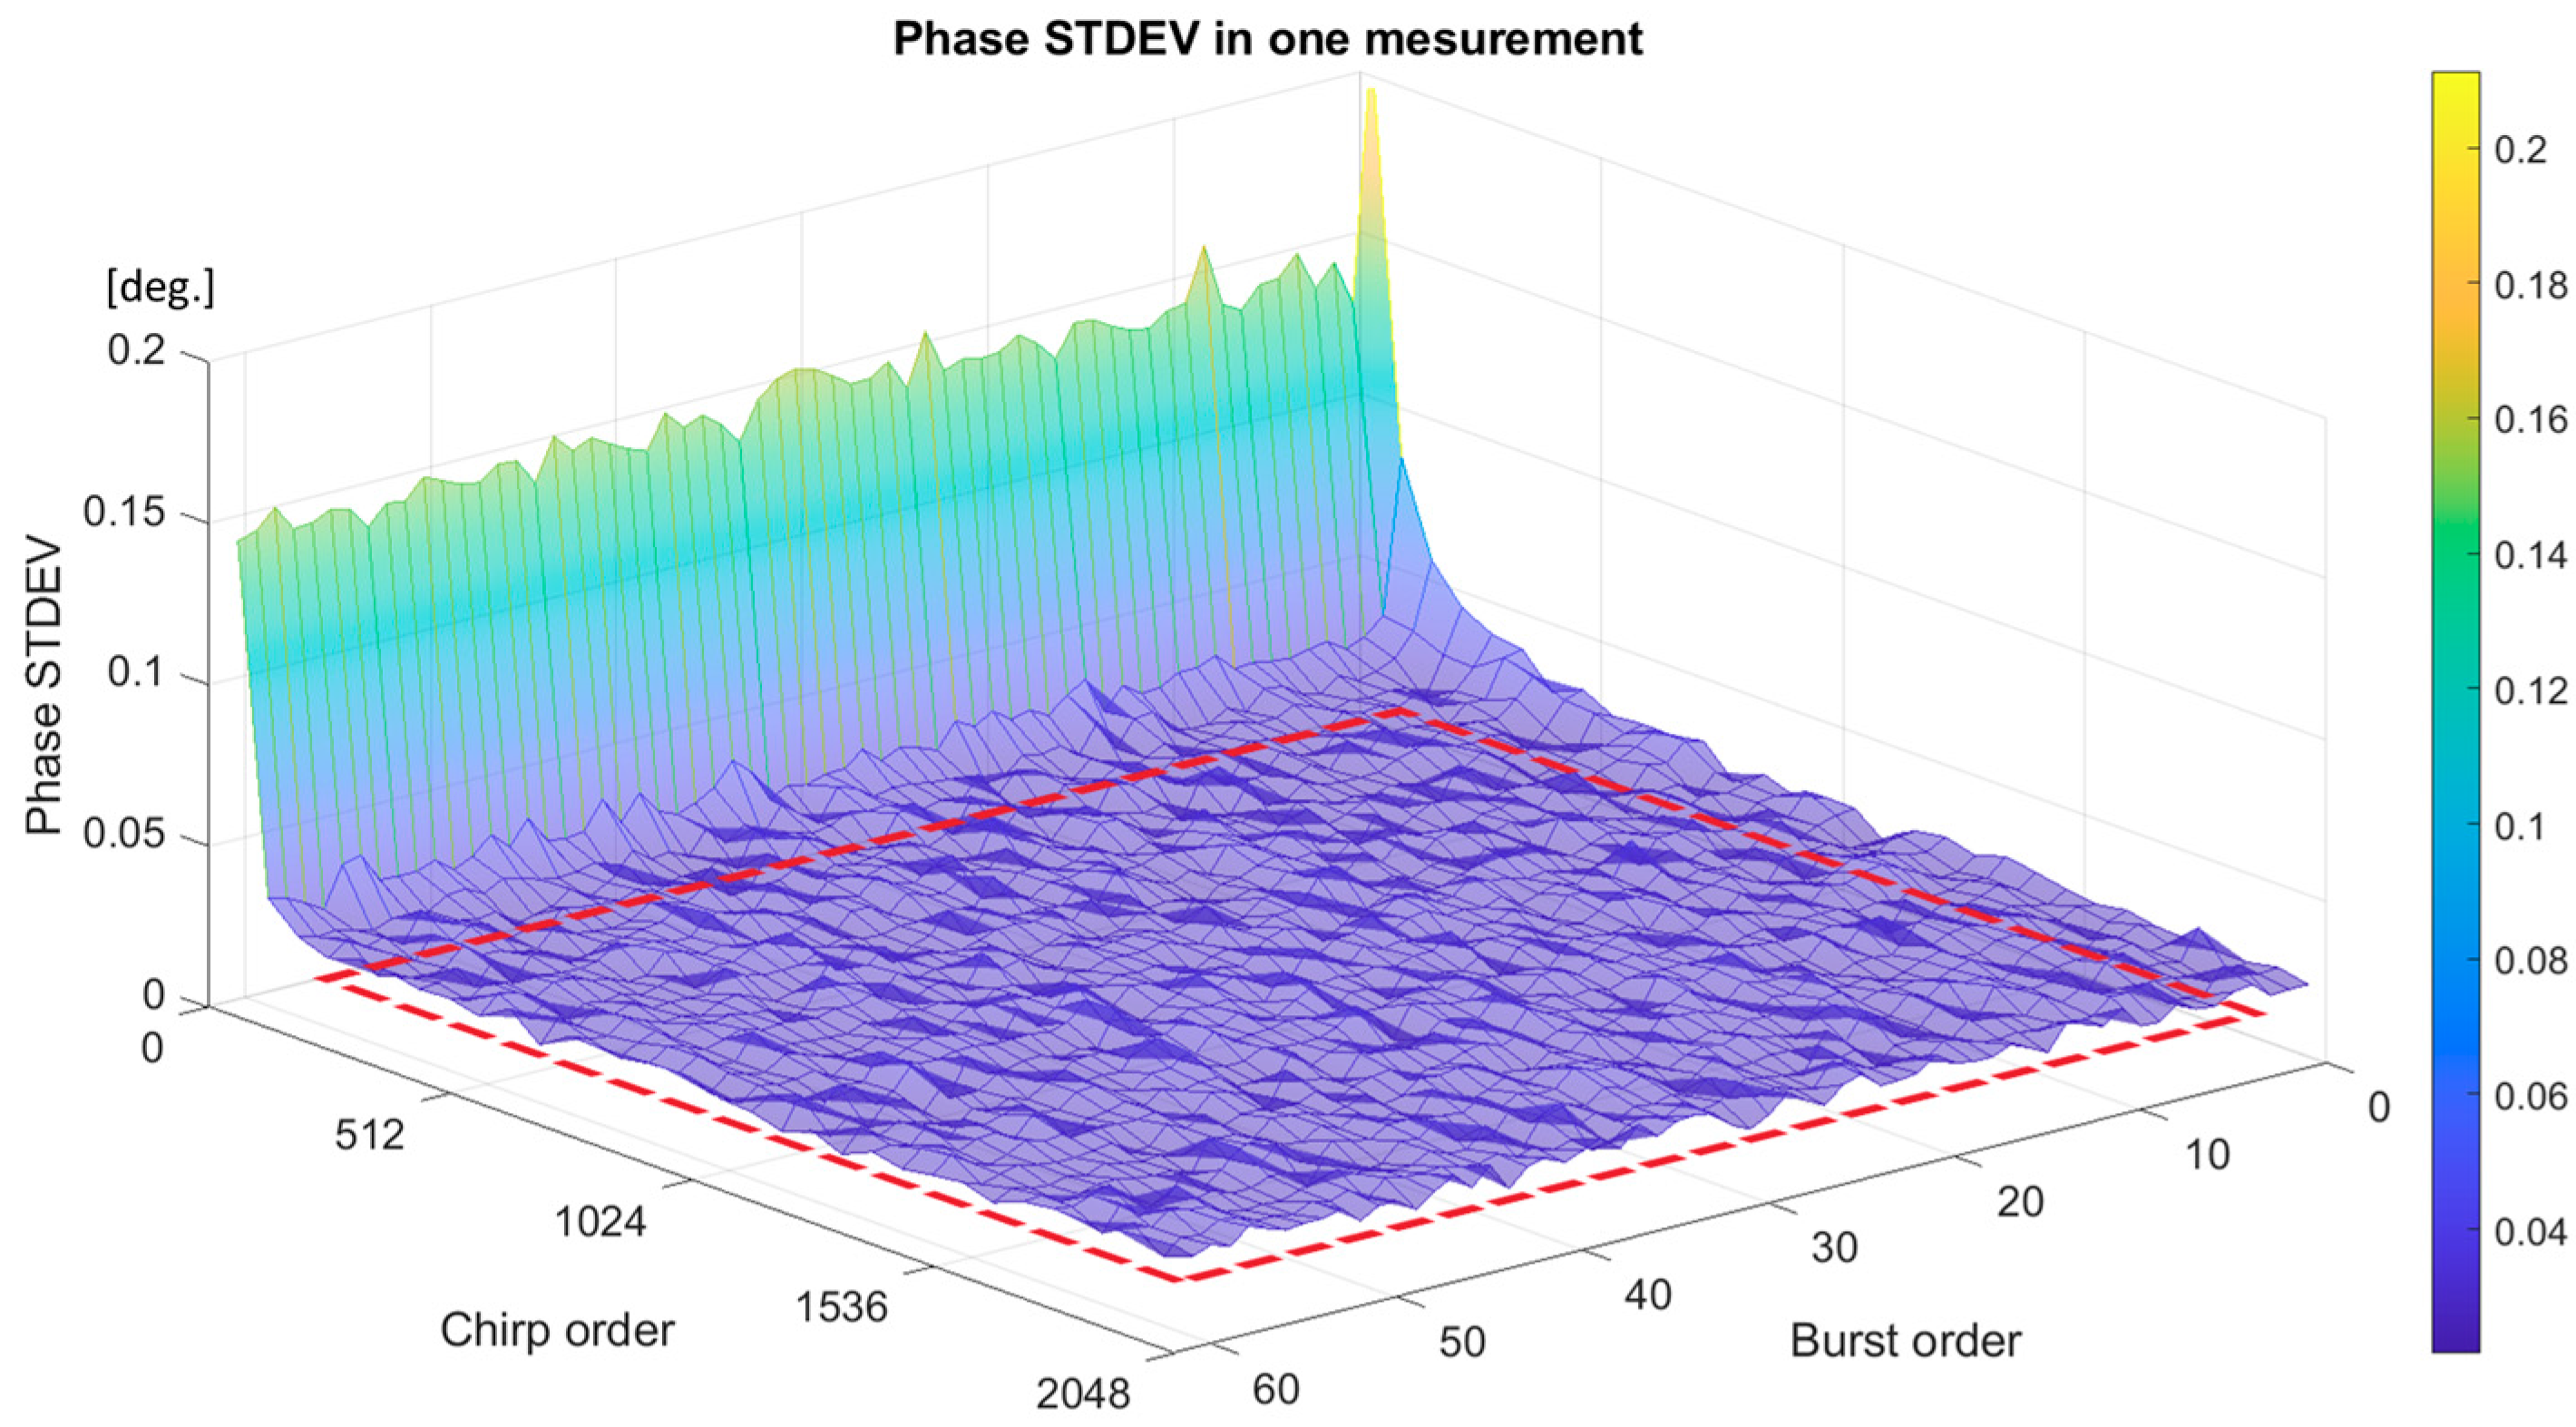
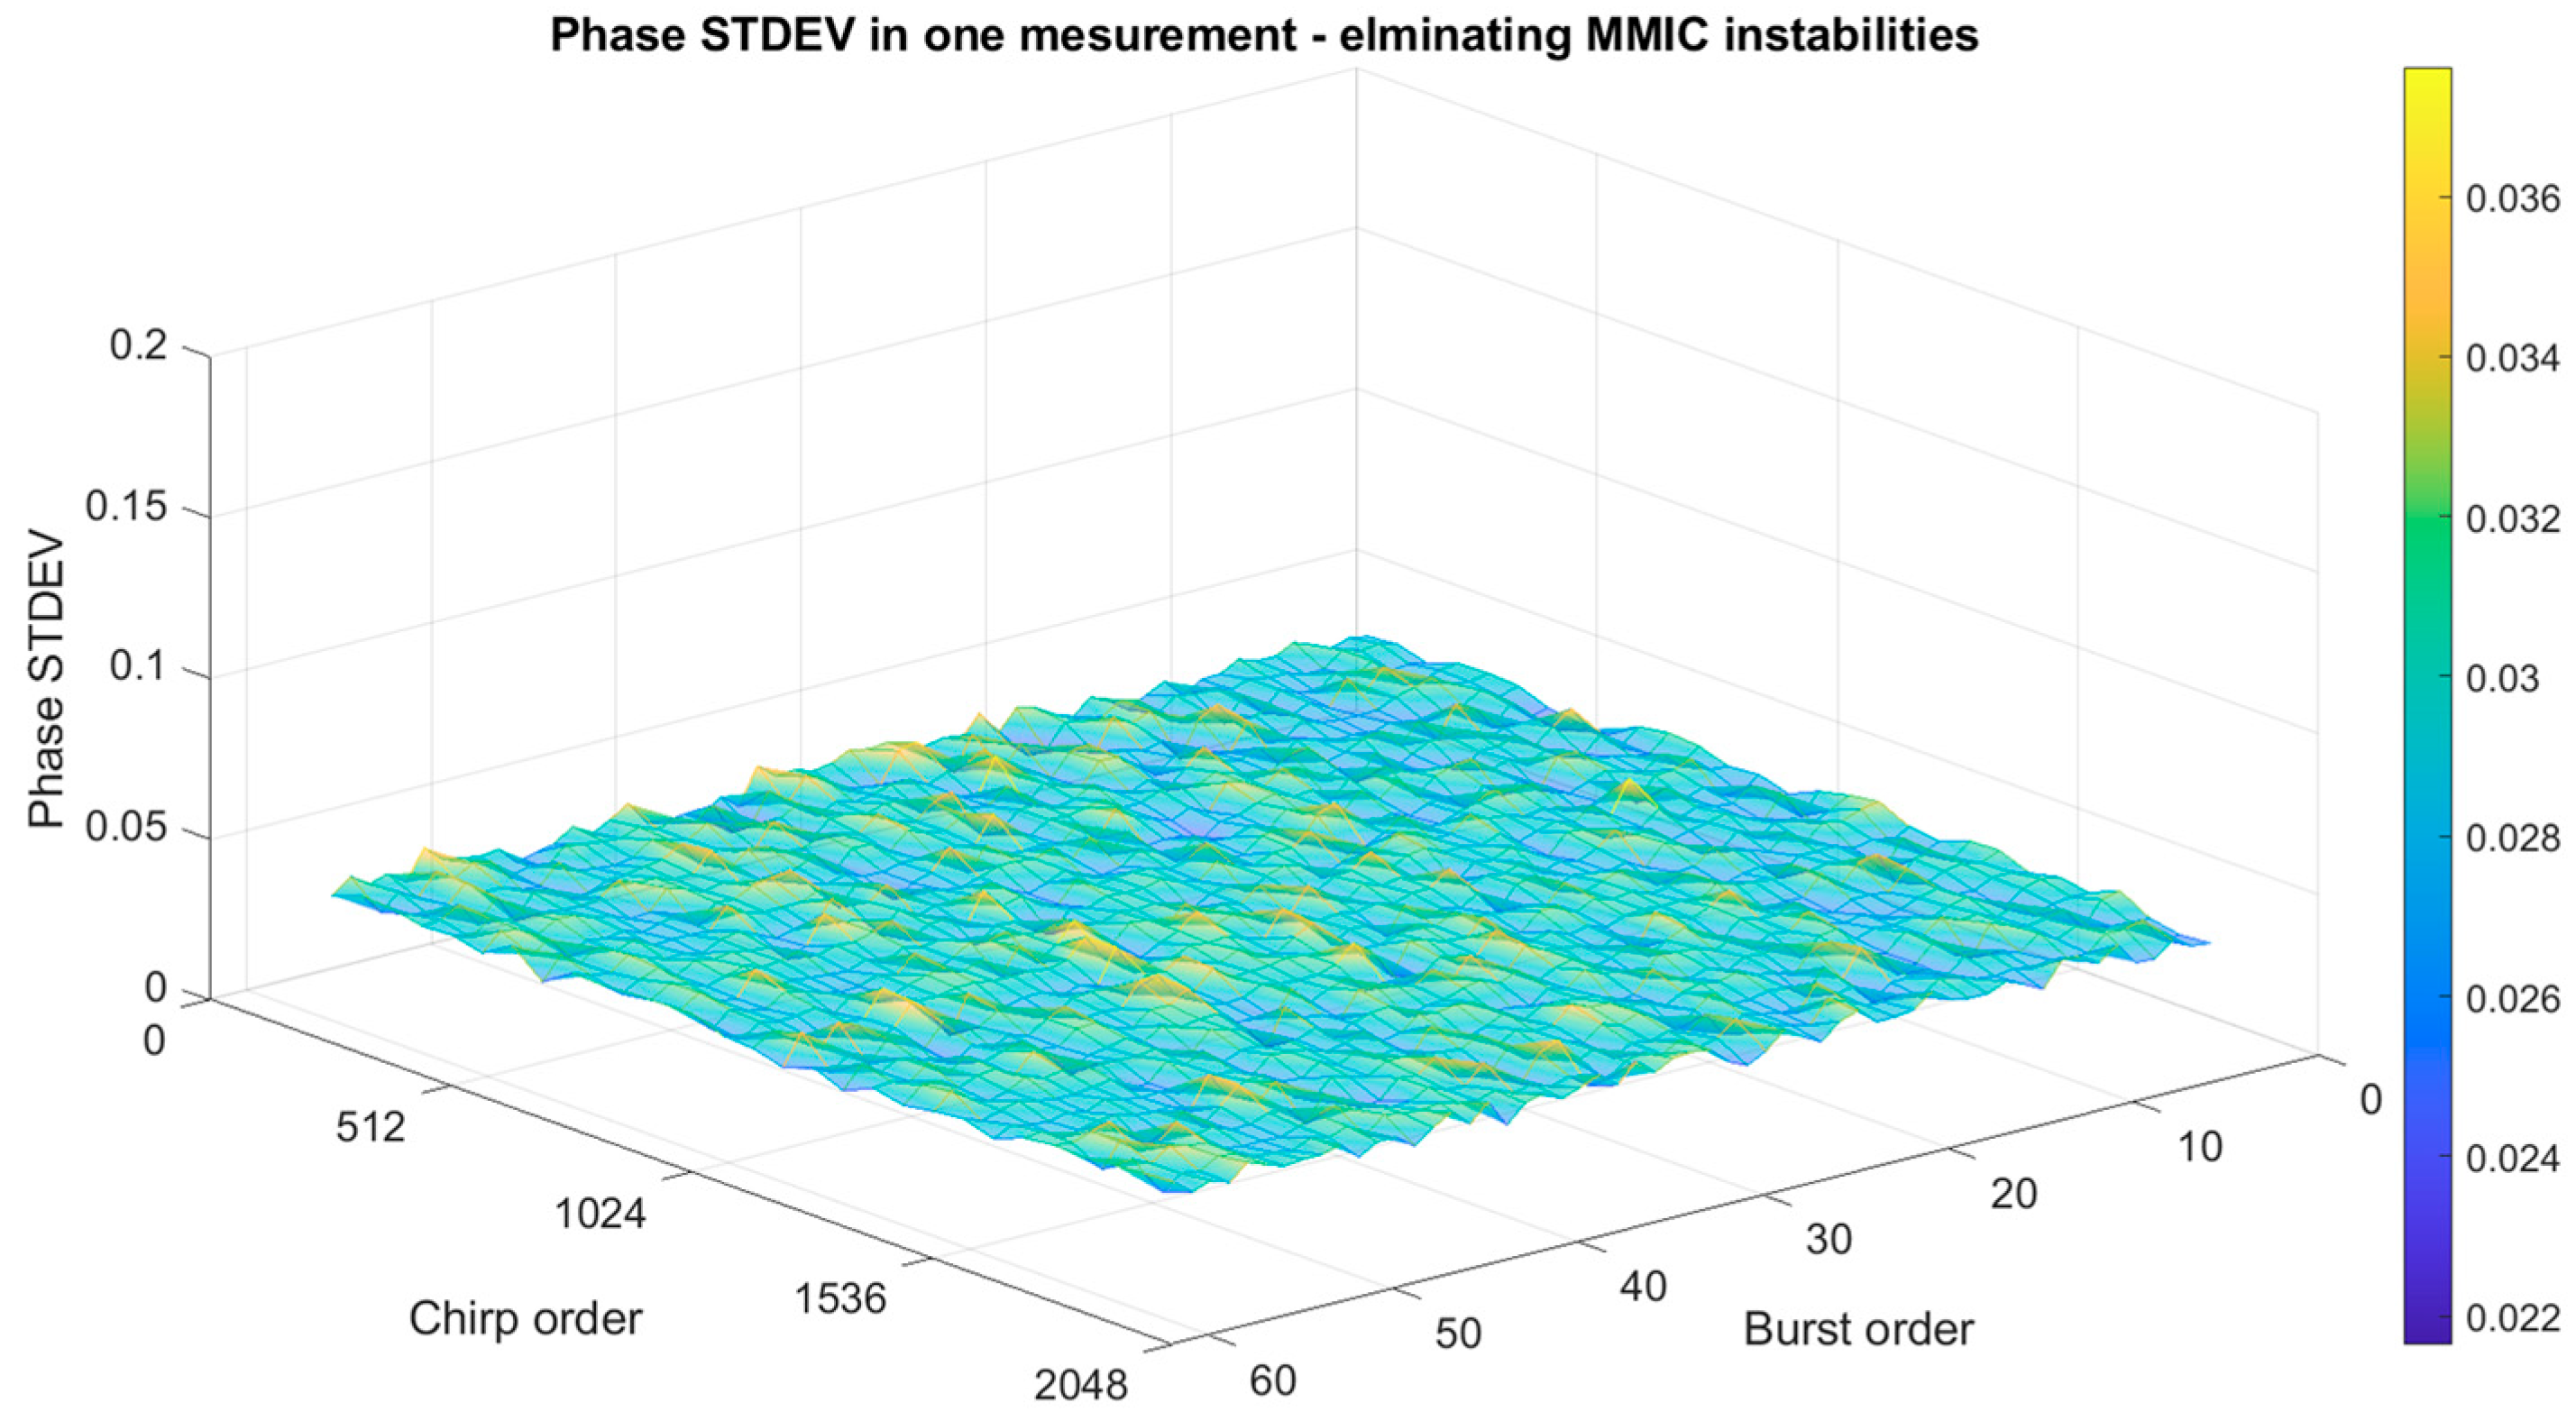
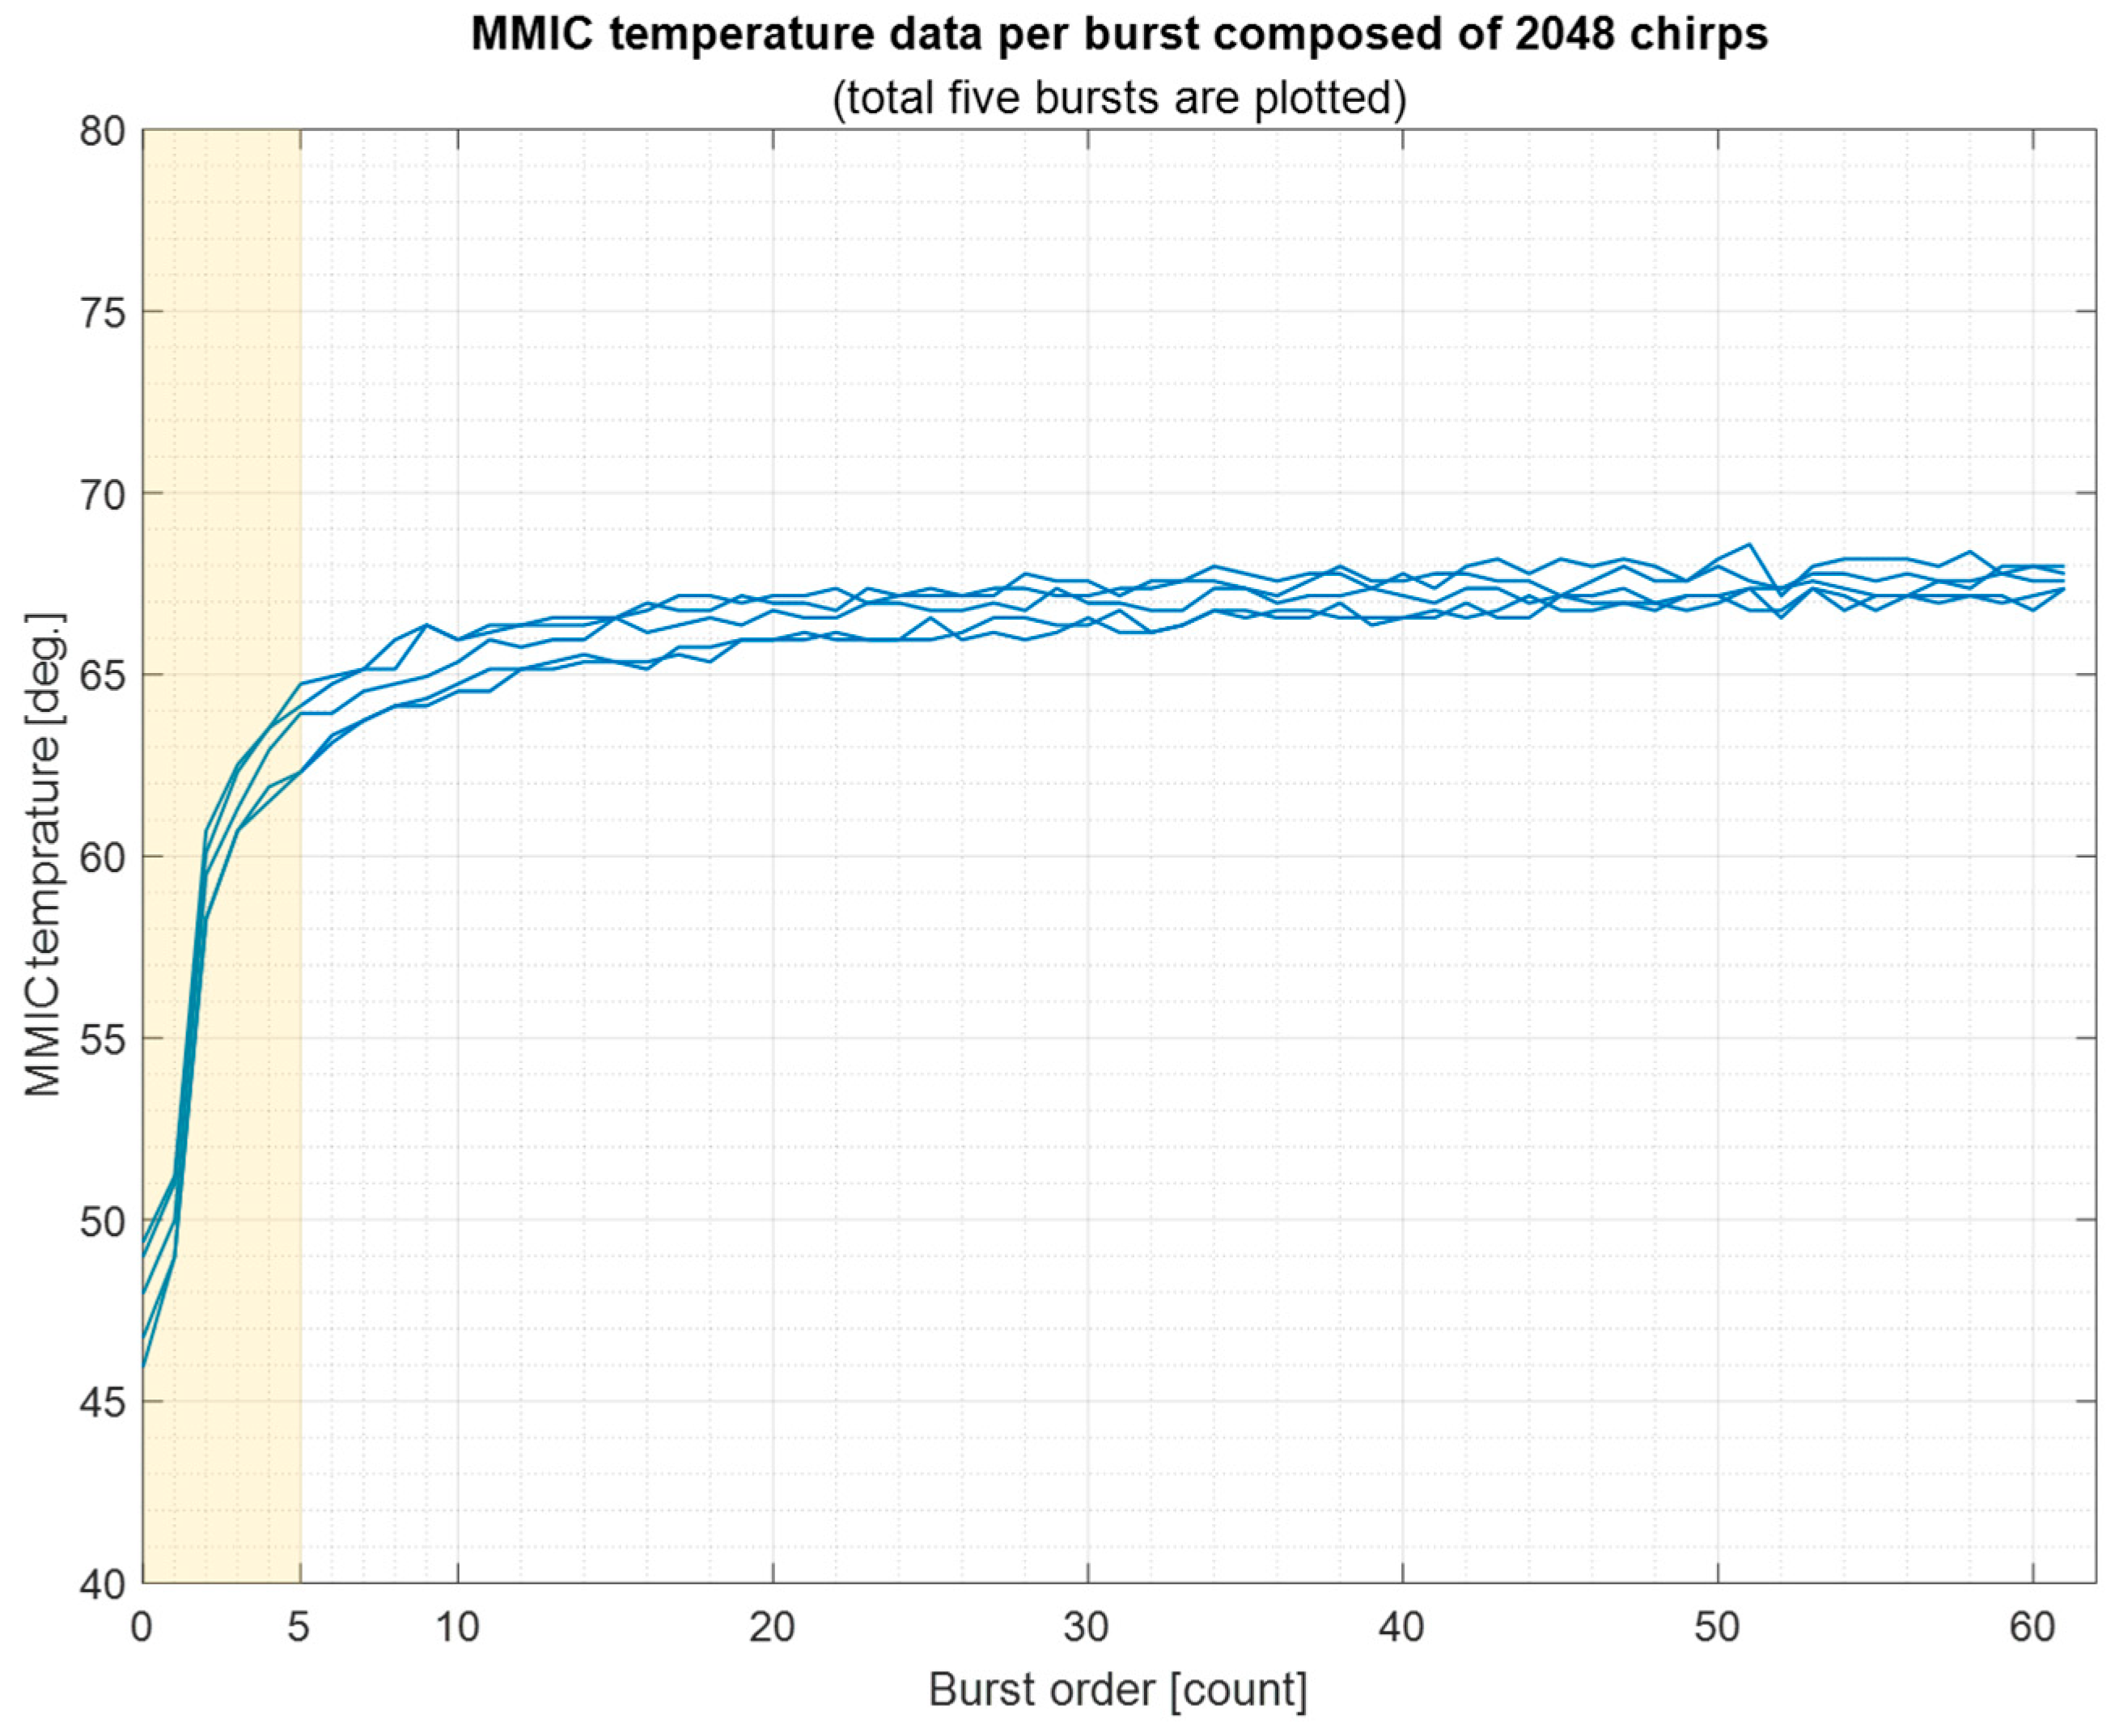
Section 4, there are instability zones in the phase data, and this work eliminated such instability zones as described in Section 4.1. The instability data appear at the beginning of the waveform in the transmitting process, where the phase is affected by the temperature of the MMIC. Figure 14 shows MMIC temperature data in the measurement experiment of the loopback waveguide in Section 3.2, where five measurement trials are plotted. The temperature changes to become higher at the beginning of the first five bursts, as highlighted. Thus, MMIC temperature is sensitive when handling very small phase data.
As mentioned in Section 4, two error components were observed through the two measurement experiments:
  • Positive offset error due to MMIC characteristics.
  • Gradient (gain) error potentially caused by MMIC characteristics or shaker machine properties.
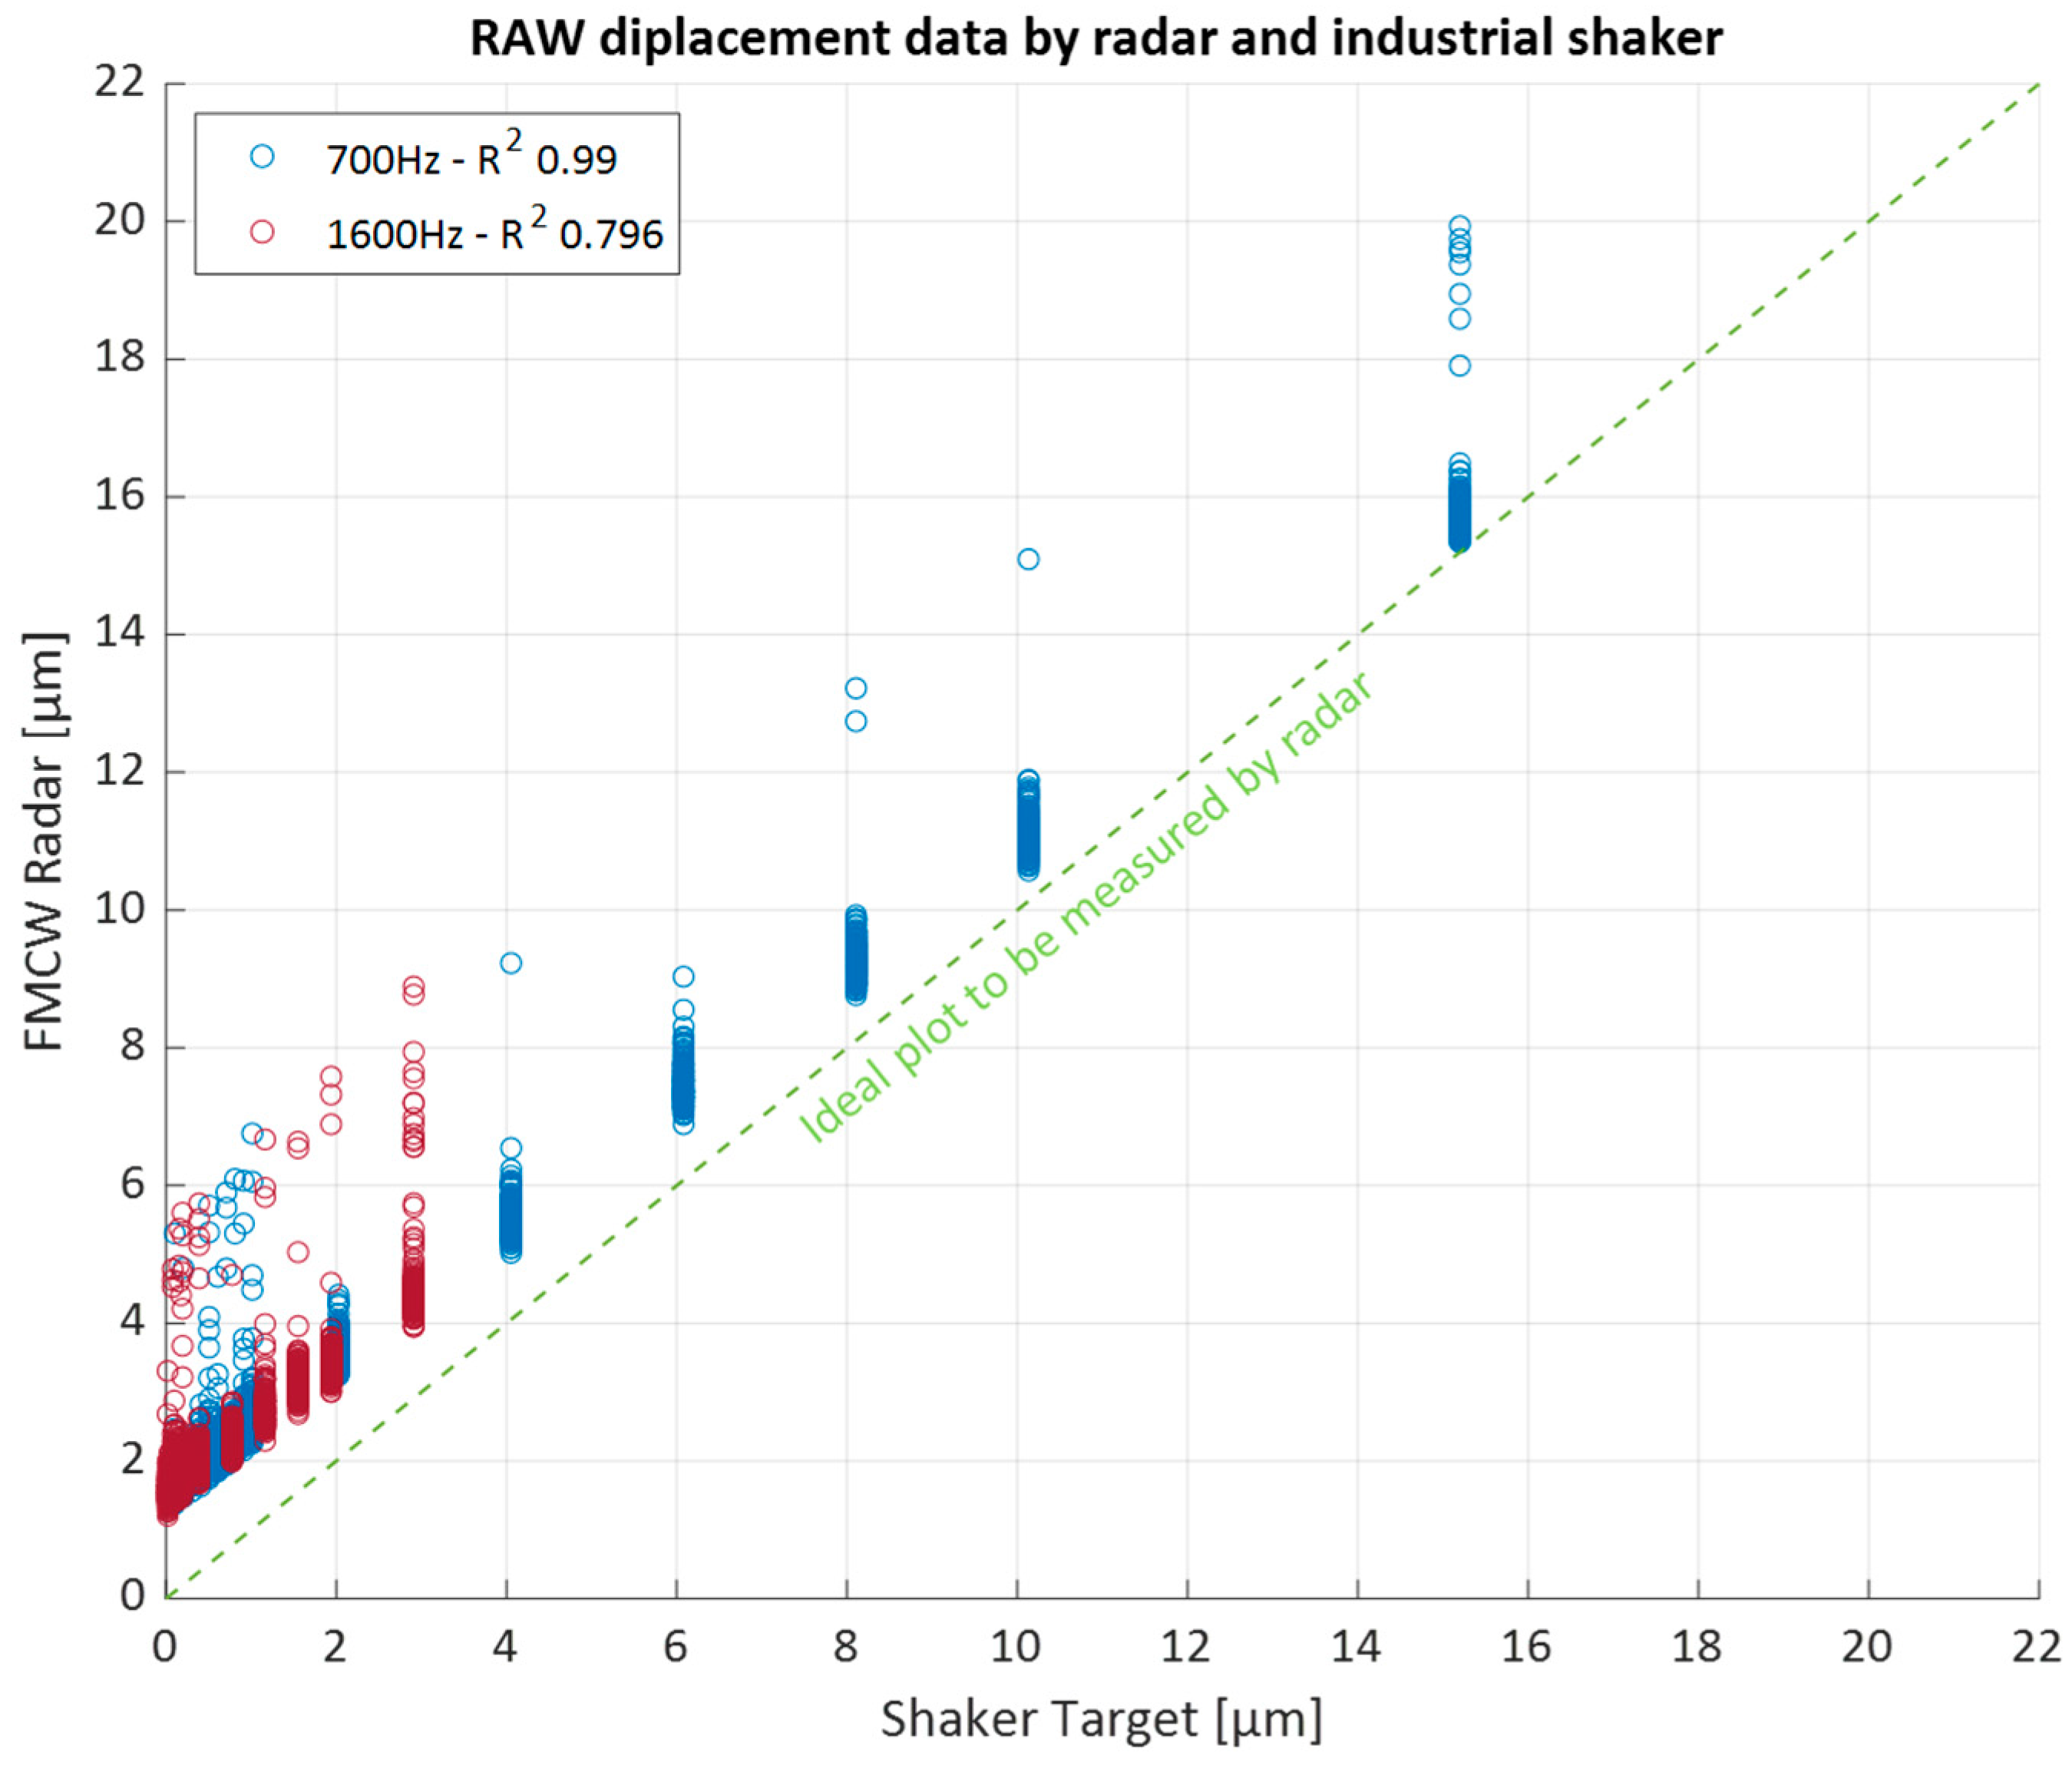
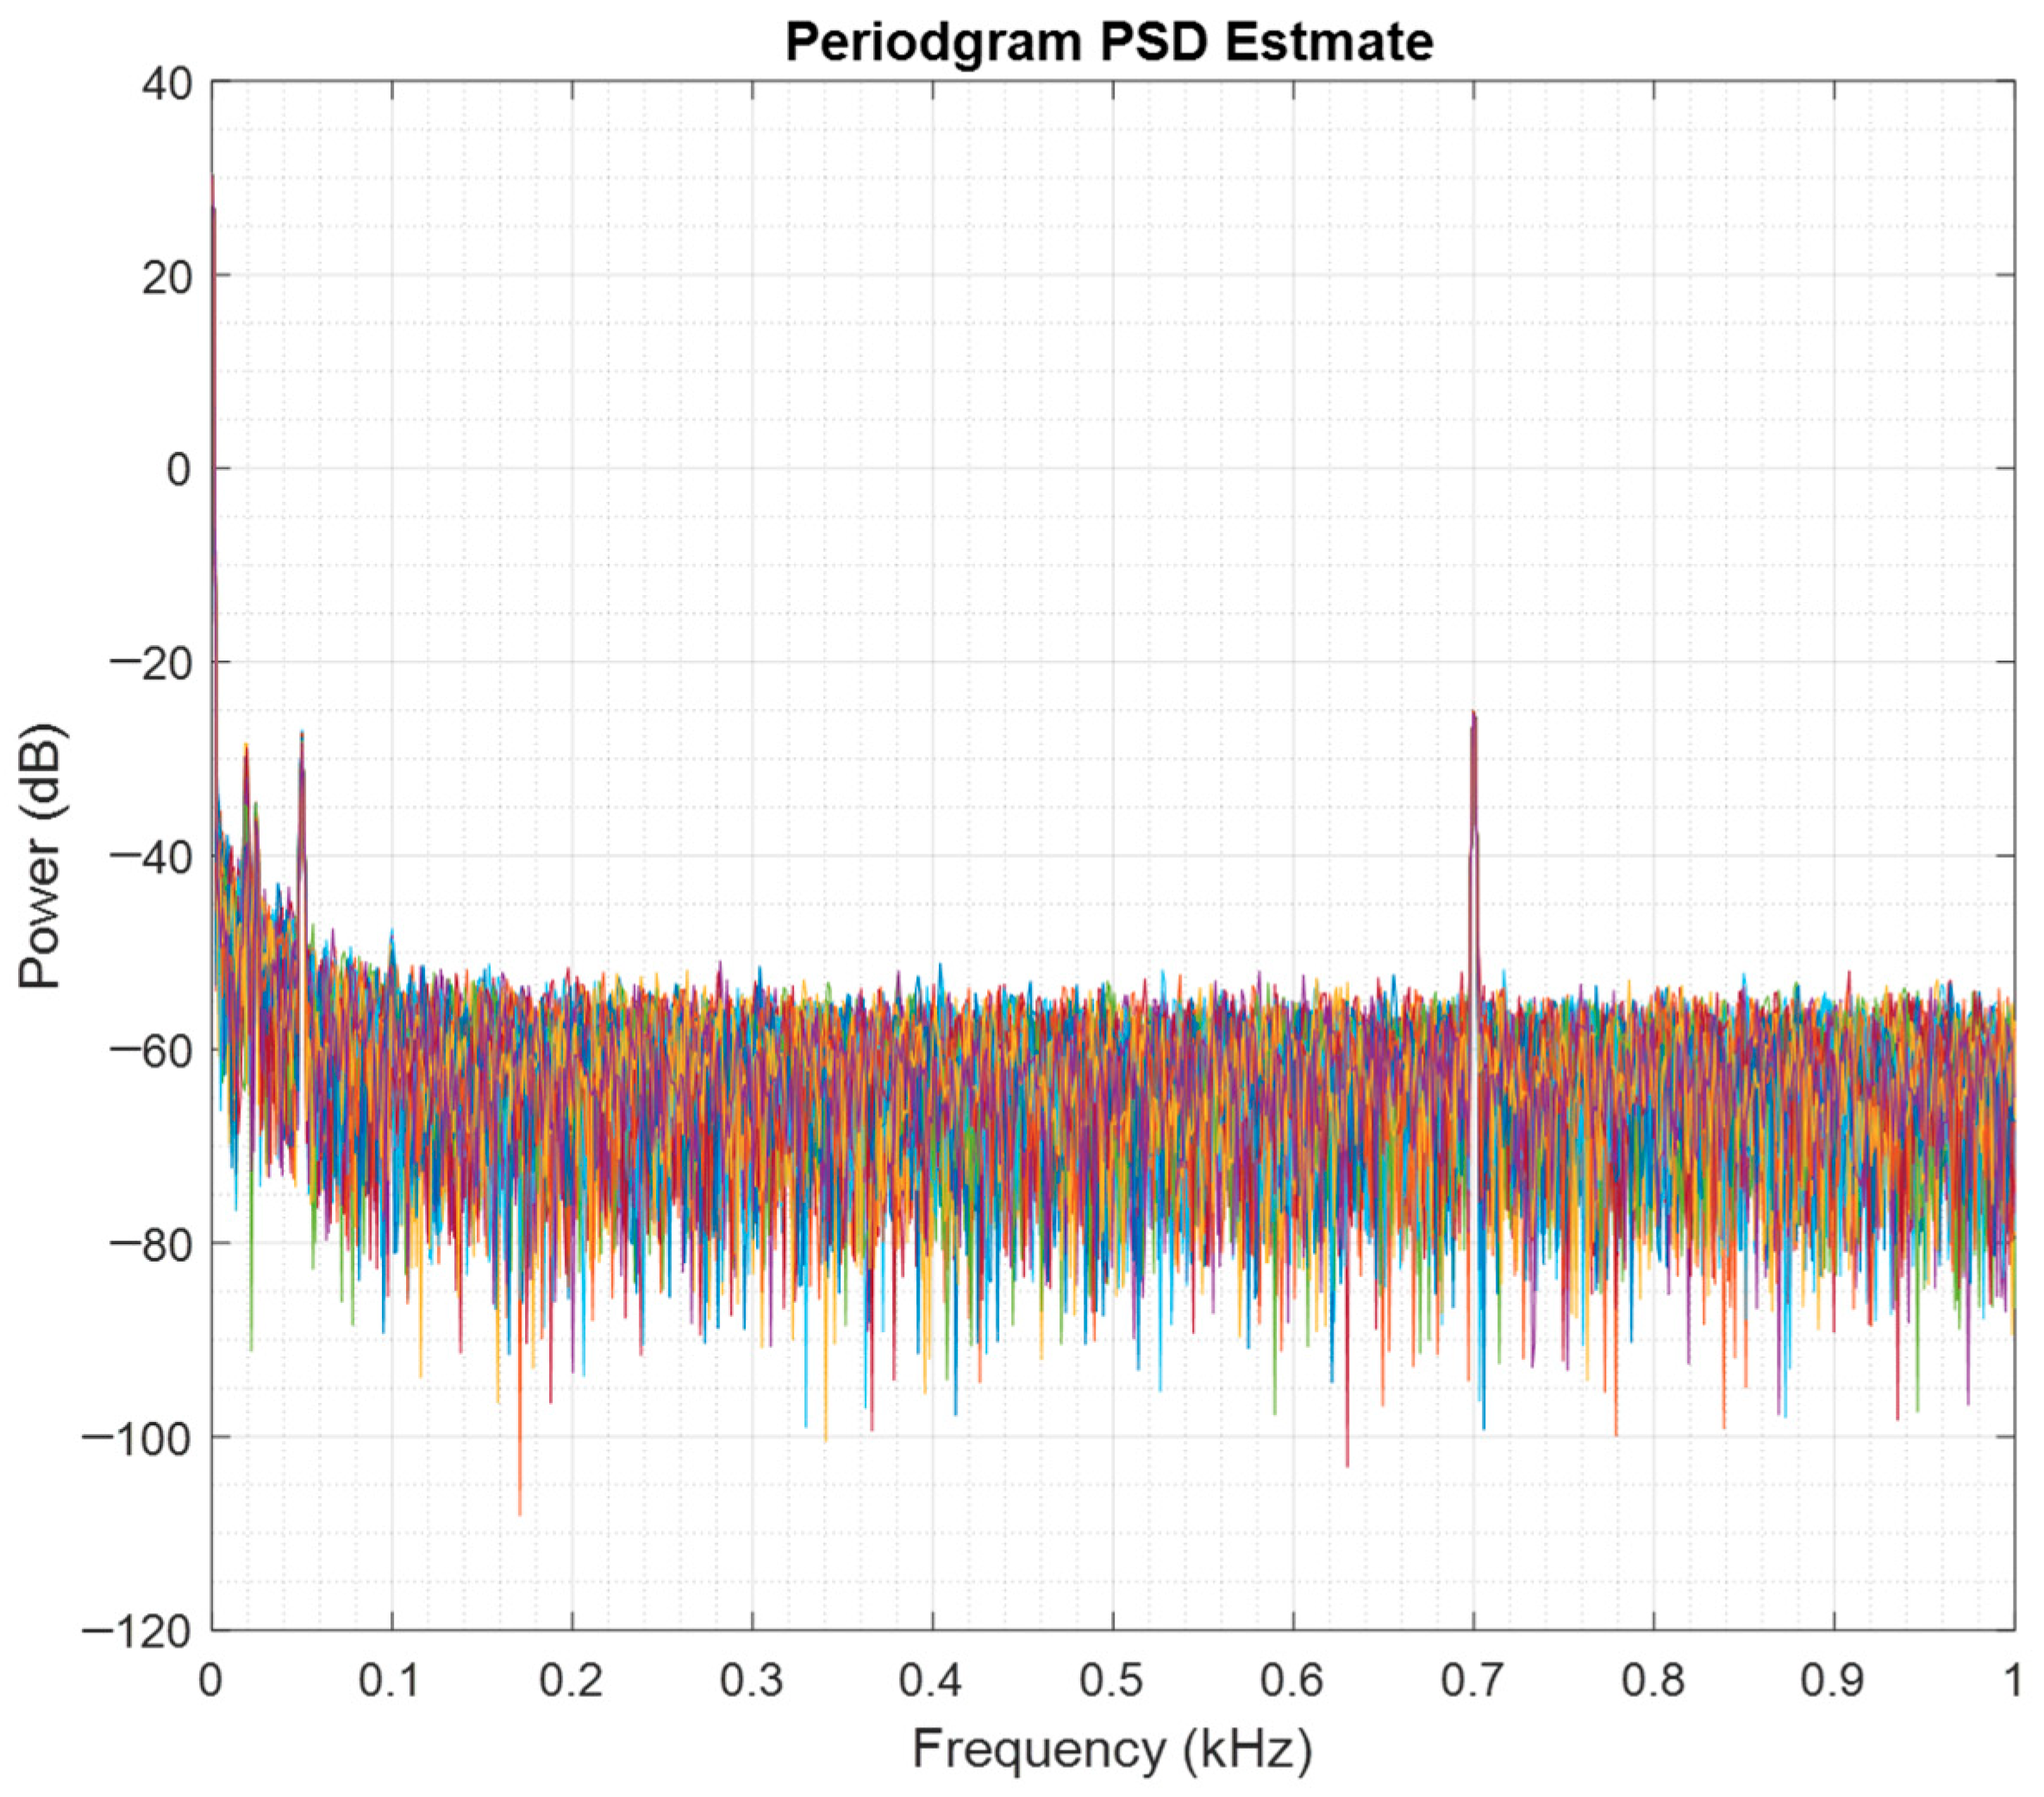
Looking at stability data, the data exhibit strong linearity across the entire measurement range, as shown in Figure 13, and can be calibrated using appropriate signal processing techniques. For instance, Figure 15 presents a periodogram that estimates the spectral density of the measured phase during a shaker vibration case at 700 Hz with a displacement of 1.013 μm. This reveals unexpected signals at lower frequencies, despite the shaker vibrating at a consistent frequency of 700 Hz.
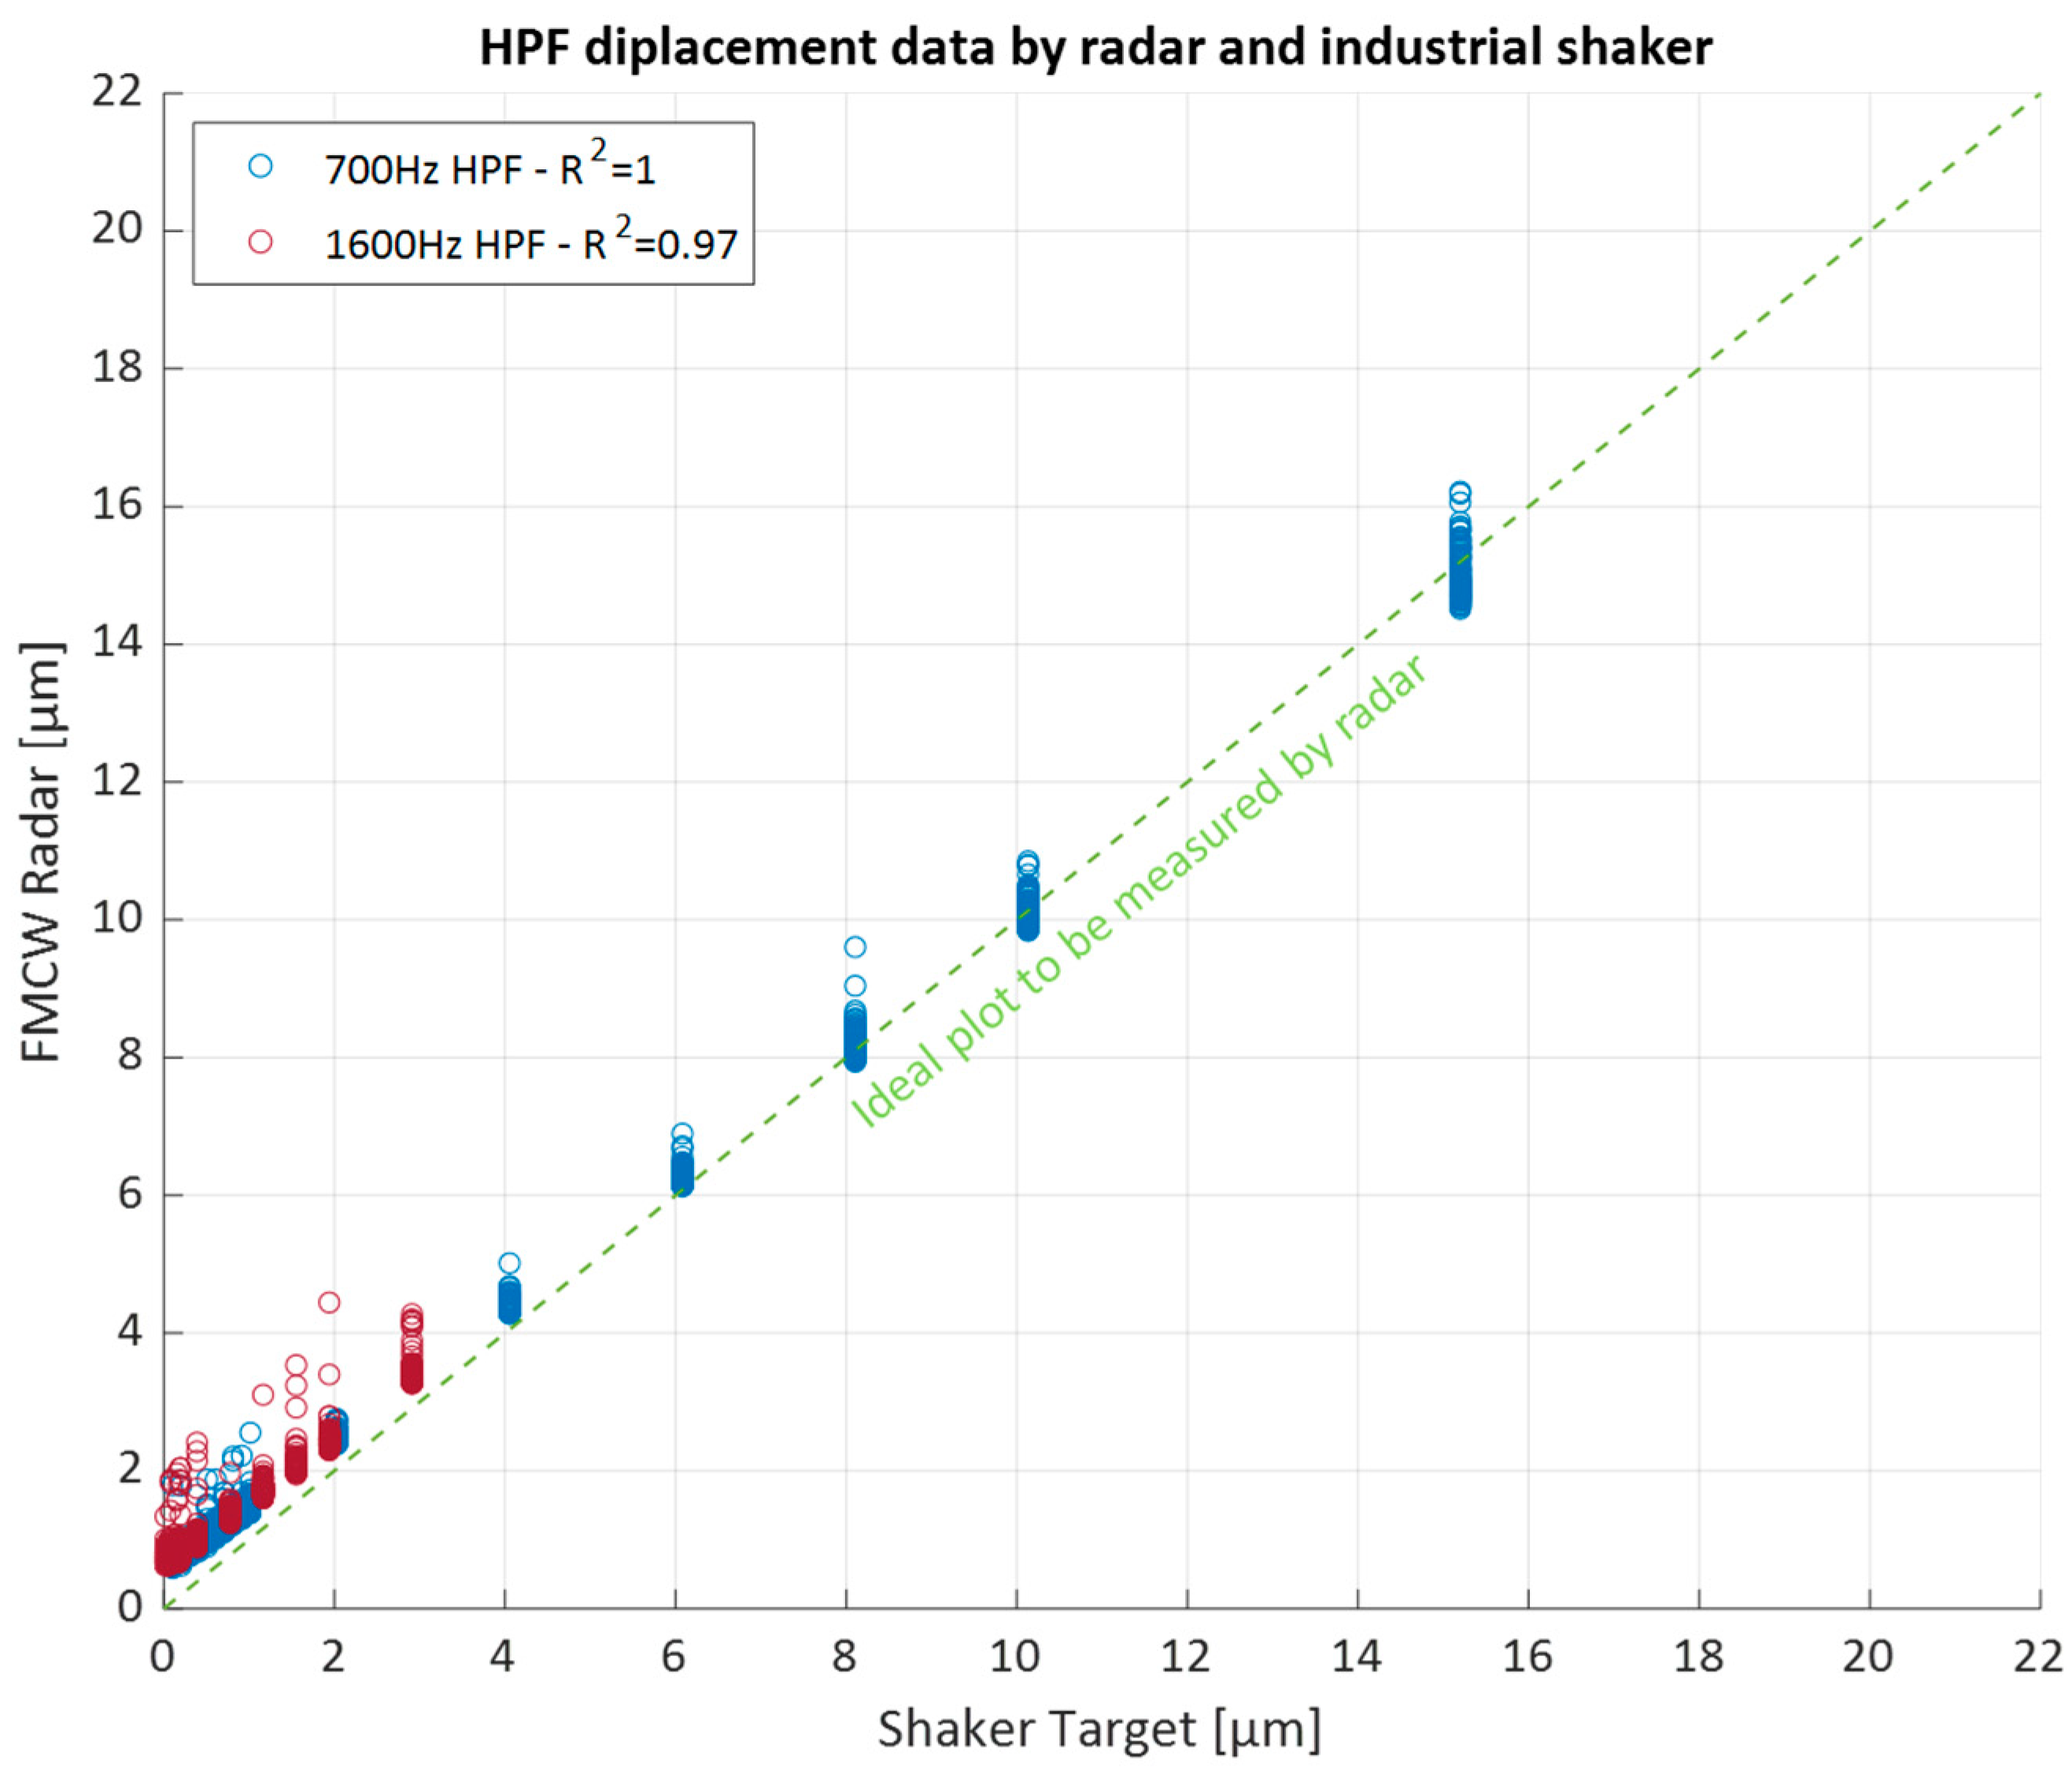
To address this issue, a high-pass filter (HPF) was applied to the sensor data. Figure 16 displays the results obtained after the application of an HPF with a cutoff frequency of 500 Hz. The application of the HPF reduced the offset, aligning the data more closely with the ideal line. This also improved the R2 value from 0.99 to 1.00 for the 700 Hz vibration case and from 0.80 to 0.97 for the 1600 Hz vibration case, as summarized in Table 8. This improvement suggests that the offset is likely caused by low-frequency noise.
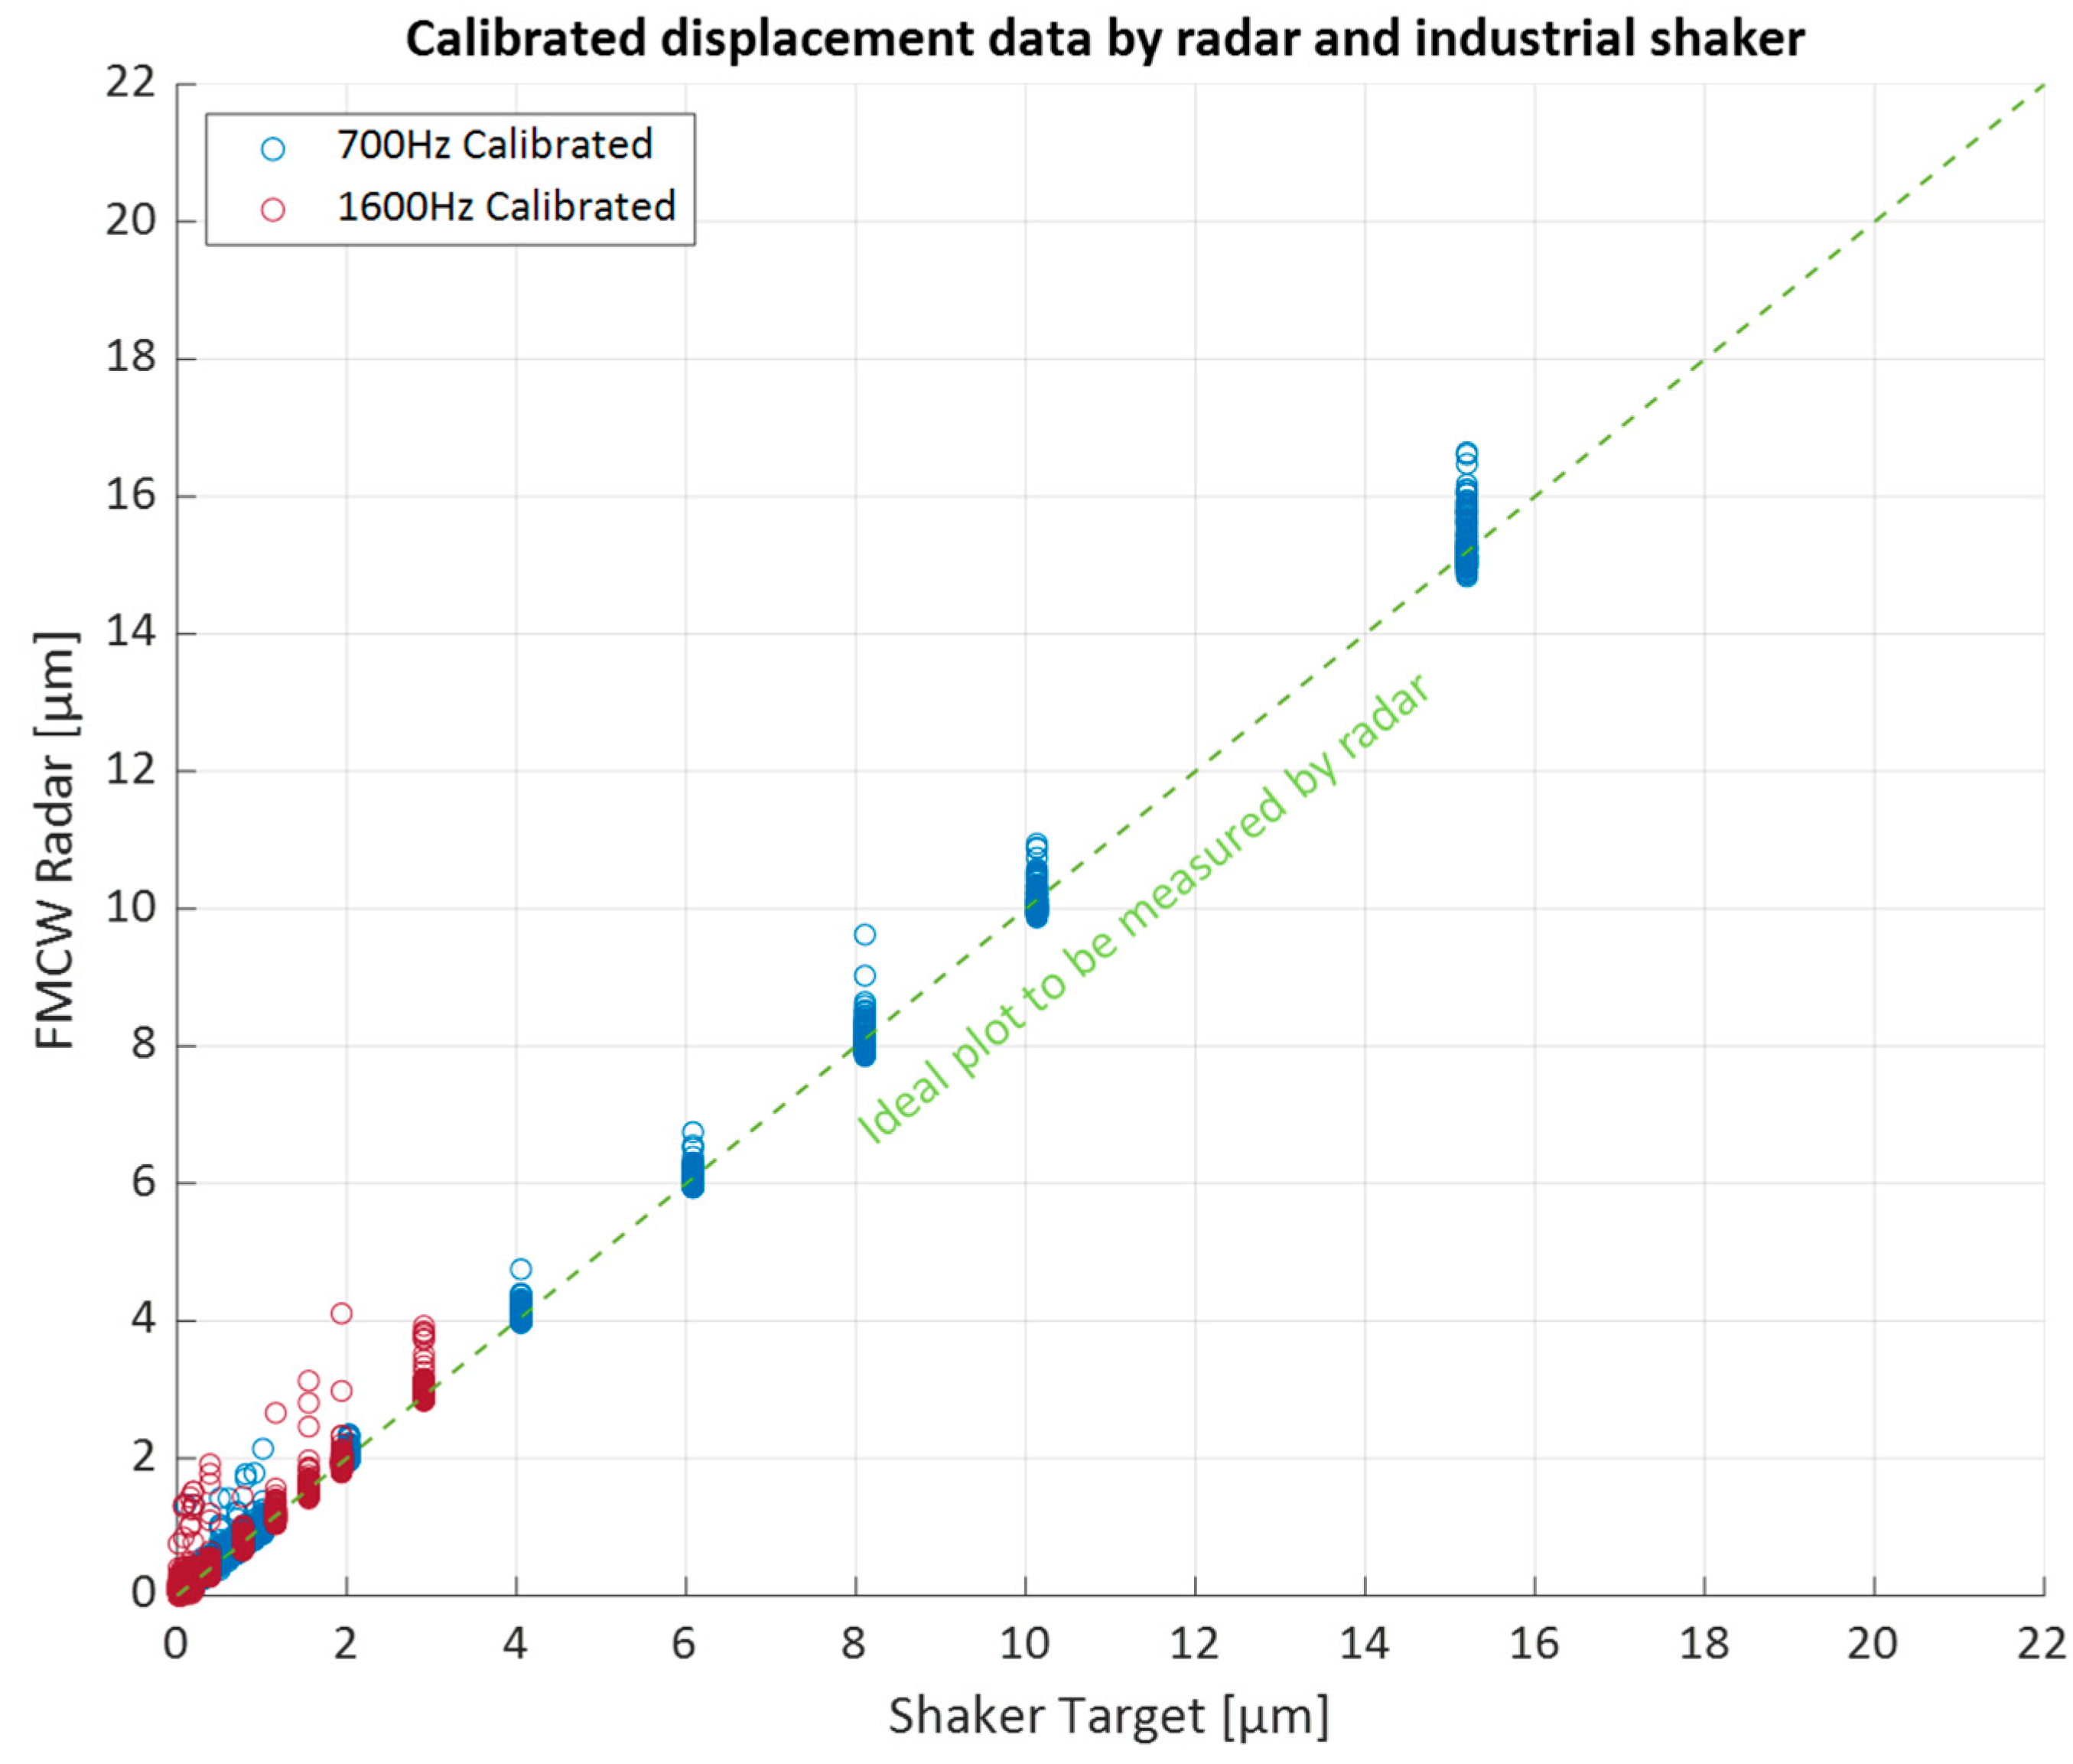
Furthermore, the linear regression model provides coefficients with Equation (9) describing the 700 Hz scenario and Equation (10) describing the 1600 Hz scenario, where dsht_prt and dlng_prt are calibrated sensor data, and ds is the raw data measured by the radar sensor. These equations can be used for sensor calibration. Figure 17 presents the calibrated sensor data using the regression coefficients, demonstrating a close fit to the ideal displacement produced by the shaker. Although calibration was successfully achieved, the cause of the gradient error remains unclear. Future work should address this issue through additional test measurements across a wider range of accelerations and vibration frequencies and various types of shaker machines.
d s h t _ p r t = 0.942 × d s + 0.572
d l n g _ p r t = 0.927 × d s + 0.686

6. Conclusions

In this study, a millimeter-wave FMCW radar sensor system was developed for small displacement sensing, and its phase accuracy and precision were experimentally evaluated using two test scenarios. The sensor demonstrated a phase accuracy shift of +0.137 degrees with a standard deviation of ±0.222 degrees. The maximum observed shift was +0.359 degrees, corresponding to a displacement offset of +1.907 μm. This offset falls within a 3-sigma condition, confirming the sensor’s accuracy. Similarly, the 3-sigma deviation of ±0.222 degrees corresponds to a displacement precision of ±1.180 μm.
The industrial shaker test verified the sensor’s capability to measure displacements ranging from 15.198 μm to as small as 0.019 μm with good linearity, as confirmed by regression analysis. Applying a high-pass filter and calibration using regression coefficients effectively aligned the measured displacement with the reference values. After calibration, the sensor precision (±1.180 μm) equaled its accuracy.
Future work will address identifying the root causes of the observed errors to further enhance reliability. Additional measurements under varied vibration conditions, including different frequencies, accelerations, and shaker types, will be conducted to better understand the influence of radar MMIC characteristics and the mechanical properties of the shaker machine on sensor performance.

Author Contributions

Conceptualization, H.T. and F.S.; methodology, H.T.; software, K.S.; validation, K.S., H.T. and N.H.; formal analysis, H.T., N.H. and K.S.; investigation, H.T.; resources, H.T. and F.S.; data curation, H.T.; writing—original draft preparation, H.T.; writing—review and editing, H.T. and F.S.; visualization, H.T.; supervision, F.S. All authors have read and agreed to the published version of the manuscript.

Funding

This research received no external funding.

Institutional Review Board Statement

Not applicable.

Informed Consent Statement

Not applicable.

Data Availability Statement

Data available on request due to restrictions.

Conflicts of Interest

Authors H.T. and N.T. are employed by Analog Devices KK. Other authors K.S. and F.S. receive compensation from Sakura Tech Cooperation.

References

  1. Pramudita, A.A.; Suratman, F.Y.; Arseno, D. Radar Application for Small Displacement Detection. In Proceedings of the 2021 IEEE Asia-Pacific Conference on Applied Electromagnetics (APACE), Penang, Malaysia, 20–22 December 2021; pp. 1–4. [Google Scholar]
  2. Sopcik, P.; O’Sullivan, D. How Sensor Performance Enables Condition-Based Monitoring Solutions. In Analog Dialogue; Analog Devices: Cambridge, MA, USA, 2019; Volume 53. [Google Scholar]
  3. Khademi, A.; Raji, F.; Sadeghi, M. IoT Enabled Vibration Monitoring Toward Smart Maintenance. In Proceedings of the 2019 3rd International Conference on Internet of Things and Applications (IoT), Isfahan, Iran, 17–18 April 2019; pp. 1–6. [Google Scholar]
  4. Raj, V.P.; Natarajan, K.; Girikumar, S.T.G. Induction motor fault detection and diagnosis by vibration analysis using MEMS accelerometer. In Proceedings of the 2013 International Conference on Emerging Trends in Communication, Control, Signal Processing and Computing Applications (C2SPCA), Bangalore, India, 10–11 October 2013; pp. 1–6. [Google Scholar]
  5. Josebeck, G.; Gowtham, A. Demystifying the P-F Curve & Augmenting Machine Learning for Maintenance Optimization. In Proceedings of the 2022 Annual Reliability and Maintainability Symposium (RAMS), Tucson, AZ, USA, 24–27 January 2022; pp. 1–5. [Google Scholar]
  6. Bengtsson, M.; Lundström, G. On the importance of combining “the new” with “the old”—One important prerequisite for maintenance in Industry 4.0. Procedia Manuf. 2018, 25, 118–125. [Google Scholar] [CrossRef]
  7. Liu, X.; Wu, X.; Liu, C. A comparison of acoustic emission and vibration on bearing fault detection. In Proceedings of the Proceedings 2011 International Conference on Transportation, Mechanical, and Electrical Engineering (TMEE), Changchun, China, 16–18 December 2011; pp. 922–926. [Google Scholar]
  8. Yoo, S.; Bae, Y.; Jang, S. Design of Wideband FMCW Radar Transceiver System Using Photonic Elements. Micromachines 2023, 14, 1296. [Google Scholar] [CrossRef] [PubMed]
  9. Giuseppe, B.; Armenise, M.N.; Ciminelli, C. Chip-Scaled Ka-Band Photonic Linearly Chirped Microwave Waveform Generator. Front. Phys. 2022, 10, 785650. [Google Scholar]
  10. Bhutani, A.; Pauli, M.; Latzko, T.; Göttel, B.; Gehringer, M.; Zwick, T. Micrometer-Accuracy Distance Measurement using 122 GHz LTCC Radar System-in-Package. In Proceedings of the 2019 IEEE Asia-Pacific Microwave Conference (APMC), Singapore, 10–13 December 2019; pp. 753–755. [Google Scholar]
  11. Liu, J.; Li, Y.; Gu, C. Solving Phase Ambiguity in Interferometric Displacement Measurement with Millimeter-Wave FMCW Radar Sensors. IEEE Sens. J. 2022, 22, 8482–8489. [Google Scholar] [CrossRef]
  12. Liu, H.; Xu, D. High Accuracy Distance Measurement With FMCW Radar and Phase Algorithm. In Proceedings of the 2023 3rd International Conference on Electronic Information Engineering and Computer Communication (EIECC), Wuhan, China, 8–10 December 2023; pp. 1–6. [Google Scholar]
  13. Ciattaglia, G.; Santis, A.D.; Disha, D.; Spinsante, S.; Castellini, P.; Gambi, E. Performance Evaluation of Vibrational Measurements Through mmWave Radars. In Proceedings of the 2020 IEEE 7th International Workshop on Metrology for AeroSpace (MetroAeroSpace), Pisa, Italy, 22–24 June 2020; pp. 160–165. [Google Scholar]
  14. Piotrowsky, L.; Jaeschke, T.; Kueppers, S.; Siska, J.; Pohl, N. Enabling High Accuracy Distance Measurements with FMCW Radar Sensors. IEEE Trans. Microw. Theory Tech. 2019, 67, 5360–5371. [Google Scholar] [CrossRef]
  15. Piotrowsky, L.; Kueppers, S.; Jaeschke, T.; Pohl, N. Distance Measurement Using mmWave Radar: Micron Accuracy at Medium Range. IEEE Trans. Microw. Theory Tech. 2022, 70, 5259–5270. [Google Scholar] [CrossRef]
  16. Xiong, Y.; Peng, Z.; Xing, G.; Zhang, W.; Meng, G. Accurate and Robust Displacement Measurement for FMCW Radar Vibration Monitoring. IEEE Sens. J. 2018, 18, 1131–1139. [Google Scholar] [CrossRef]
  17. Shehata, M.A.; Keaveney, M.; Staszewski, R.B. A 184.6-dBc/Hz FoM 100-kHz Flicker Phase Noise Corner 30-GHz Rotary Traveling-Wave Oscillator Using Distributed Stubs in 22-nm FD-SOI. IEEE Solid-State Circuits Lett. 2019, 2, 103–106. [Google Scholar] [CrossRef]
  18. Samarasekera, A.C.J.; Feger, R.; Bechter, J.; Stelzer, A. Phase Noise Measurements in Chirped FMCW Radar Signals. In Proceedings of the 2020 IEEE MTT-S International Conference on Microwaves for Intelligent Mobility (ICMIM), Linz, Austria, 23 November 2020; pp. 1–4. [Google Scholar]
  19. ISO/IEC 17025; General Requirements for the Competence of Testing and Calibration Laboratories, Edition:1. ISO: Geneva, Switzerland, 2017.
Figure 1. P-F curve on machine CbM.
Applsci 15 03316 g001
Figure 2. FMCW waveform.
Applsci 15 03316 g002
Figure 3. Small displacement by two chirps.
Applsci 15 03316 g003
Figure 4. Sensor system block diagram.
Applsci 15 03316 g004
Figure 5. Millimeter-wave FMCW radar sensor system. (a) System hardware image. (b) Measurement software image.
Applsci 15 03316 g005
Figure 6. Loopback waveguide test setup.
Applsci 15 03316 g006
Figure 7. Test setup with industrial vibration shaker.
Applsci 15 03316 g007
Figure 8. Test system setup image.
Applsci 15 03316 g008
Figure 9. Chirp and burst framework in experiment.
Applsci 15 03316 g009
Figure 10. Standard deviation of phase in one measurement.
Applsci 15 03316 g010
Figure 11. Standard deviation of phase in the stability zone.
Applsci 15 03316 g011
Figure 12. Histogram of phase data.
Applsci 15 03316 g012
Figure 13. Raw data plot by radar and shaker.
Applsci 15 03316 g013
Figure 14. MMIC temperature per chirp burst transfer.
Applsci 15 03316 g014
Figure 15. Periodogram on phase (700 Hz vibration case).
Applsci 15 03316 g015
Figure 16. Applying HPF to raw data from radar and shaker.
Applsci 15 03316 g016
Figure 17. Calibrated radar data from radar and shaker.
Applsci 15 03316 g017
Table 1. Millimeter-wave FMCW radar sensor system specification.
RF frequency (OBW)77.1–80.9 GHz (3.8 GHz)
Radar typeFMCW
Transmitter1-ch
Receiver1-ch
Detectable range5 m (max.)
Field of view±3°
Interface and power 100BASE-T (UDP) + PoE
Table 2. FMCW parameters for measurement test.
ItemsUnitValue
RF frequencyGHz77.1–80.9
RF occupied bandwidthMHz3800
RF center frequencyGHz79.0
FMCW up/down-chirp time
Long PRT settingμs200/200
Short PRT settingμs200/12.5
Chirp count in burst 2048
ADC sample in chirpsamples256
ADC FsMHz5
Range FFT point after zero paddingpoints4096
FFT windows Hann
Table 3. Captured phase data samples by loopback waveguide test.
Sensor SettingCaptured Total Raw Data Count
Long PRT583,500
Short PRT583,500
Table 4. Target displacement by industrial shaker.
Vibration Frequency
700 Hz (Short PRT)1600 Hz (Long PRT)
Acceleration [g]Amplitude p-p [μm]Amplitude p-p [μm]
15.0 15.198 2.909
10.0 10.132 1.939
8.0 8.106 1.551
6.0 6.079 1.164
4.0 4.053 0.776
2.0 2.026 0.388
1.0 1.013 0.194
0.9 0.912 0.175
0.8 0.811 0.155
0.7 0.709 0.136
0.6 0.608 0.116
0.5 0.507 0.097
0.4 0.405 0.078
0.3 0.304 0.058
0.2 0.203 0.039
0.1 0.101 0.019
Table 5. Captured phase data samples by 700 Hz/Short PRT.
Target Displacement by Shaker [μm]Captured Total Raw Phase Data Count
15.2370,688
10.13368,640
8.11372,736
6.08372,736
4.05370,688
2.03370,688
1.01380,928
0.91376,832
0.81374,784
0.71366,592
0.61372,736
0.51368,640
0.41364,544
0.30372,736
0.2370,688
0.10370,688
Table 6. Captured phase data samples by 1600 Hz/Long PRT.
Target Displacement by Shaker [μm]Captured Total Raw Phase Data Count
2.91378,880
1.94368,640
1.55376,832
1.16372,736
0.78374,784
0.39372,736
0.19368,640
0.17376,832
0.16378,880
0.14376,832
0.12389,120
0.10380,928
0.08378,880
0.06372,736
0.04391,168
0.02374,784
Table 7. Summary of loopback waveguide test results.
PRT SettingUnitShort PRT SettingLong PRT Setting
Data count (plotted in Figure 11)-528,960528,960
Meandeg.0.1160.137
Standard deviation/1σdeg.0.0640.074
±3σ [deg.]deg.±0.192±0.222
Maximum phase offset (±3σ)deg.+0.308+0.359
Equivalent target displacement (±3σ)
Max. offset (accuracy)μm+1.637+1.907
Max. precisionμm±1.023±1.180
Table 8. R2 values by linear regression analysis.
700 Hz (Short PRT Setting)1600 Hz (Long PRT Setting)
R2 of raw data0.990.80
R2 of HPF data1.000.97
Disclaimer/Publisher’s Note: The statements, opinions and data contained in all publications are solely those of the individual author(s) and contributor(s) and not of MDPI and/or the editor(s). MDPI and/or the editor(s) disclaim responsibility for any injury to people or property resulting from any ideas, methods, instructions or products referred to in the content.

